the energy effects of controlling solar shading · the need to control overheating and glare is...
TRANSCRIPT

SOM
F YSA
S,ca
pita
l20.
000.
000
euro
s,RC
SBo
nnev
ille
303.
970.
230
-©
SOM
FY.C
OM06
0901
somfy.com
THE ENERGY EFFECTS OF CONTROLLING SOLAR SHADING
Dr Paul Littlefair - Environmental Consultancy Centre - BREJose Ortiz and Claire Das Bhaumik - Sustainable Energy Centre - BRE
Scientific paper 2 060901 10/10/06 14:56 Page 1

Summary
This paper has examined the energy and thermal comfort implications of installing solar shading, including automatically
controlled shading. Two buildings, an air conditioned office and naturally ventilated hospital block, were simulated using a
sophisticated environmental modelling program (DOE-2), for a range of shading and control systems. These comprised manually
controlled internal blinds, a fixed external overhang, and internal or external blinds under automatic control and manual
override.
Results for the office suggest that in England shading can result in significant reductions in carbon dioxide emissions and energy
cost, where buildings are air conditioned. Additional CO2 savings were obtained with automatic control of shading, of around
3% compared to simple manually controlled or fixed systems. Overall, an automatically controlled shading system gave building
CO2 savings of 9% (with internal blinds) and 8% (with external blinds) in the London area compared to the no shading case.
The benefits of shading are latitude dependent; in Scotland, installation of external shading gave an energy penalty of between
3% and 9%. Moveable external shading gave the highest energy penalty because occupants would use the external blinds
to control glare, reducing solar gains on cloudy days. Automatic control of internal shading was more successful here, reducing
CO2 emissions by around 2% compared to no shading or manually controlled internal shading.
In the naturally ventilated hospital, the installation of shading resulted in an energy penalty of between 2% (for internal blinds
either manually or automatically controlled) and 11-13% for automatically controlled external shading. However the external
shading resulted in significant reductions in summertime internal temperatures, which could avoid the need to install cooling
in some areas.
P 2P 3
IntroductionThe need to control overheating and glare is increasingly
important in all types of buildings. Solar shading (refs 1,2) can
benefit occupant comfort, by reducing internal temperatures on
hot days and controlling glare.
A few studies have examined the general energy benefits of
providing shading. A BRE case study (ref 3) estimated that
installing a/c in a typical 1960s open plan office would require
an extra 55kWh/m2/year, resulting in overall a/c running costs of
£15/m2/year. The same study showed that comfort could be
achieved at zero cooling energy consumption, with a
combination of solar shading (either mid-pane or external) and
night ventilation. The extra cost of such measures will usually be
substantially less than that of installing cooling. Even in a
building where cooling had already been installed, the shading
could pay for itself in under five years.
A literature review by Dubois (ref 4) quoted studies giving savings
of between 23 and 89% in cooling energy use from installing
shading. Dubois also investigated the effect of having an awning
on a south facing office window. This study showed that large
energy savings (around 12 kWh/m2yr) could be obtained by
using a simple seasonal awning but that this was almost
completely offset by extra heating and lighting use if the awning
was fixed and remained in place year-round.
This indicates that moveable shading (ref 5) is especially
appropriate. Under cloudy conditions, or in winter, it can be
withdrawn to allow daylight and useful solar gains to enter the
building, reducing its dependence on electric lighting and its
heating requirement. This strategy requires that the shading be
appropriately controlled. Otherwise, if the shading is withdrawn
by mistake, unwanted solar gain may enter the building in heat
wave conditions, causing overheating. Conversely, the shading
may be in place at times when it is performing no useful
function; this can lead to excessive use of electric lighting and
reduction in useful solar heat gain in winter.
This paper sets out to quantify the benefits of shading control. It
describes environmental modelling of two example buildings
with an automatic shading control system, and comparison with
the same buildings with no shading, with fixed shading, and
with manual control of blinds.
Scientific paper 2 060901 10/10/06 14:56 Page 3

The Buildings
The modelling was carried out for two example buildings: an
office and a simplified hospital block. The office is illustrated in
Figures 1 and 2. It is mainly open plan but includes some
cellular spaces. It is assumed to have full air conditioning
including cooling. The HVAC system considered in the analysis
uses fans in both heating and cooling mode.
The hospital building is shown in figures 3 and 4. This consists of
wards on floors 1 and 2, with ancillary accommodation on these
floors and the whole of the ground floor. All the rooms are
naturally ventilated.
Each building has the default U values and services provision
given in the limits to design flexibility in the 2006 England and
Wales Building Regulations Approved Document L2A (ref 6). The
windows are standard low emissivity double glazed units (total
solar transmittance or g value 0.68, U value 2.0 W/m2/K).
Photoelectric dimming of electric lighting is provided. The natural
ventilation strategy used in the hospital building is assumed to
provide the minimum fresh air flow required for occupants.
The Modelling procedure
The buildings were modelled using the sophisticated
dynamic thermal model DOE 2, with Equest interface (ref 7).
Each building was modelled assuming it was located in each
of London, Manchester, and Edinburgh. The standard CIBSE Test
Reference Year for each location was used to provide weather
data. The duration of each simulation was one complete year
in order to take account of seasonal weather variations.
Each building was modelled with five different types of
shading:
a) Internal shading (roller blinds), manually controlled.
The roller blinds were of a White/Pearl fabric, with the white
side facing outwards (ie against the glazing). Its properties are
Tsolar 9%, Rsolar 54%, Asolar 37%, Tvis 8%.
b) Internal shading as above, automatically controlled with
manual override.
c) External shading, fixed (a simple overhang). The overhang
was 1 metre deep on all faces. No radiation was assumed
to be reflected from the underneath of the overhang.
d) External shading, moveable, automatically controlled with
manual override. The moveable external shading is modelled
as venetian blinds, mid coloured with slat reflectance
Rsolar 0.35. The blind is assumed to have thin curved slats
of width 100mm and vertical spacing 80mm. The slats are
assumed to be closed when lowered.
e) No shading (base case).
P 4P 5
Algorithms for manualand automatic control
Manual controlTo assess the way people use blinds, BRE carried out five surveys
of office buildings (ref 5):
l a pilot study in two office buildings at BRE’s own site in Garston
l a multi storey office block in Croydon
BRE building 4, an office / laboratory building
l a large open plan, multi storey office block in Bootle
l a large office block in Westminster
In the two earlier studies the office tasks were mainly paper
based, while in the later studies there was a range of modern
office equipment including computer screens. Contrary to
popular belief, people do not always keep their blinds down.
Typically 30% of a south facing façade might be covered by
blinds. However this proportion varies a lot between buildings
and with time of year, as Table 1 shows.
BuildingPeriod
of stydyFaçade
orientationOcclusion value %
Mininum Maximum Average
BRE B3 Feb-May 79 South 18% 46% 27%
BRE B9 Feb-May 79 South 50% 70% 60%
Croydon Jan-Jul 83 South-east 9%
South-west 9%
BRE B4 May-Sep 89 South 70% 95% 84%
Bootle Jan-Jun 90 South-west 15% 75% 27%
Aug-Nov 90 South 9% 85% 39%
It was fairly common for people to alter their blinds (once every
three days on average). Sunshine is the main factor affecting
lowering of blinds. Blind changes were only weakly related to
temperature, however, implying that the visual rather than the
thermal impacts of sunlight were the dominant factor. People
are more likely to raise their blinds at the beginning or end of
the day.
Further analysis of the Westminster data indicated that blind use
could be modelled using the following equations. In these
equations the occlusion factor F is the fraction of blinds down
over an entire façade. F depends on sunshine probability σ over
the whole hour. σ is the actual sunshine probability if the sun
can reach the façade. If the solar altitude was less than 5°, or the
solar azimuth was more than 80° from the azimuth of the
normal to the façade, σ was taken as zero.
Table 1. Occlusion values (percentage of window area on façade covered by blinds) for each building.
Scientific paper 2 060901 10/10/06 14:56 Page 5

P 6P 7
The results for manual control, and automatic control with
manual override, need to be interpreted with care because
of the number of assumptions made:
1. The way people use blinds in the office, and, except at
the start and end of the day, in the hospital, is assumed
to be the same as in the actual Westminster office studied.
2. The Westminster building had internal venetian blinds.
The analysis assumes that people use internal roller blinds,
and external venetian blinds, in the same way as internal
venetian blinds.
3. The analysis has assumed that blind operations are spread
evenly over the entire façade. In practice blind operation may
be clustered, with some people or groups of people using
their blinds a lot and others rarely raising or lowering them.
This is unlikely to affect solar gain appreciably but may have
an impact on predicted lighting use (it may underestimate the
actual impact of blinds on lighting use).
4. In Rubin et al’s study on blind reset (ref 8), they manually set
a proportion of the blinds in a large building upwards
overnight, without telling the occupants. No data are
available on how occupants would react to a regular resetting
of blind positions when they would be aware it was part of
the building management strategy.
At any time if space is not occupied, F= Fprevious
where = Fprevious is the occlusion factor for the previous hour.
During the day, if the space is occupied
F = Fprevious - 0.056 Fprevious + (0.025 + 0.065 σ ) (1-Fprevious)
At the end of occupancy
F = Fprevious - 0.122 Fprevious + (0.025 + 0.065 σ ) (1-Fprevious)
At the start of occupancy
F = Fprevious - 0.142 Fprevious + (0.025 + 0.065 σ ) (1-Fprevious)
However if there has been an automatic reset, the occupants
have a 60% probability of putting their blinds back to their
preferred position (data by Rubin et al (ref 8)).
F = 0.6 x (0.25 + 0.35*σ) if the blinds have been reset up
F= 1 – 0.6 x (1 - 0.25 - 0.35*σ) if the blinds have been reset
down.
In hospital wards, blinds are assumed to be shut at the end of
the day (F=1) then opened at the start of the day unless it is
sunny F = (0.1 + 0.26 σ). Offices and consulting rooms in
hospitals are assumed to have the same blind use patterns as
office buildings.
Automatic control
(with manual override)
Because of the way people use blinds, energy use and
comfort may be adversely affected for a number of reasons:
1. On hot days, occupants may only lower the shading after the
space has already started to overheat. And if the occupants
are absent from part of the building, the shading may not be
functioning all day, causing heat build up in these areas
which may spread to other occupied zones.
2. People may keep their blinds down longer than required,
resulting in extra lighting use and loss of useful solar gain in
winter.
3. During the night there may be a reduction in heat loss from
the building if blinds are kept down. Occupants are unlikely
to shut their blinds at night deliberately (except in spaces
used for sleeping such as hospital wards).
For these reasons an automatic control was investigated.
The control was assumed to work in the following ways.
Room unoccupied
If a room is unoccupied (either during or outside working hours)
blinds are always down, except that blinds are up to warm the
building if it is a cold day (external temperature less than
16°C at any time over the last 24 hours) and there is some sun
on the façade.
The criterion of 16 degree external temperature over the last
24 hours is intended to stop solar preheating on summer
mornings when the external temperature may start low but
become high later.
Blinds are up to help cool the building at night if the outdoor
temperature at any time in the last 24 hours was above
20 degrees and the outdoor temperature is currently less
than 16 degrees.
Room occupied
If a room is occupied, then the automatic system sends the
blinds up just before the start of occupation, except in summer
(June, July, August), when the system sends the blinds down if
there is sun on the façade, to prevent possible overheating.
In spaces like offices and hospital wards occupants value having
control over their environment. They may also want to alter
blind position so that they can have a view out or to control glare
or provide privacy. Accordingly, in the analysis users were taken
to be able to override the blind position at any time. They are
assumed to do this using the manual control algorithms above.
The system resets the blind position to its initial value at 1030,
1330 and 1630, though
(a) It only does this if the sunshine level is appropriate.
So in summer, it only sends them down if there is sun on the
façade. For the rest of the year, it only sends them up if there
is no sun on the façade.
(b) Users can put them back again, see above.
In hospital wards occupied at night, users are assumed to close
the blinds.
Scientific paper 2 060901 10/10/06 14:56 Page 7

Results
Office buildingTables 2-4 give, respectively, calculated delivered energy, carbon dioxide emissions, and energy cost for the following five cases
(see also figure 5):
A. Internal shading (roller blinds), manually controlled.
B. Internal shading, automatically controlled using SOMFY algorithms.
C. External shading, fixed (a simple overhang).
D. External shading, moveable, automatically controlled using SOMFY algorithms.
E. No shading (base case).
The CO2 emissions factors used were taken from the 2006 England and Wales Building Regulations Approved Document ADL2a (ref 6):
Natural Gas (for heating): 0.194 kgCO2/kWh
Grid Supplied Electricity: 0.422 kgCO2/kWh
P 8P 9
Case LocationSpace
HeatingSpace
CoolingLighting
VentFans
TOTAL% ofbase
A LON 74,3 11.6 51.4 24.1 161.5 97.1%B LON 71.6 9.8 51.9 22.1 155.3 93.4%C LON 76.5 11.5 51.4 24.6 164.0 98.7%B LON 85.6 5.4 53.4 19.8 164.1 98.7%E LON 70.8 15.8 51.0 28.6 166.3 100.0%
A MAN 93.5 5.9 51.4 22.4 173.2 98.5%B MAN 90.2 4.8 51.7 20.5 167.2 95.0%C MAN 96.3 5.8 51.3 23.0 176.4 100.3%B MAN 107.4 2.1 53.1 18.8 181.5 103.2%E MAN 89.0 9.0 50.9 27.1 175.9 100.0%
A EDI 110.6 3.1 51.6 21.7 187.0 102.3%B EDI 106.1 2.3 51.9 20.8 181.1 99.1%C EDI 114.0 2.9 51.5 22.1 190.6 104.3%B EDI 124.9 0.8 53.2 25.9 204.7 112.0%E EDI 106.2 5.2 51.0 20.3 182.8 112.0%
Table 2. Delivered energy (kWh/m2) in the office building.
The CO2 emissions factors used were taken from the 2006 England and Wales Building Regulations Approved Document ADL2a (ref 6):
Natural Gas: 0.194 kgCO2/kWh
Grid Supplied Electricity: 0.422 kgCO2/kWh
Costs were assumed to be
Natural Gas: 2 p/kWh
Grid Supplied Electricity: 6.5 p/kWh
These are approximate costs and will depend on tariff and supplier, so should be taken as indicative only.
Case LocationSpace
HeatingSpace
CoolingLighting
VentFans
TOTAL% ofbase
A LON 14.42 4.90 21.71 10.17 51.20 94.8%B LON 13.89 4.13 21.88 9.31 49.21 91.1%C LON 14.84 4.87 21.68 10.38 51.77 95.8%B LON 16.60 2.29 22.52 8.35 49.76 92.1%E LON 13.74 6.68 21.51 12.09 54.02 100%
A MAN 18.14 2.50 21.67 9.45 51.76 96.0%B MAN 17.49 2.01 21.83 8.66 49.99 92.7%C MAN 18.69 2.44 21.63 9.69 52.46 97.3%B MAN 20.83 0.89 22.42 7.95 52.09 96.6%E MAN 17.27 3.78 21.46 11.44 53.94 100%
A EDI 21.46 1.30 21.75 9.16 53.68 101.5%B EDI 20.59 0.95 21.89 8.79 52.22 98.7%C EDI 22.12 1.24 21.71 9.34 54.42 102.8%B EDI 24.23 0.32 22.44 10.91 57.91 109.4%E EDI 20.61 2.21 21.53 8.56 52.91 100%
Case LocationSpace
HeatingSpace
CoolingLighting
VentFans
TOTAL% ofbase
A LON 148.6 75.5 334.4 156.7 715.2 93.8%B LON 143.2 63.6 337.1 143.3 687.2 90.2%C LON 153.0 75.0 334.0 159.9 721.9 94.7%B LON 171.1 35.2 346.9 128.6 681.9 89.5%E LON 141.6 103.0 331.3 186.2 762.1 100%
A MAN 187.0 38.5 333.8 145.5 704.9 94.9%B MAN 180.3 31.1 336.2 133.3 680.8 91.7%C MAN 192.7 37.7 333.2 149.2 712.8 96.0%B MAN 214.8 13.7 345.3 122.5 696.2 93.7%E MAN 178.0 58.2 330.5 176.2 742.9 100%
A EDI 221.3 20.1 335.1 141.1 717.5 101.1%B EDI 212.3 14.6 337.2 135.4 699.5 98.5%C EDI 228.0 19.1 334.4 143.9 725.5 102.2%B EDI 249.8 4.9 345.7 168.1 768.5 108.2%E EDI 212.5 34.0 331.7 131.8 710.0 100%
Table 3. Carbon dioxide emission (kgCO2/m2) in the office building.
Table 4. Energy cost (p/m2) in the office building.
Scientific paper 2 060901 10/10/06 14:56 Page 9
P 10P 11
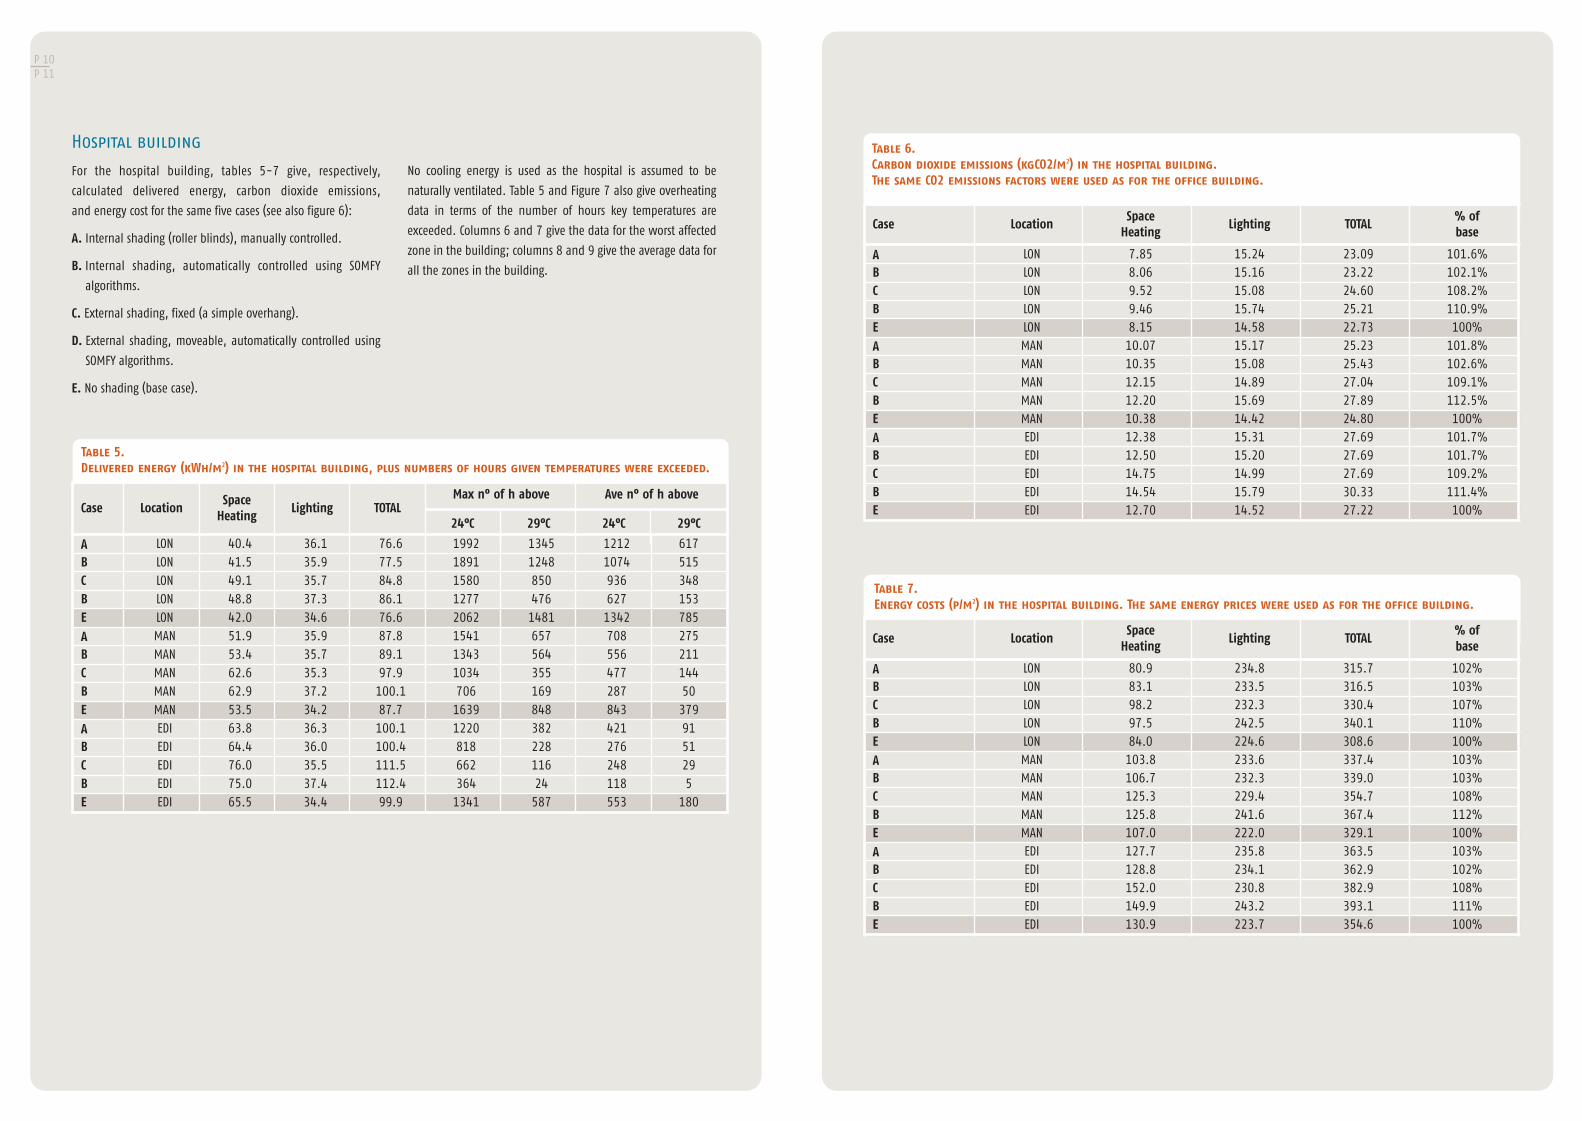
Hospital building
For the hospital building, tables 5-7 give, respectively,
calculated delivered energy, carbon dioxide emissions,
and energy cost for the same five cases (see also figure 6):
A. Internal shading (roller blinds), manually controlled.
B. Internal shading, automatically controlled using SOMFY
algorithms.
C. External shading, fixed (a simple overhang).
D. External shading, moveable, automatically controlled using
SOMFY algorithms.
E. No shading (base case).
No cooling energy is used as the hospital is assumed to be
naturally ventilated. Table 5 and Figure 7 also give overheating
data in terms of the number of hours key temperatures are
exceeded. Columns 6 and 7 give the data for the worst affected
zone in the building; columns 8 and 9 give the average data for
all the zones in the building.
Table 5. Delivered energy (kWh/m2) in the hospital building, plus numbers of hours given temperatures were exceeded.
Case LocationSpace
HeatingLighting TOTAL
A LON 40.4 36.1 76.6 1992 1345 1212 617B LON 41.5 35.9 77.5 1891 1248 1074 515C LON 49.1 35.7 84.8 1580 850 936 348B LON 48.8 37.3 86.1 1277 476 627 153E LON 42.0 34.6 76.6 2062 1481 1342 785
A MAN 51.9 35.9 87.8 1541 657 708 275B MAN 53.4 35.7 89.1 1343 564 556 211C MAN 62.6 35.3 97.9 1034 355 477 144B MAN 62.9 37.2 100.1 706 169 287 50E MAN 53.5 34.2 87.7 1639 848 843 379
A EDI 63.8 36.3 100.1 1220 382 421 91B EDI 64.4 36.0 100.4 818 228 276 51C EDI 76.0 35.5 111.5 662 116 248 29B EDI 75.0 37.4 112.4 364 24 118 5E EDI 65.5 34.4 99.9 1341 587 553 180
Max n° of h above Ave n° of h above
24°C 29°C 24°C 29°C
Case LocationSpace
HeatingLighting TOTAL
% ofbase
A LON 7.85 15.24 23.09 101.6%B LON 8.06 15.16 23.22 102.1%C LON 9.52 15.08 24.60 108.2%B LON 9.46 15.74 25.21 110.9%E LON 8.15 14.58 22.73 100%
A MAN 10.07 15.17 25.23 101.8%B MAN 10.35 15.08 25.43 102.6%C MAN 12.15 14.89 27.04 109.1%B MAN 12.20 15.69 27.89 112.5%E MAN 10.38 14.42 24.80 100%
A EDI 12.38 15.31 27.69 101.7%B EDI 12.50 15.20 27.69 101.7%C EDI 14.75 14.99 27.69 109.2%B EDI 14.54 15.79 30.33 111.4%E EDI 12.70 14.52 27.22 100%
Table 6. Carbon dioxide emissions (kgCO2/m2) in the hospital building. The same CO2 emissions factors were used as for the office building.
Case LocationSpace
HeatingLighting TOTAL
% ofbase
A LON 80.9 234.8 315.7 102%B LON 83.1 233.5 316.5 103%C LON 98.2 232.3 330.4 107%B LON 97.5 242.5 340.1 110%E LON 84.0 224.6 308.6 100%
A MAN 103.8 233.6 337.4 103%B MAN 106.7 232.3 339.0 103%C MAN 125.3 229.4 354.7 108%B MAN 125.8 241.6 367.4 112%E MAN 107.0 222.0 329.1 100%
A EDI 127.7 235.8 363.5 103%B EDI 128.8 234.1 362.9 102%C EDI 152.0 230.8 382.9 108%B EDI 149.9 243.2 393.1 111%E EDI 130.9 223.7 354.6 100%
Table 7. Energy costs (p/m2) in the hospital building. The same energy prices were used as for the office building.
Scientific paper 2 060901 10/10/06 14:56 Page 11

P 12P 13
Discussion
In the analysis, the addition of shading always produces a
reduction of cooling demand and an increase in artificial lighting
and, nearly always, heating. The only exception is in the
hospital where adding internal blinds slightly reduces the
heating load. This is because of reduced heat loss through
windows during cold nights, by reducing the conductivity of the
window system when the blinds are lowered.
Air conditioned officeThe results for the office building show that substantial cooling
savings are possible. External automatic shading control
(option D) achieves the biggest savings in cooling. Compared to
the no shading case (option E) it gives a 66% reduction in
London, 77% in Manchester and 85% in Edinburgh. This shows
the potential of this strategy to reduce cooling requirements
in air conditioned buildings (or even avoid the need to install
cooling in some locations). Cooling savings are best achieved
with external devices that prevent additional solar gains.
However, cooling savings need to be balanced against the
increases in heating and lighting energy use. When analysed
using delivered energy, internal automatic shading (b)
produces the best results in all locations with a total delivered
energy reduction (table 2) of up to 6.6% in London.
However delivered energy is not the best metric to use when
assessing the impact on the environment (for which
CO2 emissions (table 3) are more suitable) or building occupier
(who will be more interested in energy cost (table 4)).
If either of these metrics are chosen, the provision of
shading gives greater savings compared to the no shading case
(up to 10% in energy cost in London if an automatically
controlled system is used). For London, there is very little
difference between the performance of internal and external
shading systems in predicted energy cost or CO2 emissions.
However, latitude is a critical factor for shading systems. At high
northern latitudes additional shading does not generally achieve
energy savings, although it may increase user comfort by
reducing glare.
For internal blinds, the introduction of the automatic control
components (option B) always gives a saving of around 3% in
total energy use compared with manual control (option A), for
all latitudes. Both heating and cooling energy are reduced, but
lighting energy use increases marginally, because the blinds are
lowered more in summer.
Comparison of the automatically controlled external shading
(option D) with the simple fixed overhang (option C) shows that
the controlled shading gives a 5% reduction in energy cost
in London and 2% reduction in Manchester. However in
Edinburgh there is a 6% increase in energy cost. This is due to
the increase in space heating costs in winter, because the
modelling takes account of the occupants using the moveable
external shading like blinds to reduce glare. The fixed overhang
does not control glare from low angle sun in winter, so would be
unlikely to be acceptable on its own as a shading device.
A combination of automatically controllable internal shading
(winter) and external shading (summer) could result in the best
strategy for energy savings and comfort levels in an air
conditioned building.
Naturally ventilated hospitalAs the hospital does not have cooling installed, adding any
form of shading will increase the energy use (tables 5-7).
Depending which metric is used, internal shading results in an
energy penalty of 1-3%, and external shading a penalty of
7-12%, compared to the no shading case.
With internal shading, automatic control (option B) gives similar
energy use to manual control (option A). For external shading,
the moveable automatically controlled system (option C)
gives energy use 1-4% higher than the simple fixed overhang
(option D).
However energy use is not the only important issue here.
Thermal comfort is critically important too. Table 5 gives the
temperature data for the building. A typical thermal comfort
criterion for naturally ventilated buildings is a temperature of
25°C over less than 5% of occupied hours (ref 9). For a hospital
occupied 24 hours a day, this is 438 hours over the year.
Temperatures over 28°C are very uncomfortable and should be
avoided.
Table 5 shows that the hospital design is particularly prone to
overheating, especially in Southern England. Taking the hospital
as a whole, a very high temperature of 29°C is exceeded 9% of
the year with no shading. Internal shading reduces the
temperatures slightly. Fixed external shading gives a further
reduction, but the most effective system uses the moveable
automatically controlled shading. Even with this system there is
a tendency for the building to overheat, so it would need to be
applied as part of a package of measures, for example improved
ventilation and maybe cooling of the hottest zones.
Further north the overheating is not so marked if suitable
shading is installed. With the moveable automatically controlled
solar shading, overheating is limited to a few ‘hot spots’ in the
building. There is a substantial difference in thermal comfort
between the different shading options.
Moveable shading also helps to provide privacy, which is
important in hospital buildings. Options C (fixed overhang on its
own) and E (no shading) would not be acceptable in most areas
in hospitals for this reason.
Conclusions
This paper has examined the energy and thermal comfort
implications of installing solar shading, including automatically
controlled shading. The addition of shading reduces cooling
demand but increases the need for artificial lighting and,
nearly always, heating. Consequently energy savings are
generally possible only in buildings which have cooling
installed, or where cooling would have to be installed if the
shading were not present.
Analysis of an air conditioned office suggests that in England
shading can result in significant reductions in carbon dioxide
emissions and energy cost. In the London area, compared to a
building without shading, overall CO2 savings of 5% were
predicted for manually controlled blinds and 4% for a simple
external overhang. In Manchester the corresponding savings
were 4% and 3% respectively.
Additional savings can be obtained by installing automatic
control of shading. This happens if the system can lower blinds
on hot days, especially in unoccupied spaces; if it can raise the
blinds to admit daylight on dull days when shading is not
required to control glare; and if it can lower blinds on cold
nights to reduce heat loss. In offices manual override is still
recommended to allow occupant control, especially of glare. The
analysis in this paper has shown that such automatically
controlled shading will typically give extra CO2 savings of around
3% compared to simple manually controlled or fixed systems.
Overall, an automatically controlled shading system gave
building CO2 savings of 9% (with internal blinds) and 8% (with
external blinds) in the London area compared to the no shading
case.
The benefits of shading are latitude dependent; in Scotland,
installation of external shading gave an energy penalty of
between 3% and 9%. Moveable external shading gave the
highest energy penalty because occupants would use the
external blinds to control glare, reducing solar gains on cloudy
days. Automatic control of internal shading was more successful
here, reducing CO2 emissions by around 2% compared to no
shading or manually controlled internal shading.
In a naturally ventilated hospital, the installation of shading
resulted in an energy penalty of between 2% (for internal blinds
either manually or automatically controlled) and 11-13% for
automatically controlled external shading. However, the
external shading resulted in significant reductions in
summertime external temperatures, which could avoid the need
to install cooling in some areas.
Acknowledgements
The analysis described here has been funded by the shading
control manufacturer Somfy. However the views expressed here
are those of the authors and not necessarily those of Somfy SA.
We would like to thank Serge Neumann and Geraldine
Mostachfi of Somfy for providing details of their systems.
Scientific paper 2 060901 10/10/06 14:56 Page 13
. References1. Littlefair P J, ‘Solar shading of buildings’ BRE Report BR 364.
Garston, Building Research Establishment, 1999.
2. Littlefair P J, ‘Retrofitting solar shading’ BRE Information
Paper IP11/02, Garston, Building Research Establishment,
2002.
3. Energy Efficiency Best Practice Programme ‘Comfort without
air conditioning in refurbished offices’, New Practice Case
Study 118, Garston, BRECSU, 2000.
4. Dubois M-C, ‘Solar Shading for Low Energy Use and Daylight
Quality in Offices. Simulations, Measurements and Design
Tools.’ Report No TABK--01/1023,
Department of Construction and Architecture, Lund University,
Lund, Sweden, 2001.
5. Littlefair P J, ‘Controlling solar shading’ BRE Information Paper
IP12/02, Garston, Building Research Establishment, 2002.
6. Conservation of fuel and power: New buildings that are not
dwellings Approved Document L2A, 2006 edition (London:
Office of the Deputy Prime Minister) (2006). Available from
www.dclg.gov.uk
7. See http://www.doe2.com/eQUEST/
8. Rubin A I, Collins B L and Tibbott R L. ‘Window blinds as
a potential energy saver - a case study’. Washington,
National Bureau of Standards, 1978.
9. ‘Environmental design’ CIBSE Guide A. London, Chartered
Institution of Building Services Engineers, 2006.
P 14P 15
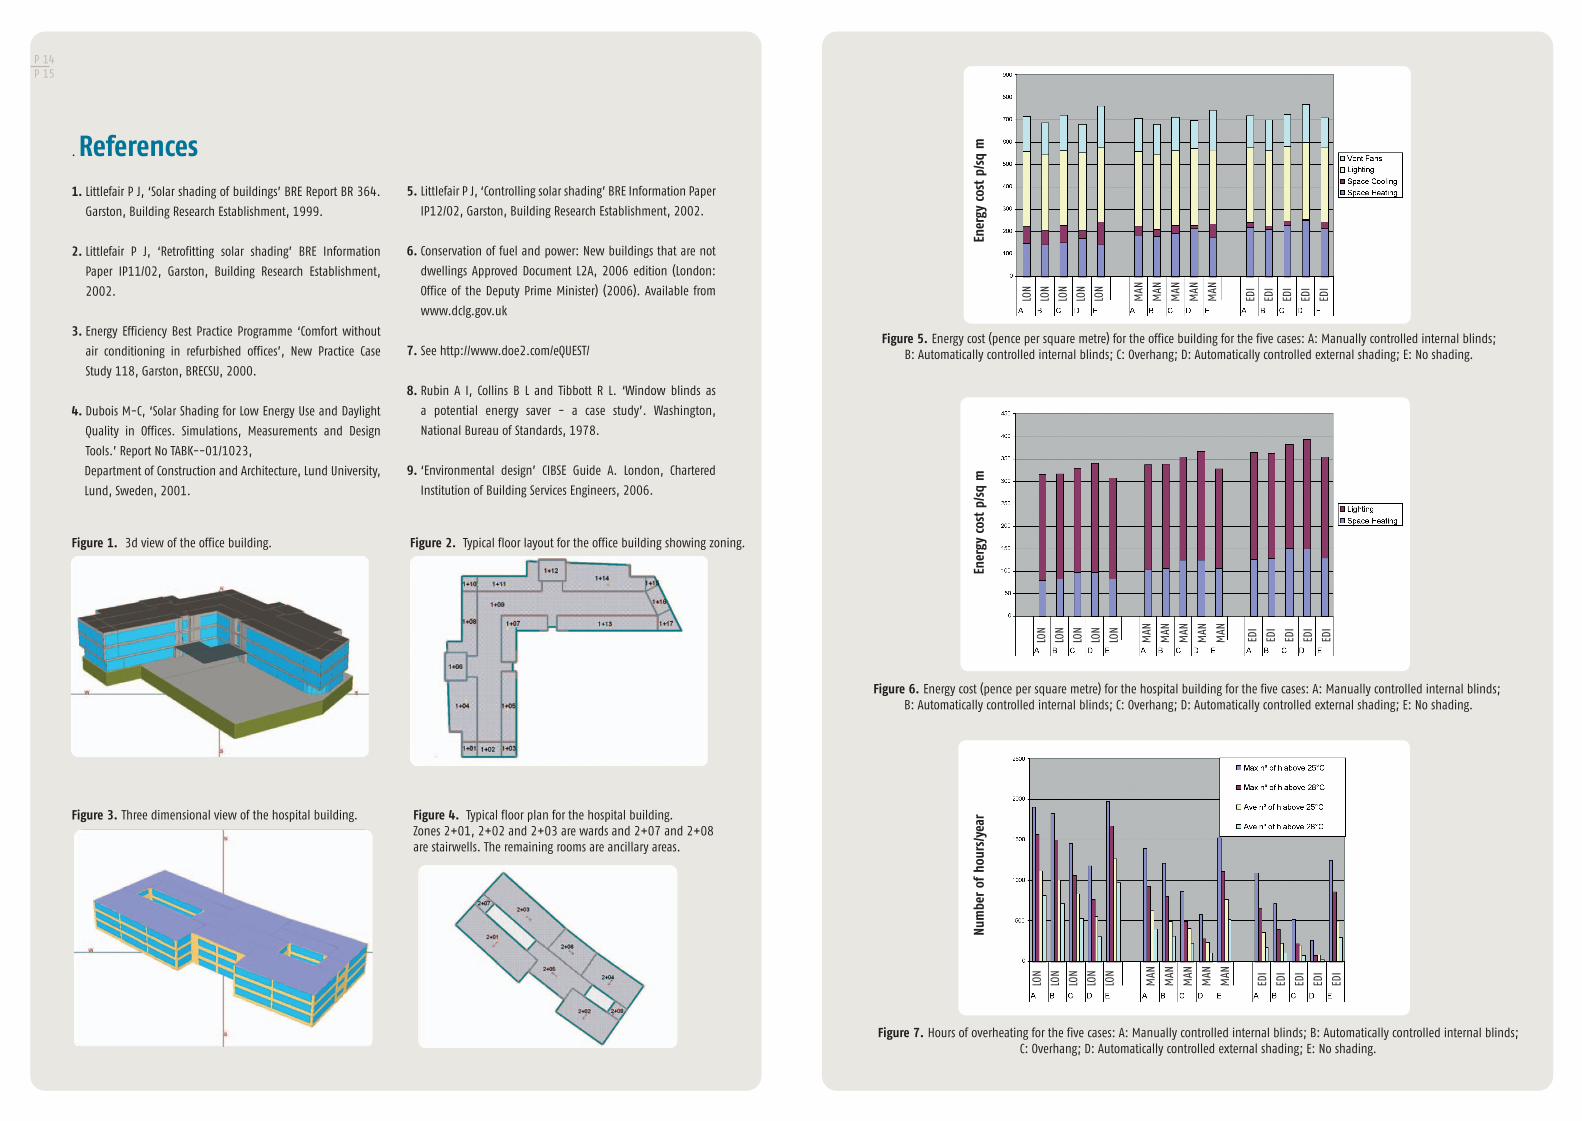
Figure 1. 3d view of the office building. Figure 2. Typical floor layout for the office building showing zoning.
Figure 3. Three dimensional view of the hospital building. Figure 4. Typical floor plan for the hospital building. Zones 2+01, 2+02 and 2+03 are wards and 2+07 and 2+08 are stairwells. The remaining rooms are ancillary areas.
Figure 5. Energy cost (pence per square metre) for the office building for the five cases: A: Manually controlled internal blinds; B: Automatically controlled internal blinds; C: Overhang; D: Automatically controlled external shading; E: No shading.
LON
LON
LON
LON
LON
MAN
MAN
MAN
MAN
MAN
EDI
EDI
EDI
EDI
EDI
Figure 6. Energy cost (pence per square metre) for the hospital building for the five cases: A: Manually controlled internal blinds;B: Automatically controlled internal blinds; C: Overhang; D: Automatically controlled external shading; E: No shading.
Ener
gyco
stp/
sqm
LON
LON
LON
LON
LON
MAN
MAN
MAN
MAN
MAN
EDI
EDI
EDI
EDI
EDI
Figure 7. Hours of overheating for the five cases: A: Manually controlled internal blinds; B: Automatically controlled internal blinds; C: Overhang; D: Automatically controlled external shading; E: No shading.
L ON
L ON
L ON
L ON
L ON
MAN
MAN
MAN
MAN
MAN
EDI
EDI
EDI
EDI
EDI
Ener
gyco
stp/
sqm
Num
ber
ofho
urs/
year
Scientific paper 2 060901 10/10/06 14:56 Page 15