the energy performance of prototype holographic glazings
TRANSCRIPT
LBL-34367DA-302
The Energy Performance ofPrototype Holographic Glazings
K. Papamichael, L. Beltrg.n, R. Furler, E.S. Lee, S. Selkowitz, M. Rubin
Energy and Environment DivisionLawrence Berkeley Laboratory
University of CaliforniaBerkeley, California 94720
February 1993
This work was supported by the Assistant Secretary for Conservation and Renewable Energy, Office of BuildingTechnologies, Building Systems and Materials Division of the U.S. Department of Energy under Contract No.DE-AC03-76SF00098.
I I It i'_" %'e_"l'_,_,llltlll--i 'iii i I_'_"11#i"'_'hl_lli-",.-IlVll I i.,._-,.l.,_P
rL
February1993 The Energy Performance ofPrototype Holographic Glazings
K. Papamichael, L. Beltr_n, R. Furler, E.S. Lee,
S. Selkowitz, M. Rubin
Building Technologies ProgramEnergy and Environment DivisionLawrence Berkeley LaboratoryBerkeley, CA 94720
1.0 Executive Summary
We report on the simulation of the energy performance of prototypeholographic glazings in commercial office buildings in a Californiaclimate. These prototype glazings, installed above conventional sidewindows, are designed to diffract the transmitted solar radiation andreflect it off the ceiling, providing adequate daylight illumination fortypical office tasks up to 30 ft (9.14 m) from the window.
Past studies on the daylight performance of previous versions of theseholographic glazings indicate that they can reduce electric lightingloads over a deeper perimeter area than clear glass for selected sunpositions. However, no data have been available to estimate potentialenergy savings over the course of an entire year, under more realisticcombined stm and sky conditions and for different windoworientations. Moreover, these previous studies have not accounted forthe cooling loads from solar heat gain associated with the use ofdaylight, which must be considered along with daylighting savings toestimate the overall efficiency improvement.
In this study, we experimentally determined a comprehensive set ofsolar-optical propeixies and characterized the contribution of theprototype holographic glazings to work-plane illuminance in a scalemodel of a typical office space. We then used the scale modelmeasurements to simulate the energy performmace of the holographicglazings over the course of an entire year for four window orientations(North, East, South and West) for the inland Los Angeles climate,using the DOE-2.1D building energy analysis computer program.
The results of our experimental analyses indicate that these prototypeholographic glazings diffract only a small fraction of the incident light.
The Energy Performanceof PrototypeHolographic Glazings page 1
iii iiw
ExecutiveSummary
The average diffraction efficiency, defined as the fraction of theincident visible radiation diffracted towards the ceiling, was estimatedat 16%-20% for the most effective angle of incident radiation. As aresult, the daylight performance of these holographic glazings is verysimilar to clear glass. The same is true with the solar heat gainperformance, since the holographic diffractive structures have only aminimal effect on the near infrared part of file solar spectrum and wereapplied on single clear glass.
Previous versions of these holographic diffractive structures showhigher diffraction efficiency, in the range of 35% - 40%. However,these previous versions produce an undesired "rainbow" effect. Thenew versions show a significant improvement with respect toproducing "white" light. However, this improvement in light qualityhas apparently been achieved at a cost of reduced diffractionefficiency.
When compared to low-E glazing with shading control, which isconsidered to be the current common practice for improved energyefficiency, holographic glazings reduced total annual electric energyrequirements by 3% on the North orientation but increased them by26%, 41% and 32% on the East, South and West orientations,respectively. Holographic glazings reduced annual elecu-ic lightingrequirements by 11%, 10%, 3% and 7% on the North, East, South andWest orientations, respectively. They also reduced cooling loads dueto solar heat by 7% on the North orientation, but increased them by50%, 71% and 58% on the East, South and West orientations,respectively. Finally, holographic glazings increased peak electricitydemand by 6%, 30%, 36% and 32%, on North, East, South and West,orientations, respectively.
Since the holographic diffractive structures may be applied tothermally better glazings than single-pane clear glass, we modeledvarious hypothetical glazings assuming the daylight performance ofthe holographic glazings and the thermal performance of double anddouble low-E glazings. While performance improved, it was still notas good as that of double low-E glazing with shading control. We alsoconsidered shading with single-pane holographic glazing, whichprovided better performance with respect to reducing cooling loads butworse with respect to daylighting (electric lighting savings), beingoverall less energy-efficient than low-E glazing with shading control.
The results of this study indicate that these prototype holographicglazings will not save energy in commercial office buildings. Theirperformance is very similar to that of clear glass, which, through sidewindows, cannot efficiently illuminate more than a 15 ft - 20 ft (4.57m - 6.09 m) depth of a building's perimeter, because the coolingpenalties due to solar heat gain are greater than the electric lightingsavings due to daylighting.
It should be possible to improve the energy performance ofholographic glazings, by redesigning their light control function and
TheEnergyPerformanceof PrototypeHolographicGlazings page2
i |11 i|1 i i i ii iiii i ii
ExecutiveSummary
by integrating them with solar heat gain control technologies into moresophisticated fenestration systems. However, ff this technology is toproduce marketable energy-efficient products, additional research anddevelopment is required to integrate the holographic structures intocomplete window / curtain-wall designs, considering the overallbuilding performance with respect to energy, cost and comfort.
2.0 Introduction
When combined with appropriate electric lighting dimming controls,the use of daylight for task illumination can significantly reduceenergy requirements in commercial buildings. While skylights caneffectively illuminate any part of one-story buildings, conventionalside windows can illuminate only a 15 ft - 20 ft (4.57 m - 6.09 m)depth of the bui:cling perimeter. Even so, the overall efficacy ofdaylight is limited, because side windows produce uneven distributionsof daylight. Achieving adequate illumination at distances further awayfrom the window results in excessive illumination near the window,which increases cooling loads from the associated solar heat gain. Asa resuk, the use of larger apertures and/or higher transmittanceglazings, to introduce daylight deeper than 15 ft - 20 ft (4.57 m - 6.09m), may prove ineffective with respect to saving energy, because thecooling load penalties may exceed the electric lighting savings.
The need for more uniform distributions of daylight admitted throughside windows has stimulated significant research and developmentefforts in new fenestration designs and glazing technologies. Many ofthese approaches rely on the common strategy of redirecting daylightand reflecting it off the ceiling towards the back of the room. Thisshould provide daylight illumination at distances up to 30 ft (9.14 m)from the window without excessive daylight and solar heat gain nearthe window.
Holographic glazings use a coating of microscopic diffractive structureto redirect light. One such coating is being developed by theAdvanced Environmental Research Group (AERG), which wasfounded in 1984 to conduct research and development on the use ofHolographic Diffractive Structures (HDS) in windows.
2.1 Background
The first AERG HDS samples were analyzed in 1989, using outdoormeasurements in a scale model that represented a 20 ft (6.09 m) wideby 30 ft (9.14 m) deep by 10 ft (3.05 m) high space with HDS glazingcovering the top 4 ft (1.22 m) of the window wall [Bryan 1990]. Theanalysis showed that, when compared to clear glass, HDS introducemore daylight at a distance of 27.5 ft (8.38 m) from the window wall,for high sun altitudes (60" to 70 °) at a plane normal to the window.However, the HDS performance decreases as the sun azimuth from the
normal to the window increases, mad the HDS introduce less daylightthan clear glass under overcast skies. Moreover, these initial HDS
The Energy Performanceof PrototypeHolographic Glazings page 3
i! i
Background
samples produce a rainbow effect, since different parts of the visiblespectrum are diffracted at different angles.
Since the 1989 study, AERG developed a new generation of smnplegratings, which use five-stripe bands of HDS designed to mix theoutgoing radiation and eliminate the rainbow effect. We will refer tothese new samples as BHDS (B stands for "banded"). Analysesperformed by AERG, using indoor measurements in a model similar tothe 1989 study, indicate that, when compared to clear glass, BHDSintroduce more daylight at a distance of 27.5 ft (8.38 m) from thewindow wall, for sun altitudes ranging from 30° to 70 ° at a planenormal to the window [AERG 1992].
The above studies indicate that the use of the BI-E)S can save lightingenergy by reducing electric lighting loads over a deeper perimeter areathan clear glass, for a limited range of sun positions. However, no datahave be,:n available to estimate total energy savings (heating, coolingand lighting) for the course of a whole year and for different windoworientations, taking into account daylighting for all sun and skyconditions, and the cooling loads from solar heat gain associated withthe use of daylight.
2.2 Objective
The agencies sponsoring this research have as their objective thedevelopment and commercialization of efficient building technologies.To realize the large market impact sought by the sponsoring agencies,new glazing technologies must exceed the performance of existingenergy efficient glazings.
The objective of this study was to determine the energy performanceof the prototype BHDS glazings in a typical office building in aCalifornia climate and compare it with that of existing energy efficientwindows.
The focus of this study was to provide a sufficiently detailedcharacterization of the solar-optical properties of the holographiccoatings so that a comprehensive annual energy analysis could beperformed.
3.0 Methodology
As explained in the previous section, the effectiveness of daylightutilization for energy savings depends on the balance of electriclighting savings due to daylighting and cooling load penalties due tosolar heat gain. The performance of a fenestration system is dynamicand depends on the context of its apphcation, which is characterizedby parameters such as building type, window orientation and climate.
Considering the above, we decided to determine the energyperformance of the BHDS sample gratings assuming office buildingactivities and schedules, for four orientations (North, East, South and
The Energy Performance of Prototype Holographic Glazings page 4

i| i i ira iiii
Methodology
West) andcompareit with the energyperformanceof double panelow-E glazing with shadingcontrol, which representscurrent commonpractice with respect to energy-efficient glazings. We also decided toconsider a California climate, because it offers the opportunity forproper consideration of the trade-off between electric lighting savingsdue to daylighting and cooling load penalties clue to solar heat gain.
We selected a 20 ft (6.09 m) by 30 ft (9.14 m) space with 10 ft (3.05m) height, with BHDS covering the whole width of the window wallfrom a 6 ft (1.83 m) to 10 ft (3.05 m) height, and low-E glazingcovering the whole width of the window wall from a 3 ft (0.91 m) to 6ft (1.83 m) height from the floor plane (Figure 1). We then comparedthe performance to the "base case" of an identical space with doublelow-E glazing with shading control, covering the whole width of thewindow wall from 3 ft (0.91 m) to 10 ft (3.05 m) height (Figure 2).The modeled space was considered as part of a 16,000 square feetoffice building, with 20 ft (6.09 m) by 30 ft (9.14 m) perimeter officespaces surrounding an 80 ft (24.36 m) by 80 ft (24.36 m) core zone.
AERG provided us with one 4 inch by 5 inch BHDS sample, two 2inch by 5 inch BHDS samples, two 2 inch by 2.5 inch BHDS samples,and one 4 inch by 5 inch HDS sample, for measurements required forsimulation analyses. These BHDS sample gratings were designed toprovide optimal results for the modeled configuration facing South.
In order to determine the energy performance of the BHDS samples,we had to determine their daylight and thermal performance. Theoptical complexity of the AERG sample gratings prevented us fromusing conventional, computer-based simulation methods. Thus, weemployed a new method, which is based on the use of scale models toexperimentally determine directional illuminance coefficients, whichare then used with analytical, computer-based routines. This methodallows us to simulate the daylight performance of fenestration systemsand spaces of arbitrary complexity under any exterior conditions, anduse the results with the DOE-2.1D energy analysis computer program[BESG 1984a, 1984b] that provides an hour-by-hour sinmlation of theoperation of a building for the course of a whole year.
4.0 Smoke Chamber Photographs
Ir,Atially,we took photographs of a laser beam transmitted through theBHDS, to visualize the magnitude and direction of the transmittedradiation. One BHDS sample was placed inside a smoke chamber anda low-power red laser beam was directed at it at various incidentangles and captured on fdm.
Visual inspection of these photographs suggest that only a smallfraction of the light incident on the BHDS is redirected, while most ofit is transmitted specularly, that is as through clear glass (Figures 3 and4). Since the size of the laser beam was small and could not cover allfive-stripes of the BHDS bands, we did not draw any conclusions and
The Energy Performance of Prototype Holographic Glazings page 5

..... i
SmokeChamberPhotographs
decided to proceed with the scale model measurements and comparethe daylight performance of the BHDS with that of clear glass.
5.0 Scale Model Photometric Analysis
After the completion of the smoke chamber photographs, AERGprovided as with an improved 4 inch by 5 inch BHDS sample, referredherein as BHDS-2. Since AERG expressed a concern that the BHDSsamples might have been damaged due to exposure to light and smoke,we decided to take measurements for both samples, as well as clearglass, and compare the results.
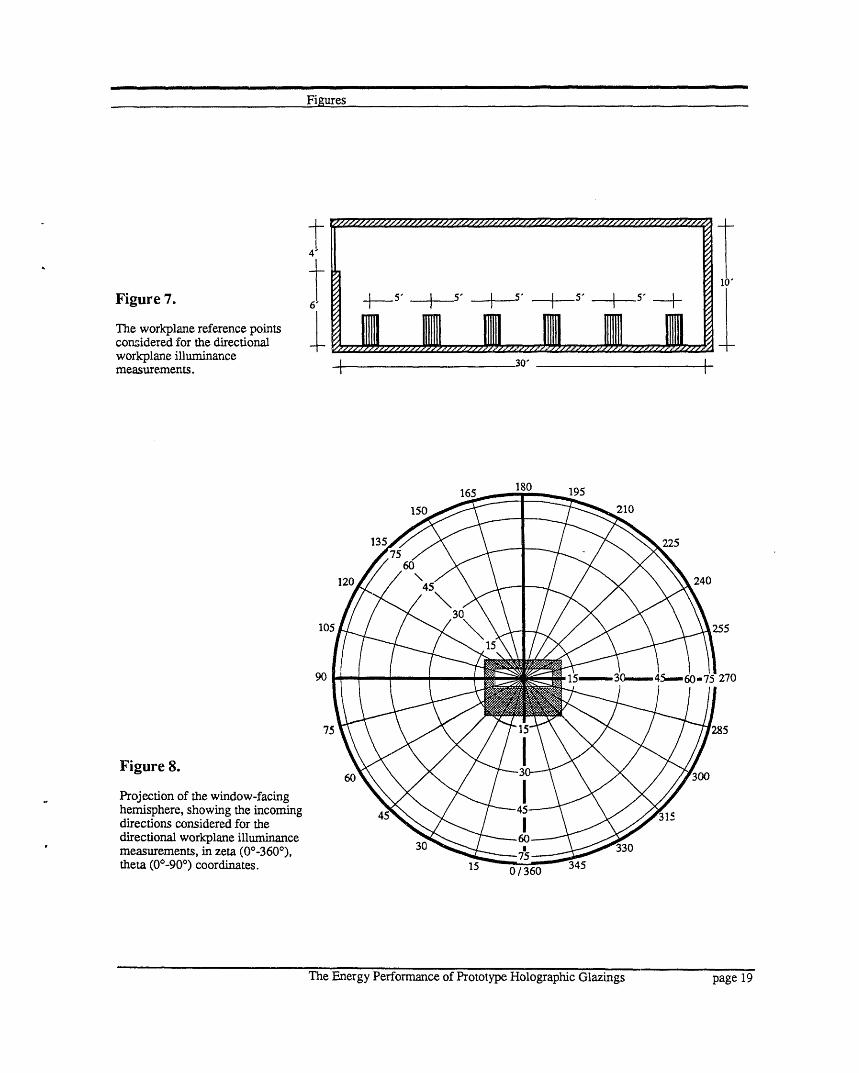
We constructed a half-inch-to-a-foot to scale model of the typicaloffice space described in Section 3.0 (Methodology), with interiorreflectance values of 0.76 for the ceiling, 0.44 for the walls and 0.21for the floor. Using our scanning radiometer [Papamichael 1987](Figures 5 and 6), we took measurements of workplane illuminance at6 distances from the windrowwall (Figure 7) for 121 incomingdirections of radiation, covering the whole hemisphere seen by thewindow (Figure 8). Since the BHDS-2 sample could not be used tocover the entire 2 inch by 10 inch aperture that corresponded to theholographic glazing, we decided to make two sets of comparisons,totaling 5 sets of measurements. First we made a three-waycomparison among clear glass, BHDS, and BHDS-2, considering a 2inch by 4 inch aperture (Figure 9). Then, we made a second set ofmeasurements for a two-way comparison between clear glass andBHDS for the whole 2 inch by 10 inch aperture (Figure 10).
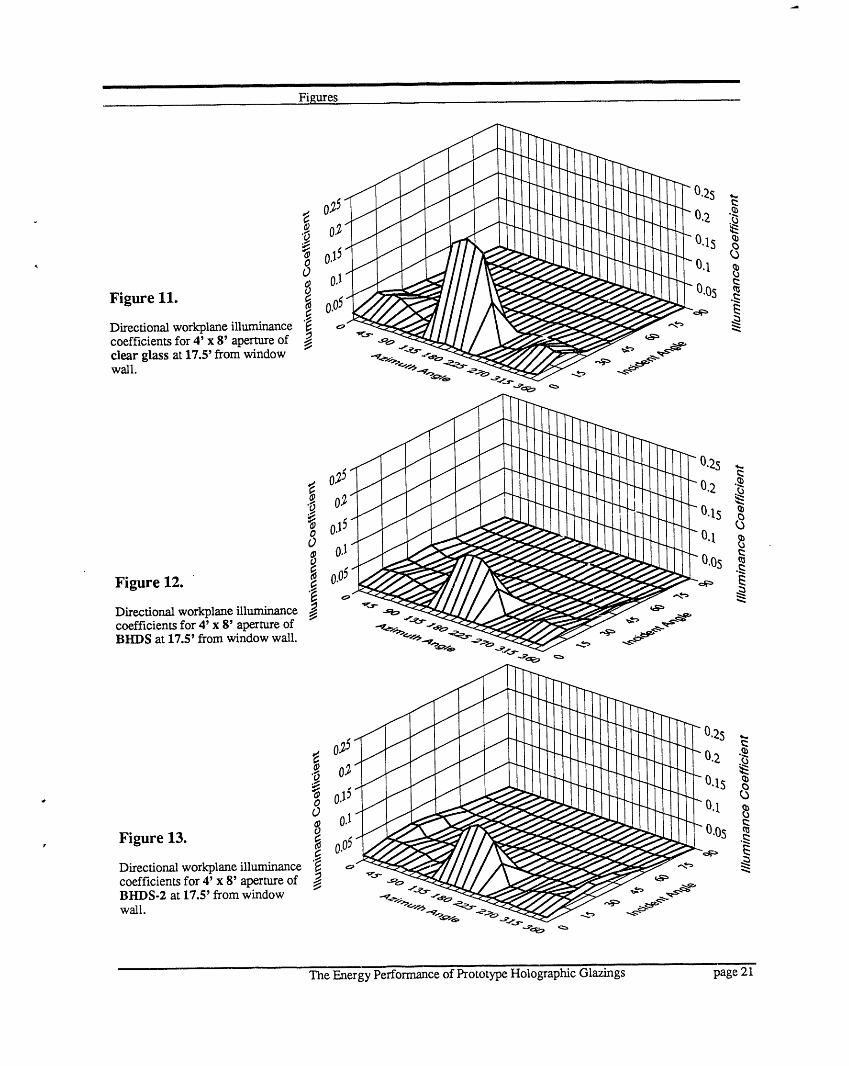
The results of these measurements indicate that BHDS and BHDS-2were very similar, confirming that the smoke tests had not damagedthe original sample (Figures 11, 12 and 13). When compared to clearglass, BHDS introduce more fight at the back of the room for a largenumber of incoming directions. However, although the percentdifferences appear to be large (Figure 14), the actual values are smallin terms of desired light levels and large for the directions that clearglass introduces more light (Figures 14, 15 and 16). The similarity ofthe results from BHDS when compared with clear glass are consistentwith the laser beam photographs which suggest that only a smallfraction of the transmitted radiation through the BHDS is redirected.
In addition to the above mentioned indoor measurements, we tookseveral outdoor measurements to ensure that the spectral output of thefight source used for the indoor measurements was appropriate.During these outdoor tests we took photographs of the model's interiorfor several sun positions, to document the color separation of thetransmitted radiation and the luminance distribution of the interiorsurfaces. We also took some additional outdoor scale modelphotographs using the HDS sample to compare the color separationand the color mixing effectiveness of the BHDS. The photographs ofthe HDS show an intense rainbow effect (Figure 17), in contrast to the
TheEnergy-SavingPotentialof PrototypeHolographicGlazings page6
i | ii p i|1 n! Hl ,, Hill , , , | III
ScaleModelPhotometricAnalysis
BHDS which is much more effective in mixing the outgoing radiationto reduce the rainbow effect (Figure 18).
We also compared the results of our outdoor measurements with thosefrom the 1989 study [Bryan 1990]. While we are in general agreementwith respect to percent differences, there are significant disagreementswith respect to actual illuminance values. The 1989 analysis used theHDS samples, rather than the BHDS coating design. However, eventhe clear glass measurements are in significant disagreement. The1989 study reports up to 70 fc (752.5 lux) at a distance of 27.5 ft (8.38m) from the window wall with clear glass. With higher outdoorillumination levels we measured 21 fc (225.75 lux) for clear glass and24 fc (258 lux) without any glass. To better understand thisdiscrepancy, we performed a set of additional outdoor measurementsvarying the ground reflectance in front of the scale model. Thisvariation of the ground reflectance resulted in a large variation inindoor workplane illuminance from 11 fc (115 lux) with low groundreflectance (brown surface) to 56 fc (605 lux) with high groundreflectance (white surface). Since the outdoor test models are tilted toobtain the correct solar incident angle, the effect of varying groundreflectance can be large, particularly at the back of the room. Apossible reason for the higher illuminance values of the 1989 studymay be the use of a high ground reflectance.
6.0 Daylight Analysis
Prior to conducting an annual energy analysis, we performed a moredetailed daylight analysis for the San Francisco, CA, climate,considering four orientations (North, East, South and West) for twelveinstances in a year (9:00 AM, 12:00 Noon and 3:00 PM, for March 21,June 21, September 21 and December 21). The daylight analysis wasperformed for both: the 4 ft (1.22 m) by 8 ft (2.44 m) aperturecomparing clear glass, BHDS and BHDS-2, and the 4 ft (1.22 m) x 20ft (6.1 m) aperture comparing clear glass and BHDS.
Daylight values for the sun, sky, and ground components weredetermined using the experimentally determined directional workplaneilluminance coefficients of the photometric analysis. Values for thesun component were determined through interpolation on themeasured coefficients. Values for the sky and ground componentswere determined through integration of the measured coefficients overthe luminance distribution of the sky and the ground. We assumed theCIE clear and overcast sky luminance distributions [CIE 1970, 1973]and 0.2 uniform ground reflectance.
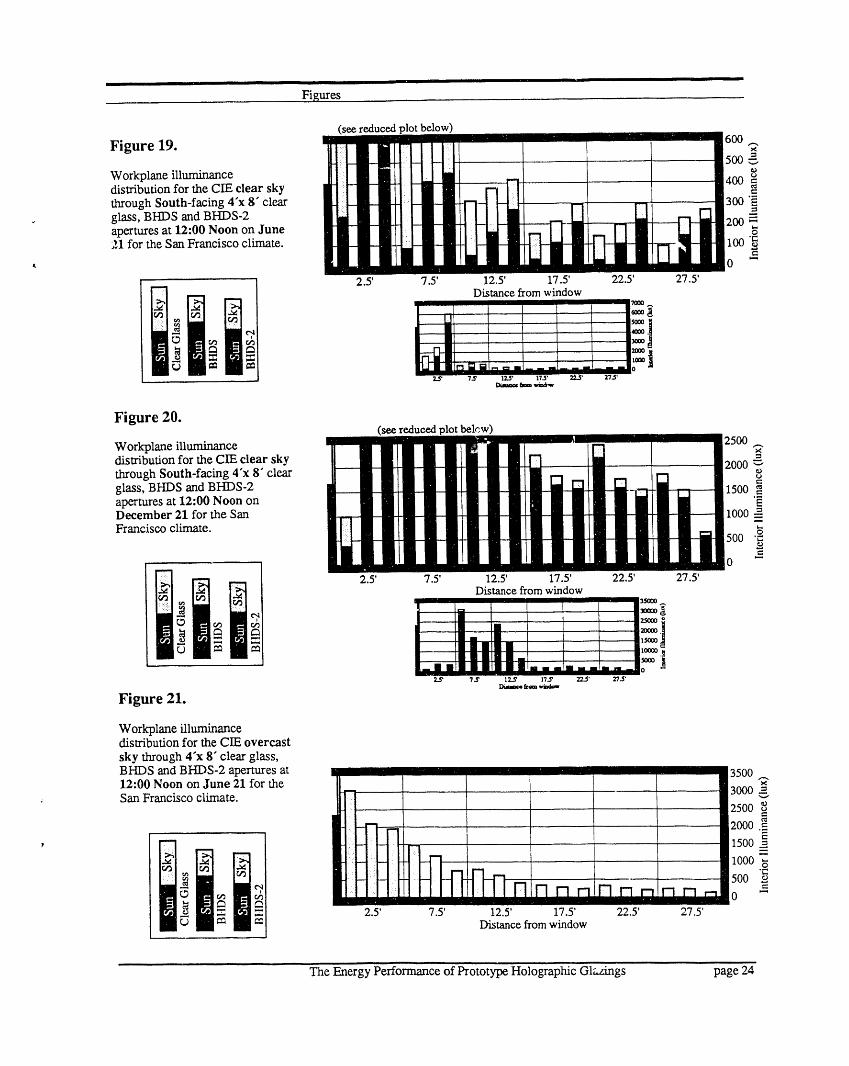
The results of the daylight analysis indicate that the BHDS and BHDS-2 introduce more light from the sun than clear glass at the back of theroom when the sun is at high altitudes in front of the window, such asduring the summer noon hours for a South-facing window (Figure 19).However, when the sun is at low altitudes, such as during the winternoon hours for a South-facing window the HDS and BHDS introduce
TheEnergyPerformanceof PrototypeHolographicGlazings page7

III II
DaylightAnalysis
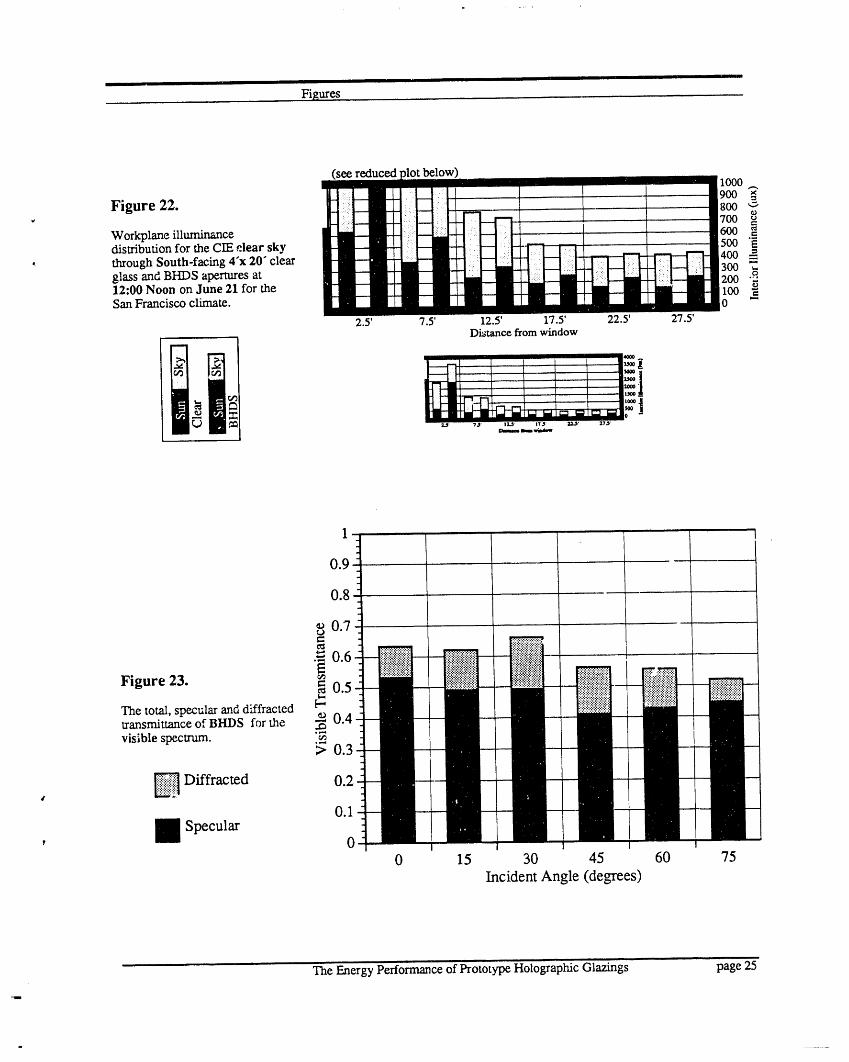
less sunlight than clear glass (Figure 20). Clear glass alwaysintroduces more light from the sky than the holographic glazingsthroughout the space (Figure 21). The differences in light contributionfrom the sky is even more profound for the 4 ft (1.22 m) by 20 ft (6.1m) aperture. In many cases the extra fight from the sky introducedthrough clear glass balances out the extra light from the sun introducedby the holographic glazings, even for the South-facing window atsummer noon (Figure 22), when the BHDS and BHDS-2 show theirbest performance for small apertures. Moreover, the BHDS andBHDS-2 always introduce high daylight levels at the front of the room,which is expected to offset some of the electric lighting savings, byproducing excessive cooling loads.
7.0 Radiometric Analysis
Using a goniospectrometer and our scanning radiometer, we measuredthe bi-directional transmittance and reflectance of the BHDS forvarious incoming directions, for both the visible and the total solarspectra. Measurements were taken in steps of one degree (1°) withrespect to the outgoing angles, for six incoming directions of radiation(0°, 15°, 30°, 45°, 60° and 75 ° incident angles). The diffractedcomponent of the transmitted radiation was then calculated throughsummation, used to approximate integration over the outgoing range ofinterest:
9ofoT(O) 9ooTd= j .dO= __-T(O)-I°
_=__oAO AO•_ =-2.8°
where T(O) is the transmittance value at outgoing direction specifiedby O, and AO is the angular response of the detector.
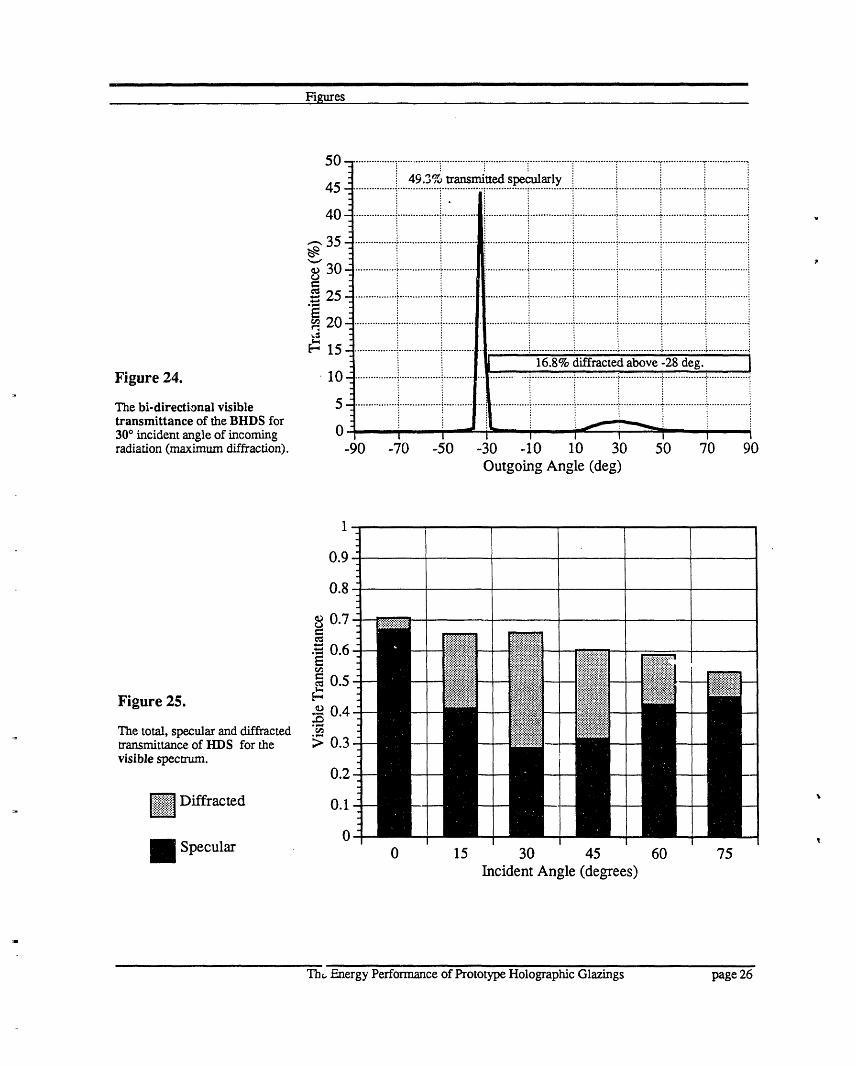
The results indicate that the BHDS redirect only a small fraction of thevisible spectrum towards the ceiling, while the major part of theincident radiation is transmitted specularly, as for ordinary glass(Figures 23 and 24). These results are consistent with the laser beamphotographs as well as the results of the scale model photometricanalyses.
We also measured the visible spectrum bi-directional transmittance ofthe HDS for comparison purposes. The results of these measurementsindicate that the HDS diffract significantly more light towards theceiling than the BHDS (Figures 25 and 26). lt appears that using thefive stripe coating design (BHDS) to reduce the rainbow effect of theHDS, reduced the effectiveness of redirecting the light towards theceiling. AERG believes that the diffraction efficiency of the BHDScould be brought up to that of the HDS, through better constructionand elimination of the spaces between the stripes.
With respect to the total solar spectrum, the results indicate that theBHDS do not redirect any of the non-visible part of the solar radiation.
TheEnergyPerformanceof PrototypeHolographicGlazings p_,gc8
Rzdiometric Analysis
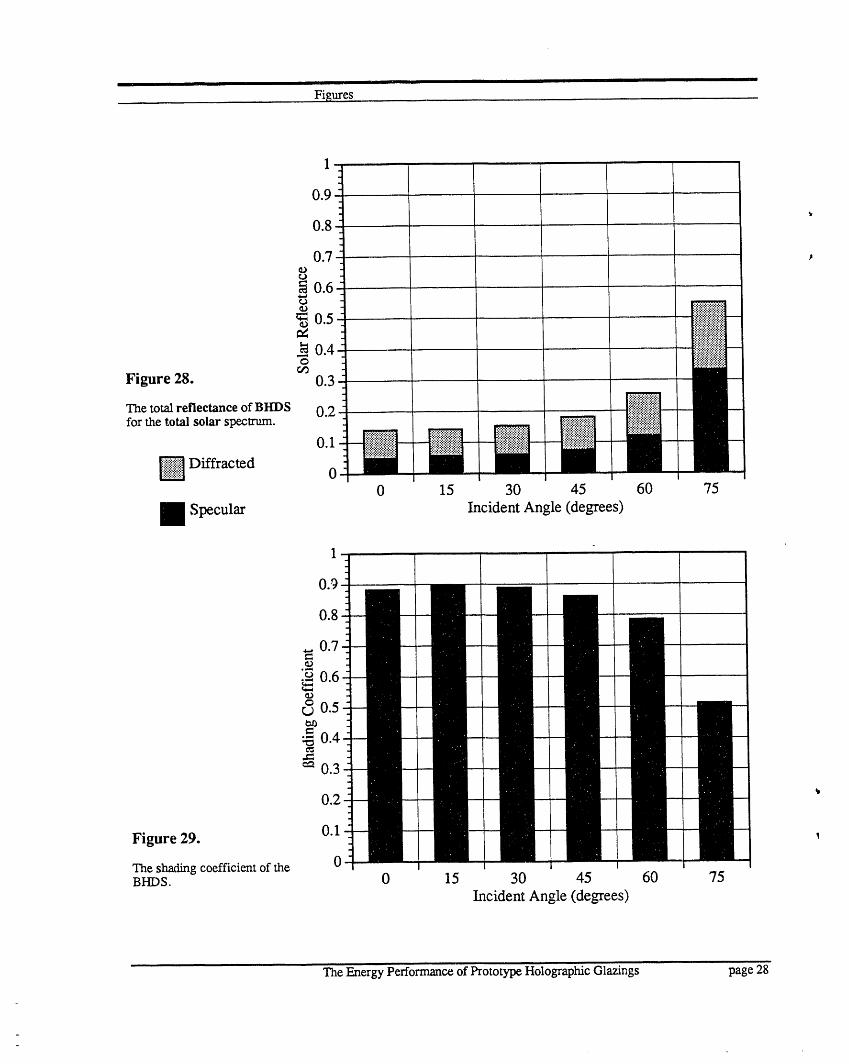
From the total spectrum transmittance (Figure 27) and reflectance(Figure 28) measurements we determined the shading coefficient ofthe BHDS for various incident angles (Figure 29), using the computerprogram WINDOW 3.1 [W&D 1989]. Due to the similarity of thethermal performance of the BHDS with clear glass, we modeled theirsolar heat gain performance following the DOE-2 algorithms.
8.0 Energy Analysis
Using the DOE-2.1D energy analysis computer program [BESG1984a, 1984b], we modeled the typical office building discussed in themethodological section in the inland Los Angeles climate. Weassumed the Title 24 recommended 1.5 W/ft 2 (16.1 W/m 2) installedlighting power density with continuous dimming controls for a desiredworkplane illuminance ef 50 fc (537.5 lux). Daylighting levels werecalculated for two reference points at 2.5 ft (0.76 m) work-plane heightfrom the floor and at depths of 12.5 ft (3.81 m) and 27.5 ft (8.38 m),controlling two independent electric lighting zones covering 42% and58% of the floor area, respectively.
We considered two fenestration designs: one representing the "basecase" with double low-E glazing of 0.33 Btu/hr/ft2/°F (1.82 W/m2/°C)U-value, 0.61 visible transmittance and 0.41 shading coefficient, andone for the application of BHDS above a low-E "view" window(Figures 1 and 2). The low-E glazing was modeled with the use of adiffuse shading device, which was deployed when the transmitted solarradiation exceeded 30 Btu/hr/ft :z(94.5 W/m2) or when the glare indexexceeded a value of 20. When the shading device was deployed, theshading coefficient was reduced by 40% and the visible transmittanceby 65%.
The luminous / thermal performance of the low-E glazing and theassociated shade control was simulated using the internal algorithms ofthe DOE-2.1 energy ,analysis program. The simulation of the BHDSperformance was performed through the development of a custom
, function called during the execution of the DOE-2 algorithms forevery hour of a whole year. This function determined the performanceof the BHDS aperture through interpolation among daylight factorsderived from analytical routines, which were based on theexperimental data fron'_the scale model measurements. Daylightfactors were determined for a large number of sun positions on a
. regular grid of 15° for solar azimuth and altitude. This techniquewhich integrates data from scale model measurements with hour-by-hour simulation algorithms is the only technique currently available toaccount for ali of the energy-related knteractions of complex glazingsover the course of an entire year.
We compared the base case low-E window (case A) to the holographiccoatings as supplied (case B) and to three other hypothetical versionsof the holographic glazings (cases C, D, E) which improved control ofsolar heat gains. These additional comparisons provide useful insights
The Energy Performance of the AERG Holographic Glazings page 9

i
EnergyAnalysis
into the energy controls that would be desired in a holographic windowsystem.
We first considered the actual BIDS sample properties, that is 1.07 U-' value (single pane glass) and 0.88 shading coefficient (case B). When
compared to a standard low-E window (case A), the results indicatethat with respect to total electric energy requirements the BHDS arebetter than the base case for the North orientation by 3 % and worse forthe East, South and West orientations by 26%, 41% and 32%,respectively (Table 1). With respect to peak electricity demand, theBHDS are worse than the base case for all orientations by 6%, 30%,36% and 32%, for North, East, South and West, respectively (Table 2).
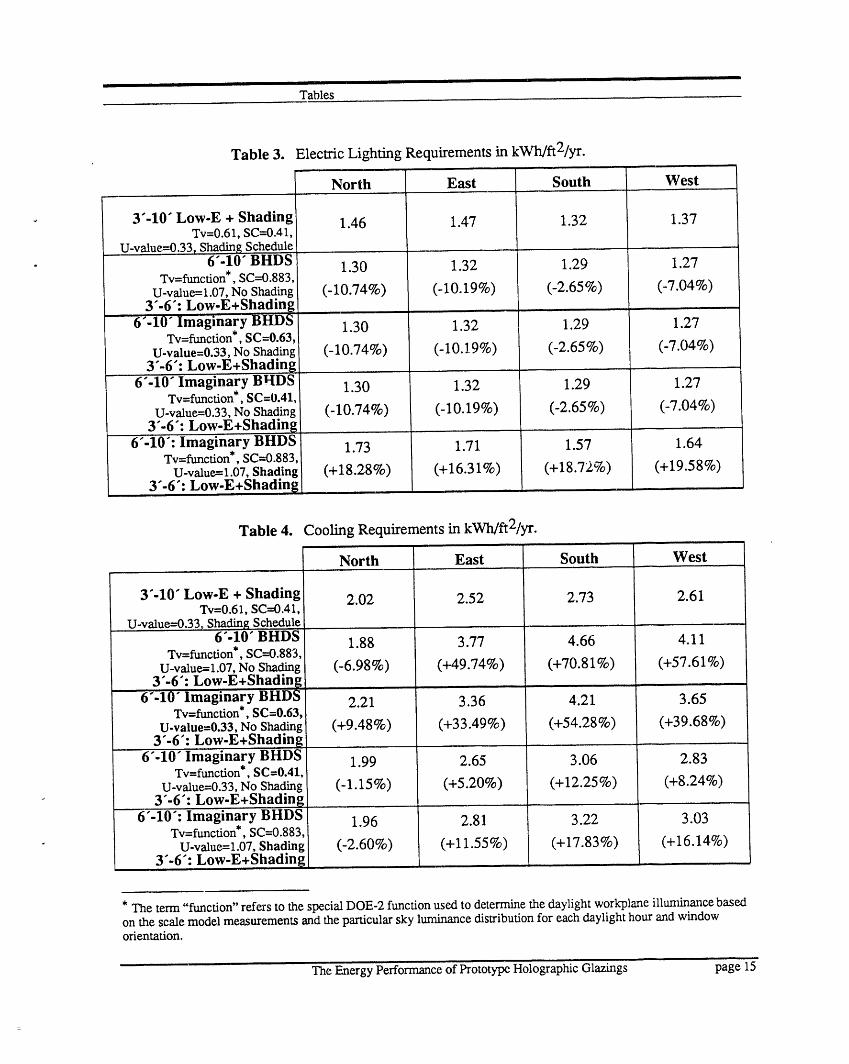
For all orientations the BHDS have lower electric lighting energy usethan the moderate transmittance (0.61) low-E glazing (Table 3).However, the cooling penalties due to solar heat gain introducedthrough the BHDS (Table 4) exceed the electric lighting savings,resulting in worse overall performance (Table 1). The betterperformance of the BHDS for the North orientation occurs because thedaylight savings exceed the smaller solar heat gain loads.
Since the thermal performance of the BHDS as supplied was the mainreason for the low performance, we considered a hypothetical BHD3window (case C) with a U-value of 0.33 (double pane glass) and amuch lower shading coefficient of 0.63, assuming the same daylightperformance as in case B. The results are better with respect to case Bbut still worse than case A for all orientations (North, East, South andWest) by 0.1%, J4%, 28% and 18% with respect to total electricenergy requirements (Table 1), and by 4%, 15%, 23% and 14% withrespect to peak electricity demand, respectively (Table 2).
Since cooling load was still a major problem, we considered a newhypothetical window (case D)with an even lower shading coefficient(0.41, equal to the low-E case), while still maintaining the originaldaylight properties as in case B. This reduction of the shadingcoefficient by 35% from case C brought the cooling loads down, nearthose (but still higher) of case A. The results with respect to case Afor total electric energy requirements are only marginally better forNorth and East orientations, by 3% and 0.5%, respectively, and worsefor South and West orientations, by 5% and 2%, respectively (Table1). With respect to peak electricity demand, they are marginally betterfor North orientation by 0.1%, and worse for all other orientations(East, South and West) by 3%, 4% and 2%, respectively (Table 2).
Case D shows that the penalties due to increased solar heat gainthrough the BttDS are not only because of the higher shading Q
coefficient but because of the lack of any solar control (shading) fordirect sunlight. However, actively controlled shading for the BHDSaperture might defeat its purpose of utilizing sunlight to illuminate theback of the room. To explore this effect, we modified case B toinclude dynamic control of sunlight through the holographic window,modeling a shading device that reduced the magnitude of the
TheEnergyPerformanceof PrototypeHolographicGlazings page 10
• ii ii illl ii i ii i
EnergyAnalysis
transmitted radiation by 65%, without affecting the distribution of thetransmitted radiation (case E). In this fmal analysis we considered ashadh_g schedule for the BHDS thatwas triggered only by solar heatgain consideration. The results of this analysis indicate that, whencompared to low-E glass, the BHDS perform worse on all orientations
• (North, East, South and West) with respect to total electric energyrequirements by 6%, 11%, 16% and 15%, respectively (Table 1). TheBHDS also perform worse with respect to peak demand for all
. orientations by 7%, 8%, 10% and 11%, respectively Table 2). Whilethe shading control reduced the cooling loads considerably (Table 4), itsignificantly reduced the daylighting benefits as well (Table 3).
9.P Conclusions and Recommendations
The results of our analyses indicate that the cfu-rent AERG bandedholographic diff, active structures (BHDS) will not save significantelectric energy or reduce peak electricity demand compared toconventional energy-efficient window systems in California officebuildings. The BHDS redirect only a small part of the transmittedradiation (approximately 16% on the average), the rest beingspecularly transmitted, as through clear glass. The BHDS thusintroduce high levels of daylight at the front of the room, where thereis already more than enz,,gh light from the conventional "view"window.
Compared to a lower transmittance (0.6 I) low-E "base case" window,the BHDS reduce annual electric lighting requirements by up to 11%on the North orientation. However, they increase annual cooling loadsby up to 71% on the South orientation. The luminous and thermalperformance of the BHDS is not significantly better than tb.at of clearglass, which cannot efficiently illuminate more than 15 ft - 20 ft (4.57m - 6.09 m) of a building's perimeter through side windows, since thesolar heat gain penalties due to solar heat gain exceed the electriclighting savings due to daylighting.
The BHDS produce significantly better "white" light than the non-banded HDS, however at an apparent penalty in diffraction efficiency.The high specular component of the transmitted radiation and theangular response at low sun angles which redirects light to the ceilingat the front of the room, both reduce the overall effectiveness of theglazing. Much better control of the solar heat gain will also berequired to provide significant annual energy savings.
I'he holographic glazings tested in this study do not show significantsavings in annual energy use or peak demand. While much technical
" progress has been made in their development over the past decade,there are still significant hurdles which must be overcome before theseprototypes can become a viable, marketable product. We group theseresearch and development needs into three areas, which are notmutually exclusive:
TheEnergyPerformanceofPrototypeHolographicGlazings page11
i iii I iii i
Conclusions and Recommendations
1. Overall Building Performance _ Windows have an impact onmany performance parameters, such as heating, cooling, lighting, peakdemand, comfort, etc. An energy-efficient window whose objective isto reduce total energy use and peak demand must satisfy these oftencontradictory requirements. Development of a marketable holographicwindow can only be successful if refinements in the optical propertiesof the coatings are driven by a detailed understanding of performancecriteria as a function of building type, orientation, latitude, climate,and time. These performance criteria with respect to holographicwindows do not currently exist.
2. Windows/Curtain "Wall"Design _ Glazing systems perform withinthe larger context of the window, as well as the building's interior.Parameters such as window width and height, ceiling height, interiorsurface reflections, etc., may greatly affect the performance ofholographic glazings. While window components, such as low-Ecoatings, gas f'fl!s,and anti reflective coatings, can be added to aholographic glazing to help control thermal gains and losses, they willincrease cost and may reduce desirable properties in other performanceareas. The integration of a holographic coating into a window andintegration of the window into the curtain wall are largely unexploredissues at this time.
3. Holographic coating design - Monochromatic laser measurementsmade by AERG on non-banded samples show 40% - 50% diffractionefficiency. White light measurements made by LBL show 35% - 40%for the sample and only 16% - 20% for the banded one, for the bestpossible incoming directions of radiation. If the banded holographiccoatings are to be developed and marketed as energy-efficient devices,their white-light diffraction efficiency must be substantially improved,over a wide range of incoming directions of radiation. Diffractionefficiency criteria may be developed for specific building applicationsusing computer simulations. However, such criteria are no currentlyavailable.
The challenge to provide an energy-efficient glazing requires thedesign and production of a coating, or array of coatings, that havegood efficiency, proper directional control over an appropriate range ofinput conditions, and good spectral control to provide a pleasinginterior lighting quality. This challenge has not yet been met.
10.0 Acknowledgments
This work was supported by the Assistant Secretary for Conservationand Renewable Energy, Office of Building Technologies, BuildingSystems and Materials Division of the U.S. Department of Energyunder Contract No'. DE-.AC03-76SF00098.
The prototype holographic diffractive structures were provided byAdvanced Environmental Research Group (AERG) with support fromCalifornia Energy Commission (CEC). We appreciate the useful
The Energy Performance of the AERG Holographic Glazings page 12
i i iii i p
Acknowledgmems
comments and guidance provided by D. Navarro and G. Simons fromCEC.
We also thank J. Klems for providing access to the scanningradiometer, J. Warner for taking the radiometric measurements,D. DiBartolomeo for automating the data acquisition procedures, andP. Fritz and A. Jackaway for constructing the _cale models.
- 11.0 References
[AERG 1992] Advanced Energy Research Group. "Holographic Test Samples."Memorandum from AERG to LBL, 2/21/92.
[Bryan 1990] Bryan, H.; King, E. "An Evaluation of a Holographic DiffractiveGlazing Material for Improved Utilization of Sunlight in Buildings."Proceedings of the 15th National Passive Solar Conference, AustinTX, March 19-22, 1990, ASES, Solar 90, pp. 181-187.
[CIE 1970] CIE. "Daylight: International recommendation for the calculation ofnatural light." In Technical Committee E-3.2 (Ed.), Paris, France:Commission Intemationale de l'Eclairage, 1970.
" [CIE 1973] CEF,. "Standardization of luminance distribution of clear skies." InTechnical Committee 4.2 (Ed.), Paris, France: CommissionIntemationale de l'Eclairage, 1973.
[BESG 1984a] Building Energy Simulation Group. "Overview of the BuildingEnergy Analysis Program." No. LBL-19735, UC-95d. LawrenceBerkeley Laboratory, Berkeley, CA, 1984.
[BESG 1984b] Building Energy Simulation Group. "DOE-2 Supplement: Version2.1." No. LBL-8706, Rev. 4, Suppl. Lawrence Berkeley Laboratory,Berkeley, CA, 1984.
[Papamichael 1987] Papamichael, K.M.; Klems, J.H.; Selkowitz, S.E. "A Large ScanningRadiometer for Characterizing Fenestration Systems." Proceedings ofthe Workshop on Optical Property Measurement Techniques,Commission of the European Communities Joint Research Center,Ispra, Italy, October 27-29, 1987.
[W&D 1988] Windows and Daylighting Group. "WINDOW 3.1: A PC Program forAnalyzing Window Thermal Performance (Program Description andTutorial)" No. LBL-25686. Lawrence Berkeley Laboratory,Berkeley, CA, 1988.
TheEnergyPerformanceof PrototypeHolographicGlazings page13

Tables
Table 1. Total Electric Energy Requirements in kWh/ft2/yr.
North East South West
3"-10" Low-E + Shading 5.29 5.740 5.81 5.74Tv=0.61, SC--0.41,
U-value=0.33, Shading Schedule
6"-10" BHDS 5.14 7.22 8.19 7.55Tv=function* SC=0.883,
U-value=1.07,No Shading (-2.89%) (+25.72%) (+41 01%) (+31.60%)3"-6": Low-E+Shading ....
6"-10" Imaginary BHDS 5.30 6.54 7.46 6.79Tv=function*, SC=0.63,
U-value=0.33, No Shading (+0.08%) (+13.92%) (+28.41%) (+18.25%)3"-6": Low-E+Shading
6"-10" Imaginary BHDS 5.12 5.72 6.12 5.86Tv=ftmction* SC=0.41,1
U-v _lue---0.33,No Shading (-3.28%) (-0.42%) (+5.38%) (+2.07%)3"-b': Low-E+Shading
6"-10": Imaginary BHDS 5.63 6.40 6.71 6.62Tv=function*, SC=0.883,
U-value=l.07,Shading (+6.46%) (+11.38%) (+15.55%) (+15.25%)3"-6": Low-E+Shading ..
Table 2. Peak Electricity Demand in W/ft 2.
North East South West
3"-10" Low-E + Shading 3.68 4.26 4.17 4.31Tr=0.61, SC---0.41,
U-value=0.33, Shading Schedule .....
6"-10" BI-IDS 3.96 5.55 5.65 5.60• i
Tv=funcuon , SC=0.883,U-value=l.07,No Shading (+6.02) (+30.35%) (+35.64%) (+30.12%)
3"-6": Low-E+Shading6"-10" Imaginary BI-IDS 3.82 4.88 5.12 4.89. *
Tv=funeuon , SC=0.63,U-value=0.33,No Shading (+3.63%) (+14.69%) (+22.78%) (+13.65%)
3"-6": Low-E+Shading ....
6"-10" Imaginary BHDS 3.68 4.38 4.33 4.40Tv=function*, SC=0.41
U-value----0.33,No Shading (-0.08%) (+2.78%) (+3.82%) (+2.13%)3"-6": Low-E+Shading .... -
6"-10": Imaginary BHDS 3.94 4.62 4.57 4.76Tv=funcuon , SC=0.883,
U-value=l.07, Shading (+6.94%) (+8.52%) (+9.76%) (+10.63%) •3"-6": Low-E+Shading
* The term "function" refers to the special DOE-2 function used to determine the daylight work'plane illuminance basedon the scale model measurements and the particular sky luminance distribution for each daylight hour and windoworientation.
The -Energy Performance of Prototype Holographic Glazings page 14
Tables
Table 3. Electric Lighting Requirements in kWh/ft2/yr.
North I East South West/
, 3"-10" Low-E + Shading 1.46 1.47 1.32 1.37Tv=0.61, SC----0.41,
U-value=0.33, Shading Schedule
• 6"-10" BHDS 1.30 1.32 1.29 1.27Tv=function*, SC=0.883,
U-value=l.07,No Shading (-10.74%) (-10.19%) (-2.65%) (-7.04%)3"-6": Low-E+Shading
6"-10" Imaginary BHDS 1.30 1.32 1.29 1.27Tv=function*, SC=0.63,
U-value=0.33,No Shading (-10.74%) (-10.19%) (-2.65%) (-7.04%)3"-6": Low-E+Shading ....
6"-10" Imaginary BrlDS 1.30 1.32 1.29 1.27Tv=function*, SC=0.41,
U-value=0.33,NoShading (-10.74%) (-10.19%) (-2.65%) (-7.04%)3"-6": Low-E+Shading
6"-10": Imaginary BHDS 1.73 1.71 1.57 1.64Tr=function*, SC=0.883,
U-value=l.07,Shading (+18.28%) (+16.31%) (+18.72%) (+19.58%)3"-6": Low-E+Shading
Table 4. Cooling Requirements in kWh/ft2/yr.
North East South West
3"-10" Low-E + Shading 2.02 2.52 2.73 2.61Tv=0.61, SC=0.41,
U-value--0.33_ Sh_dLngSchedule
6"-10" BHDS 1.88 3.77 4.66 4.11•Tv=funcuon , SC=0.883,
U-value=l.07,No Shading (-6.98%) (+49.74%) (+70.81%) (+57.61%)3"-6": Low-E+Shadin_
6"-10" Imaginary BHDS 2.21 3.36 4.21 3.65Tv=function*, SC=0.63,
U.value=0.33,No Shading (+9.48%) (+33.49%) (+54.28%) (+39.68%)3"-6": Low-E+Shading
6"-10" Imaginary BHDS 1.99 2.65 3.06 2.83Tv=function*, SC=0.41,
U-value=0.33, No Shading (-1.15%) (+5.20%) (+12.25%) (+8.24%)3"-6": Low-E+Shading
6"-10": Imaginary BHDS 1.96 2.81 3.22 3.03Tv=function*, SC=0.883,
U-value=l.07, Shadin _,I (-2.60%) (+11.55%) (+17.83%) (+16.14%)3"-6": Low-E+Shadin ;i ....
* The term "function" refers to the special DOE-2 function used to determine the daylight workplane illurxfinmacebasedon the scale model measurements and the particular sky luminance distribution for each daylight hour and windoworientation.
The Energy Performance of Prototype Holographic Glazings page 15

ii i i! i
Figures
10" .
I
>Figure 1.
The window configuration
considered as the BNDS _ _.:.r-'._-:.r.'-:.-'..:.:._.:q.-'.:._.:.r-'..--.:..:.'-.--.:..:.'+rq-:.z-:._
application. -,::,:_:iiiiii_i:iiii:il:il::ii!iiiiii:ii_i:i_:::ili::i:_i_!iiiiiii!i!ii_iii:ii!_i::iiiiii_i!iiifilliiiii_i_!ii_iiii
_ holographic glazing --J---
double low-E glazing -'J"- . ._.
[ 20" 11
?10"
Figure 2. _/_
considered as the "base case."
_ double low-E glazing _ '_
3"
"_ ii i
20" 1I
The Energy Performance of Prototype Holographic Glazings page 16

.................................................. . .... .,,- ...................
Figures
Figure 3.
Photograpt_ of a laser beamtransn_itted through BHDS for 15°incident m_gle.
Figure 4.
Photograph of a laser beantransmitted through BHDS for 6110incident aagle.
The Energy Pcrfornm.nce of Prototype Holographic Glazings page 17

ii i ii i i ii i
Figures
Figure 5.
Front view of the scanningradiometer with the scale modelused for the directional workplaneilluminance measurernents.
• Figure 6.
Rear view of the scanningradiometer with the scale model
used for the directional workplaneilluminance measurements.
The Energy Performance of Prototype Holographic Glazings page 18
Figures
Figure 7.
The workplane reference pointsconsidered for the directionalwork-plane illuminancemeasurements. -1 3o" tl
165 180 195
150 210
135 225
120
105 255
75 285
Figure 8.O0
.. Projection of the window-facing
hemisphere, showing the incoming 4' 12directions considered for thedirectional workplane illuminance
' measurements, in zeta (0°-360°), 30
theta (00-90°) coordinates. 15 0 / 360 345
The Energy Performance of Prototype Holographic Glazings page 19

i
Figures
I0"
_,_.__._.+_._._.:._.jFigure 9. 6" -_ 8" --_-
/
The 4"x 8" aperture considered for /the clear glass, BHDS and -1--BHDS-2 measurements.
I 20"
iiii
: 10im
+4"
Figure 10.
The 4"x 20" aperture considered |for the clear glass and BHDS +measurements.
I 20"
The Energy Performance of Prototype Holographic Glazings page 20
i! i
Figures
- 0.25 ,.
o,,l.4 .711J L e" ° I H'"°'_
0.1 J
Figure 11. 1 ., , 5 ._
Directional work-plane illuminance "_ 0. _ _ i ,.,,.-0coefficients for 4' x 8' aperture of rf, _"" _ _ **'_
clear glass at 17.5' fromwindOWwall. _"_--.o._So° _'-__ .. _ "_
_ j4 / " ._. , .' , "" 4. " .. 0.25 -.
_/_ _4_ ..4---.-" --- ._
I o.o5 "
Directional workplane illuminance _ _" -,_ ._-_ ,. _ _ _"
coefficients for 4' x 8' aperture of . _ .<_.¢,.,::_._.__-¢'_---_BI-IDS at 17.5' from window wall. "_-_,_., _o._
/I
/ - . ['-o._
,
Lr3
Figure 13. 1 "_, ,, _ _ _
Directional workplane illuminance "_ o .-,.'-- ._
coefficients for4' x8' aperture of rf, _ _" _'_",..<>_r._:'_,_BI-IDS-2 at 17.5' from window
The Energy Performance of Prototype Holographic Glazings page 21

II I|1 I IIII I I I I II
Figures
0.18 - i .; _ ] "
rigure14o _0.12 --- i li " - i[ *
0.1 ............ • ....
Directional workplane illuminance .=_ ii icoefficients for 4' x 20' aperture _ 0.08 - _ .... i --
)m Iof clear glass and BHDS at 27.5' _ I ifrom window wall for incoming "N 0.06 " ....directions on a plane normal to the =o " _window (180 ° zeta angle). .= •o 0.q4 _-_.................. .e..................
•-- ! _0.02- i i
: )clear glass O" i!)!ii_ _ i -'_ := i
BHDS 0 15 30 45 60 75 90Incident Angle (deg)
o_ ._ . . ._
Figure 15. .a, ,,,-- _ ;
Directional workplane illuminance _ _ ___ g _,coefficients for 4' x 20' aperture _ a ..of clear glass at 27.5' from _ _"<-<.. _m _ i_, ,,_ .,._window wail.
." .
I 0.0__ , .;, ,L,IIro.o_._. ,Figure 16.
Directional workplane illuminance _ _'_ _ _-'_ "-'_"coefficients for 4' x 20' aperture "_"_"_-_,Z,_, _" ! "_ _"_""_ofBI-IDS at 27.5' from window "_'_ _ "_"wall.
The Energy Performance of Prototype Holographic Glazings page 22

,ro,me ---I lBl III ii ..... i i ...........
Figures
: ,.:5,
'5-.
Figure 17.
Scale model photograph of theluminance distribution for the 4"x8" HDS aperture with sun at 18(1°zeta and 70° theta coordinates (seeFigure 8).
: Figure 18.
Scale model photograph of the, luminance distribution for the 4"x
8" BHDS aperture with sun at180 ° zeta and 70° thetacoordinates (see Figure 8).
The Energy Performance of Prototype Holographic Glazings page 23
i n
Figures
(see reducedplot below)
Figure 19. - 600500g
O
Workplane illuminance : 400distribution for the CIE clear sky : =through South-facing 4"x 8" clear . 300 "_glass, BI-IDS and BttDS-2 200 _-apertures at 12:00 Noon on June _21 for the San Francisco climate, i:. 100 "_
_ I 0 _
2.5' 7.5' 12.5' 17.5' 22.5' 27.5'
... _11_
2-$" 7.5' 12.5" 17.5' 22.5' 27.5'l_mla_ ¢-,,- wia&_
Figure 20.(see reducedplot belew)
Workplane illuminance II 2500distribution for the CIE clear sky 2000 _"through South-facing 4"x 8" clear 8glass, BHDS and BHDS-2 1500apertures at 12:00 Noon on "_December 21 for the San 1000 =Francisco climate.
500 ._e-
o
[]nntm ml •[]..-I. ..... _o_-_2.$' 7S 12.5" 17.$ _2.,,5' 27.5'
12utlm t-am wiadU_w
Figure 21.
Workplane illuminancedistribution for the CIE overcastsky through 4"x 8"clear glass,BHDS and BHDS-2 apertures at 3500
12:00 Noon on June 21 for the i L "_.. San Francisco climate. - _000: _.500
e",
1500 =
500_,_ __ 2.5' 7.5' 12.5' 17.5' 22.5' 27.5'Distance from window
The Energy Performance of Prototype Holographic Glazings page 24
I III
Figures
(seereduced below)10009OO _
Figure 22. 800700 o
Work-plane illuminance 600500 "_distribution for the CIE clear sky 400 =
, through South-facing 4"x 20" clear 300 "_glass and BHDS apertures at _ 200 -_12:00 Noon on June 21 for the 100 "_
San Francisco climate. 1 0 -2.5' 7.5' 12.5' 17.5' 22.5' 27.5'
Distancefromwindow
_ , {
0.9. I
0.8
_=0.7 _ !.= 0.6E
Figure 23. = 0.5t_
The total, specular and diffracted [" 0.4transmittance of BHDS for the ._visible spectrum. ._,
> 0.3
Diffracted 0.20.1
Specular, 0
0 15 30 45 60 75Incident Angle (degrees)
The Energy Performance of Prototype Holographic Glazings page 25
iiii
Figures
50 .................................._................._.................f...................................................................................• , , ,
45 49.3,%transrrdttedspe_arly _ ................._...............
40 ....................................................................................................................................................
-.35 ......................................................................................................................................................
30 ................................................................................................•................•................•................,,
e_-- 25
" i;;i ii_, 20 • ..
15 . •
Figure 24. • 10 :
The bi-directional visible 5transmittance of the BHDS for30°incident angle of incoming 0radiation (maximum diffraction). -90 -70 -50 -30 -10 10 30 50 70 90
Outgoing Angle (deg)
_
0.9
0.8
._0.6 iEo'1
0.5[-,
Figure 25. _ 0.4
The total, specular and diffracted ._transmittanceof HDS for the _ 0.3visible spectrum.
0.2
Diffracted 0.1
0Specular 0 15 30 45 60 75
Incident Angle (degrees)
Thf,Energy Performanceof Prototype Holographic Glazings page 26

i ,'-..- i ,: i
Figures
0 _ ................................. _................................................................... • ............... _ ............... _ ............... .
45 .........................................................................................................................................................
, 40 .......................................................................................................................................................
_-_ 35 ........................................................................................................................................................
30 ..........................................................................................................................................................
28.8% transmitted speeularly
t--,_=20"15 iiiiiiiiiiiiiiiiiiiiiiiiii!iiiiiiiiiiiiiiiiiiiiiiiiiiiiiiiiiiiiiiiiiiiiilliii i ; iiiiiiiiiiiiiiiiii[ _37.1%i!!iiiiiii ii!ic][f-fractedabove -28 !!ii!!!deg"iiiiiiiiiiiiiiiiiiiiiiiiill
Figure 26. 10
The bi-directional visible 5transmittance of the lIDS for 30°incident angle of incoming 0 ! cradiation(maximumdiffraction). -90 -70 -50 -30 -10 10 30 50 70 90
Outgoing Angle (deg)
1
0.9
0.8
0.7 _ _
._06EO2
0.5[..,
0.a-Figure 27. o
o_ 0.3The total transmittance of BtfDS
for the total solar spectrum. 0.2-¢
0.1
, _ Diffracted0
Specular 0 15 30 45 60 75Incident Angle (degrees)
The Energy Performance of Prototype Holographic Glazings page 27
ilill
Figm'es
u
0.9
0.8
0.7oo
0.6
0.5
0.4 _i_iilii"Er,¢]
Figure 28. 0.3 L
The total reflectance of BH:DS 0.2-for the total solar spectrum.
0.1
_ Diffracted 00 15 30 45 60 75
Specular Incident Angle (degrees)
1
0.9
0.8
,., 0.7
o 0.6
or..)0.5t:xt)
•- 0.4
_ 0.3
0.2
Figure 29. 0.1
The shading coefficient of the 0BHDS. 0 15 30 45 60 75
Incident Angle (degrees)
The Energy Performance of Prototype Holographic Glazings page 28

