the energy report– indiaawsassets.wwfindia.org/downloads/the_energy_report_india.pdf · able to...
TRANSCRIPT
THE ENERGY REPORT– INDIA100% RENEWABLE ENERGY BY 2050

Published by WWF- India
Any reproduction in full or part of this publication must mention the title and credit the above mentioned copyright owners.
Project Team:
TERI
Project advisors/reviewers: Mr. Sunil Dhingra, Dr. Ritu Mathur, Mr. K. Ramanathan, Dr. Leena Srivastava
Project team: Mr. Saptarshi Das (Principal Investigator), Dr. Atul Kumar, Ms. Ilika Mohan, Ms. Aditi Arora, Mr. Alok Kumar Jindal, Mr. Lovedeep Mann
Secretarial assistance: Ms. Nisha Khanna
WWF
WWF- India: Dr. Sejal Worah, Dr. T. S. Panwar
WWF- International: Dr. Stephan Singer, Mr. Rafael Senga
WWF- US: Mr. Brad Schallert, Ms. Keya Chatterjee
Disclaimer
This report has been prepared by TERI, with inputs from WWF. Information contained in this publication is reliable and deemed correct to the knowledge of TERI. However, TERI has not independently verifi ed the information gathered or contained in this report and, accordingly expressed no opinions or makes any representations concerning its accuracy or complete reliability or suffi ciency. The recipients should carry out their own due diligence in respect of TERI inputs in the report. WWF-India and TERI disclaims any and all liability for, or based on or relating to any such information and/or contained in, or errors in or omissions from, their inputs or information in this report.
Designed by:
Aspire Design | www.aspiredesign.inCover Image: morguefi le / Kevin_P
© WWF-India and The Energy and Resources Institute 2013

THE ENERGY REPORT– INDIA 100% RENEWABLE ENERGY BY 2050


iii
CONT
ENTS
Foreword
Ravi Singh, Secretary General & CEO, WWF− India v
R K Pachauri, Director- General, TERI vii
Abbreviations ix
List of Figures and Tables xi
Executive Summary xiii
1. Introduction 1
1.1 Background 1
1.2 Objective 3
2. Approach and Methodology 5
2.1 Description of Modelling Framework 6
3. Scenario Description 9
3.1 Reference Energy Scenario 9
3.2 100% Renewable Energy Scenario 10
4. Energy Demand Sectors 11
4.1 Drivers 11
4.2 Energy End-Use Sectors 11
4.2.1 Transport Sector 11
4.2.2 Industry Sector 12
4.2.3 Residential Sector 13
4.2.4 Commercial Sector 14
4.2.5 Agriculture Sector 14
5. Energy Supply Sources 17
5.1 Conventional Energy 17
5.1.1 Coal 17
5.1.2 Oil 18
5.1.3 Natural Gas 19
5.1.4 Nuclear Power 20
5.2 Renewable Energy 21
5.2.1 Solar Energy 21
5.2.2 Wind Energy 26
5.2.3 Hydropower 32
5.2.4 Ocean Energy 35
5.2.5 Geothermal Energy 38
5.2.6 Waste-To-Energy 42
5.2.7 Biomass 45
6. Model Results and Analysis 53
6.1 Final Energy Demand 53
6.1.1 Transport Sector 55
6.1.2 Industry Sector 56
6.1.3 Residential Sector 58
6.1.4 Commercial Sector 60
6.1.5 Agriculture Sector 61

iv
THE ENERGY REPORT– INDIA 100% RENEWABLE ENERGY BY 2050
6.2 Energy Supply 62
6.2.1 Reference Energy Scenario 62
6.2.2 100% Renewable Energy Scenario 65
6.2.3 Scenario Comparison 69
6.3 Co2 Emissions 71
6.4 Investments 72
6.5 Barriers and Policies 72
7. Conclusion 75
References 77
Appendices 83
A.1 Government Plans For Renewable-Based Capacity Addition 83
A.2 Scenario Assumptions For Renewable Energy Deployment 84
A.3 Renewable Technology Costs 86
A.4 Fuel Prices 86
A.5 Primary Commercial Energy Supply 87
A.6 Sectoral Demand, By Fuel 88

v
FOREWORDClimate change is today recognized as one of the biggest threats to humanity and nature. Our dependence on fossil-based fuels is the most signifi cant contributor to climate change; thus addressing the energy issue is fundamental to tackling climate change. Renewable energy provides a potential way forward in reducing emissions while meeting future energy needs of both developed and developing countries.
In 2011, WWF-International published “The Energy Report - 100% renewable energy by 2050” showing a pathway by which the world’s energy needs could be provided cleanly, renewably and economically by 2050. Based on a detailed analysis, it demonstrated that by 2050, power, transport, industrial and domestic energy needs could be met with only small residual uses of fossil fuels – vastly reducing concerns over energy security, environmental pollution and climate change. It also helped to identify challenges and the choices we need to make to get on this pathway.
The Energy Report of 2011 pointed to the technical potential and long term economic viability of a renewable energy based future at the global level. We believed that there was need for a similar exercise to be undertaken for India. In this report, WWF-India, in partnership with TERI, looks at the feasibility of a near 100% renewable energy future by 2050 at the national level.
Given the problem of energy access in India where more than 300 million people do not have access to electricity, renewable energy sources provide a unique opportunity to shift to cleaner sources at the decentralized level. Also, considering the increasing trend of urbanization in India, building and transport sectors are of high relevance as well in terms of energy effi ciency and tapping of energy from renewable sources. In order to avoid the long term energy infrastructure lock-in, action is needed now for a transition from fossil fuel based power to renewable energy.
While the government has taken certain measures for the promotion of renewables, these need to be scaled up and expedited. Besides the government, other stakeholders including the industry as well as citizens need to play a proactive role. “Renewables as the new normal” should be something that we should all strive for. This report is a step forward in that direction. We are optimistic that such energy sector initiatives would eventually lead to signifi cant benefi ts both in terms of energy access and in the conservation of the country’s biodiversity and, major ecosystems.
Ravi SinghSecretary General and CEOWWF-India


vii
FOREWORD
Globally, renewables are being viewed increasingly as a means for providing millions of people with a better quality of life. It is also recognized that a higher share of renewable energy in the global energy supply mix can have a signifi cant impact on future energy trends, social inclusion, environmental as well as health benefi ts. Several countries around the world have made commendable progress in moving ahead with renewable choices, and demonstrated the benefi ts that renewables provide in terms of their potential for job creation and emissions reduction apart from the primary role of energy provisioning.
Developing countries like India, where nearly 300 million people do not have access to electricity and modern energy forms, undoubtedly need enhanced supply of energy to advance their social and economic development, but the key challenge lies in being able to do so in a clean and sustainable manner. The need for diversifying towards alternative energy choices is increasingly being recognized as inevitable, particularly to enhance energy security, given the uncertainties and constraints associated with conventional fuels and technologies. Rapid deployment of renewables together with improvements in energy effi ciency can contribute to much higher levels of energy security while generating signifi cant employment opportunities and simultaneously ensuring lower levels of air pollution with attendant health benefi ts.
India has also been taking steps towards development of renewable energy. According to the Ministry of New and Renewable Energy, solar is an attractive form of renewable energy from both the perspective of climate change mitigation and energy security. The Jawaharlal Nehru National Solar Mission is a major initiative of the Government of India and State Governments, which seeks to promote ecologically sustainable growth while addressing India's energy security challenge. This programme has been accorded the highest importance within the 8 Missions of the National Action Plan on Climate Change. Further, with India’s increasing dependence on energy imports, there is growing interest in understanding the role that renewables can play in meeting future energy needs.
WWF has already conducted a study at the global level to visualize a 100% Renewable energy based world. Following this, WWF International launched the ‘Seize your power’ campaign on World Environment Day, 2013. The campaign seeks public commitments from governments and international fi nancial institutions to make new investments of USD 40 billion beyond business-as-usual in the renewable energy sector.
TERI being a leading institute that focuses on fi nding solutions towards sustainable development, has conducted this study on “100% Renewable Energy by 2050” for India, to examine the potential role that renewables could play in the Indian context and assess the challenges in moving towards such a scenario.

viii
THE ENERGY REPORT– INDIA 100% RENEWABLE ENERGY BY 2050
While the 100% Renewable Scenario as developed in this study, can at best be seen as a theoretical possibility within the modelling timeframe, it helps to visualize the implications of moving towards a high renewable scenario, and makes clear the extent and nature of challenges associated with a move in this direction.
TERI has used an integrated energy sector model to develop a scenario that refl ects an extremely ambitious move towards deployment of renewable resources and technologies across the economy as against a reference scenario where the reliance on fossil fuels continues to remain high despite policies to increase the deployment of renewables.
In terms of the scale of transformation required, the study brings out the need to undertake massive changes -both in policies and technologies as well as lifestyle related, in order to implement a near 100% renewable energy use scenario in India by 2050. Also, given the magnitude of scale-up required, signifi cant efforts would necessarily need to be taken in the immediate future, to ensure that alternative technologies are mature and commercially viable in the medium to long-term. The alternative growth path would need to include several interventions including a high penetration of solar thermal technologies for industrial heating, and exploitation of not only the more popular renewables like wind, solar and hydro but also those less discussed like geothermal, tidal and waste to energy. In case of some end-uses such as cooking, where fossil based energy choices such as LPG (or piped gas) are likely to remain preferred solutions, the 100% renewable scenario calls for lifestyle/behavioural changes on the demand side along with the supply side changes with regard to the energy mix and technologies. Additionally, the study indicates that energy effi ciency has a key role to play in reducing the magnitude of fi nal energy demand in an economy undergoing rapid urbanization and development.
The country however faces several challenges in moving towards such an ideal world, requiring immense efforts from researchers, developers, investors and policy makers alike. It also calls for several transformational changes undertaken across sectors with a sense of urgency. These include not only the timely availability of alternative commercially viable technological solutions across sectors, but also a rapid scaling-up of these options together with accelerated build-up of supporting infrastructure, appropriate skill-sets, regulatory and institutional frameworks, and adequate renewable manufacturing capacities.
While the challenges are huge and varied, I hope that this study would be viewed as one that provides useful insights to a range of stakeholders about the direction and scale of change that would need to be undertaken if we were to maximize the use of renewables in our future energy mix, the limits to each of the fuel options, the comparative ease of renewable penetration across various sectors, and a broad scale of the implications of such a move in terms of investment requirements, resource requirements, the acceleration required in the rate of adoption of each of the renewable forms, and the requisite infrastructural, policy and regulatory changes that would be essential.
R K PachauriDirector- GeneralTERI

ix
ATF Aviation Turbine Fuel
BCM Billion Cubic Metre
Bio-SG Biosynthetic Gas
BIS Bureau of Indian Standards
BtL Biomass-To-Liquids
CAGR Compound Annual Growth Rate
CEA Central Electricity Authority
CFL Compact Fluorescent Lamp
CHP Combined Heat and Power
CNG Compressed Natural Gas
C-Si Crystalline Silicon
CSP Concentrating Solar Power
CST Concentrated Solar Thermal
CTL Coal-To-Liquids
C-WET Centre For Wind Energy Technology
EGS Enhanced Geothermal Systems
ETSAP Energy Technology Systems Analysis Programme
GDP Gross Domestic Product
GHG Greenhouse Gas
GIS Geographic Information System
GTL Gas-To-Liquids
GW Gigawatt
HAWT Horizontal Axis Wind Turbine
HCV Heavy Commercial Vehicle
HVO Hydro-Treated Vegetable Oil
IEA International Energy Agency
IRENA International Renewable Energy Agency
JNNSM Jawaharlal Nehru National Solar Mission
LBNL Lawrence Berkeley National Laboratory
LCOE Levelized Cost of Electricity
LCVs Light Commercial Vehicles
LNG Liquefi ed Natural Gas
LPG Liquefi ed Petroleum Gas
LULUCF Land Use, Land Use Change and Forestry
MARKAL Market Allocation
MNRE Ministry of New and Renewable Energy
MoEF Ministry of Environment and Forests
MSW Municipal Solid Wastes
ABBREVIATIONS

x
THE ENERGY REPORT– INDIA 100% RENEWABLE ENERGY BY 2050
MT Million Tonne
Mtoe Million Tonnes of Oil Equivalent
NBMMP National Biogas and Manure Management Programme
NREL National Renewable Energy Laboratory
O&M Operation and Maintenance
OTEC Ocean Thermal Energy Conversion
PFI Population Foundation of India
PT Parabolic Trough
PV Photo Voltaic
R&D Research and Development
RD&D Research, Development and Demonstration
RDF Refuse-Derived Fuel
REN 100% Renewable Energy Scenario
REF Reference Energy Scenario
RETS Renewable Energy Technologies
SD Solar Dish
SHP Small Hydropower
SPV Solar Photo Voltaic
ST Solar Tower
TERI The Energy and Resources Institute
TF Thin Films
TOE Tonne Oil Equivalent
UNDP United Nations Development Programme
UTs Union Territories
VAWT Vertical Axis Wind Turbine
W2E Waste-To-Energy

xi
LIST OF FIGURES AND TABLES
FIGURES
Figure 1: MARKAL framework overview 7
Figure 2: Model logic 8
Figure 3: Coal imports and production 17
Figure 4: Production and net imports of crude oil and petroleum products 18
Figure 5: Natural gas production and imports 19
Figure 6: Solar map of India 21
Figure 7: Wind density map for India 26
Figure 8: Large hydro: assessed and developed installed capacity (in MW) 32
Figure 9: Geothermal provinces in India 39
Figure 10: Technological options for biomass energy 46
Figure 11: Total fi nal energy demand (including biomass) 51
Figure 12: Final energy demand by end-use sectors in 2051 52
Figure 13: Transport sector: Final energy demand across scenarios 52
Figure 14: Transport sector: energy demand across scenarios, by fuel 53
Figure 15: Industry sector: fi nal energy demand across scenarios 54
Figure 16: Industry sector: energy demand across scenarios, by fuel 55
Figure 17: Residential sector: fi nal energy demand across scenarios (including biomass) 56
Figure 18: Residential sector: energy demand across scenarios, by fuel 57
Figure 19: Commercial sector: fi nal energy demand across scenarios 58
Figure 20: Commercial sector: energy demand across scenarios, by fuel 58
Figure 21: Agriculture sector: total fi nal energy demand across scenarios 59
Figure 22: Agriculture sector: energy demand across scenarios, by fuel 60
Figure 23: Primary commercial energy supply in REF scenario 61
Figure 24: Share of fuels in primary commercial energy supply in REF scenario 61
Figure 25: Resource-wise electricity generation in REF scenario 62
Figure 26: Resource-wise electricity generation capacity in REF scenario 62
Figure 27: Primary commercial energy supply in REN scenario 64

xii
THE ENERGY REPORT– INDIA 100% RENEWABLE ENERGY BY 2050
Figure 28: Share of fuels in primary commercial energy supply in REN scenario 65
Figure 29: Resource-wise electricity generation in REN scenario 65
Figure 30: Resource-wise electricity generation capacity in REN scenario 66
Figure 31: Primary commercial energy supply and shares across scenarios 67
Figure 32: Comparison of electricity generation and generation capacity across
scenarios 68
Figure 33: Production and net imports of fuels 69
Figure 34: CO2 emissions across scenarios 69
TABLESTable 1: State-wise wind energy potentials 27
Table 2: Onshore potential of wind power in India 28
Table 3: Turbine development trend 29
Table 4: Current use of agri-residue (in million tonnes) 45
Table 5: Performance and cost of cook stoves 47

xiii
EXECUTIVE SUMMARY
This study examines the possibility of a 100% Renewable Energy Scenario for India by 2051. Two scenarios are developed for this purpose; the Reference Energy Scenario (REF) is compared with the Renewable Energy Scenario (REN) with the intent of examining what changes would be required to move toward a 100 per cent (or near-100 per cent) renewable scenario, and whether the country is likely to have the adequate technical potential for moving toward such a transformational change in its energy mix. The REF scenario considers only current trends and policies, and projects these into the future as determinants of energy demand and supply. This scenario includes all current forms of energy – fossil-based, nuclear and renewable – while in the REN scenario, fossil fuels and nuclear-based technologies are phased out and replaced, wherever possible, with renewable options. No new capacity additions of fossil fuel or nuclear-based technologies are considered, except for the ones that are already under construction. Moreover, aggressive effi ciency improvements are envisaged in the REN scenario across the entire energy system.
The study suggests that a sustainable, renewable-energy-based economy could theoretically be achieved, where as much as 90 per cent of India’s total primary energy supply could technically be based on renewable sources. The remaining 10 per cent would still need to be fuelled by fossil-based sources that are required as feedstock and where a substitution by renewable energy forms is not possible.
In the REF scenario, the economy is likely to remain based primarily on coal, oil and gas. In the REN scenario, solar, wind and hydro are considered to be the main fuels for electricity generation, while second-generation and algal biofuels contribute to meet demands of the transport sector.
Some of the key observations from this study are highlighted below.
Aggressive effi ciency improvements across the energy demand and supply sides bring in large savings – of the order of 59 per cent – by 2051.
On the supply side, fossil-based plants and technologies need to be phased out in the REN scenario much before the end of their economic lifetime (against the current situation, where old and ineffi cient plants continue to operate beyond their economic life to meet shortfalls in demand and supply). All renewable energy forms including solar, wind, geothermal and ocean tidal energy resources need to be pushed to their technical limits to achieve a move toward a 100% REN scenario.
Biofuels would need to play a key role by 2051; they would have to account for 330 Mtoe and meet 90 per cent of the transport fuel requirement in order to move toward the REN scenario.

xiv
THE ENERGY REPORT– INDIA 100% RENEWABLE ENERGY BY 2050
Around 10 per cent of the fuel mix would need to be meet by fossil fuels for niche uses such as feedstock in industry, for which there is currently no replacement.
Concentrated solar thermal technologies (that are still in the R&D phase) would need to play a key role in meeting electricity needs as well as the thermal demand in industries (and also to fulfi ll the heat requirement for temperatures below 700°C).
Energy requirements for cooking would need to shift towards electric cooking in urban areas and improved cookstoves in rural areas, irrespective of individual preferences and lifestyle choices of the households.
The import dependency of coal and oil rise in the future for both scenarios. However, while in the REF scenario this is because the domestic production is unable to keep pace with the demand, in the REN scenario this is because the requirement of these fuels is so low that all domestic production is stopped and the small requirement is entirely imported. Only gas production continues into the future as it has a comparably higher use, and the import dependency drops from 21 per cent in 2011 to 13 per cent in 2051.
The cumulative CO2 emissions in the REN scenario are about one-third of those in the REF scenario.
The total undiscounted technology investment cost for the REN scenario is 42 per cent higher than in the REF scenario, requiring an additional investment of INR 544 trillion between 2011 and 2051. This level accounts for around 4 per cent of the cumulative GDP during this period. The total undiscounted system costs in the REN scenario are only 10 per cent higher than those in the REF scenario. This, however, includes only technology-level substitutions and does not entail costs that may need to be incurred for supporting infrastructure, R&D or improvements in regulatory and institutional set-ups.
The REN scenario is clearly desirable from an environmental as well as an energy-security perspective. But achieving such a scenario poses considerable challenges at this point in time and would require several transformational changes, in all sectors, to be undertaken with a sense of urgency. These include not only the timely availability of alternative commercially viable technological solutions across sectors, but also a rapid scaling-up of these options, together with accelerated building-up of supporting infrastructure, appropriate skill-sets, regulatory and institutional frameworks and adequate renewable manufacturing capacities.
Under the REN scenario, all industrial heating requirements up to 700°C are met through concentrated solar thermal (CST) technologies by 2051. This implies that apart from its wide spread application in electricity generation, CST technologies for thermal applications need to be commercially viable even for small to medium manufacturers by 2031 in order to gain popularity and become the prevalent option in the next two decades.
Energy requirements in the transport sector are expected to increase rapidly, and a large part of this demand is expected to be met through third-generation biofuels. This technology is still in the R&D phase. In order for it to be available as a major fuel option by 2051, as in the REN scenario, this technology would have to become commercially viable within the next two decades.

xv
The REN scenario considers installation of 170 GW of offshore wind capacity by 2051, with its initiation in 2031. At present, there is no estimate of offshore wind potential for India. Accordingly, this implies that within the next two decades, the offshore wind potential would be assessed in detail, comprehensive techno-economic analyses would be conducted and commercial deployment would be successfully initiated.
The REN scenario envisages that rural households meet their cooking needs completely through improved cookstoves, while urban households switch to electricity-based cooking. This implies that it would be possible to shift cooking practices to an alternative development path, away from the current mandate of encouraging a higher penetration of LPG.
Given the large share of renewables in the electricity mix, apart from development of storage technology, improved grid integration and load management systems would be required, with immediate effect.
The REN scenario involves the introduction of technologies, most of which are currently in the R&D phase, by 2031. Therefore, transformational technological and policy shifts would need to be effected with a sense of urgency if India has to realize such a scenario by 2051.
EXECUTIVE SUMMARY

xvi
THE ENERGY REPORT– INDIA 100% RENEWABLE ENERGY BY 2050
IN 2010, FOSSIL FUELS ACCOUNTED FOR
74% OF THE TOTAL ENERGY CONSUMED IN INDIA

1
1. INTRODUCTION1.1 BACKGROUND
Over the past four decades, India’s total primary energy demand has grown over four fold, from 160 Mtoe in 1971 to 691 Mtoe in 2010 (IEA 2012b). With an increasing population and a GDP that is expected to grow at 8 per cent per annum, the energy demand of India can only be seen to expand in the future. Moreover, being a developing country, with 27 per cent of its population below the poverty line, access is yet another important issue that requires attention (Planning Commission 2009).
India continues to rely heavily on fossil fuels. The country accounted for 8 per cent of the world’s coal consumption and ranked as the third-largest consumer of coal in the world after China and the USA in 2010. Oil and gas are the most important fuels after coal. India was the fourth-largest consumer of oil in the world in 2010 after the USA, China and Japan; it accounted for 3.9 per cent of the world’s oil consumption. In 2010, fossil fuels accounted for 74 per cent of the total energy consumed in India. The shares of coal and petroleum products in the total fi nal energy mix increased from 18 per cent and 12 per cent, respectively, in 1971 to 42.4 per cent and 24 per cent, respectively, in 2010 (IEA 2012b).
Given the size of India, the total energy consumption in the country is high. However, the per capita consumption is very low—around 0.59 toe in 2010, and this has not changed much since then. Similarly in the case of energy-related CO2 emissions, India’s emissions in 2010 amounted to 1.6 Gt CO2 and have been steeply rising in the past years, making the country the world’s third largest emitter. However, its per capita emission of 1.4 t CO2 is still much lower than that of China, OECD (Organisation for Economic Co-operation and Development) countries or the world average (IEA 2012b).
The economic growth of any country is closely related to the growth of its energy consumption. This relationship is critically important for developing countries like India, where the economy is growing rapidly. Simultaneously,

2
THE ENERGY REPORT– INDIA 100% RENEWABLE ENERGY BY 2050
providing adequate and equitable access to basic amenities and services must be the immediate priority of policymakers. Energy access for all is generally recognized as a policy priority because it is accepted that this factor has a strong impact on creating opportunities for economic development and generating decent livelihoods for the poor. Without access to basic energy services, daily needs like cooking, heating and lighting cannot be met suffi ciently or effectively, and then too, only at the expense of the environment, health, social development and livelihood of the people. A large part of the Indian population still remains without access to basic energy services and infrastructure. Most of rural India depends on biomass for cooking, and in the absence of electricity, uses kerosene for lighting purposes. “Electrifi ed” villages, in many cases, mean villages that have only partial access to electricity (three to four hours per day) (World Bank 2010). Public transport systems are restricted to only larger cities while most villagers have very limited access, if at all, to motorized transport. So while access to such services needs to be increased, the quality of the services themselves needs to be improved in most cases in order to bring about a substantial change in standards of living. While the Human Development Index (HDI) value for India has increased from 0.515 in 1990 to 0.619 in 2009 (World Bank 2012), the country still ranks 128th in the index and has to enhance the level of human development considerably.
There is a strong positive link between human development, economic growth and the growth in energy and infrastructure. Past experience reveals that no country has substantially reduced poverty without massively increasing its use of energy. Electricity, in particular, plays a crucial role in improving levels of human development and the quality of modern life. Accordingly, the government of India plans to achieve an annual GDP growth rate of 8 per cent till 2030 and 6 per cent beyond that (Planning Commission 2011). Given the plans for rapid economic growth, it is evident that the country’s requirements for energy and supporting infrastructure would increase rapidly as well.
On the supply side, India’s conventional energy resources are limited. India’s oil reserves are limited, and while India is the fourth-largest coal producer in the world after China, USA and Australia (BP 2012), much of the coal reserves are inaccessible due to technological, social or geological factors (Batra and Chand 2011). As a result, India faces increasing challenges in meeting its growing commercial energy demand with domestic conventional resources.
Biofuels (including traditional biomass) also constitute an important source of energy in the Indian context, where a large number of rural households use fi rewood and agro-residue to meet their energy requirements. As per the IEA, the contribution of traditional biofuel sources was 24.6 per cent in 2010, while modern renewable sources (including large hydro) contributed only 1.7 per cent to the primary energy supply.
India’s oil import dependence has always been high; it is estimated to be around 80 per cent during the Twelfth Five-year Plan period (2012-2017) of the government of India. Even in the case of coal, import dependence is estimated to increase to keep pace with rising coal requirements and to deal with issues of coal quality (Planning Commission 2011). India is expected to be moving toward a future of increased energy imports, which would lead not only to greater uncertainties in energy supply but also to increased pressure on the country’s stock of foreign exchange.
INDIA STILL RANKS 128TH
IN THE HUMAN DEVELOPMENT INDEX AND HAS TO ENHANCE THE LEVEL OF HUMAN
DEVELOPMENT CONSIDERABLY

3
From the environment perspective, India’s GHG emissions grew by 2.9 per cent per annum between 1994 and 2007, with total emissions (including LULUCF) being 1,727.71 million tonnes of CO2 equivalent in 2007 (MoEF 2010).
Renewable technologies can provide energy services with zero or negligible GHG emissions. Thus, to attain both its developmental and environmental goals, India needs to shift to alternative and cleaner sources of energy. Renewable energy sources can play an important role in not only providing clean energy for meeting the increasing energy requirements, but also in improving energy access and providing livelihoods to people associated with the supply chain. Renewable energy technologies also have a role in ensuring sustainable development of remote regions in the country through decentralized power systems, as well as in improving the quality of life and health through avoided air pollution and waste and through improved air quality. Harvesting renewable energy in a decentralized manner is one of the options to meet rural and small-scale energy needs in a reliable, affordable and environmentally sustainable way. Some industrial energy requirements could also be met though decentralized renewable solutions.
Against this backdrop, the study seeks to analyse a scenario with an aggressive move toward renewables by 2050, in line with WWF International’s vision of achieving an economy based on 100 per cent renewable energy by 2050. The report evaluates the technical potential of renewable options and examines the barriers that would need to be removed to reach such a scenario. The implementation of such a scenario requires large technological and policy transformations. On the global level, it has been shown that by 2050 massive moves can be made toward REN, i.e., 80 per cent and more of all the energy used could be from renewable sources. This can be done with strong policies, governmental frameworks, fi nancial incentives and a focus on energy effi ciency (WWF and Ecofys 2011; IPCC 2011). On the technology front, effi ciencies will need to be improved; additionally, there will be a need to scale up existing technologies and to widely disseminate the use of new technologies, which are still in the R&D phase in several countries, including India.
The following sections draw on existing information from secondary sources, expert opinions through stakeholder consultations and results of an integrated energy modelling exercise to illustrate, through two scenarios, the prospects of alternative energy demand and supply futures for India.
1.2 OBJECTIVE
We live in a world where natural resources –energy or material –are getting rapidly depleted. With rising population and increasing aspirations for a better standard of living, this strain can only be expected to intensify. At the same time, there are many in the developing and less developed parts of the world who lack access to even the most basic energy services.
Fossil fuels like coal, oil or natural gas will become increasingly more expensive, in particular, for poor countries because cheap conventional reserves are not being replenished. At the same time, there is a need to cap emissions, globally, if we are to
INTRODUCTION

4
THE ENERGY REPORT– INDIA 100% RENEWABLE ENERGY BY 2050
limit temperature increase to 2°C above to the average pre-industrial temperatures (IEA 2012); however, choices for doing so are limited. WWF Energy Report: 100% Renewable Energy by 2050 provides a scenario where almost 100 per cent of the world’s primary energy supply is provided through renewable energy sources and the world’s dependence on conventional fuels is reduced to negligible amounts by the middle of the 21st century.
In the present study, the possibility of a 100% Renewable Energy Scenario for India is examined, while taking into account country-specifi c issues like access, resource availability, energy security considerations and the existing plans and policies of the government. While the theoretical technical potential of renewable options for India is examined, the report also discusses the barriers, limitations and practical issues in various sectors, as well as the implications of such a scenario in terms of investment needs.
The study, therefore, seeks to evaluate the possibility of the role of renewable energy such that 100 per cent of the energy needs of the country can be met through them by 2050. It must be noted that in this study 100 per cent renewable means use of renewable energy to the maximum possible extent. However, there are certain cases where fossil fuels cannot be replaced by renewable sources, such as industrial feedstock. Use of fossil fuels is assumed to continue in these cases.
The report also seeks to achieve the following objectives.
Examine the technical potential of various renewable resources
Develop a scenario to examine the extent to which India can switch to renewable energy, accounting for the energy requirements in key sectors and the associated costs

5
2. APPROACH AND METHODOLOGY
This study uses a bottom-up integrated analysis modelling framework to examine the implications of moving to the 100% Renewable Energy Scenario by 2050, such that almost all future energy demands, across sectors, can be met by renewable energy sources and technologies. The use of such an integrated framework permits a holistic assessment of the entire energy system, encompassing both the demand and supply sides and allowing for the examination of trade-offs and substitutability between and across sectors and available energy sources.
Energy demand and technology choices are expected to change with improved energy access, increased incomes and better infrastructure and services, associated with a higher level of development and improved lifestyles available to the people.
As a fi rst step, future useful energy demands are estimated and provided as drivers of energy supply and technology use. Further, the understanding of individual resource potentials and availability of alternative technology choices are provided, across scenarios, to evaluate the gap between the theoretical and realizable potential for renewables in India by 2050.
The end-use energy demand for each scenario is determined along with the associated GHG emissions. Effi ciency improvements through energy conservation measures and changes in lifestyles are also taken into account. The fi nal energy demand in various end-use sectors in the REN scenario could be reduced, in comparison to the “reference scenario”, through the adoption of energy-saving measures and technological options. It would be easier to meet lesser-energy demand levels through renewable energy. Accordingly, this approach also takes into account different options/practices on the demand side, besides considering renewable energy supply options and technologies as a means to reduce the use of fossil fuels and the consequent emissions compared to the “reference scenario”.
The study evaluates options on the demand and supply sides, with respect to technologies, modes and fuels, based on literature reviews and expert consultations. The options are mapped on a modelling framework.
This study builds on and integrates work that has already been undertaken by TERI using the MARKAL (MARKetALlocation) modelling framework for India and the knowledge base existing within TERI. TERI has developed a relatively detailed bottom-up MARKAL model database for India over the last two decades and has been using it extensively for the analysis of energy technology at the national level. A detailed analysis of the energy sector is undertaken via two scenarios using this integrated energy–economy–environment modelling framework. The model provides the optimal resource–technology combinations under various scenarios and facilitates analysis

6
THE ENERGY REPORT– INDIA 100% RENEWABLE ENERGY BY 2050
of the technology and policy options that could be implemented in order to move to a 100% Renewable Energy Scenario.
Further, for this exercise in particular, stakeholder consultations were undertaken, especially with respect to renewable energy sources and technologies, to get deeper insight into the maximum possible potential of each alternative renewable energy option.
2.1 DESCRIPTION OF MODELLING FRAMEWORK
MARKAL is a bottom-up dynamic linear programming model, which depicts both the energy supply and demand sides of the energy system. It presents policymakers and planners in the public and private sectors with extensive details on energy-producing and energy-consuming technologies, and provides an understanding of the interplay between the various fuel and technology choices for given sectoral end-use demands. As a result, this modelling framework has contributed to national and local energy planning, and to the development of carbon mitigation strategies. The MARKAL family of models is unique, with applications in a wide variety of settings and global technical support from the international research community.
MARKAL interconnects the conversion and consumption of energy. This user-defi ned network includes all energy carriers involved in primary supplies (e.g., mining, petroleum extraction, etc.), conversion and processing (e.g., power plants, refi neries, etc.), and end-use demand for energy services (e.g., automobiles, residential space conditioning, etc.) that may be disaggregated, by sector (i.e., residential, manufacturing, transportation and commercial) and by specifi c functions within a sector (e.g., residential air conditioning, lighting, water heating, etc.).
The optimization routine used in the model’s solution selects an option from each of the sources, energy carriers and transformation technologies to produce the least-cost solution, subject to a variety of constraints. The user defi nes technology costs, technical characteristics (e.g., conversion effi ciencies) and energy service demands.
As a result of this integrated approach, supply-side technologies are matched to energy service demands. Some uses of MARKAL include:
1. Identifying least-cost energy systems and investment strategies
2. Identifying cost-effective responses to restrictions on environmental emissions and wastes under the principles of sustained development
3. Evaluating new technologies and priorities for research and development
4. Performing prospective analysis of long-term energy balances under different scenarios
5. Examining the “reference” and “alternative” scenarios in terms of the variations in overall costs, fuel use and associated emissions
The MARKAL framework is detailed in Figure 1.

7
The MARKAL database for this exercise has been set up over a 50-year period extending from 2001 to 2051 at fi ve-yearly intervals, coinciding with the fi ve-year plans of the government of India. The year 2001-02 is chosen as the base year as it coincides with the fi rst year of the Tenth Five-year Plan (2002-07) of the government of India. In the model, the Indian energy sector is disaggregated into fi ve major energy-consuming sectors, namely, the agriculture, commercial, industry, residential and transport sectors. Each of these sectors is further disaggregated to refl ect the sectoral end-use demands. The model is driven by the demands on the end-use side. End-use energy demands at the country level are estimated across various energy-consuming sectors of the Indian economy.
On the supply side, the model considers the various energy resources that are available both domestically and from abroad for meeting various end-use demands. These include conventional energy sources, such as coal, oil, natural gas and nuclear, as well as renewable energy sources, such as hydro, wind, solar, biomass, etc. The availability of each of these fuels is represented by constraints on the supply side.
The relative energy prices of various forms and sources of fuels dictate the choice of fuels, which plays an integral role in capturing inter-fuel and inter-factor substitution within the model. Furthermore, the model also incorporates various conversion and process technologies – characterized by their respective investment costs, operating and maintenance (O&M) costs, technical effi ciency, life, etc. – to meet sectoral end-use demands. A discount rate of 10 per cent has been assumed through this period. Prices of conventional fuels have been taken from the fuel price projection published in IEA’s World Energy Outlook 2012 (IEA 2012b). India-specifi c capital costs and O&M costs for various technologies have been obtained from various sources. Wherever India-specifi c costs are not available, international fi gures have been used. Cost reduction in emerging technologies in the future has also been assumed. The key assumptions used in model are provided in the appendices.
The model logic is given in Figure 2.
MARKAL
Availability of technologies
Constrains on imports and mining of energy
Ecological effects CO2 emissions
Demand for energy services
Economy and society
Capital needs and technology deployment
Environment
Optimal energy mix
Energy economy
Figure 1: MARKAL
framework overview
Source: IEA-ETSAP
APPROACH AND METHODOLOGY

8
THE ENERGY REPORT– INDIA 100% RENEWABLE ENERGY BY 2050
Model runs and analyses have been carried out for two different scenarios, which provide two signifi cantly different outcomes in terms of fuel mix, technology deployment, commercial energy requirement and investment.
In this report, Chapter 3 describes the scenarios used in this analysis. Chapter 4 discusses the demand-side assumption, while Chapter 5 discusses the supply-side options. Model results for both demand and supply sides are presented in Chapter 6.
Figure 2: Model logic
Source: IEA-ETSAP
Renewables e.g.
- Biomass
- Hydro
Mining e.g.
- Crude oil
- Natural gas
- Coal
Imports e.g.
- Crude oil
- Oil products
Exports e.g.
- Oil products
- Coal
Stock changes
Fuel processing
plants e.g.
- Oil refi neries
- Hydrogen prod.
- Ethanol prod.
Power plants e.g.
- Conventional Fossil Fueled
- Solar
- Wind
- Nuclear
- CCGT
- Fuel Cells
- Combined Heat and Power
Industry. e.g.
- Steam boilers
- Machinery
Services. e.g.
- Air conditioners
- Light bulbs
Households. e.g.
- Space heaters
- Refrigerators
Agriculture. e.g.
- Irrigation pumps
Transport. e.g.
- Gasoline Car
- Fuel Cells Bus
Industry. e.g.
- Process steam
- Motive power
Services. e.g.
- Cooling
- Lighting
Households. e.g.
- Space heat
- Refrigeration
Agriculture. e.g.
- Water supply
Transport. e.g.
- Person-km
PRIMARY ENERGY SUPPLY
CONVERSION TECHNOLOGIES
END-USE TECHNOLOGIES
DEMAND FOR ENERGY SERVICE
(Final Energy) (Useful Energy)

9
3. SCENARIO DESCRIPTION
Two scenarios have been developed for the purpose of the study. These are:
1. Reference Energy Scenario (REF): Considers only current trends and policies, and projects these into the future as determinants of energy demand and supply. This scenario includes all current forms of energy—fossil-based, nuclear and renewable.
2. 100% Renewable Energy Scenario (REN): Examines the possibility as well as the energy mix of a scenario that approaches 100 per cent renewable energy in primary commercial energy. Fossil fuels and nuclear-based technologies need to be phased out and no new capacity additions in either are considered, except for the ones that are already under construction.
The assumptions on the GDP and population growth rates remain the same across both the scenarios. The following section briefl y explains the story line and broad assumptions behind each of the above-mentioned scenarios.
3.1 REFERENCE ENERGY SCENARIO
This scenario is characterized by the most probable path for the Indian economy in the absence of any additional major interventions. This scenario incorporates existing government plans and policies and follows a realistic trend of actual adoption of these policies.
Estimates regarding the domestic availability of various fuels are also incorporated in this scenario. Availability of imported natural gas is considered freely, subject to the limit for the construction of LNG terminals imposed in the plans of the government of India. However, the import of coal and oil is left free to satisfy energy demand, without any capacity restrictions.
With regards to technology penetration in the power sector, limited deployment of effi cient coal technologies (only up to supercritical) is assumed as per the Twelfth Five-year Plan. The penetration of various renewable energy technologies is considered as per existing trends. Programmes like the Jawaharlal Nehru National Solar Mission as well as the twelfth and thirteenth fi ve-year plan period targets are expected to materialize as planned, and further development from then on has been considered, as provided in Appendix A.1.

10
THE ENERGY REPORT– INDIA 100% RENEWABLE ENERGY BY 2050
3.2 100% RENEWABLE ENERGY SCENARIO
This scenario considers highly determined efforts taken toward energy-effi ciency measures, spanning across all sectors, and goes further in terms of renewable energy deployment, such that renewable energy sources are exploited to the maximum technical potential, as per literature. Solar power technologies, like solar PV, have been considered as per the potential available from 1 per cent of the country’s land, while solar thermal technologies, like concentrated solar thermal technologies, are used to meet end-use heat demand to the maximum extent possible. Renewable resources replace conventional sources of energy almost completely by 2051.
Nuclear and fossil fuels are allowed to be phased out gradually by 2051. However, in the intermediate term, only the most effi cient fossil-based technologies are allowed to be used. Advanced gas-based power generation (e.g., H-frame combined-cycle gas turbine), with 60 per cent effi ciency, is assumed to be commercially available by 2016-17. Similarly, to allow for the possibility of greater technology transfer across countries and for a greater thrust on indigenous R&D in the power sector in this scenario, all cleaner and higher-effi ciency coal technologies (excluding carbon capture and storage technologies) are allowed to penetrate in an unconstrained manner to their maximum capacity from their year of introduction. In addition to power-generation technologies, biofuels are also assumed to be available to the transport sector in the REN scenario. In this analysis, the maximum production of biodiesel is assessed based on the potential area for jatropha plantation. From 2026 onwards, second-generation biofuels, like cellulosic ethanol and advanced biodiesel (FT-Biodiesel) biofuel, are also considered based on the availability of crop residue and fuelwood for energy purposes.
On the demand side, effi ciency improvements are considered in various end-use sectors, for example, the increased share of effi cient electrical appliances to meet the demands for space conditioning, lighting and cooking in residential and commercial sectors. Furthermore, energy-effi ciency measures in the transport sectors in the form of technology as well as policy interventions by the government, such as an increased share of rail vis-à-vis road in passenger and freight movement, a higher share of movement by public transport, etc. are also incorporated in this scenario. Water heating requirement is assumed to be met entirely through solar heating by 2051. This scenario also assumes that 100 per cent of the cooking requirement is met through improved cook stoves in rural areas, which frees up more biomass for biofuels production. The scenario also pre-supposes several lifestyle changes that allow for greater electrifi cation of end-use demands. For example, by 2051, all urban cooking and substantial transport demands are assumed to be met through electricity.
The availability and deployment of renewables are allowed to increase at a much faster rate in the REN scenario than in the REF scenario. In fact, the REN scenario allows for the full exploitation of technical potentials of most renewable resources by the end of the modelling period. For example, the full exploitation of the technical potential of offshore wind by 2051 is allowed in the scenario. Concentrated solar thermal plants with storage and solar power towers are also considered and assumed to act as base load plants. Moreover, concentrated solar thermal technology for process heating is assumed to meet the needs of industrial heating applications to a large extent. In addition, other renewable technologies such as geothermal, ocean and waste-to-energy are also considered to achieve 100 per cent of their technical potential by 2051.
100% RENEWABLE ENERGY SCENARIO CONSIDERS HIGHLY
DETERMINED EFFORTS TAKEN
TOWARDS ENERGY EFFICIENCY
MEASURES AND RENEWABLE
ENERGY DEPLOYMENT

11
4. ENERGY DEMAND SECTORS
4.1 DRIVERS
Population and gross domestic product (GDP) have been considered the main drivers for estimating and projecting sectoral end-use demands in terms of physical industrial production or useful energy services. Based on the optimal fuel–technology mix chosen by the MARKAL model to meet these demands, the fi nal energy required is obtained from the model.
Population growth and the dynamics of demographic shifts across various income classes have a direct infl uence on energy demands in the future. Similarly, a high rate of economic growth, as measured by the GDP and its allocation across the agriculture, industry and services sectors, has an impact on energy consumption and its distribution across sectors. Both scenarios in this study, in line with the government policy of high and inclusive growth of the economy, assume an average annual economic growth rate of 8 per cent per annum till 2036 and 6 per cent, thereafter. The share of the agriculture sector in the aggregate GDP is considered to decline to a level of 6 per cent, with a corresponding rise in the share of industry and services to 34 per cent and 60 per cent, respectively, in 2051. Population projections for India have been estimated by different agencies, including the UNDP and Population Foundation of India (PFI). These were compared and PFI (scenario B) projections have been selected for this study, based on expert consultations. The population growth rate is expected to drop from 1.7 per cent as recorded in the 2011 census, to a rate of 0.59 per cent between 2041 and 2051. Accordingly, the population of India reaches 1.75 billion in 2051.
4.2 ENERGY END-USE SECTORS
Econometric techniques such as regression techniques, process models and end-use methods have been used to estimate and project end-use sectoral demands. The population and GDP projections, as estimated, have been used as the main driving force for assessing the end-use demands in each of the energy-consuming sectors.
Energy use in the demand side is segregated into fi ve sectors, namely, transport, industry, residential, commercial and agriculture. Each demand sector has different end-use requirements and uses different technologies to meet the end uses.
4.2.1 Transport Sector
The transport sector plays a crucial role in shaping the nation’s economic development. The sector is disaggregated into road, rail, air and water. The end-use demand in the

12
THE ENERGY REPORT– INDIA 100% RENEWABLE ENERGY BY 2050
transport sector is disaggregated in terms of passenger and freight kilometres, which may be met through alternative transportation modes and technologies.
In the analysis, the focus is mainly on road- and rail-based freight and passenger traffi c, although air- and coastal-based movements are also included in the framework.
The transportation demand is projected using socio-economic indicators such as per capita income (indicator of purchasing power), percentage share of population residing in urban areas, total population, GDP, GDP contributed by the agriculture and industry sectors, mode-wise vehicle population, occupancy rates, etc. A bottom-up approach has been deployed to estimate and project the road passenger and freight transport demand. For estimating and projecting the mode-wise transportation demands, motorized transport vehicles have been classifi ed separately as transport vehicles for passenger or freight movement. The travel demand has been separately estimated for each type of transport. Substitutability of modes as well as effi ciency improvements of each type of transport has been considered. In the REF scenario, there are limited effi ciency improvements, while in the REN scenario, effi ciency improvement of 1 per cent per annum is considered across all modes and vehicles. The REN scenario also considers a shift from road- to rail-based transport, thus, increasing its share. Occupancy and utilization rates for road-based transport have been considered as constant for the entire projection period. Vehicle populations have been projected using logistic regression models. For rail, air and water, transport demand is obtained through an exercise of regression on macroeconomic variables. Penetration of biofuels has also been considered and is mentioned in the chapter on biomass.
4.2.2 Industry Sector
The Indian industrial sector is a major energy user accounting for around 43.6 per cent of the commercial energy consumption in 2010-11 (MoC 2011a, MoP&NG 2011a). The rapid increase in energy consumption in the industry sector during the past few years is partly due to investments in basic and energy-intensive industries, following the emphasis laid on achieving self-reliance in the past development plans. The industrial sector contributed about 19 per cent to India’s GDP in 2009 (RBI 2011).
In this study, the industrial sector has been disaggregated into 10 energy-consuming industries, namely, chlor-alkali, aluminum, iron and steel, cement, textile, fertilizer and pulp and paper, brick, glass, petrochemicals and other small and medium manufacturing units grouped under “other industries”. Production in each of these industrial sub-sectors is estimated using econometric techniques. The future demand of industrial output for each of the aforementioned industrial sub-sectors is estimated as a function of the income generated by various sectors of the economy, measured by the GDP, and the value added by the industrial sector (GDP of industry), per capita income, etc.
Effi ciency improvements have been considered in both scenarios, whether through technology improvements or through shifting toward better modes of production. For example, caustic soda production in India uses the membrane cell process. This is a mature process and there is very little scope for further effi ciency improvement. A new technology called ODC (oxygen depolarized cathodes) has been developed. The

13
ODC technology has potential for energy electricity saving. In the present analysis, it is assumed that in India, ODC technology will be commercially available from 2016 in the REN scenario. Similarly, energy-effi ciency options for the cement industry include the conversion of four-stage and fi ve-stage cement plants to modern six-stage plants (with pre-heater, twin-stream, pre-calcinator and pyro-step cooler). The REN scenario also considers a higher share of blended cement in the total cement production. Many paper mills that exist today have been installed over a span of more than a 100 years, and technologies range from very old ones to the most modern ones. Indian plants are well below the standards of energy performance when compared with their counterparts in developed countries. A large number of effi ciency improvement measures like cogeneration, oxygen delignifi cation and hot dispersion systems have been considered for plants in this sub-sector. The iron and steel industry is allowed effi ciency improvements in both scenarios. In the REF scenarios, there is reduction in scrap-based production and an increase in the production from iron ore. In the REN scenario, the industry sector is assumed to move toward a greater amount of recycling.
4.2.3 Residential Sector
Energy services make up a sizable part of the total household expenditure. In India, the energy sources utilized by the residential sector mainly include electricity, kerosene, liquefi ed petroleum gas (LPG), fi rewood, crop residue and dung. Traditional fuels are predominantly used for cooking in rural areas. However, these are increasingly being replaced with modern fuels (kerosene and LPG), and commercial energy use in the residential sector is increasing on account of the change toward more energy-intensive lifestyles as well as the transition to commercial energy forms.
Energy is required in the residential sector for lighting, cooking, space conditioning, refrigeration, water heating and operating other electrical appliances. The energy demand for fans, air conditioners, and air coolers has been categorized as energy demand for space conditioning. The category “others” comprises energy demand for appliances such as televisions, washing machines, VCRs/VCPs and music systems. Population growth and the dynamics of demographic shifts across various income classes have a direct infl uence on energy demands in the future. Therefore, energy demands for various end uses have been estimated separately for urban and rural households, based on the penetration rates of these appliances across various household expenditure categories and the estimated appliance usage norms.
The Indian government’s policy for rural electrifi cation is incorporated as per Rajiv Gandhi Grameen Vidyutikaran Yojana of the Ministry of Power. However, 100 per cent electrifi cation has not been achieved as per the plan. In this study model, 100 per cent electrifi cation is assumed to have been achieved 2017 onwards.
The REN scenario considers higher penetration of energy-effi cient appliances, such as fi ve-star rated appliances (TV, refrigerators and air conditioners), CFL and LED lighting systems, etc. As for energy use in cooking, there is a shift from biomass to LPG in rural households in the REF scenario. In the REN scenario, however, in order to make a transition to 100 per cent renewable energy, rural households are assumed to use biomass with improved cookstoves, while urban households are assumed to have shifted entirely to electric cooking.
ENERGY DEMAND SECTORS

14
THE ENERGY REPORT– INDIA 100% RENEWABLE ENERGY BY 2050
4.2.4 Commercial Sector
The commercial sector comprises various institutional and industrial establishments such as banks, hotels, restaurants, shopping complexes, offi ces, public departments supplying basic utilities, etc. Given the structural changes in the economy, especially in the post-liberalization period, the services sector now accounts for a high share in the total national income—about 50 per cent in the aggregate GDP. Economic growth has paved the way for the increasing demand for services, fuelled by rising personal disposable incomes and enhanced purchasing power in the hands of people. Moreover, structural reforms in the banking sector, which have led to lower interest rates and resulted in the real estate boom (encompassing the construction of large-scale commercial buildings, shopping malls, etc. especially in urban centres), and increased government spending on the provision of public services such as public lighting, water works and sewer pumps, etc. Have provided a fi llip to the growth of the commercial sector. Accordingly, energy consumption in this sector has increased rapidly.
Most of the energy use in the commercial sector is associated with the supply of services such as space conditioning, water heating, lighting and cooking. Moreover, energy is consumed for providing civic services such as street lighting, public water works and sewage systems, etc.
A precise estimation and projection of the energy demand for the commercial sector is diffi cult, since data for this sector is scarce, particularly with respect to the reporting of the number of commercial establishments/consumers, their energy consumption patterns, amount of usage of energy for different end-use energy-consuming activities, penetration of appliances and other end-use devices in the sector, etc. Therefore, in the commercial sector, a top-down approach is used, where the total fuel consumption is fi rst estimated and projected using appropriate econometric models. The projected fuel consumption is then divided among various end-use activities involving that particular fuel.
4.2.5 Agriculture Sector
Traditionally, India has been an agricultural economy. Agriculture is still a major source of income for over 50 per cent of the total population (RBI 2011). It provides raw material to several major industries, such as sugar, textiles, jute, paper, food processing and milk processing. This sector has forward and backward linkages with the other economic sectors. Therefore, changes in the agricultural sector have a multiplier effect on the entire economy.
Mechanization of various agricultural operations like threshing, harvesting, land preparation, irrigation, etc. account for the energy demand in the agricultural sector. Energy demand in the agricultural sector in India is mainly attributed to two major agricultural operations: land preparation and irrigation pumping.
The energy demand for land preparation and irrigation is a function of land under tractors and tillers and area under irrigation, respectively; the demand also depends on the technological parameters of the associated machines.

15
Diesel and electric pump sets are mainly divided into two categories: standard and effi cient. For the REF scenario, effi cient pumps have a penetration of 30 per cent by 2051, while in the REN scenario, there are only electric pumps, and penetration of effi cient pumps is 100 per cent. The REN scenario also considers an improvement in irrigation effi ciency, whereby, the concern of water wastage is addressed; a 30 per cent reduction in the water requirement is realized in the REN scenario.
ENERGY DEMAND SECTORS

16
THE ENERGY REPORT– INDIA 100% RENEWABLE ENERGY BY 2050

17
5. ENERGY SUPPLY SOURCES
Energy supply in India is dependent largely on fossil fuels. In 2010, conventional energy contributed 74 per cent to India’s primary energy supply (IEA 2012b). Coal and gas contributed mostly to power generation and feedstock for industries. The economy consumed 696.03 MT of coal (MoC 2012) and 46.3 BCM of natural gas in 2011-12 (PPAC 2012).
Petroleum products are another important source of energy, with total petroleum consumption in the economy being around 148 million tonnes in 2011-12 (PPAC 2012). The transport sector is the largest and fastest growing consumer of petroleum products in India and drives the bulk of the demand for petroleum products, with a share of 39 per cent in the total consumption, followed by the residential, industry and commercial sectors.
In 2010, modern renewable energy forms, inclusive of large hydro, constituted only around 1.7 per cent of the primary energy supply in the country and 24.6 per cent came from traditional biomass-based fuels. The following sections discuss the availability of energy supply sources.
5.1 CONVENTIONAL ENERGY
5.1.1 Coal
Coal continues to remain the most important energy source in India’s energy mix, accounting for 42.4 per cent of the country’s total primary energy demand in 2010 (IEA 2012b). While the railways was the largest coal consumer before 1975, the power sector has since then emerged as the largest consumer, followed by the iron and steel and cement sectors. Power (utilities and captive) accounted for 87.7 per cent of the total coal consumption in 2011-12, followed by sponge iron (4.3 per cent), steel (4.1 per cent) and the cement industry (3.9 per cent) (MoC 2011a).
The estimated coal reserve in India is 285.86 billion tonnes, out of which proven reserves stand at 114 billion tonnes. However, these reserve estimates include a large share that is not extractable due to technical reasons or because it falls under forestland,among other reasons. Recent estimates now place extractable reserves at 21.80 billion tonnes (Batra and Chand 2011), which are expected to last 35-40 years at current rate of exploitation. India also has lignite reserves of 39.9 billion tonnes (MoSPI 2012).

18
THE ENERGY REPORT– INDIA 100% RENEWABLE ENERGY BY 2050
Over the past decade, both the domestic production and net imports of coal have been on the rise. Figure 3 represents coal production and imports over six years.
The production level for the terminal year of the Eleventh Five-year Plan period (2007-2012) was 554 million tonnes, with an achievement–target ratio of 81.4 per cent. The planned productions for the terminal year of the twelfth plan period(2012-2017)and thirteenth plan period(2017-2022) for domestic coking and non-coking coal and lignite together is around 715 million tonnes and 950 million tonnes, respectively (MoC 2011a). However in the model, TERI has assumed lower estimates of coal production, based on expert consultation. In the REF scenario, India is expected to achieve the Twelfth Five-year-Plan target only by 2031 and will increase yearly production to only around 850 million tonnes per annum by 2051. With globally depleting reserves and uncertain geopolitical dynamics of the future, sourcing coal through imports from other countries could be an issue. However, constraints in this regard have not been considered in order to avoid demand–supply mismatch. While IEA projections for fossil fuel prices have been considered in this study, in reality, the rise in prices could faster and higher than predicted by IEA, having implications for the country’s balance of payments.
5.1.2 Oil
After coal, oil is most important fuel in India. Petroleum products accounted for 24 per cent of the primary energy demand in India in 2010 (IEA 2012b). In 2011-12, 148 million tonnes of petroleum products were consumed in India, an increase of 5 per cent over 2010-11. The transport sector is the largest and fastest growing consumer of petroleum products in India, accounting for 39 per cent of petroleum products consumed, followed by the residential, industry and commercial sectors. As on 1 April 2011, the total crude oil reserves in India amounted to 757 million tonnes, i.e., 0.1 per cent of the estimated global reserves (MoSPI 2012). India’s growing dependence on oil imports can be seen from the rising share of net crude oil imports as indicated in Figure 4.
Figure 3: Coal imports
and production
Source: MoC, Provisional Coal Statistics 2011-12, 2012

19
ENERGY SUPPLY SOURCES
The proportion of crude oil imports has been on the rise, with nearly 80 per cent imported refi nery throughput in 2011-12. On the other hand, domestic production has been nearly stagnant ranging between 34 million tonnes per annum and 37 million tonnes per annum between 2006 and 2012. The REF scenario caps domestic oil production at 41 million tonnes by 2016-17.
Crude oil production during the Eleventh Five-year Plan period has been 177 million tonnes with an achievement–target ratio of 85.6 per cent. The target for the twelfth plan period is 216 million tonnes (MoP&NG 2011b). The average production was 35.5 million tonnes per annum for the eleventh plan period, which is proposed to be raised to 43.4 million tonnes for the twelfth plan period. The country’s crude oil reserve estimate has not changed over the last few decades. As a result, import dependency is expected to rise considerably in the REF scenario. Also crude oil supply and prices are very sensitive to geo-political issues, and alternative fuel options are desirable.
5.1.3 Natural Gas
Natural gas accounted for 7.7 per cent of the primary energy demand in India in 2010 (IEA 2012b). India ranks eleventh in terms of natural gas consumption globally. The natural gas production in the country over fi ve years is provided in Figure 5.
Figure 4: Production and
net imports of crude oil
and petroleum products
Source: MoP&NG, Basic Statistics on Petroleum and
Natural Gas 2010-11, 2011

20
THE ENERGY REPORT– INDIA 100% RENEWABLE ENERGY BY 2050
Gross production of natural gas in the country for 2011-12 stood at 47.55 BCM, which was 9 per cent lower than the production of 52.21 BCM during 2010-11. Gas consumption in the country has been increasing steadily. In 2009-10, about 68 per cent of the total gas available in the country was used for energy purposes, particularly for power generation. Natural gas is increasingly being used in the transport sector. Besides, gas is used as feedstock in fertilizer and petrochemical industries.
The production of natural gas was 216 BCM for the Eleventh Five-year Plan period, with an achievement–target ratio of 84.9 per cent. The planned production for natural gas for the twelfth plan period has been revised to a lower level of 187 BCM (MoP&NG 2011b).
5.1.4 Nuclear Power
India has a largely indigenous nuclear power programme and expects to have 20,000 MW of installed nuclear capacity by 2020 and 63,000 MW by 2032. Because India is not a signatory to the Nuclear Non-Proliferation Treaty, it was largely excluded from trade in nuclear plants or materials. This hampered the development of civil nuclear energy in the country until 2008, when a landmark civil nuclear pact was signed between India and the USA. Following the Nuclear Suppliers Group agreement, which was achieved in September 2008, the scope for supply of both reactors and fuel from other countries opened up. India has signed civil nuclear cooperation agreements with the USA, Russia, France, UK, South Korea and Canada as well as Argentina, Kazakhstan, Mongolia and Namibia.1
As on 31 March 2012, India had 20 nuclear reactors at six locations, with a total installed capacity of 4,780 MW. Nuclear power contributed to around 2.3 per cent of the gross electricity generation in 2011. Another 3,400 MW capacity is currently under construction. Several projects have also been proposed in seven locations amounting to a total capacity of 32.5 GW. Nuclear power capacity of around 200 GW is allowed
1 Details available at <www.world-nuclear.org>
Figure 5: Natural gas
production and imports
Source: MoP&NG, Basic Statistics on Petroleum and
Natural Gas 2010-11, 2011

21
by 2050 in the REF scenario. However, given the socio-political uncertainties and the environmental, social and economic cost issues that surround nuclear power development, the materialization of the projects is highly unlikely.2
5.2 RENEWABLE ENERGY
Renewable energy sources are based on primary energy sources that are regenerated naturally in timespans that are meaningful in terms of policy and planning horizons. Renewable energy technologies have several well-recognized advantages in relation to conventional, largely fossil fuels-based, energy systems. First, by displacing the use of imported fossil fuels, in particular, renewables promote energy security and provide much more resilience to market price volatility and fl uctuations than conventional energy fuels. Secondly, they are amenable to adoption at different scales—from a capacity of hundreds of megawatts to a few kilowatts. In many cases they may be deployed in modular, standardized designs. This enables renewable energy technologies (RETS) to be matched closely with end-use scales, enabling decentralized deployment. The feasibility of having a location close to the load or consuming centres enables reduction of technical transmission and distribution losses. However, where centralized grids (networks) exist, they may be inserted as individual modules in the grid (network) supply. Renewable energy can help promote sustainable development (broadly defi ned) through increased opportunities for local employment, especially for the rural poor, and can result in an improvement in the environment by reducing and avoiding GHG emissions, local air pollutants, solid waste and waste-water generation, and in the case of forestry-based sources, by conserving soil and water and maintaining the habitat of wild species. Thirdly, in the last few years, renewables have become increasingly cheaper (both for costs of installed capacity and levelized costs of electricity) and more effective (due to the increase of load factor based on more effi cient conversion technologies). Thus, there has been an exponential and double-digit growth of renewable energy deployment, mainly wind and various solar technologies, in the world.
On the other hand, several RETS also have disadvantages. First, some primary energy fl ows (e.g., solar and wind) are variable and not completely predictable, requiring hybridization with systems that are more under human control. Some renewable energy forms, such as biofuels, compete for arable land and irrigation water with food crops. If not implemented with great care, they may have adverse social and economic consequences.
The following section discusses in detail different renewable energy technologies/options available in the country.
5.2.1 Solar Energy
Solar energy is considered the most abundant of all renewable resources in India. The inception of the Jawaharlal Nehru National Solar Mission (JNNSM), also known as the National Solar Mission, has resulted in very rapid development of solar technologies in the country. The mission, launched by the Indian prime minister in January 2010, has
2 Details available at <www.npcil.nic.in>
ENERGY SUPPLY SOURCES

22
THE ENERGY REPORT– INDIA 100% RENEWABLE ENERGY BY 2050
an ambitious target of installing 20 GW of grid-connected solar power by 2020, in order to give solar technologies an impetus.
Besides installing grid-connected solar power (based on solar thermal power generating systems and SPV technologies), the JNNSM has a target of promoting 2,000 MW of off-grid applications, including 20 million solar lighting systems and 20 million sq. metres of solar thermal collector area by 2022. The mission is to be implemented in three phases—the fi rst phase will continue till March 2013, the second phase till March 2017 and the third one till March 2022. The target for Phase-I is to set up 1,100 MW of grid-connected solar plants, including 100 MW capacity of rooftop and small solar plants, 200 MW capacity equivalent of off-grid solar applications and seven million sq. Metres of solar thermal collector area. The main objective of this mission is to help reach grid parity by 2022 and set up indigenous manufacturing capacity.
Potential
The total theoretical potential for solar power in terms of direct normal irradiance is very large. Figure 6 shows the solar map of India.
Figure 6: Solar map
of India
Source: NREL, 2010

23
India has a vast potential for solar power generation, since about 58 per cent of its total land area (1.89 million sq. km) receives an annual average global insolation above 5 kWh/m2/day. Regions that receive global insolation of 5 kWh/m2/day and above can generate at least 77 W/m2 (actual on-site output), at 16 per cent effi ciency. Hence, even 1 per cent of the land area, with global insolation of more than 5 kWh/m2/day, could deliver nearly 1,460 GW of SPV-based electricity (379 billion units (kWh) considering 2,600 sunshine hours annually). This power generation capacity would enhance considerably with the improvement in the effi ciency of SPV technology. Concentrated solar thermal (CST) technology could deliver the same potential with around 1.2 per cent of the land. However, CST requires direct insolation and can only be installed in specifi c locations.
Being a densely populated country with residential, agricultural and industrial priorities, availability of land for solar programmes is likely to be a constraint. Rooftop PV could, therefore, play a role in supplementing the land requirement for solar. Several studies establish that rooftop PV can play a large role in supplementing grid electricity, and some states like West Bengal and Kerala3 are encouraging its use. However, there are several barriers to the use of roof space, such as competing uses for other services, confl icts with solar water heating systems and the availability of adequate roof space that meets the given building’s construction bye-laws. Accordingly, not all of the rooftop potential is likely to be tapped due to the barriers mentioned above, but maximizing rooftop PV by innovative means can be pursued.
Solar technologies can be divided into two broad categories.
Solar photovoltaic: Converts sunlight into electricity, based on photovoltaic effects
Solar thermal: Uses solar radiation for heating directly and generating electricity
Solar Photovoltaic (SPV)
Technology
Solar photovoltaic (SPV), or simply photovoltaic (PV), refers to the technology of using solar cells to convert solar insolation to electricity. It works on the photoelectric effect. The process works even during cloudy or rainy days, though with reduced production and conversion effi ciency. The global cumulative installed PV capacity has increased from 1.4 GW in 2000 to about 70 GW in 2011, with a global annual investment of some USD 147 billion in 2011 (REN 21 2012). Germany, Japan, USA, Italy, Spain and China are leading countries in terms of cumulative capacity, annual installed capacity, and/or production of PV modules and systems. In India, most of the existing manufacturing capacity is based on crystalline silicon manufactured as wafers. Solar PV applications include solar home systems, solar power plants, solar lighting (street lighting, home lighting systems and lanterns), solar pumping and PV modules for telecommunications and data logging. However, the high capital cost is a barrier.
3 MNRE. 2013. Roof top Solar PV Systems, <http://mnre.gov.in/fi le-manager/UserFiles/pres-entations-23052013/SECI.pdf>, last accessed on 31 October 2013
ENERGY SUPPLY SOURCES
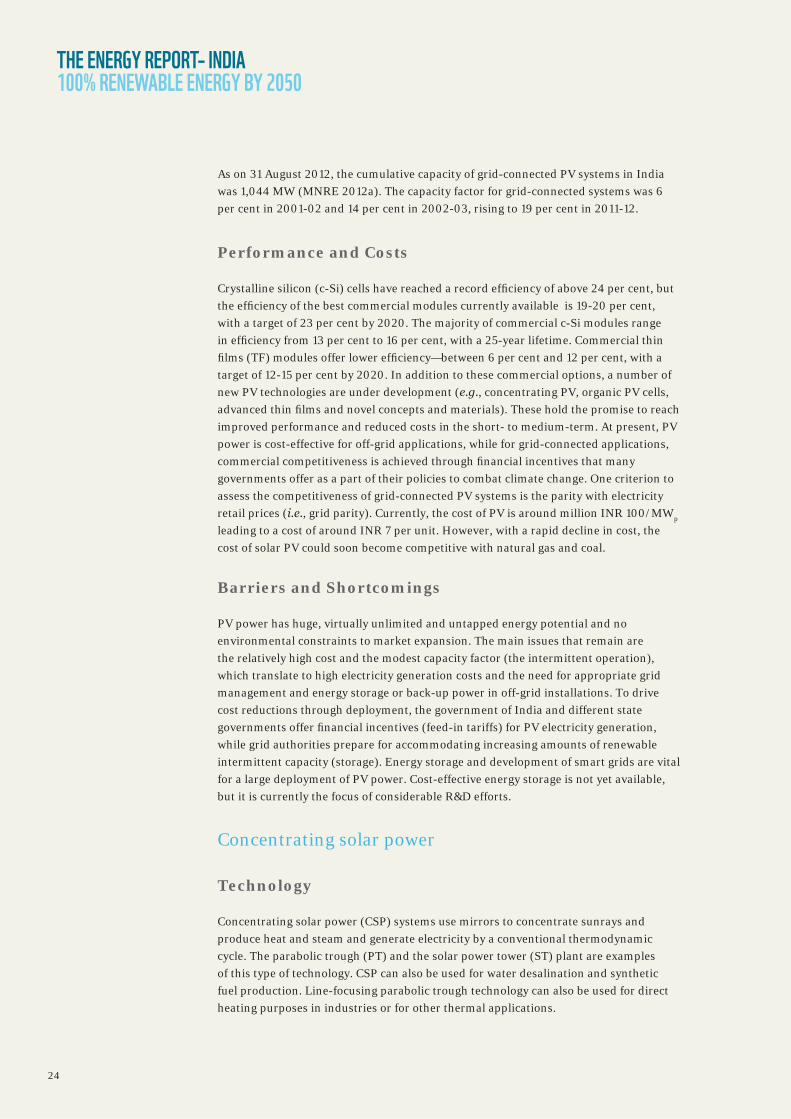
24
THE ENERGY REPORT– INDIA 100% RENEWABLE ENERGY BY 2050
As on 31 August 2012, the cumulative capacity of grid-connected PV systems in India was 1,044 MW (MNRE 2012a). The capacity factor for grid-connected systems was 6 per cent in 2001-02 and 14 per cent in 2002-03, rising to 19 per cent in 2011-12.
Performance and Costs
Crystalline silicon (c-Si) cells have reached a record effi ciency of above 24 per cent, but the effi ciency of the best commercial modules currently available is 19-20 per cent, with a target of 23 per cent by 2020. The majority of commercial c-Si modules range in effi ciency from 13 per cent to 16 per cent, with a 25-year lifetime. Commercial thin fi lms (TF) modules offer lower effi ciency—between 6 per cent and 12 per cent, with a target of 12-15 per cent by 2020. In addition to these commercial options, a number of new PV technologies are under development (e.g., concentrating PV, organic PV cells, advanced thin fi lms and novel concepts and materials). These hold the promise to reach improved performance and reduced costs in the short- to medium-term. At present, PV power is cost-effective for off-grid applications, while for grid-connected applications, commercial competitiveness is achieved through fi nancial incentives that many governments offer as a part of their policies to combat climate change. One criterion to assess the competitiveness of grid-connected PV systems is the parity with electricity retail prices (i.e., grid parity). Currently, the cost of PV is around million INR 100/MWp leading to a cost of around INR 7 per unit. However, with a rapid decline in cost, the cost of solar PV could soon become competitive with natural gas and coal.
Barriers and Shortcomings
PV power has huge, virtually unlimited and untapped energy potential and no environmental constraints to market expansion. The main issues that remain are the relatively high cost and the modest capacity factor (the intermittent operation), which translate to high electricity generation costs and the need for appropriate grid management and energy storage or back-up power in off-grid installations. To drive cost reductions through deployment, the government of India and different state governments offer fi nancial incentives (feed-in tariffs) for PV electricity generation, while grid authorities prepare for accommodating increasing amounts of renewable intermittent capacity (storage). Energy storage and development of smart grids are vital for a large deployment of PV power. Cost-effective energy storage is not yet available, but it is currently the focus of considerable R&D efforts.
Concentrating solar power
Technology
Concentrating solar power (CSP) systems use mirrors to concentrate sunrays and produce heat and steam and generate electricity by a conventional thermodynamic cycle. The parabolic trough (PT) and the solar power tower (ST) plant are examples of this type of technology. CSP can also be used for water desalination and synthetic fuel production. Line-focusing parabolic trough technology can also be used for direct heating purposes in industries or for other thermal applications.

25
Unlike PV, CSP uses just direct sunlight and provides energy (heat and power) only in regions with high direct solar irradiance. The proximity to transmission line corridors and the availability of water are also favourable factors. Surface solar radiation studies in the trans-Gangetic region, western dry plateau and Gujarat plains and hilly regions of India show that direct insolation is higher in intensity than the global insolation during summer, post-monsoonal and winter months due to clear sky conditions. During the monsoon months of June, July and August, the direct component is nearly half of the total global insolation received. However, solar hotspots in the cold Himalayan belt, including eastern Ladakh and minor parts of Himachal Pradesh, Uttarakhand and Sikkim,may not favour CSP technology as the direct component of global insolation is low.
CSP plants can be equipped with heat storage systems to generate electricity even when the sky is cloudy or after sunset. Thermal storage can signifi cantly increase the CSP dispatchability compared with solar PV and wind power and can facilitate grid integration and competitiveness. It can, thus, be used at base load plants.
At the end of 2011, the global installed capacity was about 1.8 GW (REN 21 2012), and around 20 GW was under construction. At present, there is no large scale CSP project in India.
Performance and Costs
The International Energy Agency has put the current investment cost for parabolic trough plants between USD 4000/kW and USD 8500/kW (depending on local conditions, solar irradiance and the maturity of the project, i.e., pilot, demonstration, commercial, etc.). In general, ST plants involve higher investment costs than PT plants, but offer potentially higher effi ciency (up to 25 per cent). Typical CSP O&M costs are estimated to be between USD 13/MWh and USD 30/MWh. Large energy-storage systems could signifi cantly improve the CSP capacity factor and competitiveness. A power tower that has 15-hour storage would provide signifi cant improvement in the utilization factor—up to 80 per cent. However, the costs can be prohibitive at USD 10,500/MW, while the cost of CSP systems with six hours of storage is around USD 7,500/MW (IRENA 2012a).
In India, CSP plants for power generation entail investment costs of million INR 140/MW with a fi xed O&M of about 4 per cent (CERC 2011).
Barriers and Shortcomings
CSP is an expensive technology in comparison to fossil fuel-based technologies with levelized cost of electricity (LCOE) of around INR 18 per unit. Availability of land is another important factor. Also, grid management and costs to be entailed for balance of power are important since these are variable, like in the case of most other renewable technologies. However, as storage technologies (such as molten salt technologies) are made commercially viable, this will change drastically.
ENERGY SUPPLY SOURCES

26
THE ENERGY REPORT– INDIA 100% RENEWABLE ENERGY BY 2050
Industrial Process Heating
It is estimated that 30 per cent of industrial processes require heat below 250°C (Kedare 2006). This can be met through solar air heaters and solar water heaters for temperatures less than 80°C and through solar thermal concentrators for the higher temperatures.
A 160 m2 parabolic concentrator system with a two axes tracking system has been installed at Latur, Maharashtra, for supplying thermal energy (heat) for pasteurizing milk. The Scheffl er dish has also been used for steam generation in industry. A number of such demonstrations are required in different industries for this technology to gain market acceptance.
Solar concentrator technologies could be used for thermal applications in industries with heat requirements of up to 700°C (Kedare 2006). Thus, industries – with the exception of iron and steel, cement and fertilizer –could, in theory, shift to CST-based heating.
In the REN scenario, the model considers an upper limit of 1,460 GW for solar-based power generation, which may be used either for solar CST or PV installations. In the REF scenario, a lower bound is set to refl ect the rate of development as per government plans.
5.2.2 Wind Energy
Of the renewable energy technologies applied to electricity generation, wind energy ranks second only to large hydro, in terms of installed capacity, and is growing rapidly. India is considered one of the most promising countries for wind power development in the world. With 17,700 MW (MNRE 2012b) of installed capacity (as on 30 June 2012), India’s rank in harnessing wind energy is fi fth in the world after the USA, China, Germany and Spain. During 1992-2010, the wind energy installed capacity in India witnessed an annual growth rate of 37 per cent.
According to the MNRE (Ministry of New and Renewable Energy), government of India, the total wind energy installed capacity in India is expected to increase to 32,700 MW in 2017 and to 47,700 MW by 2022. A considerable level of investment will be required over the next 20 years to generate increased volumes of wind-powered electricity. At the same time, raising the contribution of wind in electricity generation will have substantial benefi ts such as reduction of air pollution, increased job creation and economic development in India. It will, thus, provide a signifi cant boost to the Indian economy.
Potential
Various studies have estimated the wind energy potential in India. The fi gures vary considerably due to the different assumptions made during the assessments. MNRE states that the onshore wind energy potential in India is 49 GW at a hub height of 50 m. This is based on an assessment by the Centre for Wind Energy Technology (C-WET),

27
which assumes that 2 per cent of land is available for all states, except the Himalayan states, the North-eastern states and the Andaman and Nicobar Islands. Figure 7 shows the wind power density (W/sq. km) across the country at a hub height of 50 m.
Source: C-WET, 2013.4
As is clear from the map, more than 95 per cent of the nation’s wind energy potential is concentrated in fi ve states—Tamil Nadu, Andhra Pradesh, Karnataka, Maharashtra and Gujarat. The state with the overall largest resource is Karnataka, while the state with largest best quality (speed) resource is Tamil Nadu.
Recently, C-WET conducted a study to analyse the wind energy potential of India at a hub height of 80 m. Assuming a land availability of 2 per cent, it estimated India’s wind energy potential to be 102 GW. Table 1 shows a comparison between the wind energy potentials across states at hub heights of 50 m and 80 m.
4 http://www.cwet.tn.nic.in/html/departments_wpdmap.html, last accessed on 31 October 2013
Figure 7: Wind density
map for India
Source: C-WET, 20134
*agl: above ground level
ENERGY SUPPLY SOURCES

28
THE ENERGY REPORT– INDIA 100% RENEWABLE ENERGY BY 2050
States/UTs Estimated potential (MW)
at 50m ($) at 80m (* #$)
Andaman and Nicobar 2 365
Andhra Pradesh 5,394 14,497
Arunachal Pradesh* 201 236
Assam* 53 112
Bihar - 144
Chhattisgarh* 23 314
Diu and Daman - 4
Gujarat 10,609 35,071
Haryana - 93
Himachal Pradesh* 20 64
Jharkhand - 91
Jammu and Kashmir* 5,311 5,685
Karnataka 8,591 13,593
Kerala 790 837
Lakshadweep 16 16
Madhya Pradesh 920 2,931
Maharashtra 5,439 5,961
Manipur* 7 56
Meghalaya* 44 82
Nagaland* 3 16
Orissa 910 1,384
Pondicherry - 120
Rajasthan 5,005 5,050
Sikkim* 98 98
Tamil Nadu 5,374 14,152
Uttarakhand* 161 534
Uttar Pradesh* 137 1,260
West Bengal* 22 22
Total 49,130 102,788* Wind potential has yet to be validated with actual measurements.
# Estimation is based on mesoscale modelling (Indian Wind Atlas).
$ 2% land availability for all states, except Himalayan andNorth-eastern states, Andamanand Nicobar Islands and poor windy states, has been assumed. In other areas, 0.5% land availability has been assumed.
Source: C-WET, 2013.5
The Low Carbon Working Group (government of India) for the Twelfth Five-year Plan states that the onshore wind energy potential of India is 500 GW at a hub height of 80 m. The Working Group considered studies which assume that 6 per cent of the land in the country is available for wind energy development.
5 http://www.cwet.tn.nic.in/html/departments_ewpp.html, last accessed on 31 October 2013
Table 1:State-wise wind
energy potentials
Source: C-WET, 20135

29
According to the analysis by the Lawrence Berkeley National Laboratory (LBNL), about 7 per cent of the country’s land can be considered suitable for wind energy development (LBNL 2012). This excludes land with low-quality wind, slopes greater than 20 degrees, elevation greater than 1,500 m and certain other unsuitable areas such as forests, waterbodies and cities. As per LBNL’s fi ndings, the techno-economic onshore wind potential ranges from 2,006 GW at a hub height of 80 m to 3,121 GW at a hub height of 120 m, with a minimum capacity factor of 20 per cent (LBNL 2012). The potential at high-quality wind energy sites alone – i.e., a hub-height of 80 m with a minimum capacity factor of 25 per cent – is 543 GW (LBNL 2012).
Although 6-7 per cent of the country’s land is a large area and bringing it under wind farms would pose a challenge, it is worthwhile to notice that the actual land requirement for construction would be much lower and that land could, simultaneously, be used for other purposes such as agriculture and cattle grazing.
The different potentials for onshore wind energy brought out by various studies are summarized in Table 2.
Source Estimatedpotential (GW)
Hub height (m)
Other assumptions
C-WET 49 50 2% land availability for all states except Himalayan states, North-eastern states and Andaman and Nicobar IslandsC-WET 102 80
LBNL 2,006 80 Based on GIS data on topography and land use, the study found a signifi cantly high availability of land (7%) that can potentially be used for wind power development.
The study excluded land with low-quality wind, slopes greater than 20 degrees, elevation greater than 1,500m and certain other unsuitable areas such as forests, water bodies and cities.
LBNL 3,121 120
Low Carbon Working Group (Twelfth Five-year Plan)
500 80 6% land availability
Along with the huge onshore wind energy potential, India owing to its long coastline –has immense offshore potential as well. However, no formal study has been undertaken by the government to assess this potential. Xi Lu et al. (2009) estimated India’s offshore potential to be 502 GW. However, Xi Lu et al. (2009) focused on global wind energy potential, thus, their assessment does not include some key factors important in the estimation of wind potential in India.
Table 2: Onshore
potential of wind power
in India
ENERGY SUPPLY SOURCES

30
THE ENERGY REPORT– INDIA 100% RENEWABLE ENERGY BY 2050
According to Indian Wind Energy Outlook 2011, “A long coastline and relatively low construction costs could make India a favoured destination for offshore wind power.” Appreciating these factors, the government of India has decided to explore ways to tap the offshore wind energy potential.
Technology
The main technology associated with harnessing wind energy is the wind turbine, which comprises the tower, blades, rotor hub, nacelle and components inside the nacelle. The wind turns the blades of the wind turbine, and the rotating blades turn the shaft attached to the blades. The moving shaft can either power a pump or turn a generator, which can generate electricity.
Wind turbines vary in sizes and styles. They can be differentiated on the basis of axis orientation –horizontal axis wind turbine (HAWT) or vertical axis wind turbine (VAWT) – and on the basis of site-specifi cdesign—for an onshore or offshore site. Today, the three-blade HAWT with a hub height of 80-100 m is the most common turbine around the world.
Over the course of two decades, there has been tremendous growth in the capacity of wind turbines. Initially, wind turbines were designed with a low capacity of 10-30 kW. At present, India produces units varying from 250 kW to 2,500 kW. Wind turbines have also grown larger and taller. The generators in the largest modern turbines are 100 times the size of those in 1980. Over the same period, rotor diameters have increased eight fold. Table 3 shows the development in the size of wind turbines over the years.
1980 1985 1990 1995 2000 2007
Nominal power (kW) 30 80 250 600 1,500 5,000
Rotor diameter (m) 15 20 30 46 70 115
Hub height (m) 30 40 50 78 100 120
Modern wind technology is able to operate effectively at a wide range of sites—sites with low and high wind speeds, deserts and freezing arctic climates. Wind farms operate with high availability factor and are generally well integrated with the environment.
Performance and Costs
Like most other renewable energy technologies, the economics of wind power constitutes the following factors:
Investment cost
Operation and maintenance cost
Capacity factor
Economic life
In India, the capital cost for a wind energy system ranges between million INR 55-60/MW. The capital cost of offshore wind power presently is about double that of an
Table 3: Turbine
development trend
Source: Goyal, M., 2010

31
onshore system. This is primarily due to the high foundation and installation costs, cost of laying cables, cost of transporting turbines, etc. Operation and maintenance costs typically account for 1.5-4 per cent of total investment costs of current wind power systems. Another important fact of wind energy is that O&M costs are not evenly distributed over a period of time. They tend to rise as the length of time from commissioning increases. This is due to an increasing probability of component failures (IRENA 2012b).
The average capacity of wind turbines in India today is 20 per cent and projected to increase to 30 per cent by 2031. This has improved considerably over the past decade from 14 per cent. With re-powering, new onshore wind turbines in Europe have increased capacity factors from below 20 per cent in the 80's to 35 per cent and more today at same locations. The capacity factor of an offshore wind turbine is usually higher than that of an onshore one ranging from 40 per cent to 50 per cent. New technologies are said to increase the load effi ciency in future.
Barriers and Shortcomings
Keeping this enormous and yet-to-be-explored potential in mind, both the government and private companies have been progressively working to develop this sector. Wind energy is the fastest growing renewable energy sector in the country. Over the past fi ve years, it has grown at a rate of 17 per cent per annum. However, it still faces certain limitations, especially with regard to the level of infrastructure and policies in various states. The following are certain barriers that need to be overcome for greater growth of wind energy in the nation.
1. Absence of clear policy framework and problems related to fi nancing and poor grid integration
2. Restrictions on siting and construction, as wind turbines have to be located in areas of good wind speed and quality
3. Since winds do not blow strongly enough to produce power all the time, energy from wind is considered “intermittent”. Therefore, electricity from wind machines must have a back-up supply from another source. And as wind power is “variable”, utility companies can use it for only part of their total energy needs.
4. Wind towers and turbine blades are subject to damage from high winds and lightning. Rotating parts, which are located high off the ground, can be diffi cult and expensive to repair.
5. Land availability could be a constraint in the case of high deployment of wind power in India.
In the REF scenario, the C-WET potential of 102 GW of onshore wind energy is assumed to be achieved by 2050 and is set as a hard constraint in the model with constant growth. In the REN scenario, the most optimistic potential of 3,121 GW has been considered. The REF scenario does not include any offshore wind energy development. For the REN scenario, offshore wind energy is allowed to grow to 5 GW by 2036, reaching the maximum estimated potential of 500 GW by 2051.
ENERGY SUPPLY SOURCES

32
THE ENERGY REPORT– INDIA 100% RENEWABLE ENERGY BY 2050
5.2.3 Hydropower
Hydroelectric power (hydropower) is a renewable source, but it has environmental and social impacts. Large hydropower projects involve the use of dams, which by their nature dramatically alter an otherwise free-fl owing river by storing water and releasing it (either through generation or spill), usually in a controlled manner. Power is obtained by harnessing the kinetic energy of water running through a turbine, and converting it to electricity by coupling the turbine to an electric generator. While these dams do not consume fossil fuels, they alter ecosystems and affect wildlife and the people who depend on that water. The effects include, but are not limited to, changes to water temperature, dissolved oxygen levels and other water-quality parameters; decline in river species; increased erosion along riverbanks and altered sediment transport.
Hydropower projects are classifi ed on the basis of their generation capacity. The classifi cations follow.
Pico: 5 kW and below
Micro: 100 kW and below
Mini: 2,000 kW and below
Small: 25,000 kW and below
Medium: 100,000 kW and below
Large: above 100,000 kW
Small hydro projects or run-of-the-river projects do not involve building of dams and have little environmental impacts. In India, medium and smaller hydro projects are under the purview of the MNRE while large hydro projects are under the Central Electricity Authority (CEA). There is signifi cant potential for large hydro projects in the country; the potential for medium and small hydro projects is lesser in comparison.
Potential
The potential for hydropower is estimated to be 148 GW for large hydropower and another 15 GW for small hydropower (SHP). At present, there are about 5,718 potential SHP sites with an aggregate capacity of 15,384 MW in the country, as identifi ed by the MNRE, various state governments and the private sector (MNRE 2012b). In addition, 56 pumped storage projects have also been identifi ed with a probable installed capacity of 94 GW.
The assessed and developed installed hydropower capacity, by river, is given in Figure 8.

33
Source: CEA, 2013.6
As is evident, the Brahmaputra and Indus rivers have the highest potential. Only 11 per cent of Brahmaputra’s assessed potential and 50 per cent of Indus’s has been utilized so far.
The total power generation from India’s large hydro projects was 39.3 GW as on 1 April 2012. Though large hydropower projects constitute 20.1 per cent of India’s total electricity generation capacity, they produce only between 9 per cent and 14 per cent of the electricity generated by all power projects in India.
As on 31 March 2012, SHP plants with a total capacity of 3,421 MW had been set up in various parts of the country (MNRE 2012b). A total of 261 private-sector SHP projects had been set up with an aggregate capacity of 1,326 MW. In addition, 270 projects of about 914 MW were in various stages of implementation.
Technology
Hydropower plants provide at least 50 per cent of the total electricity supply in more than 60 countries (IEA 2011a). In additional to hydroelectric power, dams can provide other services, such as fl ood control, irrigation, potable water reservoirs and recreational opportunities, if sited and operated in a responsible manner. Hydroelectric power falls into two broad categories: conventional and pumped storage. Most conventional hydropower projects consist of a dam built on a river. Some conventional hydropower projects are described as run-of-the-river (ROR). These ROR projects are smaller in size; have a smaller, or no, reservoir; and are most often placed downstream of large hydropower projects.
6 http://www.cea.nic.in/reports/hydro/he_potentialstatus_basin.pdf last accessed on 31 Octo-ber 2013
Figure 8: Large hydro:
assessed and developed
installed capacity (in
MW)
Source: CEA, 20136
Brahmaputra
ENERGY SUPPLY SOURCES

34
THE ENERGY REPORT– INDIA 100% RENEWABLE ENERGY BY 2050
Pumped storage plants consist of two or more natural or artifi cial (dams) reservoirs at different heights. When electricity generation exceeds the grid demand, the energy is stored by pumping water from the lower reservoir to the higher reservoir. During periods of peak demand, water fl ows back to lower reservoir through the turbine, thus generating electricity.
Over the past decades, no major breakthrough has occurred in the basic machinery; however, advancement of computer technology has led to signifi cant improvements in many areas, such as monitoring, diagnostics, protection and control.
Performance and Costs
The existing hydropower is one of the cheapest ways to generate electricity. Most plants were built a long time ago, and the initial investment for the dams and hydrogeological infrastructure has been fully amortized. After the amortization, the remaining costs are associated with operation and maintenance and possible replacement of the main machinery after several decades of operation. Small hydropower plants may be operated for some 50 years without substantial replacement costs.
Hydropower fi ts particularly well with solar and wind power. During droughts, solar can compensate for hydro reductions. Dams can store electricity when there is a lot of sun and/or wind and release their capacity when there is less sun/wind. Pumped storage is a good back-up.
Hydropower investment costs for new installations vary considerably between industrialized and developing countries. The construction of hydropower plants usually involves substantial civil work (dams, deviation of rivers, etc.), the cost of which largely depends on labour costs, and labour costs are substantially lower in developing countries than in industrialized countries. The cost of pumped storage systems also depends strongly on the site confi guration and on the operation service. Its investment cost may be up to twice as high as an equivalent un-pumped hydropower system. The cost is also exceedingly dependent on the location and the acceptability of the project, and considering a blanket cost may result in underestimations in particular cases.
In India, the cost of medium and large hydro projects is around million INR 65/MW, whereas the cost of small hydro projects comes to around million INR 100/MW. O&M costs are estimated between 1.5 per cent and 2.5 per cent of the investment cost per year (IEA 2010).
Barriers and Shortcomings
Large hydropower projects can be controversial because they physically transform rivers, inundate valuable ecosystems, involve relocation of populations, require large electricity transmission infrastructure, are expensive, often result in poorer water quality and contribute to a decline in the number of fi sh and other life-sustaining animals. Often, public acceptance of such projects is low, in part, due to the high cost, resettlement issues and the physical damage that occurs to the river. In addition, the processes involved like getting government approval, meeting the stringent

35
environmental standards and even conducting initial studies can take a long time. While increasing energy supply from hydropower does not require technological breakthroughs, signifi cant R&D, capital investment and governmental support are required to improve technology. Looking toward the future, the effects of climate change on water availability and water fl ow are likely to affect hydropower generation.
Environmental consequences of large dams are both indirect and direct. Dams change the ecology of the river – and the lives of the people who depend on it – by altering the physical, chemical and biological conditions of rivers. Dams prohibit the migration of fi sh species. Interrupting the life cycles of fi sh can be detrimental to those who rely on this vital protein source for their sustenance. By trapping sediments, dams hamper the development and maintenance of deltas and other coastal barriers. Changes in temperature and oxygen levels also occur, making rivers and reservoirs uninhabitable for species that have adapted to natural conditions. If these impacts cannot be avoided, they should be minimized and mitigated.
In the model in this study, large hydropower is assumed to grow at its current rate of development and, thus, achieves its maximum potential of 148 GW by 2046 in all scenarios. Small hydropower also follows its current growth trend achieving its maximum potential of 15 GW by 2031 in all scenarios. However, in reality, this may not be achieved in the REF scenario due to other non-technical barriers.
5.2.4 Ocean Energy
Oceans offer renewable sources of energy in many forms, such as waves, tides and thermal gradients. Several advancements, worldwide, have been made toward harnessing the mechanical energy from waves and tides and thermal gradients for various applications.
Tidal Energy
India has a long coastline with estuaries and gulfs, where tides are strong enough to move turbines for electrical power generation. The fi rst tidal power project with a capacity of 3.75 MW is being set up by the West Bengal Renewable Energy Development Agency (WBREDA) in collaboration with the National Hydroelectric Power Corporation (NHPC) Ltd at Durgaduani Creek in the Sunderbans. The government of Gujarat has launched the Kalpasar Project, which involves building a 30-km-long dam, i.e., a 2,000km2 fresh water reservoir, on the Gulf of Khambhat between Dahej (east) and Bhavnagar (west). CEA had conducted a preliminary study of various locations in the Andaman and Nicobar Islands during 1992. The report indicated that tidal power generation would be feasible at some locations, but it may not be commercially viable due to the cost of diesel. To develop and harness tidal energy for power generation, the MNRE is implementing a programme that promotes R&D activities in the fi eld of tidal energy. The government of India aims to build 7 MW of grid-connected ocean tidal power plants during the Twelfth Five-year Plan period.
ENERGY SUPPLY SOURCES

36
THE ENERGY REPORT– INDIA 100% RENEWABLE ENERGY BY 2050
Potential
Suitable locations for tidal energy development are the Gulf of Khambhat and the Gulf of Kachchh on the west coast, where the maximum tidal range is 11 m and 8 m, respectively, with an average tidal range of 6.77 m and 5.23 m, respectively. The Ganges Delta in the Sunderbans, West Bengal, also has good locations for small-scale tidal power development. The maximum tidal range in the Sunderbans is about 5m, with an average tidal range of 2.97 m.
The identifi ed economic tidal power potential in India is 8,000-9,000 MW, with about 7,000 MW in the Gulf of Khambhat, about 1,200 MW in the Gulf of Kachchh and less than 100 MW in the Sundarbans.7
Technology
Tidal power is based on two technologies:
Tidal barrage power: Tidal barrage power is a relatively well-known technology based on capturing seawater with a barrage when the tide is high, then letting the water fl ow through hydro-turbines when tide is low. There are also alternative operation modes. Unfortunately, the number of coastal sites where tidal barrages are economically and environmentally feasible are very limited. This is because a mean tidal range of at least 4.5 m is required for economical operation. For example, it has been estimated that a tidal barrage at the Severn site in the UK could provide an electrical capacity ranging from 2 GW to 8.6 GW under the most favourable conditions. At present, there are only a small number of plants in operation worldwide– including the 254 MW Sihwa Tidal Power Plant in South Korea – with a combined capacity of roughly 500 MW (IEA 2010).
Tidal stream power: Tidal stream power can be considered a technology under demonstration.
Barriers and Shortcomings
The costs and environmental problems involved with barrage systems make them less attractive than some other forms of renewable energy. Global estimates put the price of generation at 13-15 cents/kWh (Indian estimates are not available). The disadvantages of using tidal and wave energy must be considered before jumping to the conclusion that this renewable, clean resource is the answer to all our problems. While the main detriment is the high cost of these plants, the modifi cation of the ecosystem at the bay (like reduced fl ushing, winter icing and erosion) can change the vegetation of the area and disrupt its balance. Barrages may also block outlets to open water. Although locks can be installed, this is often a slow and expensive process. Barrages affect fi sh migration and other wildlife. Many fi sh, such as salmon, swim up to the barrages and are killed by the spinning turbines. Barrages may also destroy the habitat of the wildlife living near it. Although fi sh ladders may be used to allow passage for the fi sh, these are never 100 per cent effective.
7 Details available at <http://www.mnre.gov.in/schemes/new-technologies/tidal-energy/>, last accessed on 16 August 2012

37
Similar to other ocean energies, tidal energy has several prerequisites that make it available only in a small number of regions. For a tidal power plant to produce electricity effectively (at about 85 per cent effi ciency), it requires a basin or a gulf that has a mean tidal amplitude (the differences between spring and neap tide) of 7 m or above. It is also desirable to have semi-diurnal tides, where high tides and low tides occur twice every day. A barrage across an estuary is highly expensive to build and affects a very wide area—it changes the environment for many miles upstream and downstream. For instance, barrages alter mudfl ats, negatively affecting birds which rely on tides to uncover the land so that they can feed. There are few suitable sites for tidal barrages. Also, these systems provide power for around 10 hours only each day, when the tide is actually moving in or out. Present designs do not produce a lot of electricity.
In the model, a total of 7 MW of tidal energy is installed by the end of the Twelfth Five-year Plan (2016) in both scenarios. In the REF scenario, capacity addition is assumed at similar level thereafter. In the REN scenario, a potential of 9 GW is assumed to be achieved by 2051, with the introduction of 7 MW of capacity in 2016.
Wave Energy
Wave energy deployment for commercial power generation is still being developed globally. However, installations have been built or are under construction in a number of countries, including Scotland, Portugal, Norway, USA, China, Japan, Australia and India. The world’s fi rst commercial wave energy plant, with a capacity of 0.5 MW, was developed by WaveGen and is located in Isle of Islay, Scotland8.
Potential
Primary estimates indicate that the annual wave energy potential along the Indian coast is between 5 MW/m and 15 MW/m, thus the theoretical potential for a coastline of nearly 7,000 km works out to 40,000 - 60,000 MW. However, the realistic and economical potential is certainly considerably lower than this estimation.
Technology
Wave energy projects can be grouped on the basis of their working principle as follows:
Float or buoy systems: These systems use the rise and fall of ocean swells to drive hydraulic pumps. The object can be mounted to a fl oating raft or to a device fi xed on the ocean bed. A series of anchored buoys rise and fall with the wave. The movement is used to run an electrical generator that produces electricity, which is then transmitted ashore via underwater power cables.
Oscillating water column devices: In these devices, the in-and-out motion of waves at the shore enters a column and forces air to turn a turbine. The column fi lls with water as the wave rises and empties as it descends. In the process, air inside the column is compressed and heats up, creating energy. This energy is harnessed and sent to the shore via electrical cable.
8 Details available at <http://www.oceanenergycouncil.com/index2.php?option=com_content&do_pdf=1&id=10>
ENERGY SUPPLY SOURCES

38
THE ENERGY REPORT– INDIA 100% RENEWABLE ENERGY BY 2050
Tapered channel: These systems rely on a shore-mounted structure to channel and concentrate the waves, driving them into an elevated reservoir. The water that fl ows out of this reservoir is used to generate electricity through standard hydropower technologies.
According to Rodrigues (2005), if issues such as material corrosion and implications for fi shing are addressed, wave power could become commercial around 2020, with an estimated investment cost of €5,000-6,000/kW, and a potential capacity of about 7,000 MW.
Barriers and Shortcomings
Wave energy is variable like tidal energy. Tidal energy generation systems are also fairly expensive; similarly, global estimates put the price of power generation from waves at 15-17 cents/kWh (Indian cost estimates are not available). Suitability of sites is another consideration, as wave energy projects need to be installed in locations where waves are consistently strong. These systems must also be able to withstand very rough weather.
Performance and Costs
The harsh marine environment and the nascency of marine energy technologies make the estimates of investment and O&M costs for this sector highly uncertain. For wave and tidal power, the capacity factor is typically between 30 per cent and 40 per cent of the rated power. The investment cost of tidal stream power is reported to be between USD 6,000/kW and USD 7,800/kW, while the investment cost of wave power is currently between USD 6,800/kW and USD 9,000/kW. Governmental policies and fi nancial incentives are, therefore, needed for these technologies to take off in the current market (IEA 2010).
For this study, however, wave technology has not been considered, given the limited potential in India. Also, although ocean energy technologies may be promising a power generator in the future, their development is still far from allowing their commercial use. This is due to the technological complexities, sea conditions and the diffi culty of interconnection and transmission of electricity through turbulent waterbodies. Besides, the vulnerability of aquatic systems to these technologies is also a major issue of concern. While tidal energy systems have made some advancement toward commercial exploitation, wave and ocean thermal energy conversion (OTEC) are still in the R&D phase, with several pilot projects being installed in potential sites.
Wave energy has not been considered in the model since the government lacks even directional plans for it. Also, wave energy has limited potential in comparison to the overall demand of the economy.
5.2.5 Geothermal Energy
Heat energy continuously fl ows to the Earth’s surface from its interior, where the temperature at the core is about 6,000°C. The outward transfer of heat occurs by means of conductive heat fl ow and convective fl ows of molten mantle beneath the earth's

39
crust. This results in heat fl ux at the Earth's surface. This heat fl ux, however, is not distributed uniformly over the surface; rather, it is concentrated along active tectonic plate boundaries, where volcanic activity transports high-temperature molten material to the near surface.
Geothermal energy is an enormous, under used heat and power resource that is clean, reliable (average system availability of 95 per cent), import independent (reducing dependence on foreign oil) and can be used very effectively in both on- and off-grid developments, and is especially useful in rural electrifi cation schemes. Its use spans a large range—from power generation to direct heat uses, the latter possibly using both low temperature resources and “cascade” methods. Cascade methods utilize the hot water remaining from higher temperature applications (e.g., electricity generation) in successively lower temperature processes, which may include binary systems to generate further power and direct heat uses (space heating, including district heating; greenhouse and open ground heating; industrial process heat; agricultural drying; etc.).
Potential
According to Chandrasekharam (2000), the total geothermal potential of India is 10,600 MW. This potential is distributed across the country in various geothermal provinces characterized by high heat fl ow (from 78 MW/m2 to 468 MW/m2), thermal gradients discharge (from 47oC/km to 100oC/km) and thermal springs.
In the 1970s, the Geological Survey of India conducted a reconnoitre survey of the geothermal resources in the country, in collaboration with the UN, and reported the results in several of its records and special publications (GSI 1987; GSI 1991). Subsequently, detailed geological, geophysical and tectonic studies on several thermal provinces and geochemical characteristics of the thermal discharges and reservoir temperature estimations have been carried out. These investigations have identifi ed several sites that are suitable for power generation well as for direct use.
In 2009, the global geothermal power capacity was 10.7 GWe and generated nearly 67.2 TWhe/yr of electricity, at an average effi ciency rate of 6.3 GWh/MWe (Bertani 2010). The USA, the Philippines and Indonesia are the top three geothermal-power-producing countries.
The geothermal provinces of India are detailed in Figure 9.
ENERGY SUPPLY SOURCES

40
THE ENERGY REPORT– INDIA 100% RENEWABLE ENERGY BY 2050
Technology
Geothermal power generation is currently based on fi ve technology options that are briefl y illustrated as follows.
Dry steam plants: The conversion devices consist of geothermal steam turbines that are designed to make effective use of the comparatively low-pressure and high-volume fl uid produced in such conditions. Dry steam plants commonly use condensing turbines. The condensate is re-injected (closed cycle) or evaporated in wet cooling towers. A typical geothermal plant’s capacity is 50-60 MW, but more recently 110 MW plants have been commissioned and are currently in operation.
Figure 9: Geothermal
provinces in India
Source: Chandrasekharam, 2000

41
Flash plants: As is the case with dry steam plants, geothermal fl ash plants are used to extract energy from high-enthalpy geothermal resources in which, however, the steam is obtained from a separation process—fl ashing.
Binary plants: Binary plants are usually applied to low- or medium-enthalpy geothermal fi elds where the resource fl uid is used, via heat exchangers, to heat a process fl uid in a closed loop. In binary plants, exhaust resource fl uids are often re-injected in the fi eld along with all the original constituents. Therefore, these plants are true zero-discharge technologies.
Combined-cycle or hybrid plants: Recent geothermal plants in New Zealand and Hawaii use a traditional Rankine cycle on the top end and a binary cycle on the bottom end. Using two cycles in series provides a relatively high electric effi ciency. The size of typical combined-cycle plants ranges from a few megawatts to 10 MW.
Geothermal combined heat and power: Geothermal combined heat and power (CHP)from medium-enthalpy sources, using organic Rankine cycles and a low-temperature boiling process fl uid, is cost effective if there is suffi cient demand for heat production (e.g., district heating). In general, CHP plants are economically viable and largely used in (northern) Europe, where demand for space heating is signifi cant and constant over the year. The size of a typical CHP plant ranges from a few megawatts to 45 MW.
Performance and Costs
The levelized generation costs of geothermal power plants vary widely. On an average, production costs for hydrothermal high-temperature fl ash plants have been calculated to range from USD 50/MWhe to USD 80/MWhe. Production costs of hydrothermal binary plants vary, on an average, from USD 60/MWhe to USD 110/MWhe (assumptions behind cost calculations are included in Appendix A.1). The recent development of a binary plant of 30 MW in the USA showed estimated levelized generation costs of USD 72/MWhe, with a 15-year debt and 6.5 per cent interest rate (IEA 2010). Annual O&M cost is around 3.5 per cent of the investment cost. For geothermal CHP, the investment cost is around USD 10,000/kW, which is more expensive than the “power only” option mentioned above but offers the possibility of increasing the overall effi ciency and generating additional income from heat supply. In this case, the O&M cost is USD 250/kW per year. For geothermal heating, the average investment cost is USD 1,800/kW, the O&M cost is around USD 35/kW per year.
In the India-specifi c study, however, given the limited potential as well the lack of any currently operational projects which might give an idea of India-specifi c prices, international prices have been used and cost reduction has not been considered, as provided in the appendix.
Barriers and Shortcomings
Large-scale geothermal power development is currently limited to tectonically active regions, such as areas near plate boundaries, rift zones and mantle plumes or hotspots. These active, high heat-fl ow areas include countries around the “Ring of Fire” (Indonesia, the Philippines, Japan, New Zealand, Central America, and the western
ENERGY SUPPLY SOURCES

42
THE ENERGY REPORT– INDIA 100% RENEWABLE ENERGY BY 2050
coast of the USA) and the rift zones (Iceland and East Africa). These areas are most promising for geothermal developments in the next decade (IEA 2008). In India, the potential for geothermal energy is however much less, given the lack of such volcanic activity in the mainland. In general, geothermal energy faces two crucial barriers:
Drilling: Although the cost of generating geothermal power has decreased by 25 per cent during the last two decades, exploration and drilling remain expensive and risky. Drilling costs alone account for as much as one-third to half of the total cost of a geothermal project. Locating the best resources can be diffi cult, and developers may drill many dry wells before they discover a viable resource. Because rocks in geothermal areas are usually extremely hard and hot, developers must frequently replace drilling equipment. Individual productive geothermal wells generally yield between 2 MW and 5 MW of electricity; each may cost from USD 1 million to USD 5 million to drill. A few highly productive wells are capable of producing 25 MW or more of electricity.
Transmission: Geothermal power plants must be located at specifi c areas near a reservoir because it is not practical to transport steam or hot water over distances greater than two miles (3.2 km). Since many of the best geothermal resources are located in rural areas, developers may be limited by their ability to supply electricity to the grid. Consequently, any signifi cant increase in the number of geothermal power plants will be limited by those plants’ ability to connect, upgrade or build new lines to access the power grid and whether the grid is able to deliver additional power to the market.
In the model, 7 MW of geothermal energy is assumed to be installed by the end of the Twelfth Five-year Plan (2017) in both scenarios. In the REF scenario, similar capacity additions are considered thereafter. In the REN scenario, a maximum potential of 10.6 GW is assumed to be achieved by 2051, with its introduction in 2016.
5.2.6 Waste-To-Energy
Owing to a large urban population and rising consumption and disposal levels, the generation of municipal solid waste (MSW) in India is signifi cant. The 5,100 municipalities across India generate around 115,000 tonnes of waste per day. Although not a renewable energy per se, waste-to-energy (W2E) could help mitigate solid waste pollution by using waste for energy generation, particularly in large cities.
MSW is a highly variable and heterogeneous, multi-component material which varies both seasonally and geographically. Bulk of this waste is dumped in the open in an uncontrolled manner, resulting in the pollution of waterbodies and land and causing uncontrolled emissions of methane.
By adopting environment-friendly W2E technologies for treating and processing wastes before disposal, this problem can be signifi cantly mitigated. W2E is a viable option for waste reduction as well as electricity generation. It also improves the quality of waste to conform to the required pollution control standards.
Internationally, W2E projects generally include those based on incineration, or thermal technologies. Recently, the process of anaerobic digestion for the recovery of

43
energy from MSW and segregated biodegradable wastes and residues has also gained prominence in several European countries. It should be noted, that the calorifi c value of MSW is derived mostly from plastics and paper-derived products, such as cardboard. Typical and “renewable” organic waste usually leads to a deterioration of MSW power plants because of its high water content.
Potential
In the Indian context, out of the total MSW generated, 50 per cent is organic fraction. Based on the performance of Indian W2E projects operating in Hyderabad, Vijaywada and Lucknow, it may be assumed that at least 150 tonnes of waste per day would be required to operate a 1 MW plant and for the project to be technically viable. Hence, cities that produce a minimum of 300 tonnes of MSW per day would be candidates for W2E projects. The current estimated potential for W2E in India is around 3 GW, which could increase to a maximum potential of 7 GW by 2031 (MNRE 2012b).
Technology
Many technologies can be used to derive energy from municipal solid waste. These technologies are well-developed and have been in long-term operation in full-scale plants. Some of these technologies include:
Incineration: This process is also known as “combustions” and has been a traditional technology for treating waste and recovering energy. Under this process organic wastes can be directly incinerated with minimal pre-processing. Incineration has been used successfully for the disposal of various waste products including MSW, sludge, liquid waste, agricultural waste and various industrial wastes.
Bio-methanation: Degradation of organic wastes can take place in the presence as well as absence of oxygen. When this happens in the absence of oxygen, or anaerobically, the process is called bio-methanation. MSWs contain both organic and inorganic matter. The bio-methanation of organic matter results in the production of biogas, which contains methane, carbon dioxide and traces of other gases. Anaerobic processes can take place in a reactor, covered lagoon or landfi ll in order to recover the methane gas for the generation of energy. These processes are among the most mature processes and convert waste to energy effi ciently. W2E processes can be used to achieve the following goals.
• Pollution prevention
• Reduction of uncontrolled GHG emission
• Recovery of bioenergy
• Production of stabilized residue for use as fertilizers
Refuse-derived Fuel (RDF) method: In this method, solid waste is mechanically processed to produce a more homogeneous fuel that can be stored and transported with greater ease than unprocessed heterogeneous waste. RDF can be used in a dedicated boiler or in conjunction with other fossil fuels in large industrial or utility boilers.
ENERGY SUPPLY SOURCES

44
THE ENERGY REPORT– INDIA 100% RENEWABLE ENERGY BY 2050
Gasifi cation and pyrolysis: The concepts of gasifi cation and pyrolysis have been around for quite some time. Pyrolysis involves combustion in the absence of air, while gasifi cation involves partial combustion. The advantage of this technology is that unlike incineration, where signifi cant investments need to be made for cleaning fl ue gas streams, pyrolysis produces more concentrated gas, which can be cleaned in signifi cantly lower-volume equipment.
Of these technologies, only bio-methanation and RDF projects have proven to be commercially viable in both international and national markets. Hence, in the study only these two methods have been considered.
Performance and Costs
Waste-to-energy projects provide a benefi cial way to dispose of waste. As mentioned earlier, only bio-methanation and RDF projects may be considered as fi nancially viable for India. In the case of bio-methanation, the plant capacity may be dictated by the availability of waste in the city. For a small city producing 300 tonnes of waste per day, a 3 MW plant may suffi ce; for a medium-sized city producing around 500 tonnes of waste per day, a 5 MW plant would suffi ce. For large cities, like Delhi and Mumbai, plants with a capacity of 10 MW, utilizing 1,000 tonnes of MSW per day, would be suitable.
In the case of the RDF method, it is necessary to operate plants at a certain scale, and operating them in small cities would not be feasible. It would be economical only in a city that produces 500-700 tonnes of waste per day and would require a plant capacity of 6-7 MW. The capital cost of RDF plants is around INR 90 million/MW (TERI 2008).
Barriers and Shortcomings
There are several barriers to theW2E technology. The primary barrier seems to be that urban local bodies in most of the cities are unable to segregate waste at the source, which is a must for any waste-processing option, be it composting or waste-to-energy. In such cases, projects need to invest in mechanical segregation infrastructure. This raises the cost of the projects and, in many instances, makes them unviable.
There is also the important component of public perception—there is low acceptance of specifi c processes like waste incineration, which is thought to have a negative effect on the health of those in the vicinity.
Another deterrent exists, that is, the corrosion and fouling of the boiler and the wear of refractory material in combustion processes, caused mainly by halogens phosphates and alkali compounds. So, high maintenance expenditures are required.
Finally, on the technology side, although the fundamentals of the implemented technical processes are well-known, process control, eco-effi cient cleaning of off-gas and the management of residues are still not easy tasks. Numerous technologies exist to clean off-gas from the combustion and pyrolysis processes.

45
In the model, it is assumed that 500 MW of W2E capacity will be installed by end of the Twelfth Five-year Plan period (2016) in both scenarios. In the REF scenario, similar capacity additions are considered thereafter. In the REN scenario, waste-to-energy reaches a maximum potential of 7 GW by 2051.
5.2.7 Biomass
As a renewable energy source, biomass is most equitably distributed, when compared with other sources as it does not need any conversion technology for the basic uses of cooking and lighting. The potential for energy from biomass depends primarily on land availability, water regime and soil conditions. In 2009, the amount of land devoted to growing energy crops for biomass fuels was only 0.19 per cent of the world’s total land area and only 0.5-1.7 per cent of the global agricultural land (Ladanai and Vinterbäck 2009). Agricultural residues are the primary source of biomass. Large amounts of agro-residues are used by briquetting industries. Agricultural residues are also utilized for thermal use in industries like brick/lime/pottery kilns, industrial dryers, ovens, furnaces and boilers.
The MNRE has planned to initiate the National Bioenergy Mission during the Twelfth Five-year Plan, in association with the state governments, public and private sectors and other stakeholders to promote ecologically sustainable development of bioenergy to address the country’s energy security challenge. The mission aims at creating a policy framework for attracting investment and fuelling the rapid development of the commercial biomass energy market, based on utilizing surplus agro-residues and developing energy plantations in different parts of India. This will also constitute a major contribution by India to the global effort to address the challenges of climate change.
Potential
The estimation of biomass potential constitutes the assessment of the theoretical potential of biomass and the available potential of biomass. The different methodological approaches used to estimate biomass potential are: mass fl ow analysis, market models and land use models (including remote sensing and GIS). India is very rich in biomass and has a potential of about 16,881 MW from agro-residues and plantations and 5,000 MW from bagasse cogeneration (Solanki et al. 2012). However, the installed capacities of biomass cogeneration and agro-residue are 1.2 GW and 0.9 GW, respectively (MNRE 2012b).
The quantity of agricultural residue varies with the type of crop and is driven heavily by seasons, soil types and irrigation conditions. If the amount of crop production is known, then it may be possible to estimate the amounts of agricultural residues produced via the application of the residue to crop ratio (Vimal and Tyagi 1984). As science and technology progress, there are bound to be developments in farming techniques that will, in turn, change the availability of agricultural residues with time.
ENERGY SUPPLY SOURCES

46
THE ENERGY REPORT– INDIA 100% RENEWABLE ENERGY BY 2050
Table 4: Current use of agri-residue (in million tonnes)9
Crop 2010
Fodder Fuel Other
Rice 124.7 17.2 12.4
Wheat 97.3 0 15.3
Jowar 14.0 0 0
Bajra 14.7 0 1.7
Maize 28.4 6.7 0
Other Cereals 7.4 0 0
Red Gram 0 9.4 2.6
Gram 0 8.8 0
Other pulses 0.6 7.7 7.6
Ground nut 0 1.9 12.7
Rapeseed and Mustard 0 13.3 0
Other oil seeds 0 29.8 0
Cotton 0 55.9 0
Jute 0 17.6 0
Sugarcane 13.2 45.7 52.7
Total 300.3 214 105
Table 4 indicates that nearly half of the agricultural residue available is used as fodder for livestock, about 20 per cent is used for fuel production, while the rest is consumed for other purposes. Thus, most of the agri-residue gets utilized as fodder and the remaining portion is too little for the suffi cient production of biomass. This poses a major challenge in the production of biomass-based energy.
The availability of crop residues is, more or less, spread evenly over the year. So, crop residues of one kind or the other are available throughout the year.
Technologies
Classifi cation of biomass-based renewable energy technologies can be done in the following manner: traditional, improved and modern. Traditional technologies are ineffi cient and cause indoor air pollution, leading to various respiratory tract diseases; improved technologies are preferred to traditional ones as they take care of these aspects, with the installation of chimneys in domestic appliances or by the conversion of traditional fuel into less polluting fuel like charcoal, biogas, etc. Modern technologies like biomass gasifi ers and liquefi ed fuels exhibit more potential for future use. Small-capacity gasifi er designs are now available for thermal applications. The technology has been disseminated for a large number of applications like drying tea, drying marigold fl owers, fi ring ceramic, silk reeling, dyeing, drying rubber, large-scale cooking and in steel key rolling mills, crematoriums, etc. Figure 10 presents a snapshot of the technologies for energy generation from biomass. Purple lines indicate technologies that are currently in practice for heat and power generation, green lines indicate
9 TERI estimates
Table 4: Current use of
agri-residue (in million
tonnes)9

47
technologies that are in practice for biofuel production and black lines show processes that are in the research and development stages.
Biomass combustion
Traditional biomass has been a source of renewable energy for fulfi lling energy demands in the domestic and commercial sectors in India. In particular, the domestic sector is heavily dependent on traditional sources of energy, mainly for cooking. At present, indoor air pollution kills about 2 million people in developing countries. This is due to the dependence of poor communities on traditional biomass as a fuel source, combined with the use of ineffi cient, old-fashioned stoves for cooking (WHO 2011).
There are two types of cook stoves currently in use: traditional cook stoves and improved cook stoves. Natural draft and forced draft models of single-part metallic and metal plate ceramic (ceramic composite/industrial insulating materials) cookstoves have been developed and are being manufactured in the country. Some models have been approved by the MNRE on the basis of the results of tests conducted by Biomass Cookstove Test Centers, in accordance with the provisions of the Bureau of Indian Standards (BIS) for single-pot metallic cookstoves. Other models of cook stoves, which meet the performance requirements, may be considered for the demonstration project. A new National Biomass Cookstoves Programme is proposed to be launched under the Twelfth Five-year Plan (2012-2017).
Figure 10: Technological
options for biomass
energy
Source: TERI, 2009
ENERGY SUPPLY SOURCES

48
THE ENERGY REPORT– INDIA 100% RENEWABLE ENERGY BY 2050
Table 5: Performance and cost of cook stoves10
Stove type Effi ciency (%) Cost (INR) Life (years)
Traditional cookstove 10-15 Negligible 1-6
Improved cookstove
Forced draft 45-50 3,650 6-8
Natural draft 35-45 1,100-1,400 10-15
Table 5 shows that the improved cook stove is much superior to the traditional cook stove. Hence, in a 100 per cent renewable energy scenario, the shift from traditional cook stoves to improved cook stoves is imperative.
Family biogas plants
A biogas plant is a unit that converts organic waste matter into useful gaseous fuel; as a derivative, it also provides organic fertilizer in the form of slurry. The most common feed material in a family-size biogas plant is cattle dung. India has the potential for about 12 million family-type biogas plants, based on the ballpark availability of cattle dung in the country (MNRE 2012b). As on 31 August 2012, the cumulative installed family-type biogas plants set up in the country were 4.54 million. However, not all of these plants continue to be operational due to several barriers, and the number of operational biogas plants is unknown. Since 1981-82, the MNRE is engaged in implementing the National Biogas and Manure Management Programme (NBMMP) for setting up family-type biogas plants. The cost of a biogas plant depends on factors like location and size. On an average, the cost of a two-cubic-metre biogas plant is about INR 17,000. Generally, the cost is about 30 per cent higher in hilly areas and about 50 per cent more in the North-eastern states. The economic life of a family-type biogas plant is around 15-20 years.
Gasifi cation
Gasifi cation is a thermo-chemical process that converts organic or fossil-based carbonaceous materials into carbon monoxide, hydrogen and carbon dioxide. This is achieved by reacting the material at high temperatures of more than 700°C, without combustion, with a controlled amount of oxygen and steam. The gas mixture produced as a result of this is called syngas, or producer gas, and is itself a fuel. If the gasifi ed compounds are obtained from biomass, the power derived from the gasifi cation and combustion of the resultant gas is considered to be a source of renewable energy. The chemistry of gasifi cation is essentially a two-step process—pyrolysis followed by gasifi cation. Pyrolysis is the decomposition of the biomass feedstock by heat. This step is also known as “devolatilization”. It is an endothermic reaction and produces 75-90 per cent volatile material in the form of gaseous and liquid hydrocarbons. The left-over non-volatile material contains a high carbon content and is referred to as char.
As of 30 June 2012, the total installed capacity of biomass gasifi ers in India was 153 MW (MNRE 2012b). There are two main technologies of biomass gasifi ers, namely, up-draft and down-draft.
10 Expert opinion-TERI
Table 5: Performance
and cost of cook stoves10

49
Biomass for thermal application and power generation
In India, more than 2,000 MW power is established from biomass resources. Projects of up to 800 MW are under implementation, with 100 MW installed for thermal applications in industries (MNRE 2012b). Agricultural residues are utilized for decentralized thermal use in industries like brick, lime, pottery kilns, industrial dryers, ovens, furnaces and boilers. Since the mid-90s, the MNRE has been implementing a biomass power/ cogeneration programme. A total of 288 biomass power and cogeneration projects, aggregating to 2,665 MW of capacity, have been installed in India for feeding power to the grid. These comprise 130 biomass power projects aggregating to 999 MW of capacity and 158 bagasse cogeneration projects in sugar mills, with a surplus capacity of 1,666 MW. Moreover, around 30 biomass power projects aggregating to about 350 MW are under various stages of implementation. Around 70 cogeneration projects are under implementation, with the surplus capacity aggregating to 800 MW. The states of Andhra Pradesh, Tamil Nadu, Karnataka, Maharashtra and Uttar Pradesh have taken the lead in implementing bagasse cogeneration projects (MNRE 2012b). The investment cost for biomass-based power generation is INR 44.5 million/MW (CERC 2011). The O&M cost of this is about 6 per cent of the investment cost.
Biomass for transport (biofuels)
Ethanol and synthetic hydrocarbons as well as hydrogen can be produced from biomass and can prove to be feasible alternatives to fossil-fuel use in the transport sector. Biofuelis biodegradable, and can burn up to 70 per cent cleaner than conventional diesel fuel, with 93 per cent lower total hydrocarbon emission, 50 per cent lower CO emission and 45 per cent lower particulate matter. Biofuels are commonly divided into fi rst-, second- and third- generation biofuels, but the same fuel might be classifi ed differently depending on whether technology maturity, GHG emission balance or feedstock is used to guide the distinction (IEA 2011d). Biofuels may be divided into a number of categories—by type (liquid or gaseous), feedstock or the conversion process used. IEA assumes the following classifi cation for biofuels for transport: “conventional biofuel technologies” and “advanced biofuel technologies”.
Conventional biofuel technologies include well-established processes that are already producing biofuels on a commercial scale. These biofuels, commonly referred to as fi rst-generation, include sugar and starch-based ethanol, oil-crop-based biodiesel and straight vegetable oil, as well as biogas derived through anaerobic digestion. Typical feedstock used in these processes include sugarcane and sugar beet, starch-bearing grains like corn and wheat, oil crops like rape (canola), soybean and oil palm, and in some cases, animal fats and used cooking oils.
Advanced biofuel technologies are conversion technologies and are still in the R&D, pilot or demonstration phases. They are commonly referred to as second- or third-generation. This category includes hydro-treated vegetable oil (HVO), which is based on animal fat and plant oil, as well as biofuels based on lingo cellulosic biomass, such as cellulosic-ethanol, biomass-to-liquids (BtL) diesel and biosynthetic gas (bio-SG). It also includes novel technologies that are mainly in the R&D and pilot stages, such as algae-
ENERGY SUPPLY SOURCES

50
THE ENERGY REPORT– INDIA 100% RENEWABLE ENERGY BY 2050
based biofuels and the conversion of sugar into diesel-type biofuels using biological or chemical catalysts.
In 2011, the worldwide biofuel production reached around 105 billion litres, up 17 per cent from 2009, and biofuels provided 2.7 per cent of the world’s fuels for road transport—a contribution made largely by ethanol and biodiesel. Global ethanol fuel production reached 86 billion litres in 2011, with the USA and Brazil as the world’s top producers, accounting together for nearly 90 per cent of the global production (REN 21 2012). The world’s largest producer of biodiesel is the European Union, accounting for 53 per cent of all biodiesel production in 2010. As of 2011, mandates for blending biofuels exist in 31 countries at the national level and in 29 states/provinces (Worldwatch Institute 2012). Biofuel development in India centres primarily around the cultivation and processing of jatropha plant seeds, which are very rich in oil. The drivers for this are historic, functional, economic, environmental, moral and political. The non-edible vegetable oil of Jatropha curcus has the potential for being a commercially viable alternative to diesel oil since it has desirable physical, chemical and performance characteristics comparable to diesel. Cars could run on Jatropha curcus with out requiring much change in engine design. The government of India is currently implementing an ethanol-blending programme and considering initiatives in the form of mandates for biodiesel. Due to these strategies as well as the rise in population and the growing energy demand from the transport sector, biofuels can be assured of a signifi cant market in India. In 2008, the Indian government announced its National Biofuel Policy which aims to meet 20 per cent of India’s diesel demand with fuels derived from plants by 2017.
First-generation biofuels like biodiesel and ethanol are converted from jatropha, palm, neem, sugarcane, sugarbeets, corn, etc., using processes like trans-esterifi cation and fermentation of starch and sugar, respectively. The cost of biodiesel ranges from INR 38.5/litre to INR 88/litre and that of ethanol is around INR 49.5/litre. In India, the signifi cantly dominant factor in the production of ethanol is the price and availability of molasses.
Second-generation biofuels like cellulosic ethanol, biodiesel-advanced (BtL) and algal oil, which are in research and development phases, are expected become popular by 2035. The conversion processes for these fuels are yeast fermentation/enzyme hydrolysis, Fischer–Tropsch process and microbial photosynthesis, respectively. The sources for cellulosic ethanol as well as biodiesel-advanced are agro-residues, energy crops and forestry wastes, while that for algal oil is microalgae, sunlight and water. The cost of cellulosic ethanol and BtL is the same—USD 1.05-1.15/lge (USD/litre gasoline equivalent) (IEA 2012a).The cost for these biofuels is expected to decrease due to improvement in technology and conversion processes.
Algae promise 10-100 times better productivity per hectare. They can be grown on non-arable land, utilize a wide variety of water sources like fresh, brackish, saline and wastewater and, potentially, recycle CO2 and other nutrient waste streams. Algae cultivation also faces several challenges, related to the availability of locations with suffi cient sunshine and water and facilities for oil extraction. Cultivation of algae and extraction of the oil is currently very expensive. Production cost estimates for raw oil vary from USD 0.75/l to more than USD 5/l, excluding costs for conversion to biofuel

51
(Darzins et al. 2010). Commercially viable production of biofuel from algae will depend on effective strategies to generate high-volume, low-value biofuel along with high-value co-products. However, in some OECD countries algae are projected to become commercially viable around 2030 for some applications, such as biojet fuels, and economies of scale may foster their implementation in India afterwards.
Barriers and Shortcomings
Key barriers and possible roadblocks to biomass production for energy include:
Competing resource issues: Biomass has several competing uses, for example, as cattle feed or as input in industries. An increased demand from the power-generation sector could increase the price of biomass, raising the cost of electricity generation.
Technical barriers: It refers to the high investment costs of dedicated plantations and low biomass productivity.
Financial barriers: These include the lack of investment in the forestry sector, the diffi culty in accessing fi nance and the lack of incentives.
Institutional barriers: These include the lack of coordination among different government agencies, the lack of a mechanism for their interaction with the private sector, lack of a designated agency for promoting biomass energy/plantation and lack of access to expertise on plantation in degraded land.
Policy barriers: Unclear, unsupportive and biased government policies and the absence of a national strategy or priority for promoting biomass energy use are barriers to growth of biomass production for energy.
Emergent competing usage: Recently, biomass is being used to produce plastics, whichare cheaper and meet, or even exceed, most performance standards. However, they lack the water resistance or longevity of conventional plastics.
In the model, biomass power is assumed to meet its twelfth and thirteenth fi ve-year plan capacity addition targets and reach 19 GW by 2051 in the REF scenario. While in the REN scenarios, it is allowed to reach to a higher potential of upto 25 GW by 2051, depending on the other competing uses of biomass.
The use of traditional biomass is reduced over a period of time due to LPG penetration in the REF scenario. In the REN scenario, the entire cooking requirement in rural India is met through traditional biomass and improved cook stoves.
For the modelling exercise, a zero-penetration of biodiesel and second-generation biofuel is assumed in the REF scenario; the maximum potential of domestically produced biodiesel is assumed to be exploited, based on the availability of wasteland. For the REN scenario, it is assumed that second-generation biofuels and bio algae will meet the remaining fuel demand arising from the transportation sector (once electrifi cation and biodiesel have reached their maximum potential), with their introduction in 2026.
ENERGY SUPPLY SOURCES

52
THE ENERGY REPORT– INDIA 100% RENEWABLE ENERGY BY 2050

53
6. MODEL RESULTS AND ANALYSIS
6.1 FINAL ENERGY DEMAND
With India’s increasing population and its present plans for poverty reduction and rapid economic growth, energy demands of the country will increase. Figure 11 shows the projected total fi nal energy demand (including biomass) from 2001 to 2051, across scenarios.
The total fi nal energy demand of the country is projected to rise to 2,545 Mtoe in 2051 from 560 Mtoe in 2011, in the REF scenario. With determined aggressive electrifi cation of technologies and effi ciency improvements in the REN scenario, the fi nal energy con-sumption drops to 1,461 Mtoe in 2051. Hence, signifi cant overall energy savings of 43 per cent are seen in the REN scenario by 2051, when compared with the REF scenario. Given the population of the country at that point of time, this would mean a per capita consumption of 1.45 toe (REF) or roughly 0.83 toe (REN). This is still somewhat less than the present per capita consumption of middle-income Asian countries like China (1.7 toe) and Malaysia (2.4 toe) and still much less than high-income countries like South Korea (4.2 toe) or Japan (3.9 toe) in 2009 (World Bank 2012).
Figure 12 shows the fi nal energy demand by end-use sectors in 2051. Across scenarios, each sector shows a different reduction in energy demand, depending on the nature of their specifi c end-use demand. The transport sector, followed by the industry sector,
Figure 11: Total fi nal
energy demand (including
biomass)
Source: Model results

54
THE ENERGY REPORT– INDIA 100% RENEWABLE ENERGY BY 2050
indicates the highest possibility for transformations, in terms of both energy levels and energy mix. These two sectors, together, account for around 70 per cent of the total fi nal energy consumption in 2051.
The following sub-sections present the sector-wise fi nal energy demands and fuel mix, across scenarios, over the modelling time period (see Appendix A.6 for energy demand).
6.1.1 Transport Sector
In the transport sector, total energy demand increases from 99 Mtoe in 2011 to 658 Mtoe in 2051 in the REF scenario. This represents an annual growth of 4.8 per cent over 40 years. With increased per capita incomes, increased motorization could be expected even in rural area, leading to an increase in transportation demand by many folds. Transport demand in India is expected to rise exponentially with rising
Figure 12: Final energy
demand by end-use
sectors in 2051
Source: Model results
Figure 13: Transport
sector: Final energy
demand across
scenarios
Source: Model results

55
incomes. A limited effi ciency improvement of technologies is considered in the REF scenario and more aggressive improvements (1 per cent per annum) are assumed in the REN scenario for all vehicles. A modal shift has been assumed from road-based to rail-based passenger transport, raising the share of rail from 23 per cent, through the projection period in the REF scenario, to 35 per cent by 2036 in the REN scenario, and is constant thereafter. The REN scenario also considers the share of freight movement in rail, which increases from 32 per cent in 2011 to 50 per cent in 2036 and stabilizes thereafter, while it decreases to 18 per cent and 16 per cent by 2036 and 2051, respectively, in the REF scenario (assuming a rate of change based on trend analysis). In addition, the REN scenario also considers an increased share of public modes in road-based transportation. With such efforts toward the improvement of energy effi ciency of technologies and modal shifts, the fi nal energy demand in the transport sector drops to 364 Mtoe in the REN scenario in 2051. With even a 1 per cent effi ciency improvement a year in vehicles, the fi nal energy demand in the transport sector reduces signifi cantly. Additionally, the REN scenario considers a higher penetration of electric vehicles than the REF scenario. Thus, the sector indicates energy savings of 44.5 per cent by 2051 in the REN scenario when compared with the REF scenario (see Figure 13).
Figure 14 shows the fuel-wise break-up of the fi nal energy demand in the transport sector across both scenarios.
The fuel mix in the transport sector for each scenario also varies considerably. In the REF scenario, petroleum products continue to form an integral part of the fuel mix (82 per cent of the energy use) throughout the modelling period, while the shares of other fuels such as CNG and electricity remain fairly small.
The REN scenario is designed to move away from the use of petroleum products and CNG. In this scenario, electricity and biofuels fulfi l 9.6 per cent and 90.4 per cent of the transport sector energy demand, respectively, in 2051.
The REN scenario considers a very high penetration of electric cars and electric two-wheelers and three-wheelers. Buses, HCVs, LCVs, aircrafts and ships are considered to run on biofuels like biodiesel and second-and third-generation biofuels, such as
Figure 14: Transport
sector: energy demand
across scenarios, by fuel
Source: Model results
MODEL RESULTS AND ANALYSIS

56
THE ENERGY REPORT– INDIA 100% RENEWABLE ENERGY BY 2050
FT-biodiesel and micro algal biofuel. Although there are electric buses in several cities around the world, they have not been considered in this study. Smaller Indian cities do not have public transport and most bus movements are long distance and inter-city, and so cannot be powered by electricity. With increasing income, public transport in smaller cities and towns is expected to develop by 2050. However, the possibility of the deployment of electric buses in those cities is considered very unlikely, given the complementary infrastructure required. Besides, there is a limitation to how much electricity it would be possible to generate from clean/renewable options and, then, a limitation to how much of that would be available for use in transport, given the levels of growing and unmet electricity demands of the country. Second-and third-generation biofuels are introduced only from 2021 and 2036 onwards, based on expert consultation, given that currently these fuels are only in the R&D stage.
Although, currently, electric two-wheelers are gaining space in the Indian market, the share of electric four-wheelers is negligible. Also, larger electric vehicles, with more horsepower, are currently only in the R&D stage, and price would be a serious consideration for such vehicles once they do achieve commercial production. While the disposal of storage batteries could also pose environmental problems, Li-Ion batteries are known to be recyclable.
Comparing the energy mix in the REF and REN scenarios, it is clear that in the absence of third-generation biofuels, it would be diffi cult to move to a scenario that has a share of renewables-based fuel/technology choices in the transport sector. Second-generation technologies have lower oil yield than third generation and face constraints of land availability. Therefore, greater emphasis needs to be laid on the development and deployment of third-generation biofuels for the transport sector if alternative, clean and sustainable transportation solutions are to be adopted.
6.1.2 Industry Sector
Figure 15 shows the projected fi nal energy demand in the industry sector from 2001 to 2051, across scenarios.
Figure 15: Industry
sector: fi nal energy
demand across scenarios
Source: Model results

57
The fi nal energy demand in the industry sector rises from 215 Mtoe in 2011 to 1,167 Mtoe in 2051 in the REF scenario indicating an annual growth of 5.8 per cent over the 40-year period. Final industry energy use in the REN scenario is 654 Mtoe in 2051, indicating a reduction of 44 per cent as compared to the REF scenario in 2051.
Figure 16 shows the fuel-wise break-up of the fi nal energy demand in the industry sector, across scenarios.
In the industry sector, energy effi ciency improvements indicate a scope of around 44 per cent, by 2051, for decreasing fi nal energy use; further reductions are envisaged to be made possible by the use of solar thermal and renewable-based electricity. The shares of coal, natural gas, petroleum products and electricity are projected to be around 63 per cent, 9 per cent, 13 per cent and 11 per cent, respectively, of the sector’s total energy demand in 2051 in the REF scenario. In the REN scenario, in 2051, while coal and natural gas account for 9 per cent and 5.7 per cent, respectively, of the energy consumption (which is used as feedstock and cannot be replaced), solar thermal appears as a new and major energy source comprising 35 per cent, while the share of grid electricity increases to 44.5 per cent of the fuel composition. In the REN scenario, it is also assumed that by 2051 the process heat requirement of the industry sector is met to a large extent through concentrator solar thermal (CST) technologies. The scenario also assumes that CST technologies meet the thermal demands of all industries with heat requirements of temperatures less than 700°C. This includes most industries except iron and steel, cement, aluminium, chemicals, etc. Heating requirements for these industries are assumed to be met through electricity.
It must be borne in mind that CST technology is still in the R&D phase and, unlike solar PV, it cannot be setup on rooftops; it requires a separate set-up and a large land area within the premises, which a lot of small and medium enterprises may not have. Furthermore, the huge initial capital expenditure required would prove to be a challenge for many industries until the technology becomes commercially viable.
Figure 16: Industry
sector: energy demand
across scenarios, by fuel
Source: Model results
MODEL RESULTS AND ANALYSIS

58
THE ENERGY REPORT– INDIA 100% RENEWABLE ENERGY BY 2050
Furthermore, the REN scenario assumes an increased use of scrap-based inputs (80 per cent of total steel) in steel production to reduce the use of coal. In view of the existing low per capita steel consumption, domestic availability of steel scrap in the future is expected to be very low in the country and such a scenario may imply increasing imports of scrap. The steel industry is one of the largest industries in India and is expected to continue to be so. At present, in India, scrap steel is obtained from domestic old steel, ship breaking and the import of scrap from other countries. However, due to increasing environmental concerns associated with ship breaking and the import of scrap, the availability of large quantities of scrap steel is questionable. The share of coal in 2051 in the REN scenario drops to 9 per cent, which is used as a non-replaceable fuel (reducing agent) in the iron and steel industries. The abrupt reduction in the coal consumption occurs because, initially, domestic production of steel goes up and, once the inventory of steel in the economy has been built suffi ciently, domestic production is stopped and nearly all the steel is assumed to be produced through recycling.
6.1.3 Residential Sector
Figure 17 shows the projected fi nal energy demand in the residential sector from 2001 to 2051.
The fi nal energy demand in the residential sector (including traditional biomass) increases from 208 Mtoe in 2011 to 328 Mtoe in 2051, growing at an annual growth rate of 1.1 per cent over 40 years in the REF scenario. In the REN scenario, it decreases to 191 Mtoe in 2051. Thus, in 2051, an energy saving of 42 per cent is achieved in the REN scenario against the REF scenario. This is a result of increased penetration of effi cient appliances, lighting devices and effi cient cookstoves. The rate of increase of the fi nal energy demand in the residential sector is not as rapid as in the transport and industry sectors, indicating signifi cant progress in effi ciency improvements in this sector even in the REF scenario. Figure 18 shows the fuel-wise break-up of the fi nal energy demand in the residential sector, across scenarios.
Figure 17: Residential
sector: fi nal energy
demand across scenarios
(including biomass)
Source: Model results

59
The share of each fuel required to meet the residential sector end-use demand varies with time, across all scenarios. In the REF scenario, electricity, petroleum fuels and traditional biomass meet 10 per cent, 11 per cent and 75 per cent of the energy demand, respectively, in 2011; this changes to 64 per cent, 10 per cent and 26 per cent, respectively, in 2051.
In the REF scenario, cooking and water heating is largely dependent on biomass. In the case of cooking, the increased penetration of LPG and natural gas reduce the dependence on biomass from the 2011 level of 90 per cent to around 75 per cent by 2051. In the case of water heating, electricity replaces biomass and the share of biomass in water heating drops from 93 per cent in 2011 to 70 per cent in 2051. Solar water heating is assumed to not have a signifi cant penetration in the REF scenario. A substantial rural population relies on biomass which is why the heavy dependence on this resource continues.
In the REN scenario, 67 per cent of the fi nal energy demand is met through electricity and the rest via traditional and, now, substantially improved biomass and solar energy. In the REN scenario, urban cooking is assumed to shift completely to electricity, while rural cooking occurs through biomass with improved cookstoves. There is also a limited penetration of solar cooking technologies. Around 17 per cent of cooking demand is met through electricity, 82 per cent through biomass and 1 per cent through solar by 2051. However, water heating demand in this scenario is met completely through solar water heaters by 2051. In this scenario, again, the shift to electricity from LPG to meet cooking needs involves lifestyle changes and is not likely to be easily adopted by people due to individual preferences and cultural factors. A considerable drop is seen in the consumption of biomass in the last decade due to the intensive penetration of improved cookstoves, with very high conversion effi ciency.
Figure 18: Residential
sector: energy demand
across scenarios, by fuel
Source: Model results
MODEL RESULTS AND ANALYSIS

60
THE ENERGY REPORT– INDIA 100% RENEWABLE ENERGY BY 2050
6.1.4 Commercial Sector
Figure 19 shows the projected fi nal energy demand in the commercial sector from 2001 to 2051.
In the commercial sector, the total energy consumption increases rapidly from 16 Mtoe in 2011 to 318 Mtoe in the REF scenario, refl ecting an annual growth of 8 per cent over 40 years. As a result of the aggressive efforts to improve the energy effi ciency of technologies, the energy consumption in the sector drops to 227 Mtoe in the REN scenario, refl ecting energy savings of 29 per cent by 2051.
Figure 20 shows the fuel-wise break-up of the fi nal energy demand in the commercial sector, across scenarios.
While electricity and petroleum products are the two main fuels used to meet commercial sector demands in the REF scenario, the REN scenario necessitates a complete shift toward electrifi cation. In 2011, petroleum fuels contribute about 26 per cent in the fuel mix, while electricity contributes 58.8 per cent. The rest comes from traditional biomass which is prevalent in the rural areas. In the REF scenario,
Figure 19: Commercial
sector: fi nal energy
demand across scenarios
Source: Model results
Figure 20: Commercial
sector: energy demand
across scenarios, by fuel
Source: Model results

61
petroleum products contribute 19.8 per cent and electricity contributes 72.9 per cent to the energy mix. In the REN scenario, however, nearly complete electrifi cation (98 per cent) of the sector occurs by 2051 and renewable-based electricity is assumed to fulfi l nearly all the energy demands of this sector. As is the case in the residential sector, such a transition is likely to be associated with practical diffi culties in shifting toward electric-based cooking in the Indian context. A small percentage of the demand is met through biomass in rural areas.
6.1.5 Agriculture Sector
Figure 21 shows the projected fi nal energy demand in the agriculture sector from 2001 to 2051.
In the agriculture sector, the total energy consumption rises from 21 Mtoe in 2011 to 74 Mtoe, at an annual growth of 3.2 per cent over 40 years, in the REF scenario. With aggressive efforts toward improving energy effi ciency of irrigation pump sets and other agricultural machinery, the energy consumption could reduce by 67 per cent to only 24 Mtoe by 2051 in the REN scenario vis-à-vis the REF scenario.
Figure 22 shows the fuel-wise break of the fi nal energy demand in the agriculture sector, across scenarios.
Figure 21: Agriculture
sector: total fi nal energy
demand across scenarios
Source: Model results
MODEL RESULTS AND ANALYSIS

62
THE ENERGY REPORT– INDIA 100% RENEWABLE ENERGY BY 2050
The REN scenario assumes 100 per cent penetration of effi cient pump sets from 2031 onwards and necessitates a complete shift toward electric pumpsets. Other farm machinery like tractors, tillers and harvesters are assumed to use biofuels in the REN scenario.
As a result of the above assumptions, we obtain a different fuel mix in the agriculture sector across scenarios. In the REF scenario, electricity and petroleum products are the major fuels used. In 2011, their shares stand at 55.6 per cent and 44.4 per cent, respectively. In 2051, the fuel mix changes to 66 per cent and 34 per cent of electricity and petroleum products, respectively, in the REF scenario. In the REN scenario, 88 per cent and 12 per cent of the sector’s energy consumption is met through electricity and biodiesel, respectively.
6.2 ENERGY SUPPLY
Based on the sectoral end-use demands and end-use technology options across sectors, as well as the available fuel resources (domestic and imports), assumptions for the primary commercial energy supply, fuel mix and electricity generation options, across scenarios, are discussed in the following section. The MARKAL model balances the demand and supply sides to provide an indication of the level of energy use as well as the energy mix across scenarios.
6.2.1 Reference Energy Scenario
In the Reference Energy Scenario, the total primary commercial energy supply increases to 3,448 Mtoe in 2051, which is six times the 2011 level, at a CAGR of 4.8 per cent per annum (see Figure 23). In this scenario, coal and oil continue to dominate the energy supply, with the share of coal remaining nearly the same as it is today. In 2051, the share of coal is around 58 per cent, while the share of oil decreases from around 32 per cent in 2011 to 26 per cent in 2051 (see Figure 24). Thus, in 2051, 84.3 per cent of the commercial energy comes from coal and oil, 6.7 per cent from gas and 5.4 per cent from nuclear energy. The share of renewable resources, including large hydro, increases marginally from 3 per cent in 2011 to 3.6 per cent in 2051.
Figure 22: Agriculture
sector: energy demand
across scenarios, by fuel
Source: Model results

63
The REF scenario assumes that technology development will continue to progress at the current pace. There is neither any aggressive development of renewable technologies nor any aggressive deployment of energy-effi ciency measures. The transport sector is entirely dependent on fossil fuels and the use of biodiesel is not assumed at all.
This business-as-usual scenario clearly indicates that with the current policies and plans, the use of renewable energy will increase signifi cantly, however, fossil fuels would need to continue playing an important role in the energy mix. Accordingly, the supply of these fuels would have to be increasingly met through massive imports. Such a scenario is certainly highly unsustainable, if not impossible.
Figure 23: Primary
commercial energy
supply in REF scenario
Source: Model results
Figure 24: Share of fuels
in primary commercial
energy supply in REF
scenario
Source: Model results
MODEL RESULTS AND ANALYSIS

64
THE ENERGY REPORT– INDIA 100% RENEWABLE ENERGY BY 2050
Electricity generation (centralized and decentralized) grows by eight times the 2011 levels in 2051, at a CAGR of 5.3 per cent per annum. A break-up of electricity generation, by resource, is provided in Figure 25. Electricity generation capacity, by resource, is provided in Figure 26.
Figure 25: Resource-wise
electricity generation in
REF scenario
Source: Model results
Figure 26: Resource-wise
electricity generation
capacity in REF scenario
Source: Model results

65
Due to lower load factors, the share of installed renewable electric capacity – 21 per cent – is higher than its share of electricity generation – 13 per cent –in 2051. Moreover, the share of renewable electricity drops from 18 per cent in 2011 to 13 per cent by 2051 in the REF scenario. The share remains somewhat constant till 2021 and decreases thereafter, as the total energy supply increases at a faster rate than renewables. The rest of the energy comes from fossil fuels (79 per cent) and nuclear power (8 per cent) in 2051.
The total installed capacity for power generation increases to 829 GW in 2031 and 1,917 GW in 2051 in the REF scenario. Renewable energy deployment progresses according to the twelfth and thirteenth fi ve-year plans till 2021, and follows a historical rate of capacity addition over the years in the REF scenario. Under this scenario, wind power develops to its full potential of 102 GW, at a hub height of 80m, as estimated by C-WET. At present, offshore wind turbine technology in India is still in the nascent stage and tentative targets for the twelfth and thirteenth fi ve-year plans do not include any offshore wind energy development. Thus, in the REF scenario, this technology has not been considered. There is an improvement in the utilization (load) factor of wind technologies, from 20 per cent in 2011 to 30 per cent in 2031 and beyond, across all scenarios. Solar power develops according to the revised Planning Commission targets, achieving 10 GW by 2016 and 26 GW by 2021. Capacity additions, thereafter, occur at the same rate as in the Thirteenth Five-year Plan. Capacity of solar PV rises to 131 GW by 2051. Both small and large hydros develop at a gradual rate and stabilize once they reach the maximum estimated potential of 15 GW and 148 GW, respectively.
Geothermal energy, ocean tidal energy and waste-to-energy play a very small role in this scenario, as currently only pilot projects have been planned. The resources achieve capacities of 900 MW, 100 MW and 4 GW, respectively, in 2051.
Biomass-based power grows according to the plan period estimates and reaches the maximum estimated potential of 19 GW by 2051.
6.2.2 100% Renewable Energy Scenario
In this scenario, close to 100 per cent (90 per cent in India) of the primary commercial energy is obtained from renewable sources, while 100 per cent of the electricity is generated from renewable resources. The scenario implies that there would be signifi cant impetus provided to renewable energy technologies, bringing about substantive reductions of renewable energy manufacturing costs and ensuring that several renewable energy technologies are commercially adopted in the next few years. This also means using present knowledge for exploiting renewable energy resources beyond their economic limit to their farthest technical extent, radically increasing effi ciency and material recycling and decommissioning some fossil fuel and nuclear plants—or not building them in the fi rst place. The transport sector shifts entirely to electricity and biofuels. Biofuels form 23 per cent of the total commercial energy supply, meeting transportation needs. With the current technology of second-generation biofuels, land availability would be the issue. However, third-generation algal biofuels (which are still in the R&D stage) have an increased yield and have also been considered. Most of the yield could be produced domestically, were this technology to be commercially viable and available for large-scale application by 2031. The remaining
MODEL RESULTS AND ANALYSIS

66
THE ENERGY REPORT– INDIA 100% RENEWABLE ENERGY BY 2050
small amount of coal (4.2 per cent) is used as non-replaceable fuel (reducing agent) in the iron and steel industry, while natural gas (3 per cent) is used as feedstock in industry. Figures 27 and 28 represent the primary commercial energy supply and the shares of resources, respectively, in the REN scenario. Primary energy supply stabilizes from 2036 onwards. Due to the very high share of renewables, conversion effi ciency losses from fossil fuels gets eliminated. At the same time increased use of scrap-based inputs in the iron and steel sector reduces the use of coal. Beyond 2031, solar thermal technologies are assumed to meet the heating demand of industries, whose heat requirements are less than 700°C. The REN scenario (see Figure 28) still roughly doubles the use of coal and oil between today and 2035 before declining it to half of the 2001 level by 2050. In order to allow for a smooth transition to such a low fossil-fuel-dependent economy and to avoid systemic disruptions such as premature closures of coal-fi red power stations toward 2050, a very early and ambitious renewable energy programme is needed today and in coming years.
Figure 27: Primary
commercial energy
supply in REN scenario
Source: Model results

67
Figure 29 depicts the share of each resource in electricity generation, while Figure 30 gives the capacity requirement, by resource, in the REN scenario.
Electricity generation increases by eight times the level in 2011, at a CAGR of 5.2 per cent per annum. This rise is due to the increased electrifi cation of the transport sector, residential cooking and thermal applications in industries. The generation capacity rises from 237 GW in 2011 to 833 GW in 2031 and to 2,870 GW in 2051—an increase of
Figure 28: Share of fuels
in primary commercial
energy supply in REN
scenario
Source: Model results
Figure 29: Resource-wise
electricity generation in
REN scenario
Source: Model results
MODEL RESULTS AND ANALYSIS

68
THE ENERGY REPORT– INDIA 100% RENEWABLE ENERGY BY 2050
ten times from the capacity level in 2011. Onshore wind has the highest share for both generation capacity and generation output.
It is assumed that onshore wind energy would not exceed its maximum potential of 3,121 GW at a hub height of 120 m. The Lawrence Berkeley National Laboratory (LBNL) estimation, which assesses this potential of 3,121 GW, assumes that 7 per cent of the land in the country would be available for onshore wind energy development. Offshore wind has been assumed to develop at an accelerated rate from 2031 and has been assumed to not exceed the maximum estimated potential of 500 GW by 2051. The model returns a capacity of 1,113 GW of offshore and 117 GW of onshore wind installation.
Solar capacity in the REN scenario increases to 1,200 GW in 2051. This takes into consideration the availability of land equivalent to 1 per cent of the solar hotspots in the country. Solar thermal contributes 80 per cent of this capacity in order to meet base load demand.
To realize this level of solar thermal potential, land availability is a considerable constraint. Rooftop solar panels would also have to be utilized for solar PV. This would necessitate forward-looking transitional efforts both in terms of policy aspects as well as fi nancing. Moreover, the large renewable energy addition that the REN scenario calls for requires substantial changes to be made in transmission, power-handling systems and networks. A coordinated and harmonized effort is necessary among actors and implementers, project developers and renewable energy technology customers as well as regulatory bodies.
Geothermal power is assumed from 2016 onwards. It reaches the maximum estimated potential of 10.6 GW in 2051. However, geothermal technologies in India are still in the R&D stage. The technology is expensive and has with very little potential, which is
Figure 30: Resource-wise
electricity generation
capacity in REN scenario
Source: Model results

69
spread over seven “geothermal provinces” in India. Compared to other countries in the world, where geothermal energy has received much more attention and support, India is still to develop a pilot project, and this is one sector that has lagged behind.
Ocean tidal energy grows to a maximum estimated potential of 9 GW in 2051 following a linear growth trend. However, ocean energy technologies are still in the R&D stage. Besides, they are extremely expensive to invest in and have little potential. Thus, the feasibility of adapting this technology in India is subject to debate at the present.
Installed capacity of energy generated from waste grows to the maximum potential of 7 GW, as estimated by the Planning Commission for the year 2031, in 2051. The initiative would require the active involvement of municipal bodies in proper waste collection and separation, which does not exist yet in many Indian cities. However, even if a determined effort is made in this direction, the calorifi c value obtained from waste might not be comparable to the investment made for deploying this technology. In any case, it plays a minor role in energy production in the country and renewable energy source policies of the government may prefer to focus on other technologies.
6.2.3 Scenario Comparison
The total primary energy supply and the shares of the various fuels for the Reference Energy and 100% Renewable Energy scenarios are depicted in the Figure 31.
By 2051, renewable sources provide almost 90 per cent of all energy in the REN scenario compared to a negligible share in the REF scenario. Also, due to strong efforts toward energy effi ciency, the total primary energy supply in 2051 in REN scenario is only 59 per cent of that in the REF. Electricity generation in the REN is nearly the same as that of the REF scenario, since the reduction in demand due to effi ciency improvement is offset by the increase in demand due to higher electrifi cation, particularly in residential and commercial cooking, transport and some industry process heating. The REN scenario also has a much lower share of fossil fuels in both 2031 and 2051 as compared to the REF scenario. The REF scenario has fossil fuel shares of 93 per cent and 90 per cent for 2031 and 2051, respectively, in the primary commercial energy supply; in the REN scenario the share of fossil fuels for 2031 and 2051 are 91 per cent and 10 per cent, respectively (see Appendix A.5 for decadal data).
Figure 31: Primary
commercial energy
supply and shares across
scenarios
Source: Model results
MODEL RESULTS AND ANALYSIS
Energy share comparisonEnergy share comparison
Primary commercial energy supplyPrimary commercial energy supply

70
THE ENERGY REPORT– INDIA 100% RENEWABLE ENERGY BY 2050
Import dependency for coal, oil and gas increases over a period of time in the REF scenario.
Oil consumption in 2051 is 780 MT in the REF scenario, while it decreases to 46 MT in the REN scenario. The import dependency for oil (crude oil and petroleum products) rises from 80 per cent in 2011 to 97 per cent in 2051 for the REF scenario. Given the lack of domestic reserves (which has led to a nearly stagnant rate of production) and increasing demand, a steeply rising import dependency is inevitable in the REF scenario. In the REN scenario, biofuel is available as a replacement for petroleum products. Second generation and algal biofuels are domestically produced, and this helps improve energy security. The consumption of petroleum products falls to minimal quantities by 2051 in the REN scenario, and this demand is met entirely through imports, as domestic refi neries are all phased out by that time.
Coal consumption increases to 4,310 MT in the REF scenario in 2051, while in the REN scenario, it drops to 94 MT. Import dependency for coal rises from 19 per cent in 2011 to 75 per cent in 2051 for the REF scenario, while it is 86 per cent in 2051 in the REN scenario. There is higher import dependency in the REN since only coking coal is used this scenario, mainly in industries, and its production is very low in India.
In the case of natural gas, annual consumption increases to 261 BCM in 2051 for the REF scenario. The import of natural gas is restricted by the delay in the installation of LNG pipelines, and the assumptions on the same do not change across the scenarios. In the REN scenario, however, natural gas consumption rises to only 48 BCM. Import dependency rises from 21 per cent in 2011 to 84 per cent in 2051 in the REF scenario. In the REN scenario, the import dependency drops to only 13 per cent in 2051.
The production and imports for all fuels are given in Figure 33.
Figure 32: Comparison
of electricity generation
and generation capacity
across scenarios
Source: Model results

71
6.3 CO2 EMISSIONS
Figure 34 shows CO2 emissions from 2001 to 2051, across both scenarios.
Figure 33: Production
and net imports of fuels
Source: Model results
Figure 34: CO2
emissions
across scenarios
Source: Model results
MODEL RESULTS AND ANALYSIS

72
THE ENERGY REPORT– INDIA 100% RENEWABLE ENERGY BY 2050
In the REF scenario, CO2 emissions increase by seven times from 1.7 billion tonnes per annum,today, to 11.2 billion tonnes per annum in 2051, growing at a rate of 4.8 per cent per annum. This would represent about half of all current energy-related CO2 emissions worldwide and would substantially contribute to accelerating climate change and warming rates, much above the universally agreed 2-degree-centigrade objective. The REN scenario in contrast shows an obvious and massive reduction in CO2 emissions, with emissions in 2051 at 0.4 billion tonnes, which is even less than the current level of CO2 emissions.
6.4 INVESTMENTS
As per the model results, the total undiscounted investment in technology for the next 40 years is estimated at INR 1,307 trillion for the REF scenario, and INR 1,851 trillion for the REN scenario. The investment cost for the REN scenario is 42 per cent higher than the REF scenario. Consequently, the REN scenario requires an additional investment of INR 544 trillion between 2011 and 2051 over and above the investment in the REF scenario, which is around 4 per cent of the cumulative GDP during this period.
The total undiscounted system cost is INR 4,839 trillion in the REF scenario and INR 5,306 trillion in the REN scenario (i.e., 10 per cent higher than in the REF scenario). While the costs in the model account for a technology-to-technology comparison, it must be noted that to achieve the REN scenario,additional transaction costs would be incurred to undertake appropriate RD&D, set up adequate transport and energy transmission infrastructure, put in place proper regulatory systems, ensure development of appropriate skill sets, etc. These costs are beyond those accounted for in the model. At the same time, it must be kept in mind that the REF scenario also brings with it costs in the form of a higher level of air pollution and its associated impacts and an increased level of CO2 emissions. Therefore, while it is acknowledged that the challenges presented by the scale of the REN scenario are immense, it would still be benefi cial to move toward this scenario.
It is observed that a major deviation takes place from 2031 onwards. Government plans till the end of the Thirteenth Five-year Plan are already, largely, in place. This, essentially, means that most of the additional investment – at least INR 517 trillion – would be required between 2036 and 2051. The additional investment is around 6 per cent of the GDP during the same period. It is worthwhile to mention that most renewable technologies are currently not competitive in the present market design. As a result, a bulk of the investment on technologies will require some fi nancial support from the government initially. Part of the fossil fuel subsidies could be diverted to subsidize renewable energy technologies and to fund research and development in alternative technologies.
6.5 BARRIERS AND POLICIES
The REN scenario is clearly desirable both from an environmental as well as from an energy security perspective. However, there are several barriers to achieving such a scenario at this point in time. Some of these barriers are mentioned below.
IN 2051,
CO2 EMISSIONS
INCREASE BY SEVEN TIMES IN REFERENCE
ENERGY SCENARIO, BUT DECREASE BY
FOUR TIMES IN THE RENEWABLE ENERGY
SCENARIO

73
Time-lags in achieving commercial viability of technological solutions and lack of timely build-up of manufacturing capacities and deployment of options across sectors and fuels
Existence of niche demands that currently have no alternative to fossil-based energy choices
Constraints in scaling up renewable energy supply, which is based on non-biomass forms,for meeting the growing energy requirements of the rural poor who have improved access and incomes
Adequate and simultaneous development of supporting infrastructure
India is the fi rst country to have a ministry dedicated to the development of renewable energy. The Ministry of New and Renewable Energy (MNRE) is the nodal ministry of the government of India for all matters relating to new and renewable energy. The broad aim of the Ministry is to develop and deploy new and renewable energy for supplementing the energy requirements of the country.
The twelfth and thirteenth plan targets for development of renewable resources are fairly ambitious. The Jawaharlal Nehru National Solar Mission has been launched with a target of 22 GW of solar installation by 2022—a highly ambitious target for a country that had little solar installation when the mission was launched. The National Policy on Biofuels is also very ambitious; it proposes an indicative target of 20 per cent blending of biofuels, both for biodiesel and bio-ethanol, by 2017.
In order to facilitate the plan targets, the government of India has several policies in place to encourage renewable energy development in the country.
The government allows 100 per cent FDI in renewable energy distribution and generation projects.
Undertakings in generation and distribution of renewable energy are provided tax holidays.
The Indian Renewable Energy Development Agency has been set up under the Ministry of Non-Conventional Energy Sources and is a specialized fi nancing agency to promote and fi nance renewable energy projects.
Generation-based incentives have been introduced to promote projects under independent power producers for wind and solar technologies. These could be extended to other resources in the future.
Under renewable purchase obligations, distribution companies, open access, consumers and captive consumers are obligated to buy a certain percentage of power from renewable sources of energy. This policy has been put in place to facilitate India’s ambition of deriving 15 per cent of its electricity requirement from renewable energy sources by 2020.
International mechanisms like the clean development mechanism (CDM) allow industrialized countries that have committed a reduction in GHGs to invest in projects, which reduce emissions in developing countries. India is the second largest seller of carbon credits and has the highest rating of any CDM host country (KPMG 2012).
MODEL RESULTS AND ANALYSIS

74
THE ENERGY REPORT– INDIA 100% RENEWABLE ENERGY BY 2050
India has already implemented various policies and measures to promote renewable resources. However, in order to achieve a target of the magnitude of the REN scenario, the country would have to do much more—both in terms of the level and pace of what can currently be envisaged.
Some of the following measures could help increase and accelerate the penetration of renewables in India’s energy mix.
Creating “centralized renewable zones”over an area of 1,000-2,000 acres (four to eight kilometres), where detailed techno-economic analysis would be conducted and common infrastructure could be used to attract investors, may be considered.
Enhancing RD&D efforts both at the global and national level are important to bring in new/renewable technologies at commercially viable scales and to demonstrate their success across end-use applications and user-groups.
Increasing the budgetary allocation is necessary for the development of grid infrastructure and the integrated management of power generation and grid supply infrastructure.
Moving toward rationalized pricing of energy and technologies to encourage the use of cleaner and more effi cient fuels and technologies is important. While certain section of users would need to be provided with targeted subsidies, adopting progressive energy pricing structures together with innovative ways of internalizing the costs of degradation of domestic natural resources can play a role in accelerating the shift toward alternative fuels and technologies. Current subsidies on fossil fuels could be diverted toward the development of renewable resources and technologies. The current cess on coal, for example, is envisaged to be used for promoting renewables.
Including consumers in informed decision-making is equally important. Awareness generation coupled with setting of norms, standards and labelling can help provide an impetus to more effi cient and renewable technologies. Similarly, net-metering systems could be adopted to popularize renewables-based home systems.
Strengthening policy and regulatory set-ups is extremely relevant. Policy implementation needs to be properly monitored and regular appraisals need to be done to ensure that programmes are on track and to achieve the desired targets.

75
7. CONCLUSION
From the analysis in the preceding sections, it is clear that fora fast-growing but still low-income country like India both long-term energy scenarios – REF and REN – pose challenges, but from very different perspectives. The REF scenario depicts an unsustainable, polluting and relatively ineffi cient energy future in 2051. The REN scenario presents a modern, cleaner and highly effi cient India and shows that it is, in principle, theoretically feasible to achieve close to 90 per cent penetration of renewable energy sources in the energy mix by 2051. However, there are still many unresolved questions in the REN scenario related to resource potentials, availability, commercial viability of alternative options, policy and fi nance mobilization, barriers of cultural and technological lock-ins, etc. Several feasibility studies are, therefore, needed to lay the basis for moving toward the REN scenario; these have not yet been carried out. There are many interventions that would be necessary to remove various barriers and to achieve higher levels of renewable energy deployment in India.
In addition, global development of effi cient renewable energy technologies must accelerate along with its dissemination to India at affordable prices. This goes much beyond the conventional “technology transfer”approach and requires action from all—governments, industrial stakeholders and NGOs. This may also require a new “deal” under the WTO for fair and free trade of clean energy.
Apart from creating awareness regarding effi cient renewable energy options, efforts are required for promoting research and development in these alternative technologies and resources. The availability of algal biofuels can serve as an alternative to petroleum products, and the development of electric vehicle technologies, with larger capacities, is important.
The REN scenario also requires that by 2051 process heat requirements of the industry sector be met, to a large extent, through concentrator solar thermal (CST) technologies. While, CST technology is still in its R&D phase, its development needs to be stepped up fi rst and, then, its penetration encouraged and increased so as to make this a viable option to consider.
Finally, most renewable resources have issues of intermittency and variability associated with them. As a result, grid stability would be another major challenge. So, appropriate measures for grid enhancement, stability augmentation and modern load and grid management are required across the country; power storage facilities also need to be developed. Although the model considers concentrating solar power (CSP) with storage, the present technology is in its infancy and, hence, its potential is limited at this juncture. India would, therefore, need to invest heavily in grid infrastructure. Simultaneously, the government should consider the development of smart grid systems.
Developments in renewable technologies are, however, progressing rapidly both in India and across the globe, and higher levels of regional cooperation can play a key role in accelerating the pace and spread of renewable energy development.
THE RENEWABLE ENERGY SCENARIO
SHOWS THAT IT IS, IN PRINCIPAL, THEORETICALLY
FEASIBLE TO ACHIEVE CLOSE TO
90% PENETRATION OF
RENEWABLE ENERGY SOURCES IN THE ENERGY MIX BY
2051
MANY INTERVENTIONS
WOULD BE NECESSARY TO
REMOVE VARIOUS BARRIERS AND
TO ACHIEVE HIGHER LEVELS OF
RENEWABLE ENERGY DEPLOYMENT IN
INDIA

76
THE ENERGY REPORT– INDIA 100% RENEWABLE ENERGY BY 2050

77
REFERENCES
Batra, R.K. and Chand, S.K. 2011. India’s coal reserves are vastly overstated: is anyone listening? The Energy and Resources Institute, New Delhi, India.
BP. 2011.BP Statistical Review of World Energy,<www.bp.com/statisticalreview>, last accessed on 31 October 2013. British Petroleum, London, United Kingdom.
CEA. 2012. Central Electricity Authority,<http://cea.nic.in/>, last accessed on 20 August 2012.
CEA. 2012. National Electricity Plan,<http://www.cea.nic.in/reports/powersystems/nep2012/generation_12.pdf>, last accessed on 31 October 2013. Central Electricity Authority, Ministry of Power, Government of India, New Delhi.
CERC. 2011. Explanatory Memorandum for Draft Terms and Conditions for Determination of Tariff for Renewable Energy Sources. Central Electricity Regulatory Commission, Government of India, New Delhi.
Chandrasekharam, D. 2000.Geothermal energy resources of India. Paper given atIBC Conference “Geothermal Power Asia 2000” Manila, Philippines,<http://www.geos.iitb.ac.in/geothermalindia/pubs/IBC/IBCTALKweb.htm>, last accessed on 31 October 2013.
C-WET. 2012. Estimation of Installable Wind Power Potential at 80 m level in India, <http://www.cwet.tn.nic.in/html/departments_ewpp.html>, last accessed on 31 October 2013. Centre for Wind Energy Technology, Chennai, India.
Dadhich, P.K. and Kishore, V.V.N. 2009. Evaluation of biomass for conversion to liquid biofuels in India.The Energy and Resources Institute, New Delhi, India.
Darzins, A., Pienkos, P. and L. Edye. 2010. Current Status and Potential for Algal Biofuels Production. IEA Bioenergy Task 39 Report T39-T2. International Energy Agency, Paris, France.
Dhingra, S., Mande, S., Kishore, V.V.N. and V. Joshi. 1996. Briquetting of Biomass – Status and Potential. The Energy and Resources Institute, New Delhi, India.
GSI. 1987. Geothermal Volume. Geological Survey of India Records, pp 115, pp 206.
GSI. 1991. Geothermal Atlas of India. Geological Survey of India Special Publication 19, pp 144.
Goyal, M. 2010. Repowering-Next big thing in India. Renewable and Sustainable Energy Reviews 14, pp 1400-1409.

78
THE ENERGY REPORT– INDIA 100% RENEWABLE ENERGY BY 2050
IEA. 2010. Projected Costs of Generating Electricity,<http://www.iea.org/textbase/nppdf/free/2010/projected_costs.pdf>, last accessed on 31 October 2013. International Energy Agency, Paris, France.
IEA. 2011a.Key World Energy Statistics 2011. International Energy Agency, Paris, France.
IEA. 2011b. World Energy Outlook 2011. International Energy Agency, Paris, France.
IEA. 2011c. Technology Brief E11. IEA-ETSAP,International Energy Agency, Paris, France.
IEA. 2011d.Technology Roadmaps-Biofuels for transport 2011,<http://www.iea.org/papers/2011/biofuels_roadmap.pdf>, last accessed on 31 October 2013. International Energy Agency, Paris, France.
IEA. 2012a. Energy Technology Perspectives 2012,<http://www..org/Textbase/npsum/ETP2012SUM.pdf>, last accessed on 31 October 2013. International Energy Agency, Paris, France.
IEA. 2012b. World Energy Outlook 2012. International Energy Agency, Paris, France.
IPCC. 2011.IPCC Special Report on Renewable Energy Sources and Climate Change Mitigation. Prepared by Working Group III of the Intergovernmental Panel on Climate Change. [Edenhofer, O., Pichs-Madruga, R., Sokona, Y., Seyboth, K., Matschoss P., Kadner, S., Zwickel, T., Eickemeier, P., Hansen, G., Schlömer, S. and C. von Stechow (eds)]Cambridge University Press, Cambridge, United Kingdom and New York, NY, USA. 1075 pp.
IRENA. 2012a. Renewable energy technology cost analysis series: Concentrating Solar Power,<http://www.irena.org/DocumentDownloads/Publications/RE_Technologies_Cost_Analysis-CSP.pdf>, last accessed on 31 October 2013. International Renewable Energy Agency, UAE.
IRENA. 2012b. Renewable energy technology cost analysis series: Wind Power,<http://www.irena.org/DocumentDownloads/Publications/RE_Technologies_Cost_Analysis-Wind Power.pdf>, last accessed on 31 October 2013. International Renewable Energy Agency, UAE.
IWTMA. 2009. Indian Wind Energy Outlook, 2009,<http://www.indianwindpower.com/pdf/GWEO_A4_2008_India_LowRes.pdf>, last accessed on 31 October 2013. Indian Wind Turbine Manufacturers Association, Chennai, India.
Kedare, S.B. 2006. Solar Thermal Systems for Industrial Process Applications,<http://www.ese.iitb.ac.in/events/other/renet_fi les/22-9/Session%201/Solar%20thermalfor%20industrial%20use(S.B.K).pdf>, last accessed on 31 October 2013.
KPMG. 2012. Taxes and Incentives for Renewable Energy. KPMG International Cooperative, Switzerland.

79
REFERENCES
Ladanai, S. and Vinterbäck, J. 2009. Global Potential of Sustainable Biomass for Energy,<http://pub.epsilon.slu.se/4523/1/ladanai_et_al_100211.pdf>, last accessed on 31 October 2013. Swedish University of Agricultural Sciences, Uppsala, Sweden.
LBNL. 2012. Reassessing Wind Potential Estimates for India: Economic and Policy Implications. Lawrence Berkeley National Laboratory, Berkeley, USA.
Lu, X., McElroy, M.B. and J. Kiviluoma. 2009. Global potential for wind-generated electricity. Proceedings of the National Academy of Sciences, 106, 10933-10939.
MNRE. 2010. Biomass Resource Atlas of India. Ministry of New and Renewable Energy, Government of India, New Delhi.
MNRE. 2012a. Cumulative deployment of various Renewable Energy Systems/ Devices in the country,<http://www.mnre.gov.in/mission-and-vision-2/achievements>, last accessed on 31 October 2013. Ministry of New and Renewable Energy, Government of India, New Delhi.
MNRE. 2012b. Annual Report 2011-12. Ministry of New and Renewable Energy, Government of India, New Delhi.
MoC. 2011a. Coal Directory. Ministry of Coal, Government of India, New Delhi.
MoC. 2011b. Report of the Working Group on Coal & Lignite for Formulation of Twelfth Five Year Plan, <http://planningcommission.nic.in/aboutus/committee/wrkgrp12/wg_Coal1406.pdf>, last accessed on 31 October 2013. Ministry of Coal, Government of India, New Delhi.
MoC. 2012. Provisional Coal Statistics 2011-12. Ministry of Coal, Government of India, New Delhi.
MoEF. 2010. India: Greenhouse Gas Emissions 2007,<http://moef.nic.in/downloads/public-information/Report_INCCA.pdf>, last accessed on 31 October 2013. INCCA: Indian Network for Climate Change Assessment, Ministry of Environment and Forests, Government of India, New Delhi.
MoP. 2012. Report of The Working Group on Power for Twelfth Plan. Ministry of Power, Government of India, New Delhi.
MoP&NG. 2011a. Basic Statistics on Indian Petroleum & Natural Gas 2010-11. Ministry of Petroleum and Natural Gas, Government of India, New Delhi.
MoP&NG. 2011b. Draft Working Group on Petroleum and Natural Gas for the 12th Five year Plan. Ministry of Petroleum and Natural Gas, Government of India, New Delhi.
MoSPI. 2012. Energy Statistics 2012,<http://mospi.nic.in/mospi_new/upload/Energy_Statistics_2012_28mar.pdf>, last accessed on 31 October 2013. Ministry of Statistics and Programme Implementation, Government of India, New Delhi.

80
THE ENERGY REPORT– INDIA 100% RENEWABLE ENERGY BY 2050
NREL. 2010. Indian Renewable Energy Status Report,<http://www.nrel.gov/docs/fy11osti/48948.pdf>, last accessed on 31 October 2013. National Renewable Energy Laboratory, Department of Energy, Washington D.C., USA.
Pillai, I.R. and Banerji, R. 2009. Renewable Energy in India: Status and Potential. Energy 34, pp 970-980.
Planning Commission. 2009. Report of the expert group to review the methodology for estimation of poverty,<http://planningcommission.nic.in/reports/genrep/rep_pov.pdf>, last accessed on 31 October 2013. Planning Commission, Government of India, New Delhi.
Planning Commission. 2011. Faster, Sustainable and More Inclusive Growth-An Approach to the Twelfth Five Year Plan,<http://planningcommission.nic.in/plans/planrel/12appdrft/appraoch_12plan.pdf>, last accessed on 31 October 2013. Planning Commission, Government of India, New Delhi.
PPAC. 2012. Provisional statistics. Petroleum Planning and Analysis Cell, Ministry of Petroleum and Natural Gas, Government of India, New Delhi.
RBI. 2011. Handbook of Statistics of the Indian Economy 2010-11,<http://www.rbi.org.in/scripts/AnnualPublications.aspx?head=Handbook%20of%20Statistics%20on%20Indian%20Economy>, last accessed on 31 October 2013. Reserve Bank of India, Mumbai, India.
REN 21. 2012. Renewables 2012, Global Status Report.
Rodrigues, J., Domingos, T., Conceicao, P. and J. Belbute. 2005. Constraints on dematerialisation and allocation of natural capital along a sustainable growth path. Ecological Economics 54 (2005),pp 382-396.
Solanki,M.K., Mishra, P., Maheshwar, S and T.A. Khan. 2012. Current Indian Perspective for Unconventional Energy Resources and its Exploration. International Journal of Engineering Research & Technology 1 (6), pp 1-10.
TERI. 2008. Market Development for clean energy sector: Focus on Municipal waste,<http://www.teriin.org/upfi les/projects/TOC/2008EE01_20101027120009.pdf>, last accessed on 31 October 2013.The Energy and Resources Institute, New Delhi, India.
TERI. 2009. Evaluation of biomass for conversion to liquid biofuels in India. The Energy and Resources Institute, New Delhi. India.
TERI. 2012. TERI Energy Data Directory & Yearbook 2011/12. The Energy and Resources Institute, New Delhi, India.
Vimal, O.P. and Tyagi, P.D. 1984. Energy from biomass - an Indian Experience. Gricole Publishing Academy, New Delhi, India.

81
WHO. 2011. <http://www.who.int/mediacentre/factsheets/fs292/en/>, last accessed on 31 October 2013.
World Bank. 2010. Empowering Rural India: Expanding Electricity Access by Mobilizing Local Resources,<http://online.wsj.com/public/resources/documents/WorldBankreport0215.pdf>, last accessed on 31 October 2013.
World Bank. 2012. Data,<http://data.worldbank.org/indicator/EG.USE.PCAP.KG.OE>, last accessed on 19 October 2012.
Worldwatch Institute. 2012. Biofuels make a comeback despite tough economy,<http://www.worldwatch.org/biofuels-make-comeback-despite-tough-economy>, last accessed on 15 August 2012.
WWF and Ecofys. 2011. The Energy Report: 100% Renewable Energy by 2050. WWF International, Gland, Switzerland and Ecofys, Utrecht, The Netherlands.
REFERENCES

82
THE ENERGY REPORT– INDIA 100% RENEWABLE ENERGY BY 2050

83
APPENDICESA.1 GOVERNMENT PLANS FOR RENEWABLE-BASED CAPACITY ADDITION
All scenarios consider renewable-based capacity additions as per the targets of the twelfth and thirteenth fi ve-year plans. The planned targets for capacity additions are given in tables A-1 and A-2.
Table A-1: Tentative programme for capacity additions to grid-interactive renewable power under the Twelfth Five-year Plan (2012-17)
Source/System Capacity (MW)
Wind power 15,000
Biomass power 2,100
Small hydropower 1,600
Large hydropower 9,200
Solar power 10,000
Waste-to-energy 500
Tidal power 7
Geothermal power 7
TOTAL 38,414
Table A-2: Tentative programme for capacity additions to grid-interactive renewable power under the Thirteenth Five-year Plan (2017-22)
Source/System Capacity (MW)
Wind power 15,000
Biomass power 2,000
Small hydro 1,500
Large hydro 9,200
Solar power 16,000
TOTAL 43,700

84
THE ENERGY REPORT– INDIA 100% RENEWABLE ENERGY BY 2050
A.2 SCENARIO ASSUMPTIONS FOR RENEWABLE ENERGY DEPLOYMENT
The assumptions for different scenarios for each renewable resource are given in Table A-3
Table A-3: Assumptions for renewable energy deployment across scenarios
TECHNOLOGY REF REN
Wind
Wind onshore Assume 12th and 13th plan capacity addition. Same capacity addition (11 GW) in each of following fi ve-year plans
Assume 12th and 13th plan capacity addition, aggressive deployment after the 13th plan. Assume LBNL maximum potential (3,121 GW) as upper bound by 2051
Wind offshore No deployment 5 GW by 2036,with upper bound of maximum estimated potential of 500 GW by 2051
Solar
SPV (grid) Assume 12th and 13th plan capacity addition. Same capacity addition (16 GW) in each of following fi ve-year plans
Minimum to the level of REF scenario; however, could reach the maximum potential of (1,400 GW), depending on demand
CSP (grid) CSP and SPV are be allowed to compete from 2016 onwards
CSP and SPV are allowed to compete up to the maximum potential. CSP with 15-hour storage is used as base load plant. Used for meeting 100% renewable-based electricity generation by 2051
CST (industry) No deployment Meets thermal requirement for process heating of all industries with heat requirement of <700°C by 2051; amounts to around 87% of total industrial heating processes
Solar water heater Limited penetration 100% water heating requirement to be met through solar water heater
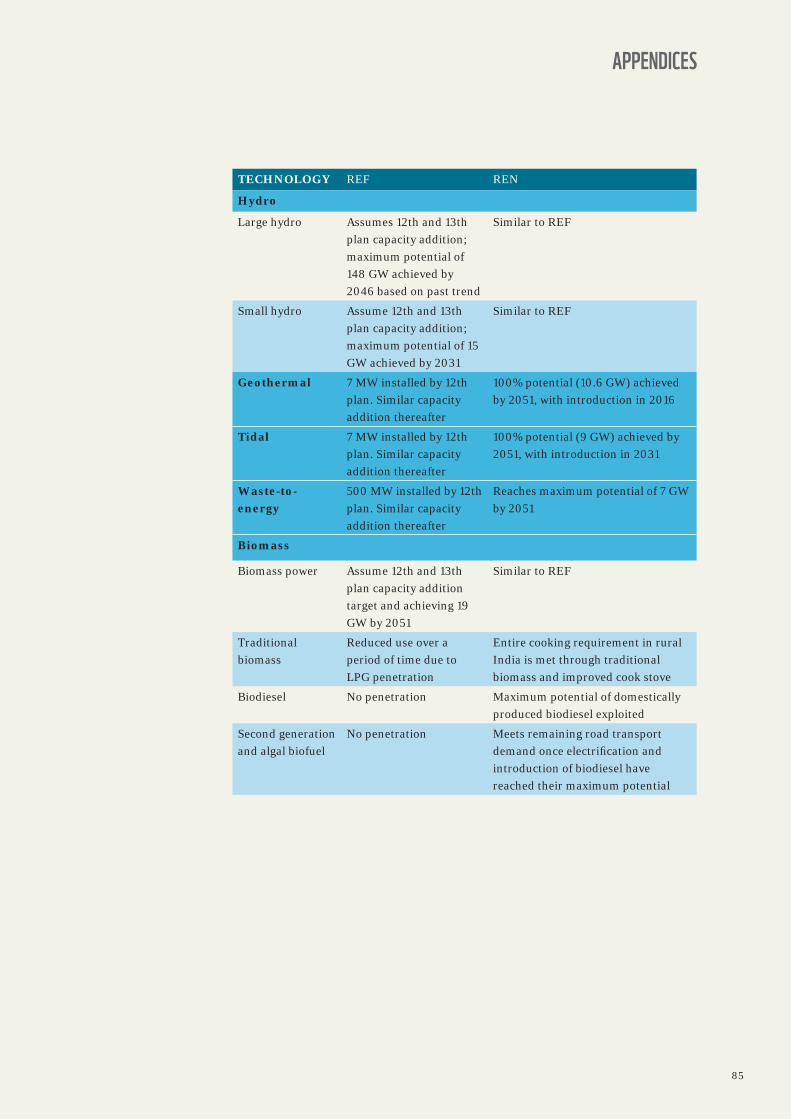
85
TECHNOLOGY REF REN
Hydro
Large hydro Assumes 12th and 13th plan capacity addition; maximum potential of 148 GW achieved by 2046 based on past trend
Similar to REF
Small hydro Assume 12th and 13th plan capacity addition; maximum potential of 15 GW achieved by 2031
Similar to REF
Geothermal 7 MW installed by 12th plan. Similar capacity addition thereafter
100% potential (10.6 GW) achieved by 2051, with introduction in 2016
Tidal 7 MW installed by 12th plan. Similar capacity addition thereafter
100% potential (9 GW) achieved by 2051, with introduction in 2031
Waste-to-energy
500 MW installed by 12th plan. Similar capacity addition thereafter
Reaches maximum potential of 7 GW by 2051
Biomass
Biomass power Assume 12th and 13th plan capacity addition target and achieving 19 GW by 2051
Similar to REF
Traditional biomass
Reduced use over a period of time due to LPG penetration
Entire cooking requirement in rural India is met through traditional biomass and improved cook stove
Biodiesel No penetration Maximum potential of domestically produced biodiesel exploited
Second generation and algal biofuel
No penetration Meets remaining road transport demand once electrifi cation and introduction of biodiesel have reached their maximum potential
APPENDICES

86
THE ENERGY REPORT– INDIA 100% RENEWABLE ENERGY BY 2050
A.3 RENEWABLE TECHNOLOGY COSTS
India-specifi c data for the cost of various technologies has been obtained from literature and stakeholder consultations. Wherever India-specifi c data is unavailable, international fi gures have been used. Cost reduction in emerging technologies has also been assumed in the future. The renewable technology costs, as incorporated in the model, are given in Table A-4.
Table A-4: Capital cost of various renewable energy technologies assumed in this study
Capital costs (million INR/MW)
Technology 2011 2031 2051
Wind onshore 60.0 50.2 42.0
Wind offshore 120.0 103.9 90.0
Large hydro 65.0 65.0 65.0
Small hydro 100.0 100.0 100.0
Tidal 289.0 289.0 289.0
Geothermal 217.0 217.0 217.0
Waste-to-energy 90.0 90.0 90.0
Biomass for power 44.5 44.5 44.5
Solar PV 100.0 64.8 42.0
CSP with 15-hour storage 470.0 352.0 267.0
A.4 FUEL PRICES
The economic costs of energy resources have been considered in the model. Accordingly, taxes and subsidies are not considered so as to refl ect the price differentiation across various consuming segments/uses. As such, cost, insurance and freight (CIF) prices are considered for imported fuels, while free-on-board (FOB) prices are taken for domestic extraction and exports. For fuel prices in the future (till 2035), International Energy Agency’s (IEA) projection of fuel prices under the current policy scenario – as published in World Energy Outlook 2012– is used. Since the projection for fuel prices beyond 2035 is not provided by the IEA, trend analysis is used to project fuel prices till 2051 (see Table A-5).
In view of regional variation in prices of imported natural gas, the price trajectory reported for import of natural gas to Japan is considered for analysis. For LNG import, an addition re-gasifi cation cost of has been used to estimate net import cost. The FOB prices for petroleum products are estimated by using the average value of the ratios of their prices in 10 years (2001-2011), with respect to the crude oil price. The CIF prices are estimated by adding load port charges, freight, insurance and ocean losses to the FOB prices.

87
Table A-5: Fuel prices
Fuel Unit 2015 2020 2025 2030 2035 2051
Crude oil USD/barrel 118.4 128.3 135.7 141.1 145.0 171.1
Natural gas USD/MBtu 15.30 14.70 15.20 15.60 16.00 16.45
Coal USD/tonne 110.0 115.0 119.2 122.5 125.0 136.3
A.5 PRIMARY COMMERCIAL ENERGY SUPPLY
Table A-6: Primary commercial energy supply (Mtoe)
Primary commercial energy supply (Mtoe)
2001 2011 2021 2031 2041 2051
Reference Energy Scenario
Coal 146 282 542 914 1,486 1,999
Oil 105 169 317 525 699 909
Natural gas 26 58 58 118 172 230
Nuclear 4 7 23 52 99 187
Hydro 7 13 20 31 38 45
Solar 0 0 4 9 14 19
Wind 0 3 8 15 20 25
Biomass-based power 0 2 4 7 9 11
Waste-to-energy 0 0 1 1 2 2
Geothermal 0 0 0 0 0 1
Tidal 0 0 0 0 0 0
Biofuel for transportation 0 0 2 5 12 19
100% Renewable Energy Scenario
Coal 146 293 424 579 429 60
Oil 105 164 251 341 245 41
Natural gas 26 58 60 130 155 43
Nuclear 4 7 8 6 4 0
Hydro 7 13 22 34 43 52
Solar 0 0 9 16 203 611
Wind 0 3 8 39 165 252
Biomass-based power 0 2 4 8 11 15
Waste-to-energy 0 0 1 1 2 4
Geothermal 0 0 0 0 1 7
Tidal 0 0 0 0 0 2
Biofuel for transportation 0 0 2 12 145 333
APPENDICES

88
THE ENERGY REPORT– INDIA 100% RENEWABLE ENERGY BY 2050
A.6 SECTORAL DEMAND, BY FUEL
Table A-7: Transport sector demand, by fuel (Mtoe)
Transport sector demand, by fuel (Mtoe)
2001 2011 2021 2031 2041 2051
Reference Energy Scenario
Petroleum fuel 31 96 198 341 451 542
LPG 0 1 2 2 2 1
CNG 0 1 3 6 13 18
Biofuels 0 0 2 5 12 19
Electricity 0 2 11 32 55 78
100% Renewable Energy Scenario
Petroleum fuel 31 94 159 228 163 0
LPG 0 0 0 0 0 0
CNG 0 1 3 5 4 0
Biofuels 0 0 2 12 144 330
Electricity 0 4 10 13 21 34
Table A-8: Residential sector demand, by fuel (Mtoe)
Residential sector demand, by fuel (Mtoe)
2001 2011 2021 2031 2041 2051
Reference Energy Scenario
Traditional biomass 151 178 185 175 159 132
Petroleum fuels 18 15 15 19 21 22
Natural gas 0 1 2 4 8 13
Electricity 7 15 36 72 118 161
Solar 0 0 0 0 0 0
100% Renewable Energy Scenario
Traditional biomass 151 178 182 153 69 58
Petroleum fuels 18 15 15 19 5 0
Natural gas 0 1 2 4 8 0
Electricity 7 14 34 66 104 127
Solar 0 0 0 0 3 6

89
Table A-9: Industry sector demand, by fuel (Mtoe)
Industry sector demand, by fuel (Mtoe)
2001 2011 2021 2031 2041 2051
Reference Energy Scenario
Coal 56 105 201 390 588 747
Natural gas 13 30 36 61 86 109
Petroleum products 31 32 47 74 106 147
Grid electricity 9 30 50 62 97 131
Solar thermal 0 0 0 0 0 0
Biomass 10 18 33 42 41 33
100% Renewable Energy Scenario
Coal 56 109 188 292 322 60
Natural gas 13 30 35 54 52 38
Petroleum products 31 31 34 50 56 36
Grid electricity 9 30 33 53 109 291
Solar thermal 0 0 0 0 57 230
Biomass 10 18 21 11 0 0
Table A-10: Agriculture sector demand, by fuel (Mtoe)
Agriculture sector demand, by fuel (Mtoe)
2001 2011 2021 2031 2041 2051
Reference Energy Scenario
Petroleum products 7 9 16 21 25 25
Electricity 7 12 25 37 47 50
Biodiesel 0 0 0 0 0 0
100% Renewable Energy Scenario
Petroleum products 7 9 14 13 1 0
Electricity 7 12 22 24 28 21
Biodiesel 0 0 0 0 1 3
APPENDICES

90
THE ENERGY REPORT– INDIA 100% RENEWABLE ENERGY BY 2050
Table A-11: Commercial sector demand, by fuel (Mtoe)
Commercial sector demand, by fuel (Mtoe)
2001 2011 2021 2031 2041 2051
Reference Energy Scenario
Petroleum products 12 4 8 15 28 50
Natural gas 0 0 1 3 6 13
Electricity 2 10 24 55 121 232
Biomass 1 2 4 8 14 23
100% Renewable Energy Scenario
Petroleum products 12 4 8 15 6 0
Natural gas 0 0 1 3 1 0
Electricity 2 10 23 50 121 222
Biomass 1 2 4 7 5 5
WWF-India is one of the largest conservation organizations in the country dealing with nature conservation, environment protection and development-related issues. Established as a Charitable Trust in 1969, it has an experience of over four decades in the fi eld. Its mission is to stop the degradation of the planet’s natural environment, which it addresses through its work in biodiversity conservation and reduction of humanity’s ecological footprint.
WWF-India works across different geographical regions in the country to implement focused conservation strategies on issues like conservation of key wildlife species, protection of habitats, management of rivers, wetlands and their ecosystems, climate change mitigation, enhancing energy access, sustainable livelihood alternatives for local communities, water and carbon footprint reduction in industries, and combating illegal wildlife trade. WWF-India is actively engaged in promoting renewable energy uptake, enabling energy access, demonstrating renewable energy projects in critical landscapes, and overall promoting clean energy solutions.
To know more, log on to: www.wwfi ndia.org
The Energy and Resources Institute is a dynamic and fl exible organization with a global vision and a local focus. A unique developing country institution, TERI is best described as an independent, non-profi t research organization focusing on energy, environment and sustainable development. Its mission is ‘to develop and promote technologies, policies and institutions for effi cient and sustainable use of natural resources’.
To know more, log on to: www.teriin.org

Darbari Seth Block, IHC Complex, Lodhi Road, New Delhi - 110 003, IndiaTel. (+91 11) 2468 2100 and 41504900Fax (+91 11) 2468 2144 and 2468 2145
© 1986 Panda Symbol WWF-World Wide Fund For Nature (Formerly World Wildlife Fund)WWF-India Secretariat172-B Lodi EstateNew Delhi - 110003Tel: 011 4150 4814, Fax: 011 4150 4779