the enthalpy of reaction of tris(hydroxymethyl) … · the enthalpy of reaction of tris ... i...
TRANSCRIPT
--------1
JOURNAL OF RESEARCH of the Natio na l Bureau of Standards - A. Physics a nd Chemistry Vol. 77A, No. 5, September-October 197:3
The Enthalpy of Reaction of Tris(hydroxymethyl)aminomethane With Hydrochlori'c Acid
Anthony P. Brunetti, * Edward J. Prosen, and Robert N. Goldberg
Institute for Materials Research, National Bureau of Standards, Washington, D.C. 20234
(June 22, 1973)
The e nthalpy of reaction of tri s(hydroxymethyl)aminomethane with 0.1 N He] has been meas ured us ing a n isoperibol so lution calorimete r, e mployi ng a mod ified quartz the rmometer and an a utomatic digital data acq uisition sys tem. The enthalpy value obta ined at 298.15 K is 245.93 ± 0.26 J . g- I. Pa rti cul ar atte nti on was give n to possible sources of syste mati c erro r in the electri ca l ca librations.
Key words: Enthalpy of reaction; so lution calorimetry; s tandard reference materi al; tri s(h ydroxymethyl)aminomethane; thermochemistry.
1. Introduction
This s tudy was undertake n to establish the precision and accuracy of meaS Ul'eme nts that can be made with an isoperibol (isothermal jacket) solution calorimeter constru cted for future work on the thermochemi stry of calcium phosphates. The tes t reac tion selected for this purpose was the reaction of tris(hydroxymethyl)aminomethane (hereafter referred to as TRIS) with 0.1 N HCl. The samples of TRIS e mployed in the tes t reaction were parts of the pre paration issued as NBS Standard Reference Material No. 724a (NBS-SRM 724a).
A summary [1]1 of values of high precision for the TRIS-HCl reaction reports interlaboratory variations in th e enthalpy for thi s tes t reac tion greate r th an 0.4 percent. The majority of these values have been measured in isoperibol solution calorimeters and are slightly lower than the value reported in this work. Th e results of this study are in close agreement with those obtained in an adiabatic calorimeter used in the certification of NBS-SRM 724a [1].
2 . Materials
SRM 724a was used in all experiments. Prior to filling the sample ampoules, the TRIS was stored 1I1
a desiccator over a saturated aqueous solution of magnesium nitrate which gives 50 percent relative humidity. This procedure follows the recommendations of the NBS Standard Reference Material Certificate [7].
* Research Associate of the American Dental Association Resea rch Unit at the National Bureau of S tandards, Washington . D. C. 20234. Supported in part by Research Crant OE00572 10 the American DenIal Assoc ia tion from the Na tional I nslitute of Denial Research.
I Figures in bracke ts indicate literature refe rences al the e nd of this paper.
The HCl solutions were prepared using ACS reagent grade concentrated hydrochloric acid (37-38%) which was diluted to the desired concentration with freshly boiled distilled water. No special precautions were take n to exclude carbon dioxide during the filling of the calorimeter. The acid concentrations were determined by titrating the HCl solutions with sodium hydroxide solutions that were standardized with potassiul,11 acid phthalate (SRM 84h) using phenolphthalein as the e nd point indicator. The acid concentrations were 0.0996 N (Expt. Nos. 9 to 12) and 0.1011 N (Expt. Nos. 13 to 18).
The TRIS sample was introduced via a small glass funnel into cylindrical glass ampoules with very thinwalled ends. The ampoules hold a volume of 1.0 cm3
and are manufactured by the LKB Co mpany.2 Before filling, the ampoules were rinsed with ACS reagent grade acetone followed by distilled water and then dried in an oven. After filling, the ampoule was closed with a small rubber stopper which had bee n presoaked in HCl, rinsed with distilled water and dried. The stopper was sealed with warm bees wax and the ampoule submerged in 0.1 N HCl to check for leakage. It was then rinsed, dried and mounted on the stirrerampoule holder of the calorimeter.
3. Calorimetric Apparatus and Procedure
The calorimeter vessel , jacket and constant temperature water bath were manufactured by the LKB Company [2]. However, all auxiliary equipme nt , including the electrical energy and temperature meas-
2 Certain commercial material s are ide ntified in thi s paper in order to adequately specify the e xperimental procedures. Such identification does nol imply recommend ation or endorsement by the Nat ional Bureau of S tandards.
599
uring apparatus, were assembled from other sources and are described below. As this investigation proceeded several changes were made in various components of the apparatus and these will be described as well.
3.1. The Calorimeter
The isothermal jacket of the calorimeter, a can of nickel-plated brass, is immersed in a stirred-water bath whose temperature is regulated by means of a proportional controller. A test of the temperature stability of the bath, as measured at one point in the wellstirred bath, indicated that it was maintaining a constant temperature to within ±0.0015 K over a 15 hour period.
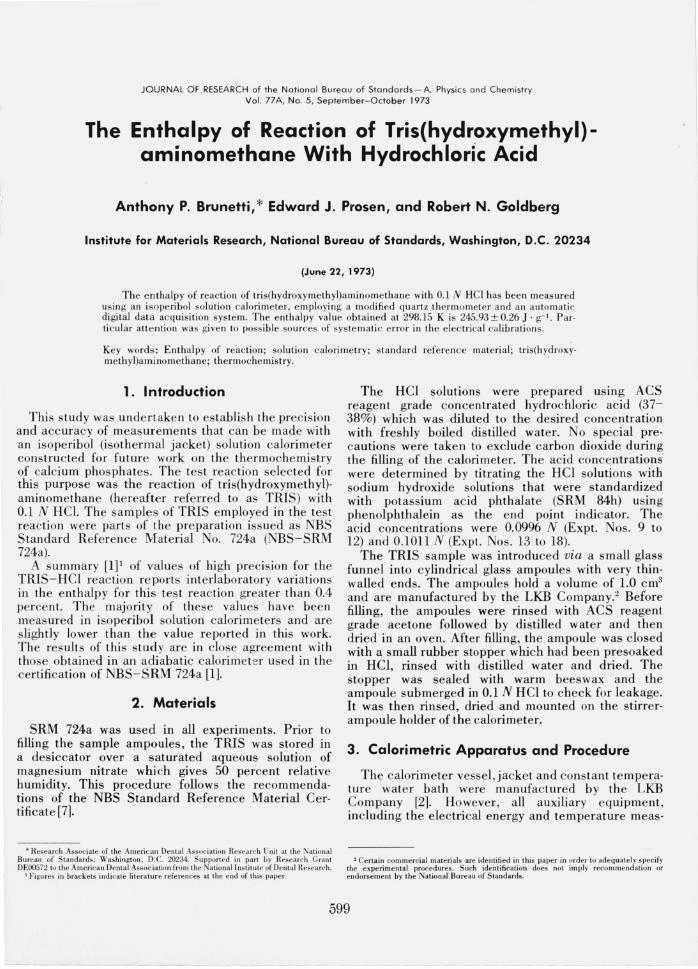
The first calorimeter vessel was constructed of thin-walled glass and held a volume of 100 cm 3. As received from the manufacturer the vessel contained three glass wells. One of the wells was specially added for installation of a quartz-oscillator probe. The other two glass wells held the electrical calibrating heater and a thermistor; the thermistor was not used in this work. The vessel is suspended from the lid of the submarine jacket by means of a screw connection and O-ring-seat at the top of its glass neck. The original glass vessel was broken in an accident following Expt. No. 11 and a second calorimeter vessel was constructed in the NBS glass blowing shop. It differed from the original in that its volume was llO cm3 and it was more nearly spherical than the original cylindrical vessel. The thermistor well was omitted and the walls of the heater and thermometer wells were made of thinner glass. The use of the new vessel (Expt. Nos. 12 to 18) had no observable effect on the value of the calorimeter heat leak modulus , the value of which was approximately 1.03 X 10- 4 S - I. A photograph of the second vessel is shown in figure 1.
Venting in the original calorimeter was only through the stirrer shaft bearings and housing. Since adequate venting of the calorimeter was desired, following Expt. No. 15, additional venting was provided by drilling a I-mm diam hole through the bottom and the top of the housing for the stirring shaft and inserting a syringe needle through these two holes. This needle provided direct venting from above the calorimetric liquid to the atmosphere.
The gold-plated combination stirrer-ampoule holder was driven at a constant speed of approximately 300 rpm by a synchronous motor through an O-ring belt and pulley arrangement. This replaced the original cable drive system.
3.2. The Calibrating Heater
The original heater consisted of 50-n of manganin wire wound bifilarly on a phenolic form located in the bottom of the heater well of the vessel. A light oil covered the heater. Insulated copper leads were soldered to the manganin wire and were passed through two thin polytetrafluoroethylene (PTFE) disks that were separated with a layer of Wood's metal. The Wood's metal provided thermal tempering of the leads
FIGURE 1. Calorimeter Reaction Vessel.
Calibration heater in left well and quartz-probe in right well , central glass pin is for breaking ampoules.
to the vessel. The copper leads, after passing through a second layer of Wood's metal, terminated at the top of the well where they were soldered to two small gold-plated connectors imbedded in an epoxy cement that sealed the heater well. Two short copper wire leads went from the connectors at the top of the heater well to a two-pin connector in the jacket lid. Current and potential leads were attached to each pin of the jacket connector.
After the original vessel was broken, the original heater was installed in the new vessel following the above method employed by the manufacturer as closely as possible and used in experiments 15 and 16. However, a new heater was constructed prior to Expt. No. 17. It was bifilarly wound with 82n of enamel-insulated manganin wire (#40 A WG) onto a piece of thin-walled stainless steel tubing that had been coated with insulating varnish and baked. Approximately six inches of PTFE-insulated copper wire (#30 A WG) was soldered to the manganin wire and then coiled and pushed down into the heater well. As in the original heater, a light mineral oil covered the heater and the thermal tempering and the sealing of the leads to the well of the calorimeter vessel was the same as described earlier. However, the two copper leads (#26 A WG, Formvar insulated) soldered to the PTFE-coated wire went directly to a four-pin connector. The four pins of the connector were shorted pair-wise at the connector to form the branch points for the current and potential leads (see fig. 1). The "thermal stationing" of the heater leads at the jacket was modified by removing the original connector and fitting a brass plug with a smaller hole, and placing a small four-pin feed-through connector into this hole.
600
----- - - - - - - - -
1
3.3. Electrical Energy Measurements
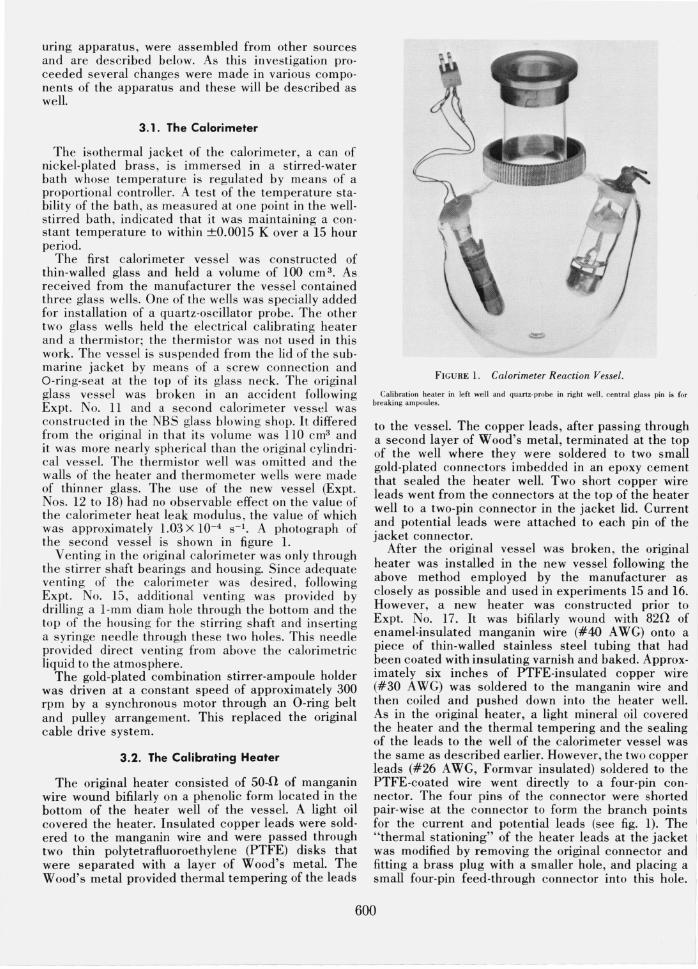
A schematic diagram of the electrical calibration circuit is shown in figure 2. The current through the heater and the potential drop across the heater were obtained from measurements of the potential drop across the I-n standard resistor and across a 2-kn resistor in the 20-kn volt box. Appropriate corrections were made for the current through the volt box and the leads connecting it to the branch points of the heater. As indicated in figure 2 , the circuit was always grounded only at one point, namely, at the power supply (Princeton Model 602R) which was operated in the constant voltage mode. (Note that the measuring resistors are near ground potential. Otherwise the circuit was found to be isolated from ground by at least 100-MO.) Voltages were measured on a Leeds and Northrup type K5 potentiometer (error limit of ±0.005% +0.03 /-tV) which was standardized against a Weston unsaturated standard cell. The standard cell was periodically compared with a ban k of NBS certified Weston saturated cells and all measuring equipment was calibrated and compared with other standards in this laboratory. Time measurements were made by inserting a timing circuit, consisting of an electronic counter (HP 5325 B) with a resolution of 1 ms, parallel to the electrical calibration circuit (point A in fig. 2). Current flowing through this parallel circuit has no effect on the meas· urement of the heater current and voltage since it is outside of the measuring circuit.
The above circ uit and apparatus were used in Expt. Nos. 13 to 18. In Expt. Nos. 9 through 12 a completely separate electrical circuit was used. It differed from the above in that (1) there was no volt box across the heater, (2) a digital voltmeter (Hewlett Packard 3450A; input resistance > 1010n, sensitivity of ± 1/-t V) was used to meas ure the potential drops across the heater and a standard resistor (O.ln) in series with the heater, (3) a different power supply (Princeton 602CR) was used , and (4) a mercury relay was used to switch between the ballast resistor and the heater side of the circuit.
CALORIMETER HEdTER
VOLT BOX
ElECTRONIC COUNTER
POWER '!' SUPPLY
The total electrical energy was calculated from the product of the current through the heater , voltage across the heater and time interval of heating. It was assumed that the heat generated in the heater leads between the calorimeter vessel and jacket was apportioned one-half to the calorimeter vessel and the other half to the jacket. The resistance of the leads between the jacket and the calorimeter vessel was 0.04 percent of the resistance of the calibration heater; therefore, a correction of 0.02 percent was applied to the measured electrical energy for the heat lost to the jacket.
It was observed that the heater resistance, as determined from the current and potential measurements, was dependent on the power level applied to the heater. This effect is attributable to the change in resistance of the heater wire as the temperature in the well rises , and became significant at power levels approaching 2 W. Power input during the TRIS experiments was maintained below this level and by measurement of the current through and the potential drop across the heater under load conditions, any change in heater resistance was automatically accounted for in the electrical calibrations.
The powe r input was l.18 W, in Expt. Nos. 9 through 16, 0.95 W in Expt. No. 17, and 0.13 W in Expt. No. 18. The time interval of electrical heating was varied from approximately 100 to 1000 s.
In order to test for possible errors associated with the electrical calibrations, a second, temporary heater with a resistance of 870 was placed directly into the water of the solution vessel. This heater was coated with Apiezon "W" wax and no electrical leakage was detectable using the high impedance scale of a voltohm meter (the electrical resistance was estimated to be greater than 100 Mn). Several centimeters of the leads from this heater were coiled and submerged with it in the water to insure good thermal tempering. The two current leads were then passed through the I-mm vent holes of the housing for the stirrer shaft, and were stationed at the top of the shaft-housing where potential leads were attached. Repeated determinations of the calorimeter electrical energy equivalent, alternating between the permanent heater in the well and the temporary heater in the water of the solution vessel, gave a difference between the means of three determinations with each heater of 0.006 percent, with none of the deviations from each of the means being greater than 0.009 percent. In calculating the heater-lead correction for the temporary heater the calorimeter boundary was chosen to be one-half the distance between the surface of the water in the vessel and the jacket lid. The heater lead correction was approximately equal to that for the permanent heater.
lun 1Kn 3.4. Thermometry and Data Acquisition
The temperature of the calorimeter vessel was POTENTIOMETER determined by means of a Hewlett-Pac kard quartz
oscillator thermometer [3]. The TO-5 transistor case FIGURE 2. Diagram of circuit used for electrical energy equivalent containing the temperature -sensitive quartz crystal
determinations. was removed from its original stainless steel capsule,
601
~8-076 0 - 73 - 3
placed in the bottom of the glass well in the solution vessel, and covered with light mineral oil. The leads from the quartz crystal were thermally stationed to the calorimeter vessel by passing them through a layer of dental amalgam which was contained between two thin PTFE disks. At the top of the well the leads were soldered to two small, gold·plated pin connectors which were imbedded in the epoxy cement that sealed the well (see fig. 1).
The temperature de pendence of the frequency of the quartz probe is nominally 1000 Hz· K- I [3], and by counting for 100-s, a temperature resolution of 10 JLK is obtained. In order for this resolution to be meaningful, it is necessary that the reference oscilla· tor in the quartz thermometer chassis be stable to within 3 parts in 1010 during an experiment. It was found by one of us (E1P) that this stability was obtained by replacing the ceramic trimmer-capacitor in the oscillator circuit of the reference oscillator with an air capacitor. To check this stability the reference oscillator frequen cy was monitored against a standard frequency available at NBS which is reproducible to 1 part in 1011.
The digital output from the quartz thermometer and from a digital clock with O.l-s resolution, went to a digital coupler and then to a teletype where the time and temperature data were logged both on punched paper tape and in typed form.
The absolute temperature of the quartz thermometer from 295 to 303 K was obtained to within ±0.003 K by comparison with a platinum resistance thermometer that · had been calibrated by NBS (IPTS 1948). In performing the comparison, the platinum thermometer was placed in the stirred-water jacket of the calorimeter and its temperature was compared with the quartz oscillator temperature by measurement of the voltage of a differential copper-constantan thermocouple between the vessel and the jacket. One of the thermocouple junctions was cemented to a thin, insulated silver tab cemented to the side of the solution vessel, the other wax-coated junction was located in the bath near the platinum thermometer. Throughout this procedure the water in the solution vessel was stirred and the calorimeter was maintained near its convergence temperature to minimize the temperature difference between the calorimeter and the jacket.
3.5. Experimental Procedure
All weighings were done on a single-pan micro· balance with a sensitivity of one microgram. The balance was calibrated against a set of Class M metric weights that had been calibrated by the Mass Section of NBS. Corrections to vacuum were made using a density of 1.35 g. cm- 3 for TRIS. The density of air was determined by daily observations of the temperature, pressure and humidity and corrections were applied as described by Bowman et al. [4]. Care was taken, employing uranyl nitrate in the balance chamber, to avoid electrostatic charge effects that might interfere with the weighings. A molecular weight of 121.1369 g. mol- 1 TRIS was assigned on the basis of the 1969 table of atomic weights [5] .
Each calorimetric experiment included three parts, an electrical calibration, the TRIS-HCI reaction, and finally a second electrical calibration. Each part consisted of approximately 30 data points (each point being recorded at 101.6-s intervals) which included an initial rating period, a main period, and a final rating period. Following each part, dried, cold air (introduced via a stainless steel tube temporarily inserted through a hole in the lid of the jacket) was blown over the exterior surface of the vessel in order to cool it. The electrical heatings and chemical reaction were thus carried out over the same temperature I
interval (within a few hundredths of a kelvin). In all experiments the final temperature of the calorimetric vessel was 0.05 to 0.17 K below the convergence temperature.
4. Calculations
4.1. Corrected Temperature Rise
The following treatment to obtain the corrected temperature rise was developed with the help of R. L. Nuttall, NBS Thermochemistry Section. i\
I The corrected temperature rise (ilTcorr) was calculated [6a] using eq (1),
where Ti and Tf are, respectively, the temperatures at ti, a time during the initial rating period, and tj, a time during the final rating period. In eq (1), k is the calorimeter heat leak modulus or cooling constant, and T co is the convergence temperature. The time, t;, was chosen as the time just before heat, either electrical or chemical, was introduced into the calorimeter; the time, tj, was chosen as anyone of several points in the final rating period. The quartz thermometer is an integrating device and will automatically evaluate ' a part of the integral in eq (1), as indicated below in eq (10). To utilize this feature of the quartz thermometer over the entire main period the times ti and tf must be, and were, chosen at the end points of integration periods of observed quartz thermometer readings. During the rating periods the rate of tempera- ' ture change is given by eq (2).
(2)
The integrated form of this equation is
(3)
where To is temperature at the time to, any selected time in the particular rating period used. It is convenient to select to in eq (3) as equal to ti in the initial period and equal to tf in the final period. This has been done in eqs (7) and (8) below.
Since the quartz thermometer is an integrating device the reading, (), displayed by the quartz ther-
602
mometer is the time-average te mperature over the integration interval , A, as given by eq (4) and was referenced to the midtime of the inte rval:
_ ~ i l+>../2 () - \ Tdt_ J\. t- >"/2
(4)
Su bstitution of T from eq (3) into eq (4), results in the following expression for () during rating periods:
e 2 -e 2 [
.lil - IrA ] ()=L,-(Too -To)e- k(t- to)_ kA . (5)
By defining two new constants , ()", = To" and
we get:
(6)
Thus, we have for the initial and final rating periods, res pectively, the following equations:
(}T = () OO - (() ", -()j)e- k(tT - >.. /2- ti) (7)
(}T= ()", - (()oo - ()f )e- k(tT- >../2- 1j) (8)
where tr's are the times at the end of the thermometerintegration periods at which time the readings ()T
appear on the r ead-out , ti is the time at the end of the initial period , and tf is the time at the s tart of the final period. Equations (7) and (8) were fitted to the
t time-quartz thermom eter data (()r, tT ) of the initial and final rating periods as a single set of data by using a nonlinear least squares procedure [8]. From this fit the parameters k, ()oo , ()j, and ()f are obtained. The observed temperature rise , Tf - T; , can then be shown to be given by
Tf- T;= (()f-()i) [ ~ kA-:..!0...]. (9) e 2 -e 2
The last factor in eq (9) depends on k and A. In thi s calorimete r k == 0.0001 S - 1 and A == 100 s. Thus
- ----
the factor has the value 0.999996 and can almost be neglected.
The correction to the observed temperature ri se, i. e., the integral in eq (1), can be writte n as
r~ If. k Jt. (T", -T) dt= kT", (tf- t;) -k tTdt . , I
(10)
The integral on the right side of eq (10) was evaluated in two parts : (1) an integral over the thermometer integration time which , for the ·nth time interval is equal to A()n ; (2) an integral over the dead time (the fraction of a second during which the counter is tra nsmitting data to the coupler) which is evaluated by assuming a linear temperature chan ge between adjacent data points.
Equation (1) can also be written in the form,
(11)
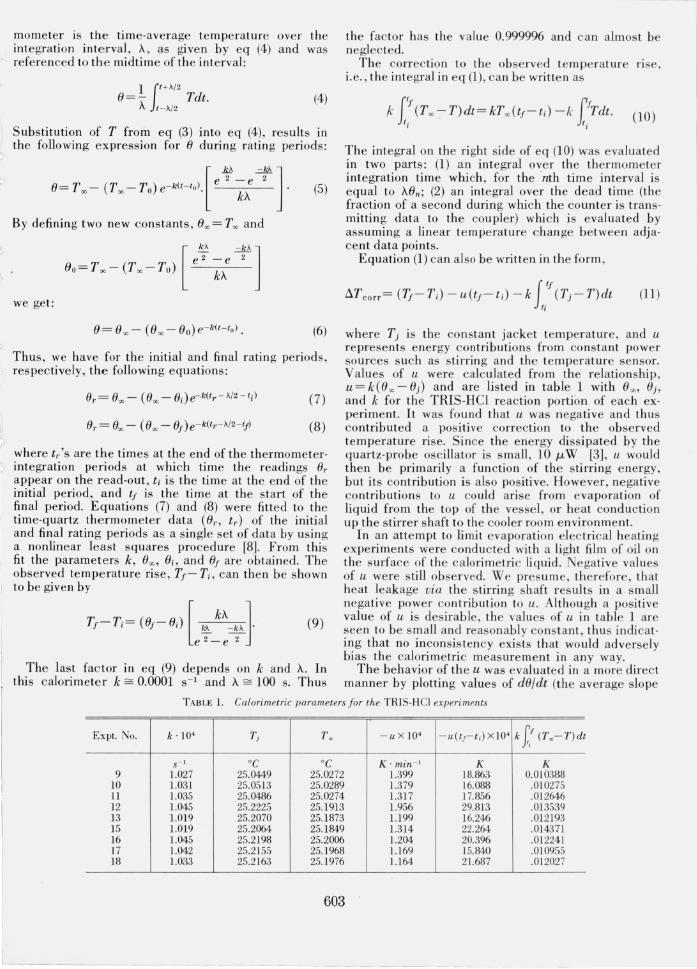
where T j is the constant jacket temperature, and u represents e nergy contributions from co ns ta nt power sources such as stirring and the temperature sensor. Values of u were calculated from the relationship. u=k(() oo- () j) and are listed in table 1 with () "" ()j, and k for the TRIS-HCl reaction portion of each experime nt. It was found that u was negative and thus contributed a positive correction to the observed temperature rise. Since the e nergy di ssipated by the quartz-probe oscillator is small, 10 I.l. W [3] , u would then be primarily a function of the stirring e nergy, but its contribution is also positive. However, negative contributions to u could arise from evaporation of liquid from the top of the vessel, or heat conduction up th e s tirrer shaft to the cooler room environment.
In an atte mpt to limit evaporation elec tri cal heating experi me nts were conducted with a light film of oil on the surface of the calorimetric liquid_ Negative values of u were s till observed. We presume, therefore, that heat leakage via the s tirring shaft results in a . small negative power contribution to u. Although a positive value of u is desirable, the values of u in table 1 are seen to be small and reasonably constant, thus indicating that no inconsistency exists that would adversely bias the calorimetric measurement in any way.
The be havior of the u was evaluated in a more direct manner by plotting values of d()/dt (the average slope
TABLE 1. CaLorimet ric parameters/or the TRIS-HCI experiments
ExpL No. k · 10· T j T~ -uX 10' - u(tJ- t,) X 10· k f (T~-T)dt s o l °C °C K · min- l K K
9 1.027 25.0449 25.0272 1.399 18.863 0.010388 10 1.03] 25.0513 25.0289 1.379 16.088 .010275 11 1.035 25.0486 25.0274 1.317 17.856 .012646 12 1.045 25.2225 25.1913 1.956 29.813 .013539 13 1.019 25.2070 25. 1873 LI99 16.246 .012193 15 1.019 25.2064 25. 1849 1.314 22.264 .014371 16 1.045 25.2198 25.2006 1.204 20.396 .01224] 17 1.042 25.2155 25.1968 LI69 15.840 .010955 18 1.033 25.2163 25. 1976 LIM 21.687 .012027
603
0.020 f-
-
0 . 016
'" o 0.012 rl o rl
~ ~
"" o rl U)
0 . 008 I-
0 . 00 4
I I
-
-a,,: b ,,:
,," .. ::' c
d .... -e
,,' ....
o I- ~~~,( , I I /
" I~ I //
I I o 0 . 4 0 .8 0.12 0.16
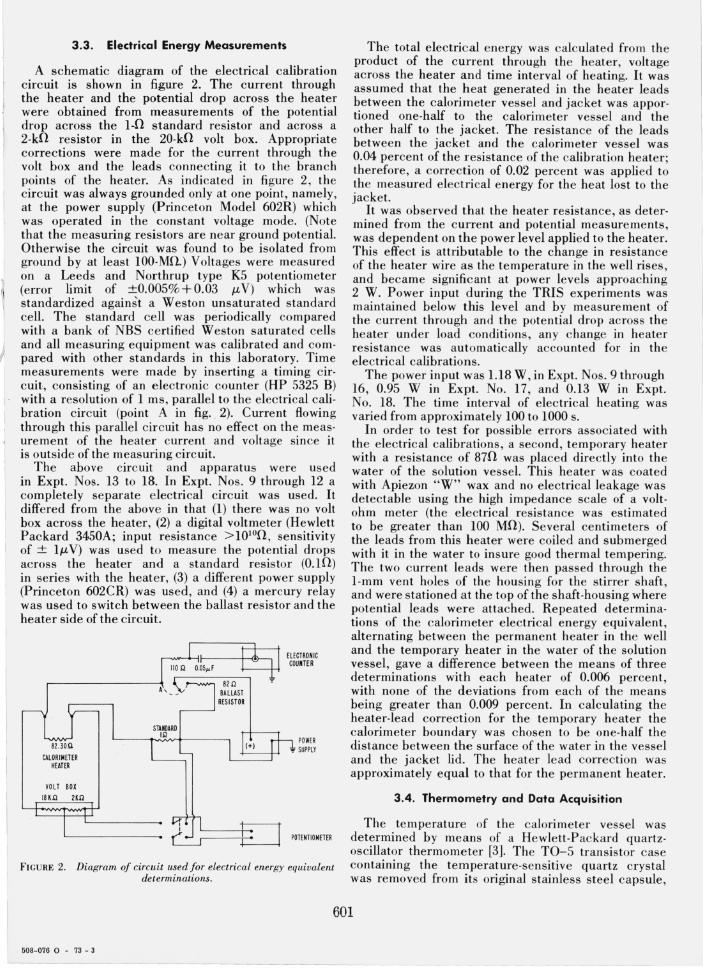
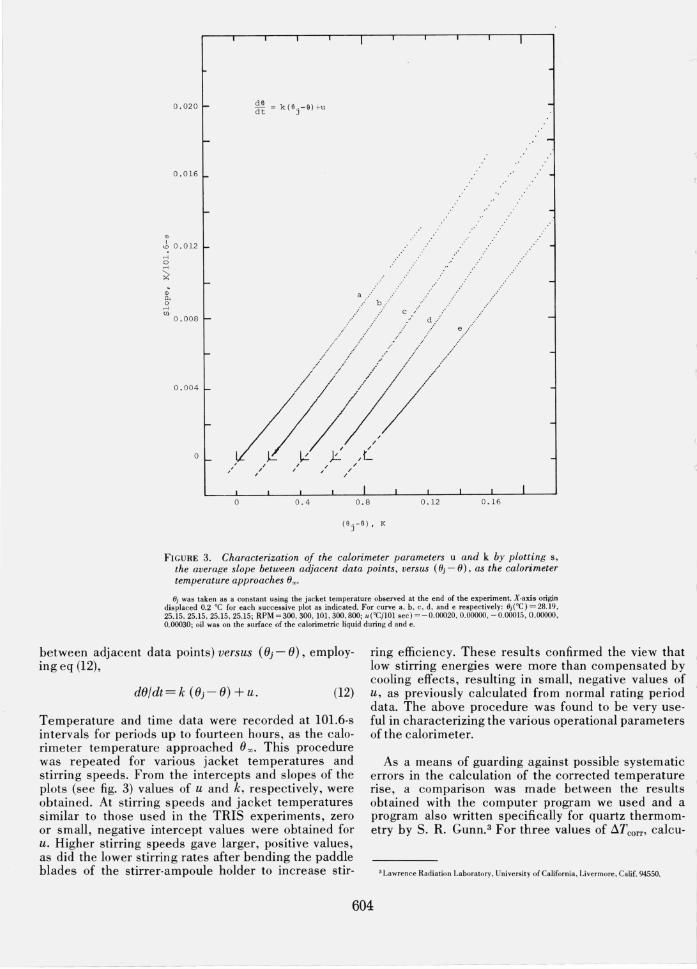
FIGURE 3. Characterization of the calorimeter parameters u and k by plotting s, the average slope between adjacent data points, versus (OJ - 0), as the calorimeter temperature approaches O~.
OJ was taken as a constant using the jacket temperature observed at the end of the experiment. X-axis origin displaced 0.2 °C for each successive plot as indicated. For curve a, b, c, d, and e respectively: 8j (OC) = 28.19 , 25.15, 25.15, 25.15 , 25.15; RPM = 300, 300, !OI , 300, 800; u(OC/IOI sec) = -0.00020, 0.00000, - 0.00015,0.00000, 0'{)0030; oil was on the surface of the calorimetric liquid during d and e.
between adjacent data points) versus (8j - 8), employing eq (12),
(12)
Temperature and time data were recorded at 101.6-s intervals for periods up to fourteen hours, as the calorimeter temperature approached 8,,_ This procedure was repeated for various jacket temperatures and stirring speeds. From the intercepts and slopes of the plots (see fig. 3) values of u and k, respectively, were obtained. At stirring speeds and jacket temperatures similar to those used in the TRIS experiments, zero or small, negative intercept values were obtained for u. Higher stirring speeds gave larger, positive values, as did the lower stirring rates after bending the paddle blades of the stirrer-ampoule holder to increase stir-
ring efficiency. These results confirmed the view that low stirring energies were more than compensated by cooling effects, resulting in small, negative values of u, as previously calculated from normal rating period data. The above procedure was found to be very useful in characterizing the various operational parameters of the calorimeter.
As a means of guarding against possible systematic errors in the calculation of the corrected temperature rise, a comparison was made between the results obtained with the computer program we used and a program also written specifically for quartz thermometry by S. R. Gunn. 3 For three values of t:..Tcom calcu-
3 Lawrence Radiation Laboratory, University of California, Livermore, Calif. 94550.
604
, ,
<

l v
(
TABLE 2. Calorimetric data for the reaction of TRIS with 0.1 N HCI
Electrical energy Mass of Corrected Assigned Expt. equivalent TRIS in tern perature Q reaction -Q vapor· reaction - ~H(298 .1 5 K) No. ization
Initial Final vacuum
J. K - l J. K- l g 9 a 443.839 444.609 0.500758
10 a 444.373 444.977 .505858 11 a 446.939 446.793 .505409 12 b 491.951 492.334 .558259 13 c 492.932 493.531 .557665 15 d 491.587 491.693 .537582 16 d 492.310 492.839 .562404 J7 e 493.010 494.116 .560898 18 e 493.129 493.693 .543787
rise
K J J 0.277398 123.227 0.030
.279860 124.447 .030
.278566 124.482 .028
.279037 137.326 .024
.277890 137.064 .022
.269113 132.307 .023
.280911 138.370 .022
.279550 137.976 .022
.270891 133.661 .023
temperature
°C 24.789 24.785 24.779 24.951 24.962 24.967 24.971 24.986 24.994
J. g- J 245.836 245.758 246.032 245.962 245.767 246.109 246.030 246.009 245.829
Mean - 245.926 Sdm = 0.043
Experiment Nos. 1 to 8 were the first measurements made with the solution calorimeter facility. Difficulties were experienced due to erratic stirring energy and a malfunctioning timer. Expt. No. 14 was not comple ted. Therefore these experiments were not included in table 2.
a Original vessel, digital voltmeter employed in calibration circuit. b Second vessel , original heater installed. c As b, but potentiometer now in calibration circuit. d As c, with calorimeter vent ing increased. e As d , with new calibration heater in vessel.
lated from the data of a typical TRIS experiment, two of the values agreed to within 0.002 percent, and the third to within O.Oll percent, clearly minimizing the probability of error from the method of data treatment.
4.2. Enthalpy of Reaction
The enthalpy of the TRIS- HCl reaction at the mean reaction temperature , Till , was calculated from eq (13)
(13)
where EE is the average of the initial and final state electrical energy equivalents. This enthalpy is equivalent to the isothermal enthalpy at the mean reaction temperature [6b], assuming no significant change in heat capacity over the temperature range of the measurement.
The measured enthalpy was corrected for the following effects: (1) the heat of vaporization of a small amount of water into the increased vapor space that resulted from breaking the sample ampoule (0.016 to 0.025%), and (2) the correction of the measured enthalpy to 298.15 K (0.004 to 0.130%). In applying the latter correction, flCp for the TRIS- HCl reaction was taken to be 1.435 J. K- ' . g- I [1]. No correction was made for the heat of breaking the ampoule. Several sealed ampoules, both empty and with a drop of water added, were broken in 0.1 N HCl. However, the analysis of drift data in experiments in which sample ampoules were and were not broken showed that the heat effect (0.015J) associated with breaking the ampoules is less than the uncertainty of the temperature rise calculation.
5. Results and Discussion
5.1. Experimental Results
The results of nine TRIS-HCI experiments are listed in table 2. Inspection of the calculated values of the reaction enthalpy indicates no apparent differences due to the various experimental parameters that were changed during the course of the investigation. Namely, th e changes made in the calibrating instruments, heaters, solution vessel, and venting did not affect the results . In vi ew of this, the nine results were averaged to give a value of -245.93 J' g- I (29791 ]-mol- ' ) with a standard de viation of the mean of O.043]-g- ' (5.2 J. mol- I).
5.2. Estimate of Uncertainty
In table 3 we estimate reasonable upper limits for possible sources of systematic errors in our experi ments. If all of the listed sources of systematic error were in the same direction , the res ults would be in error by 0.07 percent.
A reasonable assignment of uncertainty would be twice the standard deviation of the mean (±0.035%), if we were to assume that all of our measure ment errors were random errors. However, in view of possible sources of systematic error, we have added our estimate of possible systematic errors to the random error and assigned an overall uncertainty of ± 0.10 percent to the TRIS-HCI reaction enthalpy and obtain a value of - 245.93 ± 0.26 ]- g- I at 298.15 K.
5.3. Conclusion
The enthalpy reported in thi s paper for the TRISHCl reaction is olle of the higher values that have been
605
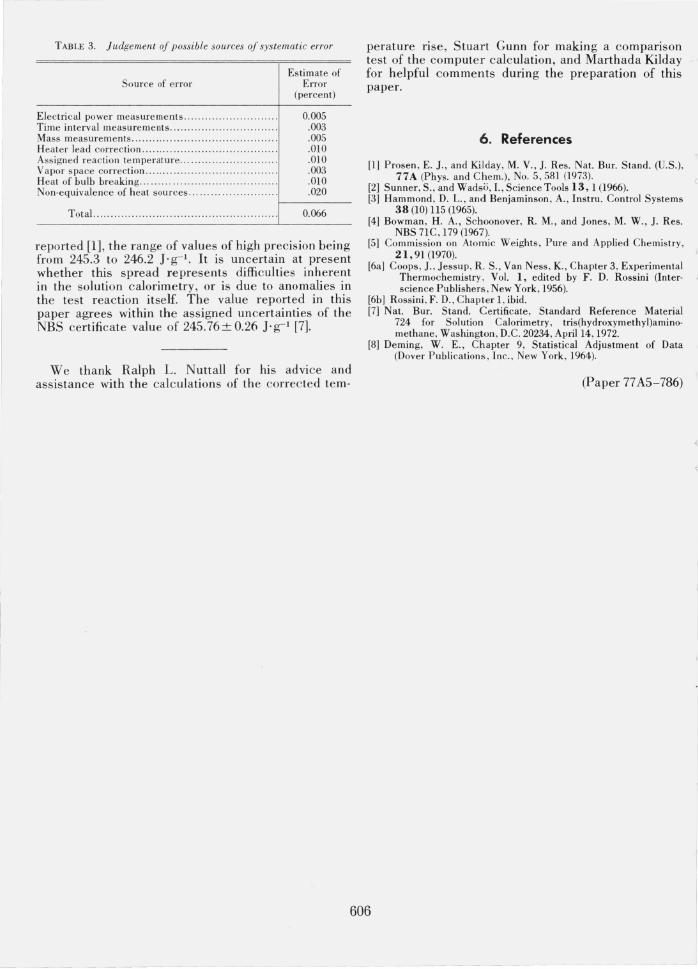
TABLE 3. Judgement of possible sources of systematic error
Source of e rror Estimate of
Error (percent)
Electrical power measurements .. .. . .... ....... .. ... . . .... 0.005 Time interval measurements.. . .. .... ........ .... .. . .... ... .003 Mass measurements. ...... .... ..... ........ ... ... . . . . ... ... .. .005 Heater lead correction........ . .. . . .. ........... .. .. .... .. .. . .010 Assigned reaction temperature... . .. .. . . ..... . . .. . . .. .... . .010 Vapor space correction... .. . .. ........ . .. .. . .. ......... ..... .003 Heat of bulb breaking.... ..... ........ . ... ..... . . ..... . .. . .. .010 Non·equivalence of heat sources... ... ..... . . ....... ... .. .020
Total.. .. ..... ... .. .. .. ... . . . .... ........ ... . .... . .... . . .. 0.066
reported [1], the range of values of high precision being from 245.3 to 246.2 J. g- l. It is uncertain at present whether this spread represents difficulties inherent in the solution calorimetry, or is due to anomalies in the test reaction itself. The value reported in this paper agrees within the assigned uncertainties of the NBS certificate value of 245.76 ± 0.26 J. g- l [7].
We thank Ralph L. Nuttall for his ad vice and assistance with the calculations of the corrected tem-
perature rise, Stuart Gunn for making a comparison test of the computer calculation, and Marthada Kilday . \ for helpful comments during the preparation of this paper.
6. References -(,
[1) Prosen, E. J. , and Kilday, M. V.,]. Res. Nat. Bur. Stand. (U.S.), I
77 A (phys. and Chern.), No.5, 581 (1973). [2) Sunner, S. , and Wad so, I. , Science Tools 13, 1 (1966). [3) Hammond , D. L., and Benjaminson , A., Instru. Control Systems
38 (10) 115 (1965). [4) Bowman, H. A., Schoonover, R. M., and Jones , M. W., J. Res.
NBS 7lC, 179 (1967). [5) Commission on Atomic Weights, Pure and Applied Chemistry,
21,91 (1970). [6a) Coops, J., Jessup, R . S., Van Ness , K. , Chapter 3, Experimental
Thermochemistry , Vol. 1, edited by F. D. Rossini (Inter· science Publishers, New York, 1956).
[6b) Rossini, F. D. , Chapterl, ibid. [7) Nat. Bur. Stand. Certificate, Standard Reference Material
724 for Solution Calorimetry, tris(hydroxymethyl)amino· methane, Washington, D.C. 20234, April 14, 1972.
[8) Deming, W. E. , Chapter 9, Statistical Adjustment of Data (Dover Publications, Inc., New York, 1964).
(Paper 77 A5-786)
r
606