the environmental dynamic efficiency of onshore oil fields
TRANSCRIPT

Keyword: Environmental sustainability. Oil fields. Environmental efficiency. Produced water.
Published Date: 7/1/2020 Page.135-151 Vol 8 No 07 2020
Abstract
One of the main environmental concerns associated with the exploration and production of oil fields is related to the
generation of produced water, this is a strategic challenge for companies since is resposible for the largest share of waste
genretared by the oil industry. This theme is presented as multidisciplinary since it is a study with dynamic models in an
environmental area linked to the oil industry. Thus, the present work aims to evaluate the performance of dynamic
environmental sustainability, from the generation of produced water from onshore oil fields located at the coastal basins
of Brazil with higher oil production. The data were made available by the ANP (National Petroleum Agency) from its
website, totalizing 67 fields during the years 2014, 2015 and 2016. In addition, dynamic Data Envelopment Analysis was
used to determine dynamic efficiency. The results showed a positive effect of the variables directional wells, vertical wells
and age, the first two variable showed a fundamental role in determining environmental efficiencies. Therefore, the results
allowed to state that there is a poor management of the technological resources in onshore fields of the Brazilian coastal
basins, generating excessive amounts of produced water.
The Environmental Dynamic Efficiency of Onshore Oil
Fields Located at The Brazilian Coastal Basin
Dr. Marcus Assunção;Dra. Mariana Almeida;prof. Dra. Marcela Marques Vieira
International Journal for Innovation Education and Research
ISSN: 2411-2933
DOI: https://doi.org/10.31686/ijier.vol8.iss7.2462
International Journal for Innovation Education and Research www.ijier.net Vol:-8 No-07, 2020
International Educative Research Foundation and Publisher © 2020 pg. 135
The Environmental Dynamic Efficiency Of Onshore Oil Fields
Located At The Brazilian Coastal Basin
Dr. Marcus Assunção
Doctor in Engineering; Master in Administration; Professor of Logistics of IFRN.
Dra. Mariana Almeida
Doctor in Production Engineering; Associate Professor of PEP/UFRN
prof. Dra. Marcela Marques Vieira
Doctor in Production Engineering; Associate Professor of PEP/UFRN
ABSTRACT
One of the main environmental concerns associated with the exploration and production of oil fields is
related to the generation of produced water, this is a strategic challenge for companies since is resposible
for the largest share of waste genretared by the oil industry. This theme is presented as multidisciplinary
since it is a study with dynamic models in an environmental area linked to the oil industry. Thus, the
present work aims to evaluate the performance of dynamic environmental sustainability, from the
generation of produced water from onshore oil fields located at the coastal basins of Brazil with higher oil
production. The data were made available by the ANP (National Petroleum Agency) from its website,
totalizing 67 fields during the years 2014, 2015 and 2016. In addition, dynamic Data Envelopment Analysis
was used to determine dynamic efficiency. The results showed a positive effect of the variables directional
wells, vertical wells and age, the first two variable showed a fundamental role in determining
environmental efficiencies. Therefore, the results allowed to state that there is a poor management of the
technological resources in onshore fields of the Brazilian coastal basins, generating excessive amounts of
produced water.
Keywords: Environmental sustainability. Oil fields. Environmental efficiency. Produced water.
1. INTRODUCTION
Nowadays, oil can be considered the most important source of energy, since it produces multiple
derivatives (gasoline, kerosene, bitumen, etc.) in order to meet an ever increasing demand from society.
According to data from the IEA (International Energy Agency), it is estimated that in 2018, the daily
demand for oil reached the level of 146.2 million barrels per day worldwide. Despite this latent growth in
oil production, there is an important trade-off in this production system between the development of the oil
sector and the increase of waste generation inherent to the process, representing threats to the environment
and environmental sustainability of this industry.
International Journal for Innovation Education and Research www.ijier.net Vol:-8 No-07, 2020
International Educative Research Foundation and Publisher © 2020 pg. 136
The oil and gas production processes produce large volumes of liquid waste, among which stands
out the generation of produced water. This term is used to describe a water that is produce along with oil
and gas during production, that is often injected into wells in order to increase oil recovery (Venkatesan &
Wankat, 2017)
This undesirable fluid is an inextricable part of the hydrocarbon recovery process. As the fields
develop, they tend to produce increasing amounts of water (Khatib & Verbeek, 2003), and can reach values
close to 100% of the well's production as it reaches the end of its productive life.Thus, in view of the
problem exposed it is evident the damage caused to the environment due to the repeated and constant
generations of water produced by the oil and gas industry, promoting damage to the environmental
sustainability of the industry, generating challenges for researchs for efficiency.
One of the most used techniques to measure the efficiency of a set of decision units is Data Envelopd
Analysis (DEA), whose application has spread through several areas, assisting in decision-making for
greater efficiency (Liu, Lu, Lu & Lin, 2013). The DEA uses a non-parametric method, whose objective is
to determine the efficiency curve from a mathematical optimization schedule, allowing to analyse the
relative performance of similar production units (Cook & Seiford, 2009).
Considering the relevance of this theme, it was identified the scarcity of quantitative studies related
to the evaluation of productive efficiency in the oil and gas industry, especially with the consideration that
the production system has an undesirable output, the "produced water". Through the importance and impact
of environmental issues on the oil industry, this study continues the considerations of Song, Zhang & Wang,
2015, Sueyoshi & Goto, 2012 and Sueyoshi & Goto, 2012a.
However, this is a distinct analysis, since it aims to investigate the dynamic aspects of production
through an adequate modeling (DDEA), in order to monitor the environmental performance of productive
fields of the Brazilian coastal basins for both productive and environmental issues, showing the
multidisciplinarity of this theme. This transversality of knowledge brings to the end the need to research
about the themes that use multiple sciences for their development, as can be attested in the case of the
environment area.
Therefore, this work aims to evaluate the dynamic environmental efficiency of oil fields located at
the Brazilian coastal basins, considering the years 2014, 2015 and 2016, through Data Envelopment
Analysis (DEA). This evaluation was structured in the considerations of Golany & Roll (1989),
characterized by constant returns of scale and product orientation. Moreover, this study seek to promote a
significant contribution to specialized literature regarding the oil and the environment area, since it deals
with an environmental efficiency model capable of measuring the performance of an oil field focusing on
the output of an undesirable product: produced water. In addition to the contribution related to the
environmental area, the study contributes to the literature of DEA, since studies using it in the oil sector
are still insipid, especially with the use of dynamic models.
2. EFFICIENCY MODELS APPLIED TO THE OIL INDUSTRY
Industrial development is important to all nations when evaluating their economic prosperity.
However, this development causes trade-offs among which stand out: air pollution, water and other types
International Journal for Innovation Education and Research www.ijier.net Vol:-8 No-07, 2020
International Educative Research Foundation and Publisher © 2020 pg. 137
of contamination, that result in health problems to the population and climate change. Thus, it is necessary
to consider how to reach a balance between economic success and pollution mitigation to maintain a high
level of social and environmental sustainability worldwide (Sueyoshi, Yang & Goto, 2017).
In order to better understand these socioclimatic changes and seek for the best practices of
environmental sustainability, Sueyoshi, Yang & Goto (2017) systematized a broad research from the world
theoretical framework in the area of energy and environment, being it dividedin the areas of energy and
environment for a better methodological segmentation.
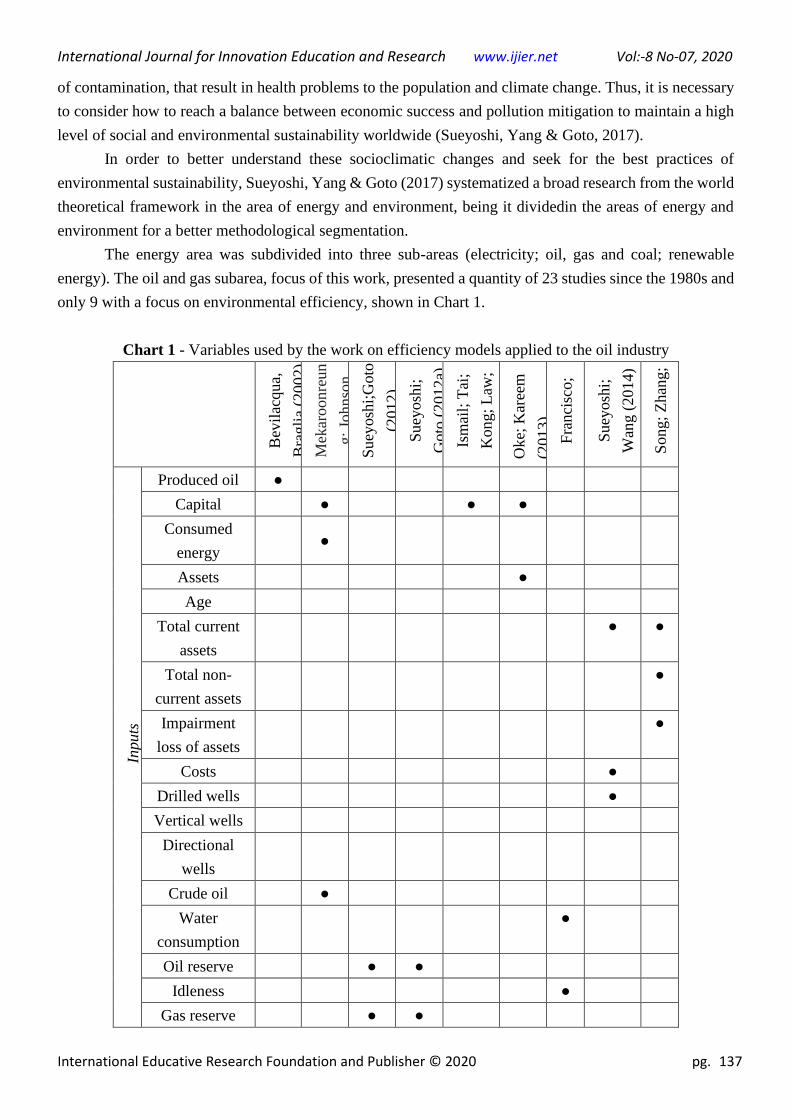
The energy area was subdivided into three sub-areas (electricity; oil, gas and coal; renewable
energy). The oil and gas subarea, focus of this work, presented a quantity of 23 studies since the 1980s and
only 9 with a focus on environmental efficiency, shown in Chart 1.
Chart 1 - Variables used by the work on efficiency models applied to the oil industry
Bev
ilac
qua,
Bra
gli
a (2
002)
Mek
aroonre
un
g;
Joh
nso
n
(2010)
Suey
osh
i;G
oto
(2012)
Suey
osh
i;
Goto
(2012a)
Ism
ail;
Tai
;
Kong;
Law
;
Shir
azi;
Kar
im
(2013)
Oke;
Kar
eem
(201
3)
Fra
nci
sco;
Alm
eida;
Sil
va
(2013)
Suey
osh
i;
Wan
g (
2014)
Song;
Zhan
g;
Wan
g (
2015)
Inputs
Produced oil ●
Capital ● ● ●
Consumed
energy ●
Assets ●
Age
Total current
assets
● ●
Total non-
current assets
●
Impairment
loss of assets
●
Costs ●
Drilled wells ●
Vertical wells
Directional
wells
Crude oil ●
Water
consumption
●
Oil reserve ● ●
Idleness ●
Gas reserve ● ●

International Journal for Innovation Education and Research www.ijier.net Vol:-8 No-07, 2020
International Educative Research Foundation and Publisher © 2020 pg. 138
Cost ● ●
API Grade
Manpower ● ●
● ● O
utp
uts
Des
irab
le
Oil
production
● ● ●
Gas ●
Distilled ●
Gas
Production
● ●
Profits ● ● ●
Undes
irab
le
Gas
emission ●
●
Produced
water
Toxic or
effluent ●
● ●
Unco
ntr
oll
able
Age of
refinery
●
Country Ital
y
US
A
US
A
US
A
Mult
iple
Countr
ies
Nig
eria
Bra
zil
US
A
Chin
a
Number of DMU's 28
113
19
19
17
5
10
50
20
Model CC
R
Hip
erbóli
c
o
CC
R/
DT
S*
CC
R/D
TS
*
CC
R/
Eco
efic
iên
cia
CC
R/B
CC
CC
R/
BC
C
UE
/ U
EN
/UE
M
UE
NM
/
UE
NM
(DC
)
DE
A
Red
es
Source: Research data, 2020.
*Disposability and Damages to Scale (DTS)
Bevilacqua & Braglia (2002) assessed the relative environmental efficiency of the seven oil
refineries created in Italy over a 4-year period (1993-1996), considering six different types of emissions
(CO, CO2, SO2, NOx, TSP, VOC)) as undesirable outputs and the annual amount of oil processed as inputs.
The results showed that refineries containing an environmental management system present better
efficiencies.
The work of Mekaroonreung & Johnson (2010) aimed to describe and compare various methods in
order to estimate the technical efficiency of 113 oil refineries operating in the United States between 2006
International Journal for Innovation Education and Research www.ijier.net Vol:-8 No-07, 2020
International Educative Research Foundation and Publisher © 2020 pg. 139
and 2007, considering the emission of toxic gases as an undesirable output. A hyperbolic efficiency
measure was applied to analyze the potential loss of each refinery due to environmental regulations. The
results indicated that domestic refineries could improve efficiency, regardless of disposal assumptions, and
that environmental regulations would reduce the amount of potentially desirable products produced by
some facilities.
Also in relation to the American reality, Sueyoshi & Goto (2012, 2012a) used the DEA to perform
an environmental assessment using non-radial DEA models in 19 oil companies: 14 American and 5
foreign. This study proposes three types of unification for environmental assessment of the DEA. The
results denoted greater efficiency for foreign companies, especially those from Saudi Arabia and Russia.
Another conclusion obtained was that the national oil companies would need to meet their own country's
environmental standard, while international oil companies should comply with international standards
stricter than national standards.
The reality of the Nigerian oil industries was studied by Oke & Kareem (2013) in order to
investigate the operational efficiency of five oil companies, taking as reference the years from 2006 to
2009. The application of the DEA CCR and the BBC was used for data analysis. The research found that
two companies operated below 10% of operational efficiency, causing an average efficiency of the
companies studied below 50%.
Ismail, Tai, Kong, Law, Shirazi & Karim (2013) designed a study focusing on analyzing the
environmental performance and economic efficiency of the global operations for 17 companies in 2008.
These companies were selected from the global oil industry by applying a comparison between technical
efficiency and eco-efficiency. The results showed a weak positive relationship between eco-efficiency and
technical efficiency in relation to the companies studied.
Song, Zhang & Wang (2015), took advantage of the DEA in networks to develop an environmental
efficiency model for 20 companies from the Chinese oil industry,, being compared the results of pollutant
treatment efficiency and production efficiency between years 2006 and 2011.
The same market approach adopted by Song; Zhang & Wang (2015), related to the Chinese oil
market, was used by Sueyoshi & Goto (2015). They considered 17 companies in the oil sector to calculate
the environmental efficiency index under evaluation from 2006 to 2009, evolving the model proposed by
Sueyoshi & Goto (2012, 2012a), since the malmquist index was included for this study. They concluded
that the industry did not exhibit any major boundary change over the evaluated years. When considering
companies, they saw a considerable boundary change under the capacity to manage and improve
environmental performance.
Thus, following the trend of studies in refineries (Sueyoshi & Goto, 2012, 2012a), an environmental
efficiency assessment, with emphasis on effluents and water consumption in the production process for 10
refineries from the Brazilian public sector was carried out by Francisco, Almeida & Silva (2013). The
classical methods of DEA (CCR, BCC) were applied in this research, considering a model of desirable
outputs and two others with undesirable outputs. Based on the comparison of the results, it was verified the
clear importance of the environmental variable for a more accurate analysis of the production process and
the rejection of the hypothesis that the age of the refinery would negatively interfere in production.
International Journal for Innovation Education and Research www.ijier.net Vol:-8 No-07, 2020
International Educative Research Foundation and Publisher © 2020 pg. 140
Sueyoshi & Wang (2014) proposed a corporate sustainability measure to reduce undesirable outputs
(e.g. CO2) through DEA. The study was conducted using data from 50 companies (integrated and
independent companies) from the oil sector of the United States. It was evidenced that integrated companies
overcome the independent due to the large supply chain incorporated into the first group provided them a
scale of merit in their operations as well as an opportunity to gain consumer opinions about their business
operations. Thus, the large supply chain system, which covers upstream and downstream business
functions, would increase corporate sustainability in the U.S. oil industry.
Tavana, Khalili-Damghani, Arteaga & Hosseini (2019) presented a multi-objective, customized
DEA model to evaluate the dynamic performance of oil refineries in the presence of undesirable results,
with an application in 9 refineries located in the United States.
Hu,Yan, Li, Yao & Feng (2020) developed a Network DEA model focusing on the production of
produced water. The Stage 1 is related to oil development while Stage 2 is associated with wastewater
treatment. Thus, considering that the model needs to solve undesirable results, a Data Envelopment
Analysis (DEA) Slack-Based Static Measurement (SBM) network structure model with a feedback
variable was established. Furthermore, a total of 13 oil fields were used and the results state there is a
stronger relationship between the efficiency of oilfield wastewater treatment and the entire system.
Few studies have been developed regarding the application of DEA in the oil industry focousing on
the environmental efficiency, most studies investigated the reality of the American oil industry through the
use of classic Models of DEA (CCR and BCC), making clear the need for development for this theme to
the use of more complex and robust models - hybrid, dynamic and in networks - already developed.
3. RESEARCH METHOD
This study is characterized as quantitative and exploratory, since it performed an evaluation of the
efficiency for 67 oil fields (with oil production below 14000m3/year) located at the basins of Alagoas,
Espírito Santo, Potiguar and Sergipe. For this, secondary data from National Petroleum Agency (ANP)
were collected for the years 2014, 2015 and 2016.
This sample cut-out made it possible to obtain a more homogeneous set of DMU's, which allowing
the use of the DEA tool, which presupposes homogeneity of the DMU's in order to ensure adequate results.
The study carried out by Dyson, Allen, Camanho, Podinovski & Sarrico (2001) discusses in depth
the issues related to homogeneity in DEA and how to ensure it. Data Enveloping Analysis (DEA) was
chosen because it is a method capable of measuring, with greater robustness, the efficiency of a set of
DMU's related to environmental sustainability issues (Sueyoshi & Goto, 2017).
The modeling adopted in the investigation corresponds to the dynamic model of DEA, once that the
research seeks to evaluate a three-year time frame. Thus, since it aims to understand the variations by period
and total of productive efficiency, the modeling proposed by Kao (2013) described in Equation 1, was
elected as the most appropriate for the reality explored in this work.

International Journal for Innovation Education and Research www.ijier.net Vol:-8 No-07, 2020
International Educative Research Foundation and Publisher © 2020 pg. 141
1
𝐸𝑘𝑅 = 𝑚𝑖𝑛. ∑ 𝑣𝑖. 𝑋𝑖𝑘
𝑚
𝑖=1
+ ∑ 𝑤𝑓 . 𝑍𝑓𝑘(0)
𝑔
𝑓=1
𝑠. 𝑡. ∑ 𝑢𝑟 . 𝑌𝑟𝑘
𝑠
𝑟=1
+ ∑ 𝑤𝑓 . 𝑍𝑓𝑘(𝑝)
= 1
𝑔
𝑓=1
(∑ 𝑣𝑖 . 𝑋𝑖𝑗
𝑚
𝑓=1
+ ∑ 𝑤𝑓 . 𝑍𝑓𝑗(0)
𝑔
𝑓=1
)
− (∑ 𝑢𝑟 . 𝑌𝑟𝑗
𝑠
𝑟=1
+ ∑ 𝑤𝑓 . 𝑍𝑓𝑗(𝑝)
𝑔
𝑓=1
) ≥ 0, 𝑗
= 1, … , 𝑛
(∑ 𝑣𝑖 . 𝑋𝑖𝑗(𝑡)
𝑚
𝑖=1
+ ∑ 𝑤𝑓 . 𝑍𝑓𝑗(𝑡−1)
𝑔
𝑓=1
)
− (∑ 𝑢𝑟 . 𝑌𝑟𝑗(𝑡)
𝑠
𝑟=1
+ ∑ 𝑤𝑓 . 𝑍𝑓𝑗(𝑡)
𝑔
𝑓=1
) ≥ 0
𝑗 = 1, … , 𝑛; 𝑡 = 1, … , 𝑝
𝑢𝑟 , 𝑣𝑖 , 𝑤𝑓 ≥ 𝜀, 𝑟 = 1, … , 𝑠; 𝑖 = 1, … , 𝑚; 𝑓
= 1, … , 𝑔
(1)
Where vi is the usefulness of input; ur is the output utility; wf is the usefulness of the
intermediate product; Xik is the amount of input i for DMU k; Yrk is the quantity of product r for DMU k;
Zfk(p)
is the amount of the intermediate product f for DMU k in period p; Zfj(p)
is the amount of the
intermediate product f for DMU j in period p; Zfk0 is the quantity of the intermediate product f for DMU k
that is the imput in the initial period; Zfj0 is the quantity of the intermediate product f for DMU j that is
entered in the initial period; Xijt is the amount of input i of DMU j in the period under analysis; Yrj
t is the
quantity of product r in the DMU j for the period; Zfjt−1 is the quantity of the intermediate product f for
DMU j in the period prior to that the one under analysis; and, Zfjt the quantity of the intermediate product
f of DMU j in the period under analysis.
With the optimal solution (ur∗, vi
∗, wf∗), one can calculate the efficiency of the whole system, Ek
s, and
International Journal for Innovation Education and Research www.ijier.net Vol:-8 No-07, 2020
International Educative Research Foundation and Publisher © 2020 pg. 142
period, Ek(t)
, with t = 1,..., p, for DMU k, using Equations 2 and 3, based on the second and third sets of
constraints of the model previously exposed:
𝐸𝑘𝑆 =
∑ 𝑢𝑟 . 𝑌𝑟𝑘 𝑠𝑟=1 + ∑ 𝑤𝑓 . 𝑍𝑓𝑘
(𝑝)𝑔𝑓=1
∑ 𝑣𝑖 . 𝑋𝑖𝑘 𝑚𝑖=1 + ∑ 𝑤𝑓 . 𝑍𝑓𝑘
(0)𝑔𝑓=1
(2)
𝐸𝑘𝑡 =
∑ 𝑢𝑟 . 𝑌𝑟𝑘(𝑡)
𝑠𝑟=1 + ∑ 𝑤𝑓 . 𝑍𝑓𝑘
(𝑡)𝑔𝑓=1
∑ 𝑣𝑖 . 𝑋𝑖𝑘(𝑡)𝑚
𝑖=1 + ∑ 𝑤𝑓 . 𝑍𝑓𝑘(𝑡−1)𝑔
𝑓=1
(3)
(2)
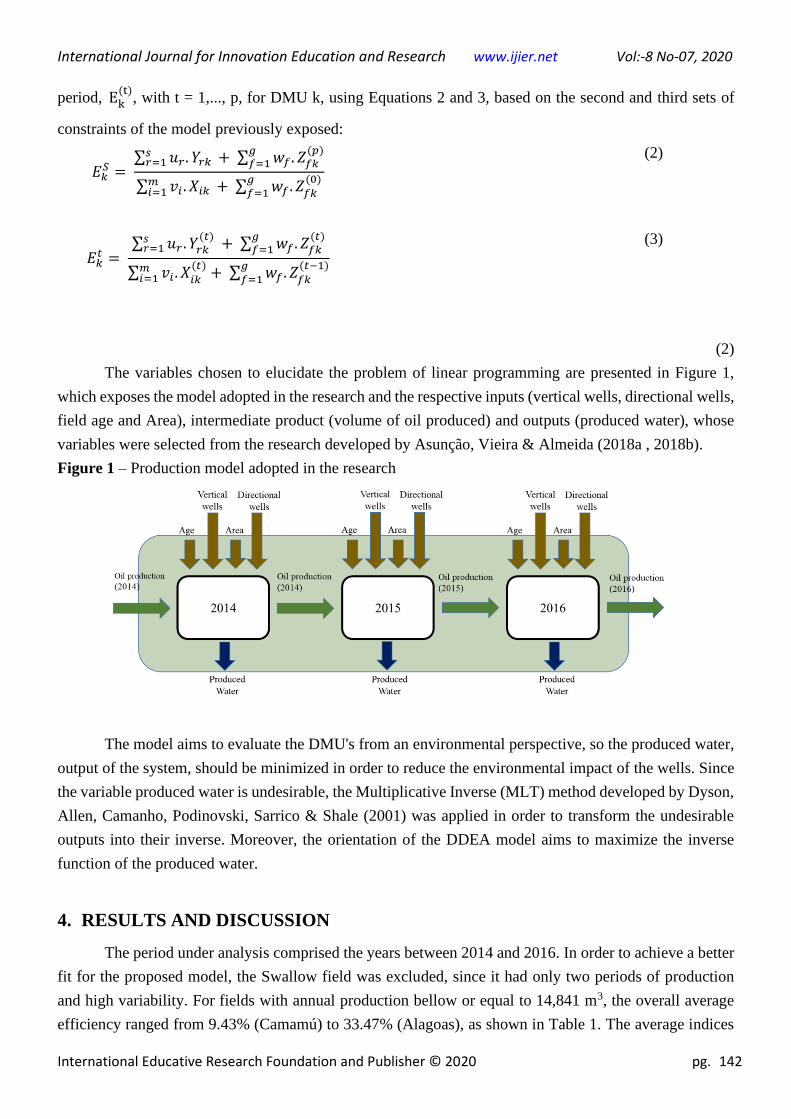
The variables chosen to elucidate the problem of linear programming are presented in Figure 1,
which exposes the model adopted in the research and the respective inputs (vertical wells, directional wells,
field age and Area), intermediate product (volume of oil produced) and outputs (produced water), whose
variables were selected from the research developed by Asunção, Vieira & Almeida (2018a , 2018b).
Figure 1 – Production model adopted in the research
The model aims to evaluate the DMU's from an environmental perspective, so the produced water,
output of the system, should be minimized in order to reduce the environmental impact of the wells. Since
the variable produced water is undesirable, the Multiplicative Inverse (MLT) method developed by Dyson,
Allen, Camanho, Podinovski, Sarrico & Shale (2001) was applied in order to transform the undesirable
outputs into their inverse. Moreover, the orientation of the DDEA model aims to maximize the inverse
function of the produced water.
4. RESULTS AND DISCUSSION
The period under analysis comprised the years between 2014 and 2016. In order to achieve a better
fit for the proposed model, the Swallow field was excluded, since it had only two periods of production
and high variability. For fields with annual production bellow or equal to 14,841 m3, the overall average
efficiency ranged from 9.43% (Camamú) to 33.47% (Alagoas), as shown in Table 1. The average indices
International Journal for Innovation Education and Research www.ijier.net Vol:-8 No-07, 2020
International Educative Research Foundation and Publisher © 2020 pg. 143
are low, however in accordance with the results derived from the relational model used due to the
dynamicity of production (Kao, 2013).
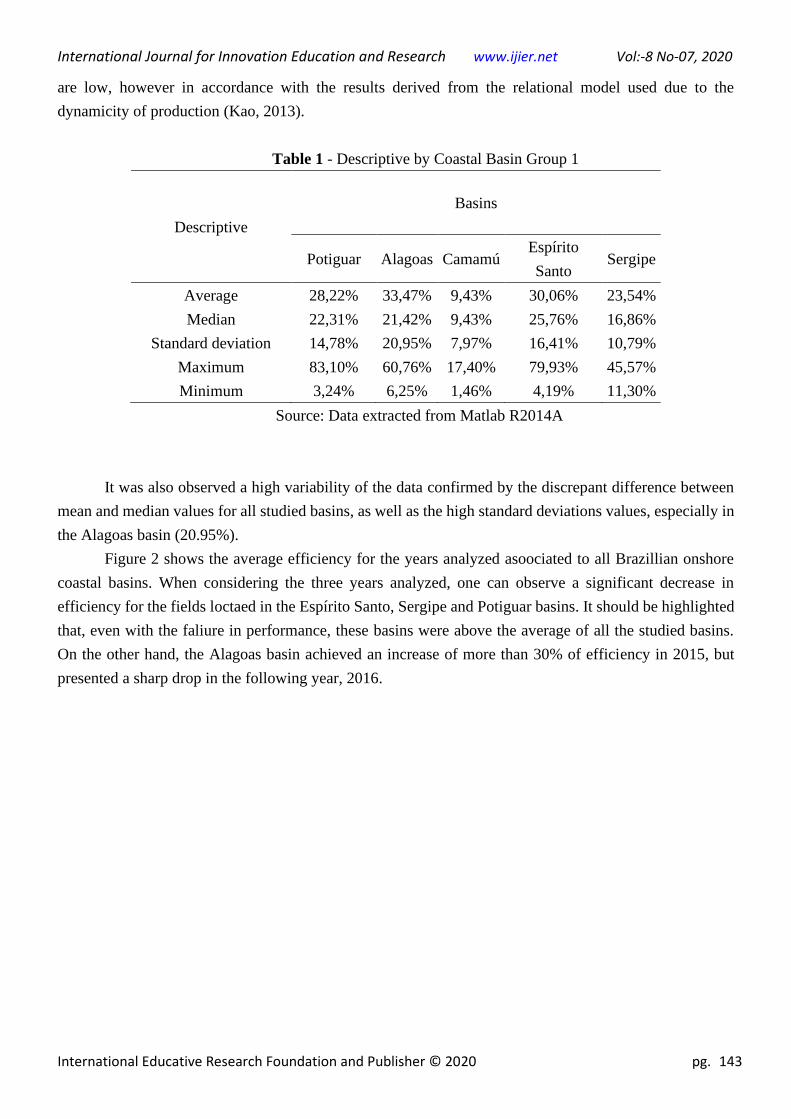
Table 1 - Descriptive by Coastal Basin Group 1
Descriptive
Basins
Potiguar Alagoas Camamú Espírito
Santo Sergipe
Average 28,22% 33,47% 9,43% 30,06% 23,54%
Median 22,31% 21,42% 9,43% 25,76% 16,86%
Standard deviation 14,78% 20,95% 7,97% 16,41% 10,79%
Maximum 83,10% 60,76% 17,40% 79,93% 45,57%
Minimum 3,24% 6,25% 1,46% 4,19% 11,30%
Source: Data extracted from Matlab R2014A
It was also observed a high variability of the data confirmed by the discrepant difference between
mean and median values for all studied basins, as well as the high standard deviations values, especially in
the Alagoas basin (20.95%).
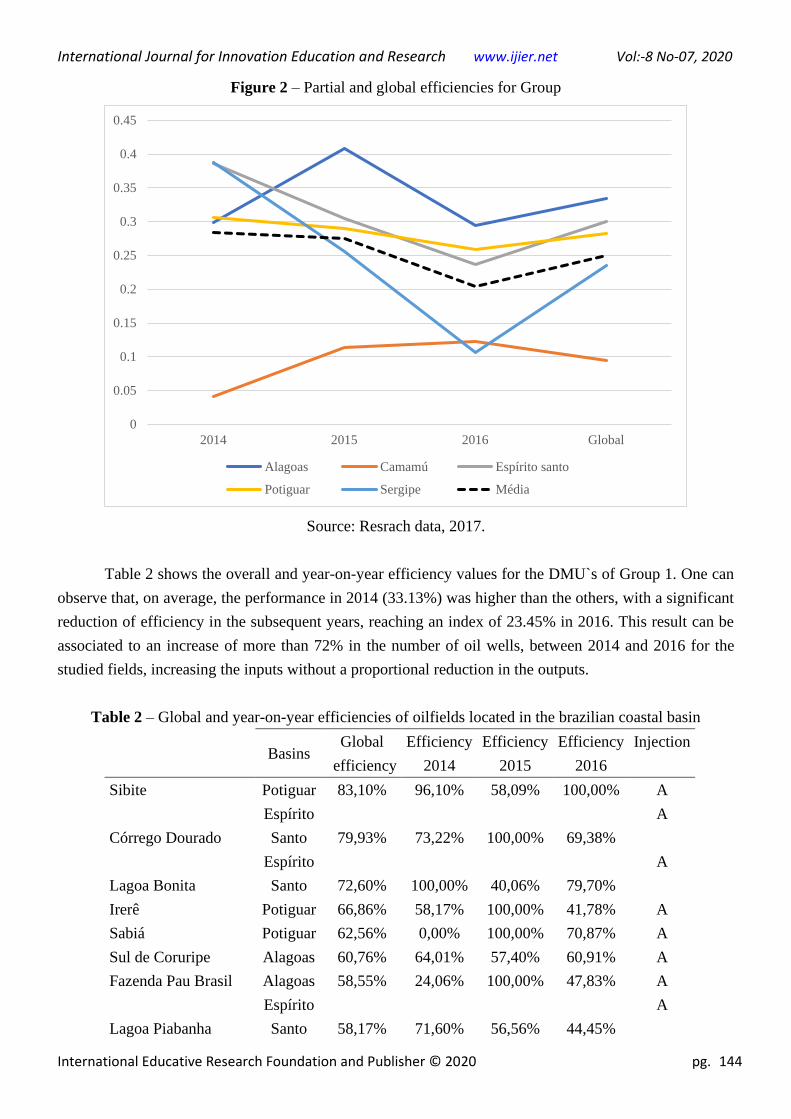
Figure 2 shows the average efficiency for the years analyzed asoociated to all Brazillian onshore
coastal basins. When considering the three years analyzed, one can observe a significant decrease in
efficiency for the fields loctaed in the Espírito Santo, Sergipe and Potiguar basins. It should be highlighted
that, even with the faliure in performance, these basins were above the average of all the studied basins.
On the other hand, the Alagoas basin achieved an increase of more than 30% of efficiency in 2015, but
presented a sharp drop in the following year, 2016.
International Journal for Innovation Education and Research www.ijier.net Vol:-8 No-07, 2020
International Educative Research Foundation and Publisher © 2020 pg. 144
Figure 2 – Partial and global efficiencies for Group
Source: Resrach data, 2017.
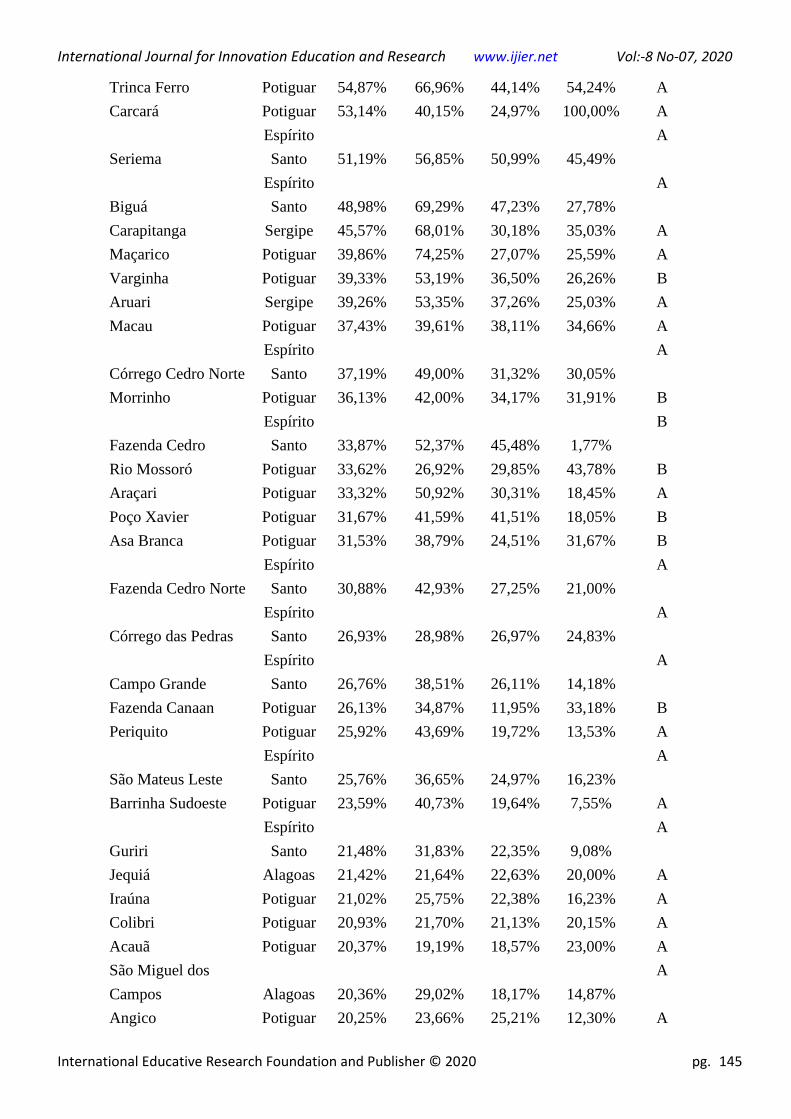
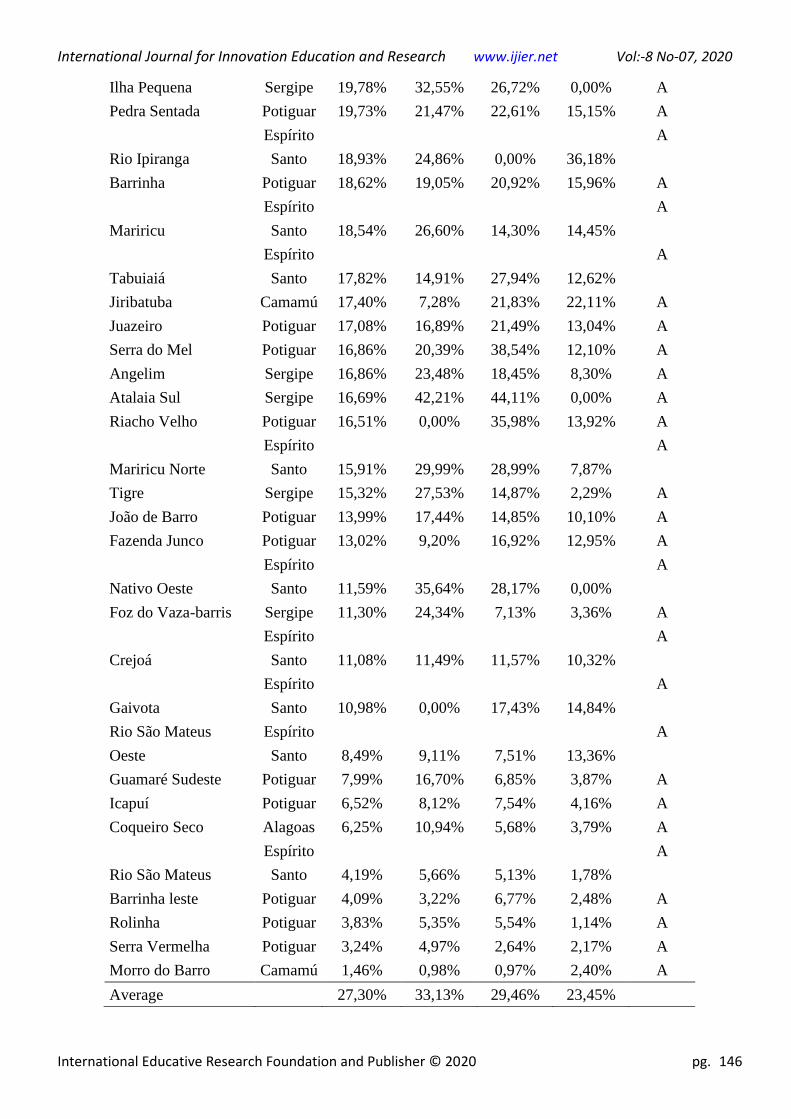
Table 2 shows the overall and year-on-year efficiency values for the DMU`s of Group 1. One can
observe that, on average, the performance in 2014 (33.13%) was higher than the others, with a significant
reduction of efficiency in the subsequent years, reaching an index of 23.45% in 2016. This result can be
associated to an increase of more than 72% in the number of oil wells, between 2014 and 2016 for the
studied fields, increasing the inputs without a proportional reduction in the outputs.
Table 2 – Global and year-on-year efficiencies of oilfields located in the brazilian coastal basin
Basins
Global
efficiency
Efficiency
2014
Efficiency
2015
Efficiency
2016
Injection
Sibite Potiguar 83,10% 96,10% 58,09% 100,00% A
Córrego Dourado
Espírito
Santo 79,93% 73,22% 100,00% 69,38%
A
Lagoa Bonita
Espírito
Santo 72,60% 100,00% 40,06% 79,70%
A
Irerê Potiguar 66,86% 58,17% 100,00% 41,78% A
Sabiá Potiguar 62,56% 0,00% 100,00% 70,87% A
Sul de Coruripe Alagoas 60,76% 64,01% 57,40% 60,91% A
Fazenda Pau Brasil Alagoas 58,55% 24,06% 100,00% 47,83% A
Lagoa Piabanha
Espírito
Santo 58,17% 71,60% 56,56% 44,45%
A
0
0.05
0.1
0.15
0.2
0.25
0.3
0.35
0.4
0.45
2014 2015 2016 Global
Alagoas Camamú Espírito santo
Potiguar Sergipe Média
International Journal for Innovation Education and Research www.ijier.net Vol:-8 No-07, 2020
International Educative Research Foundation and Publisher © 2020 pg. 145
Trinca Ferro Potiguar 54,87% 66,96% 44,14% 54,24% A
Carcará Potiguar 53,14% 40,15% 24,97% 100,00% A
Seriema
Espírito
Santo 51,19% 56,85% 50,99% 45,49%
A
Biguá
Espírito
Santo 48,98% 69,29% 47,23% 27,78%
A
Carapitanga Sergipe 45,57% 68,01% 30,18% 35,03% A
Maçarico Potiguar 39,86% 74,25% 27,07% 25,59% A
Varginha Potiguar 39,33% 53,19% 36,50% 26,26% B
Aruari Sergipe 39,26% 53,35% 37,26% 25,03% A
Macau Potiguar 37,43% 39,61% 38,11% 34,66% A
Córrego Cedro Norte
Espírito
Santo 37,19% 49,00% 31,32% 30,05%
A
Morrinho Potiguar 36,13% 42,00% 34,17% 31,91% B
Fazenda Cedro
Espírito
Santo 33,87% 52,37% 45,48% 1,77%
B
Rio Mossoró Potiguar 33,62% 26,92% 29,85% 43,78% B
Araçari Potiguar 33,32% 50,92% 30,31% 18,45% A
Poço Xavier Potiguar 31,67% 41,59% 41,51% 18,05% B
Asa Branca Potiguar 31,53% 38,79% 24,51% 31,67% B
Fazenda Cedro Norte
Espírito
Santo 30,88% 42,93% 27,25% 21,00%
A
Córrego das Pedras
Espírito
Santo 26,93% 28,98% 26,97% 24,83%
A
Campo Grande
Espírito
Santo 26,76% 38,51% 26,11% 14,18%
A
Fazenda Canaan Potiguar 26,13% 34,87% 11,95% 33,18% B
Periquito Potiguar 25,92% 43,69% 19,72% 13,53% A
São Mateus Leste
Espírito
Santo 25,76% 36,65% 24,97% 16,23%
A
Barrinha Sudoeste Potiguar 23,59% 40,73% 19,64% 7,55% A
Guriri
Espírito
Santo 21,48% 31,83% 22,35% 9,08%
A
Jequiá Alagoas 21,42% 21,64% 22,63% 20,00% A
Iraúna Potiguar 21,02% 25,75% 22,38% 16,23% A
Colibri Potiguar 20,93% 21,70% 21,13% 20,15% A
Acauã Potiguar 20,37% 19,19% 18,57% 23,00% A
São Miguel dos
Campos Alagoas 20,36% 29,02% 18,17% 14,87%
A
Angico Potiguar 20,25% 23,66% 25,21% 12,30% A
International Journal for Innovation Education and Research www.ijier.net Vol:-8 No-07, 2020
International Educative Research Foundation and Publisher © 2020 pg. 146
Ilha Pequena Sergipe 19,78% 32,55% 26,72% 0,00% A
Pedra Sentada Potiguar 19,73% 21,47% 22,61% 15,15% A
Rio Ipiranga
Espírito
Santo 18,93% 24,86% 0,00% 36,18%
A
Barrinha Potiguar 18,62% 19,05% 20,92% 15,96% A
Mariricu
Espírito
Santo 18,54% 26,60% 14,30% 14,45%
A
Tabuiaiá
Espírito
Santo 17,82% 14,91% 27,94% 12,62%
A
Jiribatuba Camamú 17,40% 7,28% 21,83% 22,11% A
Juazeiro Potiguar 17,08% 16,89% 21,49% 13,04% A
Serra do Mel Potiguar 16,86% 20,39% 38,54% 12,10% A
Angelim Sergipe 16,86% 23,48% 18,45% 8,30% A
Atalaia Sul Sergipe 16,69% 42,21% 44,11% 0,00% A
Riacho Velho Potiguar 16,51% 0,00% 35,98% 13,92% A
Mariricu Norte
Espírito
Santo 15,91% 29,99% 28,99% 7,87%
A
Tigre Sergipe 15,32% 27,53% 14,87% 2,29% A
João de Barro Potiguar 13,99% 17,44% 14,85% 10,10% A
Fazenda Junco Potiguar 13,02% 9,20% 16,92% 12,95% A
Nativo Oeste
Espírito
Santo 11,59% 35,64% 28,17% 0,00%
A
Foz do Vaza-barris Sergipe 11,30% 24,34% 7,13% 3,36% A
Crejoá
Espírito
Santo 11,08% 11,49% 11,57% 10,32%
A
Gaivota
Espírito
Santo 10,98% 0,00% 17,43% 14,84%
A
Rio São Mateus
Oeste
Espírito
Santo 8,49% 9,11% 7,51% 13,36%
A
Guamaré Sudeste Potiguar 7,99% 16,70% 6,85% 3,87% A
Icapuí Potiguar 6,52% 8,12% 7,54% 4,16% A
Coqueiro Seco Alagoas 6,25% 10,94% 5,68% 3,79% A
Rio São Mateus
Espírito
Santo 4,19% 5,66% 5,13% 1,78%
A
Barrinha leste Potiguar 4,09% 3,22% 6,77% 2,48% A
Rolinha Potiguar 3,83% 5,35% 5,54% 1,14% A
Serra Vermelha Potiguar 3,24% 4,97% 2,64% 2,17% A
Morro do Barro Camamú 1,46% 0,98% 0,97% 2,40% A
Average 27,30% 33,13% 29,46% 23,45%

International Journal for Innovation Education and Research www.ijier.net Vol:-8 No-07, 2020
International Educative Research Foundation and Publisher © 2020 pg. 147
Note: The letter A in the Injection column represents that the field does not use water reinjection
as a secondary method of recovery, while the letter B denotes the use of reinjection.
Source: Data extracted from Matlab R2014A.
It is important to report that, except the fields Pau Brasil (Alagoas), Maçarico (Potiguar), Sibite
(Potiguar), Araçari (Potiguar) and Lagoa Bonita (Espírito Santo) the others have similar efficiency indices
in all observed periods. This result provides indications of the need for improvement in processes, aiming
to ensure higher levels of efficiency and strategies that do not print a methodological continuity, making it
impossible to promote a better management of the produced water from these fields.
It is important to highlight that the two most efficient fields of Group 1, Sibite (Potiguar - 83.10%)
and Córrego Dourado (Espírito Santo - 79.93%), are among the three largest producers of this group,
although no field has reached the global efficiency frontier. If the annual results were observed, it can be
observed that in 2014 only the Lagoa Bonita field reached 100% efficiency. While in 2015, the fields
Córrego Dourado (Espírito Santo), Irerê and Sabiá (Potiguar) and Fazenda Pau Brasil (Alagoas) reached
the frontier of efficiency. In 2016, only the Carcará and Sibite (Potiguar) fields achieved this result. In
addition, the Carcará (Potiguar) field reached the efficiency frontier in 2016, after a 1300% reduction in
the volume of produced water, while the Sibite (Potiguar) field achieved a significant decrease in efficiency
in 2015 (58.09%), which can be explained by a 32% reduction in oil production and a 28% increase in
water production.
Another reality that deserves attention concerns the fields of Lagoa Bonita (Espírito Santo) and
Fazenda Pau Brasil (Alagoas). The first obtained a significant decrease in its efficiency index, from 100%
to 40.06%, given an increase of 34 times the amount of produced water. The second increased its rate from
24.06% (2014) to 100% in 2015, driven by a 584% increase in oil production. In the following year,
Fazenda Pau Brasil (Alagoas) reduced its rate due to the increase in water production and shrinking of oil
production.
Figure 3 systematizes the comparison between efficiency per period and the number of wells per
field. The values obtained allow to state that fields with the same number of wells have significantly
different efficiencies, indicating that the environmental management adopted by each field can positively
or negatively influence their performance. It should be noted that the fields that presented the highest
efficiencies have one or two wells. These DMU's presented low inputs, justifing the high rates of efficiency
obtained.

International Journal for Innovation Education and Research www.ijier.net Vol:-8 No-07, 2020
International Educative Research Foundation and Publisher © 2020 pg. 148
Figure 3 - Comparison between efficiency and number of wells per field Group 1
Source: Research data, 2020.
Figure 4 illustrates the comparison between the age of the field and the measured efficiency. Higher
values were observed for the fields at the beginning of production, followed by falls over the second decade
of exploration. However, there is a recovery after the twenty years of operation always followed by a
downward trend in efficiency. This decline may be related to the effects of increased water production
already reported by Khatib & Verbeek (2003); Clark & Veil (2009). These results can be explained by how
the output (produced water) is managed over the lifetime of the fields.
Figure 4 - Comparison between efficiency and age of the field Group 1
Source: Research data, 2020.
The authors highlight the good efficiency indexes attributed to the Fields Sibite, Irerê and Sabiá
(Potiguar) with production age between 1 and 6 years, to the fields Córrego Dourado and Lagoa Bonita
(Espírito Santo) with production time between 19 and 22 years and to the fields Sul de Coruripe and
0%
10%
20%
30%
40%
50%
60%
70%
80%
90%
0 2 4 6 8 10 12 14
0%
10%
20%
30%
40%
50%
60%
70%
80%
90%
0 10 20 30 40 50 60
International Journal for Innovation Education and Research www.ijier.net Vol:-8 No-07, 2020
International Educative Research Foundation and Publisher © 2020 pg. 149
Fazenda Pau Brasil (Alagoas) with production age between 29 and 35 years. These data suggest that
although there is a globaltrend of falling efficiencies, as the production years go by, there are cases in which
the managements of the produced water stand out.
Thus, field managers have better know-how regarding the management of this unwanted output
with more exploration time, which explains the observed recovery of some of the fields reported in this
study.
5. CONCLUSIONS
The proposed model of environmental sustainability for the onshore oil fields of the Brazilian
coastal basins highlighted the importance of multidisciplinarity regarding the use of various sciences in
order to construct methodologies capable of pointing out/solving latent problems of society.
The relevance of the variables Vertical Wells and Directional Wells for the construction of the
dynamic efficiency index was also explained, since their weights had a significantly higher relevance than
those adopted for the variables Area and Age.
It was also found that there is a discrepancy in the environmental management practiced by the
fields studied, taking into account that the DMU’s with similar technological resources presented different
productions of produced water and oil, causing inefficiency and unsustainable plants. Inefficiency is the
result of unnecessary costs and environmental impacts arising from lack of control and planning of the
processes that permeate the oil and gas industry, especially those associated with the reuse and/or disposal
of water produced from oil.
Therefore, it can be stated that the management of technological resources, associated with
responsible planning, contributes to the volume of produced water for the oil fields of the Brazilian coastal
basins. The geometry of the chosen well and the time of exploration are fundamental factors for greater
control of the water produced. There is still a large dispersion in the results of similar DMU's, which
attests, in general, a mismanagement of resources, especially environmental, resulting in the low rates of
overall efficiency measured in this research.
REFERENCE
Agência Internacional de Energia (2017). Demandas mundiais de petróleo e gás. Disponível em:
https://www.iea.org/media/omrreports/tables/2017-06-14.pdf . Acesso em: 01/04/2018.
Assunção, M. V. D., Vieira, M. M., & Almeida, M. R. (2018a). The influence of oil well on the water
generation from the potiguar basin/Brazil. Acta Scientiarum. Technology, 40, e38403-e38403.
Assunção, M. V. D., Vieira, M. M., & de Almeida, M. R. (2018b). Fatores influenciadores na produção
indesejada da água produzida de petróleo: um estudo na bacia Potiguar/Brasil. HOLOS, 2, 146-160.
Bevilacqua, M., & Braglia, M. (2002). Environmental efficiency analysis for ENI oil refineries. Journal of
cleaner production, 10(1), 85-92.
International Journal for Innovation Education and Research www.ijier.net Vol:-8 No-07, 2020
International Educative Research Foundation and Publisher © 2020 pg. 150
Cook, W. D., & Seiford, L. M. (2009). Data envelopment analysis (DEA)–Thirty years on. European
journal of operational research, 192(1), 1-17.
Dyson, R. G., Allen, R., Camanho, A. S., Podinovski, V. V., Sarrico, C. S., & Shale, E. A. (2001). Pitfalls
and protocols in DEA. European Journal of operational research, 132(2), 245-259.
Francisco, C., Aparecida, C., Rodrigues de Almeida, M., & Ribeiro da Silva, D. (2012). Efficiency in
Brazilian refineries under different DEA technologies. International Journal of Engineering Business
Management, 4(Godište 2012), 4-35.
Golany, B., & Roll, Y. (1989). An application procedure for DEA. Omega, 17(3), 237-250.
Hu, Z., Yan, S., Li, X., Yao, L., & Luo, Z. (2019). Evaluating the oil production and wastewater treatment
efficiency by an extended two-stage network structure model with feedback variables. Journal of
environmental management, 251, 109578.
Kao, C. (2013). Dynamic data envelopment analysis: A relational analysis. European Journal of
Operational Research, 227(2), 325-330.
Khatib, Z., & Verbeek, P. (2003). Water to value-produced water management for sustainable field
development of mature and green fields. Journal of Petroleum Technology, 55(01), 26-28.
Liu, J. S., Lu, L. Y., Lu, W. M., & Lin, B. J. (2013). Data envelopment analysis 1978–2010: A citation-
based literature survey. Omega, 41(1), 3-15.
Mekaroonreung, M., & Johnson, A. L. (2010). Estimating the efficiency of American petroleum refineries
under varying assumptions of the disposability of bad outputs. International Journal of Energy Sector
Management, 4(3), 356-398.
Oke, D. M., & Kareem, S. D. (2013). An inter-temporal analysis of operational efficiency of oil firms:
Further evidence from Nigeria. International Journal of Energy Economics and Policy, 3(2), 178.
Song, M., Zhang, J., & Wang, S. (2015). Review of the network environmental efficiencies of listed
petroleum enterprises in China. Renewable and Sustainable Energy Reviews, 43, 65-71.
Sueyoshi, T., & Goto, M. (2012). Data envelopment analysis for environmental assessment: Comparison
between public and private ownership in petroleum industry. European journal of operational
research, 216(3), 668-678.
International Journal for Innovation Education and Research www.ijier.net Vol:-8 No-07, 2020
International Educative Research Foundation and Publisher © 2020 pg. 151
Sueyoshi, T., & Goto, M. (2012). Returns to scale and damages to scale under natural and managerial
disposability: Strategy, efficiency and competitiveness of petroleum firms. Energy economics, 34(3), 645-
662.
Sueyoshi, T., & Wang, D. (2014). Sustainability development for supply chain management in US
petroleum industry by DEA environmental assessment. Energy Economics, 46, 360-374.
Sueyoshi, T., & Goto, M. (2015). DEA environmental assessment in time horizon: Radial approach for
Malmquist index measurement on petroleum companies. Energy Economics, 51, 329-345.
Sueyoshi, T., Yuan, Y., & Goto, M. (2017). A literature study for DEA applied to energy and
environment. Energy Economics, 62, 104-124.
Tavana, M., Khalili-Damghani, K., Arteaga, F. J. S., & Hosseini, A. (2019). A fuzzy multi-objective multi-
period network DEA model for efficiency measurement in oil refineries. Computers & Industrial
Engineering, 135, 143-155.
Venkatesan, A., & Wankat, P. C. (2017). Produced water desalination: An exploratory
study. Desalination, 404, 328-340