the essential guide to voip implementation and...
TRANSCRIPT
VoIP Implementation and Management
Written by: John Q. Walker and Jeffrey T. Hicks
The Essential Guide to
Copyright John Q. Walker and Jeffrey T. Hicks, 2002. All Rights Reserved. 1
The Essential Guide to VoIP Implementation and Management by John Q. Walker and Jeffrey T. Hicks NetIQ Corporation
Chapter Two: Planning for VoIP
Planning, Analysis, and Assessment 3 Understanding Current Telephony Usage ................................................................................................5
Call Detail Records ........................................................................................................................5 Call Volume Statistics....................................................................................................................6 Call Flow Analysis..........................................................................................................................6
Understanding Reliability.............................................................................................................................6 Hardware Reliability ......................................................................................................................9 Software Reliability and Features ................................................................................................9 Link and Carrier Reliability.........................................................................................................10 Environment and Electrical Power...........................................................................................10 Network Design...........................................................................................................................10 User Errors and IT Process Management ...............................................................................11
Understanding Call Quality .......................................................................................................................12 Standards for Measuring Call Quality.......................................................................................14 Codec Selection............................................................................................................................18 Delay ..............................................................................................................................................20 Jitter................................................................................................................................................22 Lost Data.......................................................................................................................................22
VoIP Readiness Assessment .....................................................................................................................24 Configuration Assessment..........................................................................................................24 Utilization Assessment................................................................................................................25 Call Quality Assessment .............................................................................................................26 Bandwidth Modeling...................................................................................................................27
Evaluation and Purchase 29 Working on the Problem Areas................................................................................................................30
Upgrading the Data Network for Good Call Quality............................................................30 Eliminating Equipment Gaps ....................................................................................................33
Building a Pilot Deployment.....................................................................................................................34 Learning New Lessons Well ......................................................................................................34

Copyright John Q. Walker and Jeffrey T. Hicks, 2002. All Rights Reserved. 2
Starting the Pilot ..........................................................................................................................35 Evaluating Equipment and Systems .........................................................................................35 Watching for VoIP Gotchas ......................................................................................................36
Deployment, Tuning, and Testing 38 Assembling a Test Plan..............................................................................................................................38 References 40 About the Authors......................................................................................................................................41
Copyright John Q. Walker and Jeffrey T. Hicks, 2002. All Rights Reserved. 3
Chapter Two: Planning for VoIP Chapter Two of our book, “The Essential Guide to VoIP Implementation and Management,” by John Q. Walker and Jeffrey T. Hicks of NetIQ Corporation, explains what you need to con-sider when planning a VoIP deployment.
We’ll serialize this book, releasing a chapter a month for seven months. A revised, bound edition, to be published in autumn 2002, will follow.
If you’re new to VoIP, we recommend downloading the previous two chapters and reading them first. The “Introductory Chapter” introduces the terminology and acronyms that recur frequently in the telephony and data networking communities – a set of ideas essential to a good understanding of VoIP. Chapter 1 explains how to build a business case for VoIP – the first step in the planning process of a VoIP deployment.
This chapter continues with the IT project plan we introduced last chapter. It covers the first three stages in depth: 1) planning, analysis, and assessment, 2) evaluation and purchase, and 3) initial deployment. We’ll save the topics of tuning and VoIP management for later chapters.
Planning, Analysis, and Assessment If you were packing your bags for an extended adventure, you would try to anticipate everything you might need. You’d make of list of the items you’d like to have with you and when you might need them. To make your list, you’d start with the things you had already, and then add the things you’d need but would have to acquire.
A VoIP deployment is such an extended adventure. Even before you pack your bags, you need to decide what you want to accomplish and settle on an accompanying schedule and budget. And you need to determine where you are today so you’ll know you how far you’ll have to travel to reach your target.
Planning is the most important phase of a successful VoIP deployment. If you complete the upfront work and set the right expectations, every other step should be a matter of checking to make sure that the expectations are being met.
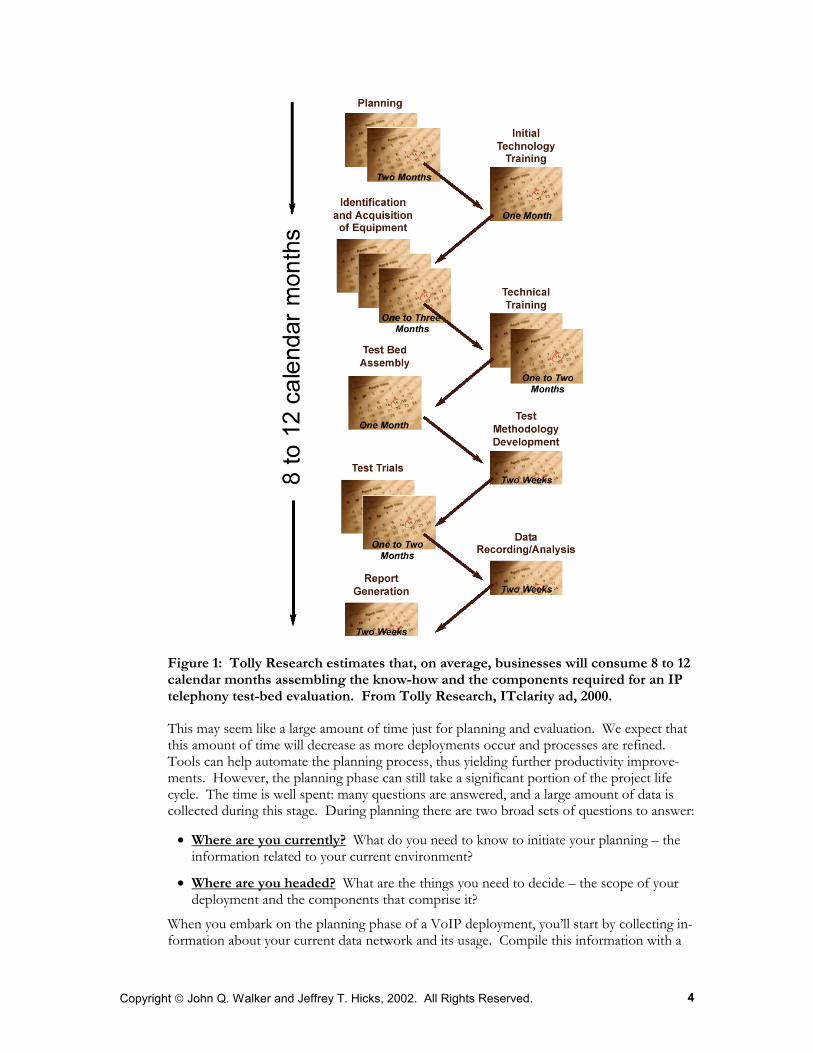
Like most large IT projects, a VoIP deployment may face schedule and time constraints. Because shortcuts during the planning and evaluation process can have negative effects on the final implementation, start by estimating the time required to complete these stages. The Tolly Research team estimates that 8 to 12 months are needed to complete the planning and evaluation stages of a major VoIP project, as shown in Figure 1.
Copyright John Q. Walker and Jeffrey T. Hicks, 2002. All Rights Reserved. 4
Figure 1: Tolly Research estimates that, on average, businesses will consume 8 to 12 calendar months assembling the know-how and the components required for an IP telephony test-bed evaluation. From Tolly Research, ITclarity ad, 2000.
This may seem like a large amount of time just for planning and evaluation. We expect that this amount of time will decrease as more deployments occur and processes are refined. Tools can help automate the planning process, thus yielding further productivity improve-ments. However, the planning phase can still take a significant portion of the project life cycle. The time is well spent: many questions are answered, and a large amount of data is collected during this stage. During planning there are two broad sets of questions to answer:
• Where are you currently? What do you need to know to initiate your planning – the information related to your current environment?
• Where are you headed? What are the things you need to decide – the scope of your deployment and the components that comprise it?
When you embark on the planning phase of a VoIP deployment, you’ll start by collecting in-formation about your current data network and its usage. Compile this information with a
Copyright John Q. Walker and Jeffrey T. Hicks, 2002. All Rights Reserved. 5
view toward understanding what must be done to reach your final goal – a successful VoIP deployment. We’ve broken this information down into four categories of questions:
• Telephony usage. What’s the current call volume? What’s the profile of these calls, including their typical frequency, duration, location, and call flow?
• Reliability. What’s the current data network/system reliability? What’s your target reli-ability? What will it take to get from the current state of reliability to your target?
• Call quality. What’s the current estimated call quality? What’s your target call quality? What will it take to get from the current level of call quality to your target?
• VoIP readiness. How do you assess VoIP readiness? What is needed to perform a readiness assessment?
For each category of questions, there is an established methodology for finding the most useful answers. We elaborate on these methods below.
Understanding Current Telephony Usage Key characteristics of the telephone calls that travel over your existing phone system are well known; the data has been captured somewhere, ever since your telephones were first used. To understand how many users and how many calls your VoIP system must support, look at how many your current telephony system supports. A team somewhere within your organi-zation, or under contract by your organization, knows this information intimately and has been tracking it for years. Here’s what you’ll find out from them, or from their records:
• Number of calls • Number of users (number of distinct phone numbers) • Duration of calls • Number of concurrent calls • Call volume profiles – peak and average usage statistics
− When do they occur? − How long are they?
• Location and call flow. What percentage of the calls occurs within each site? What per-centage occurs within the organization, from site to site? How many calls go to and from the outside world?
Call Detail Records Telephone records and the current PBX call volume reports are a good source of data about the likely call volume a network will have to handle. Your current phone supplier or the system itself captures information about telephone calls in Call Detail Records (CDRs). You’ve seen simple examples of these, in your monthly itemized long-distance bill. CDRs include information like the date and time of each call, the number that was called, the dura-tion of the call, and its cost. Actually, lots more information is captured internally, including information about incoming calls, whether an attempted call was completed or not, the ac-count to which a call should be billed, and so on.
Softcopy CDRs can be easily processed. Many PBXs can sort them or export them as comma-separated value (CSV) files, which you can easily load into spreadsheet programs,
Copyright John Q. Walker and Jeffrey T. Hicks, 2002. All Rights Reserved. 6
such as Microsoft Excel. A useful statistic often calculated from CDRs is the “busy hour” – the clock hour in a day when the most calls occur – and the “busy day.” Calls during the busy hour are usually broken into two categories: the “busy hour calls attempted” (BHCA) and the “busy hour calls completed” (BHCC). These two numbers, BHCA and BHCC, de-scribe the peak call volume. (An aside: for the PSTN in the USA, the busy hour on the busy day is usually after lunchtime on Mother’s Day.)
Call Volume Statistics In the telephony industry, the busy hour traffic is often calculated in erlangs. An erlang is a number that represents the “busyness” of a particular telephone line. An erlang value of “1” means that the telephone line is 100% busy. Similarly, telephony statistics may include an Erlang B calculation, which is used to tabulate one of the following factors, given the other two:
Busy Hour Traffic (BHT) The number of hours of call traffic during the busiest hour of operation.
Blocking The percentage of calls that are blocked because not enough lines are available.
Lines The number of lines in a trunk group.
There are some simple calculators available that implement the Erlang B calculation and al-low for some quick modeling scenarios of the different statistics. To find them, enter “erlang calculator” in a Web search engine.
Call Flow Analysis When it comes to determining where to deploy and stage a VoIP deployment, the flow of call traffic is an especially useful statistic. If a site has a large percentage of calls that occur within the site (intrasite traffic), that location may be ideal for VoIP on the LAN. If a high volume of call traffic passes between two sites (intersite traffic), those sites may be candi-dates for VoIP because they can take advantage of toll bypass.
Additionally, determine how many calls travel to and from the PSTN. Analyzing the data using the busy-hour calculations can allow for capacity planning when VoIP traffic is added to the data network.
The current telephony usage information that you gather will serve as valuable input for the later planning stages of your deployment. Now let’s take a look at the next category of questions to ask as you’re gathering data about your current network: reliability.
Understanding Reliability Users have come to expect a high level of reliability from their phone system. Decades of knowledge, experience, and innovation have raised PSTN reliability very high. When you pick up a phone, you get a dial tone almost instantly. Can you even recall the last time a telephone call was dropped by the PSTN? Typical user expectations of unavailability for the phone system are about 5 minutes, cumulatively, per year. The level of availability the PSTN
Copyright John Q. Walker and Jeffrey T. Hicks, 2002. All Rights Reserved. 7
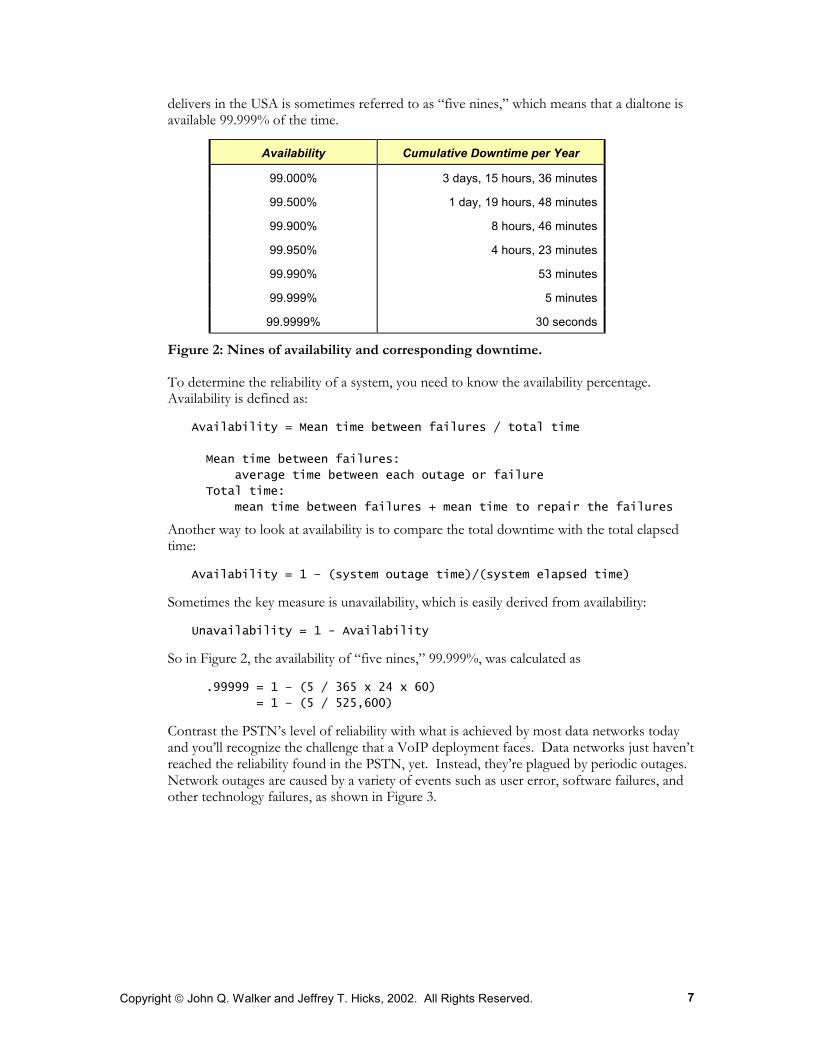
delivers in the USA is sometimes referred to as “five nines,” which means that a dialtone is available 99.999% of the time.
Availability Cumulative Downtime per Year
99.000% 3 days, 15 hours, 36 minutes
99.500% 1 day, 19 hours, 48 minutes
99.900% 8 hours, 46 minutes
99.950% 4 hours, 23 minutes
99.990% 53 minutes
99.999% 5 minutes
99.9999% 30 seconds
Figure 2: Nines of availability and corresponding downtime.
To determine the reliability of a system, you need to know the availability percentage. Availability is defined as:
Availability = Mean time between failures / total time
Mean time between failures:
average time between each outage or failure
Total time:
mean time between failures + mean time to repair the failures
Another way to look at availability is to compare the total downtime with the total elapsed time:
Availability = 1 – (system outage time)/(system elapsed time)
Sometimes the key measure is unavailability, which is easily derived from availability:
Unavailability = 1 - Availability
So in Figure 2, the availability of “five nines,” 99.999%, was calculated as
.99999 = 1 – (5 / 365 x 24 x 60)
= 1 – (5 / 525,600)
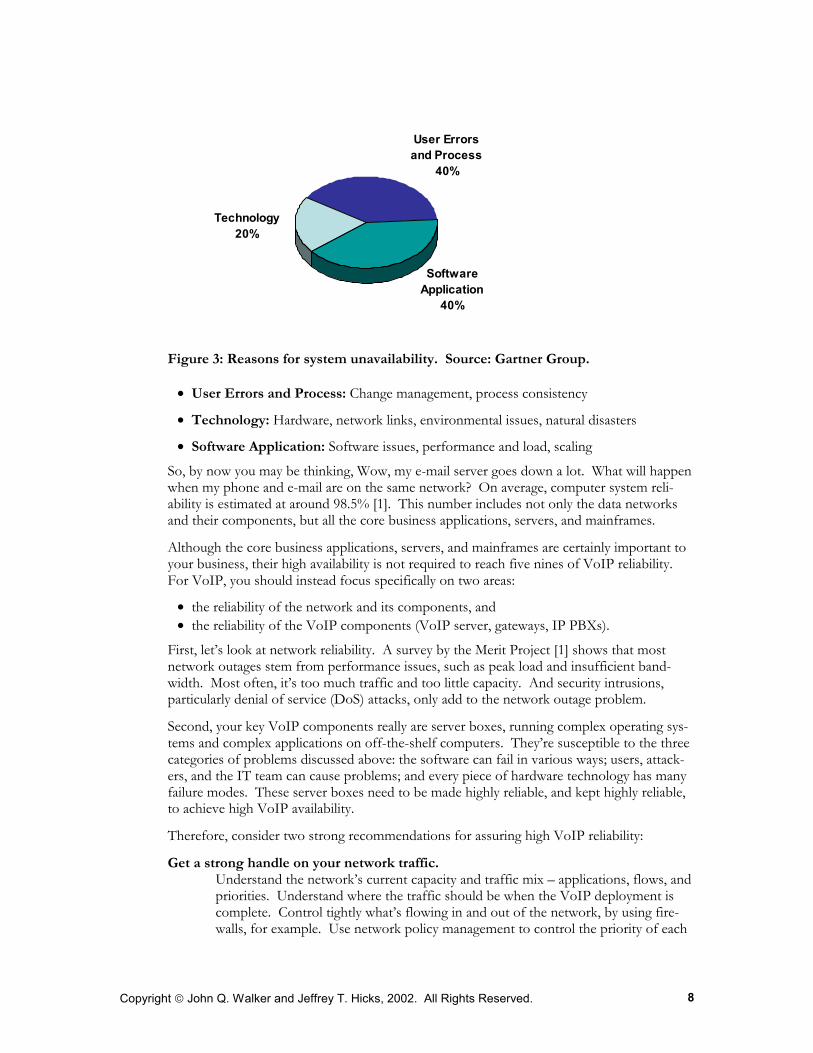
Contrast the PSTN’s level of reliability with what is achieved by most data networks today and you’ll recognize the challenge that a VoIP deployment faces. Data networks just haven’t reached the reliability found in the PSTN, yet. Instead, they’re plagued by periodic outages. Network outages are caused by a variety of events such as user error, software failures, and other technology failures, as shown in Figure 3.
Copyright John Q. Walker and Jeffrey T. Hicks, 2002. All Rights Reserved. 8
Technology20%
Software Application
40%
User Errors and Process
40%
Figure 3: Reasons for system unavailability. Source: Gartner Group.
• User Errors and Process: Change management, process consistency
• Technology: Hardware, network links, environmental issues, natural disasters
• Software Application: Software issues, performance and load, scaling
So, by now you may be thinking, Wow, my e-mail server goes down a lot. What will happen when my phone and e-mail are on the same network? On average, computer system reli-ability is estimated at around 98.5% [1]. This number includes not only the data networks and their components, but all the core business applications, servers, and mainframes.
Although the core business applications, servers, and mainframes are certainly important to your business, their high availability is not required to reach five nines of VoIP reliability. For VoIP, you should instead focus specifically on two areas:
• the reliability of the network and its components, and • the reliability of the VoIP components (VoIP server, gateways, IP PBXs).
First, let’s look at network reliability. A survey by the Merit Project [1] shows that most network outages stem from performance issues, such as peak load and insufficient band-width. Most often, it’s too much traffic and too little capacity. And security intrusions, particularly denial of service (DoS) attacks, only add to the network outage problem.
Second, your key VoIP components really are server boxes, running complex operating sys-tems and complex applications on off-the-shelf computers. They’re susceptible to the three categories of problems discussed above: the software can fail in various ways; users, attack-ers, and the IT team can cause problems; and every piece of hardware technology has many failure modes. These server boxes need to be made highly reliable, and kept highly reliable, to achieve high VoIP availability.
Therefore, consider two strong recommendations for assuring high VoIP reliability:
Get a strong handle on your network traffic. Understand the network’s current capacity and traffic mix – applications, flows, and priorities. Understand where the traffic should be when the VoIP deployment is complete. Control tightly what’s flowing in and out of the network, by using fire-walls, for example. Use network policy management to control the priority of each
Copyright John Q. Walker and Jeffrey T. Hicks, 2002. All Rights Reserved. 9
type of traffic. Apply firm user management, to police what each user can do and to control which resources they can access.
Get high-quality VoIP server, gateway, and IP PBX boxes, and secure them well. Install their required software, then put change management and access controls on the box – control tightly what changes are made and who can make them. Lock them down, to avoid physical or network intrusions. Put them on an uninterruptible power supply (UPS) to avoid downtime due to power outages.
Following these guidelines, the individual components that makeup the network should be examined as well. Let’s look at the underlying issues individually. Cisco Systems identifies the key availability items as [2]:
• Hardware reliability • Software reliability and features • Network link and carrier reliability • Environment and electrical power • Network design • User errors and process management
Hardware Reliability Inevitably hardware fails, so plan in advance to purchase hardware that’s resilient – resistant to failure. In many instances, network equipment vendors have included features to help make their hardware more resilient. For example, devices may have multiple CPUs, power-supplies, and cooling fans. If one of these components fails, the device can still operate. The duplication of components in order to make the system more resilient is referred to as redundancy.
Load balancing also provides resiliency and scalability. In a load-balanced scenario, multiple devices are configured to share the network or server load. For example, a group of Web servers is configured to alternate when responding to requests for the same Web site con-tent. Load balancing of Web servers is commonplace and provides resiliency in the case where a single server in the group fails.
By allowing multiple devices to behave as a single entity, clustering is a third technique for achieving resiliency. Within a cluster of devices, typically one device serves as the primary device and another as the backup. If the primary device fails, the backup takes over in a seamless manner that’s transparent to users. In addition to resiliency, clustering also provides for easier management – the entire group of devices can be managed as a single unit – and scalability – combined, the group of devices can support more users than a single device. Clustering is a good way to improve the reliability of VoIP servers.
Software Reliability and Features To improve reliability, don’t install lots of other programs on your VoIP servers. Even though server operating systems generally try to minimize the impact that one application can have on another, ill-behaved programs can use large amounts of CPU and memory, creating server-performance problems. Worse yet, programs that provide device drivers, or operate in kernel mode, can potentially cause the server to crash. Limit the applications in-stalled on critical VoIP servers to what is needed to operate and manage the server. Many vendors offer certification programs to ensure that programs are well behaved and don’t
Copyright John Q. Walker and Jeffrey T. Hicks, 2002. All Rights Reserved. 10
adversely affect server performance. Shop around for management tools that have been vendor-certified.
Test software patches carefully and apply them in stages. For example, you might apply patches to a limited number of servers and wait to see the effects before applying them to all your servers. Unfortunately, fixes for software often introduce other problems, so it’s best to test them out before widespread deployment. Check to see if you can apply the fix “hot,” without a server reboot. Some operating systems have features to allow fixes to be applied while the system is running. If the fix requires a server reboot, plan to do the updates during off-hours, or have a backup server available to bring online while the other server is being updated.
Lock VoIP servers down with the tightest intrusion security available. You want to make sure that your critical VoIP servers aren’t vulnerable to attack. Securing your servers may re-quire installing a firewall to protect and/or an intrusion-detection system to warn you of any security violations.
Link and Carrier Reliability Network link resiliency is an important consideration when you’re shopping around for an Internet Service Provider (ISP). Investigate the reliability record for the ISP. In a later chap-ter, we’ll discuss service level agreements (SLAs). An SLA generally requires an ISP to pro-vide their customer with certain levels of link availability and network performance. Talk with other customers; thorough SLA contracts and tight adherence to them are strong indi-cators of ISP reliability. Be sure to include reliability details in your contracts with the ISP. Finally, consider what happens when a failure does occur. How quickly does the provider restore service? What’s the process for opening a “trouble ticket?” All of these questions should be answered in a properly-structured contract with your provider.
Environment and Electrical Power The environment surrounding your network is a factor that’s easy to ignore. However, environmental factors should be included in any reliability assessment. Temperature ex-tremes can lead to system failure. Flood damage can wipe out your system and require extensive repairs. Proper air conditioning may be lacking in server locations. Whenever possible, raised floors or rooms that are protected against environmental hazards should be considered.
With POTS, the phones were powered by the phone company, which may be independent of the local electrical system. Observe that you can call the electrical company from your wired phone at home when the power goes out there. Look at the current reliability level of the power system. Uninterruptible power supply (UPS) boxes can reduce the risk of a power failure’s affecting key systems.
Network Design Good network design can eliminate problems that stem from a single point of failure. A single point of failure can arise when all traffic must go through one device. For example, an office has a single firewall that must filter all incoming network traffic. Single points of
Copyright John Q. Walker and Jeffrey T. Hicks, 2002. All Rights Reserved. 11
failure can also create performance bottlenecks in the case where a device is over burdened. Look for these points in your network design and seek to eliminate them.
When a failure occurs, operator intervention isn’t always required because good network de-sign can make the network self-healing. Self-healing networks can re-route data over differ-ent paths in the case of a link failure along the primary path. Take advantage of dynamic routing protocols to take some pressure off your network operator. Some advanced routing protocols can also provide increased resiliency by allowing multiple routers to be deployed and act as a single default gateway. Consider the case where a single router serves as your default gateway. If it fails, you may not be able to access the rest of the network.
A good network design also considers security. Firewalls and intrusion detection systems should be used to protect the enterprise network from outside intrusions. Network address translation (NAT) devices can keep computer addresses hidden from hackers. However, be careful where you place the NAT devices, because it is difficult, if not impossible, to make VoIP work across a NAT.
As you design your network, don’t neglect other crucial network services like Domain Name Service (DNS) or Dynamic Host Configuration Protocol (DHCP). Most IP phones use DHCP to minimize the configuration necessary to obtain an IP address. If the DHCP ser-vice is down, the IP phone is unable to join the network. DNS and DHCP services run on server computers, so primary and backup servers may be necessary.
User Errors and IT Process Management User error and IT process are the final contributors to availability issues. To prevent both sources of network disruptions, you need good IT processes in place to support VoIP well. Look to eliminate error-prone processes; in doing so, you’ll be able to reduce or avoid user errors. Here are some tips to help your IT staff avoid user errors:
• Thorough training – give the IT staff the training needed to support and manage a VoIP deployment.
• Intuitive user interfaces – look for configuration and management tools that are intui-tive and easy to use.
• Re-design or automate tricky tasks – automation is a good way to handle error-prone tasks.
Your goals in maintaining a reliable VoIP deployment occur in stages: prevent, detect, and react:
Prevent: If you prevent and avoid problems altogether, you increase availability.
Detect: When prevention fails, you want to spot problems as soon as possible, to shorten the time that elapses before isolation and repair.
React: When a problem is encountered, you want a timely and appropriate reaction, to shorten the isolation and repair time. Having reacted well, close the loop by making the necessary long-term fixes and responses to prevent and avoid the same problems in the future.
These are the goals in the IT project stages we introduced last chapter: management and monitoring, and fault isolation and repair.
Copyright John Q. Walker and Jeffrey T. Hicks, 2002. All Rights Reserved. 12
Management and monitoring. VoIP management is required to ensure the reliability and availability of the components, as well as high call quality. Management is critical if you’re going to be proactive in dealing with problems. When a problem occurs, how long does it take you to detect it? Ideally, you’d like to know about the problem before users start calling it in. Management software tools should let you set thresholds for key reliability and call quality measurements and then receive notifications when the thresholds are crossed.
Fault isolation, diagnosis, and repair speed. Once you do detect a problem, the key to maintaining a reliable VoIP network is how quickly you can isolate, diagnose, and fix it. You need to quickly pinpoint the component in the VoIP system – server, phone, router, network link – that is causing the problem.
Once you reach a point where the system is very reliable and you can resolve any availability problems quickly, then it’s time to take a look at network performance as it relates to call quality.
Understanding Call Quality Traditional networked applications and VoIP applications have different network perform-ance requirements. For example, while file-transfer applications consume large amounts of bandwidth by sending data as quickly as possible, ERP applications send small amounts of data, but use frequent flows between sender and receiver. By contrast, VoIP applications consume relatively little bandwidth, but can’t tolerate large delays or variations.
Even when they’re carried on the same network, voice traffic and data traffic can’t be handled the same way.
• They have different packet sizes.
• They are sent at different rates.
• They are buffered and delivered to the destination differently.
• They must fulfill very different user expectations.
Although an e-mail message or a file transfer can be delayed by half an hour without exciting anyone’s notice, delays of a few hundred milliseconds can impair a VoIP telephone call. (A millisecond, abbreviated “ms,” is one thousandth of a second, so 1000 milliseconds equals one second.) And when you start to run VoIP across any given enterprise network, delays caused by other applications, overloaded routers, or faulty switches may be inevitable.
Most data networks aren’t ready to provide the performance needed for PSTN-level call quality or reliability. You might argue that the quality is great on a campus LAN with under-utilized capacity, but how many enterprise networks consist of a single campus LAN? Let’s take a look at the network performance issues before and after a VoIP deployment.
Network Performance before VoIP Data networks have customarily been tuned to make network applications, such as Web transactions, e-mail, and ERP, run really well. Two characteristics of these types of applica-tions affect their performance requirements on the network:
Copyright John Q. Walker and Jeffrey T. Hicks, 2002. All Rights Reserved. 13
• They send data using the TCP protocol. TCP is a connection-oriented protocol, which means that the two sides of the data exchange maintain strong tracking about everything that’s sent and received. For example, your browser uses the TCP interface when fetching Web pages – you don’t want to see holes or out-of-order pieces of data on the screen, so your browser and the Web server program work together to make sure everything is received intact. TCP also provides congestion control so that when a sender is sending too fast, the receiver sends a “slow down” message. TCP applications are usually elastic, consuming as much bandwidth as is available to them.
• They are transaction-oriented. Application transactions consist of requests and responses. A transaction can be as simple as a single request and response: a credit card number is sent and an authorization is received. Or a transaction can contain many short request and response flows, or even, in the case of a file transfer, a single transmis-sion of a large amount of data. In a typical application transaction, a client requests a Web page, and the server responds by sending the information. Similarly, an application might request a set of records from an SQL query on the server. The amount of time it takes to perform a transaction gives the user an indicator for how responsive the appli-cation feels. The back-and-forth nature of these transactions means the application demands certain performance provisions from the network.
How do you know when one of these transaction-oriented applications isn’t performing well? The key performance measurements are throughput and response time.
Throughput numbers tell the rate at which traffic can flow through a network. This is the key measurement for applications such as FTP, which need to transfer large amounts of data. Networks with higher throughput can deliver data in a shorter period of time. A measurement reflecting a network’s capacity, throughput is usually measured in bytes or bits per second.
Response time is a measurement that indicates how long it takes to send a request and re-ceive a reply over a network. The response-time metric is key for network transactions, be-cause the longer an operation takes, the more impatient a user gets. Usually described in milliseconds or seconds, the response time measurement for a transaction reflects the user’s experience with a network.
A network that consistently provides high throughput and low response time lets TCP-based transactional applications perform well.
Network Performance with VoIP Because the goal of providing good call quality is unique, voice traffic places a new set of demands on data networks. Even a network that’s tuned to provide the high throughput, low response time needed to make other applications perform well may perform poorly when voice traffic is added. Voice has real-time characteristics, which have very strict re-quirements for network performance. Voice applications have two characteristics that require real-time network performance:
• They send data using the RTP protocol. The real-time transport protocol (RTP) is an application-layer protocol that rides on the connectionless UDP protocol. UDP is said to be connectionless because it provides for no acknowledgements or tracking of the data sent and received. Nor does RTP provide for retransmission of data that has been lost by the network. In contrast to TCP applications, RTP doesn’t provide con-gestion control directly, so a sender could overwhelm a receiver by sending too much
Copyright John Q. Walker and Jeffrey T. Hicks, 2002. All Rights Reserved. 14
data, too quickly. To help prevent this problem, RTP applications usually send data at a fixed data rate.
• Interactive conversations can’t tolerate large delays. A typical telephone conversa-tion usually depends on a certain amount of interaction between the caller and the callee. The higher the level of interaction, the less you can tolerate delays in the conversation. If the delay is too high, the conversation is burdened by a “walkie-talkie” effect – the talkers feel they must complete each sentence with some keyword like “over” to let the receiver know that they’ve finished talking. This can become very tedious, and gives both parties in the conversation a perception of poor call quality.
When a converged network is tuned correctly, many types of applications can coexist and perform well. But the converse is also true. How do you know if the voice call quality is poor? We’ll talk in-depth about call quality later, but several underlying network perform-ance measurements play a key role in determining call quality. The fundamental network performance measurements for voice traffic are delay, jitter, and packet loss. We’ll discuss these in detail while understanding their impact on call quality in the next section.
After this brief introduction to some of the network performance issues that come into play when you deploy VoIP, let’s take a look at the reality that call quality equals network performance.
Standards for Measuring Call Quality The quality goal for a VoIP call is the same level of quality that the PSTN consistently delivers, and it’s a lofty goal. PSTN-level quality is sometimes referred to as “toll” quality, and it’s excellent. Some companies have even advertised PSTN quality so good that “you can hear a pin drop.” That being said, getting good call quality day in and day out with a VoIP deployment is possible. But it implies that you’ll know what level of call quality you’re getting. That’s why it helps to understand some of the different measurement standards for voice quality.
Ever since the telephone was invented, call quality testing has usually been subjective: pick-ing up a telephone and listening to the quality of the voice. The leading subjective measurement of voice quality is the Mean Opinion Score, or MOS, as described in the ITU (International Telecommunications Union) recommendation P.800 [3].
To determine a MOS for a telephone call by using human listeners, lots of people listen to a call and give their opinion of its quality. This certainly works well, but it’s pretty expensive to hire a bunch of people to assign a score to your calls each time you make a tuning adjust-ment or network configuration change. The good news is that the human behavioral patterns have been heavily researched and quantified. The research describes how humans would most likely react—what mean opinion score they would give—as they hear audio with different levels of delay or packet loss. This mapping between audio performance characteristics and a quality score makes the MOS standard valuable for network assess-ments, benchmarking, tuning, and monitoring.
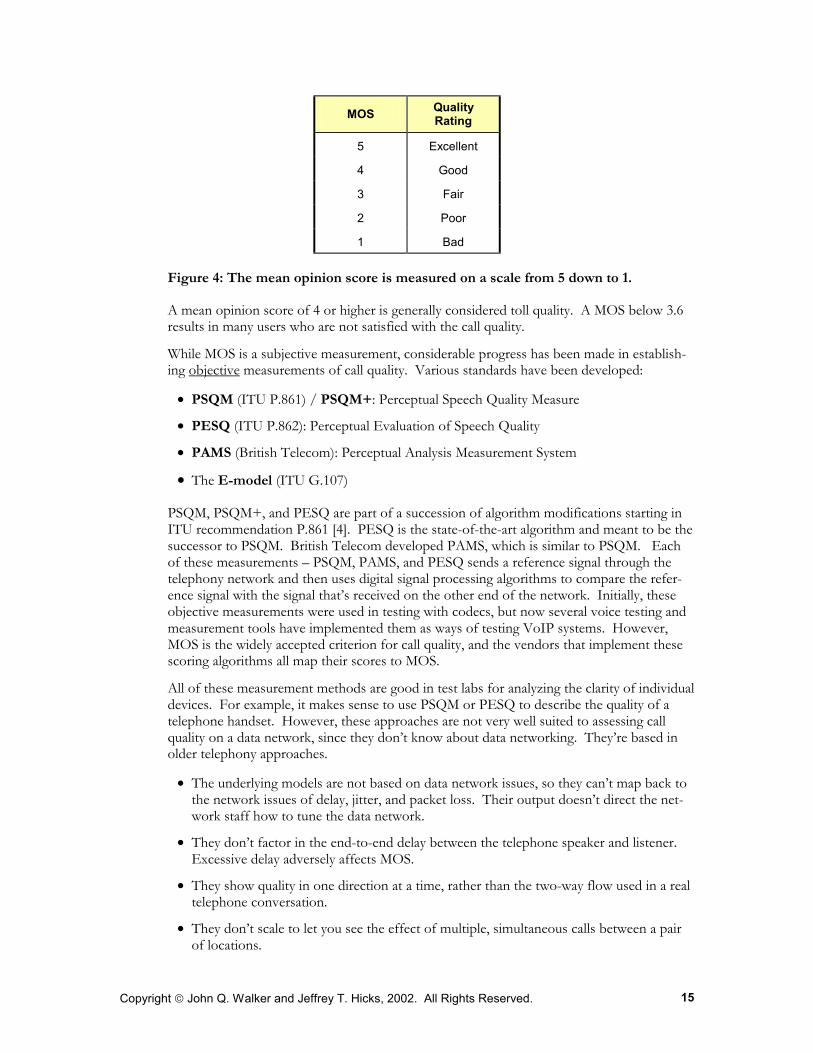
The Mean Opinion Score (MOS) described in ITU P.800 is a subjective measurement of call quality as perceived by the receiver. A MOS can range from 5 down to 1, using the follow-ing rating scale:
Copyright John Q. Walker and Jeffrey T. Hicks, 2002. All Rights Reserved. 15
MOS Quality Rating
5 Excellent
4 Good
3 Fair
2 Poor
1 Bad
Figure 4: The mean opinion score is measured on a scale from 5 down to 1.
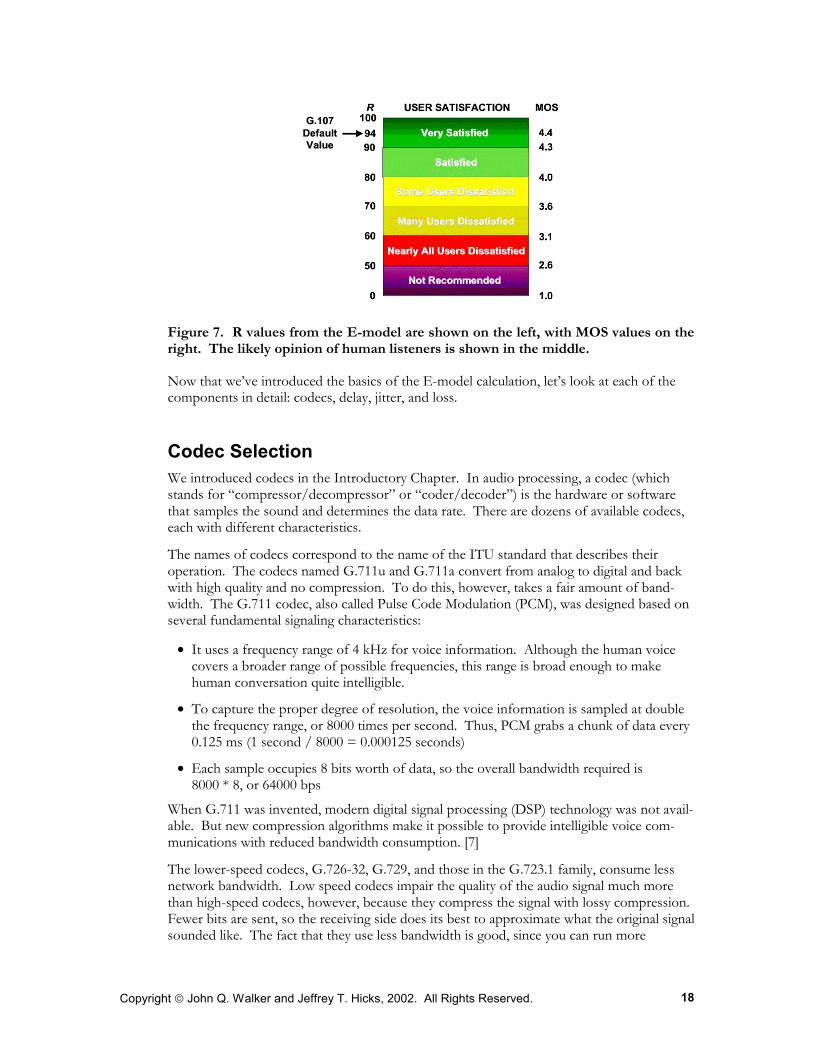
A mean opinion score of 4 or higher is generally considered toll quality. A MOS below 3.6 results in many users who are not satisfied with the call quality.
While MOS is a subjective measurement, considerable progress has been made in establish-ing objective measurements of call quality. Various standards have been developed:
• PSQM (ITU P.861) / PSQM+: Perceptual Speech Quality Measure
• PESQ (ITU P.862): Perceptual Evaluation of Speech Quality
• PAMS (British Telecom): Perceptual Analysis Measurement System
• The E-model (ITU G.107)
PSQM, PSQM+, and PESQ are part of a succession of algorithm modifications starting in ITU recommendation P.861 [4]. PESQ is the state-of-the-art algorithm and meant to be the successor to PSQM. British Telecom developed PAMS, which is similar to PSQM. Each of these measurements – PSQM, PAMS, and PESQ sends a reference signal through the telephony network and then uses digital signal processing algorithms to compare the refer-ence signal with the signal that’s received on the other end of the network. Initially, these objective measurements were used in testing with codecs, but now several voice testing and measurement tools have implemented them as ways of testing VoIP systems. However, MOS is the widely accepted criterion for call quality, and the vendors that implement these scoring algorithms all map their scores to MOS.
All of these measurement methods are good in test labs for analyzing the clarity of individual devices. For example, it makes sense to use PSQM or PESQ to describe the quality of a telephone handset. However, these approaches are not very well suited to assessing call quality on a data network, since they don’t know about data networking. They’re based in older telephony approaches.
• The underlying models are not based on data network issues, so they can’t map back to the network issues of delay, jitter, and packet loss. Their output doesn’t direct the net-work staff how to tune the data network.
• They don’t factor in the end-to-end delay between the telephone speaker and listener. Excessive delay adversely affects MOS.
• They show quality in one direction at a time, rather than the two-way flow used in a real telephone conversation.
• They don’t scale to let you see the effect of multiple, simultaneous calls between a pair of locations.
Copyright John Q. Walker and Jeffrey T. Hicks, 2002. All Rights Reserved. 16
• They require invasive hardware probes, which you need to purchase and deploy before beginning VoIP measurements.
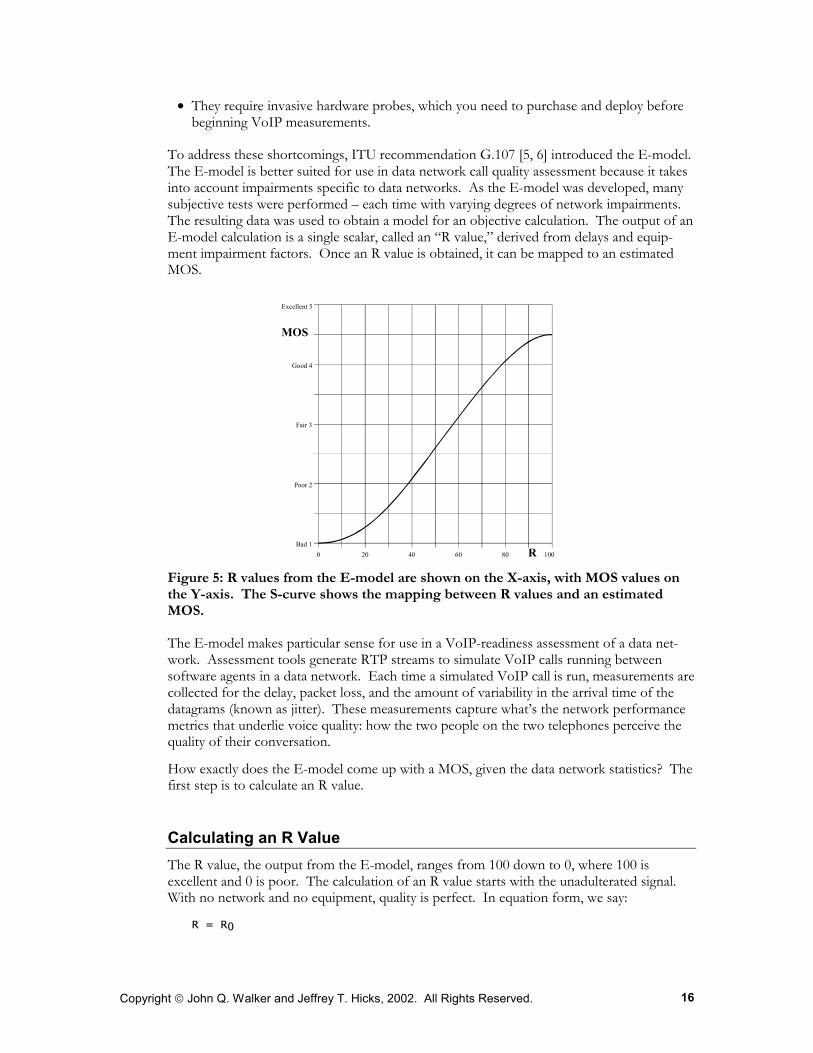
To address these shortcomings, ITU recommendation G.107 [5, 6] introduced the E-model. The E-model is better suited for use in data network call quality assessment because it takes into account impairments specific to data networks. As the E-model was developed, many subjective tests were performed – each time with varying degrees of network impairments. The resulting data was used to obtain a model for an objective calculation. The output of an E-model calculation is a single scalar, called an “R value,” derived from delays and equip-ment impairment factors. Once an R value is obtained, it can be mapped to an estimated MOS.
0 20 40 60 80 100 R
MOS
Excellent 5
Good 4
Fair 3
Poor 2
Bad 1
Figure 5: R values from the E-model are shown on the X-axis, with MOS values on the Y-axis. The S-curve shows the mapping between R values and an estimated MOS.
The E-model makes particular sense for use in a VoIP-readiness assessment of a data net-work. Assessment tools generate RTP streams to simulate VoIP calls running between software agents in a data network. Each time a simulated VoIP call is run, measurements are collected for the delay, packet loss, and the amount of variability in the arrival time of the datagrams (known as jitter). These measurements capture what’s the network performance metrics that underlie voice quality: how the two people on the two telephones perceive the quality of their conversation.
How exactly does the E-model come up with a MOS, given the data network statistics? The first step is to calculate an R value.
Calculating an R Value The R value, the output from the E-model, ranges from 100 down to 0, where 100 is excellent and 0 is poor. The calculation of an R value starts with the unadulterated signal. With no network and no equipment, quality is perfect. In equation form, we say:
R = R0
Copyright John Q. Walker and Jeffrey T. Hicks, 2002. All Rights Reserved. 17
But, the network and the equipment impair the signal, reducing its quality as it travels from end to end:
R = R0 – Is – Id – Ie + A
where:
• Is: simultaneous impairments to the signal
• Id: delays introduced from end to end
• Ie: impairment introduced by the equipment, including packet loss
• A: advantage factor. For example, mobile users may tolerate lower quality because of the convenience. Set to 0 in most models and assessments.
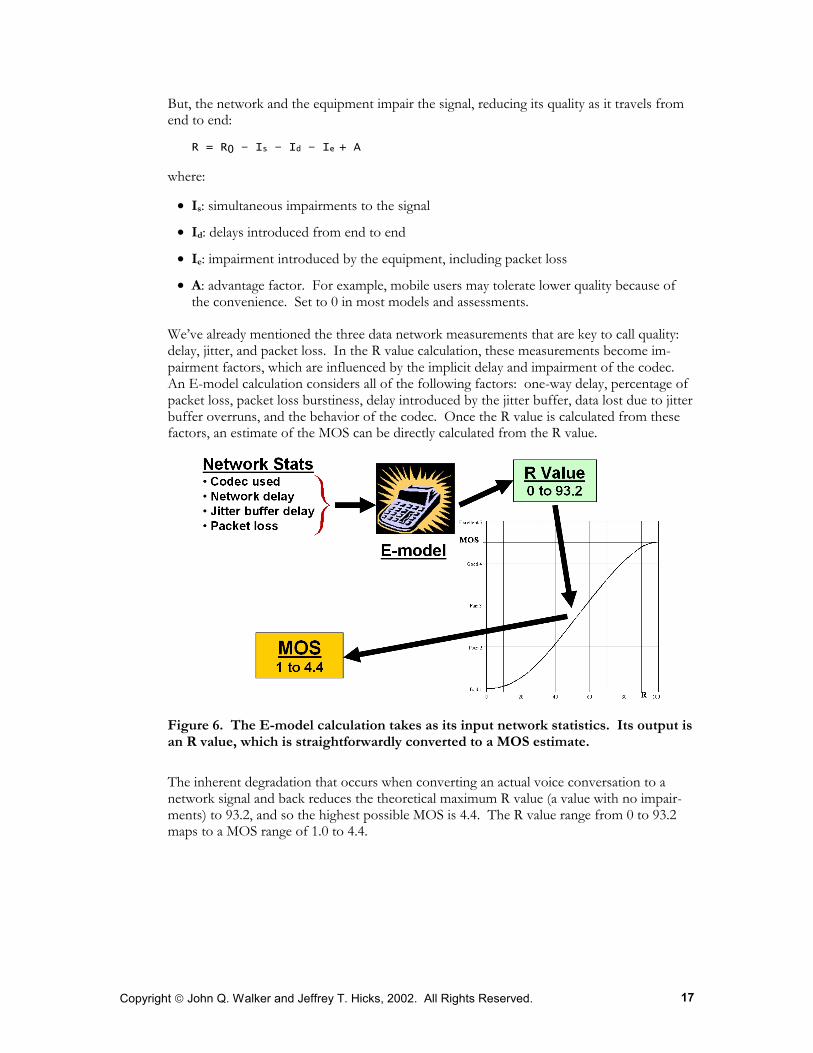
We’ve already mentioned the three data network measurements that are key to call quality: delay, jitter, and packet loss. In the R value calculation, these measurements become im-pairment factors, which are influenced by the implicit delay and impairment of the codec. An E-model calculation considers all of the following factors: one-way delay, percentage of packet loss, packet loss burstiness, delay introduced by the jitter buffer, data lost due to jitter buffer overruns, and the behavior of the codec. Once the R value is calculated from these factors, an estimate of the MOS can be directly calculated from the R value.
Figure 6. The E-model calculation takes as its input network statistics. Its output is an R value, which is straightforwardly converted to a MOS estimate.
The inherent degradation that occurs when converting an actual voice conversation to a network signal and back reduces the theoretical maximum R value (a value with no impair-ments) to 93.2, and so the highest possible MOS is 4.4. The R value range from 0 to 93.2 maps to a MOS range of 1.0 to 4.4.
Copyright John Q. Walker and Jeffrey T. Hicks, 2002. All Rights Reserved. 18
Figure 7. R values from the E-model are shown on the left, with MOS values on the right. The likely opinion of human listeners is shown in the middle.
Now that we’ve introduced the basics of the E-model calculation, let’s look at each of the components in detail: codecs, delay, jitter, and loss.
Codec Selection We introduced codecs in the Introductory Chapter. In audio processing, a codec (which stands for “compressor/decompressor” or “coder/decoder”) is the hardware or software that samples the sound and determines the data rate. There are dozens of available codecs, each with different characteristics.
The names of codecs correspond to the name of the ITU standard that describes their operation. The codecs named G.711u and G.711a convert from analog to digital and back with high quality and no compression. To do this, however, takes a fair amount of band-width. The G.711 codec, also called Pulse Code Modulation (PCM), was designed based on several fundamental signaling characteristics:
• It uses a frequency range of 4 kHz for voice information. Although the human voice covers a broader range of possible frequencies, this range is broad enough to make human conversation quite intelligible.
• To capture the proper degree of resolution, the voice information is sampled at double the frequency range, or 8000 times per second. Thus, PCM grabs a chunk of data every 0.125 ms (1 second / 8000 = 0.000125 seconds)
• Each sample occupies 8 bits worth of data, so the overall bandwidth required is 8000 * 8, or 64000 bps
When G.711 was invented, modern digital signal processing (DSP) technology was not avail-able. But new compression algorithms make it possible to provide intelligible voice com-munications with reduced bandwidth consumption. [7]
The lower-speed codecs, G.726-32, G.729, and those in the G.723.1 family, consume less network bandwidth. Low speed codecs impair the quality of the audio signal much more than high-speed codecs, however, because they compress the signal with lossy compression. Fewer bits are sent, so the receiving side does its best to approximate what the original signal sounded like. The fact that they use less bandwidth is good, since you can run more
Copyright John Q. Walker and Jeffrey T. Hicks, 2002. All Rights Reserved. 19
concurrent calls over the same links, but the compression they do reduces the clarity, intro-duces delay, and makes the voice quality very sensitive to lost data.
The way that the codec impairs the audio can reduce the R value significantly. “Codec impairments” are added directly into the “Ie” portion of the R value equation. For example, using the G.723.1a codec causes 19 points to be subtracted directly from the 93.2 points available in the theoretical maximum R value.
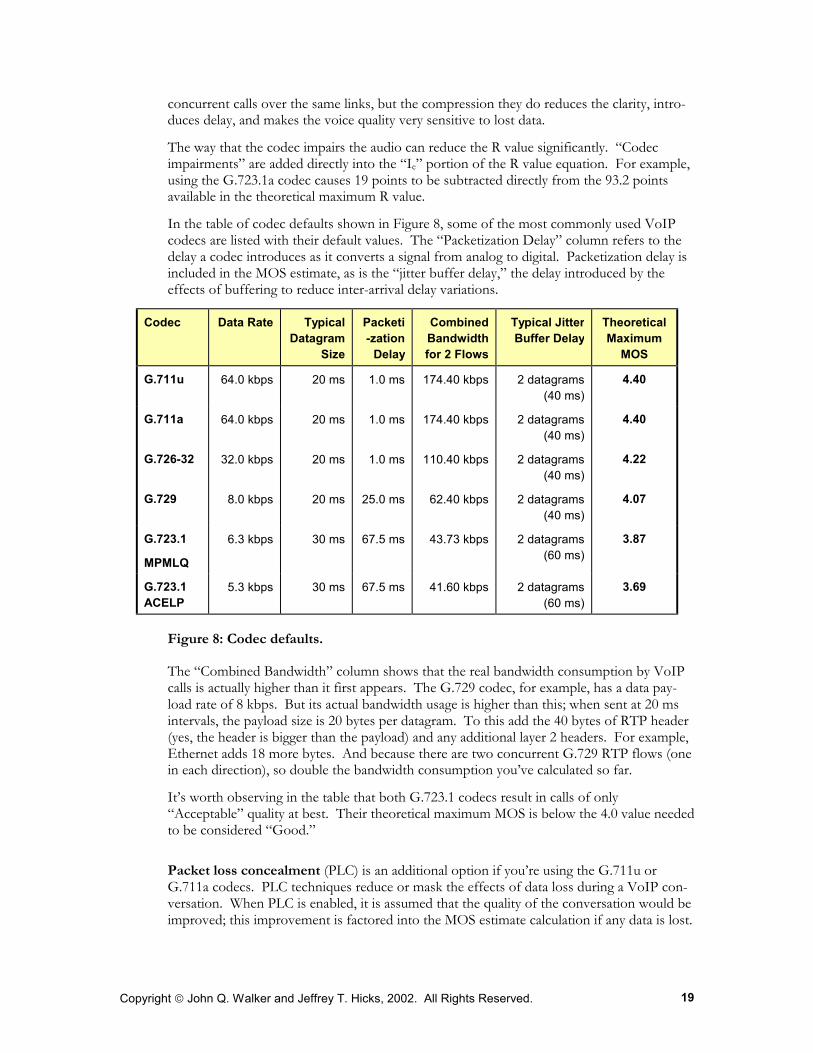
In the table of codec defaults shown in Figure 8, some of the most commonly used VoIP codecs are listed with their default values. The “Packetization Delay” column refers to the delay a codec introduces as it converts a signal from analog to digital. Packetization delay is included in the MOS estimate, as is the “jitter buffer delay,” the delay introduced by the effects of buffering to reduce inter-arrival delay variations.
Codec Data Rate Typical Datagram
Size
Packeti-zation
Delay
Combined Bandwidth for 2 Flows
Typical Jitter Buffer Delay
Theoretical Maximum
MOS
G.711u 64.0 kbps 20 ms 1.0 ms 174.40 kbps 2 datagrams (40 ms)
4.40
G.711a 64.0 kbps 20 ms 1.0 ms 174.40 kbps 2 datagrams (40 ms)
4.40
G.726-32 32.0 kbps 20 ms 1.0 ms 110.40 kbps 2 datagrams (40 ms)
4.22
G.729 8.0 kbps 20 ms 25.0 ms 62.40 kbps 2 datagrams (40 ms)
4.07
G.723.1
MPMLQ
6.3 kbps 30 ms 67.5 ms 43.73 kbps 2 datagrams (60 ms)
3.87
G.723.1 ACELP
5.3 kbps 30 ms 67.5 ms 41.60 kbps 2 datagrams (60 ms)
3.69
Figure 8: Codec defaults.
The “Combined Bandwidth” column shows that the real bandwidth consumption by VoIP calls is actually higher than it first appears. The G.729 codec, for example, has a data pay-load rate of 8 kbps. But its actual bandwidth usage is higher than this; when sent at 20 ms intervals, the payload size is 20 bytes per datagram. To this add the 40 bytes of RTP header (yes, the header is bigger than the payload) and any additional layer 2 headers. For example, Ethernet adds 18 more bytes. And because there are two concurrent G.729 RTP flows (one in each direction), so double the bandwidth consumption you’ve calculated so far.
It’s worth observing in the table that both G.723.1 codecs result in calls of only “Acceptable” quality at best. Their theoretical maximum MOS is below the 4.0 value needed to be considered “Good.”
Packet loss concealment (PLC) is an additional option if you’re using the G.711u or G.711a codecs. PLC techniques reduce or mask the effects of data loss during a VoIP con-versation. When PLC is enabled, it is assumed that the quality of the conversation would be improved; this improvement is factored into the MOS estimate calculation if any data is lost.
Copyright John Q. Walker and Jeffrey T. Hicks, 2002. All Rights Reserved. 20
PLC makes the codec itself more expensive to manufacture, but does not otherwise add delay or have other bad side-effects.
Delay The time it takes a conversation to travel from the speaker to the listener is the end-to-end delay, or latency. Latency introduces blank spaces in a conversation that are annoying at best. At worst, they can even cause the listener to misunderstand you because so much of the meaning in our speech is carried non-verbally, by such things as inflection and tone and pauses in the conversation.
End-to-end delay is actually made up of four components:
• Propagation delay: the time to travel across the network from end to end. It’s based on the speed of light and the distance the signal must travel. For example, the propaga-tion delay between Singapore and Boston is much longer than the propagation delay between New York and Boston.
• Transport delay: the time to get through the network devices along the path. Net-works with many firewalls, many routers, congestion, or slow WANs introduce more delay than an overprovisioned LAN on one floor of a building.
• Packetization delay: the time for the codec to digitize the analog signal and build frames – and undo it at the other end. The G.729 codec has a higher packetization delay than the G.711 codecs because it takes longer to compress and decompress the signal.
• Jitter buffer delay: the delay introduced by the receiver as it holds one or more data-grams to reduce variations in arrival times.
The combined value of propagation delay and transport delay is typically termed “network delay” or “one-way delay.” The packetization and jitter buffer delays are fixed, that is, they’re constants for any given call. However, you can readily experience transport delay as a result of traffic congestion, particularly if you have deep queues.
Many VoIP engineers don't know how much latency is too much. A simple answer is 150 ms. The ITU has conducted studies on the impact that delay has on quality. These studies are published as ITU recommendation G.114 [8]. Delays greater than 150 ms cause a conversation to become uncomfortable. This level of delay is usually the point at which both parties begin to speak at the same time and can’t recover gracefully – by the time they realize the other party is also talking, they’re too far into their own words.
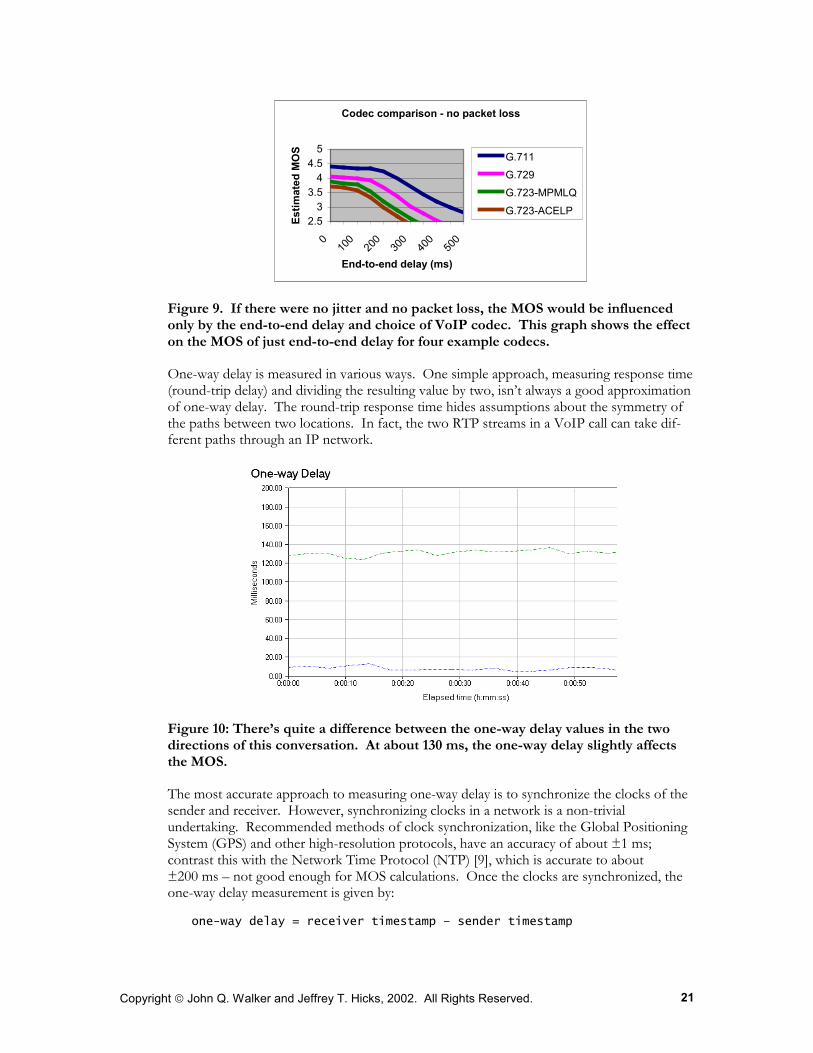
The end-to-end delay affects the MOS for each codec differently. Codecs that use little or no compression like G.711 can tolerate larger delays before the MOS begins to degrade.
Copyright John Q. Walker and Jeffrey T. Hicks, 2002. All Rights Reserved. 21
Codec comparison - no packet loss
2.53
3.54
4.55
010
020
030
040
050
0
End-to-end delay (ms)
Estim
ated
MO
S G.711G.729G.723-MPMLQG.723-ACELP
Figure 9. If there were no jitter and no packet loss, the MOS would be influenced only by the end-to-end delay and choice of VoIP codec. This graph shows the effect on the MOS of just end-to-end delay for four example codecs.
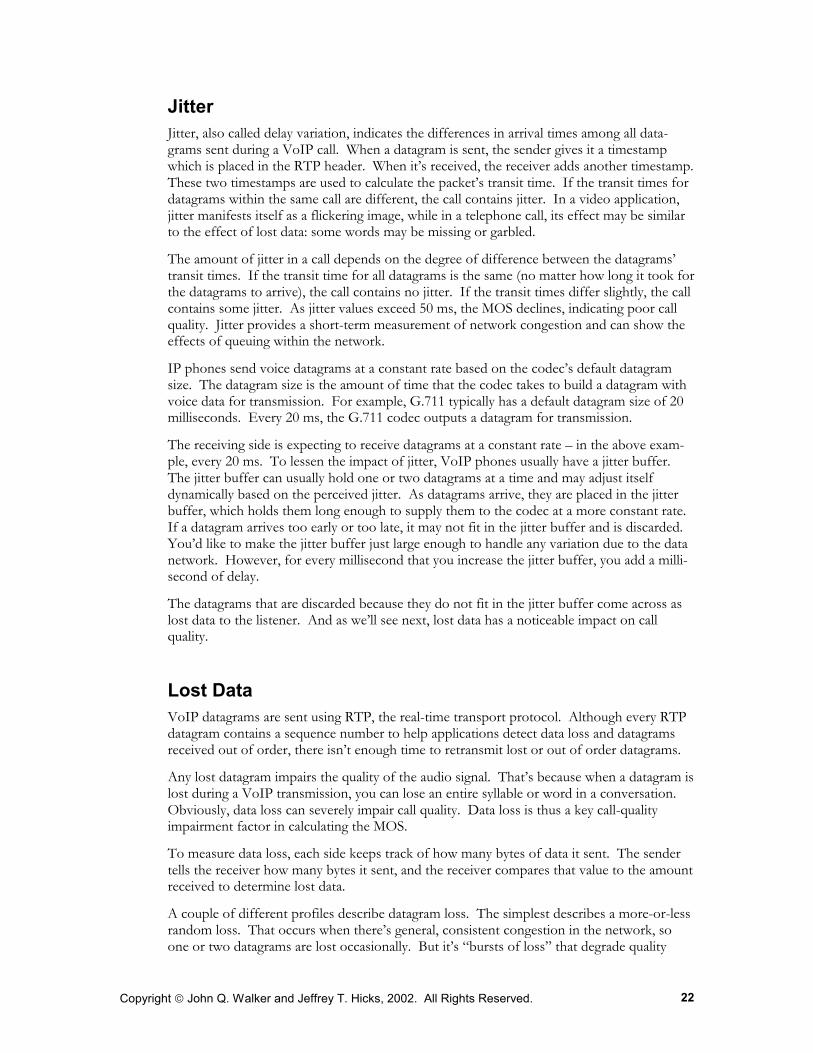
One-way delay is measured in various ways. One simple approach, measuring response time (round-trip delay) and dividing the resulting value by two, isn’t always a good approximation of one-way delay. The round-trip response time hides assumptions about the symmetry of the paths between two locations. In fact, the two RTP streams in a VoIP call can take dif-ferent paths through an IP network.
Figure 10: There’s quite a difference between the one-way delay values in the two directions of this conversation. At about 130 ms, the one-way delay slightly affects the MOS.
The most accurate approach to measuring one-way delay is to synchronize the clocks of the sender and receiver. However, synchronizing clocks in a network is a non-trivial undertaking. Recommended methods of clock synchronization, like the Global Positioning System (GPS) and other high-resolution protocols, have an accuracy of about ±1 ms; contrast this with the Network Time Protocol (NTP) [9], which is accurate to about ±200 ms – not good enough for MOS calculations. Once the clocks are synchronized, the one-way delay measurement is given by:
one-way delay = receiver timestamp – sender timestamp
Copyright John Q. Walker and Jeffrey T. Hicks, 2002. All Rights Reserved. 22
Jitter Jitter, also called delay variation, indicates the differences in arrival times among all data-grams sent during a VoIP call. When a datagram is sent, the sender gives it a timestamp which is placed in the RTP header. When it’s received, the receiver adds another timestamp. These two timestamps are used to calculate the packet’s transit time. If the transit times for datagrams within the same call are different, the call contains jitter. In a video application, jitter manifests itself as a flickering image, while in a telephone call, its effect may be similar to the effect of lost data: some words may be missing or garbled.
The amount of jitter in a call depends on the degree of difference between the datagrams’ transit times. If the transit time for all datagrams is the same (no matter how long it took for the datagrams to arrive), the call contains no jitter. If the transit times differ slightly, the call contains some jitter. As jitter values exceed 50 ms, the MOS declines, indicating poor call quality. Jitter provides a short-term measurement of network congestion and can show the effects of queuing within the network.
IP phones send voice datagrams at a constant rate based on the codec’s default datagram size. The datagram size is the amount of time that the codec takes to build a datagram with voice data for transmission. For example, G.711 typically has a default datagram size of 20 milliseconds. Every 20 ms, the G.711 codec outputs a datagram for transmission.
The receiving side is expecting to receive datagrams at a constant rate – in the above exam-ple, every 20 ms. To lessen the impact of jitter, VoIP phones usually have a jitter buffer. The jitter buffer can usually hold one or two datagrams at a time and may adjust itself dynamically based on the perceived jitter. As datagrams arrive, they are placed in the jitter buffer, which holds them long enough to supply them to the codec at a more constant rate. If a datagram arrives too early or too late, it may not fit in the jitter buffer and is discarded. You’d like to make the jitter buffer just large enough to handle any variation due to the data network. However, for every millisecond that you increase the jitter buffer, you add a milli-second of delay.
The datagrams that are discarded because they do not fit in the jitter buffer come across as lost data to the listener. And as we’ll see next, lost data has a noticeable impact on call quality.
Lost Data VoIP datagrams are sent using RTP, the real-time transport protocol. Although every RTP datagram contains a sequence number to help applications detect data loss and datagrams received out of order, there isn’t enough time to retransmit lost or out of order datagrams.
Any lost datagram impairs the quality of the audio signal. That’s because when a datagram is lost during a VoIP transmission, you can lose an entire syllable or word in a conversation. Obviously, data loss can severely impair call quality. Data loss is thus a key call-quality impairment factor in calculating the MOS.
To measure data loss, each side keeps track of how many bytes of data it sent. The sender tells the receiver how many bytes it sent, and the receiver compares that value to the amount received to determine lost data.
A couple of different profiles describe datagram loss. The simplest describes a more-or-less random loss. That occurs when there’s general, consistent congestion in the network, so one or two datagrams are lost occasionally. But it’s “bursts of loss” that degrade quality
Copyright John Q. Walker and Jeffrey T. Hicks, 2002. All Rights Reserved. 23
most significantly. A burst is generally considered to be more than one consecutive lost datagram. Human listeners don’t readily notice lower quality if loss of datagrams is ran-domly distributed, with just a few at a time dropped. This type of loss pattern has some ef-fect, as shown in the following two figures, but the quality decline mostly stems from a combination of loss and delay. Bursts of loss, however, can have a devastating effect, and are weighted heavily in the E-model calculation.
Take, for example, the following comparison charts:
Codec comparison - 5% random packet loss
11.5
22.5
33.5
44.5
5
010
020
030
040
050
0
End-to-end delay (ms)
Estim
ated
MO
S G.711 w/PLCG.729G.723-MPMLQG.723-ACELP
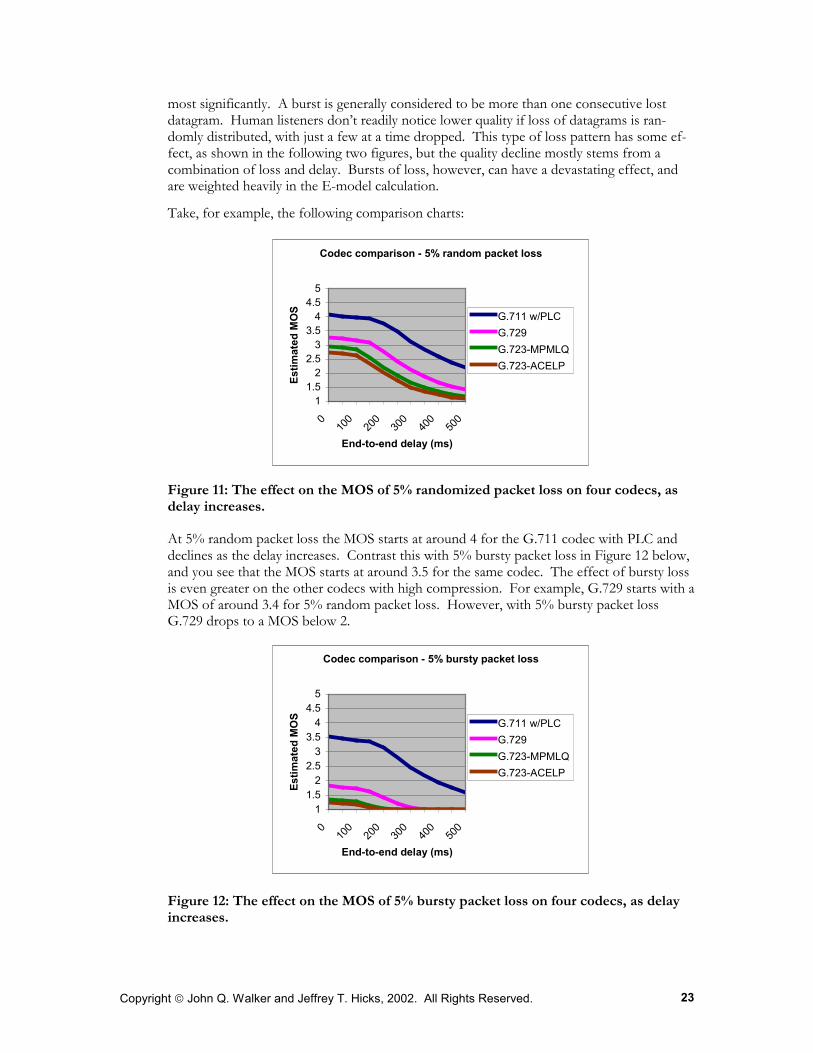
Figure 11: The effect on the MOS of 5% randomized packet loss on four codecs, as delay increases.
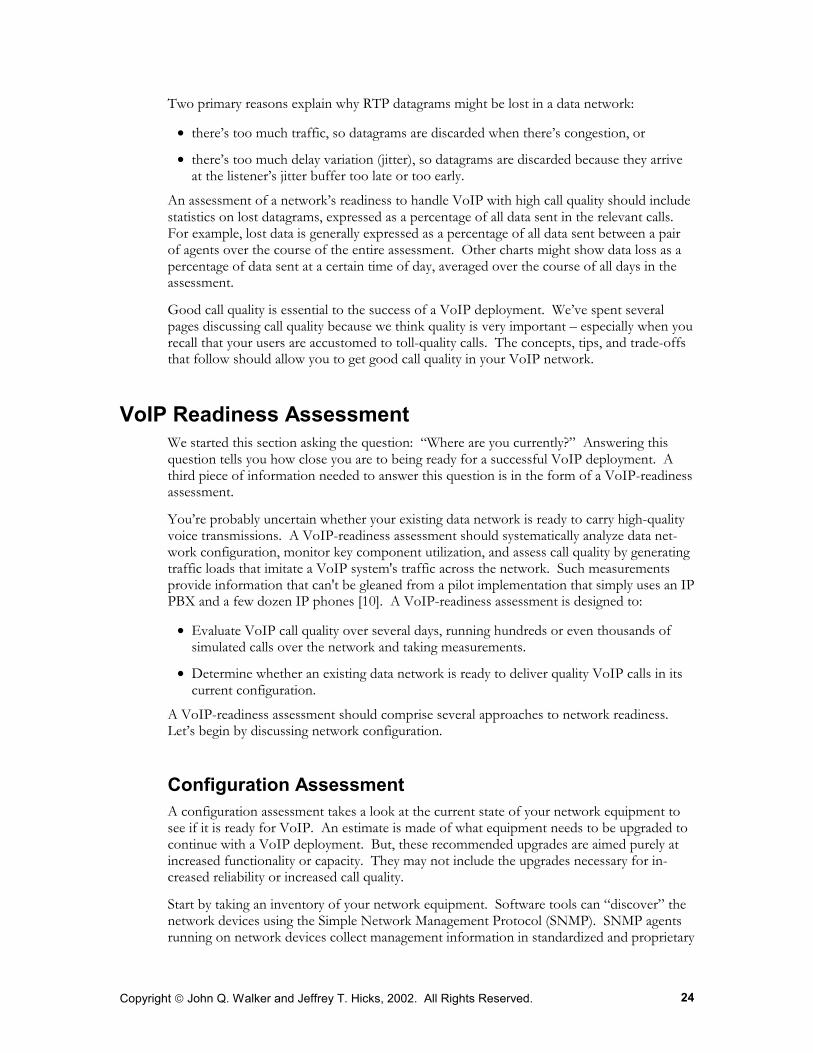
At 5% random packet loss the MOS starts at around 4 for the G.711 codec with PLC and declines as the delay increases. Contrast this with 5% bursty packet loss in Figure 12 below, and you see that the MOS starts at around 3.5 for the same codec. The effect of bursty loss is even greater on the other codecs with high compression. For example, G.729 starts with a MOS of around 3.4 for 5% random packet loss. However, with 5% bursty packet loss G.729 drops to a MOS below 2.
Codec comparison - 5% bursty packet loss
11.5
22.5
33.5
44.5
5
010
020
030
040
050
0
End-to-end delay (ms)
Estim
ated
MO
S G.711 w/PLCG.729G.723-MPMLQG.723-ACELP
Figure 12: The effect on the MOS of 5% bursty packet loss on four codecs, as delay increases.
Copyright John Q. Walker and Jeffrey T. Hicks, 2002. All Rights Reserved. 24
Two primary reasons explain why RTP datagrams might be lost in a data network:
• there’s too much traffic, so datagrams are discarded when there’s congestion, or
• there’s too much delay variation (jitter), so datagrams are discarded because they arrive at the listener’s jitter buffer too late or too early.
An assessment of a network’s readiness to handle VoIP with high call quality should include statistics on lost datagrams, expressed as a percentage of all data sent in the relevant calls. For example, lost data is generally expressed as a percentage of all data sent between a pair of agents over the course of the entire assessment. Other charts might show data loss as a percentage of data sent at a certain time of day, averaged over the course of all days in the assessment.
Good call quality is essential to the success of a VoIP deployment. We’ve spent several pages discussing call quality because we think quality is very important – especially when you recall that your users are accustomed to toll-quality calls. The concepts, tips, and trade-offs that follow should allow you to get good call quality in your VoIP network.
VoIP Readiness Assessment We started this section asking the question: “Where are you currently?” Answering this question tells you how close you are to being ready for a successful VoIP deployment. A third piece of information needed to answer this question is in the form of a VoIP-readiness assessment.
You’re probably uncertain whether your existing data network is ready to carry high-quality voice transmissions. A VoIP-readiness assessment should systematically analyze data net-work configuration, monitor key component utilization, and assess call quality by generating traffic loads that imitate a VoIP system's traffic across the network. Such measurements provide information that can't be gleaned from a pilot implementation that simply uses an IP PBX and a few dozen IP phones [10]. A VoIP-readiness assessment is designed to:
• Evaluate VoIP call quality over several days, running hundreds or even thousands of simulated calls over the network and taking measurements.
• Determine whether an existing data network is ready to deliver quality VoIP calls in its current configuration.
A VoIP-readiness assessment should comprise several approaches to network readiness. Let’s begin by discussing network configuration.
Configuration Assessment A configuration assessment takes a look at the current state of your network equipment to see if it is ready for VoIP. An estimate is made of what equipment needs to be upgraded to continue with a VoIP deployment. But, these recommended upgrades are aimed purely at increased functionality or capacity. They may not include the upgrades necessary for in-creased reliability or increased call quality.
Start by taking an inventory of your network equipment. Software tools can “discover” the network devices using the Simple Network Management Protocol (SNMP). SNMP agents running on network devices collect management information in standardized and proprietary
Copyright John Q. Walker and Jeffrey T. Hicks, 2002. All Rights Reserved. 25
formats called Management Information Base (MIB) objects. Network discovery tools can collect configuration information from the MIB objects on routers and switches. Some of the tools, like Microsoft Visio, can also help you draw a diagram of the network.
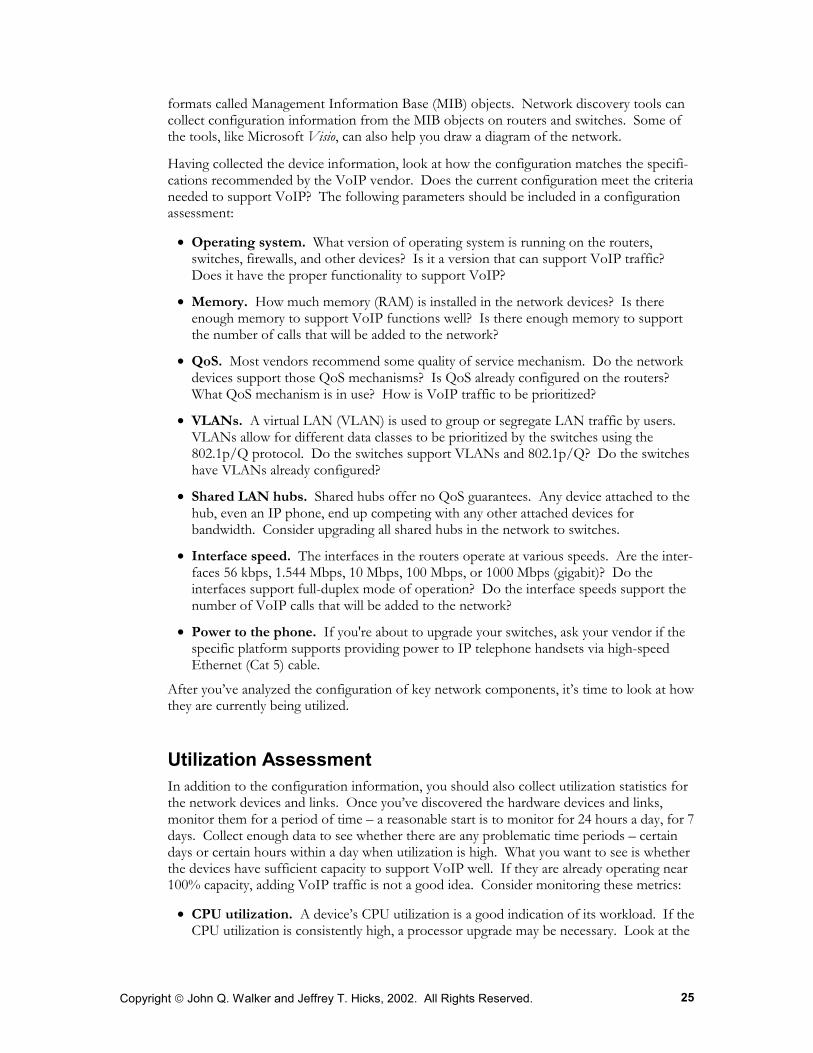
Having collected the device information, look at how the configuration matches the specifi-cations recommended by the VoIP vendor. Does the current configuration meet the criteria needed to support VoIP? The following parameters should be included in a configuration assessment:
• Operating system. What version of operating system is running on the routers, switches, firewalls, and other devices? Is it a version that can support VoIP traffic? Does it have the proper functionality to support VoIP?
• Memory. How much memory (RAM) is installed in the network devices? Is there enough memory to support VoIP functions well? Is there enough memory to support the number of calls that will be added to the network?
• QoS. Most vendors recommend some quality of service mechanism. Do the network devices support those QoS mechanisms? Is QoS already configured on the routers? What QoS mechanism is in use? How is VoIP traffic to be prioritized?
• VLANs. A virtual LAN (VLAN) is used to group or segregate LAN traffic by users. VLANs allow for different data classes to be prioritized by the switches using the 802.1p/Q protocol. Do the switches support VLANs and 802.1p/Q? Do the switches have VLANs already configured?
• Shared LAN hubs. Shared hubs offer no QoS guarantees. Any device attached to the hub, even an IP phone, end up competing with any other attached devices for bandwidth. Consider upgrading all shared hubs in the network to switches.
• Interface speed. The interfaces in the routers operate at various speeds. Are the inter-faces 56 kbps, 1.544 Mbps, 10 Mbps, 100 Mbps, or 1000 Mbps (gigabit)? Do the interfaces support full-duplex mode of operation? Do the interface speeds support the number of VoIP calls that will be added to the network?
• Power to the phone. If you're about to upgrade your switches, ask your vendor if the specific platform supports providing power to IP telephone handsets via high-speed Ethernet (Cat 5) cable.
After you’ve analyzed the configuration of key network components, it’s time to look at how they are currently being utilized.
Utilization Assessment In addition to the configuration information, you should also collect utilization statistics for the network devices and links. Once you’ve discovered the hardware devices and links, monitor them for a period of time – a reasonable start is to monitor for 24 hours a day, for 7 days. Collect enough data to see whether there are any problematic time periods – certain days or certain hours within a day when utilization is high. What you want to see is whether the devices have sufficient capacity to support VoIP well. If they are already operating near 100% capacity, adding VoIP traffic is not a good idea. Consider monitoring these metrics:
• CPU utilization. A device’s CPU utilization is a good indication of its workload. If the CPU utilization is consistently high, a processor upgrade may be necessary. Look at the

Copyright John Q. Walker and Jeffrey T. Hicks, 2002. All Rights Reserved. 26
average and the peak CPU utilization. The average CPU utilization may be low, but the peaks during busy times may indicate problems when VoIP traffic is added.
• Buffer utilization. To reduce jitter in a network, there should be plenty of available buffers. If buffers are highly utilized, there may be more delay associated with buffering packets and thus jitter can increase. Look at the average and peak buffer utilization.
• Dropped packets. When congestion occurs at a bottleneck, packets get dropped. Dropped packets are detrimental to VoIP call quality, so a high number for this statistic indicates frequent or prolonged congestion. This statistic may be correlated to high CPU utilization numbers.
• Bandwidth utilization. What percentage of your bandwidth is already being used? A sure way to achieve excellent voice quality is to be sincerely overprovisioned. The bandwidth utilization should give a good indication of capacity available for VoIP.
When analyzing the utilization of the network components, be sure to look at average and peak values.
Once you have collected the configuration and utilization information, you have some good indications of problem areas that need to be addressed or areas where VoIP should perform well. Combine these statistics with your current telephony usage statistics that we discussed previously, and plan ahead for potential problem areas before the VoIP traffic is added.
Call Quality Assessment The call quality portion of a VoIP-readiness assessment determines how well voice over IP will sound on a network by assessing the quality of simulated VoIP calls. To assess call quality, realistic VoIP traffic is sent across the network and the resulting flows are measured. Measurements for delay, jitter, and packet loss are collected and input to the E-model in order to obtain a MOS.
There are several characteristics of the simulated VoIP traffic to consider before running a call quality assessment:
• Which codecs will be used, since they incorporate compression algorithms, data rates, and datagram sizes?
• Whether packet loss concealment (PLC) is enabled for G.711 codecs. • Voice datagram sizes. • The ability to use silence suppression. Silence suppression can be used by some IP
phones to reduce the amount of bandwidth consumed. With silence suppression, if no one is talking, the phone sends much smaller packets.
• Jitter buffers and their sizes. • Quality of Service (QoS).
You can use pre-configured defaults for system parameters, or you can tune them to see how various technical choices affect call quality and bandwidth consumption. For example, you can examine the effects of a half-dozen codecs representing various compression algo-rithms; you can also tinker with jitter buffers, datagram size, and silence suppression.
Call quality testing simulates VoIP traffic between pre-selected points on a network for a chosen period of time. While the simulated calls are running, measurements are taken and call quality scores are calculated. Reports quantify what’s collected over the course of an assessment to ascertain a network’s readiness and capacity for handling real VoIP traffic.
Copyright John Q. Walker and Jeffrey T. Hicks, 2002. All Rights Reserved. 27
Assessment software measures delay, jitter, and lost data, and produces a report showing call quality by day of week, location, network cause, and so on. You end up being able to tell what technical factors affect call quality. What’s wonderful is that you can get all these answers before you’ve spent a lot of money, time, and energy on actually deploying VoIP equipment. You can work through all the data network issues so that by the time you actually start running the real VoIP piece of it, you have a data network that's going to work well. You can also make cost-effective decisions about network infrastructure and application traffic once you know how voice over IP is performing.
When running a call quality assessment, try to model the expected VoIP traffic. For exam-ple, we have eight major sites in NetIQ. From our development site in Raleigh, we rarely call our sales offices in Japan and Europe. It makes sense to set up just one simulated call from Raleigh to Japan and from Raleigh to Europe. An assessment generates several calls an hour, although we probably make less than one call a day between these sites. Part of an as-sessment is to make sure that you can get a connection and make a toll-quality call any time you want, so testing throughout the day is fine. We call infrequently from Raleigh to Port-land, so we would probably define two calls between those sites. Finally, we make many calls to our Houston and San Jose sites, so we would define ten simultaneous calls.
A call-quality assessment is not a stress test; remember, you’re running simulated traffic on a production network. Test with an approximation of the average call volume during work hours, as opposed to the peak call volume. There’s a nice “weakest component mode” though, that is easily observed. If the data network is already heavily loaded with existing application traffic and you then add VoIP traffic, it’s the VoIP traffic that breaks “first” – it will show high delay, jitter, packet loss, or some combination. Points of weakness are readily seen during preliminary test runs. If initial runs show a high MOS, the additional VoIP traf-fic will probably have no adverse effect on the other application traffic. However, if they quickly show a low MOS, you may or may not be affecting the other traffic – but you know immediately that the network resources are stretched too thin.
Predicting call quality before investing in VoIP equipment is a valuable step in the VoIP-readiness assessment. The call-quality assessment can be difficult without the proper tools. We’ve written a whitepaper that details how to do a call-quality assessment with one such tool, NetIQ’s Chariot VoIP Assessor [11, 12].
Bandwidth Modeling In previous phases of the planning process, you’ve collected current telephony usage stats and hardware configuration information. Now it’s time to use some of that information for modeling purposes. The goal of modeling is to look at existing telephony usage and existing data network utilization and try to determine if the current network infrastructure can sup-port the future VoIP traffic. This is the time to ask all of the “what if” questions concerning call volume and link capacity. The simplest case for modeling uses the projected call vol-umes, codec selections, and bandwidth requirements. Calculate the bandwidth required by the new VoIP traffic, and see whether its additional bandwidth requirements overload the network. Modeling can require a lot of math to calculate different values for different input variables. You may need to redo the calculations over and over – changing a different vari-able each time.
Modeling is often done for critical network links. As you are looking at initial VoIP deploy-ments, ask the “what if” questions before the voice traffic is placed on the network. Take a

Copyright John Q. Walker and Jeffrey T. Hicks, 2002. All Rights Reserved. 28
look at the different links that will need to support VoIP traffic. Then, take the following parameters as input for a model of that traffic:
• Codec. What codec will be used for the calls? As discussed earlier, different codecs have different bandwidth requirements. For example, G.711 requires 64 kbps (without protocol header overhead), but G.729 requires only 8 kbps. Selecting a codec with a lower bandwidth may allow for more calls, but the resulting MOS will be lower.
• Number of calls. The number of simultaneous voice calls that could be supported. This number may be represented in erlangs, to represent of the number of hours of call traffic that occur during the peak call volume.
• Current bandwidth utilization. What’s the current bandwidth utilization? This is usually expressed as a percentage of the total bandwidth available.
• Bandwidth capacity. What’s the maximum bandwidth capacity for the link? This is usually expressed in kilobits per second or megabits per second.
A Modeling Example We have a T1 link between the NetIQ offices in Raleigh and Houston. Based on our hard-ware analysis and assessment, we know that the link has a capacity of 1.544 Mbps, average utilization of 35%, and a peak utilization of 75% (occurring at various times throughout the week).
The call volume data says that we need to support, on average, ten simultaneous calls be-tween Raleigh and Houston. Our first choice is to use G.711 as the codec because it has the highest theoretical maximum MOS.
What if we add 10 G.711 calls to this link?
10 calls x 174.40 kbps per call = 1744.0 kbps
= 1.744 Mbps
The resulting call volume for 10 G.711 calls would be greater than the capacity for the link. So let’s try changing the codec.
What if we switch to a G.729 codec?
10 calls x 62.40 kbps per call = 624 kbps
The link has, on average, 1.544 Mbps x 65% = 1.004 Mbps. So the ten simultaneous calls using the G.729 codec could be sustained over the link. However, during peak utilization periods, only 1.544 Mbps x 25% = 386 kbps would be available. Thus, some of the calls would be dropped or would suffer reduced call quality. So on average, this link would be okay, but when it comes to call quality, you want to be better than average.
What if we enable RTP header compression on this link?
Routers support RTP header compression in an effort to reduce the bandwidth required by VoIP traffic. The IP, UDP, and RTP headers are compressed from 40 bytes to be-tween 2 and 5 bytes. Let’s assume that the header goes from 40 to 5 bytes. Now the bandwidth requirements for each G.729 call are as follows:
Copyright John Q. Walker and Jeffrey T. Hicks, 2002. All Rights Reserved. 29
20 bytes G.729 payload + 5 bytes RTP/UDP/IP header + 18 bytes Layer 2
header * 8 bits/byte * 50 packets/second * 2 (bidirectional call)
= 34.40 kbps per call
10 calls x 34.40 kbps per call = 344 kbps
Now, our call traffic is consuming 344 kbps, which fits in the 386 kbps that we have in the worst case during peak utilization.
Modeling can get very complicated, very quickly. There are many other questions that you can ask: What if QoS mechanisms are applied? What if silence suppression is enabled? Our recommendation is to start simple. Look at the bandwidth considerations related to your VoIP deployment and go from there, performing the calculations again for each variable you consider.
Evaluation and Purchase At this stage of your VoIP deployment, you begin to act on the information you collected during planning, analysis, and assessment. First, you rectify any problems that were identi-fied; in particular, you make the network improvements necessary for good call quality and upgrade the equipment gaps. Second, you set up a pilot deployment, to gain firsthand ex-perience taking the steps necessary to do a full-blown deployment. During the pilot deployment, you will evaluate and purchase your first round of new VoIP equipment.
Start with a realistic budget. Make some initial estimates as to what the deployment and its ongoing management will cost. What devices and services do you need to purchase and how much will they probably cost? Are these estimates close to what you expect to spend?
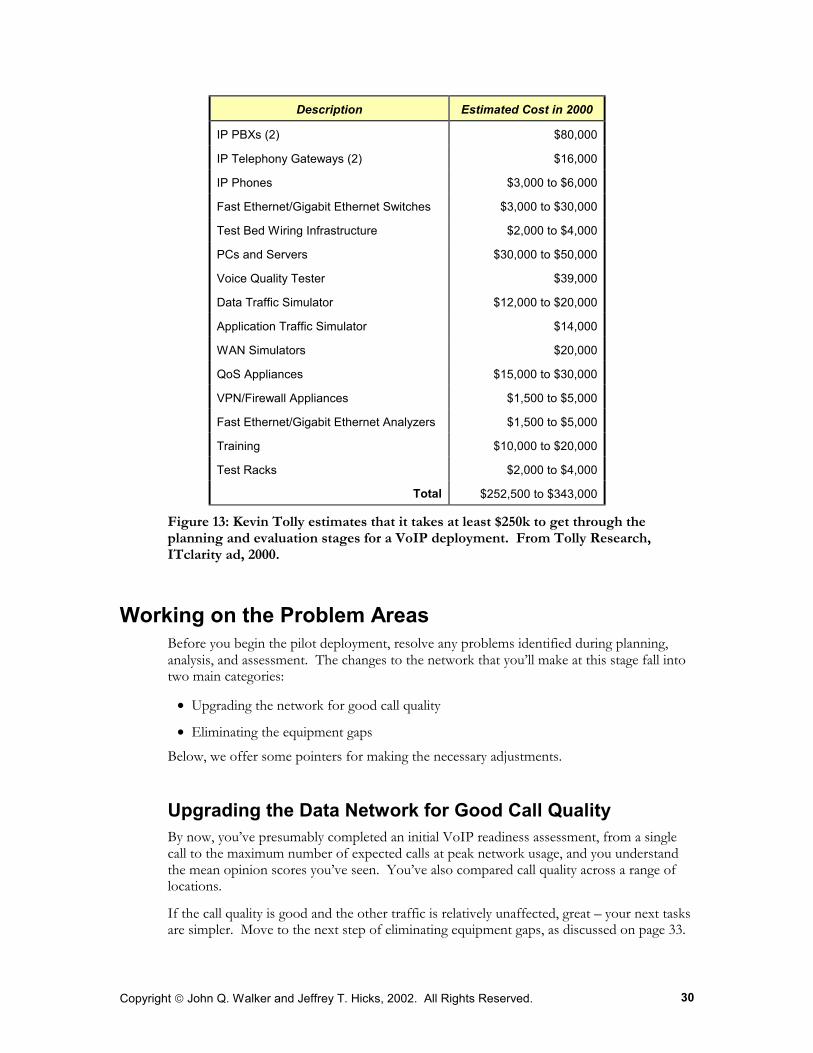
Here’s another chart from Tolly Research, showing their estimate of the cost of completing the planning and evaluation stages of a major VoIP deployment. These numbers include the purchase of the equipment for a small pilot deployment, as well as the related test equipment and personnel training. They believe the process costs at least $250k US dollars when done in a structured manner. The chart is part of an advertisement promoting their services, but we think it’s a good itemization.
Copyright John Q. Walker and Jeffrey T. Hicks, 2002. All Rights Reserved. 30
Description Estimated Cost in 2000
IP PBXs (2) $80,000
IP Telephony Gateways (2) $16,000
IP Phones $3,000 to $6,000
Fast Ethernet/Gigabit Ethernet Switches $3,000 to $30,000
Test Bed Wiring Infrastructure $2,000 to $4,000
PCs and Servers $30,000 to $50,000
Voice Quality Tester $39,000
Data Traffic Simulator $12,000 to $20,000
Application Traffic Simulator $14,000
WAN Simulators $20,000
QoS Appliances $15,000 to $30,000
VPN/Firewall Appliances $1,500 to $5,000
Fast Ethernet/Gigabit Ethernet Analyzers $1,500 to $5,000
Training $10,000 to $20,000
Test Racks $2,000 to $4,000
Total $252,500 to $343,000
Figure 13: Kevin Tolly estimates that it takes at least $250k to get through the planning and evaluation stages for a VoIP deployment. From Tolly Research, ITclarity ad, 2000.
Working on the Problem Areas Before you begin the pilot deployment, resolve any problems identified during planning, analysis, and assessment. The changes to the network that you’ll make at this stage fall into two main categories:
• Upgrading the network for good call quality
• Eliminating the equipment gaps
Below, we offer some pointers for making the necessary adjustments.
Upgrading the Data Network for Good Call Quality By now, you’ve presumably completed an initial VoIP readiness assessment, from a single call to the maximum number of expected calls at peak network usage, and you understand the mean opinion scores you’ve seen. You’ve also compared call quality across a range of locations.
If the call quality is good and the other traffic is relatively unaffected, great – your next tasks are simpler. Move to the next step of eliminating equipment gaps, as discussed on page 33.
Copyright John Q. Walker and Jeffrey T. Hicks, 2002. All Rights Reserved. 31
If the call quality is not acceptable, determine what the problems are and where they’re lo-cated. What factor influenced the poor quality the most: end-to-end delay, jitter, lost data, or a combination of all three? Can a simple change in the VoIP configuration options, such as the choice of codec, improve the call quality sufficiently? Where are the most likely bottle-necks?
Begin remedying poor call quality by cleaning up the existing network traffic. It’s been esti-mated that 20% to 50% of network traffic is unnecessary. That’s because the default settings of modern operating systems often turn on unneeded network services. End users and even administrators are usually unaware that this traffic even exists. A good way to detect this traffic is with a protocol or LAN analyzer. Sometimes, older systems are still generating un-used traffic. Common examples are the NetBEUI and IPX protocols. Not only will re-ducing network traffic free up bandwidth, but it will also reduce processor and memory utili-zation on your PCs and servers. [13]
Now, look at the costs of making the required network improvements. Choices include adding more bandwidth, upgrading or replacing existing network equipment, laying out your network architecture in a more efficient configuration, reconfiguring or tuning the network for QoS, or a combination of these.
These choices are only the start of a decision tree for a network administrator, because the costs of these different choices are not equal. For example, adding more bandwidth may be a recurring expense if bandwidth is leased; upgrading the hardware may be a capital expense; and QoS tuning may appear to be free, but it usually has a high cost in personnel time.
Analyze the costs in as much depth as you can and decide whether you want to proceed with network changes. Readying the network is an iterative process of making the most cost-effective improvements a step at a time, then repeating the VoIP-readiness assessment to see if you’re reaching your call-quality goals.
If your cost estimates for preparing the data network for VoIP appear too high, this is a good time to take another look at your VoIP deployment plan. By this point, you’ll under-stand better what the deployment will require, so you’ll have some choices:
• you can decide how to budget costs intelligently at the right time in the future,
• you can increase your current budget and proceed – considering this a suitable long-term investment, or
• you can approach VoIP as a staged deployment, taking some steps now and saving some steps for later.
Obtaining More Bandwidth Here are four tuning techniques worth exploring to conserve and ration bandwidth: RTP header compression, silence suppression, RTP multiplexing, and call admission control.
• Compressed RTP headers save bandwidth by reducing the number of bytes in RTP datagrams. VoIP traffic uses RTP to encapsulate the speech frames. RTP header com-pression (called “cRTP”) is used among routers in the network backbone. It can reduce the 40-byte RTP headers to a tenth of their original size, halving the bandwidth con-sumed when using low-speed codec. In streaming video, by contrast, the payload is of-ten ten times the size of the header, so compression may not be noticeable. Enable it when there’s a link along the route with bandwidth lower than 500 kbps. So, why not
Copyright John Q. Walker and Jeffrey T. Hicks, 2002. All Rights Reserved. 32
always use cRTP? It adds latency, increasing the transport delay component of the end-to-end delay.
• Silence suppression saves bandwidth by making the payload smaller. In most telephone conversations, there are times when one speaker or the other (or both) are silent. Dur-ing silence, it’s not necessary to send full packets; a much smaller packet can be sent, in-dicating silence during the period. Enabling silence suppression at each end of the con-versation can typically reduce overall payloads by 50%, although call quality may be affected.
• RTP multiplexing can save bandwidth by putting multiple packets of audio information into one datagram. This means that only one IP/UDP/RTP header is necessary, instead of one for each audio packet. Delay is increased, though, since the datagram can’t be sent until multiple packets have been generated. Another downside is that the loss of a single datagram can mean the loss of multiple audio packets, further eroding the call quality.
• Call admission control lets you avoid having too many concurrent VoIP conversations. If your WAN bandwidth only supports two VoIP calls well, you want to avoid a third call. VoIP server software can limit the number of concurrent conversations to a pre-defined number, to avoid overloading slow links. Excess calls can then be automatically routed to the PSTN.
These four techniques may help, but it may ultimately come down to the fact that you need bigger pipes. Look for the slowest links, or the links where the contention for bandwidth is greatest. Many delay and data-loss problems can be solved by having lots of available band-width, to accommodate the VoIP conversations and the other concurrent network transac-tions effortlessly.
Upgrading or Replacing Existing Equipment Upgrading or replacing your data network equipment may give you the boost you need, without buying additional bandwidth from your service provider. The latest, fastest equip-ment often can increase bandwidth, decrease latency, and increase capacity. Here are some upgrades to consider:
• Hubs often create bottlenecks in a heavily-used LAN. Consider replacing hubs with Layer 3 switches. Recent switches are also much better at handling IP multicast traffic than those of a few years ago; check to see if the combination of old switches and IP multicast is massively throttling your available LAN capacity. Also, aside from being orders of magnitude faster than traditional routers, high-speed switches are getting quite reasonable in price. Purchasing these is an especially good move if your older routers don’t support the QoS schemes you plan to implement, so you have to replace them anyway.
• Routers operate using queues for the arriving and departing traffic. Routers always seem to function better with lots of RAM. Doubling or tripling a router’s RAM is frequently a cost-effective upgrade.
• Modern hardware-based firewalls have much higher capacities than some older, software-based models. Firewalls are often bottlenecks, greatly increasing transport delay as they reach their limits.
Copyright John Q. Walker and Jeffrey T. Hicks, 2002. All Rights Reserved. 33
• In the WAN, look for ways to reduce delay. A change from satellite links to terrestrial links for VoIP traffic flows can significantly reduce the fixed propagation delay.
• Network backbones can become the bottlenecks over time. Is the backbone now the place where traffic slows down during peak usage periods? Is it time to consider the new optical switches and routers?
Changing the Network Design Will laying out the network and arranging the users differently help improve the key VoIP measurements? Network redesign is obviously a big step. Consider changing the layout of your data network for situations like these:
• Could VoIP conversations take shorter, more direct routes, reducing their propagation and transport delays? For example, do you have traffic going from New York City through San Diego back to Florida?
• Fewer hops can reduce the cumulative transport delay. VoIP traffic is much more sensi-tive to the number of hops than traditional TCP transactions. Do some VoIP flows take 30 or 40 hops from end to end? Could the number of hops be reduced by re-engineering the network?
• Clustering of traffic patterns means finding out what users are using which network applications, and where they’re located. Does unnecessary data traffic flow on the same links as critical VoIP traffic? Could servers be positioned closer to clients, reducing backbone traffic? Could firewalls be placed differently?
• Look for bottlenecks or other congestion points. If they can’t be eliminated, can the voice traffic be routed around them?
• Consider a layered architecture. QoS will increase the load on your network devices. A layered architectures means that you push CPU-intensive work, like classifying packets with access-control lists, out to the edge of your network. This lets the core of the net-work focus on high-speed switching, which is critical to delay-sensitive voice traffic.
Reconfiguring or Tuning the Network for QoS Network devices and applications have powerful techniques available for dealing with the sharing of network resources, collectively referred to as Quality of Service (QoS). QoS is most useful in VoIP deployments to help with consistency. At times when overall conges-tion rises, you would like VoIP traffic to maintain consistent low levels of delay, jitter, and packet loss. Like having lots of available bandwidth, QoS can also give you breathing room.
QoS is a large topic with lots of technical details, so we’ll discuss tuning choices in detail in a later chapter. At this point, though, plan on using QoS to make a good situation better – don’t plan on using it to move you from a marginal situation to “good enough.”
Eliminating Equipment Gaps We’ve supplied an outline of equipment configuration items to analyze in “Configuration Assessment” on page 24. Begin making the upgrades, starting with those that are the most cost effective. Make changes or upgrades one device at a time to start with, verifying proper

Copyright John Q. Walker and Jeffrey T. Hicks, 2002. All Rights Reserved. 34
operation after each change. Do all this before adding any VoIP traffic to the mix; your in-tention is to make sure that you’re doing what’s necessary for VoIP without degrading the existing data network traffic.
For example, before updating the operating system of a router, build a small acceptance test, in which a variety of representative traffic is generated among several places in a network to see that it’s routed correctly. For example, the test should contain flows consisting of TCP, UDP, ICMP, IP multicast, and router-table-update traffic. Run the acceptance test before making the upgrade, noting both proper operation and the traffic’s performance. (An appli-cation traffic generator can be especially helpful for this type of testing [14]). Make the equipment changes, then run the acceptance test again, checking to see that everything is operating as before and the performance meets or exceeds the previous measurements.
Building a Pilot Deployment A pilot deployment is the place for your entire team to get firsthand experience with VoIP systems and their behavior. And, during the pilot deployment, you evaluate and purchase your first round of new VoIP equipment.
Learning New Lessons Well The reason to do a pilot deployment is to learn. Your test lab is the place for everyone on your team to get his or her hands dirty with VoIP configuration details. Schedule times for unstructured use of the new equipment. Connect the equipment together in many different combinations. Make mistakes; get into situations where nothing seems to work, and spend the time required to debug the situation. Your test lab is where the whole team needs to get very comfortable with how VoIP behaves, how it mixes with other traffic, how it behaves when something is wrong, how to debug it, how to isolate a problem, and how to fix it.
Take equipment out of the boxes, get it up and running, read the manual, play with all the configuration choices. Do benchmark testing. Build a mini-representation of your data network traffic, such as a mix of e-mail, ERP, Web browsing, streaming video, database queries, and so on. How does the application traffic perform with no VoIP? How does it perform when VoIP is added?
Be sure to include representative firewalls, DNS and DHCP servers, VPN servers, traffic shapers, and other specialized networking gear in the test lab. Configure the firewalls to mimic the settings in your production firewalls, then make sure all the VoIP traffic – both setup and call traffic – passes through the firewalls and traffic shapers as intended. These types of devices are most likely to be sources of configuration errors or omissions. Learn all you can in the test lab, and learn more in the pilot to assure it is right when you do the full deployment.
The pilot is the time to work through a range of tuning choices. For example, some QoS techniques require that the devices at each of the hops through the IP network be reconfigured. Making these changes can be tedious when done by hand, but you’ll find that by doing things by hand, you learn where great productivity gains can be made. Your team needs to be experts at tuning data networks for VoIP – such tuning is not done just once (at the initial deployment), but it’s done whenever a new device is added or topology changes are made.
Copyright John Q. Walker and Jeffrey T. Hicks, 2002. All Rights Reserved. 35
Extensive education of the IT and support teams should also take place during the pilot. To many experienced in the data networking community, the VoIP concepts we’ve discussed so far may be new, alien, and confusing. Send them to the classes they enrolled in months ago, read all you can find on the Web, devour the documentation from the vendors, read the weekly and monthly journals, and let them play in the lab.
Finally, your team needs to become experts at monitoring and managing the VoIP system. Install the server and agent management components, and start gathering reports. You need to learn which events in your environment should be routed to you as alerts, and which should be handled automatically. What does it look like at the management console when a break occurs in the network? What does congestion look like? What happens when call quality declines?
Starting the Pilot The locations where you choose to roll out VoIP for a pilot program will have a noticeable influence on what you can learn from the pilot. First of all, pick places where the ROI is high, the potential for disruption is low, and the users’ cooperation and feedback level is high. See the last chapter for some good candidates.
You’ll want to pick two locations, so you can run VoIP both within a single location and between a pair of locations. One of the best places to start a VoIP pilot is between a pair of branch offices. This is true for several reasons. First, from a cost perspective, it’s usually prohibitively expensive to put full-featured telephony equipment in small branch offices, even though the users in these offices may need the same features as the central office.
Second, from a project-management standpoint, it’s much simpler to coordinate the rollout of a new technology in small groups. Because branch offices conveniently organize these small groups geographically, where they share the same infrastructure, but are separate from other groups, the branch office is an ideal place to start with VoIP.
Third, small groups of users means less risk. Even though IP telephony products are maturing rapidly, few businesses have the confidence to forklift the rock-solid equipment they’ve been using the past 20 years and replace it with “converged” equipment.
Finally, to get deployments started, VoIP vendors have some nice “branch office” packages with fairly attractive pricing.
Evaluating Equipment and Systems Your test lab and your pilot deployment are the places to evaluate the new VoIP hardware and software equipment you plan to acquire. The question you’re attempting to answer in an evaluation is whether the components and their vendors meet your expectations.
Review how you make evaluation and purchase decisions. Presumably, it is to obtain equipment that gets you where you are headed. You’d like your purchases to be cost-effective, scalable, and reliable. VoIP equipment may have a range of expected lifetimes; do the purchases satisfy the lifecycle expectations you have for them?
New purchases are commonly evaluated in a setting that represents typical usage in your en-vironment. When measurements and comparisons are done by professional testing labs or at shows, they’re sometimes known as “bake-off” or “shoot-outs.” A representative bake-off requires some planning, though, to make sure that you’re testing what’s important for
Copyright John Q. Walker and Jeffrey T. Hicks, 2002. All Rights Reserved. 36
your environment. Effective analysis skills and thorough test tools aren’t necessarily com-mon, which is why many rely on the evaluations and comparison done by professional test-ing labs. So, you face a trade-off: do a bake-off in-house, tailored to your environment, or depend on the results done by professional testing labs.
Network performance questions are easy to pursue as you evaluate network equipment for VoIP:
• What’s the user throughput through the device for one application session?
• How many sessions can you run concurrently? When you reach that number, what’s the user throughput?
• What’s a recommended maximum number of sessions to configure, by CPU or RAM?
• How many locations (address pairs) can you have in concurrent sessions?
• Same questions, but with response time rather than throughput – what’s the latency through the device with one session? When you reach the maximum, how bad does the latency get? What’s the recommended maximum?
• Ask similar questions, but in the context of end-to-end delay, packet loss, and jitter – the key network performance metrics for VoIP and multimedia traffic?
• What happens as you add IP multicast traffic?
• Now, put together a realistic traffic mix in the test lab. Let’s say your network is 60% TCP, 30% RTP, 10% UDP, with a mix of transactions, file transfers, streaming. What are the representative throughput, response time, delay, lost data, and jitter values for the corresponding application traffic?
• What happens when you leave traffic mixes like this going for days or weeks at a time?
In the end, you may determine that the devices you’re evaluating may have similar measure-ments. But, the process of purchasing and using the equipment has brought you closer to what’s probably the most important element of the evaluation: your relationship with the vendor.
We’re often asked questions like this, “We have 250 telephones we want to convert to VoIP. What vendor should we choose?” We recommend choosing four or five vendors, and building pilots with a size of about 10 IP phones each. The vendors will know you have your eye on a larger rollout than just 10 – how do they treat you during the pilot? How is their product reliability? How is their technical support?
The quality of the relationship you build with the equipment vendors, as well as the quality and price of their products, should guide you in deciding what to buy. It takes doing a pilot to give you the confidence to know what to select.
Watching for VoIP Gotchas Tom Lancaster, in his excellent VoIP tips on searchNetworking.com [15, 16], has brought to our attention some gotchas you’re likely to encounter in your pilot: echo and full duplex capability in softphones. We’ve captured his advice here.
Copyright John Q. Walker and Jeffrey T. Hicks, 2002. All Rights Reserved. 37
Dealing with Echo Problems Echo sounds likes a speaker’s words are being repeated as soon as they reach the receiving end of a call. As long as the echo is reasonably quiet and short, most people can tolerate it, if they notice it at all. However, as the time between your speech and the echo grows, the echo becomes irritating.
The first step in getting rid of echo is to isolate its source. Usually only one party hears the echo. If that’s the case, the echo source is on the far end. This is fairly logical if you think about standing in a canyon shouting “echo echo echo.” If you stand right next to a wall and shout “echo,” you’re not going to hear one. To hear the echo, you have to stand far enough away that the sound has time to travel from you to the reflection and bounce back to you. When you shout “echo” into a nearby wall, more sound bounces back to you, but the delay is so short that you can’t hear it. For this reason, if your local gateway is causing an echo, you won’t hear it because you’re too close.
After you figure out which end of the circuit is causing the echo, look for the “usual sus-pects.” The easy bet is cheap headsets or conference phones. These devices are notorious for allowing the output from the speaker back into the input (the microphone). In this case, an echo problem is easy to diagnose because you can swap them out immediately and note whether the echo disappears. If it doesn’t, the next guess is any place where different telephony technologies meet. For instance, a 2-wire to 4-wire conversion and a digital-to-analog gateway are common causes of noticeable echo. Troubleshooting these components will take a little more effort and usually some testing instruments will be needed to measure things like decibel loss and impedance.
Determining Full-Duplex Capability in Softphones The audio hardware in PCs being used as softphones needs to be able to record and play back at the same time. This is called full-duplex audio; without it, you can speak or listen, but not both at the same time. Unfortunately, many PCs have hardware that does not sup-port full-duplex audio. For these computers, you may have to use an external device, like an IP phone, instead of your PC’s sound card and microphone. Upgrading sound cards in a few PCs in a small office may be pretty annoying, but it can be a budget-buster if you order 200 softphones for your corporation and find out your desktops will all require upgrades be-fore you can use them.
Checking to see whether your PCs support full duplex audio is a fairly simple matter. Start by making sure your microphone and speakers are plugged in and turned on. Open a pro-gram that you can use to record and play back sound from your microphone. Microsoft Sound Recorder is a free package that ships with Windows (Start/Programs/Accessories/Entertainment/Sound Recorder). If you don’t already have a favorite third-party application, use the Microsoft program.
Next, make a recording. Do this by clicking the “Record” icon and speaking into your microphone for a minute. After you have finished, open a second instance of Sound Recorder (or your favorite application). On the first Sound Recorder, rewind your recording and play it back. Once it starts to play back, quickly switch to the second instance of Sound Recorder. On the second instance, begin recording again for a few seconds. If you can play back the second recording, you know the PC supports full-duplex audio.
Copyright John Q. Walker and Jeffrey T. Hicks, 2002. All Rights Reserved. 38
Deployment, Tuning, and Testing Presumably you’ve planned your VoIP deployment well, understood your user requirements, and understood the existing data network. You’ve put together a shopping list of upgrades and new equipment, and have completed their evaluation and purchase. You’ve made the upgrades necessary in the network, and are sure everything’s working well without VoIP.
Now it’s a matter of making the VoIP deployment work as you planned.
Deploy the new components one at a time, starting in the places in the network where the new components are most likely to work well the first time. Most breakage in a network occurs when changes are made. Geoff Smith at Mitel observes in 2002 that most VoIP failures happen because of changes to routing tables in network routers. If possible, make one change at a time, and be ready to withdraw the change if something breaks.
It’s unlikely everything will work as desired without some tuning. We’ll spend a separate chapter later in the book on the many techniques available for tuning network traffic.
Testing is an absolutely vital part of the deployment phase. Testing will help you get un-equivocal answers to questions like these: Does it work like you planned? Do all the features work? Can everyone be reached? Does it behave well under stress? To answer these ques-tions, you’ll need to construct a test plan; your team should be able to confirm that every aspect of the project is working as desired. An outline for constructing a VoIP test plan is described below.
Assembling a Test Plan Getting your VoIP deployment deployed well means making sure it is working as designed. Deployment teams put together test plans to verify that the specifications have been met. Here are some of the key elements of a VoIP deployment test plan.
• Operational and functionally complete?
Does the end-user equipment work right (microphones, handsets, headphones, sound cards, dialing interfaces)? Do each of the VoIP functions work? For every user? At every interface?
If you have PSTN failover, does a break in the VoIP system cause the PSTN failover to occur quickly?
• Easy to use?
You want the system to be easy to use for each of your end users, to avoid a long series of help desk calls. Put together a list of representative tasks that each user should be able to accomplish. Observer some controlled user interface testing to assure that they can do all the tasks, quickly and without errors.
You also want your IT team to be able to do their jobs easily and without errors. Can they add, modify, and remove users easily? Can they quickly and correctly find and iso-late faults when they occur?
Copyright John Q. Walker and Jeffrey T. Hicks, 2002. All Rights Reserved. 39
• Is network performance good for the networked applications?
Do telephone conversations sound good? With VoIP, network performance is synony-mous with call quality. We spent a lot of discussion in this chapter talking about the need to adequate bandwidth, low delay, and low jitter. The proof is in the measurement of these variables on the deployed network.
Do the transaction-oriented applications on the network perform well? The quality of the experience using traditional applications is measured by response time or through-put. For each critical application on the network, is the response time or throughput still meeting expectations?
This second set of measurements requires you to do benchmarking. Treat it like a high-school chemistry experiment. Collect a representative set of timing samples before making any changes, make the changes, then rerun the exact same set of measurements.
• Interacts well with other equipment and applications?
Setting up VoIP will involve many changes to your existing data network equipment. Are the routers still routing correctly? Are the firewalls still permitting and constraining the right traffic? Does IP multicast traffic still get routed correctly?
• Stable under stress?
You designed the VoIP system to support a given number of calls simultaneously, along with all your other network traffic. When that limit is reached, is the call quality still good? Are you using call admission, so that the number of calls can’t be exceeded? What happens as the volume of background data network traffic increases, or if a new video streaming application is added?
• Anything extraneous?
You’ve asked the question of whether the system is doing what you want it to do. Now ask whether it’s doing anything you don’t expect. Are there excess or redundant net-work flows, possibly caused by configuration options you didn’t understand? You may need a network protocol analyzer to help in this assessment – take some snapshots of the network before and after VoIP, and see if there are any unexpected flows.
• Reports on problems well?
Activate the VoIP management system, and assure that it’s operating correctly. Baseline its operation for a few days, then purposely cause faults in the system. Are the faults di-agnosed promptly and correctly? Are the faulty components isolated? Do the alerts go to the right network management console? Are any automatic recovery operations per-formed right?
Getting VoIP working well is not about “what to do if it doesn’t work.” You can make it work well the first time. The steps to deploy VoIP successfully are part of classic IT project management: plan thoroughly, evaluate and experiment with the designs and devices you plan to use, then roll out the deployment incrementally, building upon your successes and learning as you proceed.
We’ve described these steps thoroughly in this chapter, with lots of questions and bulleted lists. It may be that there are more tasks here than you are prepared to take on with your current team. The next chapter discusses outsourcing alternatives.
Copyright John Q. Walker and Jeffrey T. Hicks, 2002. All Rights Reserved. 40
References 1. “MERIT Project Results,” IT Resource Survey Results, Computer Associates
International, 1997, www.meritproject.com/it_survey_results.htm.
2. “Getting Ready for Voice over Data,” Hank Lambert, Cisco Systems, VoiceCon 2001, Washington, DC, February 26, 2001.
3. ITU-T Recommendation P.800, “Methods for subjective determination of transmission quality,” www.itu.int/publications/main_publ/itut.html.
4. ITU-T Recommendation P.861, “Objective quality measurement of telephone-band (300-3400 Hz) speech codecs,” www.itu.int/publications/main_publ/itut.html.
5. ITU-T Recommendation G.107, “The E-model, a computational model for use in transmission planning,” www.itu.int/publications/main_publ/itut.html.
6. ITU-T Recommendation G.108, “Application of the E-model: A planning guide,” www.itu.int/publications/main_publ/itut.html.
7. “VoIP voice quality often best,” Tom Lancaster, SearchNetworking.com Networking Tips and Newsletters, December 20, 2001, searchnetworking.techtarget.com/tip/1,289483,sid7_gci783354,00.html.
8. ITU-T Recommendation G.114, “One-way transmission time,” www.itu.int/publications/main_publ/itut.html.
9. Network Time Protocol version 3, RFC 1305, www.ietf.org/rfc/rfc1305.txt.
10. “Assess your network,” Tom Lancaster, SearchNetworking.com Networking Tips and Newsletters, December 6, 2001, searchnetworking.techtarget.com/tip/0,289483,sid7_gci784599,00.html.
11. “Doing a VoIP Assessment with Chariot VoIP Assessor,” Susan Pearsall and John Q. Walker, NetIQ Corporation whitepaper, March 2002, www.netiq.com/products/va/whitepapers.asp.
12. For more information on Chariot VoIP Assessor, see the NetIQ Corporation Web site: www.netiq.com/products/va/.
13. “VoIP in the Enterprise: Preparing your Network,” Tom Lancaster, SearchNetworking.com Networking Tips and Newsletters, January 31, 2002, searchnetworking.techtarget.com/tip/1,289483,sid7_gci801018,00.html.
14. For more information on Chariot, see the NetIQ Corporation Web site: www.netiq.com/products/chr/.
15. “Troubleshooting VoIP echo problems,” Tom Lancaster, SearchNetworking.com Networking Tips and Newsletters, November 29, 2001, searchnetworking.techtarget.com/tip/1,289483,sid7_gci783354,00.html.
16. “Check for full duplex capability,” Tom Lancaster, SearchNetworking.com Networking Tips and Newsletters, December 13, 2001, searchnetworking.techtarget.com/tip/1,289483,sid7_gci785861,00.html.

Copyright John Q. Walker and Jeffrey T. Hicks, 2002. All Rights Reserved. 41
About the Authors John Q. Walker is a director at NetIQ Corporation. He is one of the founders of Ganymede Software, heading the software development team there before it joined NetIQ in spring 2000. In earlier jobs, he managed teams responsible for designing and developing high-speed networking at IBM. Another job stint involved inventing ways to break security on a new computer system, reporting his methods to the development team. He co-authored a book on portable network programming for McGraw-Hill. Dr. Walker holds a Ph.D. in software engineering; his Masters degree focused on system testing.
Jeffrey T. Hicks is a technical lead at NetIQ Corporation. He has recently led the develop-ment teams for the award-winning Chariot and Chariot VoIP Assessor products. He has been active in the development of VoIP testing and management solutions for the past four years. In earlier jobs, he helped develop innovative network communications software products at IBM. Mr. Hicks holds a Masters of Engineering from North Carolina State University and a B.S. in Computer Engineering from Auburn University.