the estimation of recovery and centre-body...
TRANSCRIPT
R. & M. No. 3035(15,406, 16,696)
A.R.C. Technical Report
MINISTRY OF SUPPLY
AERONAUTICAL RESEARCH COUNCIL
REPORTS AND MEMORANDA
The Estimation ofShock Pressure Recovery and
External Drag of Conical Centre-Body
Intakes at Supersonic SpeedsBy
E. L. GOLDSMITH and C. F. GRIGGS
© Crown Copyright 1959
~
!Oz»:s::m
I.... Iv
.......
;::0
!!lc:::0Z
~

Theand
Estimation of Shock Pressure RecoveryExternal Drag of Conical Centre-Body
Intakes at Supersonic SpeedsBy
E. L. GOLDSMITH and C. F. GRIGGS
COMMUNICATED BY THE DIRECTOR GENERAL OF SCIENTIFIC RESEARCH (AIR)MINISTRY OF SUPPLY
Reports and Memoranda No. 3°35*
November J 1953
Summary.-Methods of predicting shock pressure recovery and external drag at all mass flows have been developeclfor conical centre-body intakes at supersonic speeds. Comparison with wind-tunnel measurements shows that themethod for predicting the shock pressure recovery gives the correct variation for the shock losses as the shock configuration changes with mass-flow ratio. Agreement near full mass flow is not so good when the losses other than shocklosses are probably changing rapidly and the shock configuration remains unchanged. Results of drag tests show thatreasonable agreement with theory is obtained for the rise in drag which occurs when the intake is spilling and for thedrag at full mass flow. Curves are included to assist in the calculation of the drag rise and the associated reduction inpressure recovery.
1. Introduction.-It has been shown':" that conical centre-body air intakes fulfil the requirements of high recovery of free-stream total pressure and low external drag over a useful range ofMach number and mass flow.
In the interests of maximum propulsive efficiency it may be necessary to operate a long-rangeram jet at its critical point (full mass flow, near maximum pressure recovery and minimum drag)over the whole of its flight range, in which case some variable-geometry arrangement will have tobe used.
On the other hand, a fixed-geometry guided missile launched at a Mach number of 1·4 or 1· 6and having a maximum Mach number in the region of 2·2 at altitude may be required to operateinitially at 80 to 90 per cent of full mass flow. Thus it is important to develop methods ofestimating drag and pressure recovery under conditions of reduced mass flow.
Methods for estimating these two quantities are presented in this report and the results arecompared with experimental values. Some of the results are taken from experimental workconducted in the Royal Aircraft Establishment 9 in. X 9 in. and the No. 4 S~- in. X st in.Supersonic Tunnels.
Charts have been added at the end of this note by means of which the methods of estimationof pressure recovery and drag can be reduced to simple semi-graphical processes.
2. Estimation of Pressure Recovery.-Typical pressure-recovery-mass-flow curves are shown inFig. 2 for the two conditions (a) ()t < f}zc and (b) ()/ > e,". The notation is given fully at the endof the text and is illustrated in Fig. 1.
* RA.E. Report Aero. 2463, receivecl 24th November, 1952.RA.E. Tech. Note Aero. 2276, received 31st March, 1954.
1

(a) 8f < 8,"
At (A), as shown, part of the entering stream tube passes through the efficient two-shocksystem (conical shock followed by a I second I shock approximately normal to the cone surface)and part solely through the I third I nearly normal shock. The final pressure recovery at the entryto the combustion chamber is a mean value resulting from the mixing of the two streams.At point (B) the maximum pressure recovery is obtained before the full mass-flow condition isreached. In this state the position of the streamline separating the external and internal flowscoincides with the position of the point of intersection of the three-shock system (i.e., r, = r ;(Fig. 60) ) and all the mass flow is entering through the efficient two-shock system. On furtherreducing the back pressure, the critical point (C) is reached. At this point the mass flow hasachieved its maximum value and the pressure recovery has dropped off slightly from its valueat (B). This drop is presumably caused by the curving of the centre body that must occur insidethe cowl for any practical design. Part of the second shock is then occurring at a higher Machnumber and is therefore less efficient.
(h) Of> Ow
For point (A) conditions are identical to case (a) just considered. In the region (B), Yi is stillless than reM and the pressure recovery continues to rise until, finally, the full mass-flow conditionis reached at the critical point (C). The maximum pressure recovery in this condition will thenbe smaller than for case (a), as there is now less isentropic conical compression, the expansion ofthe flow inside the lip will probably have an adverse effect and there is shock-boundary-layerinteraction both on the centre body and on the under surface of the cowl.
Thus in order to estimate the pressure-recovery-mass-flow curve we require to know:(i) the angle of the third shock to the free stream
(ii) the variation of r, with mass flow for r, ~ ro:
(iii) the position of the second shock along the centre body (this can be found approximatelyfrom condition (ii) when r, < r co)
(iv) the mixing and internal and external boundary-layer losses associated with the internalflow.
At the intersection of three shocks with resultant subsonic flow the system is defined and theangle of the third shock can be found (see Appendix I). The variation of r, with mass flow forr, ,--- r ; has been derived by extending the work of W. E. Moeckel" for detached shocks as inAppendix II and the method of estimating the drop in pressure recovery from (B) to (C) ispresented in Appendix III.
The residual losses (i.e., those other than the shock losses) are the subsonic diffusion losses.They result from the effects of skin friction and mixing in the subsonic diffuser and are probablyconsiderably influenced hy the shock-boundary-layer interaction on the cone surface just infront of the duct entry. These losses will vary with mass flow and with Reynolds number andno attempt has heen made to calculate or measure them.
~~. The Estimation of External Drag.- <1.1. External Drag when Spilling.-As is usual forintake work at the R.A.E., we define the external drag coefficient (excluding skin friction) atany mass flow as CD cxt ,:-- C[) cowl CD pre-entry'
Now since we know the position of the external shock system (Appendices II and III) relativeto the inlet, it should be possible to sum the external pressures acting on the stream-tube boundaryAC (some weighted mean between the static pressure at B and the stagnation pressure at C wouldhave to he used for the portion BC (Fig. 1) ) to give the pre-entry drag C[) pre' At the same timeas ej) pIC is increasing the pressures acting on the external surface of the cowl are decreasing.I t is, however, difficult to predict the decrease in CD cowl when spilling, because the subsonic flowat the lip rapidly expands to supersonic velocities, and separation regions followed by shockson the cowl result.
2

We therefore apply the method developed for Pitot intakes'. This cannot be justified in thesame way, but nevertheless the cases can be considered analogous. When r;» r -r. we split thespillage drag into two parts. Along AB the external pressures can be summed from a knowledgeof conical flow to obtain e pre i - For J3C we take the drag due to spillage as the product of theprojected area ABc and the relative static pressure behind the 'second' shock. Whenr, < r : eD pre 1 is zero, and the spillage drag becomes the product of the' spillage area' .4.4(;
and the relative static pressure behind the' third' shock, i.e., for r, > r if':
(PA+ PB _ P )A2 o: AB --L (Pw 2 - Poo)A Bc
( ]) ext == eD cowl 0 + A I Aq'XC max qw max
where eD cowl 0 = cowl drag at full mass flow.
For r < r: :
C]) ext == CD cowl 0(Pw:l - Poc)A rl C
q00 Am ax
This then gives a non-linear characteristic for the drag rise, the slope changing discontinuouslyat the mass flow where r, = roo.
3.2. e07.£)1 Drag at Full Mass FI07v.-There are two linear theories'>" by which the drag at fullmass flow of a Pitot intake (or what is equivalent, a centre-body intake with the nose shock insidethe cowl lip) can be calculated. One is a slender-body theory (which assumes the radius of thecowl at any point to be small compared with the overall length) and the other is a quasi-cylindertheory (which assumes the radius to be nearly constant). Neither theory is strictly applicableto the models used here but it has been shown' that results from the two theories agree remarkablywell for bodies which are neither particularly slender nor good approximations to cylinders. Themethod used here has been to calculate the pressure coefficient at points on the cowl by quasicylinder theory and then to integrate them numerically. In Appendix IV the details of thisprocess are given extended to the case when the cone shock is outside the cowl lip so that it canno longer be treated exactly as a simple Pitot.
3.3. Lip Drag.--In addition to the cowl and pre-entry drag at full mass flow there is probablyan appreciable lip drag owing to the finite thickness of the rim of the model cowls. This is illustrated in Fig. 3 which shows the drag for a lip radius of 0·0053 in. (rlip/ren = 0,0053) calculatedfrom the results of a limited experimental investigation by Fraenkel" of the lip drag of Pitotintakes.
The use of Fraenkel's empirical relationship (derived from tests at Mach numbers of 1·4 and1,8) at Mach numbers up to 3·3 probably requires further experimental justification.
3.4. Pre-Entry Drag at Full M ass FloU'.-Pre-entry drag can be calculated exactly by use ofthe conical flow tables of Ref. 9. This has been done for a range of cone and lip position anglesand the collected results are given in Ref. 10.
4. Models.-The experimental work was planned with two main objectives:(d) To collect pressure-recovery and drag data from models having variations of cane
angle (}n lip-position angle ()/ and cowl shape, so as to obtain comparisons betweenexperimental and predicted results over as wide a range of conditions as possible.
(b) To obtain drag data for models which have realistic values for the ratioA entry/A combustion chamber' This entails the use of a rather larger tunnel than has hitherto
3

been used for intake work (5~ in. X 5~ in.). Some drag tests have been done thereforein the RA.E. 9 in. X 9 in. Supersonic Tunnel over the Mach number range 1·5 to 1·9.
It is convenient to discuss the models under the headings of the two tunnels in which theywere tested.
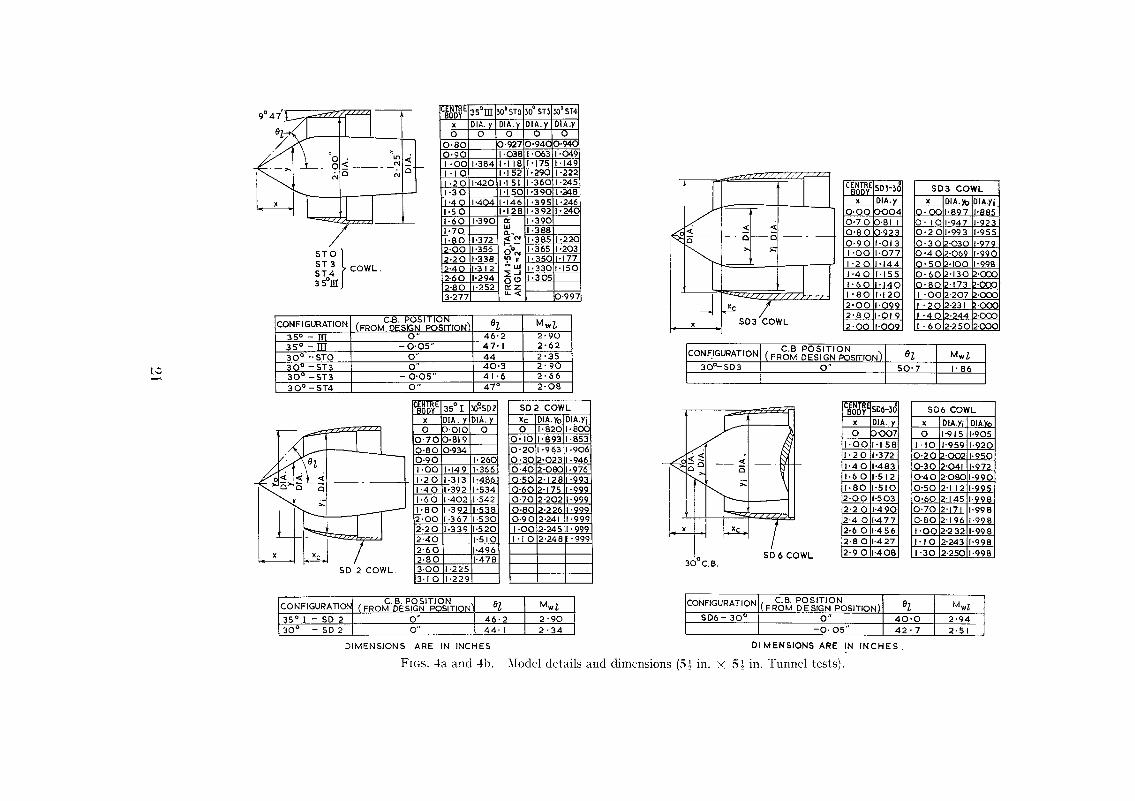
4.1. 5-~ in. X 5l in. Tunnel Models.-Variations of cowl shape and lip-position angle havebeen investigated by testing models STO, ST3, ST4, SD2, SD3 and SD6 (Figs. 4a and 4b). Thefirst three models have the same cone angle (Oc = 30 deg) and cowl, and have lip-position anglessuch as the cone shock falls on the cowl rim (Ow = 0,) at Mach numbers of 2,08, 2,35, and 2·90respectively. The three curved cowl models also have the same cone angle (Oc = 30 deg) andhave the cone shock on the rim at Mach numbers of 2·35 (SD2), 1·86 (SD3) and 2·9 (SD6).It is desirable that the second shock should be attached to the cowl rim at full mass flow. Thisis not possible for the ST models owing to the large turning angle demanded at the entry (fromangles corresponding to supersonic flow around a 30 deg cone to horizontal inside the cowl) hutcowls SD2 and SD3 are designed for an attached second shock at 1·86 and cowl SD6 for anattached shock at 2· 14.
To obtain more variation of AI"" some of the models were tested with their centre bodiesmoved either fore or aft relative to the cowl (away from their design position). In these casesthe model has been specified by a designation such as ST3 (-- 0·05 in.) or SD6 (- 0·05 in.) etc.,which indicates that the centre body has been moved back 0·05 in. relative to the cowl.
Some models with a 35-deg cone semi-angle have also been tested in combination with thecowls originally designed for the ~10-deg conical centre bodies. The 35-deg centre body coordinates are also given in Fig. 4.
4.2. 9 in. X 9 in. Tunnel M odels.-These models (Figs. 5 and 6) are based on designs whosedrag characteristics at full mass flow were investigated theoretically in Ref. 11. The investigations led to the conclusion that the optimum cone angle for maximum net thrust (gross thrustminus external drag) was probably considerably below 30 deg. It may be noted that since themodels were made, attention has been re-directed to cone angles in the region of 30 deg becauseof unstable flow conditions which are obtained at very small amounts of spillage with the smallercone angles.
As mentioned earlier, these models have realistic values of AentryjAcombustion chamber- In otherwords, for the Mach number range considered (1 ·5 to 2·0 for 0c =: 15 deg and 22· 5 deg and 1·6to 2·4 for 0c -: 30 deg), the designs will run as ram jets near critical flow conditions with maximum heat input.
The models were designed to be fitted with two alternative rear cowlings (Fig. 6), thus enablingthe ratio AentryjA max to be changed. By testing both the arrangements, it was hoped to provethat the drag rise when spilling was not seriously affected by such a change and, therefore, thatresults which perforce had to be obtained with the parallel rear cowl because of reflected shockdifficulties, could also be applied to the tapered-cowl models with only minor errors.
5. Apparatus and Experimental Procedurc.--5.l. Pressure Recovery Aleasurements.-Thcmodel was screwed to a fixed sting and the exit area was controlled by a sliding cone which couldbe operated while the tunnel was running (Fig. 7). Three rakes of five Pitots each projectedthrough the cone to measure the total pressure at the end of the subsonic diffuser. The apparatus(with nine Pitots instead of fifteen) is described and illustrated more fully in Ref. 11.
Measurements of total head before and after diffusion were made at zero incidence at Machnumbers of 1·86, 2,14, 2·48, 2·90 and 3·27 in the 5~ in. X 5§ in. Tunnel and at Mach numbersof 1,51, 1·62, 1·81 and 1·91 in the 9 in. X 9 in. Tunnel for various values of model exit areacovering the subcritical and supercritical regimes of flow.
4
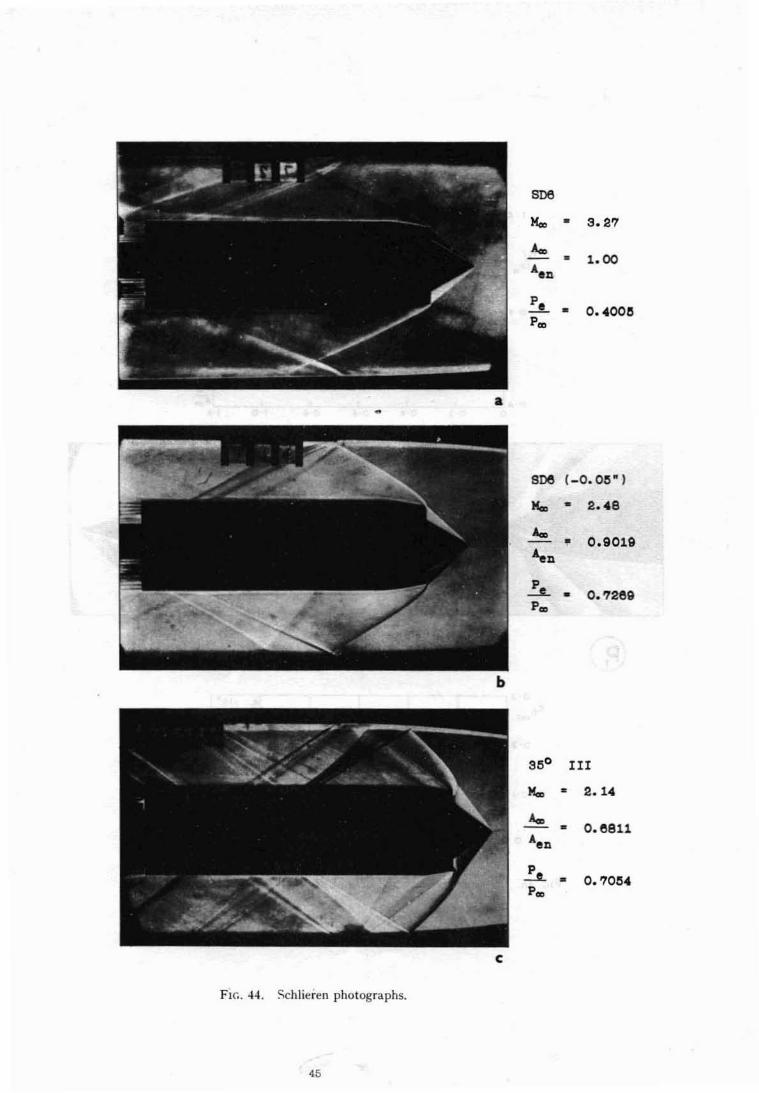
Schlieren photographs of the shock-configuration were taken and those with the inlet at fullmass flow are presented.
5.2. Drag Measurements.-The method of obtaining external diffuser drag was to measurethe total drag force on the model with a strain-gauge drag balance, and then the internal drag,base drag, sting force* and calculated skin-friction drag were subtracted.
The strain-gauge balance is shown in Figs. 8 and 9. It was found desirable when operatingthe balance in the tunnel to keep the temperature approximately constant, wind off and wind on.To ensure this a thermo-couple (copper-constantan junction) was installed.
Three rakes of seven Pitots each, spaced at 120-deg intervals, spanned the rear of the model.The inner tubes measured the pressure recovery of the internal flow and the outer tubes measuredthe base pressure.
The force acting on the rear of the support sting was determined by measuring the pressurein the balance housing.
All the tests were made at atmospheric stagnation pressure. The balance was calibrated heforeand after every run, the temperature in the balance housing being kept approximately constantthroughout the running and calibrating period.
The flow was observed with a two-mirror schlieren system and some of the photographs takenare presented.
(a) Internal drag.-The internal drag coefficient is defined by:
CD int =
and can be calculated from the measurement of mean total pressure recovery at the exit. It isassumed the pressure ratio across the exit is such that it is always choked. Details of the calculation are given in Ref. 3.
(b) Base drag.-As in some cases the reflected shock strikes the wake from the rear of themodel at a position very near to the base, it was necesssry to check the base pressure (as recordedby the base Pitot-tubes) by making separate runs with base plugs containing static pressureholes. This check revealed errors of appreciable magnitude at some mass flows. However, byensuring that the ends of all the tuhes were in one plane and by reducing the gap between thebase and the ends of the tubes to a minimum, reasonable agreement was eventually obtained.
(c) Skin-friction drag.-The external skin-friction drag has been calculated using values forskin-friction coefficient C, for laminar and turbulent flow given in Ref. 12. As skin-friction dragis between a third and a half of the total drag at full mass flow and the ratio CfIaminar/Cjturbulent
is approximately one third, the percentage accuracy of the result would be considerably affectedby whether fully laminar or turbulent flow was assumed. To determine the state of the boundarylayer over the models, some transition points were observed using a chemical indicator. Fromthese tests it was apparent that at full mass flow the boundary layer was laminar over the wholemodel except for wedges of turbulence emanating from small dents in the cowl rim and from theheads of three sets of screws joining the centre body to the cowl. In the calculations a value of C,intermediate between the laminar and turbulent values (appropriate to the approximate amountsof laminar and turbulent flow) has been taken.
At reduced mass flow it was found that, in general, the boundary layer became turbulent justdownstream of the cowl rim (presumably due to the presence of the' over-expansion' shock onthe cowl). Hence in the calculations the boundary layer has been taken as fully turbulent at allmass flows below the maximum.
* From the action of the internal balance pressure on the rear end of the sting.
5

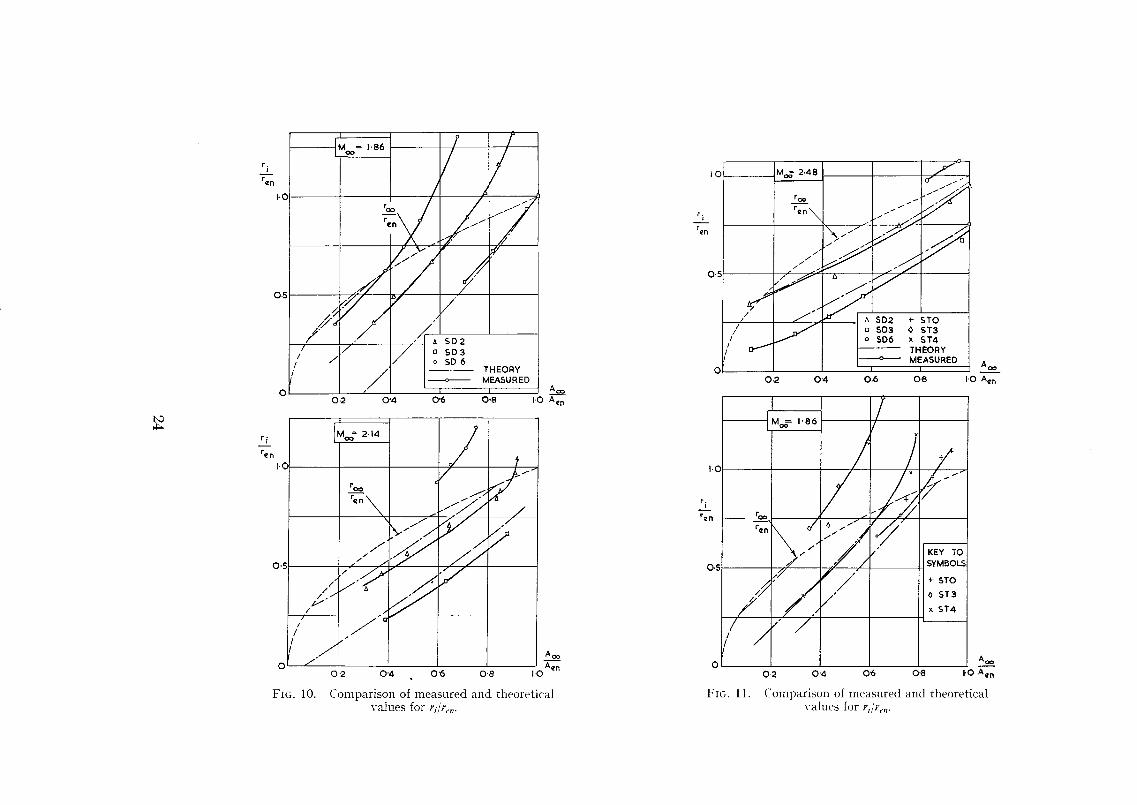
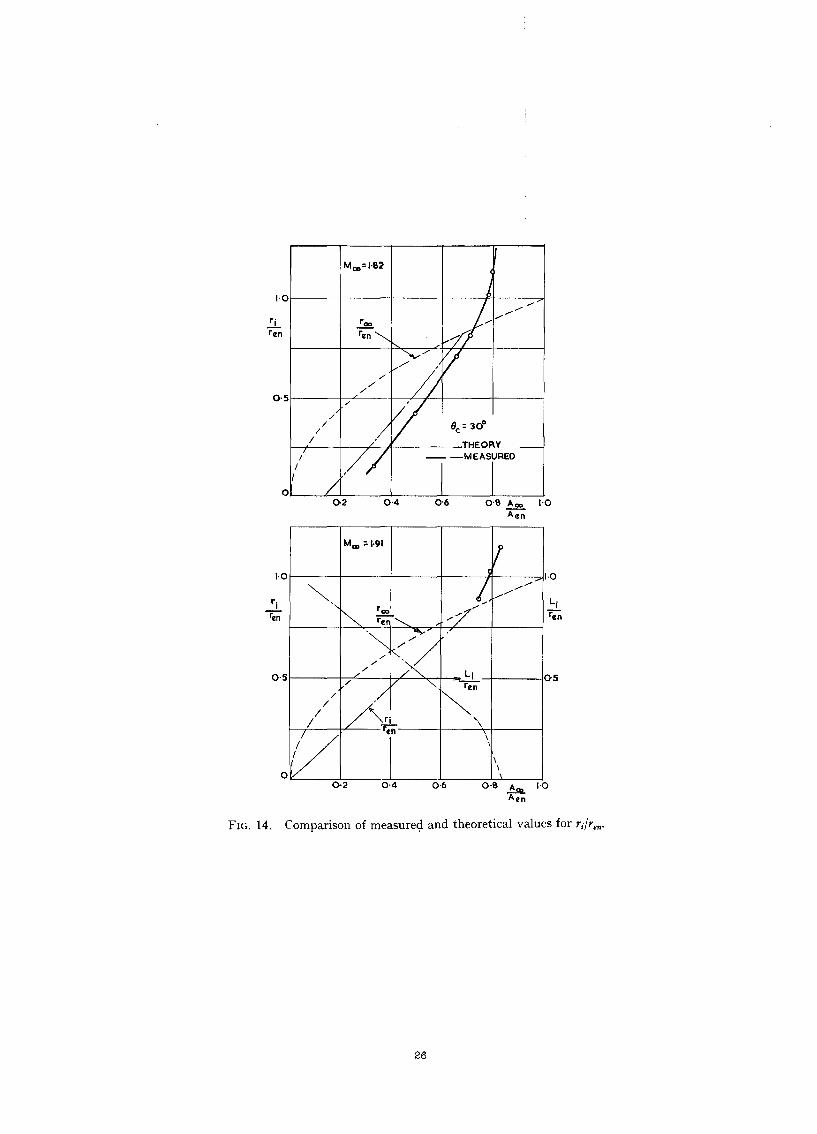
6. Discussion of Rcsults.--6.1. Pressure Rec01lery.-As has been seen (section 2) the mainvariation of pressure recovery with mass flow (the decrease with decreasing mass flow in the subcritical flow condition) is effected by the variationof r, (the radius of the three-shock intersectionpoint) with respect to the position of the streamline dividing the internal and external flows, r;..A comparison of values of r.ir., measured off Schlieren photographs with values calculated fromequation (19), Appendix II, is shown in Figs. 10 to 14. The theoretical results can be calculatedonly when ri < r, .
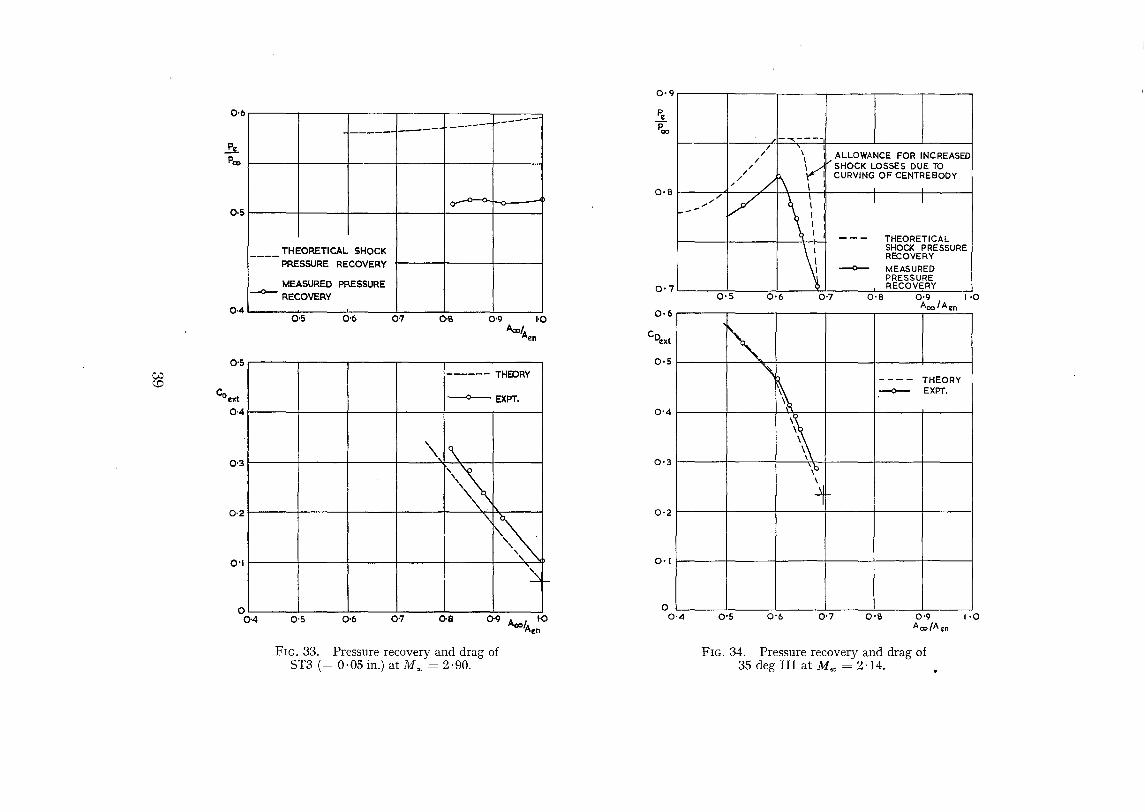
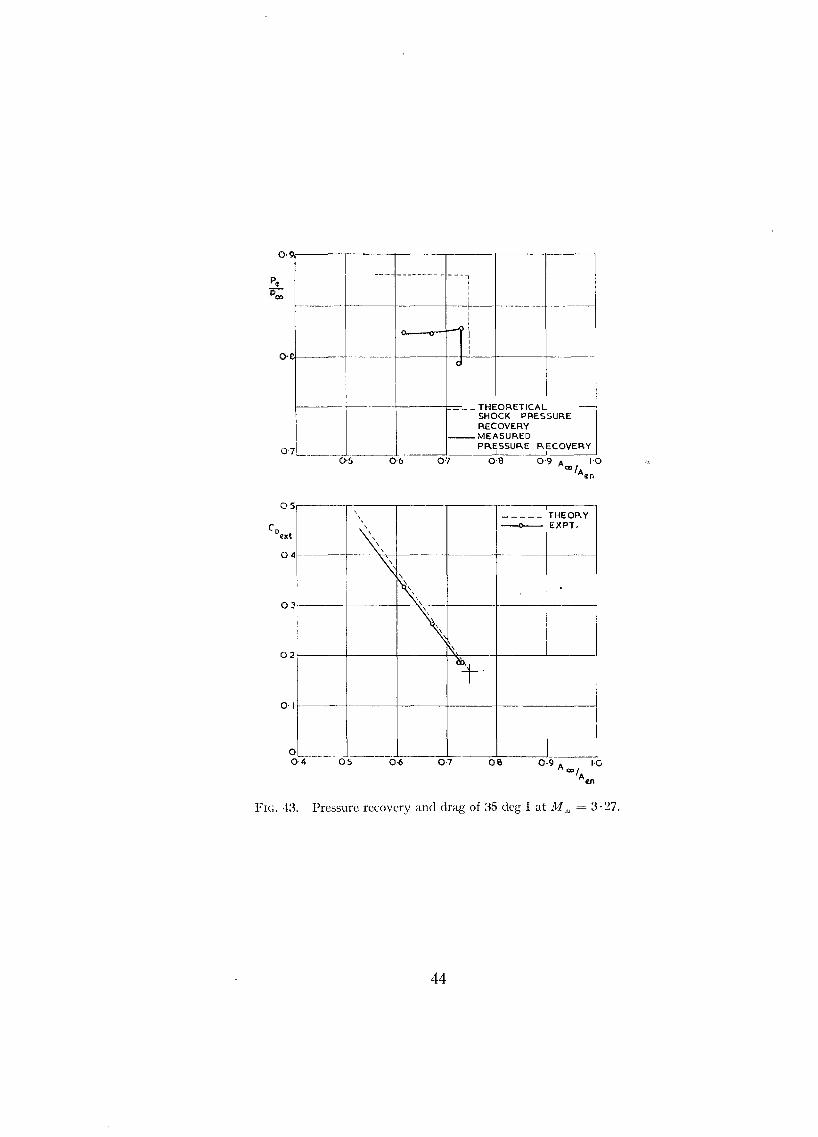
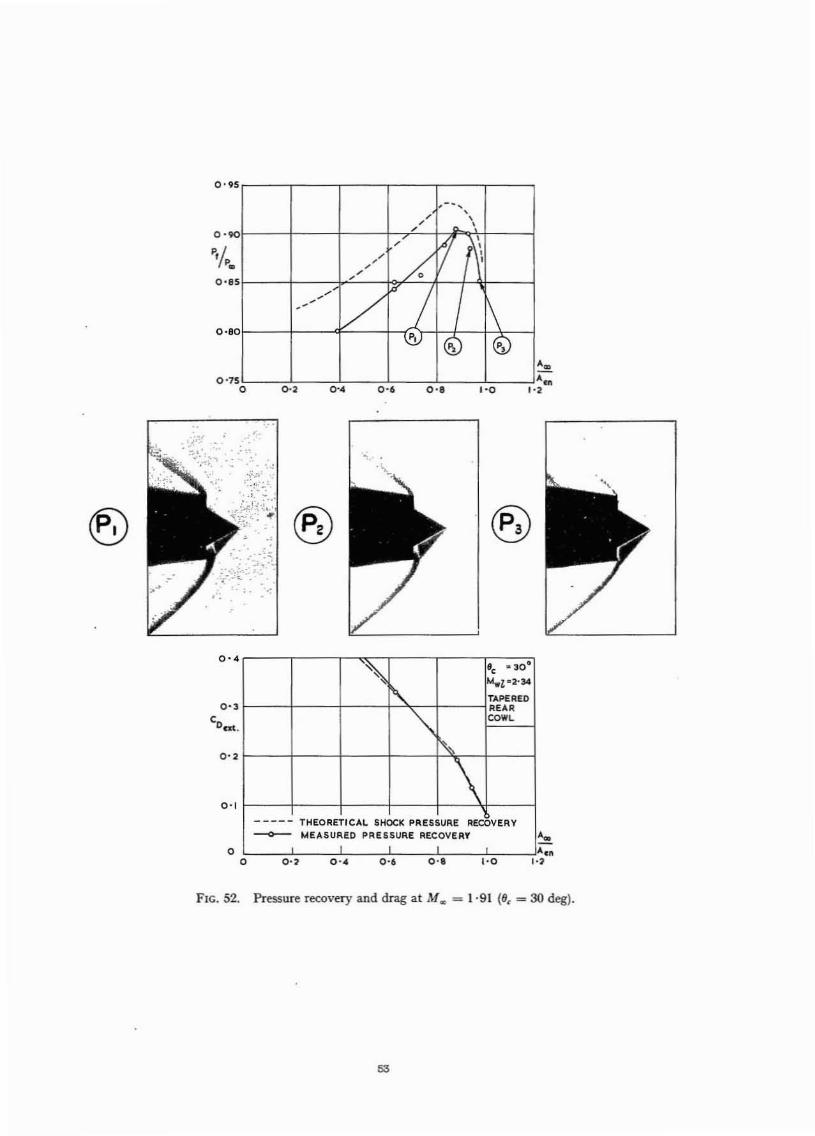
The comparison between estimated and experimental variation of pressure recovery with massflow in the two sets of tests are shown in Figs. IS to 43 and Figs. 45 to 52. The theoretical curvesare calculated from equation (22), Appendix II, and therefore they do not include any allowancefor the subsonic diffusion losses. As can be seen, the mass flow at which the pressure recoveryhegins to fall off (i.e., when r, = r.,) and the initial slope of the curve are predicted reasonablywell by the theory. As mass flow is reduced (and more of the subsonic diffusion is accomplishedin front of the duct entry), it is to be expected that the subsonic diffusion loss will be decreasedand hence the predicted and experimental curves should converge. This can be seen in somecases (Figs. 16, 46 and 51). In other cases, however, the opposite is true. This is probablyexplained hy an overriding effect of the gradual divergence of measured and calculated r, asshown in Figs. 12,13 and 14.
When r, is greater than r; the theory (Appendix III) gives the pressure recovery as beingsolely a function of the position of the second shock on the centre body and the slope of thecentre body at this position. Thus it is to be expected that agreement between the predicted andactual fall-off in pressure recovery near full mass flow will be best if, at the position of the secondshock on the centre body, the slope of the surface is near to the original cone angle (i.e., so thatthe amount of assumed two-dimensional expansion is small).
Studies of the flow at the corner such as is shown in Fig. 53 suggest that the shock loss andviscous effects cannot be separated in the manner suggested in Appendix III. In actual fact theboundary layer usually breaks away from the centre-body surface in the vicinity of the cornerand the flow does not approximate to the expansion-shock process outlined in the Appendix.The increased loss experienced near to full mass flow is then largely the result of the subsonicmixing that occurs behind the separation resulting from the shock-boundary-layer interaction.Thus the agreement achieved is not particularly good in many cases (Figs. 26, 32 and 34).
When On is smaller than 0/ and the cone shock can be reflected regularly inside the cowl atfull mass flow, the problem of predicting pressure recovery in this condition becomes more difficult.No satisfactory method has been evolved and therefore for model SD3 at J.11 co = 1,86,2·14 and2·4R and for model SD2 at M u cc= 2·48 it has been assumed that the cone shock is not reflected,so that a Mach reflection is formed at the cowl lip just as for the ST series of cowls at full massflow.
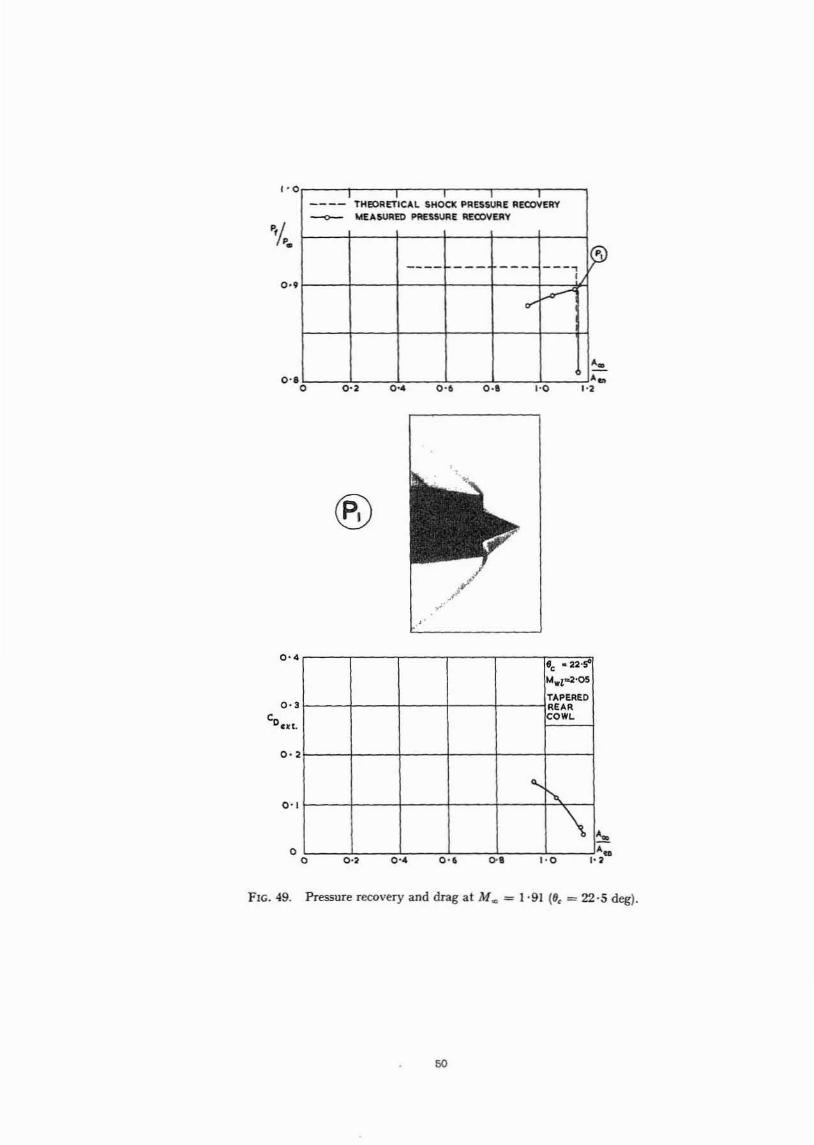
For models 5D6 and ST3 at 111 /J :ccc: 2· 14 and 2·48 and for the 0c = 15-deg model at jVI 00 = 1· 51,r, is greater than r, at all mass flows (Figs. 10 to 12), and so theoretically the pressure recoveryremains constant. For the Or ccc 22·5-deg drag model at J.11c-: 1·91 a three-shock system cannotform (Fig. 57) and therefore the drop-off in pressure recovery cannot be predicted by the theory.
6.2. External Drag. --The results are shown in Figs. 21 to 43 and 45 to 52. Theoretical dragsat full mass flow (cowl drag calculated by the method of Appendix IV,pre-entry drag from Ref. 10and cowl-lip drag by the method of Ref. 8) in general compare well with the measured results.Where discrepancies do occur they are probably due to:
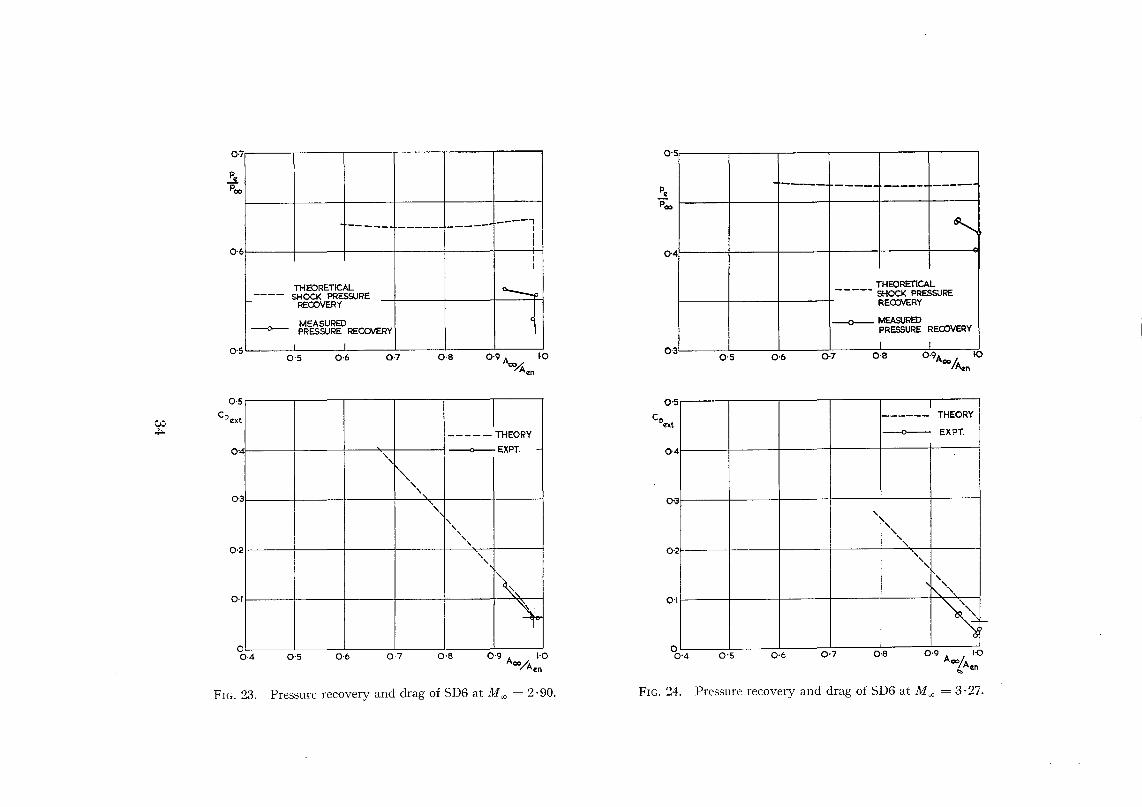
(a) Uncertainties in external mean-skin-friction drag coefficient due to separation of theexternal boundary layer under the influence of the reflected nose shock (Fig. 44a). Thisprobably accounts for the low drags measured for SD6 at full mass flow at M If. = 3· 27(Fig. 24)
(0) The existence of detached shocks at the cowl lip at full mass flow.
6
These can occur for either of two reasons:(i) Because the angle through which the entering flow is required to turn is larger than the
maximum deflection angle for shocks at the cone flow Mach number(ii) Choking of the internal duct due to excessive internal contraction. This condition may
be aggravated due to boundary-layer breakaway at the shoulder of the centre body.For the ST3 (- O·05 in.) and 35-deg III models the mass flow never reaches its theoretical maximum value at the lower Mach numbers due to choking at the minimum areasection of the internal duct and due to the consequent detached shock at the cowl lipat full mass flow the drag is higher than predicted (Figs. 31 and 32 and 34 to 40). Thevariation of the maximum mass flow with Mach number for the 35-deg III model israther haphazard and may be due to changing breakaway conditions at the duct throat(Figs. 34 to 37).
The slope of the drag versus mass-flow curve seems to be reasonably well predicted by themethods given in Appendix V. The mass flow at which the vortex sheet from the three-shockintersection point impinges upon the cowl lip (i.e., when r, = roo) also seems to be well predictedexcept for SD6 (- O·05 in.) at Moo = 2· 48 (Fig. 26). This is a case where r, is very nearly equalto roo over a large range of mass flow (Fig. 54). Hence any small error in the prediction of r,results in a large error in the estimation of the intersection points of the two curves.
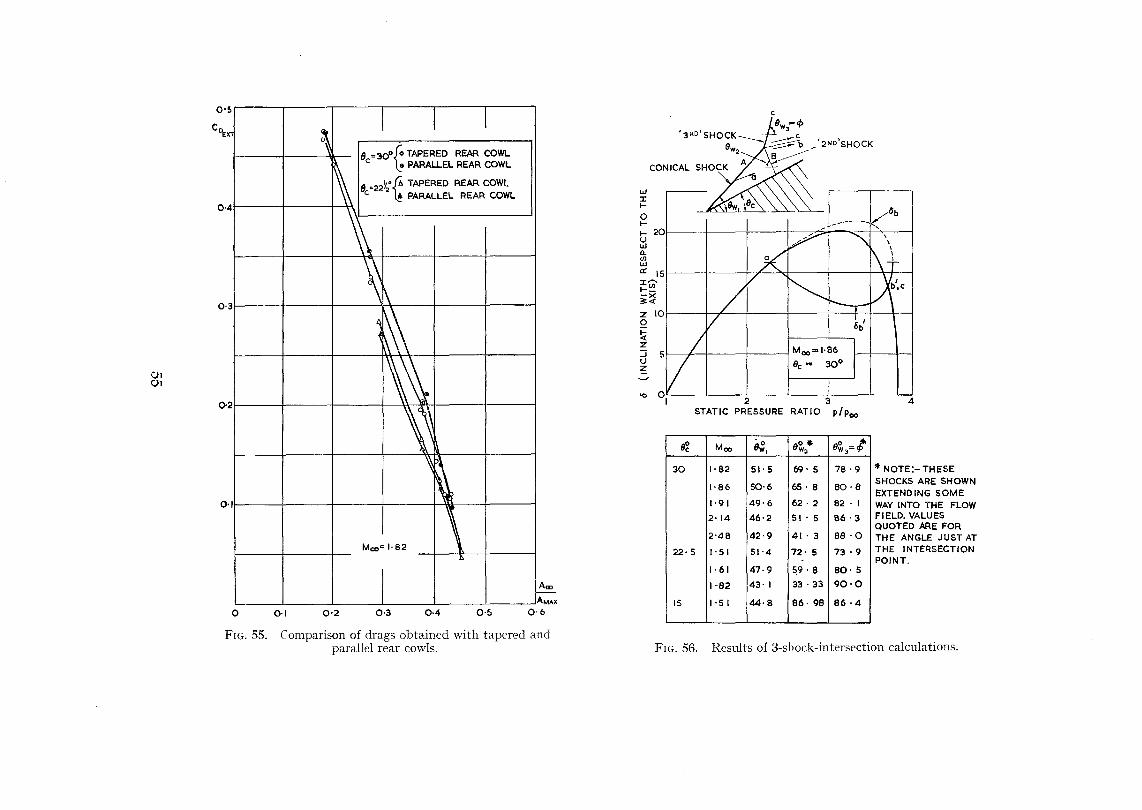
Fig. 55 shows a comparison of drag measurements obtained at Moo = 1·82 with tapered andparallel rear cowls for ec = 30 deg and 22· 5 deg. As can be seen, the difference in drag betweenthe two configurations at all mass flows is small. No conclusion can be drawn as to the relativerates of drag rise as the scatter of the results on repeat tests (± 0·005 of CD ext) is roughly of thesame order as the change in drag due to the change in model geometry.
7. Conclusions.-(a) The method (due to W. E. Moeckel) for predicting the position of thedetached shock wave in front of a Pitot intake can be extended to the case of the conical centrebody intake and thus reasonable results for the fall-off in pressure recovery at reduced mass flowcan be obtained.
(b) A crude but simple method (to take into account the curving of the centre body) forpredicting the pressure recovery near full mass flow gives fair results for most practical designs.
(c) A method for predicting the rise in drag at reduced mass flow analogous to that developedin Ref. 3 for Pitot intakes gives quite good agreement with experimental results.
(d) The cowl drag of centre-body intakes at full mass flow can be satisfactorily predicted bylinearised theory as developed for quasi-cylinders in Ref. 6.
7
A
B
('J) cowl
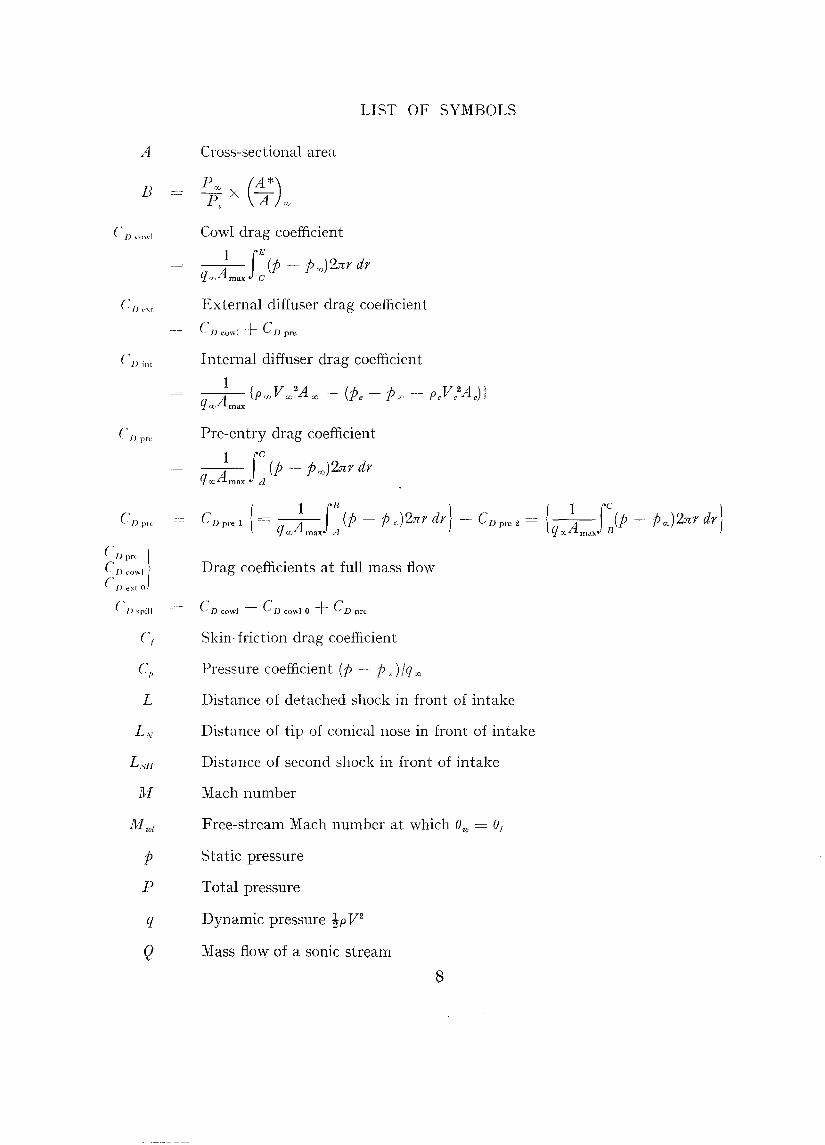
LIST OF SYMBOLS
Cross-sectional area
Cowl drag coefficient
1 JE (P - poo)2nr drq""Am ax C
External diffuser drag coefficient
CJ) cowl + CD pre
(']) iut Internal diffuser drag coefficient
Pre-entry drag coefficient
1 fC4. (P - poo)2nr drqOOoL max. A
(:j) 1)1(:
L
t.,
1\;[
M Wf
Pp
q
Q
f __ 1 IB 1, __ I 1 Ie: \CDprell- A (P-Pxc)2nrdrf+CDPre2-\ A (p-p"J2nrdrJ
~ qOJ max A ~ q -s: max B
Drag coefficients at full mass flow
CD cowl - CD cowl 0 + CD pre
Skin-friction drag coefficient
Pressure coefficient (P - PJlqoo
Distance of detached shock in front of intake
Distance of tip of conical nose in front of intake
Distance of second shock in front of intake
Mach number
Free-stream Mach number at which Ow = Of
Static pressure
Total pressure
Dynamic pressure tpV 2
Mass flow of a sonic stream
8

LIST OF SYMBOLS-continued
r Radial co-ordinate
T Total temperature
V Velocity
x, s Axial co-ordinates
Mach angle sin -1~
fJ
()
p
ep
()c
( )e
( i,
( )f
( ) i
( )1
( ) 00
( )* ( L
( i,
( ) 0
cot Cf. = V (M2 - 1)
t -1 1 - (ri max/ri )an i.:»:Inclination of the sonic line
Angle with respect to the diffuser axis of a line through the cone vertex
Inclination of a streamline to the free-stream direction
dr/ds
Density
Inclination of the' third' shock to the free-stream direction
On the cone surface
At the exit
At the entry
At the final section of the subsonic diffuser
At the three-shock intersection point
At the cowl lip
In the free stream
Sonic conditions
Mean value
Co-ordinates of the vertex of the hyperbola
9

REFERENCES
6 G. N. \Varcl
-1 L. E. Fraenkel
S M. J. Lighthill
11 L. E. Fraenkel and E. L. Goldsmith
Title, etc.
Theoretical and experimental analysis of low-drag supersonic inlets havinga circular cross-section and a central body at Mach numbers of 3 '30, 2·75and 2·45. N.A.C.A. Report 1189. 1954.
The performance of some centre body diffusers at supersonic speeds. R,A.E.Report Aero. 2372. A.RC. 13,540.
Approximate method for predicting form and location of detached shockwaves ahead of plane or axially symmetric bodies. ~.A.C.A. Tech.Note 1921.
The external drag of some Pitot-type intakes at supersonic speeds. Part 1.RAE. Report Aero. 2380. A.RC. 13,537. June, 1950.
Supersonic flow past bodies of revolution the slope of whose meridiansection is discontinuous. Quart. j. Mech. ApP. Math. Vol. I, Part 1.March, 1948.
The approximate external and internal flow past a quasi-cylindrical tubemoving at supersonic speeds. Quart. j. M echo A pp. M alit. Vol. I, Part 2.June, 1948.
The theoretical wave drag of some bodies of revolution. R. & M. 28-12.May, 1951. .
The external drag of some Pitot-type intakes at supersonic speeds. Part 1IRA.E. Report Aero. 2422. A.RC. 14,289. June, 1951.
Tables of supersonic flow around cones. :;\UT Tech. Report 1'\0. 1.
Some curves for calculation of the performance of conical centre-bodyintakes at supersonic speeds and maximum mass flow. c.P. 108.December, 1951.
A preliminary investigation of the performance of conical supersonicdiffusers. RA.E. Tech Note Aero. 200. A.RC. 12,582. June, 19·19.
The measurement of heat transfer and skin friction at supersonic speeds.Part II. c.r. 64. December, 1949.
Author
A. Ferri and L. M. Nucci
2 E. L. Goldsmith, L. E. Fraenkeland C. F. Griggs
:~ W. E. Moeckel
7 L E. Fracnkr-l
H L. E. Fracnkol
9 Z. Kopal ..10 L. E. Fraenkel
12 R J. Monaghan and J. E. Johnson
No.
10

APPENDIX I
Calculation of the Conditions at the Intersection Pointof Three Shocks 'lC'iht Resultant Subsonic Flow
For the intersection of three shocks at a point to be possible the flow behind the single thirdshock and the flow behind the two shocks must both have the same static pressure and direction.
The graph of stream direction (J versus static-pressure ratio, P!P", , is drawn for the flow behindoblique shock waves occurring at the free-stream Mach number (Fig. 56 is a typical example fora 30-deg cone semi-angle at M co = 1·86). The point a is defined by the conical shock and formsthe origin for the second graph shown superimposed for oblique shocks occurring in the flowimmediately behind the conical shock. The intersection point b', c of these two graphs givesthe static-pressure and flow-direction conditions downstream of the shocks necessary for thesystem to exist.
It is found that for small cone angles at high free-stream Mach numbers, the intersectionpoint b', c can give negative values for the deflection of the free stream through the third shock.It seems unlikely that this is a physically possible three-shock system. Photographs taken ofthese configurations show that a four-shock system forms in these cases, the additional shockcoming from a boundary-layer thickening, occurring between the first and second shocks (Fig. 57).Such a four-shock system with resultant subsonic flow is not uniquely determined as is the threeshock arrangement, and hence when these conditions obtain no attempt has been made tocalculate pressure recovery or drag rise. A graph can be plotted (Fig. 58) of cone angle againstlimiting Mach number Allim above which a three-shock system is no longer possible (i.e., 1kflim
is the Mach number at which (Jw 3 = 90 deg and 0b',c = 0).
APPENDIX II
The Method of Estimating the Position of the Detached Shock Wave inFront of Pitot and Centre-Body Intakes at Any Mass Flow
The method derived by Moeckel" for calculating the position of the detached shock in front ofa Pitot entry for any given mass flow below the maximum value, has been applied to conicalcentre-body inlets for mass flows such that the entering stream-tube radius r w is greater than theradius of the three-shock intersection point rio
It is convenient to reproduce here the method as given for Pitot intakes. The modificationsnecessary when applying the method to centre-body inlets can then be more clearly presented.
(a) Pitot Entry.-It is assumed that the detached wave is of hyperbolic form asymptotic tothe free-stream Mach angle, and the intersection of the stagnation streamline (which separatesthe interior from the exterior flow) with the detached shock is assumed to be the vertex of thehyperbola (Fig. 59). It is further assumed that the sonic body point Sen is located at the lip ofthe cowl and that the sonic line SSen is straight. A continuity relationship can then be established to locate the hyperbola axially with respect to the inlet.
11
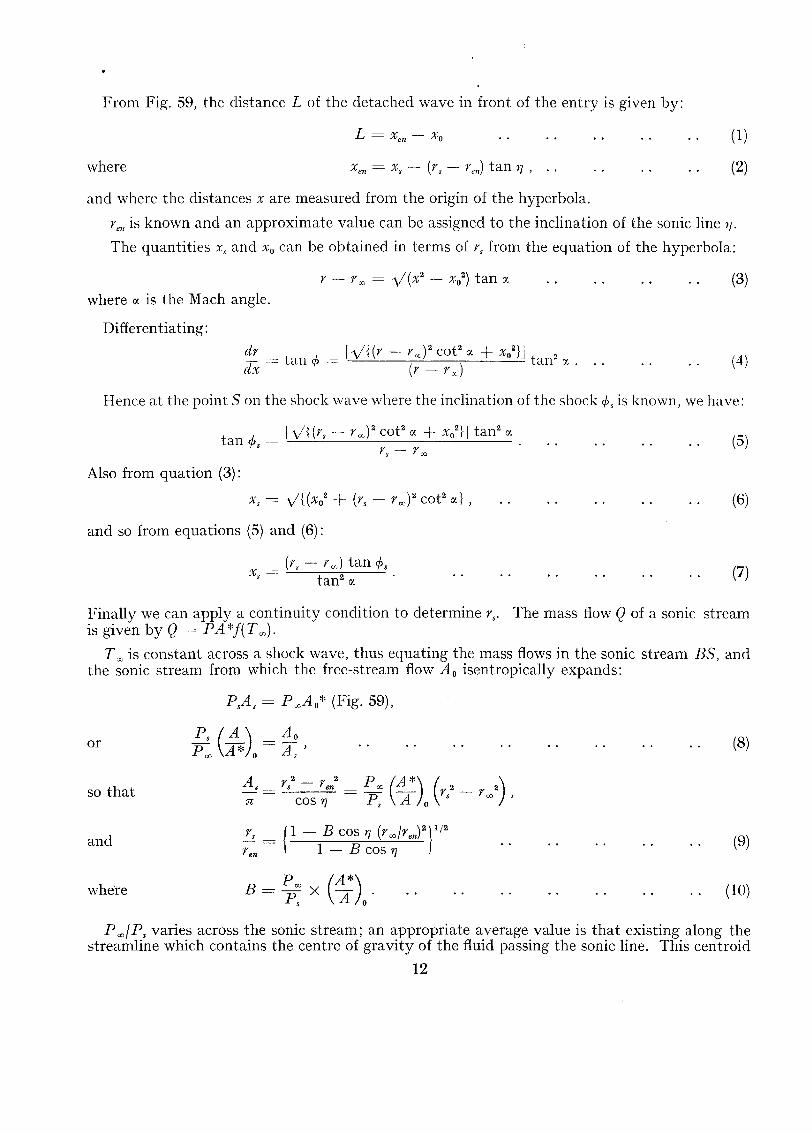
From Fig. 59, the distance L of the detached wave in front of the entry is given by:
where
(1)
(2)
and where the distances x are measured from the origin of the hyperbola.
r en is known and an approximate value can be assigned to the inclination of the sonic line 1].
The quantities X s and Xo can be obtained in terms of rs from the equation of the hyperbola:
(3)where IX is the Mach angle.
Differentiating:
(4)
Hence at the point S on the shock wave where the inclination of the shock cPs is known, we have:
tan cPs = h/{ (rs - raY cot2IX + X0
2}J tan2IX •
r s - roo
Also from quation (3):
and so from equations (5) and (6):
(rs - rae) tan cPsXs = tan" IX
(5)
(6)
(7)
Finally we can apply a continuity condition to determine r; The mass flow Q of a sonic streamis given by Q = PA *f(T(0)'
Too is constant across a shock wave, thus equating the mass flows in the sonic stream BS, andthe sonic stream from which the free-stream flow A o isentropically expands:
PsAs = P ",A o* (Fig. 59),
or
so that
and
where
As= rs2
- r en2
= P oo (A*) (rs2 _ r (02) ,n cos r; P, A 0
rs = {1 - B cos 1] (r00Iren)2}1/2
r en 1 - B cos r;
P (A*)B = p7 x A o·
(8)
(9)
(10)
P oolP. varies across the sonic stream; an appropriate average value is that existing along thestreamline which contains the centre of gravity of the fluid passing the sonic line. This centroid
12
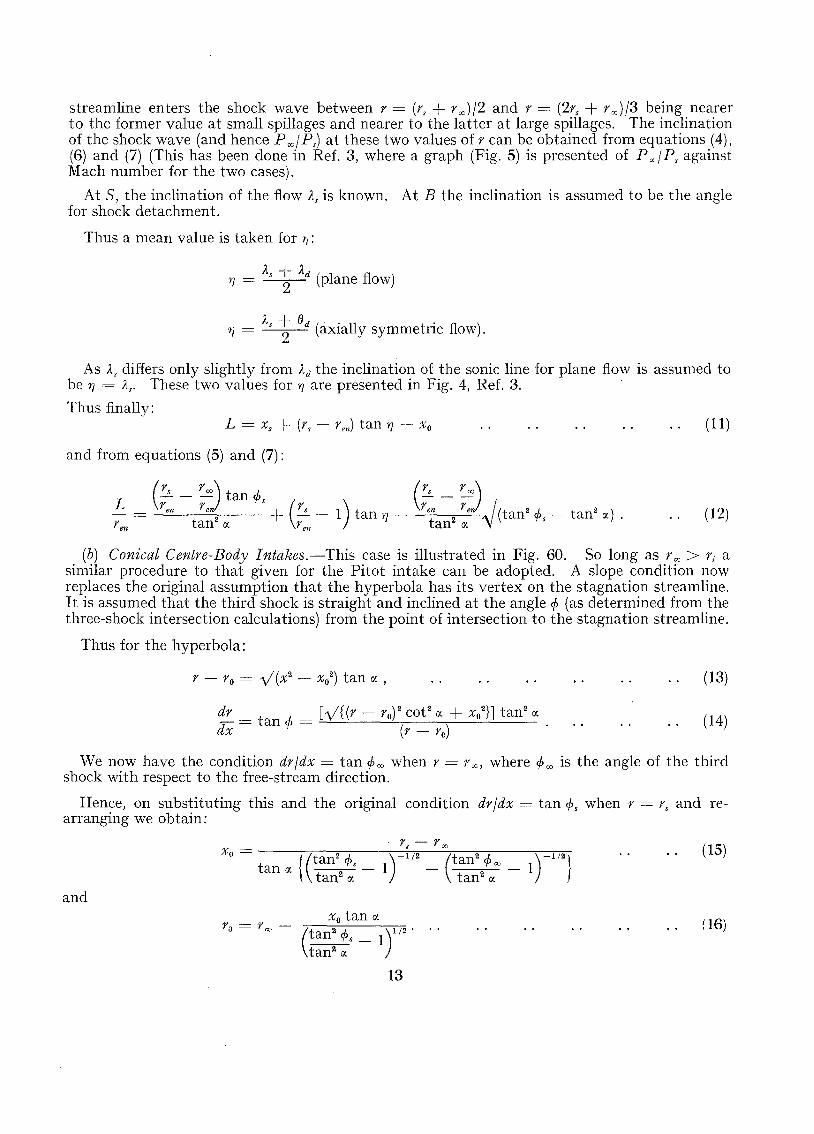
(11)
streamline enters the shock wave between r = ir, + rco)/2 and r = (2rs + rocJ/3 being nearerto the former value at small spillages and nearer to the latter at large spillages. The inclinationof the shock wave (and hence P colPs) at these two values of r can be obtained from equations (4),(6) and (7) (This has been done in Ref. 3, where a graph (Fig. 5) is presented of P ex IP, againstMach number for the two cases).
At 5, the inclination of the flow J. s is known. At B the inclination is assumed to be the anglefor shock detachment.
Thus a mean value is taken for n;
A + Att = s 2 d (plane flow)
rj = As 1()d (axially symmetric flow).
As As differs only slightly from Ad the inclination of the sonic line for plane flow is assumed tobe rj = As. These two values for tt are presented in Fig. 4, Ref. 3.
Thus finally:
and from equations (5) and (7):
L ( rs _ rco) tan cP (rs _ r co). ren ren2 s _1._ (rs _ 1) tan rj _ ren 2ren l(tan2cPs - tan" IX) •
tan IX ren tan IX 'V (12)
(b) Conical Centre-Body Intakes.-This case is illustrated in Fig. 60. So long as r co > r. asimilar procedure to that given for the Pitot intake can be adopted. A slope condition nowreplaces the original assumption that the hyperbola has its vertex on the stagnation streamline.It is assumed that the third shock is straight and inclined at the angle cP (as determined from thethree-shock intersection calculations) from the point of intersection to the stagnation streamline.
Thus for the hyperbola:
(13)
(14)
We now have the condition drld» = tan cPco when r = ref" where cPco is the angle of the thirdshock with respect to the free-stream direction.
Hence, on substituting this and the original condition drld» = tan cPs when r == rs and rearranging we obtain:
and
xo = {(tan2cP s )~1/2 (tan2cPco )-1/2}
tan IX t 2 - 1 - t 2 - 1an IX an IX
(15)
ro=rco-X o tan IX
(t an2 cPs _ 1)1/2 .tan" IX
13
(16)

The procedure is then exactly as before for the Pitot intake and we finally obtain:
L [ (r,/ren) - (rw/ren) ]ren = {(tan2 CPs )~ 1;2 (tan2 CPu: ) -1/2tan ex \ -- - 1 - - 1
\ tan2 ex tan2 ex
( rs __ 1) tan 11r;
(17)
where, as before:r,
Yell
{I - Bcosil (r",~/rcn)2\1!2
\ 1 - B cos I) J(18)
(19)1 - cot 0", tan cp
r,
r.;
The results obtained for the shock position ahead of the entry from the above expression agreebetter with experimental measurements from photographs if two-dimensional values for 1/'andPsiP'; are taken for all mass flows (In Ref. 3 a similar recommendation is made for smallspillages) .
Having determined L, we then have (Fig. GO):
r x _ (L N - L) tan cP",rell ren
and (20)
Thus from equation (19) we can determine at any mass flow the proportion of the enteringstream-tube air which passes through the two-shock system (the rest passing through the singlethird shock).
The pressure recovery through the two shocks can be determined if we assume that the secondshock is normal to the mean flow direction between the cone shock and the cone surface andoccurs at a mean Mach number:
(21)
The pressure recovery through the third shock is also determined as we know its direction tothe free stream from the three-shock - intersection calculations.
Thus finally an area mean of these two streams of differing total head gives the predictedpressure recovery at any mass flow, i.e.,
r:( P ) (rCD
2
r/ ) ( P ) ( r/ )- X -2--2 + - X ~P if..! ~3rd shock ren ren P CI:.-' cone shock + normal shock ren
(rof,2/ren2)(22)
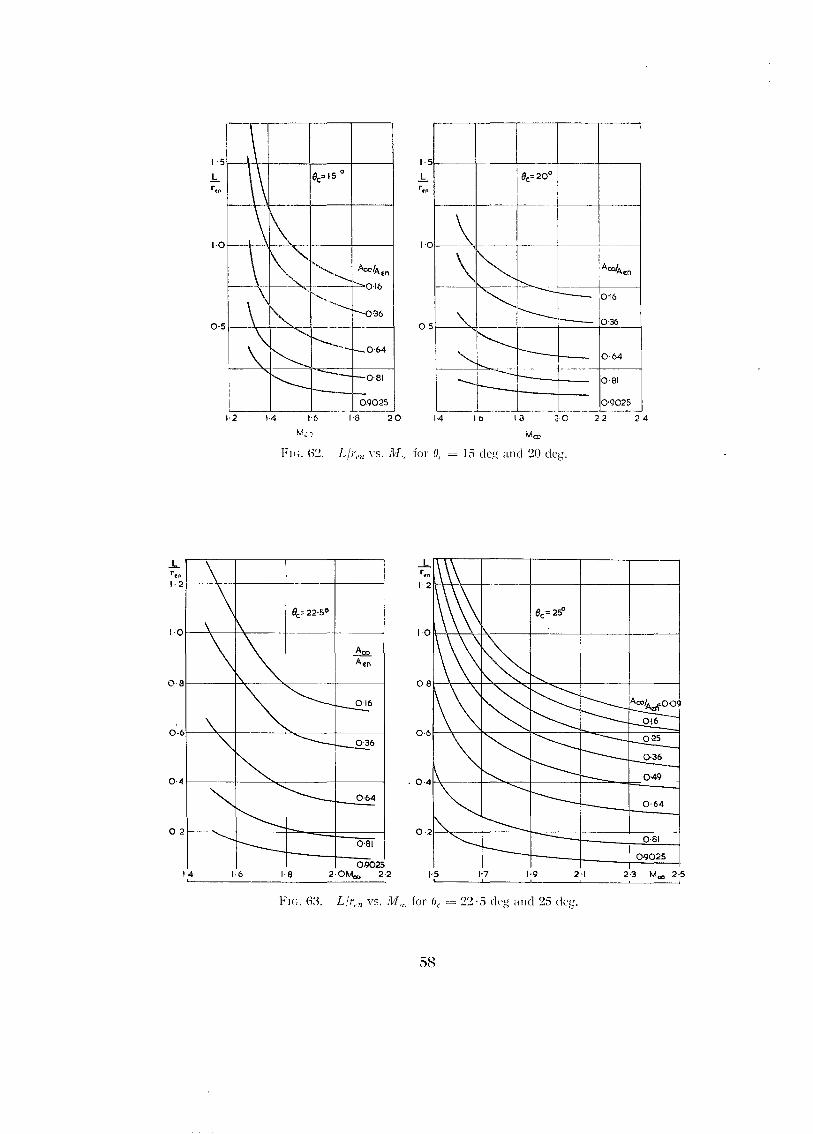
This method for calculating the shock pressure recovery is rather tedious to apply and itsapplication has been facilitated by the addition of some graphs (Figs. 62 to 78) at the end of thereport.
In Figs. 62 to 65 t.t«; (equation (17) ) has been plotted against free-stream Mach number M"for a range of mass-flow ratios A .r/Aen for cone angles of 15, 20, 22· 5, 25,30 and ~35 deg.
If the cowl-lip position angle 0/ is known, rlr.; can be calculated from equation (19) andFig. 66 (Ow vs. 111-,) and Fig. 67 (cp o: vs. "~{ ",).
Finally Pen/P,r. is calculated from equation (22) with the aid of graphs of PIP/leone I normal shock
vs. u : (Figs. 68 to 70) and (P/P otc)3rd shoe" vs. 11I otc (Figs. 71 and 72).
14
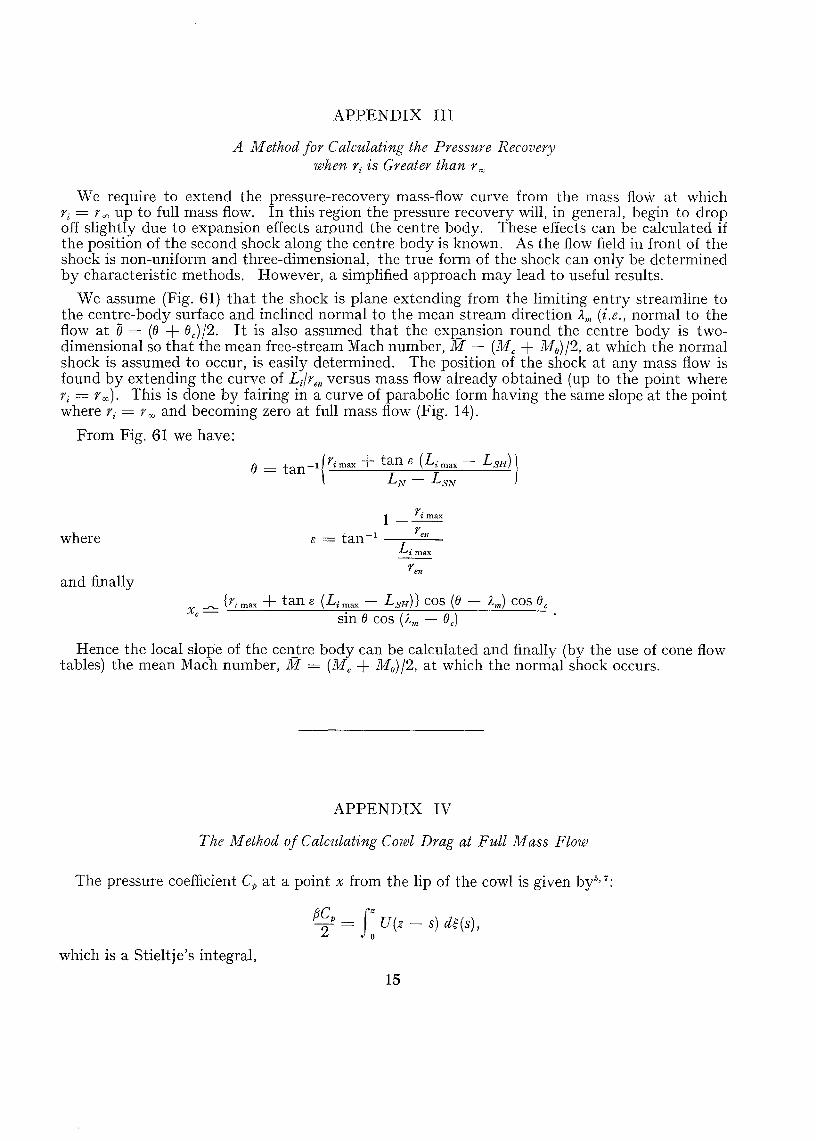
APPENDIX III
A Method for Calculating the Pressure Recoverywhen r, is Greater than roo
We require to extend the pressure-recovery mass-flow curve from the mass flow at whichr, = roo up to full mass flow. In this region the pressure recovery will, in general, begin to dropoff slightly due to expansion effects around the centre body. These effects can be calculated ifthe position of the second shock along the centre body is known. As the flow field in front of theshock is non-uniform and three-dimensional, the true form of the shock can only be determinedby characteristic methods. However, a simplified approach may lead to useful results.
We assume (Fig. 61) that the shock is plane extending from the limiting entry streamline tothe centre-body surface and inclined normal to the mean stream direction Am (i.e., normal to theflow at e= (8 + 8e)/2. It is also assumed that the exp_ansion round the centre body is twodimensional so that the mean free-stream Mach number, M = (Me + Me) /2, at which the normalshock is assumed to occur, is easily determined. The position of the shock at any mass flow isfound by extending the curve of Ldren versus mass flow already obtained (up to the point wherer, = roo). This is done by fairing in a curve of parabolic form having the same slope at the pointwhere r, = roo and becoming zero at full mass flow (Fig. 14).
From Fig. 61 we have:
8 = tan-l{rimaX + tan 8 (Li max - LSH)}L N - L S N
where
and finally
1 _ r imaxr:
L i m ax
Hence the local slope of the centre body can be calculated and finally (by the use of cone flowtables) the mean Mach number, M = (Me + M e)/2, at which the normal shock occurs.
APPENDIX IV
The Method of Calculating Cowl Drag at Full Mass Flow
The pressure coefficient Cp at a point x from the lip of the cowl is given by" 7:
which is a Stieltje's integral,
15
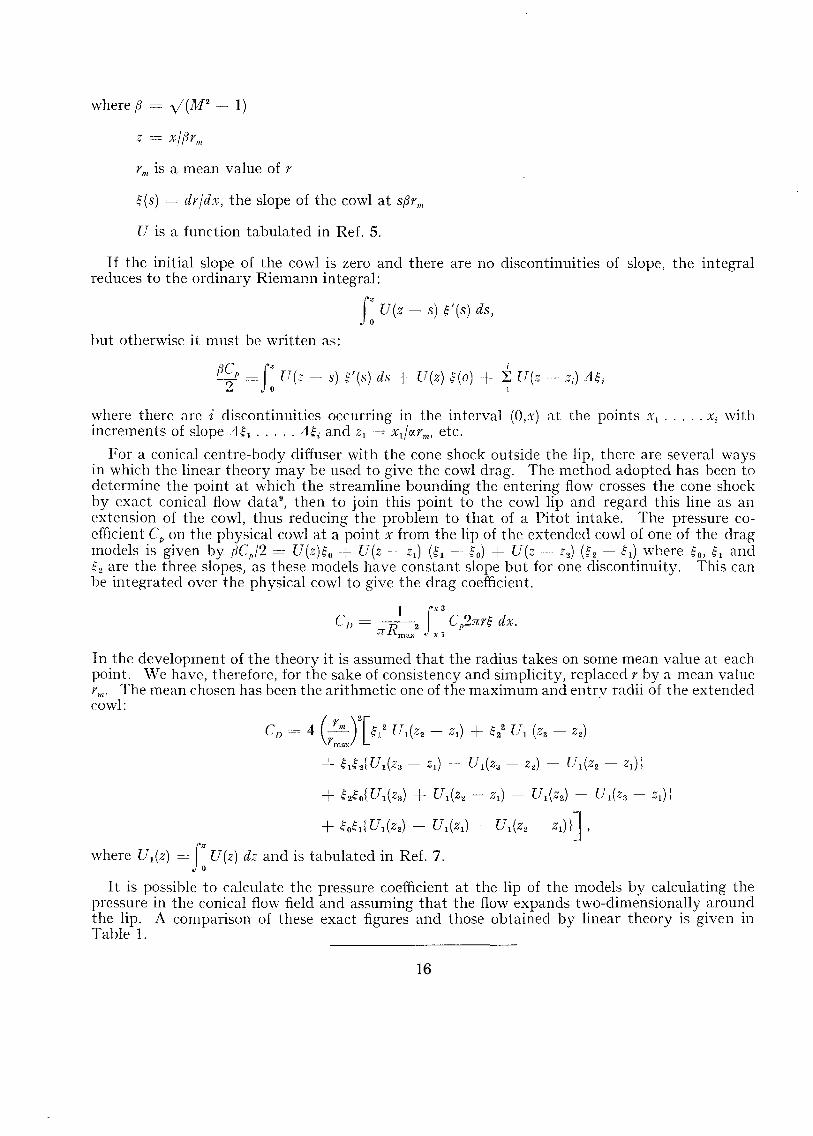
where fJ = y'(M2- 1)
rill is a mean value of r
~(s) = drldx, the slope of the cowl at sfJr",
U is a function tabulated in Ref. 5.
If the initial slope of the cowl is zero and there are no discontinuities of slope, the integralreduces to the ordinary Riemann integral:
f: U(z - s) ~'(s) ds,
hut otherwise it must be written as:
fJ~p =cfz [TCc: ~. s) $'(s) ds + U(z) ~(o) + i UCc: zJ !I~i~ 0 1
where there are i discontinuities occurring in the interval (O,x) at the points Xl ..... Xi withincrements of slope /I~l ..... ;1~i and Zl = xt/ocrm , etc.
For a conical centre-body diffuser with the cone shock outside the lip, there are several waysin which the linear theory may be used to give the cowl drag. The method adopted has been todetermine the point at which the streamline bounding the entering flow crosses the cone shockby exact conical flow data", then to join this point to the cowl lip and regard this line as anextension of the cowl, thus reducing the problem to that of a Pitot intake. The pressure coefficient C, on the physical cowl at a point x from the lip of the extended cowl of one of the dragmodels is given by /1Cp /2 =c U(z)~o + U(z - Zl) (~1 - ~o) + U(z - Z2) (~2 - ~l) where ~o, ~1 and$2 are the three slopes, as these models have constant slope but for one discontinuity. This canbe integrated over the physical cowl to give the drag coefficient.
, 1 fxa(}) = -R2 Cp2nr~ dx.
n max xl
In the development of the theory it is assumed that the radius takes on some mean value at eachpoint. We have, therefore, for the sake of consistency and simplicity, replaced r by a mean valuerIll' The mean chosen has heen the arithmetic one of the maximum and entry radii of the extendedcowl: .
en = 4C~~r[~12 U 1(Z2 - Zl) + ~22 U1 (za - Z2)
+ ~1~2{Ul(Za - Zl) -- U1(za - Z2) - U1(Z2 - Zl):
+ ~2~o{U1(Za) + U1(Z2 - Z1) - U 1(Z2) - U1(za - Z1) 1
+ ~o~lfUl(Z2) - U1(Zl) - U1(Z2 - Z1n] ,
where U1(z) = f: U(z) dz and is tabulated in Ref. 7.
It is possible to calculate the pressure coefficient at the lip of the models by calculating thepressure in the conical flow field and assuming that the flow expands two-dimensionally aroundthe lip. A comparison of these exact figures and those obtained by linear theory is given inTahle 1.
16
APPENDIX V
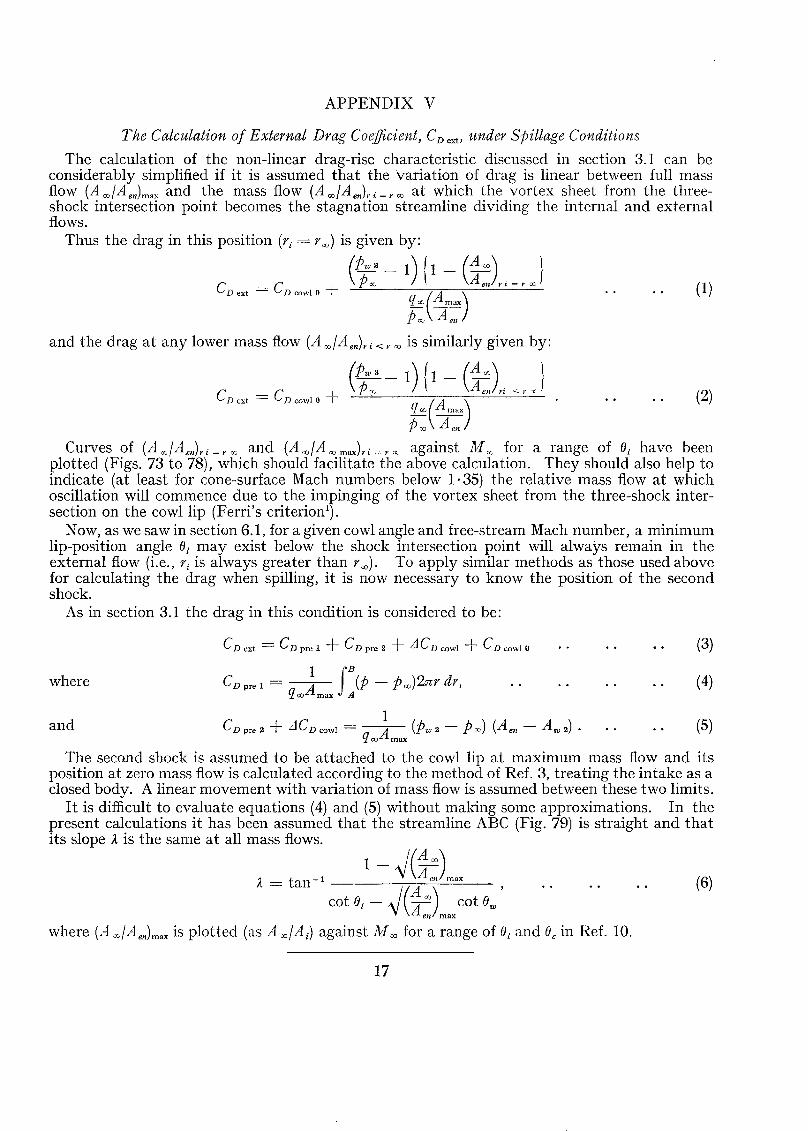
The Calculation of External Drag Coefficient, CD ext' under Spillage Conditions
The calculation of the non-linear drag-rise characteristic discussed in section 3.1 can beconsiderably simplified if it is assumed that the variation of drag is linear between full massflow (AooIAen)max and the mass flow (AooIAen)ri=roo at which the vortex sheet from the threeshock intersection point becomes the stagnation streamline dividing the internal and externalflows.
Thus the drag in this position (ri = roo) is given by:
(PW3_ 1) {1- (A 00) }
C C + Pete t Aen ri=rao (1)D ext = D cowl 0 (A )qC/O max
Pao Aen
and the drag at any lower mass flow (A aoIAen),. i < r co is similarly given by:
(2)CD ext = CD cowl 0 +
(PW 3 -1) (1- (Aero) }Pao t A en ri ,,-,. x
qao(A max)Poo Aen
Curves of (AaoIAen)ri~roo and (AooIAoomaJ"i~"oo against Mao for a range of 0, have beenplotted (Figs. 73 to 78), which should facilitate the above calculation. They should also help toindicate (at least for cone-surface Mach numbers below 1,35) the relative mass flow at whichoscillation will commence due to the impinging of the vortex sheet from the three-shock intersection on the cowl lip (Ferri's criterion').
Now, as we saw in section 6.1, for a given cowl angle and free-stream Mach number, a minimumlip-position angle ()/ may exist below the shock intersection point will always remain in theexternal flow (i.e., r, is always greater than roo)' To apply similar methods as those used abovefor calculating the drag when spilling, it is now necessary to know the position of the secondshock.
As in section 3.1 the drag in this condition is considered to be:
CD ext = CD pre 1 + CD pre 2 + zlCD cowl + CD cowl 0 (3)
where 1 JBCDpre1= A (p-pao)2nrdr,
q00 max A(4)
(6)
1and CDpre2+LlCDcowl= A (PW2-poo) (A.,,-A w2)' (5)
q00 max
The second shock is assumed to be attached to the cowl lip at maximum mass flow and itsposition at zero mass flow is calculated according to the method of Ref. 3, treating the intake as aclosed body. A linear movement with variation of mass flow is assumed between these two limits.
It is difficult to evaluate equations (4) and (5) without making some approximations. In thepresent calculations it has been assumed that the streamline ABC (Fig. 79) is straight and thatits slope A is the same at all mass flows.
1 _ t -1 1 - ~(~taxIL - an I(A ) ,
cot 0/ - '\j Ae: max cot ()w
where (A aoIA.,,)max is plotted (as A oolA;) against ]1;[00 for a range of ()/ and ()c in Ref. 10.
17

TABLE 1
Comparison oj C07.RJl-Lip Pressure Coefficients asCalculated by Linearised and Exact Theories
Model Mach Exact Linear(deg) number Cp lip Cp 1ip
-15 1· 51 0·251 0·227
~2·5 1·51 0·203 0·205
1 .()l 0·208 0·195
I·H2 0·212 0·176
1 ·91 0·199 0·170
:{O 1·82 0·141 0·152
1·91 0·149 0·148
18

FIG. 1. Suffix notation.
®
x
(0) (JL<9 w (b) 9L>6 w
FIGS. 2a and 2b. Pressure recovery at reduced mass flow.
19

0'05
0·02
0'01
.-
v--- I---
----t>:L-----V--
~~
»>r l ip = 0'0053 "
ren = 1·000 "
a1-6 1'8
FIG. 3. Cowl-lip drag coefficient (CD lip).
20
3-0
CONFIGURATION (FROMCrfEtgNsl;6~~ION~ 9Z Mwl
35° - m 0" 46·2 2'9035° ill 0·05" 47·1 2'6230° -STO 0" 44 2'35300-ST3 0" 40·3 2'9030u -ST3 0'05" 41·6 2' 6630° ST4 0" 47° 2·08
CONF.IGURATION ( C.B. POSITION ~)9Z MwZFROM DESIGN POSfTlON
30° SD3 0" 50'7 I' 86
S03 COWLx DIA.lb DIA.Yi
10'00 1'897 1,885b'IO 1'947 1'9230·20 1'993 1,9550'30b·030 1'9700'40 2·069 1·990In· 50 ·100 1'9980'60 2'130 12·0D00'80 2'173 12·0D01·00 2·207 12·0D01'20 2·231 12,000/'40 2·244 2·0001·60 2·250 2·000
C~~1~E5D3-30x DIA.y
0·00 <Xl0 40·70 0·81 I0'80 0·9230·90 1·0131'00 1·0771'20 1'1441·40 1'1551'60 1,1401'80 1·1202'00 1·0992'80 1·0192'00 I·OOQ
IC§8rW t 350 m30'STO30'sn YJ'ST4
x DIA. Y DIA. Y DIA.y DIA.y0 0 0 0 0
0·80 0·927 0'94 0·940'90 1·038 1'063 1·0491·00 1·384 1·118 1'175 1·1491'10 1'152 1·290 1·222
11·20 1·420 1·151 1'360 1·2451·30 1'150 1'390 1':1481'40 1'404 1'146 1·395 1·2461·50 1'128 1·392 1'2401·60 1'390 cr 1·3901·70 w 1·388a._1·80 1,372 <{N 1·385 1·2201-'.-2·00 1'356 OON 1·365 1·2032·20 1·338 'fJ " 1·350 1·1772'40 1·312 -w 1·330 1,1502·60 1·294 ~.J 1·3050C)2·80 1·252 crZ3·277
u...;: 10'997
STO}ST 3ST4 COWL.
350m
~~mE 35°r YJ~SDZ
x DIA. Y DIA. Y~ 0 0·010 0
I I 0·70 0·8190·80 0·934
~ . 9~ - 0·90 1,260
~1·00 1·149 1·366
~>-~ -c --- 1·20 1·313 1'486o 0 0 1·40 1·392 1'534
i"--."1·60 1,402 1·542....1·80 1·392 1·538
I 2·00 1·367 1·530~ 2·20 1·339 1·520
I2·40 \·5102'60 1'496
~ ~ 2·80 1'478SD 2 COWL. 3·00 1·225
3·10 1·229
SD2 COWLXc DIA.Yo DIA.y·0 1'820 1·800
0'10 1'893 1·8530'20 1·963 1·9060·30 2·023 1·9460·40 2·080 1·9760·50 2·128 1·9930'60 2'175 1·9990·70 2·202 1·9990·80 2·226 ·9990·90 2·241 1·9991·00 2·245 1'9991·10 2·248 "999
SD 6 COWL
C&NTRI 5D6-3&ODYx DIA. Y0 b-007
1·00 1'1581·20 1'3721'40 1'4831·60 1'5121·80 1·5102'00 1·5032'20 1'4902'40 ',4772·60 1·4562·80 1·4272·90 1'408
SD6 COWL
x DIA.Y; DIA.Yn0 1'915 1'905
1·10 1'959 1·9200·20 2·002 1·9500·30 2'041 1·9720'40 2'080 1'9900'50 2'112 1·9950·60 2'145 1·9980·70 2'171 1·9980·80 2'196 1·9981'00 2'232 1·9981'10 2'243 1'9981'30 2·250 1·998
35° I - SD 2 I o· I 46'230° - SD 2 I 0" I 44· I
I Mwl II 2·90 II 2 '34 I
CONFIGURATION C.B. POSITION9Z Mwl(FROM DESIGN POSITION)
SD6 30° 0" 40'0 2'94-0·05" 42·7 2·51
DIMENSIONS ARE IN INCHES 01 MENSIONS ARE IN INCHES.
FIGS. -la and -lb. Model details and dimensions (;'i~ in. X ;'i! in. Tunnel tests).

STO su snst·, U· TUNN(l MO DELS
FIG. 5. (; l'!Il'r<ll view of models,
'"
I
o<
r~
CIIA.· .
o0 ' .01 ,0251, 0 ••l ' OIlS\ · 10 0l 'lI S1 ·1201" 251·130I 13tI IlllI oU.
. ~'
o 0
• DIA.0 0
0 90 0763, 00 O-~~~1·10 0 " 15
tf2 0 OL~~~- 0 " . 5
IT:~~- O :~:!R1·5 0 0~981 ----,
1· 60 0 -989
W...:.! O 9...:...~_~~1· 80 0 · '10" 0 - O~'. 5
' 00 Q:.!~ ~
ALTER. NATlvEPAR.AllEl R.U>R.
"·~-''2f-· -" ~i22·5 DA.AG MODEL DfTACHA91E
PLUG
....~-
30 0 D~UG MODEL5HOWING MET HOO O F AT TACHMENT O F CENTl l.E BODY.

FIl:. 9. St rain-gauge drag- balance wit h ex it flowand base-pressure Pitot-tu be racks.
G
-6--
Flc . 7. Pressure-rec overy-measurement h ost rig installat ionin R.t\ .E. :\0. 4(5 1 in. X fq in.) Sup ersonic Tunnel.
eASE P~!oSUAEP, TQT llACK
FIG. R Strain-ga uge dril ,t{ balance.
0·806
M~ 2·48
0-2
III
1----; Moo
= \. 86 I----++---+-----j
" SD2 + STOI 0 503 o ST3I
I o SD6 x ST4I
THEORYf-0-- MEASURED
0Aco
0·2 0'4 0.6 08 \·0 A~n
I0r---p~=-t----r------tet",e-/cj
1·01----I-----I---/--l----+=-+~f.-.---------l
0·51---_+----r'----:;;&"F-...,.--.f-:,..L-:;~_+--_____i
KEY TO
Q.51----+--,,:z---I---#'---/-'-+-----+J SYMBOLS
+ STO
Q ST3
x 5T4
r j
ron
THEORYMEASURED
SO 2SD3
o SO 6
,/
Moo= 2·14
/
/.'~.
/"
0·2
/I
II
0·5/
//
~./
I/
II
Ace0 A.n
0'2 0'4 0'6 oe \'0
O.sI---_+--n:¥----In-F--+_--cL----1----I
~01---_+----+--_f_+_--_I'1---7I;
I----JM = I· 86 \---_+---I----l----I----jco
r .I
ron
r i
ron
FIG. 10, Comparison of measured and theoreticalvalues for nlr.;
FIG. 11. Comparison of measured and theoreticalvalues for rilr.:

0'60'402
/M..:I'61 J pJ
../, ....
.!sa.."' .........-
rcn \
"~/v-:
",~// .:/
/
1/1/
'-.......'
,
MO: 1'511.,..-.......
.-/f...
,.-" /.!&
rcn \ ..... '"/'"",,-
/'/ ~..-...../
/ .- THEORY r--
",
_ MEASUREDI
/I
',0
o
0,5
0806
0-4
0'4
0·2
0·2
M~ 2-48
I·OI-----t---t---+--P---h:--?!
O..5/----t--r''--''7''''l-"-7¥--+----i----l
I,O'r-----r---I".:----r---.--~::7I
rj
rcn r----+----+--i-rr--::~~~-___1
o 02 0'4 08
FIG. 12. Comparison of measured and theoretical values for ri!rtn• FIG. 13. Comparison of measured and theoretical values for ri!r.",
Moo=I'82
I·OI----+---+-------+----,~--____."I
"""0·5/
//
I/ _._THEOR.V
I -- -MEASURED/
I
00·2 0·4 0'8 A oo 1·0
A oz n
·0
0'5
Mco :::1·91
1/e
/--1
~ L, ///
" -. roo ///roz n•...........
-. ::'" .
~>!",",
/" Lj/ <,
Arozn
/ -.//
I r( ,rozn
\
(/ \\
\
\o
1·0
0·5
0-2 0·4 0·6 0-8 ~ 1·0Aoz n
FIG. 14. Comparison of measured and theoretical values for r;/ren•
26
'.1 0 " ...,0'0 'o .0 7o
,-- ~(P;)--- '" '"--,
].?I"~--7
o·
o·
®
®
0 -75 ---® ----------";' THEOR£'TICAL SHOCK'. PRESSURE RECOVERY
2-48 O'6~ ~ MEASURED PRESSURERECOVERY
0·55 ~0 0 · 7 0 ·. 0 · ' 0 ·' 1-0 "~II
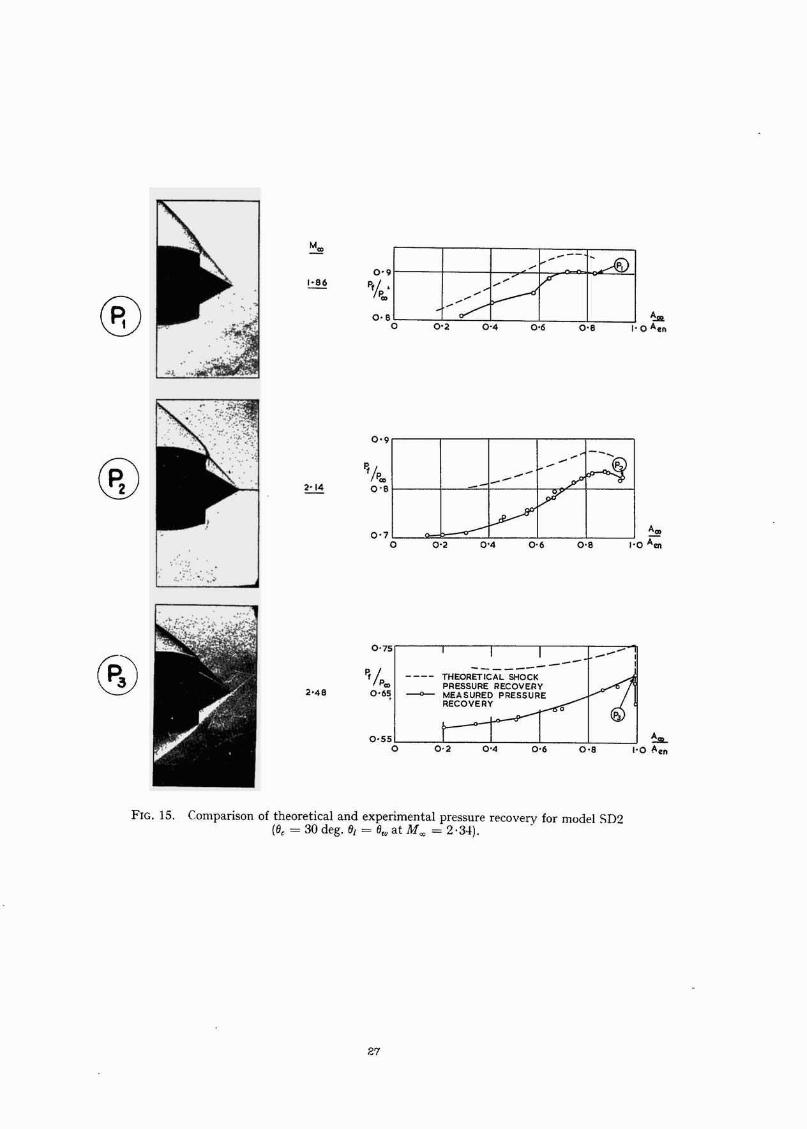
FIG. IS. Comparison of theoret ical and experimental pressure recovery for model SD2fll. = 30 de-g. fJ/ = II," at M", = 2-3-1).
27

'.I OAe.0 '
0 "
00
0 ·0
0 '
THEOIlETICAL SHOO<PRE SSUIIE RECOV ERY ,, '"MEASURE D PRESSURE ... 'RECOVERY _'--
0 '
0 "
----_/
0------ ~
0 .
0 "
0 '0
0 " r::-==-===::-:-==- - --,-...".-"',;,':.
0 " 1---r---,~"'"9---t---I
®
®
®FIG. 16. Comparison of theoretical and experimental pressure recovery for model SD3
(6c = 30 deg. 6/ = fll<. at Moo = } ·86 ).
26
®
® 0"1pv.p .•0 "
o
'.' u
' 0o.o.0'
- - _ THEORETICAL SHOCk PRE SSURERECOVER Y
s ~ MEASU AED PRESSURE RECOVERY
- ---, --~- - -- -1"",
<; 17r05CILL~ ,
s ,0 '.o
0 "
.. //p.0 ,'®
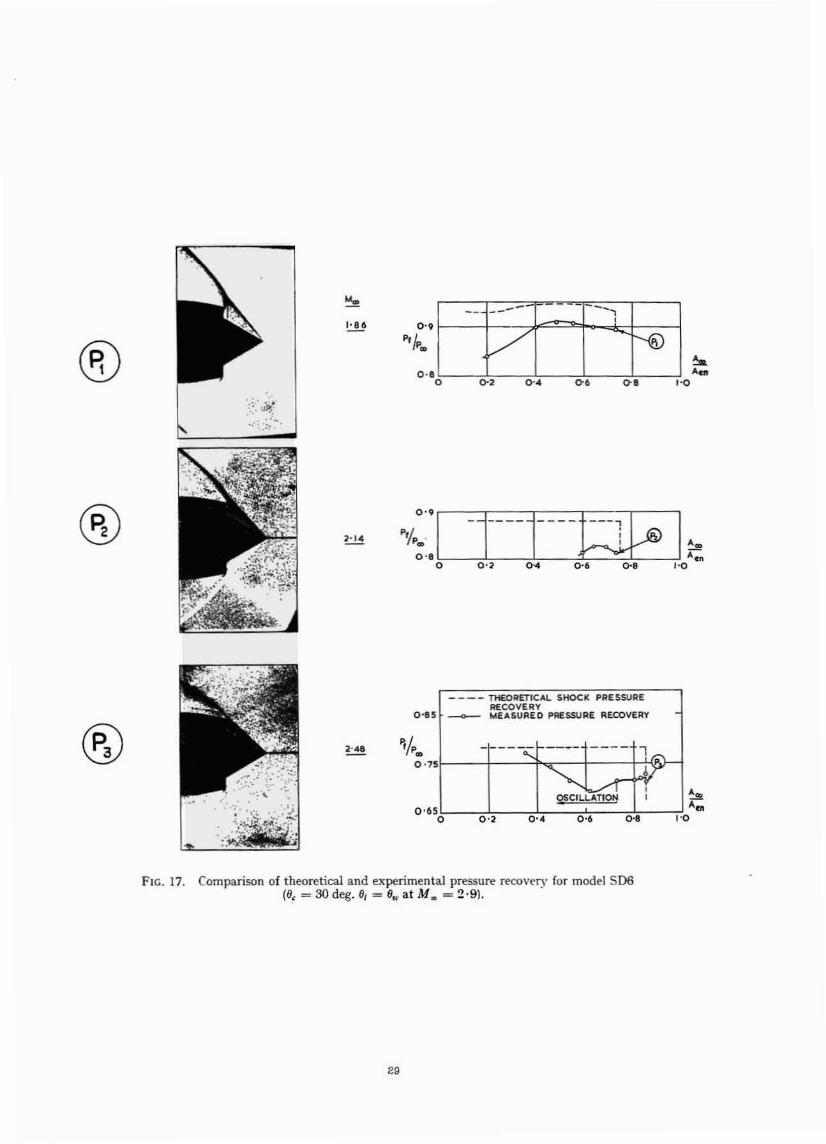
FIG. 17. Comparison of theoretical and experimental pressure recovery for model SD6(8e = 30 deg, 8, = 8... at M .. = 2,9\,

A.A~
' 00 'o.
THEORETICAL SHOCKPRESSURE RECOVE RYMEA SUREOPRESSURE RECOVER,
,-'
0'
5
.....................-~~,
,IY I----- V eel--- .>
5-0-' o
0- '
~ /'.0-"
0- 'v;•
~A,.'00 '0'
-- - -------------
0
- I ~0
0-'
0-''0 /'.
0-'
.j ....
Ftc . 18. Comparison of theoretical and experimental pressure recovery for model STO(6, = 30 deg. 8/ = 6", at M.r, = 2 ,05).
30
o ·
---- - - --~"i
---- - ,
6\', -e-
__ _ _ THEO RETI C....L. SHOCK PR ESS URERECO VER Y
~ MEA SURED PRE SSURE RECOVE RY
' 0 0' 0 -' 0" 0 -' ,-
"~II '.o ·
®
®
®
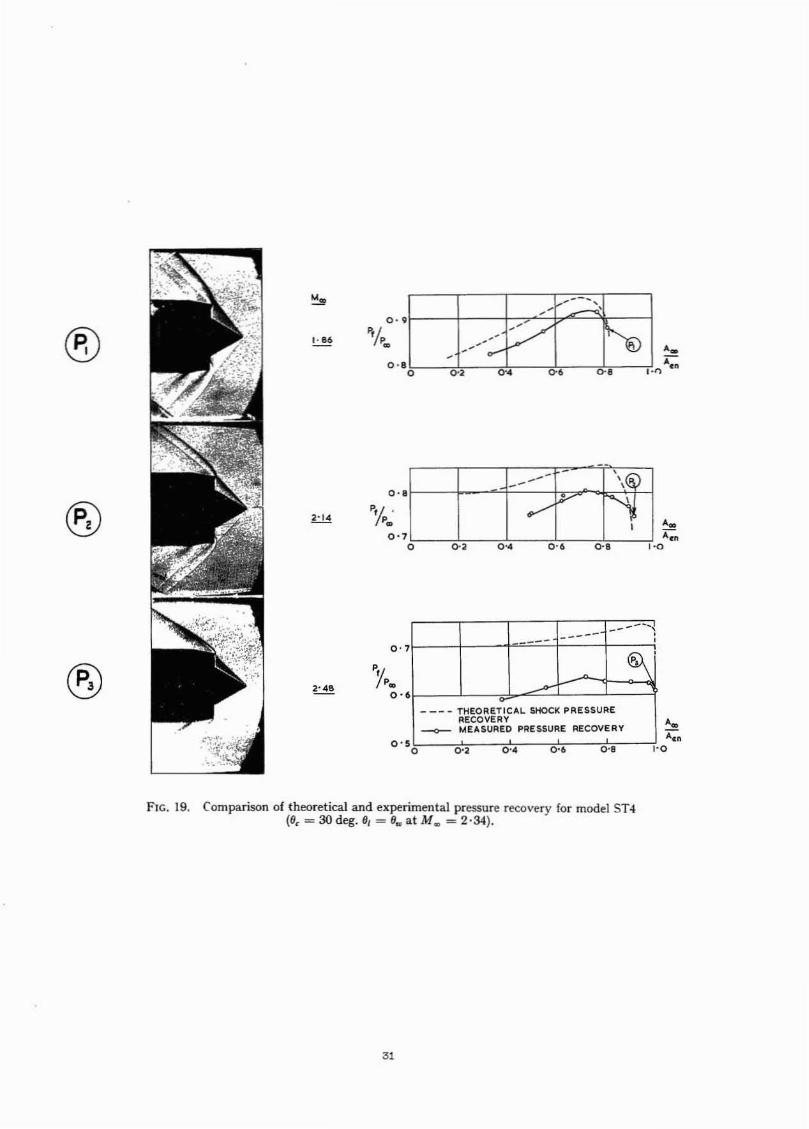
FIG. 19. Comparison of theoretical and experimental pressure recovery for model ST..(9~ = 30 deg. 8/ = 8..,at Moo = 2 ,34).
31

'....' 0o.".o .o
• - --~0000• .. 1 : -o0r-o,o·
o ·
'Ij••o·
®
®
o·
o ·
.,//..
o·
• ---r - ,0
IOSCIL.LATION ,,
....... 1-.. 1
--- - THEORETICAL SHOCl( PRESSUR£~
• _ f.!l~~ PRESSURE RE.CO ....ERY0 0 ·' 0 ·. 0-. 0·'
' ......o
FIG. 20. Comparison of theoret ical and experimental pressure recovery for model ST3(e. = 3Odeg. 6/ = 8l< atM ", = 2 ,9).
32

0'80'70·5
----- ----~- ---- I
IIII
TH EORETI CAL--- SHOCK PRESSURERECOVERY
-0--MEA!>UREDPRESSURE RECOVERY
0'30'4
0'4
0·5
0·9 ',0Aec/Aen
0·8070·60·5
8
----- ------ ---,
7t>"""
lTHEORETICAL---- SHOCK PRESSURERECOVERY
--0---MEASUREDPRESSURE RECOVERYI Io
O'
Q.
FIG. 21. Pressure recovery and drag of SD6 at 1\1x = 2·14.
0·2
04
0·8070'60·5
s--- THEORY
t -0-- EXPT.
s -,-,
"--,""
·2~,
......,'1
o0'4
o
o
o
o
o
0·9 A 1·0OO/A(n
FIG. 22. Pressure recovery and drag of SD6 at M a; = 2·-i8.
0-80·70'60·5
, I, -- ----- THEORY.,\' 0- EXPT.
\
~ '\
\ v,\\ ,
~I
o
0·5
0,3
o-t
COcxt
0·80·70'60'5
5
----- ----- ----- ----,THEORETICAL
----- SHOCK PRESSJRERECOVERY
---0- MEASUREDPRESSURE RECOVERY
I I03
0'4
O·
0·80·70·60'5
7
----- ----- ----,----- III
611
THEORETICAL "'------- SHOCK PRESSUREf- RECOVERY
MEASURED(
----0--- PRESSURE RECOVERY
1 I
O'
Q.
0·5
0·80·7O·{;0-5
I------ THEORY
-<>-- EX PT.
, ,"
2-, ,,,
"I
i'.."
~'".--'1--
oa'4
0-3
o-
O'
0·4
0·9 roAa::>/A
/1 en0·80·70'60'5
5
It
----- THEORY
-, 0 EXPT.,1'",
-,·3 ,
-,-,,,
2, ,,
-t'\,~
o
o0·4
o
o
O·
a·CD~X
FIG. 23. Pressure recovery and drag of SD6 at Moo = 2·90. FIG. 24. Pressure recovery and drag of SD6 at Moo = 3·27.

----- ----- ------,III
~I
~II
-> III
/' I
THEOREnCAL---- SHOO< PRESSURERECOVERY
_MEASUREDPRESSURE RECOVERYI I
----- ---- ~--=-.:::..::.----- ..,...., I-, I\ I
INCREASED--I------ ,
IALLOWANCE FOP. \SHOCK LOSSES DUE TO CURVING ~ IOF CENTREBODY / I\
IV I
A \ I\ I\1~I- ___ - THEORETICAL
SHOCK PRESSUP.E IRECOVEP.Y
--0- MEASUREDPRESSURE RECOVEIW
0·80'10·60-5
08
0-6
0-7
0·80-70·60'5
0·8
09
0·7
0·9 Aa>/ 10A~n
os0'70·60·5
I.... ---- THEORY
.... --O--EXPT........
....,....,
-, ,-,
....
" --
\ -,f-------- _. -, -~-.--
\~
\\I
+- -
O·
o0·4
0·3
0·6
0·4
0·2
0·5
o-e0-70'60·5
'6
t "",·5
~ ----- THEORY
" -EJ(PT.\4 -. --·3
"I
":2
'\'~,
t--
'1
'"
o
o
O·
O·
o
FIG_ 25. Pressure recovery and drag ofSD6 (- 0·05 in.) at Moo = 2·14.
FIG. 26. Pressure recovery and drag ofSD6 (- 0·05 in.) at Moo = 2·48.

0·9 A<:> 10
Aen
os
08
07
07
0·6
0·5
05
Pressure recovery and drag of SD2 at AI", = '2' 14.
---- THEORY--0- EXPT,
~
~~ .....s
<,
,,~-,
,-, "'0
'tI
9
~----- 1
.//
I././I
---- '"I
./././
/~ N_/I
....- I
-: I
-: p
---- THEORETICALSHOCK PRESSURERECOVERY
--<l-MEASURED
7PRESSURE F\ECOVERY
I
O·
O'
O'
o0·4
0·4
0'5
0·6
O'
0·3
0,2
'Oext
FIG. 28.
0·8
0·8
0·7
0'7
0·6
0·6
05
0·5
FIG. 27. Pressure recovery and drag ofSD6 (- 0·05 in.) at MeL = 2·90.
-' --------' .-
J
.~- ---THEORETICAL
SHOCK PRESSURERECOVERY
-o--MEASUP-EDPRESSURE RECOVERY
- --THEORY--e--EXPT.
"',,\.,~
I\
\
06
O'
o0-4
0·504
0·4
07
03
0·2
0·5
c;,cxt

o.e0-70.60.5
-- I-- ---I'---- - l
IIII
~V
- - - THEORETICALSHOCK PRESSURERECOVERY
__ MEASUREDPRESSURE RECOVERY
o 4
0·5
o 6
0·9 A 10a>JAlZn
0·60705
J......--- I1.----- I-- -- II
,..---s~1
--- - THEORETICALSHOCK PRESSURERECOVERV
__MEASURED
P~ESSURE RECOVEP.V
0·8
0'7
0·60·4
0.9 A aoJ '0A.n
Oil070.60·50.4
5
---- THEORYt
~EXPT.
4
,3
,~,
2 "."" I,,I
_I-._-
O.
O.
o·
o
O.
0·8070-605
------THEORV-o--EXPT.
.. ,
I',"~
-1
o004
o
0·4
0·2
03
FIG. 29. Pressure recovery and drag of SD2 at 11J lj) = 2·48. FIG. 30. Pressure recovery and drag of SD2 at Moo = 2·90.

\ I\ I\ I\ I
\jIIII
~:::::.~- --I~.:
0'8
0·8
-----
0'7
0·7
0'6
0'6
0·5
0·5
-----ALLOWANCE FOR INCREASED
SHOCK LOSSES DUE TO CURVING
OF CENTREBODY
____ THEORETICAL SHOCK
PRESSURE RECOVERY
MEASURED PRESSURE-0--
RECOVERY
------- THEORY
EXPT.
"~
'~\\
~\\
\\
I\
+
o 6L --.L L-__-L__-----l
0·8r---~---.------.----.-----.------,
0·5
0·3
o·
0-4
02
CDext
0.8
0.8
0.7
0·7
0.6
0.6
0.5
0.5
----- ----- ----- -"""1II
\~ IIIII
III
- - - THEORETICALSHOCK PRESSURERECOVERY
__ MEASUREDPRESSURE RECOVERY
--- THEORY-e-EXPT
• SMALL AMPLITUDE
~SHOCK OSCILLATiONS
'1'''\\
1\,,,,
'"\\"\b
,
~I
o0.4
0.9
0.704
0·5
0.4
0·8
0.3
0.2
o.
FIG. 31. Pressure recovery and drag ofST3 (- 0·05 in.) at M~ = 2·14.
FIG. 32. Pressure recovery and drag ofST3(-0·OSin.)atMx =2·48.
------f------------ -----
~~0- ~
---- THEORETICAL SHOCK
PRESSURE RECOVERY
MEASURED PRESSURE-0-- RECOVERY
------ THEORY
-0-- EXPT.
,\-,
'~""'\..
-,
'~,,-'I-
0'8
0-80'7
0'7
0'6
0'6
0'5
0'5
-"""'----/ I
/\ I1/ ALLOWANCE FOR INCREASED/
/ V! SHOCK LOSSES DUE TO/
i\ CURVING OF CENTRE BODY/ /, \ I/
V \'I I"'....
~~
I II I --- THEORETICAL
\{SHOCK PRESSURERECOVERY
---0-- MEASUREDPRESSURERECOVERY
"'\
~---- THEORY..->- EXPT.
'\'\b
\
~
0'9
o0'4
0-7
0-8
0·6
0'1
0'2
0·5
0-3
0'9 1'0Aa:,~
en
0'8
0·80'1
0'70'6
0'5
0'5
0·6
o04
0·5
0'5
0·4
0'3
0·2
Gout0·4
FIG. 33. Pressure recovery and drag ofST3 (- 0·05 in.) at M~ = 2·90.
FIG. 34. Pressure recovery and drag of35 deg III at M", = 2·14.

0'8
0-80'7
0'70·6
0'60'5
0'5
-,.,--- -I
--- I-~---- - I
----- I1II
1II
.Ll.
0--~V 1\---- THEORETICAL ;p
SHOCK PRESSURERECOVERY
~ MEASUREDPRESSURERECOVERY
-,, 1\ ---- THEORY,, --0- EXPT.,,
"" '\-,
K,,
,,~f'eo\,
\\
\
\11
0'4
0'3
0-4
0·2
0·1
04
0·5
0'6
0'5
<:Out
0'9 A / '-00:> A en
0'8
0-8
0'7
0'7
0'6
0'60'5
0'5
/.,.,--->-----1
-,.I--- I---- IIIIIIII
THEORETICA~I
---- ro-c-cI
SHOCK PRESSURE
RECOVERY
~ MEASUREDPRESSURERECOyERY
"'\~---- THEORY
-0--- EXPT.
",
,~It SMALL AMPLITUDE
SHOCK OSCILLATIONS
\
t\"\~,,
'j...
I
0'3
o0'4
o
0'4
O' 5
O' 6
O' 55
Q. 65
0- 75
FIG. ~~S. Pressure recoverv and drag of:~S degill I at 1\1-s: .: 2 --!R
FIG. 36. Pressure recovery and drag of:~S cIeg III at 1\1"f: = 2·90.

o
I I IALLOWANCE FOR INCREASED
ISHOCK LOSSES DUE TOCU:~N~lF CENTR.EBODY.
/,- ''iJ I
..... V .............. \ I\ I
,.- ,-
/" \\ I
,- /
\:,.-
/,- ./'
\ ;iI
_____ THEORETICALSHOCK PRESSURERECOVERY
---MEASUR.EDPRESSURE RECOVERY
°i 5 °t or r °t Aa>/Acn'-r
0·9
0·7
O·B
----------1-----1-----
---- THEORETICALSHOCK PRESSURERECOVERY
---0-- MEASURED 0--0-PRESSURE rRECOVERY
O· 5
0-4
, ---- THEORY,,--0-- EXPT.,
'"",
l-."\.,,
"
1009O·B0·70·60·5
,,,,,,
""-----THEORY
0 EXPT
~
\\~
\\\\
--r
I
Aa>/Acno
0·4
O·
0·6
0·3
0·2
0·5
0·4
0'9 A / 10CD Aen
0-8
0'8
0·7
0-7
0·6
0'6
0·5
0'5
o0-4
0·1
O' 2
0·3
0·4
O' 5
FIG. 37. Pressure recovery and drag of35 deg III at M oc = 3·27.
FIG. 38. Pressure recovery and drag of 35 deg III(- 0·05 in.) at M", = 2·14.

0·80·70·5
.-
----'
---'------ --------
Ia...... I~"\
THEORETICAL--- SHOCK PRESSURERECOVERY
-0-MEASUREDPRESSURE RECOVERY
0'404
0.5
',00·90·80·70·6
I
+
0·5
I i
III --'--'
--' Ii--' I
I I -~~~
I l' ...-iI i ..... ,.,-,,-
i I__ "1
! I--- I ~
, III ./ I
Cf'V I
THEORETICAL----SHOCK PRESSURERECOVERY
A ooG MEASURED
I PRESSURE RECOVERYIA q n
0·65
0·55
0-80'7060·5
5 "\ ------- THEORY J
\o EXPT.
l ,,• SMALL AMPLITUDE
''I. SHOCK4
""'\OSCILLATiONS
,~
,-,
3
"'~'<,,
''I. "8,,,,
·1 ,,,
o0'4
o
O·
O·
O·
O·
100'9o-s0·70·60·5
'"\.
'\ ---- THEORY-0-- eXPT.
-
'~
'~'I.,\
I\\
~I
I i
IAcol iA~.,
O·
o0·4
0·3
0·4
0·2
FIG. 39. Pressure recovery and drag of 35 deg III(-0·05in.) at Moe =2·-18.
FIG. 40. Pressure recovery and drag of~~5 deg III (- 0·05 in.) at u ; = 2·90.

-~,
..-- I------ I. --- I--- I-- II
III
~
THEORETICAL--- SHOCK PRESSURE
RECOVERY
-0-MEASUREDPRESSURE RECOVERY
0·5
0'8 0·9 A 10orA~n
0705 0'6
i I II ----- -
-, I/~4
II I ;..- I ! I- I I-- I I j
i-- III
\
I
0_II
...., - i' i........ / I
THEORETICAL--- SHOCK PRESSURERECOVERY
---<)- MEASUREDPRESSURE RECOVERY
065
0·550'4
0·75
0·'1----+---+------1----+----+------1
0·9A I ro00 A~n
0·8
0·8
0:"/
0'7
0'6
0·6
0·5
0-5
e
--- THEORY
l ---0- EXPT•
-,-,
-,
.....,,,~"- -,
'~"-
I ~
o04
0'2
0·.
03
04
O·
0·9 Aa:t roIAq,n
--..:. THEORY 1-0-- EXPT.
• SMALL AMPLITUDESHOCK OSClllAnONS
080'706
,....
.........
......
<, -,....
05OL-__-l-__-L__-----I ..l.-__-L ,
0'4
0'6
Coext
*'" 05CN
0'4
FIG. -11. Pressure recoyery and drag of35 deg I at 1\,£ro = 2· -18.
FIG. -12. Pressure recovery and drag of35 deg I at 1If-x: = 2·90.
0-807
--- -------- - - --IIIII
---- -- -----
--9-v
----(
_ THEORETICAL --SHOCK PP.ESSURERECOVERY
__ MEASUREDPP.ESSUP.E P.ECOVERY
----=
0·9 A I·GCDI
A~n
08070-605
_____ THEOP.Y
\,--0-- EXPT.
\,'\ .
\ ,~
00-=t-I
L _________ ------o04
03
04
0-
0-5
02
44
a
b
c
FIG. ·44 . Schlieren photographs.
4.
Sll6
Moo • 3.27...1.00•
'on
Po • 0.4ooeP~
BDe ( _0. 015- )
Moo • 2. 4B
... • 0.9019'en
!L • 0 .72e9P~
30· III
Moo • 2.14
...O.eSll-- •
'on
!.L • 0.70ts4P~

••'.
"'0o .0 '0 '0 'o
OSCN. -,---- ,I
~r7 I~0-~ <& , ~,,,,
- - - - T HEORETICAL .HOCII: PREUUAE RECOVERY
~ loIEUUlED PREUoURE RECOVERY
• ,- -0 -
' _0
',II,.
•..,'0o.0-'0-'0-'
," . os.....t·~..oou.u., ....CO"'-
"-,['. ,
,- - -
oo
0 -
0 -
F IG. 45. Pressure rt'Co \'ery and drag at .\f ... = 1 ·51 (8, = 15 d("~ l .

,.,' 0o .o.o .0 '
r - -
V®,
/
/,--- - r/ r.:~
---- THEORETI CAL SHOCK PRE.SSURE AECOVERY
~ MEASURED PRESSURE RECOVER Y
•.0 "o
" 0
0"
' 0o .~.0 'o
'\.e
_ 22-5·
t.4.~ - 2'05
PARALLEL.AEAR
~\COWL
a~'.
•, •·
0 , '
o ·
o·
FIG. 46. Pressure recovery and rlrag at M .. = I -51 (8e = 22 ·5 deg).

'.,~,' 0o.c .eo .0 "o
",---- ,,/
,,,-' ::A--; IB- ,. .... d @
---- Tl4£O JlETICAl SHOCk PRl: SSUJI£ RECO VEJlY
~ ...EASURED PRESSURE JlECO\lt.RY
•o ·
0 "
"0
' ,jI'.
'.' .., ,' 0o.o-eo.0 '
• 'e . ;u.S
-,....1.. 2.0 5
, ....un,
~REARCOW,
,
I'-,
oo
o·
o ·
o ·
Flc . 47. Pressure recovery and drag at MWj = 1·61 (9. = 22 ·S deg).
,.

'.' .., ,, 0o.o.o .0 'o
I I ,€JOSCH.L.ATION -
~- .- --"( li: -',- - - - ",1
r\ .
•
0·.
o ·
' ·0
' 0o.o .o .0'
•- - --- THEORETICAL SHOCK PRESSURE RECOVERV~ MEASURE D PRESSURE RECOVERY
,"',\ " -22·5
t.4.Z- 2-0-,, :--. TAPERED• "REARCOW,
-,,
'\,
. . . .
o·
oo
o·
o·
FIG. 48. Pressu re recovery and drag at .u .. = 1-82 (6c = 22 ·5 deg).
.,.
"' 0o.c -eoo.
__ _ _ I TH EORETICAL $Ho'a PR.ESSURE 1l.[~ERV~ IrolEA ~RED I"FtEUUR £ Il.ECXWERV
-- - - --- ---- - - -, ~,.-V
A.A.. ., .0·.
o
' ·0
."/ '.
®
..A.
"'00- .o •O '0·.
'c . ;l.;l. 's"
M..Z-:t 'OS
TAPERED, REARCOWl..
a
<,I'..,\
.oo
O·
0·'
o·
FIG. -19. Pressure recovery and drag at M.. = 1·91 ( 8~ = 22 ·5 deg).

'0.,..o.0- ,o
--- ---- ,Ii;)-@--/
,,, AW, V
• A.o ·
0 "
"0
"j,'.
® ® {;:;-p \'''--'Y
..A., ,'0c -eo.o .0-,
" o. 30 ·
M. Z"a·34TAP£ AEDAUIICOWL
\
\,
. .oo
o·
FIG. 50. Pressure recovery and drag at Mm= 1-61 (1ft = 30 deg).
51

"j,'.
\ ,,,,,' V
®
A.A~
"' 0o.o.o ,0, '
s . ",'"' 1,\
t.4.r-2-)4
TAP£AE DAU R
'\ COWL.
~a ,,
- - - - THEORETI CAl. SHOCK PRESSURE RECOVER Y~ MEASURED PRESSURE RECOVERY
oo
o·
o·
0 "
o ·
FIG. 51. Pr essure recovery and dra~ at .'of", = 1· 82 (6< = 30 deg}.
.....h,.,"00 "c -s0'
,, - ~ .., ,,,~ •,
1 •, •/~
,,,,• ,
....... --/
/ / \0
\!l.. 6: 6)A
• A. .
0 ,'
0"
0 "
0'50
";'p.
®
'..: .
"", 0o ,c -eo ,0 '
-, " - 30 ·
"-t"j.Z-'·"TAPERED
-, REARCO"
""\----- THEORETI CAL SHOCK PRESSURE RECOV ERY~ toAE AS UR fO PRESSURE RECOVE R'
A. .oo
FIG. 52. Pressure recovery and drag at .\1.. = 1·91 (8~ = 30 deg).
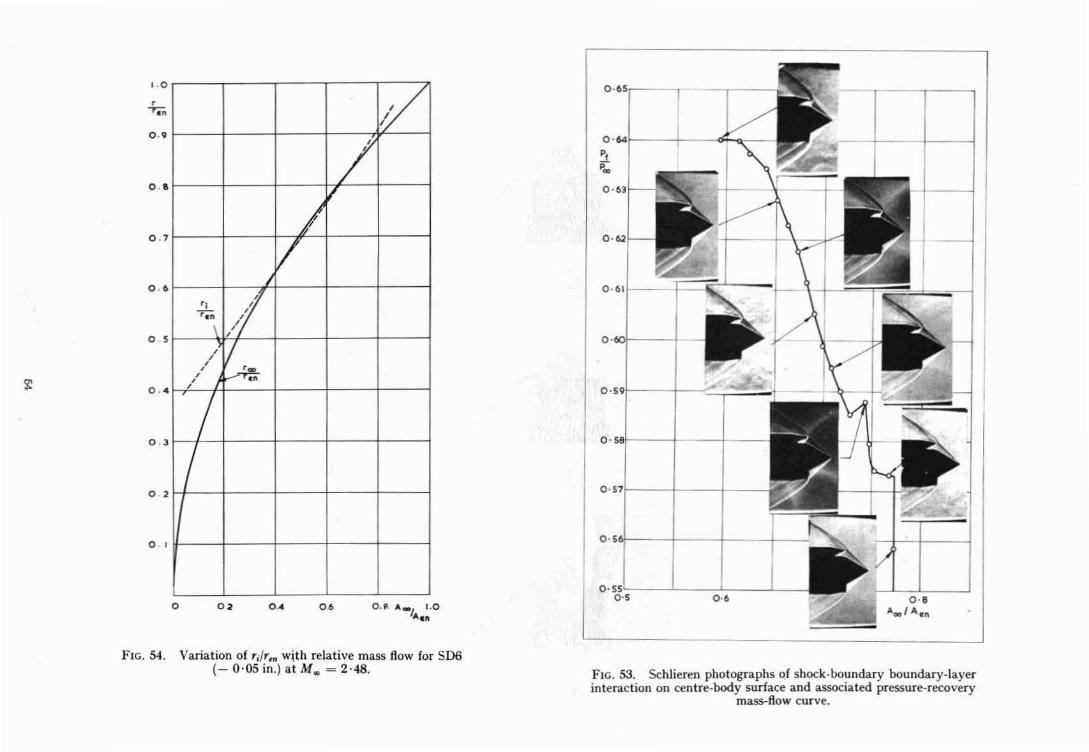
FIG. 54. Variation of r,l'~" with relative mass flow for SD6(- 0 ·05 in.) at M . = 2 ·48.
0 ·'
0 · 63
0.611-- -
0·"
0·001-- --1
o-",1-- -1-- -+
c. '01-----1--+--1-~
o."r--+-~~~:";j
O·ss'--- - L _ -'_ _ -JL_0·'
c -..~---:'--O<C..-
~'.
FIG. 53. Schlieren photographs of shock-boundary boundary-layerinteraction on centre-body surface and associated pressure-recovery
mass-flow curve.
0 . s, "'-/ 1.0' ..0'o.0 'o
,//
J/
r /1r,;;. \ ,,/~ [/
'., ..,,
77
a
,o ·
0 ·'
0 .'
0 · '
0.'
"0
o .
0 · '
0 . '
0 .'
4
'" NOTE:- THESESHOCKS ARE SHOWNEXTENDING SOMEWAY INTO THE FLOWFIELD. VALUESQUOTED ARE FORTHE ANGLE JUST ATTHE INTERSECTIONPOINT.
_'2 NO'SHOCK
2 3STATIC PRESSURE RATIO p/poo
Bg Moo 6~, eO .. B~3:1W,
30 1·82 51· 5 69 - 5 78 ·9
1·86 50-6 65· 8 80·8
1·91 49-6 62· :2 82 . I
2·14 46-2 51 - 5 B6 - 3
2-4B 42·9 41· 3 88 '0
22· 5 I-51 51'4 72' 5 73·9
I· 61 47-9 ~9· 8 80- 5
1·82 43' I 33·33 90·0
15 1-5 I 44·8 86· 98 86·4
1------/-'--1--__1--_----1 Moo'" I·86
Be - 30°
wJ:I-
ol-I- 201---~~I---~~t-~-t-----,-~+--c--+---'->.:----1uw0-inwa: 151---~~t-~~hL-""""",:f--~~+__~-_/_-\-I---1
~~-x~«
z 10f--------h~-t---+__--+__-t__/_---1f________1
o~z:Juz
0·60·50·40·30'20·1o
\I I I
8 =300tTAPERED REAR COWL
~C • PARALLEL REAR COWL
6. -22'/;~ TAPERED REAR COWLC • PARALLEL REAR COWL
\~ \
'~
\\~.
~
~I
Ma>" 1·82 \I!.
I ~AMAx
o-
0·2
0·3
0·4
0'5
C~x
FIG. 55. Comparison of drags obtained with tapered andparallel rear cowls. FIG. 56. Results of 3-shock-intersection calculations.
242218 20161·4
ec=20 0
~_\ --- ---~--
\ -. AooIA~n<,
1------
~ ----- 0'16
\. ---:- 0'365
I"---I---" 0·641:-- __ r--- -I-t- 0'81
0'9025l..--.
1'0
o
(·5
.b.r.n
0'81
0·64
0(36
0-9025
1·8 201·6
M,·:,
1-4,,2
(·0 1---1----'11---'>,,,---1---+--------\
0-51---\--+-----">,,-+----\------1
I .51---1-+-+---+----\-----\
.b.r.n
FIC;. (.,:.!_ Llr"" vs. l1I" for U, == IS deg and 20 deg.
I·Ol--->,.----+~--+---+__---
o 81------t-'r---"'l----+-------I
0'16
0·61---'-.;---+------f"-e---+------10·36
0·4
0·64
020'81
0.902514 1·6 1'8 2·0Ma> 2·2 1·5, , 1'7
11'9
1
2·1
0·25
036
0-49
0·64
0·81
I 09025
2·3 Ma> 2·5,
FH;. 6:~. Lire" vs, M", for Uf = 22·5 c1C'g and 25 deg.
58

3·1 3·3Moo
2'92·52·32·11·9
\
~ 6c = 30 "
r-,-, <,
I----r--- Am/p,en
r-, -........
----- - r--- 0'16
r--- --, --,-0·36
--------<; r--0·64
I--
-----r-. 0·81
0·9025a
1·5
0·6
0·8
0'4
r-o
0·2
'·2...b..ren
FIG. 64. Llr.; vs. Moo for ()c = :30 deg.
1·2
....b....r,n
1·0
0·8
0·6
0-4
1·2
-.<, 6c =35"
~<,
<..,r---<, t---...............----I----<,
-------I------- ---
0·16
0·36
0·64
0·81
0'9025
o1·7 1·9 2·' 2·3 2·5 2·7 3·1 3·3
Moo
FIG. 65. L/ren vs. 211:0 for ()c = :~5 deg.
58

FIG. 71. Pressure recovery through the' third' shock[ (PI P .,J:Jrd shock YS. M", for Oc = IS, 20 and 22 -S degJ.
I -,o SHOCK8
C=22-5°
-,~-.
~a"'l-u _9 ~~ 6oD 2
o0>
o.:.,o
a-o'"f. .
I I I I T TiII
I
IIII
I
I
.~
Iw / /
,\II
0
~x/
00
,/
,
/
1//7I
1//
-
/
,/
I
M/
-
,I
II?I
, II)
,
1/, W, I'
, /-/I
L I I
wa-
tv
."
o_J>
tv
tv
a-
IV
60
w
'"
w<Xl
w
6
IV
~
o
tv
CD
'"
~
a
~ :!:.-- ;:;o 2~~",,::;-,
R ~-c r:'"i :)",,::l~ '")
II SS:.0*''''-~
::lo'"i
:3~ir:::;-'or:;0;-
::0
-..:J::='
:!o
'"'j'"i
'":n~
~'"i
~'")
2~..... '"~. :)
~
~~~ ~ ''''-::
"';:l 0Q..~
~~'")
;::Lc.,;t;:;,~'''''''-:
,,7 I· 6Moo
1'7 1-6
Moo
1-7 J-6Moo
J -6
J • 6
1-6
r -5
r -5
1-5
1-4
'-4
1-4
I- 3
1-3
1-3
I -,SHOCK
-.-.'~
0eC~20
'·0
0-9
1-0
0-9
0- 6
0-9
0-8
(~)3R
(:J3
RD
(:a>t
Q:l~
1-0
0'6
0-6
0-4
0·2
(:Jm ~HOC.
~ :-- "'-
~~~1:::::,
"'" "'"~
eO .................c ......-.,
25 ---1-__
----- 30 --I'---'--- 35
o1·2 \·4 I-e 2'0 2·2 2·6 2·8 3·0
FIG. 72. Pressure recovery through the 'third' shock[(PjP",bdshock vs. M", for ()e = 25, 30 and 35 deg].
41 e~
41·S
41
0'6 f----!---===-+------co..-""f---"""""'''F------f-=--''''--r------T<:..---If::7'''----l-7'''---j---;.,e---+----1
O·61--~~~-oe=::=F--__c_=,...I-'"""=--+----::"'"""'""":::....--j---_"7'F-----_+--/_j---_I_--__I
O·41----t'.,----~""-""""'=__+---_1_---t-=""r---t--1--r_--+--t_l_---_I_--_I
1·0
(A00
Aen n =rI 00
O·21----!---+.;:---_1_--4-+---l--j--_+-l~-j---_I_--_I__I_--_1_--_____1
1·7 1·8 1'9 2'0 2·1 2'3 . 2'4 2·5 2·6 Moo 2'7 2·6
FIG. 73. (A",jAen)r i = r ec vs. M", for ()e = 30 deg.
63

I1
II
2·2 2·3 2·4MACH NUMBER
2·12·01·9
I1
0'1"'I
1'8
O' 2!1-__-+__-\-\h.-!'-=---I--1-l.-__+-__-1- +-l-_-+-+__+-..;-_-++_--I
0·4~__-+y..r-..,-----1"-c_----",-..+ +."....c:.-_-+ H __-+--L__1-+-_-+-l-_--I
0·6\---+""----=::--1----= F-=:-!--__o,£--j----,?---+----1------+----
380·4f----+- --+---+--'>,;;-::-;:--+---+-1---1----1----1----
0·2r----t---+--+-i-+---+-i-----1----+----IL - ----i
1'5 1'6 1·7 I·e ',9 2·0 2,' 2·2 Moo 2·3
64
,
51 50 49 48 47 46 45 4'4 43 4 41'5 41
), ~r::::::=-:t:=---::::::---.>:--- V / /'"
i-- - E:====t==------- /A rl'~.rOO0:::-- - -- ./
~~ -----> .: /-r--. -- /r--...
\"~ --- /<,
\ 41
40
0·8
0·6
0'4
0·2
',0
(A 00
AOOM
1·7 1·8 ,.<) 2·0 2'1 2·2 2·4 2·5 2·6
FIG. 76. (AoolA,.(. max)ri ~ 00 vs, Moo for Be = :,0 dcg.
2·52·2 2·3 2·4MACH NUMBER
2'11'91'8
I II II II II I
\'7
53 52 51 50 49 4e 47 46 4S 44 43
O'--__-'-__!..-JJ.-'---'_.L..L__-'-__---.J'--__-'---'-_--'---'-__.L..--'-_--'-__---'
1'5 1,6
0·21-----I--7"1rl-'----7-t+---_I_---j!-----t--'--_+---7---t_t--+---i
0·6f-----I\-"""~__"I___-.:::>""_<;;:_+_--_I_--____:l,L---_+_:t_.::=:-_+__t_--t_-I--+---'=-_l
0·4f------I---\--\-I--\--\--+--:7""''-t----j----t-t--_+-+---t_t--+---i
FIG. 77. (A."IA"" max)'i = r eo vs. M", for (). = 25 deg.
65
38394047 46 45 44 43 42 41---
~~V -:V:....---," :::::::- ~ -:::-=::~~
-: /
-----: /<, /1\
38
02
06
\·4 1·5 1·6 1·7 1'8 1'9 2'0 2,'
FIG. 78. (AooIA CD max)r i _~ r CD vs. Moe for Oc = 22· 5 dcg.
..
/
~111__-• 1-----LN----I.
rFIG. 79. Notation for location of 'second' shock and calculation of drag
(ri always greater than roo).
(40907) Wt.52 K7 6/59 F, M. & S. PRiNTHD IN GREAT UHITAIN
66

JR. & M. No. 3035
Publication of theAeronautical 'Research I Council
ANNUAL TECHNICAL REPORTS OF THE AIERONAUTICALRESEARCH COUN'CIL (BOUND VOLUM IES)
1939 Vol. I. Aerodynamics General, Performance, Airscrews, Engines. 50S. (52S.)Vol. II. Stability and Control, Flutter and Vibration, Instruments, Structures, Sea-
planes, etc. 63s. (65s.) .1940 Aero and Hydrodynamics, Aerofoils, Airscrews, Engines; Flutter, Icing, Stability and
Control Structures, and a miscellaneous section. 50S. (52S.) .1941 Aero and Hydrodynamics, Aerofoils, Airscrews, Engines, Flutter, Stability and Con-
trol Structures. 63s. (65s.) .1942 Vol. I. Aero and Hydrodynamics, Aerofoils, Airscrews, Engines. 75s. (77s.)
Vol. II. Noise, Parachutes, Stability and Control, Structures, Vibration, WindTunnels. 47s. 6d. (49s. 6d.)
1943 Vol. I. Aerodynamics, Aerofoils, Airscrews. 80S. (82S.)Vol. II. Engines, Flutter, Materials, Parachutes, Performance, Stability and Con
trol, Structures. 90S. (92S. 9d.)1944 Vol. I. Aero and Hydrodynamics, Aerofoils, Aircraft, Airscrews, Controls. 84s.
(86s.6d.)Vol. II. Flutter and Vibration, Materials, Miscellaneous, Navigation, Parachutes,
Performance, Plates and Panels, Stability, Structures, Test Equipment,Wind Tunnels. 84s. (86s. 6d.)
1945 Vol. 1. Aero and Hydrodynamics, Aerofoils. I30s. (I32S. gd.)Vol. II. Aircraft, Airscrews, Controls. I30s. (I32S. 9d.)Vol. III. Flutter and Vibration, Instruments, Miscellaneous, Parachutes, Plates and
Panels, Propulsion. I30s. (I32S. 6d.)Vol. IV. Stability, Structures, Wind Tunnels, Wind Tunnel Technique. I30S.
(I32S. 6d.)
Am11LUd Reports of the Aeronautical Research COWlCU-1937 2S. (2S. zd.) 1938 IS. 6d. (IS. 8d.) 1939-48 3s. (3s. 5d.)
Index: to all Reports and Memoranda published in the AnnualTechnical Reports, and separately-s- :
April, 1950 R. & M. 26<Jo 2S. 6d. (2S. IOd.)
Author Index to all Reports and Memoralllld~ of the Aeaonautica!Research Council-« .
1909-January, 1954 R. & M. No.' 2570 I5S. (I5S. 8d.) .
Indexes to the Technical Reports of the Aieronautical ResearchCouncll->
December I, 1936-June 30, 1939 R. & M. No. 1850 IS. 3d. (IS. 5d.)July I, 1939-June 30, 1945 R. & M. .tiro. 1950 IS. (IS. 2d.)July I, 1945-June 30, 1946 R. & M. No. 2050 IS. (IS. 2ci.)July I, I946-December 31, 1946 R. & M. No. 2150 IS. 3d. (IS. sci.)January I, 1947-June 30, 1947 R. & M. No. 2250 IS. 3d. (IS. 5d.)
Published Reports and Memoranda of the Aeronautical ResearchCOUDCiJl-
Between Nos. 2251-2349 R. & M. N.). 2350 IS. 9d. (IS. tId.)Between Nos. 2351-2449 R. & M. No. 2450 2S. (2S. 2d.).Between Nos. 2451-2549 R. & M. No. 2550 2S. 6d. (2S. tool.)Between Nos. 2551-2649 R. & M. No. 2650 2S. 6d. (2S. tod.)Between Nos. 2651-2749 R. & M. No, 2750 2s.6d. (2S. roz.)
Prices in brackets include postage i
HER MAJESTY'S STATIONERjY OFFICEYork House, Kingsway, London W.C.2; 423 Oxford Street, London w.i, 13a Castle Street, Edinburgh 2;39 King Street, Manchester 2; 2 Edmund Street, Birmingham 3·; 109 St. Mary Street, Cardiff;
Tower Lane, Bristol, I ; 80 Chichester Street, Belfast, or tfU'oltgh any bookseller.
8.0. Code No. 23-3035
R. & M. No. 3035