the etiology of hematologic malignancies in children and
TRANSCRIPT
The etiology of hematologic malignancies in children and adolescents: Pre- and postnatal factors
A DISSERTATION SUBMITTED TO THE FACULTY OF THE GRADUATE SCHOOL
OF THE UNIVERSITY OF MINNESOTA BY
Amy Marie DeVries Linabery
IN PARTIAL FULFILLMENT OF THE REQUIREMENTS FOR THE DEGREE OF
DOCTOR OF PHILOSOPHY
Julie A. Ross
March 2010

© Amy M. Linabery 2010

i
Acknowledgements
This body of work would not have been possible without the contributions of
many, many people. First, I thank my dissertation committee, Drs. Sue Duval, James
Pankow, and Logan Spector, for their time, careful review, and thoughtful feedback on
these projects. I would like to extend a special thank you to my advisor, Dr. Julie Ross,
who has provided a great deal of guidance and support, and numerous opportunities over
the past 6 years. Although I doubt that I can ever repay you in kind, I aspire to establish a
research program of the highest caliber (such as the one I have been trained in) and to
offer the same level of support to other students down the line.
With respect to the FROGS Study, I thank Julie Ross for the wonderful project,
Megan Slater for her tireless and very capable study coordination efforts, as well as
Michelle Roesler, Colleen Geary Carter, Jan Reimer, Israel Pinner, Tim Weaver, and
Ginny Oie, who each assisted in data collection efforts, and Logan Spector, who laid the
groundwork for this project in his 2006 survey of state newborn screening programs. I am
grateful to the subjects that took the time and the leap of faith to participate in the study. I
appreciate the participating Children’s Oncology Group (COG) institutions, including:
Cancer Research Center of Hawaii, Honolulu, HI; Children’s Hospitals and Clinics of
Minnesota, Minneapolis, MN; Children’s Medical Center, Dayton, OH; Connecticut
Children’s Medical Center, Hartford, CT; Dartmouth-Hitchcock Medical Center,
Lebanon, NH; Driscoll Children’s Hospital, Corpus Christi, TX; East Tennessee
Children’s Hospital, Knoxville, TN; Hackensack University Medical Center,
Hackensack, NJ; Lutheran General Children’s Medical Center, Park Ridge, IL; Michigan

ii
State University, Lansing, MI; Miller Children’s Hospital/Harbor-UCLA, Long Beach,
CA; Mission Hospitals, Asheville, NC; New York University Medical Center, New York,
NY; Primary Children’s Medical Center, Salt Lake City, UT; St. Christopher’s Hospital
for Children, Philadelphia, PA; The Children’s Hospital of Southwest Florida, Lee
Memorial Health System, Fort Myers, FL; University of Florida, Gainesville, FL;
University of Texas Health Science Center at San Antonio, San Antonio, TX; and
University of Vermont College of Medicine, Burlington, VT. I also extend a sincere
thanks to the state newborn screening program contacts that provided helpful information
regarding state NBS policies and/or assistance in obtaining NBS. Importantly, the
FROGS Study was supported by National Institutes of Health (NIH) grants T32
CA099936, U10 CA13539, and U10 CA98543, and a grant from the Children’s Cancer
Research Fund, Minneapolis, MN.
On the Epidemiology of Infant Leukemia Study, I thank Julie Ross for the
opportunity to coordinate this study; Michelle Roesler for the on-the-job training with
regard to coordinating COG studies, for her institutional memory, and for her incredible
devotion to “getting it right;” as well as the other individuals who made the study a
success, such as Angela Smit, Megan Chang, Erica Langer, and A.J. Hooten; and Drs.
Nyla Heerema, Joanne Hilden, and Stella Davies for their MLL reviews. I thank the
participants who so graciously provided both a figurative (i.e., personal information) and
a literal (i.e., biospecimens) part of themselves for this study. Finally, I acknowledge the
many COG institutions across the U.S. and Canada that participated in either phase of the
study, with a special acknowledgment of the hardworking clinical research associates

iii
(CRAs) who submitted the Institutional Review Board applications and approached
families regarding the study. The Epidemiology of Infant Leukemia Study was supported
by NIH Grants R01 CA75169, T32 CA099936, U10 CA13539, and U10 CA98543, and
the Children’s Cancer Research Fund.
With regard to the meta-analysis, I must thank Dr. Anne Jurek for her careful
review of the many abstracts generated in the literature search and abstraction of included
studies, and Sue Duval for her guidance in meta-analytic techniques. I am also
appreciative of all of the pediatric cancer experts who kindly responded to my requests
for information, including Patricia A. Buffler, Greta R. Bunin, Sven Cnattingius, Henrik
Hjalgrim, Claire Infante-Rivard, Xiaomei Ma, Martha S. Linet, Mary L. McBride,
Patricia A. McKinney, Rachel L. Miller, Elizabeth Milne, Beth A. Mueller, Andrew F.
Olshan, Frederica P. Perera, Eleni Petridou, Peggy Reynolds, Paula F. Rosenbaum,
Joachim Schüz, Xiao Ou Shu, Karin C. Söderberg, Logan G. Spector, and Wei Zheng.
The meta-analysis was supported by NIH grant T32 CA099936 and the Children’s
Cancer Research Fund.
I am indebted to the other PhD trainees in pediatric cancer epidemiology who
have travelled this journey with me (Kim Johnson, Cindy Blair, and Susan Puumala) for
the support, the humor, and for the thoughtful consideration of all matters great and
trivial. I look forward to many years of friendship and collegiality.
Finally, I would be remiss if I did not acknowledge my husband, Matt, for his
enthusiastic and devoted support of me in pursuit of this training. He has contributed to
my success on a daily basis and I will be forever grateful for that. And my children, Peter

iv
and Sadie, (two of my other “collaborations” during this degree program) have added
balance and joy to my educational experience (and my life) and have enhanced the depth
of my understanding of just how devastating a cancer diagnosis in one’s child would be.

v
Dedication
This dissertation is dedicated to all of the infants, children, and adolescents who
are dealt the blow of a cancer diagnosis and to their families and caretakers. May you
prevail and find some comfort in knowing that others are working to identify the causes
of and ultimately to prevent these devastating and debilitating diseases.

vi
Abstract
Little is known about the etiology of most pediatric hematologic malignancies,
although there is evidence for prenatal initiation of leukemogenesis for many cases. The
current body of research, a series of three complementary studies, evaluated the potential
for unbiased measurement of prenatal exposures through retrieval of existing
biospecimens and examined associations between pre- and postnatal exposures and
pediatric/adolescent leukemia.
The first study assessed the feasibility of retrospective collection of residual
neonatal blood spots (NBS) for 947 childhood/adolescent leukemia and lymphoma cases
from state newborn screening programs nationwide. Biological mothers were also asked
to complete self-administered questionnaires regarding prenatal exposures, personal and
family history of atopic disease, and selected demographic factors. Overall, 37% of
families provided consent for NBS release and 41% of mothers completed questionnaires.
Consenting cases were born in 39 states and 46 NBS were obtained from 5 states (CA,
NY, MI, TX, and WA). NBS storage/release policies are rapidly evolving; requests are
pending in states involved in litigation (MN), reviewing policies (NJ), and reviewing this
study (MA). Currently, population-based NBS studies can be conducted in a limited
number of states; fortunately, most of these have large populations to provide reasonable
pediatric case and control groups.
In the second study, the largest of its kind, the association between self-reported
prenatal vitamin supplementation and infant leukemia was examined, since folic acid is
postulated to play a preventative role in the pathogenesis of childhood leukemia,

vii
particularly among ALL cases. After adjustment for race/ethnicity and income, there was
little evidence supporting associations between periconceptional vitamin use (OR = 0.89,
95% CI: 0.64-1.24), use after knowledge of pregnancy (OR = 0.78, 95% CI: 0.48-1.28),
or use in all periods (OR = 0.84, 95% CI: 0.62-1.14) and infant leukemia. These results
may be attributable to high rates of folic acid supplementation in the study population,
including personal vitamin use and national folic acid fortification programs implemented
in the U.S. and Canada early in the study period.
Atopic disease is hypothesized to be protective for several malignancies. In the
third study, meta-analysis was performed to summarize and quantify the risk of acute
leukemia associated with atopic disease in children and adolescents and to identify
sources of heterogeneity in the existing literature. Inverse associations were observed for
ALL and atopy overall (OR = 0.69, 95% CI: 0.54-0.89)), and for asthma (OR = 0.79,
95% CI: 0.61-1.02), eczema (OR = 0.74, 95% CI: 0.58-0.96), and hay fever (OR = 0.55,
95% CI: 0.46-0.66) examined separately. ORs for ALL differed across strata of study
design, exposure data source, and latency period, indicating these factors impact study
results. Although these results should be interpreted cautiously given the modest number
of studies, substantial heterogeneity, and potential exposure misclassification, they are
useful in designing future research.
viii
Table of Contents
Acknowledgements ............................................................................................................ i Dedication .......................................................................................................................... v Abstract............................................................................................................................. vi Table of Contents ........................................................................................................... viii List of Tables ................................................................................................................... xii List of Figures................................................................................................................. xiv List of Abbreviations ..................................................................................................... xvi Chapter 1: Overview of hematologic malignancies in children/adolescents .................... 1 Chapter 2: Review of the literature for the Feasibility of Retrospectively Obtaining
Guthrie Spots (FROGS) Study............................................................................................ 6
Descriptive epidemiology ............................................................................................... 6
Children’s Oncology Group............................................................................................ 6
What are neonatal blood spots (NBS)?........................................................................... 8
Significance of NBS ..................................................................................................... 11
Factors influencing NBS retrieval ................................................................................ 12
NBS storage conditions................................................................................................. 14
Etiologic factors of interest........................................................................................... 16
Significance of the research .......................................................................................... 22
Chapter 3: Feasibility of obtaining neonatal blood spots for childhood cancer cases: A
Children’s Oncology Group study .................................................................................... 24
Introduction................................................................................................................... 25
Methods......................................................................................................................... 26
Statistical analysis .................................................................................................... 29
Results........................................................................................................................... 29
Discussion..................................................................................................................... 45

ix
Chapter 4: Review of the literature on infant leukemia, folic acid supplementation, and
genes related to folic acid metabolism.............................................................................. 51
Infant leukemia ............................................................................................................. 51
Folate metabolism......................................................................................................... 52
Review of literature on vitamins, folate, iron supplementation, and childhood leukemia
....................................................................................................................................... 57
Review of the literature regarding SNPs in the folate metabolism pathway and
childhood leukemia....................................................................................................... 60
Possible mechanisms of leukemogenesis...................................................................... 69
Iron supplementation and leukemogenesis ................................................................... 73
Theoretical model of causation..................................................................................... 73
Significance of the research .......................................................................................... 79
Chapter 5: Maternal vitamin and iron supplementation and risk of infant leukemia: A
report from the Children’s Oncology Group .................................................................... 81
Introduction................................................................................................................... 82
Methods......................................................................................................................... 83
Participant eligibility/identification.......................................................................... 83
Data collection.......................................................................................................... 85
Statistical methods .................................................................................................... 86
Results........................................................................................................................... 87
Discussion..................................................................................................................... 98
Chapter 6: Review of the literature regarding the association between childhood and
adolescent leukemia and atopic disease.......................................................................... 106
Childhood/adolescent leukemia .................................................................................. 106
Atopy........................................................................................................................... 107
Possible biological mechanisms linking atopic disease and childhood leukemia ...... 111
Identified studies of the atopy-leukemia association .................................................. 115
Theoretical model of causation................................................................................... 119

x
Significance of the research ........................................................................................ 124
Chapter 7: The association between atopy and childhood/adolescent leukemia: A meta-
analysis............................................................................................................................ 126
Introduction................................................................................................................. 127
Methods....................................................................................................................... 128
Study identification and selection ........................................................................... 128
Data extraction ....................................................................................................... 129
Statistical methods .................................................................................................. 130
Results......................................................................................................................... 131
Discussion................................................................................................................... 154
Chapter 8: Conclusions ................................................................................................. 161 Bibliography .................................................................................................................. 164 Appendix A. Children’s Oncology Group Institutions participating in AADM01P1 Pilot
study................................................................................................................................ 191
Appendix B. NCCLS procedure for the collection of NBS........................................... 192 Appendix C. Examples of analytes that have been extracted from dried blood spots... 193 Appendix D. FROGS Study self-administered paper questionnaire for mothers .......... 194 Appendix E. FROGS Study forms and ancillary materials ........................................... 226 Appendix F. FROGS Study letters of approval ............................................................. 244 Appendix G. Response rates for the questionnaire, written consent and assent, and adult
contact information forms, and NBS retrieval rates overall and by age at diagnosis, year
of birth, and years since diagnosis. ................................................................................. 254
Appendix H. Studies examining prenatal vitamin and/or iron supplementation and
childhood leukemia......................................................................................................... 258

xi
Appendix I. Questionnaire items regarding prenatal vitamin and iron supplementation
......................................................................................................................................... 268
Appendix J. Prevalence of atopic disease among children and adolescents ................. 270 Appendix K. International experts surveyed to request any other relevant published or
unpublished results.......................................................................................................... 271
Appendix L. Meta-analysis data abstraction form......................................................... 275 Appendix M. Results of cumulative meta-analysis for A) leukemia overall and atopy or
allergies, B) ALL and atopy or allergies, C) ALL and asthma, D) ALL and eczema, E)
AML and asthma............................................................................................................. 278
Appendix N. Results of influential analysis for A) leukemia overall and atopy or
allergies, B) ALL and atopy or allergies, C) ALL and asthma, D) ALL and eczema, E)
AML and atopy or allergies, F) AML and asthma.......................................................... 284

xii
List of Tables
Table 3-1. Characteristics of 947 eligible pediatric hematologic cancer cases…….....
33
Table 3-2. Frequencies, response rates, and results from univariate logistic
regression models for the questionnaire, consent, assent, child contact information
request, and NBS retrieval, overall and by initial contact, language, age at diagnosis,
year of birth, years since diagnosis and vital status…………………………………...
34
Table 3-3. Neonatal dried blood spot retention and release policies for queried
states…………………………………………………………………………………...
38
Table 5-1. Selected characteristics of 443 infant leukemia cases and 324 controls
and associations with leukemia………………………………………………………..
90
Table 5-2. Association between vitamin use and infant leukemia……………………
92
Table 5-3. Association between vitamin use and infant leukemia by MLL gene
status…………………………………………………………………………………...
94
Table 7-1. Characteristics of 10 Case-control Studies Included in the Meta-analysis
of the Atopy-Leukemia Association…………………………………………………..
135
Table 7-2. Distribution of Factors Related to Quality in the 10 Case-control Studies
Included in the Meta-analysis of the Atopy-Leukemia Association…………………..
139
Table 7-3. Description of Case-control Studies Excluded from the Meta-Analysis of
the Atopy-Leukemia Association.……………………………………………………..
140
Appendix A. Children’s Oncology Group Institutions participating in AADM01P1
Pilot study…………………………………………………………………………….. 191

xiii
Appendix C. Examples of analytes that have been extracted from dried blood
spots…………………………………………………………………………………
193
Appendix G. Response rates for the questionnaire, written consent and assent, and
adult contact information forms, and NBS retrieval rates overall and by age at
diagnosis, year of birth, and years since diagnosis………………..………………...
254
Appendix H. Studies examining prenatal vitamin and/or iron supplementation and
childhood leukemia……………………………………………………………….....
258
Appendix J. Prevalence of atopic disease among children and adolescents……......
270
Appendix K. International experts surveyed to request any other relevant
published or unpublished results………………………………………………….....
271

xiv
List of Figures
Figure 1-1. Theoretical model for the development of childhood hematologic
malignancies…………………………………………………………………………
3
Figure 2-1. Guthrie card used by the Michigan Department of Community Health
newborn screening program…………………………………………………………
9
Figure 4-1. Diagram of the folate metabolism pathway…………………………….
56
Figure 4-2. Proposed mechanism for the development of MLL+ infant leukemia…
71
Figure 4-3. Directed acyclic graph depicting the hypothesized association between
folic acid consumption and infant leukemia………………..……………………….
74
Figure 6-1. Diagram of the atopic response to environmental allergens……..…….
108
Figure 6-2. Directed acyclic graph depicting the hypothesized association between
atopy and childhood leukemia……………………………..………………………..
119
Figure 7-1. Flow diagram of the search strategy and study selection process...……
143
Figure 7-2. Study-specific and random effects summary odds ratios (ORs) and
95% confidence intervals (CIs) for the associations between leukemia overall,
acute lymphoblastic leukemia (ALL), and acute myeloid leukemia (AML) and A)
atopy or allergies, B) asthma, C) eczema, D) hay fever, and E) hives……………...
144

xv
Figure 7-3. Random effects summary odds ratios (ORs) and 95% confidence
intervals (CIs) upon stratification by quality-related factors for the association
between acute lymphoblastic leukemia (ALL) and A) atopy or allergies, B)
asthma, and C) eczema……………………………………..………………………..
150
Appendix M. Results of cumulative meta-analysis for A) leukemia overall and
atopy or allergies, B) ALL and atopy or allergies, C) ALL and asthma, D) ALL
and eczema, E) AML and asthma…………………………………………………...
278
Appendix N. Results of influential analysis for A) leukemia overall and atopy or
allergies, B) ALL and atopy or allergies, C) ALL and asthma, D) ALL and
eczema, E) AML and atopy or allergies, F) AML and asthma………….…………..
284

xvi
List of Abbreviations
ALL acute lymphoblastic leukemia
AML acute myeloid leukemia
ANLL acute non-lymphoblastic leukemia
APC average annual percent change
ART assisted reproductive technology
BDNF brain-derived neurotrophic factor
BHMT betaine-homocysteine methyltransferase
BMI body mass index
bp base pair
cALL common acute lymphoblastic leukemia
CBS cystathionine-β-synthase
CCG Children's Cancer Group
CCRN Childhood Cancer Research Network
CDC Centers for Disease Control and Prevention
CI confidence interval
COG Children's Oncology Group
CPRC Cancer Protocol Review Committee
CRP C-reactive protein
CSLI Clinical and Laboratory Standards Institute
DAG directed acyclic graph
DHFR dihydrofolate reductase
DHMH Department of Health and Mental Hygiene
DNA Deoxyribonucleic acid
DSB double strand break
dUMP deoxyuridine monophosphate
EBV Epstein-Barr Virus
FE fixed effects
FISH fluorescent in situ hybridization

xvii
FROGS Feasibility of Retrospectively Obtaining Guthrie Spots
HAMP hepcidin antimicrobial peptide
HFE hereditary hemochromatosis gene
HL Hodgkin lymphoma
HLA human leukocyte antigen
HMO health maintenance organization
HR homologous recombination
ICD-O International Classification of Diseases for Oncology
IFN interferon
IgE immunoglobulin E
IGF insulin-like growth factor
IL interleukin
IRB institutional review board
IRR incidence rate ratio
ISAAC International Study of Asthma and Allergies in Childhood
MeSH medical subject headings
MLL mixed lineage leukemia
MMP matrix metalloproteinase
MTHFD1 5,10-methylenetetrahydrofolate dehydrogenase
MTHFR 5,10-methylenetetrahydrofolate reductase
MTR 5-methyltetrahydrofolate-homocysteine methyltransferase
MTRR 5-methylenetetrahydrafolate-homocysteine methyltransferase reductase
NA not available
NBS neonatal blood spot
NCCLS National Committee on Clinical Laboratory Standards
NHANES National Health and Nutrition Examination Survey
NHEJ non-homologous end joining
NHIS National Health Interview Survey
NHL non-Hodgkin lymphoma

xviii
NIH National Institutes of Health
NNMT nicotinamide N-methyltransferase
NNSIS National Newborn Screening Information System
NT neurotrophin
NTD neural tube defect
OR odds ratio
PKU phenylketonuria
PON1 paraoxonase 1
PRAMS Pregnancy Risk Assessment Monitoring System
RDD random digit dialing
RE random effects
RFC1 reduced folate carrier
RR rate ratio
RT-PCR reverse transcription polymerase chain reaction
SAM S-adenosylmethionine
SE standard error
SEER Surveillance, Epidemiology, and End Results
SES socioeconomic status
SHMT1 hydroxymethyltransferase
SLC19A1 solute carrier family 19 member 1
SNP single nucleotide polymorphism
SSB single strand break
TCN2 transcobalamin II
Th1 T helper 1 cell
Th2 T helper 2 cell
TMP thymidine monophosphate
TNF tumor necrosis factor
TREM triggering receptor expressed on myeloid cells
TSH thyroid stimulating hormone

xix
TYMS thymidylate synthase
UKCCS United Kingdom Childhood Cancer Study
UTR untranslated region

1
Chapter 1: Overview of hematologic malignancies in children/adolescents
Childhood cancers are the leading cause of disease-related mortality among those
aged 1-19 years.1 The American Cancer Society estimated that 10,730 U.S. children ages
0-14 years would develop cancer in 2009 and 1,380 children would die of the disease.2
Leukemia is the most common childhood malignancy, with an estimated annual
incidence of 42 cases per 1,000,000 persons for those diagnosed at ages 0-19 years; the
incidence has been increasing in recent years (average annual percent change 1992-2004:
0.7%; 95% confidence interval: -0.1-1.5%)3 Childhood lymphomas are the third most
common malignancy (22 cases/1,000,000 persons)3 following tumors of the central
nervous system; however, relatively little research has been dedicated to the study of the
determinants of childhood lymphoma. These hematologic cancers may share similar
etiologic factors, particularly T-cell acute lymphoblastic leukemia (ALL) and non-
Hodgkin lymphoma (NHL), which have identical histologies.4
There is important evidence in support of an in utero initiation of most childhood
leukemias. One significant line of evidence establishing the prenatal origins of leukemia
has been the detection of common chromosomal translocations present in neonatal blood
spots (NBS) collected at birth from affected children, including t(4;11) (MLL-AF4) in
infant ALL cases,5 t(12;21) (TEL-AML1) in ALL in children diagnosed at 2-5 years, and
t(8;21) (AML1-ETO) in childhood acute myeloid leukemia (AML) cases.6 These
translocations may constitute a first genetic hit in a multistep pathway,6 which may
involve subsequent hits resulting from exposure to endogenous or exogeneous factors. Of
note, TEL-AML1 translocations have been reported at a rate of 1% in a series of cord

2
blood samples, which is 200-fold greater than the rate of leukemia in the general U.K.
population,7 supporting a multifactorial model of causation. The researchers further
estimate that if all pediatric preleukemic genetic insults were surveyed, they would
cumulatively be detected in approximately 5% of children.7 Other compelling evidence
includes the results of twin studies, indicating nearly complete concordance for infant
leukemia among monochorionic monozygotic twins (~100%) and a concordance rate of
~10% among older children and adolescents,8 which is much greater than would be
expected by chance.
Knudson originally presented the concept of a two-step model for carcinogenesis
with respect to childhood retinoblastoma in 1971.9 Greaves adapted this model to
pediatric leukemia and suggested a minimum of two hits, one occurring prenatally and
the other after birth, are required for leukemic transformation.8 A proposed multi-step
model for pediatric leukemogenesis is depicted in Figure 1-1 below. An in utero genetic
event, such as an MLL rearrangement in infant leukemia, another chromosomal
translocation (t(12;21) or t(8;21), for example), or hyperdiploidy may constitute the first
hit.10 In the case of a two-hit model, only one additional mutation in a hematopoietic cell
is required for leukemia development. Environmental exposures (yet to be identified, see
below) may play a role in leukemogenesis as additional ‘hits’.

3
The etiology of acute leukemia is likely attributable to an underlying genetic
susceptibility coupled with endogenous or exogenous exposures. Greaves’ Hypothesis,
for example, postulates that at least 2 spontaneous mutations are involved in
leukemogenesis of common B-cell ALL occurring in early childhood.11 According to
Greaves, the first genetic mutation occurs randomly in utero as a result of the high rate of
precursor B cell proliferation and the second occurs postnatally, due to an abnormal
response to delayed exposure to a common infectious agent resulting in increased
precursor B cell proliferation.11, 12 He suggests that other immune-related factors, such as
breastfeeding, exposure to infectious agents during infancy (via older siblings, crowding,
daycare attendance, or lack of hygiene), vaccinations, and HLA type (or other genetic
factors affecting susceptibility), may modulate this relationship 11, 12
There are few established causal factors for pediatric hematologic malignancies.4
Risk factors for childhood leukemia include predisposing genetic conditions, such as
Down syndrome (OR ~10-20),13 neurofibromatosis type I,14 and Fanconi anemia;15
exposure to in utero (RR ~ 1.4)16 or postnatal therapeutic irradiation;17-19 and exposure to
TimeBirth
Chromosomal translocationHyperdiploidy Genetic mutations/aberrations
Exogeneous/endogenous insultGenetic susceptibility Environmental insults
Genetic instability
Figure 1-1. Theoretical model for the development of childhood hematologic

4
chemotherapeutic agents, such as alkylating agents20 or epidopophyllotoxins.21, 22 There
is also reasonable evidence for an association with high birthweight,23 although the
underlying mechanism is yet to be unveiled.
Relatively little research has been dedicated to the study of the determinants of
childhood lymphoma; the only established risk factor for Hodgkin lymphoma (HL) is a
family history of HL24, 25 and for NHL, the known risk factor is immune deficiency, such
as that due to therapeutic immune suppression,26 acquired immune deficiency syndrome
(AIDS),27 or congenital immunodeficiency syndromes (e.g., ataxia telangiectasia).28
There is convincing evidence for infection with Epstein-Barr virus (EBV) as an
underlying cause of both diseases,29, 30 although EBV infection likely accounts for a small
proportion of cases in the United States.
Factors warranting further investigation include in utero exposure to vitamins
(folic acid),31 alcohol,32 and tobacco smoke,32 maternal use of fertility or other hormone
treatments,33 and a personal or family history of atopic disease.34-38 These exposures were
explored in the current body of research, a series of three complementary studies. The
first study examined the feasibility of retrospective collection of residual neonatal blood
spots for childhood cancer patients on a nationwide basis. These blood spots are of
interest because they may provide a unique opportunity for the unbiased measurement of
in utero exposures. In the second study, the association between prenatal vitamin
supplementation, as measured via maternal self-report, and infant leukemia was
examined, since folic acid is postulated to play a preventative role in the pathogenesis of
childhood leukemia, particularly among ALL cases.39-42 The third study is a meta-

5
analysis with the purpose of summarizing and quantifying the risk of acute childhood
leukemia associated with atopic disease. Five of six previously identified studies
suggested an inverse association between any atopy and childhood ALL, for example.34-
38, 43

6
Chapter 2: Review of the literature for the Feasibility of Retrospectively Obtaining
Guthrie Spots (FROGS) Study
Descriptive epidemiology
Pediatric hematologic malignancies, although rare, comprise a substantial
proportion of childhood morbidity and mortality. Childhood leukemia is the most
common malignancy among children ages 0-19 years, with an estimated annual incidence
of 42 cases per 1,000,000 persons; the incidence has been increasing in recent years
(average annual percent change (APC)1992-2004: 0.7%, 95% confidence interval (CI): -0.1-
1.5%).3 Childhood lymphomas, including Hodgkin lymphoma (HL) and non-Hodgkin
lymphoma (NHL), collectively represent the third most common malignancy (11.7
cases/1,000,000 persons and 10.4 cases/1,000,000 persons, respectively); the rate of
NHL also appears to be rising over time (APC1992-2004: 1.4%, 95% CI: -0.1-3.0%).3 These
hematologic cancers may share similar etiologic factors, particularly T-cell acute
lymphoblastic leukemia (ALL) and NHL, which have identical histologies.4
Children’s Oncology Group
The rarity of childhood cancers necessitates a cooperative, multi-center approach
to research. The Children’s Oncology Group (COG) is a cooperative trials group
consisting of 220 institutions in the U.S., Canada, Australia, New Zealand, Switzerland,
and the Netherlands; the majority (87%) of these are U.S. Institutions. An estimated 85%
of childhood and 44% of adolescent leukemia cases and 70% of childhood and 27% of
adolescent lymphoma patients are registered with COG in the U.S.44 COG and its

7
predecessors (Children’s Cancer Group (CCG) and Pediatric Oncology Group (POG))
have been credited with many therapeutic advances in pediatric oncology, owing to the
conduct of Phase III randomized trials, which allow the safety and efficacy of novel
therapeutic modalities to be investigated in reference to standard treatments on a larger
scale than would otherwise be feasible. Oversight of these studies permits gatekeeping,
such that successful therapies are retained and those deemed ineffective or harmful are
abandoned, ultimately leading to better outcomes for affected patient populations.45
The COG Epidemiology Steering Committee is responsible for the conduct of
many of the largest etiologic studies of pediatric malignancies in North America.46 The
committee was also instrumental in the implementation of the Childhood Cancer
Research Network (CCRN) on December 24, 2007, which should prove a nearly
population-based childhood cancer registry in the U.S.47 Participating COG institutions
are required to approach/inform all parents of childhood cancer patients about the CCRN,
regardless of their participation in clinical trials. Parents (and children ages ≥18 years) are
asked to choose one of three participation levels: (1) no participation (information
compliant with the Health Insurance Portability and Accountability Act is collected), (2)
registration with CCRN, including personal identifiers, but no future contact regarding
future COG-approved non-therapeutic studies, or (3) registration with CCRN and
agreement to future contact.
The current study utilized the dataset assembled in COG AADM01P1 - Protocol
for Registration and Consent to the Childhood Cancer Research Network (CCRN): A
Limited Institution Pilot (Principal Investigator: J. Ross) for identification of potential

8
participants. Through supplemental funds to the COG Chairman’s grant, this pilot
protocol (AADM01P1) was developed and activated at a 10% (n = 23; see Appendix A)
random sample of COG institutions in North America.47 The protocol was opened on
May 1, 2001, and by March 2002 all 23 institutions had obtained IRB approval to enroll
patients. The protocol involved two upfront consents for parents (and children, if age
eligible). The first consent allowed name and contact information to be released to the
COG registration system. In addition to this first consent, the second consent involved
agreement to be potentially contacted in the future to consider taking part in a non-
therapeutic study. These future studies would then be separately consented by the
investigators conducting the study. As of January 19, 2007 (pilot study close), 2,233
individuals among the 23 institutions were approached. Of these, 2,136 (96%) agreed to
both levels of consent, while 70 (3%) agreed to release of name and contact information
only. Only 27 (1%) refused both consent levels.
What are neonatal blood spots (NBS)?
The concept of neonatal blood spot screening was introduced by Dr. Robert
Guthrie in the 1960s.48 Dr. Guthrie advocated that neonatal blood could be collected from
heelsticks, spotted uniformly onto heavy, absorbent filter paper, dried, and subsequently
tested for phenylketonuria (PKU), the most well-known of the inborn errors of
metabolism, on a population scale.48 The filter paper forms currently used in the
collection of dried blood spots are commonly called “Guthrie cards” and the NBS are
also termed “Guthrie spots” in recognition of their earliest proponent. A diagram of a
Guthrie card used by the state of Michigan is shown in Figure 2-1 below.

9
Figure 2-1. Guthrie card used by the Michigan Department of Community Health
newborn screening program.49
Today, over 40 years after the initial introduction by Guthrie, blood spots are
collected from a vast majority of neonates (>95%)50 in the U.S. according to a standard
protocol51 to test for a panel of inborn errors of metabolism. The former National
Committee on Clinical Laboratory Standards (NCCLS, now the Clinical and Laboratory
Standards Institute, CLSI) developed the widely accepted standard procedure for the
collection of NBS.51 The protocol is summarized in Appendix B. In 2008, approximately
half of the NBS samples were obtained within 24-48 hours of birth, while an additional
34% were tested between days 3-7, and 3% were tested after day 7.52 (The timeframe for
testing was unknown for 13% of samples in the National Newborn Screening Information
10
System Database.52 Of note, these data are incomplete and there are some redundancies
because some states require multiple draws per individual.)
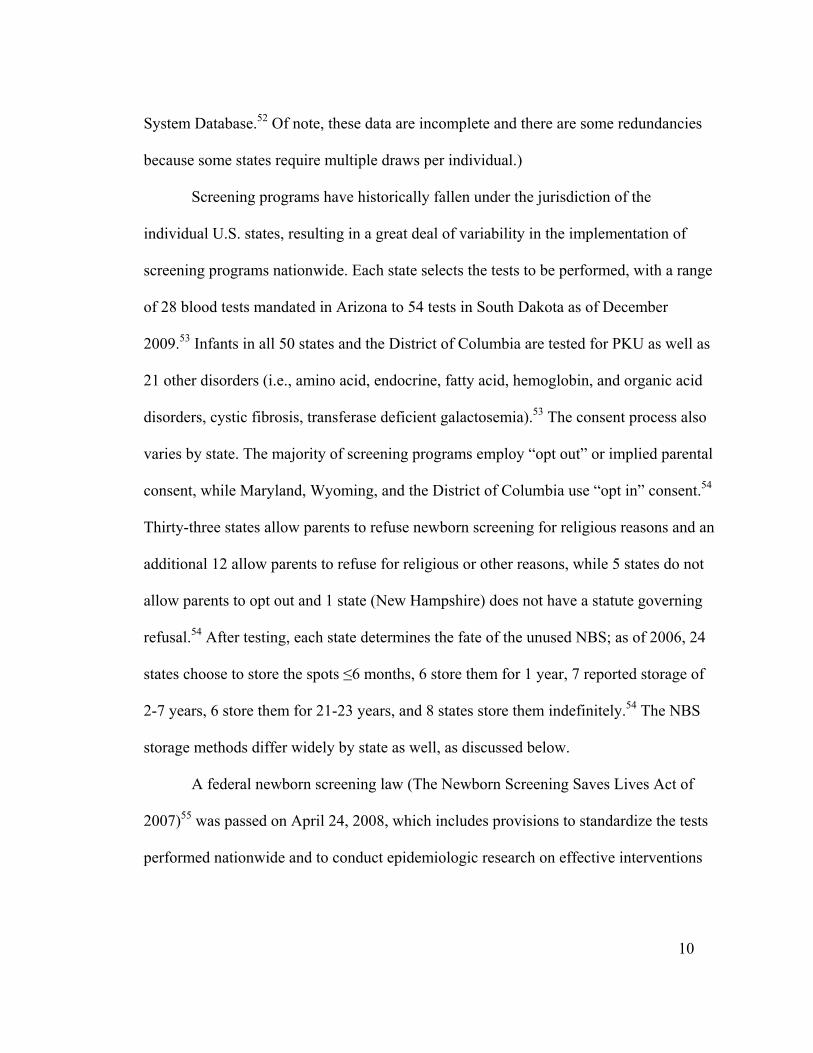
Screening programs have historically fallen under the jurisdiction of the
individual U.S. states, resulting in a great deal of variability in the implementation of
screening programs nationwide. Each state selects the tests to be performed, with a range
of 28 blood tests mandated in Arizona to 54 tests in South Dakota as of December
2009.53 Infants in all 50 states and the District of Columbia are tested for PKU as well as
21 other disorders (i.e., amino acid, endocrine, fatty acid, hemoglobin, and organic acid
disorders, cystic fibrosis, transferase deficient galactosemia).53 The consent process also
varies by state. The majority of screening programs employ “opt out” or implied parental
consent, while Maryland, Wyoming, and the District of Columbia use “opt in” consent.54
Thirty-three states allow parents to refuse newborn screening for religious reasons and an
additional 12 allow parents to refuse for religious or other reasons, while 5 states do not
allow parents to opt out and 1 state (New Hampshire) does not have a statute governing
refusal.54 After testing, each state determines the fate of the unused NBS; as of 2006, 24
states choose to store the spots ≤6 months, 6 store them for 1 year, 7 reported storage of
2-7 years, 6 store them for 21-23 years, and 8 states store them indefinitely.54 The NBS
storage methods differ widely by state as well, as discussed below.
A federal newborn screening law (The Newborn Screening Saves Lives Act of
2007)55 was passed on April 24, 2008, which includes provisions to standardize the tests
performed nationwide and to conduct epidemiologic research on effective interventions
11
to prevent adverse effects of selected heritable disorders. This law should eradicate much
of the interstate variation in screening in the future.
The COG Epidemiology Committee conducted a preliminary survey (led by L.
Spector) of 48 state health departments (or equivalent) in 2006; results of this survey
indicated that 12 states retained NBS for more than 5 years and were willing/able to
release them for research purposes with written parental consent. These states included:
California, Iowa, Maine, Michigan, Minnesota, New Mexico, North Carolina, North
Dakota, New Jersey, Ohio, South Carolina and Washington. Current state storage and
release policies are described in Table 3-3 of this document.
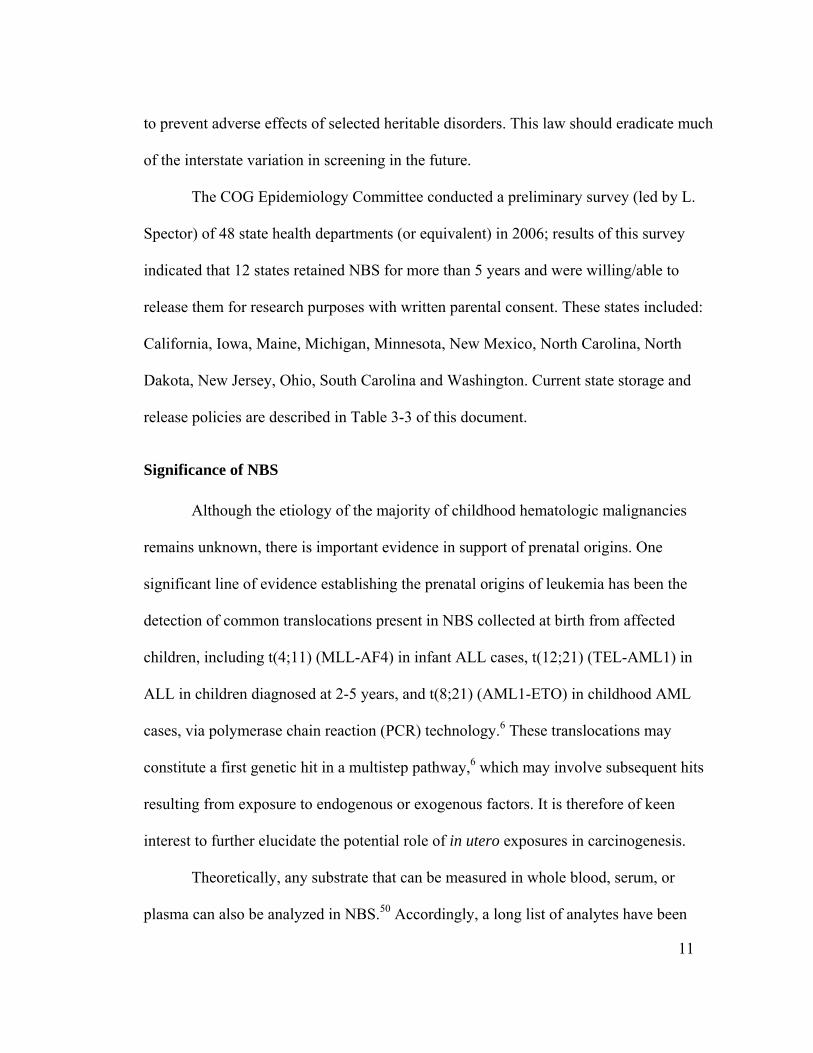
Significance of NBS
Although the etiology of the majority of childhood hematologic malignancies
remains unknown, there is important evidence in support of prenatal origins. One
significant line of evidence establishing the prenatal origins of leukemia has been the
detection of common translocations present in NBS collected at birth from affected
children, including t(4;11) (MLL-AF4) in infant ALL cases, t(12;21) (TEL-AML1) in
ALL in children diagnosed at 2-5 years, and t(8;21) (AML1-ETO) in childhood AML
cases, via polymerase chain reaction (PCR) technology.6 These translocations may
constitute a first genetic hit in a multistep pathway,6 which may involve subsequent hits
resulting from exposure to endogenous or exogenous factors. It is therefore of keen
interest to further elucidate the potential role of in utero exposures in carcinogenesis.
Theoretically, any substrate that can be measured in whole blood, serum, or
plasma can also be analyzed in NBS.50 Accordingly, a long list of analytes have been

12
successfully extracted from blood spots and evaluated, such as amino acids, enzymes,
human and viral DNA, antibodies, markers of inflammation, steroids, metals, protein
adducts, and pesticides.50, 56-58 A list of specific substrates that have been analyzed is
provided in Appendix C.
Analysis of NBS for analyte levels, such as insulin-like growth factor I (IGF-I),59
folate,60 DNA adducts as markers of in utero exposure to alcohol or tobacco smoke,61 or
reproductive hormones,62 would represent important methodological advancement in the
study of childhood cancers. While analysis of IGF, folate, and gonadal hormones have
been previously undertaken in blood spots obtained from other populations,59, 60, 62 the
analysis of DNA adducts has not been previously reported, to our knowledge. We are
currently working in collaboration with Stephen S. Hecht, Ph.D., Program Leader of the
Carcinogenesis and Chemoprevention Research Program at the University of Minnesota
Cancer Center, to develop an assay for this purpose.63-65 Further, in collaboration with Dr.
Hecht, we have completed an analysis of cotinine levels in NBS, which provide a
measure of tobacco exposure.66
Factors influencing NBS retrieval In addition to state retention and release policies, other factors have been
associated with the storage, release, and/or acquisition of NBS. Tarini et al conducted a
nationally representative survey of 3,047 parents of children <18 years and observed that
78% of respondents would authorize NBS storage by state newborn screening programs
for a period of time, 38% would agree to indefinite storage, and 76% would be willing to
release their children’s NBS for research if their permission was sought.67 Only 10%

13
were very unwilling to release NBS for research. Respondents were considerably less
amenable to research conducted without parental permission (28% were willing). The
authors indicate that the definition of parental permission needs to be explored further;
their results do not necessarily implicate a formal written consent process for each
individual research project. They also reported that parents with children with very good
to excellent health and those with a high school education or less were less likely to agree
to NBS storage. Similarly, older parents and those with healthy children were less likely
to permit future use in research. Notably, this survey was designed to assess parental
attitudes and was hypothetical in that no consent forms or NBS were collected.
Loffredo and Ewing conducted a sub-study of the Baltimore-Washington Infant
Study, in which they attempted to retrieve NBS from the Maryland Department of Health
and Mental Hygeine (DHMH) from 522 cases with congenital heart defects and 1,645
representative controls born during the period 1981-1989.68 Retrieval rates were
significantly lower among cases (65%) and varied by type of cardiac abnormality (range:
26% of those with truncus arteriosus to 76% of those with atrial septal defects) compared
with controls (84%). Among controls, 10% had no DHMH laboratory number available
to link the participant with his/her blood spot and 5% had a lab number, but the blood
spot was not located. Rates of retrieval were significantly lower among low birthweight
infants (64% among those with a birthweight of <2500g vs. 85% among those with a
birthweight of ≥2500g) and among those born before 38 weeks gestation (69% vs. 86%
for ≥38 weeks). There were no significant differences in retrieval rates for other infant
(race, gender, county of residence, household income) or maternal (age, parity, marital

14
status, educational attainment) characteristics examined. Of note, Maryland is one of the
few states employing opt-in consent for screening.
Two small studies of childhood cancer conducted in New Jersey69 and
Washington state70 have reported using the name of the mother (and the child in NJ), the
child’s date of birth, and the hospital of birth as matching variables in locating the NBS
of childhood cancer cases and matched controls. One of these, a case-control study of
childhood brain tumors, examined factors influencing the NBS retrieval; the value of
these results is limited, however, given the small sample size in the unretrieved group (n
= 13).70
NBS storage conditions
An important area of concern to researchers interested in the retrieval and analysis
of NBS is the varied storage methodology employed by different states.56 As
recommended in the CSLI /NCCLS protocol, ideal storage conditions for NBS involve
individual storage (along with a desiccant and humidity indicator card) at -20°C in sealed
bags with low gas permeability; humidity should be maintained at <30%.51 Maintaining
these ideal conditions can be costly,71 especially in states with high birth rates. Some
states report storage at ambient conditions, in which temperature and humidity can
fluctuate with seasons, while others report storage in a refrigerator (2-8°C) or freezer (-20
to -30°C), with or without desiccant.71, 72 Storage in ambient conditions could result in
denatured DNA and/or the breakdown of other analytes over time. Similarly, some states
package the NBS individually, while other states store them in bulk, with adjacent
Guthrie cards touching;71 a concern of bulk storage is the potential for cross-

15
contamination across specimens.73 Table 3-3 of this document lists current storage
conditions.
In a series of two papers, Skogstrand et al investigated the effects of various NBS
storage conditions on a panel of 25 markers of inflammation. In the first study, they
observed that NBS stored at -24°C for 23 years had generally similar levels of cytokines
as those stored 1 month or 3 years, respectively, with the exception of diminished levels
of IL-1β, IL-8, sIL-6rα, MMP-9, TREM-1, CRP, BDNF, and NT-4.74 The authors
provide three possible explanations for the observed decreases, including (1) the analytes
degraded over time, (2) the analytes were not extracted as efficiently from the older
cards, or (3) secular increases in population levels of these analytes over time. In the
second study, they compared storage at 4°C, room temperature, and 35°C for up to 30
days and found that storage at lower temperatures yielded better results overall.58
Although there was some variation, cytokine levels were well preserved at the higher
temperatures for ≤7 days as compared with those stored at -20°C immediately upon
collection. Levels of IL-2 and IL-18 were greater in those stored at room temperature and
35°C, while reduced concentrations of IL-1B, IL-6, TNF-B and BDNF were measured in
those stored at ≥4°C.
With respect to genotyping, Klotz et al reported that the ability to amplify and
genotype DNA was robust to “simple storage” (storage in boxes without separators), but
was not robust to extreme temperatures, as occurred in NBS collected in New Jersey
prior to 1983.69 They were able to genotype DNA from 97% of NBS stored after 1982
compared with 3% of those stored from 1979-1982. Conversely, Searles Nielsen et al

16
obtained genotype data from all stored NBS in Washington state, although some
specimens had been stored in bulk up to 25 years without climate control.70 Furthermore,
they did not find evidence of cross-contamination.
Finally, McDade et al provided a summary of protocols for 45 NBS analytes most
applicable to population-based health research, including the duration of stability for 31
substrates at both 4°C and room temperature.57 They reported a stability range of 1 day to
>3 months for both temperatures.
To investigate these storage concerns further, investigators in the University of
Minnesota Department of Pediatrics, Division of Epidemiology and Clinical Research (L.
Spector, S. Ognjanovic, and J. Ross) are currently establishing a pregnancy cohort (n =
500 women) in Minneapolis, Minnesota with the aim of testing different storage
conditions reported by various U.S. states. Results from this comparative study will aid in
the design of analytic methods of NBS collected in the current study.
Etiologic factors of interest
The relevant literature regarding etiologic factors of primary interest is
summarized below. The summaries are not intended to provide an exhaustive review of
the literature, but rather to justify the inclusion of related items in the questionnaire. As
noted above, few etiologic studies of childhood lymphomas have been conducted,
thereby limiting the summaries to leukemias for some factors.
Birthweight. High birthweight has been fairly well established as a risk factor for
childhood leukemia. Upon pooling the results from 23 studies published through 2008,

17
Caughey and Michels reported a modestly higher risk of ALL associated with high
birthweight (generally classified as birthweight >4000g) compared with normal
birthweight (OR = 1.23, 95% CI: 1.15-1.32) and an OR of 1.18 (95% CI: 1.12-1.23)
associated with each 1000g increment in birthweight.75 The summary odds of AML from
7 studies for those with a high birthweight were 1.40-fold greater than those with a
normal birthweight (95% CI: 1.11-1.76).75Insulin-like growth factor I (IGF-I) 76and
thyroid stimulating hormone (TSH)77 have been suggested as possible mediators of the
observed association.
The majority of studies evaluating birthweight and childhood leukemias and
lymphomas, lymphomas, or HL or NHL examined separately have found no evidence of
an association.78-82 Studies conducted in the U.S. and Greece reported increased risk
associated with higher birthweight for NHL (US: OR>4000g = 1.5, 95% CI: 1.0-2.4;
Greece: OR500g increment = 1.42, 95% CI: 1.04-1.92), but found no association with respect
to HL.83, 84 Conversely, a German study observed an elevated OR for NHL for low
birthweight (OR<2500g = 2.3, 95% CI: 1.2-4.3), but no association with high birthweight.85
Maternal pre-pregnancy weight/weight gain during pregnancy. Hematologic
malignancies are thought to be initiated in utero, implicating the maternal environment in
etiology. A case-cohort analysis of leukemia and perinatal factors from the state of New
York reported complex results.86 Maternal pre-pregnancy weight was not statistically
significantly associated with ALL in offspring, although there was evidence of a
monotonic dose response overall (ptrend = 0.03) and among those <5 years at diagnosis

18
(ptrend = 0.002). A pre-pregnancy body mass index (BMI) of >25 kg/m2 (compared to
BMIs of 20-24 kg/m2) was associated with 44% increased odds of ALL diagnosed at <5
years (95% CI: 3-101%). There was evidence of an interaction between maternal pre-
pregnancy weight and offspring birthweight, such that the presence of either high
birthweight or high pre-pregnancy weight, but not both, increased the risk of ALL by
26% or 72%, respectively. High maternal weight gain (>14 kg) during pregnancy was
associated with a 40% increased risk of ALL (OR14.1-18.1 kg = 1.42, 95% CI: 1.04-1.94;
OR≥18.6 kg = 1.38, 95% CI: 0.99-1.94). For AML, there was no association observed for
maternal pre-pregnancy weight or elevated weight gain during pregnancy.86 Conversely,
a case-control study in Washington state found little evidence of an association between
childhood leukemia and maternal pre-pregnancy weight or pregnancy weight gain,
respectively.87
Maternal exposure to fertility/hormone treatments. This exposure is of interest due to the
rapid secular increases in use of assisted reproductive technologies (ART) over the past
decade.88 A meta-analysis examining the incidence of childhood cancers following ART
did not provide evidence of an association upon pooling of 11 cohort studies (OR = 1.33,
95% CI: 0.62-2.85).89 In the initial report on this topic, von Steensel-Moll et al found a
suggested increased risk of ALL associated with a history of fertility problems (OR = 6.0,
95% CI: 0.9-38.2) and a positive association with use of drugs to maintain pregnancy
(OR = 1.9, 95% CI: 1.0-3.5).90 Roman et al observed a nonsignificant increased odds of
childhood leukemias for mothers ever treated hormonally for infertility (OR = 2.5, 95%

19
CI: 0.7-9.3) and for those treated with the index pregnancy (OR = 2.7, 95% CI: 0.6-
11.9).81 Schüz et al also reported an increased risk of acute leukemia (OR = 1.6, 95% CI:
1.0-2.5), but not NHL (OR = 0.9, 95% CI: 0.4-1.9), associated with maternal hormonal
treatment for infertility.85 Finally, Kobayashi et al found a statistically significantly
higher number of lymphoma cases (compared with other cancers) in mothers undergoing
ovulation induction (2/517, p = 0.013).91 Of note, all studies conducted to date are limited
by small numbers of cases.
Maternal vitamin supplementation. Of the 7 studies examining maternal vitamin
supplementation and childhood ALL, 4 reported significant inverse effects in the range
0.40 ≤ OR ≤ 0.84,39-42 while another reported a nonsignificant inverse association92 and 2
reported associations near the null.93, 94 Upon pooling of 3 studies, the fixed effects
summary odds ratio computed by Goh et al indicated a significant reduction associated
with childhood ALL (OR = 0.61, 95% CI: 0.50-0.74).31 Dockerty et al did not find
evidence of an association with ALL in pooling results from 3 different studies (OR =
0.9, 95% CI: 0.8-1.1).93 For AML (and acute non-lymphocytic leukemia, ANLL), each of
the 3 identified studies failed to find evidence of an association with maternal prenatal
vitamin supplementation.39, 40, 95 (A more thorough literature review is provided in
Chapter 4 and Appendix H of this document.)
Schüz et al reported an inverse association between maternal vitamin, folate
and/or iron supplement use during pregnancy and NHL in offspring (OR = 0.68, 95% CI:
0.48-0.97).39

20
Maternal prenatal alcohol exposure. The literature on the association between maternal
prenatal alcohol use and childhood leukemias and lymphomas has been inconsistent. Of
the 11 studies evaluating maternal prenatal alcohol consumption and leukemia or ALL, 5
observed no evidence of an association,38, 85, 90, 96, 97 and 3 found significantly increased
risk associated with any use during pregnancy, with ORs in the range of 1.4-2.0.98-100 A
fourth case-control study conducted in France reported a nonsignificant association for
any alcohol use during pregnancy (OR = 1.3, 95% CI: 0.8-2.0), but observed a positive
association with >1 glass/day (OR = 2.8, 95% CI: 1.3-5.9).101 Conversely, 2 other studies
observed inverse ORs of 0.57 (95% CI: 0.34-0.95)102 and 0.7 (95% CI: 0.5-0.9),103
respectively. Of note, Infante-Rivard reported inverse associations with each of the
individual exposures examined, including stratification by trimester, type of alcohol
(wine, beer, spirits) and frequency of use (<1 drink/day, ≥1 drink/day).103
Of the 7 studies investigating the association with AML, 3 failed to find evidence
of an association,97, 99, 100 while 3 found evidence of a sizable positive association with
ORs of 2.4 (95% CI: 1.3-4.5)96, 1.9 (95% CI: 1.0-3.6),98 and 2.6 (95% CI: 1.2-5.8),101
respectively, and a fourth reported a nonsignificant positive association.104 The positive
associations were observed consistently upon stratification by frequency of use in one
study,96 by trimester, type of alcohol (wine, beer, liquor), and frequency of use in the
second,98 and by rate of daily use in the third.101
Two studies evaluating maternal alcohol consumption during pregnancy with
respect to leukemia and lymphomas combined did not find evidence of an association.78,
105 A study of NHL, however, reported a nonsignificant inverse association for exposure
21
to 1-7 glasses per week of beer, wine or strong liquor during pregnancy (OR = 0.8, 95%
CI: 0.6-1.2).85
Maternal prenatal tobacco smoke exposure. A meta-analysis of studies exploring the
association between maternal tobacco smoking and childhood hematologic malignancies
was published in 2000.106 The pooled ORs calculated in that meta-analysis did not
provide evidence of increased risk of leukemia and lymphomas combined (9 studies, OR
= 1.03, 95% CI: 0.90-1.17), leukemias, acute leukemias, and ALL combined (8 studies,
OR = 1.05, 95% CI: 0.82-1.34) or lymphomas and NHL combined (6 studies, OR = 1.13,
95% CI: 0.85-1.49). Several studies have been published since that meta-analysis was
conducted. For acute leukemia, an additional 10 studies found no association,85, 99-101, 107-
112 while a large cohort study in Sweden computed an inverse association between
maternal smoking in the first trimester and ALL (HR = 0.73, 95% CI: 0.58-0.91), but
reported a nonsignificant positive association with AML (HR = 1.41, 95% CI: 0.74-
2.67).113 The association with AML was attributable to those smoking ≥10 cigarettes per
day (HR = 2.20, 95% CI: 1.00-4.83).
For lymphomas, there was one additional report of no association 113 and one
study reporting a positive association between maternal consumption of >20 cigarettes
per day during pregnancy and childhood NHL (OR = 5.2, 95% CI: 1.2-22.4).85 The latter
estimate was based on small numbers; no association was observed for lower rates of
maternal smoking in that study.

22
Atopy. Six case-control studies have explored the possible relationship between atopic
disease (i.e., asthma, eczema, hay fever, hives) and the development of childhood ALL;
five of these reported inverse relationships with ORs in the range of 0.3-0.7, 34-38 while
one found a 2.2-fold increased risk associated with atopy.43 Two studies reporting on
AML failed to find an association; these studies included very small numbers of cases.34,
36 (A more thorough literature review is provided in Chapter 6 of this document and a
meta-analysis is provided in Chapter 7.)
Significance of the research
The primary aim of the current study is to assess the feasibility of obtaining NBS
from childhood cancer cases on a nationwide basis. NBS are a rich resource, in that they
are collected uniformly from nearly all children in the United States at birth for the
purpose of testing for inborn errors of metabolism and other disorders,50, 51, 114 and
therefore, constitute the only consistent source of prediagnostic biological specimens
existing for children with cancer. A significant limitation faced by pediatric cancer
epidemiologists conducting case-control studies is the issue of recall bias. NBS may
represent an unbiased record of an individual’s in utero biology, including exposure to
endogenous and exogenous factors, since they are collected at the time of birth. Some
states retain residual blood spots for a period of 5 years or more, potentially permitting
their use in etiologic research.71
To achieve the study aims, mothers were asked to complete a self-administered
paper questionnaire regarding prenatal exposures and birth characteristics of their
children, and all parents were asked to consider providing written permission for

23
researchers to obtain their child’s NBS from state newborn screening programs. If a child
had reached the age of majority (≥18 years) at the time of contact, he/she was asked to
provide release of his/her NBS instead. State newborn screening programs were then
contacted to request the NBS. Etiologic hypotheses of interest involve the index child’s
birthweight,23 maternal weight gain during pregnancy,86 maternal vitamin
supplementation with a focus on folate consumption,31 maternal alcohol and tobacco
smoke exposure32 and maternal exposure to fertility or other hormone treatments.33
Factors related to the immune system are also of interest.35

24
Chapter 3: Feasibility of obtaining neonatal blood spots for childhood cancer cases:
A Children’s Oncology Group study
Although the etiology of most pediatric hematologic malignancies is unknown, there is
evidence supporting prenatal origins. Neonatal blood spots (NBS) are collected uniformly
from newborns in the U.S. to test for metabolic disorders. NBS therefore constitute the
only consistent source of prediagnostic specimens for children with cancer and may
provide an unbiased record of prenatal exposures. Some states retain NBS for ≥5 years,
potentially permitting their use in case-control studies. The primary aim of this study was
to assess the feasibility of obtaining NBS from pediatric/adolescent cancer cases
nationwide. A secondary aim was to assess study participation 2-8 years after agreeing to
future contact. Biological mothers of hematological cancer cases diagnosed at 19 U.S.
Children’s Oncology Group institutions in 2001-2007 were asked to complete
questionnaires regarding prenatal exposures (n = 887). All parents/guardians and cases
aged ≥18 years were asked to release their child’s/their NBS (n = 947). NBS were then
requested from state newborn screening programs. Overall, 41% of mothers completed
questionnaires and 37% of families provided consent for NBS release. Notably, 82% of
those completing questionnaires also provided consent. Consenting cases were born in 39
states and 46 NBS were obtained from 5 (CA, NY, MI, TX, WA); 124 NBS were
unobtainable because cases were born prior to the dates of state retention. NBS
storage/release policies are rapidly evolving; requests are pending in states involved in
litigation (MN), reviewing policies (NJ), and reviewing this study (MA). Currently,
25
population-based NBS studies can be conducted in a limited number of states;
fortunately, many have large populations to provide reasonably sized pediatric case and
control groups.
Introduction
Although the etiology of most childhood hematologic malignancies remains
unknown,4 there is important evidence in support of prenatal origins. One significant line
of evidence is the detection of chromosomal translocations present in neonatal blood
spots (NBS) collected at birth from acute lymphoblastic leukemia (ALL) and acute
myeloid leukemia (AML) cases.5, 6 These translocations may constitute a first genetic hit
in a multistep pathway,6 with subsequent hits from endogenous or exogenous factors. It is
therefore of keen interest to elucidate the role of in utero exposures in leukemogenesis.
NBS are collected from nearly all neonates (>95%)50 in the U.S. per a standard
protocol51 to test for metabolic and other disorders.53 Theoretically, any substrate that can
be measured in whole blood, serum, or plasma can also be analyzed in NBS.50
Accordingly, several analytes have been evaluated in NBS, such as amino acids,
enzymes, human and viral DNA, antibodies, markers of inflammation, steroids, metals,
protein adducts, pesticides and cotinine.50, 56-58, 66
Newborn screening programs are mandated by U.S. states, resulting in
considerable variability in implementation nationally.54 Each state selects tests to be
26
performed, establishes consent and refusal processes, and determines the fate of residual
NBS.a
Recall bias is a potentially serious limitation of retrospective case-control studies
of rare pediatric/adolescent disorders. NBS constitute the only consistent source of
prediagnostic biospecimens for children with cancer and in theory would provide an
unbiased record of in utero exposures, since they are collected at birth. Some states retain
residual NBS for ≥5 years, potentially permitting their use in etiologic research.71 The
primary aim of this study was to assess the feasibility of obtaining NBS from childhood
cancer cases with written consent on a nationwide basis. A secondary aim was to assess
subject willingness to participate in a study years after consenting to future contact.
Methods
Eligible subjects were identified via Children’s Oncology Group (COG) protocol
AADM01P1 - Protocol for Registration and Consent to the Childhood Cancer Research
Network (CCRN): A Limited Institution Pilot, which was activated at a 10% random
sample of COG institutions in North America (n = 23).47 The protocol involved two
levels of consent for parents/guardians and children ages ≥18 years. The first level of
consent allowed name and contact information to be released to the COG registration
system. The second level involved agreement for future contact regarding COG-approved
non-therapeutic studies. Institutions were to approach all newly diagnosed cancer cases.
a Of note, The Newborn Screening Saves Lives Act (2007) passed into law in April 2008 includes provisions to standardize the tests performed nationwide (The Newborn Screening Saves Lives Act of 2007, Pub. L. No. 110-204, 122 Stat. 705-712 (April 24, 2008)).

27
Between May 2001 and January 2007, 2,233 families were approached and 2,136 (96%)
agreed to both consent levels.
Cases were eligible for this study (COG AEPI08N1) if they were diagnosed with
leukemia or lymphoma between the ages of 0-21 years, were born in the U.S. (Canada
has no provision to provide NBS), and they or their parent/guardian participated in
AADM01P1, agreed to future contact, and spoke English or Spanish. Deceased cases
were eligible.
COG diagnosing institutions were provided with study summaries and were asked
to supply contact information for family members providing AADM01P1 consent or any
reasons why families should not be contacted (e.g., child recently died). Subjects were
contacted in a series of mailings (introductory letter, study packet, reminder/thank you
postcard) over a period of 4 weeks, followed by a phone call and/or a final mailing
(second study packet).b Spanish translations were sent to known Spanish speakers.
Biological mothers, if available, were asked to complete self-administered
questionnaires regarding prenatal exposures and birth characteristics.c All
parents/guardians were asked to consider providing three levels of written consent,
including release of their child's NBS to study investigators, long-term storage of NBS by
investigators, and future contact regarding this study. All parents/guardians were asked to
b Study packets contained letters, questionnaires, and consent and assent forms, as applicable, for mothers; letters, consent and assent forms, or adult contact information forms, as applicable, for parents/guardians; and letters and consent forms for adult children. The self-administered paper questionnaire and samples of other study materials are provided in Appendices D and E. Questionnaire content was restricted due to a mandate from the COG Scientific Council that the questionnaire require 20 minutes or less for completion in order to minimize respondent burden for a feasibility study. c Items focused on exposures during the index pregnancy, such as maternal reproductive history, weight gain, vitamin supplementation, and alcohol and tobacco exposure, as well as the child’s birthweight and length and personal and family history of atopy.

28
provide contact information for children ≥18 years in the questionnaire or contact
information form, as applicable, so that adult children could be asked to provide written
release for their own NBS.
Due to lower than anticipated response rates, non-respondents were traced via
telephone and reverse directories and on-line methods. Multiple attempts were made to
reach non-respondents via telephone at different times of day/days of the week;
voicemail/answering machine messages were left on third or subsequent failed attempts.
Families who did not respond via mail, who were not reached via telephone, and whose
outgoing message did not clearly identify them were classified as “contact unknown.”
State newborn screening programs were provided with signed consent/assent
forms and asked to release NBS. States were also asked to provide their NBS retention,
storage, and release policies.d States of birth were contacted for all participating cases
regardless of prior responses to surveys,54, 71 as policies are evolving.
The protocol was approved by the University of Minnesota Institutional Review
Board (IRB) and IRBs of states releasing NBS, as needed.e
d Some of this information is available and updated regularly on the National Newborn Screening Information System (NNSIS) website (National Newborn Screening Information System. Laboratory Specimen Information for Newborn Screening in the U.S. in 2010. [Last accessed January 27, 2010]. http://www2.uthscsa.edu/nnsis/). e The COG Scientific Council and the University of Minnesota Cancer Protocol Review Committee (CPRC) provided approvals prior to seeking IRB approvals. IRB applications were submitted to the University of Minnesota, Minnesota Department of Health, State of New York Department of Health, Washington State Department of Health, Michigan Department of Community Health, Texas Department of State Health Services, and New Jersey Department of Health and Senior Services. COG and CPRC approval letters and IRB response letters are shown in Appendix F; we currently await a response from New Jersey.

29
Statistical analysis
Univariate unconditional logistic regression (SAS v9.2, SAS Institute, Cary,
North Carolina) was performed to assess whether baseline participant characteristics
(type of respondent initially contacted, language, age group at diagnosis, year of birth,
time since diagnosis, last known vital status) were statistically significant predictors of
questionnaire completion, consent, assent, provision of adult child contact information, or
NBS retrieval; odds ratios (ORs) and 95% confidence intervals (CIs) were produced.
Multivariable logistic regression was also performed to determine the significance of
predictors after adjustment for all other factors.
Results
Nineteen U.S. COG institutions provided updated contact information and reasons
not to contact subjects, while 2 refused and 2 Canadian institutions were excluded
(Canada has no provision to provide NBS).f Of 1,006 hematologic cases in the
AADM01P1 dataset, contact was attempted for 947 in the current study, while the
remainder were not contacted due to institutional refusal to provide name and contact
information (n = 25), subjects retracting consent for future contact (n = 11), institutional
losses to follow up (n = 7), parent’s language (n = 6), subject’s place of birth outside of
U.S. (n = 5), biological mother unavailable (n = 3), and patient’s poor health (n = 2).
For the vast majority of the 947 families, we initiated contact with mothers (94%)
and native English speakers (93%), as these individuals had provided permission for
future contact in the AADM01P1 study (Table 3-1). Forty-one percent of cases were
f COG institutions are listed in Appendix A.

30
diagnosed at <5 years and approximately 20% were diagnosed in each of the other age
categories. Half were born in 1997 or thereafter (48%), while 59% were diagnosed ≥5
years prior to contact (median = 5 years). Most cases were last known to be alive (89%).
Of the 947 families, 385 participated in some manner, resulting in an overall
response rate of 41%, while 27 actively refused (3%) and materials from 56 were
returned to sender (6%). An additional 165 were passive refusals (17%), meaning contact
was confirmed via telephone. It was unclear if contact was made with the remaining 314
(33%). Frequencies, response rates, and results of univariate regression prediction models
are provided in Table 3-2.g
The distribution of questionnaire responses was very similar to those described
above for overall response; 41% of mothers returned completed questionnaires. Mothers
of cases diagnosed at 15-20 years and mothers of cases born in 1987-1991 were
approximately 2 times more likely to complete questionnaires than mothers of cases aged
0-4 years (OR = 2.05, 95% CI: 1.41-2.98) and those born in 1997-2001 (OR = 1.85, 95%
CI: 1.29-2.66), respectively. Spanish speakers were significantly less likely to return
completed questionnaires than English speakers (OR = 0.39, 95% CI: 0.19-0.79). Upon
adjustment for all factors, only Spanish language remained a significant predictor of non-
response (OR = 0.38, 95% CI: 0.19-0.79).
Fifty-four percent of parents/guardians with children ≥18 years at the time of
contact provided names and addresses; 132 adult children were therefore asked to provide
consent for release of NBS.
g A full listing of the response rates for the questionnaire, written consent and assent, and adult contact information forms, and NBS retrieval rates overall and by age at diagnosis, year of birth, and years since diagnosis are shown in Appendix G.

31
The consent response distribution was also similar to that for any participation;
37% of families returned signed consent forms, including 228 mothers (34%), 7
parent/guardians (21%), and 75 adult children contacted upon receipt of information from
parents/guardians (57%). Of those providing consent, 304 agreed to NBS release, NBS
storage, and future contact, while 2 agreed to release and storage, 2 agreed to release and
future contact, and 2 agreed to release only. Notably, 82% of families providing
completed questionnaires also returned signed consents and 1 family provided consent
but declined the questionnaire (the contact was a step-mother and was ineligible for the
questionnaire). One consent was inadvertently signed by a minor and written consent
could not be obtained from that parent/guardian. Similar to questionnaire response,
diagnosis at ages 15-20 years (OR = 1.95, 95% CI: 1.28-2.97), birth in the years 1987-
1991 (OR = 2.08, 95% CI: 1.38-3.15), and Spanish language (OR = 0.33, 95% CI: 0.14-
0.75) were significant predictors of consent. Spanish language was the only significant
predictor after adjustment for the other factors (OR = 0.32, 95% CI: 0.14-0.74).
Thirty-two percent of children ages 8-17 years returned signed assent forms. In
addition, 7 were signed by parents/guardians and signed assents were not obtained from
these children.
Respondents were born in 42 U.S. statesh and those providing consent for NBS
release were born in 39 of these.i NBS were requested for 299 cases (and were not
requested for 7 missing signed assents and 4 not born in the U.S.). Of 39 states queried, 5
h States of birth for respondents included: AK, AZ, CA, CT, DE, FL, GA, HI, IA, ID, IL, IN, KY, LA, MA, MD, ME, MI, MN, MO, MS, MT, NC, NE, NH, NJ, NM, NV, NY, OH, OK, OR, PA, SD, TN, TX, UT, VA, VT, WA, WI, and WY. i States of birth for those providing consent included the states listed above less HI, NH, and KY.

32
(CA, MI, NY, TX, WA) released 46 NBS. These states were unable to provide NBS for
12 “age-ineligible” cases (those born prior to the oldest date of state retention) and were
unable to locate spots for 2 age-eligible cases based on the information provided (child’s
last name, date of birth, mother’s full name, hospital name and city). NBS retrieval rates
and results from prediction models are listed in Table 3-2. None of the factors examined
was a significant predictor of NBS retrieval, although this may be attributable to the
small number of retrieved spots.
NBS were unobtainable for 112 cases because states store spots for <1 year (n =
72, AZ, GA, IL, LA, NE, OK, PA, UT, VA, WY), 1-<5 years (n = 32, AK, DE, ID, MT,
NM, NV, OH, TN, WI) or ≥5 years (n = 7, IA, IN, MD, ME, MO, NC) and cases were
age-ineligible. Of note, state policies may not allow for NBS retrieval in 5 of these (GA,
IL, NM, NV, WY). Policies in 6 states (CT, FL, MS, OR, SD, VT) do not allow for
release of identifiable NBS for research (n = 60). Requests for NBS are pending in 3
states (n = 67), including one involved in litigation unrelated to the current study (MN), a
second currently reviewing its storage/release policies (NJ), and a third performing a
protocol review (MA). Information regarding length of retention, willingness to release
spots with written consent, and storage conditions for the 39 queried states (provided in
written personal communications with newborn screening program contacts listed on the
NNSIS website,115 or their designates) is listed in Table 3-3.

33
Table 3-1. Characteristics of 947 eligible pediatric hematologic cancer cases.
Characteristic
N (%) Initial contact Mother 887 (93.7) Parent/Guardian 57 (6.0) Child ≥18 years at diagnosis 3 (0.3) Language English 877 (92.6) Spanish 46 (4.9) Unknown 24 (2.5) Age at diagnosis 0-4 years 375 (39.6) 5-9 years 204 (21.5) 10-14 years 181 (19.1) 15-20 years 187 (19.8) Year of birth 1982-1986 86 (9.1) 1987-1991 208 (22.0) 1992-1996 197 (20.8) 1997-2001 326 (34.4) 2002-2006 130 (13.7) Years since diagnosis 2-4 years 386 (40.8) 5-10 years 561 (59.2) Vital status Alive 844 (89.1) Deceased 83 (8.8) Unknown 20 (2.1)

34
Table 3-2. Frequencies, response rates, and results from univariate logistic regression models for the questionnaire, consent, assent,
child contact information request, and NBS retrieval, overall and by initial contact, language, age at diagnosis, year of birth, years
since diagnosis and vital status.
Questionnaire Consent Assent N (%) OR 95% CI N (%) OR 95% CI N (%) OR 95% CI
Overall 366 (41.3) 310 (37.1) 148 (32.0) Initial contact Mother 366 (41.3) 1.00 299 (37.9) 1.00 144 (32.4) 1.00 Guardian NA NA 11 (26.2) 0.58 0.29 - 1.18 4 (22.2) 0.60 0.19 - 1.85 Adult child 0 (0.0) -- 0 (0.0) -- NA NA Language English 355 (42.6) 1.00 298 (38.5) 1.00 145 (33.1) 1.00 Spanish 10 (22.2) 0.39 0.19 - 0.79 7 (17.1) 0.33 0.14 - 0.75 2 (11.1) 0.25 0.06 - 1.11 Unknown 1 (11.11) 0.17 0.02 - 1.35 5 (26.3) 0.57 0.20 - 1.60 1 (14.3) 0.34 0.04 - 2.82 Age at diagnosis 0-4 years 138 (38.6) 1.00 136 (36.3) 1.00 70 (36.3) 1.00 5-9 years 65 (33.7) 0.81 0.56 - 1.17 62 (30.5) 0.77 0.54 - 1.11 56 (29.6) 0.74 0.48 - 1.14 10-14 years 69 (40.8) 1.10 0.76 - 1.60 51 (36.2) 1.00 0.67 - 1.49 21 (26.3) 0.63 0.35 - 1.12 15-20 years 94 (56.3) 2.05 1.41 - 2.98 61 (52.6) 1.95 1.28 - 2.97 1 (100) -- Year of birth 1982-1986 36 (50.7) 1.61 0.96 - 2.70 23 (43.4) 1.39 0.77 - 2.50 NA NA 1987-1991 104 (54.2) 1.85 1.29 - 2.66 69 (53.5) 2.08 1.38 - 3.15 3 (27.3) 0.71 0.18 - 2.74 1992-1996 57 (30.5) 0.69 0.47 - 1.01 55 (27.9) 0.70 0.48 - 1.03 51 (28.3) 0.75 0.50 - 1.13 1997-2001 122 (39.0) 1.00 116 (35.6) 1.00 94 (34.6) 1.00 2002-2006 47 (37.9) 0.96 0.62 - 1.47 47 (36.2) 1.03 0.67 - 1.57 NA NA
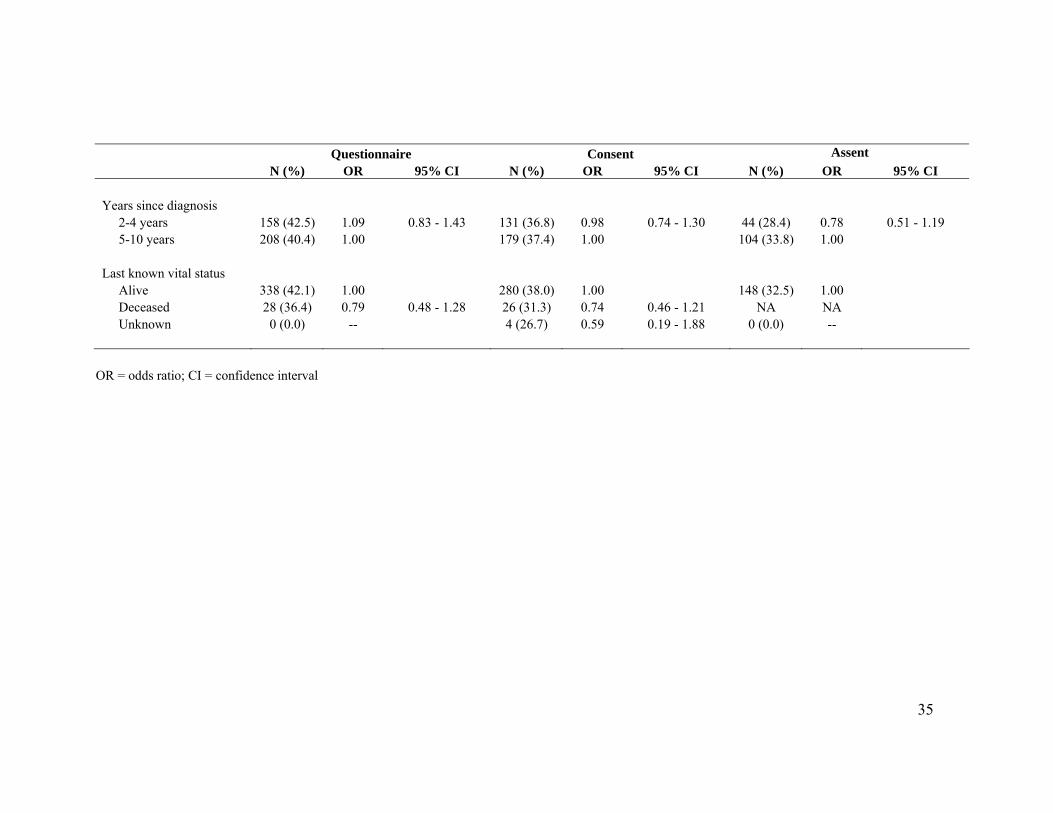
35
Questionnaire Consent Assent N (%) OR 95% CI N (%) OR 95% CI N (%) OR 95% CI
Years since diagnosis 2-4 years 158 (42.5) 1.09 0.83 - 1.43 131 (36.8) 0.98 0.74 - 1.30 44 (28.4) 0.78 0.51 - 1.19 5-10 years 208 (40.4) 1.00 179 (37.4) 1.00 104 (33.8) 1.00 Last known vital status Alive 338 (42.1) 1.00 280 (38.0) 1.00 148 (32.5) 1.00 Deceased 28 (36.4) 0.79 0.48 - 1.28 26 (31.3) 0.74 0.46 - 1.21 NA NA Unknown 0 (0.0) -- 4 (26.7) 0.59 0.19 - 1.88 0 (0.0) --
OR = odds ratio; CI = confidence interval
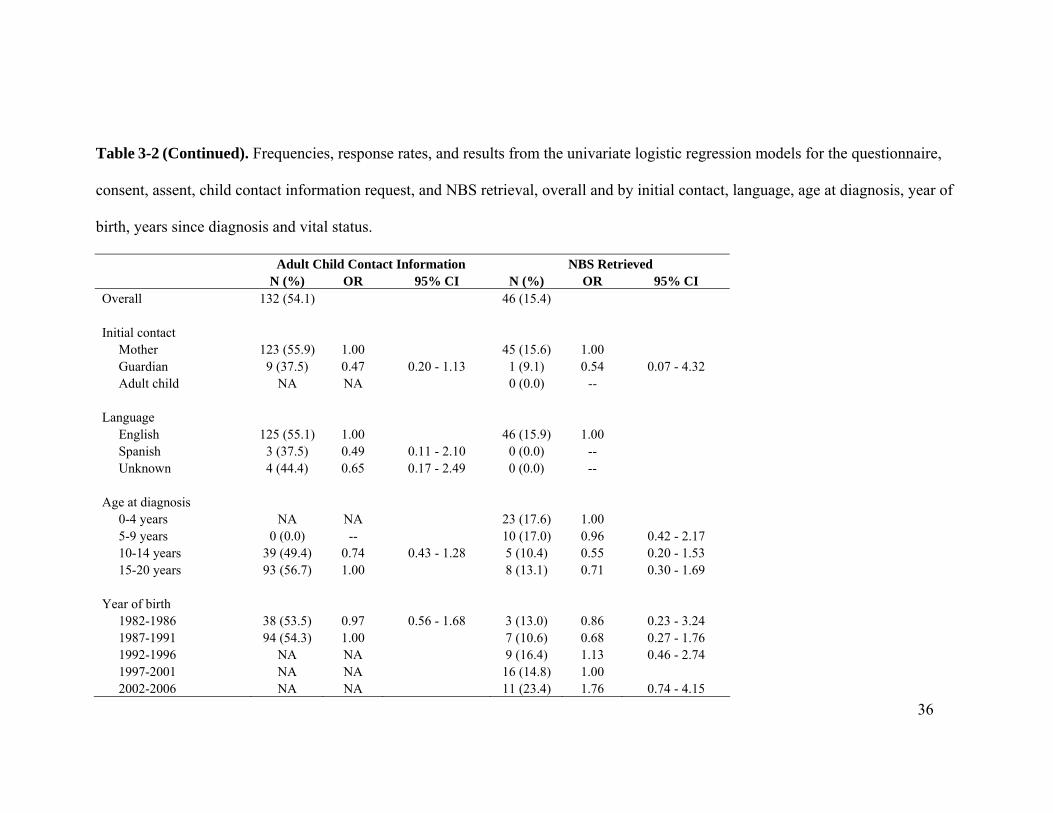
36
Table 3-2 (Continued). Frequencies, response rates, and results from the univariate logistic regression models for the questionnaire,
consent, assent, child contact information request, and NBS retrieval, overall and by initial contact, language, age at diagnosis, year of
birth, years since diagnosis and vital status.
Adult Child Contact Information NBS Retrieved N (%) OR 95% CI N (%) OR 95% CI
Overall 132 (54.1) 46 (15.4) Initial contact Mother 123 (55.9) 1.00 45 (15.6) 1.00 Guardian 9 (37.5) 0.47 0.20 - 1.13 1 (9.1) 0.54 0.07 - 4.32 Adult child NA NA 0 (0.0) -- Language English 125 (55.1) 1.00 46 (15.9) 1.00 Spanish 3 (37.5) 0.49 0.11 - 2.10 0 (0.0) -- Unknown 4 (44.4) 0.65 0.17 - 2.49 0 (0.0) -- Age at diagnosis 0-4 years NA NA 23 (17.6) 1.00 5-9 years 0 (0.0) -- 10 (17.0) 0.96 0.42 - 2.17 10-14 years 39 (49.4) 0.74 0.43 - 1.28 5 (10.4) 0.55 0.20 - 1.53 15-20 years 93 (56.7) 1.00 8 (13.1) 0.71 0.30 - 1.69 Year of birth 1982-1986 38 (53.5) 0.97 0.56 - 1.68 3 (13.0) 0.86 0.23 - 3.24 1987-1991 94 (54.3) 1.00 7 (10.6) 0.68 0.27 - 1.76 1992-1996 NA NA 9 (16.4) 1.13 0.46 - 2.74 1997-2001 NA NA 16 (14.8) 1.00 2002-2006 NA NA 11 (23.4) 1.76 0.74 - 4.15
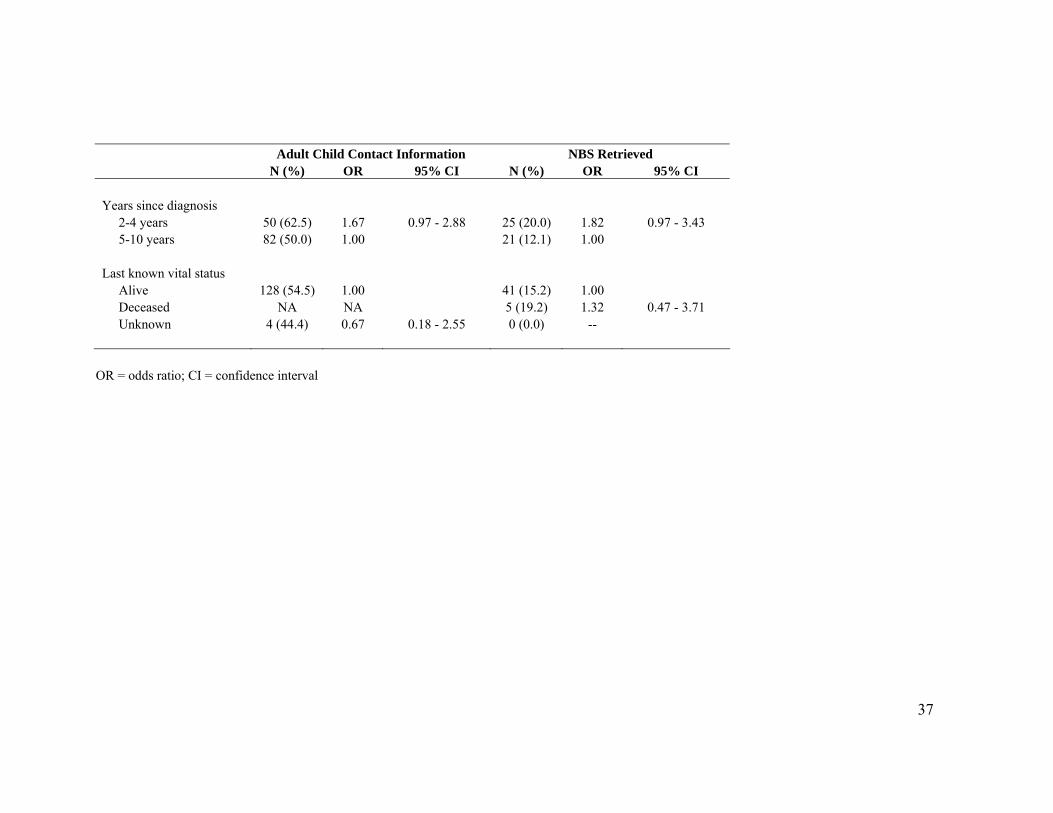
37
Adult Child Contact Information NBS Retrieved N (%) OR 95% CI N (%) OR 95% CI
Years since diagnosis 2-4 years 50 (62.5) 1.67 0.97 - 2.88 25 (20.0) 1.82 0.97 - 3.43 5-10 years 82 (50.0) 1.00 21 (12.1) 1.00 Last known vital status Alive 128 (54.5) 1.00 41 (15.2) 1.00 Deceased NA NA 5 (19.2) 1.32 0.47 - 3.71 Unknown 4 (44.4) 0.67 0.18 - 2.55 0 (0.0) --
OR = odds ratio; CI = confidence interval

38
Table 3-3. Neonatal dried blood spot retention and release policies for queried states.*
State Length of retention Oldest year retained
Willing to release spots with written parental consent?
Spots received? Storage conditions Notes
AK 3 years 2007 Yes, as long as not tested for anything already screened
No -- not age eligible
Stored at room temperature in sealed boxes without
desiccant.
AZ 90 days 2009 Yes No -- not age eligible
Stored at room temperature in bulk in plastic boxes
without desiccant.
CA Indefinitely October 1980 (but only indexed
electronically since March 1982)
Yes Yes Stored at -20°C in plastic bags in cardboard boxes.
IRB approval is required. Researchers may
encounter a delay due to backlog and may be
assessed a fee.
CT 2 years 2008 No No Stored at -20°C in sealed bags with desiccant.
DE 3 years (beginning in 2010)
2009 Yes No -- not age eligible
Stored at -20°C in sealed bags with desiccant.
A notarized original consent form is required;
no copies or faxes.
FL Indefinitely June 2005 No No Stored at room temperature. Currently in the process of writing new release
policies.
GA 6 weeks 2009 Maybe No -- not age eligible
Stored in refrigerator in gas-permeable bags without
desiccant.
No written policy exists, but is currently being
drafted.
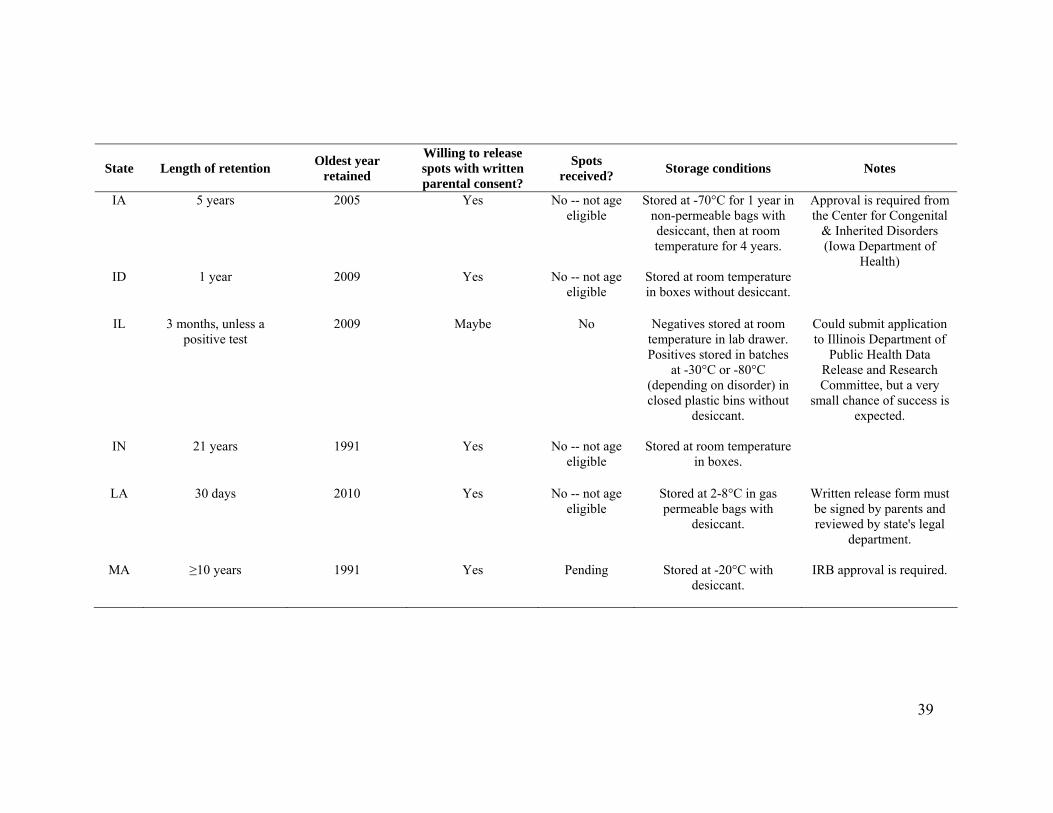
39
State Length of retention Oldest year retained
Willing to release spots with written parental consent?
Spots received? Storage conditions Notes
IA 5 years 2005 Yes No -- not age eligible
Stored at -70°C for 1 year in non-permeable bags with desiccant, then at room temperature for 4 years.
Approval is required from the Center for Congenital
& Inherited Disorders (Iowa Department of
Health) ID 1 year 2009 Yes No -- not age
eligible Stored at room temperature in boxes without desiccant.
IL 3 months, unless a positive test
2009 Maybe No Negatives stored at room temperature in lab drawer. Positives stored in batches
at -30°C or -80°C (depending on disorder) in closed plastic bins without
desiccant.
Could submit application to Illinois Department of
Public Health Data Release and Research Committee, but a very
small chance of success is expected.
IN 21 years 1991 Yes No -- not age
eligible Stored at room temperature
in boxes.
LA 30 days 2010 Yes No -- not age eligible
Stored at 2-8°C in gas permeable bags with
desiccant.
Written release form must be signed by parents and reviewed by state's legal
department.
MA ≥10 years 1991 Yes Pending Stored at -20°C with desiccant.
IRB approval is required.

40
State Length of retention Oldest year retained
Willing to release spots with written parental consent?
Spots received? Storage conditions Notes
MD Indefinitely 2004 Yes No -- not age eligible
Stored at -20°C for 6 months.
IRB approval is required. At time of publication,
state reviewing/updating policies.
ME Indefinitely 1998 Yes No -- not age
eligible Stored at -20°C with
desiccant.
MI Indefinitely 1985 Yes Yes Stored in a warehouse with no temperature or humidity
controls.
IRB approval is required. May need to sign a materials transfer
agreement and pay a fee.
MN Indefinitely 1997 Pending Pending Since 2005, stored at -20°C in plastic containers. Prior
to 2005, stored at room temperature in cardboard boxes. All are in stacks of ~1000 with no desiccant.
At time of publication, state involved in
litigation.
MO 5 years (beginning in Fall 2010)
2010 Yes No -- not age eligible
Stored in bulk in sealed bags with desiccant in the refrigerator for one month and at -20°C for 5 years.
MS 1 year 2009 No No Stored at room temperature in boxes without desiccant.

41
State Length of retention Oldest year retained
Willing to release spots with written parental consent?
Spots received? Storage conditions Notes
MT 1 year 2009 Yes No -- not age eligible
Stored at -20°C in biohazard bags without desiccant.
Must be approved by the State Medical Officer and Office of Legal Affairs.
NC Indefinitely 2002 Yes No -- not age
eligible Stored at room temperature in boxes without desiccant.
IRB approval is required. Policies may be changing
soon.
NE 90-120 days 2009 Yes No -- not age eligible
Stored in the refrigerator in sealed bags of low gas
permeability.
Must submit an application to the Chief Medical Officer and the
Newborn Screening Advisory Committee for
approval.
NJ 23 years 1987 Pending Pending Stored at ambient temperature and humidity;
bundled together in cardboard boxes.
IRB approval is required. At time of publication,
state reviewing/updating policies.
NM 1 year 2009 Will not release NBS to researchers, but
will consider requests from parents
No Stored at room temperature in boxes without desiccant.
NV 1 year 2009 Maybe No -- not age eligible
Stored at room temperature in sealed boxes without
desiccant.
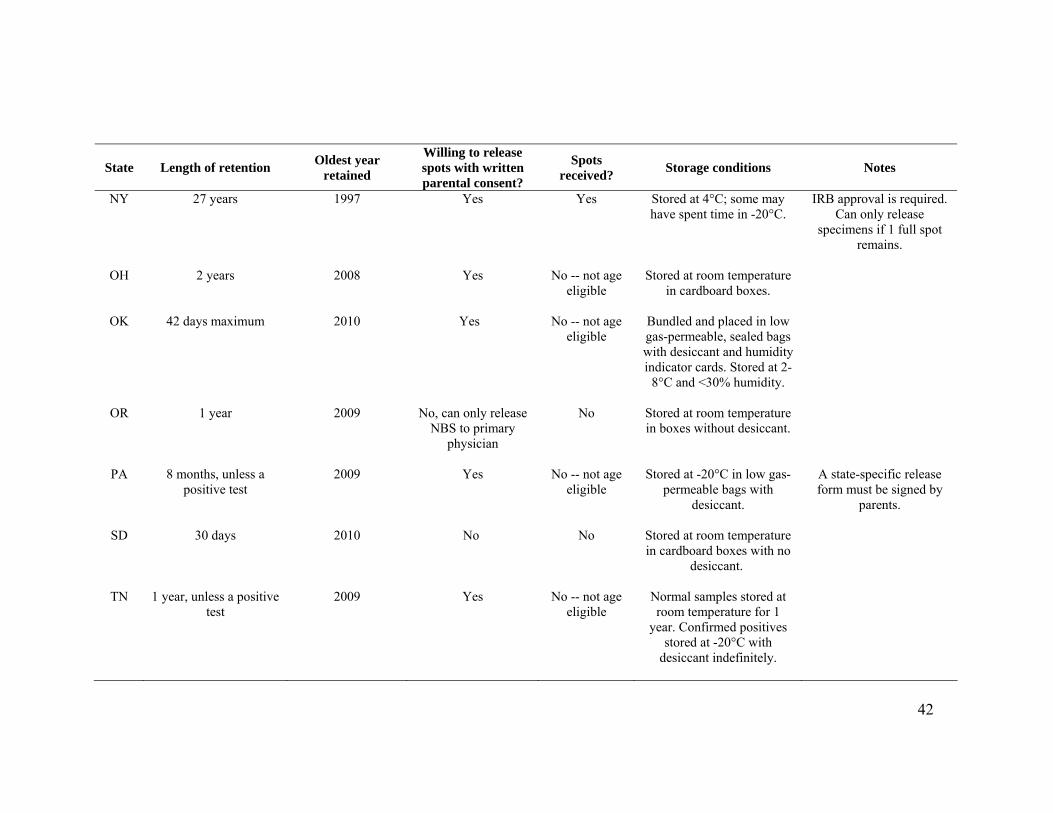
42
State Length of retention Oldest year retained
Willing to release spots with written parental consent?
Spots received? Storage conditions Notes
NY 27 years 1997 Yes Yes Stored at 4°C; some may have spent time in -20°C.
IRB approval is required. Can only release
specimens if 1 full spot remains.
OH 2 years 2008 Yes No -- not age
eligible Stored at room temperature
in cardboard boxes.
OK 42 days maximum 2010 Yes No -- not age eligible
Bundled and placed in low gas-permeable, sealed bags with desiccant and humidity indicator cards. Stored at 2-
8°C and <30% humidity.
OR 1 year 2009 No, can only release NBS to primary
physician
No Stored at room temperature in boxes without desiccant.
PA 8 months, unless a positive test
2009 Yes No -- not age eligible
Stored at -20°C in low gas-permeable bags with
desiccant.
A state-specific release form must be signed by
parents.
SD 30 days 2010 No No Stored at room temperature in cardboard boxes with no
desiccant.
TN 1 year, unless a positive test
2009 Yes No -- not age eligible
Normal samples stored at room temperature for 1
year. Confirmed positives stored at -20°C with
desiccant indefinitely.
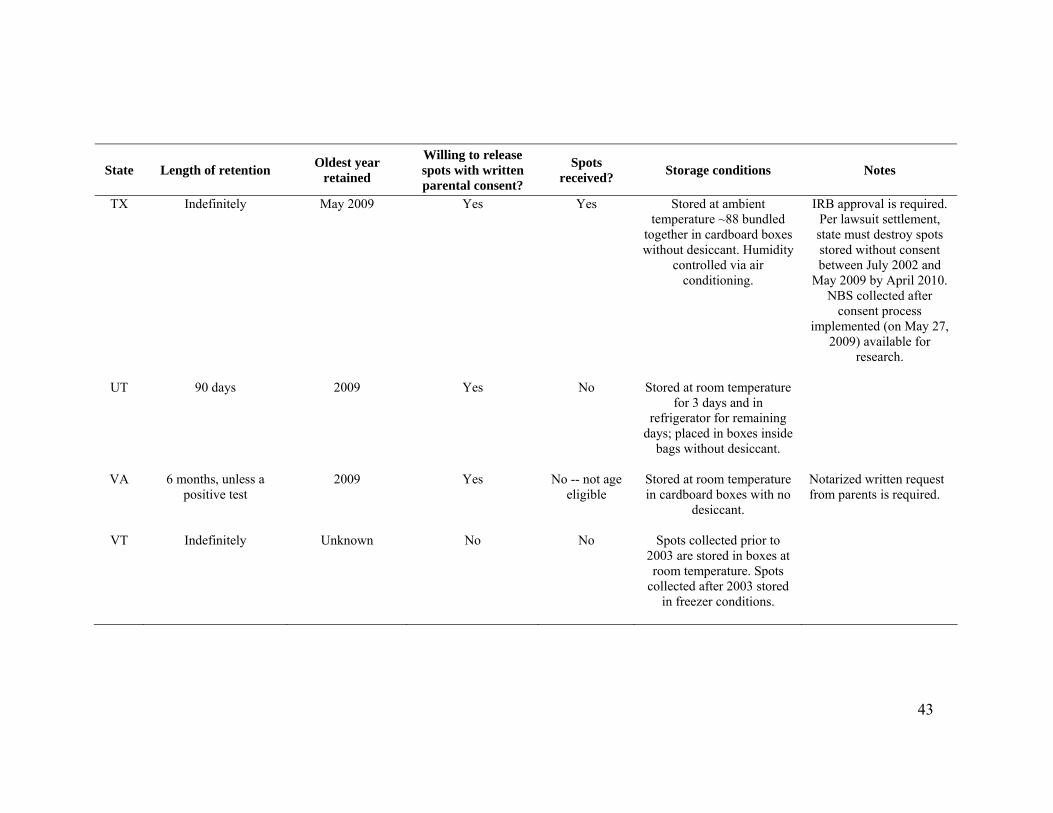
43
State Length of retention Oldest year retained
Willing to release spots with written parental consent?
Spots received? Storage conditions Notes
TX Indefinitely May 2009 Yes Yes Stored at ambient temperature ~88 bundled
together in cardboard boxes without desiccant. Humidity
controlled via air conditioning.
IRB approval is required. Per lawsuit settlement, state must destroy spots stored without consent between July 2002 and
May 2009 by April 2010. NBS collected after
consent process implemented (on May 27,
2009) available for research.
UT 90 days 2009 Yes No Stored at room temperature
for 3 days and in refrigerator for remaining
days; placed in boxes inside bags without desiccant.
VA 6 months, unless a positive test
2009 Yes No -- not age eligible
Stored at room temperature in cardboard boxes with no
desiccant.
Notarized written request from parents is required.
VT Indefinitely Unknown No No Spots collected prior to 2003 are stored in boxes at room temperature. Spots
collected after 2003 stored in freezer conditions.

44
State Length of retention Oldest year retained
Willing to release spots with written parental consent?
Spots received? Storage conditions Notes
WA 21 years 1988 Yes Yes Stored at ambient room temperature.
IRB approval is required. IRB Authorization Agreement form must also be signed by parent.
WI 1 year 2009 Yes No -- not age eligible
Stored at 4°C in plastic bags (76 per bag) without
desiccant.
WY 6 months 2009 Maybe No -- not age eligible
Stored at room temperature. No official release policy exists.
* Reported by state newborn screening program contacts provided by the National Newborn Screening Information System115 or their designate.
45
Discussion
Forty-one percent of subjects recontacted 2-8 years after consenting to COG
protocol AADM01P1 participated in the current COG feasibility study, including 41% of
mothers completing questionnaires and 37% of families contributing signed consents.
Accurate cooperation rates cannot be calculated, since we are unable to determine if one-
third of subjects were reached. Among families in which mothers provided completed
questionnaires, however, a strong majority (82%) were willing to release their/their
child’s NBS, indicating a high level of participation in NBS research if families are
reached and engaged in the study. Nevertheless, due to limited state retention and release
practices, NBS were retrieved for only a small fraction of those requested (15%).
Notably, many states queried were willing/able to release NBS with subject consent,
however, NBS were not stored long enough to permit their release.
Prior studies assessing NBS retrieval have been conducted within single states;
these studies also differed from the current study in that investigators did not acquire
subject consent prior to specimen retrieval.68-70 Our results are consistent with those from
a nationally representative survey of 3,047 parents of children <18 years, in which 78%
of respondents indicated they would authorize state storage of their children’s NBS and
76% would be willing to release NBS for research if their permission was sought.67 Only
10% were “very unwilling” to allow NBS release. Respondents were considerably less
amenable to research conducted without parental permission (28% were willing). The
authors indicate that the definition of parental permission needs to be examined; their
results do not necessarily implicate formal written consent processes for individual

46
research projects. Notably, that survey was designed only to assess parental attitudes; no
consent forms or NBS were collected.
Telephone discussions with subjects also proved illuminating. Anecdotally,
although some parents expressed surprise that their children’s NBS may have been
retained by state newborn screening programs, none voiced objections to the practice. On
the contrary, many parents indicated interest in this potential avenue for research.
Importantly, a few parents conveyed hesitation about releasing NBS in case their children
need them in the future.
Epidemiologic research using NBS is shrouded in ethical debate. Overall, there is
conflict between societal/public health benefits versus individual rights, and regarding
ownership of the spots.54, 116, 117 Specifically, opponents of NBS research are concerned
about the preservation of data privacy, the potential for misuse of DNA, and the failure to
obtain active consent for long-term storage and secondary uses.54, 116, 117 If such concerns
are not adequately addressed, public concern may lead to reduced availability of NBS.
For example, genetic privacy advocacy groups sued the states of Texas and Minnesota in
2009, calling for the destruction of residual NBS stored without explicit parental
consent.118, 119 Although NBS were spared for this study, the settlement in Texas resulted
in the destruction of 5 million NBS by April 2010.120 At the time of publication, an
appeal was expected in the dismissed Minnesota lawsuit.121 Other states are reviewing
their policies (see Table 3-3), presumably due to similar considerations. As with any

47
research involving humans, establishing transparency and trust with subjects and the
greater public are critical.j
States storing NBS must also address logistical and budgetary issues.116 Ideal
conditions include individual storage with a desiccant and humidity indicator card at -
20°C in sealed bags with low gas permeability; humidity should be maintained at
<30%.51 Maintaining these conditions can be costly,71 especially in states with high birth
rates. Some states report storage at ambient conditions, in which temperature and
humidity can fluctuate with seasons, while others report refrigerator (2-8°C) or freezer (-
20 to -30°C) storage, with or without a desiccant.71, 122 Storage in ambient conditions
could result in denatured DNA and/or degredation of analytes, limiting the utility of and
contradicting the rationale for storing spots long-term.116 Similarly, some states package
NBS individually, while other states store them in bulk, with adjacent Guthrie cards
touching; a concern of bulk storage is the potential for cross-contamination.73
In addition to state retention and release policies, other factors have been
associated with NBS acquisition. In our study, spots were not retrieved for 2 of 310
consenting cases and there is no obvious explanation for this; identical data were
provided to states for these cases as for those with retrieved specimens. In requesting
NBS from the Maryland Department of Health and Mental Hygeine, Loffredo and Ewing
observed significantly lower retrieval rates among 522 cases with congenital heart defects
(65%) than among 1,645 population-based controls (84%).68 Among controls, 10% had
j The Danish Newborn Screening Biobank can serve as an example of a successful NBS repository; it has been storing residual NBS from all newborns since 1982 and has provisions for the release of NBS to researchers conducting approved research. Importantly, there were no known abuses of data or samples from that repository as of 2007 (Norgaard-Pedersen B, Hougaard DM. Storage policies and use of the Danish Newborn Screening Biobank. J Inherit Metab Dis. Aug 2007;30(4):530-536).
48
no laboratory number to link the participant with his/her blood spot and 6% had a lab
number, but the NBS was not located. Retrieval rates were significantly lower among low
birthweight and preterm infants; there were no significant differences for other infant or
maternal characteristics examined.
This study features unique strengths. To our knowledge, it is the first U.S. study
to attempt NBS retrieval with subject consent on a national level. The study population
was generated from a random sample of COG institutions and should therefore
reasonably represent U.S. pediatric and adolescent hematologic cancer cases, since COG
institutions treat the vast majority of leukemia and lymphoma cases ages 0-14 years in the
U.S.44, 123 Correspondingly, responding cases were born in 42 states and consent was
received for 39 of these, providing an excellent survey of the feasibility of this
methodology nationally. These results are also applicable to etiologic studies of other rare
pediatric/adolescent conditions requiring retrospective designs.
This study was designed to obtain completed questionnaires and residual NBS.
Questionnaire response rates were of interest for two reasons. First, this design simulates
the likely design of future case-control investigations of childhood cancers involving
NBS, since some pediatric malignancies are thought to be initiated in utero and since it is
useful to have information regarding exposures, potential confounders, and/or
stratification variables. Second, it serves as a test of the live CCRN (implemented in
December 2007), since a primary purpose of this registry is to facilitate future contact
regarding non-therapeutic studies.47k The 41% response rate observed in the current study
is lower than can be expected in using the current iteration of the CCRN simply because k A previous CCRN pilot study included an interview component conducted between April and December, 2004; 75 of 107 participants sampled (70%) completed an interview shortly after registration onto CCRN.

49
more subjects will likely be reached if they are contacted closer to diagnosis and CCRN
registration. Further, parents and states may be less likely to provide NBS for a feasibility
study than for etiologic studies with specific analytic hypotheses. Importantly, this
response rate may indicate selection bias, which should be accounted for in interpreting
study results. For example, individuals with higher socio-economic status tend to
participate in case-control studies of childhood cancer,124 and parents of higher
educational levels have expressed greater willingness to permit long-term NBS storage.67
The chief study limitation is that state NBS policies are continually evolving; this
report represents a snapshot in time. Some states have recently passed legislation
allowing long-term storage of NBS (Table 3-3). Conversely, 2 states have been sued
within the past year due to data privacy concerns, resulting in destruction of stored NBS
in 1, and others are reviewing their policies.
Etiologic studies of pediatric/adolescent cancers usually utilize retrospective case-
control designs, however, we did not query families of controls, who are expected to be
less motivated to participate. Parents of healthy children may be less likely to recognize
the importance or utility of NBS research or have concerns about data privacy and
therefore may be less likely to provide consent for NBS release and/or storage.67
Consistent with this idea, Tarini et al found that parents with children with very good to
excellent health were less likely to agree to NBS release or storage.67
Ideally, NBS from all U.S. infants would be cataloged and properly stored such
that they could be retrieved and released for etiologic research with appropriate scientific
justification, ethics review board oversight, and subject consent. In practice, state
retention policies are evolving. Currently, retrospective population-based case-control

50
studies of cancers or other rare disorders in children/adolescents using NBS are limited to
a few states. For example, NBS were retrieved with signed consent from 5 of 39 states
queried in this study. Fortunately, many of these have large populations to provide
reasonably sized pediatric case and control groups. Depending on subject ages and future
policies, NBS may be retrievable from an additional 9 states that store NBS ≥5 years.
Studies of conditions in young children may have the greatest success and the most
relevance to prenatal exposures. It will be of interest to observe future state policies as
they unfold.

51
Chapter 4: Review of the literature on infant leukemia, folic acid supplementation,
and genes related to folic acid metabolism
Infant leukemia
Leukemias are diagnosed in children ages <12 months (heretofore denoted “infant
leukemia”) at a rate of 40 per 1,000,000 infants (19/1,000,000 for acute lymphoblastic
leukemia, ALL; 15/1,000,000 for acute myeloid leukemia, AML; and 6/1,000,000 for
other leukemias).3 Infant leukemias are distinct from leukemias in older children and
adolescents with respect to several notable characteristics. The proportions of ALL and
AML cases are more similar among infants (47% vs. 37%, respectively), while ALL
predominates among children and adolescents (78% vs. 17% AML).3 Unlike leukemias
diagnosed in older children and adolescents, infant leukemia is associated with a poor
survival rate (ALL: 5-year survival: 57%, 10-year survival: 37%; AML: 5-year survival:
39%, 10-year survival: 34%); these survival rates have improved substantially compared
with rates in earlier decades.3
Most cases of infant leukemia (~75% of ALLs and ~60% of AMLs) are preceded
by rearrangements of the mixed lineage leukemia (MLL) gene on chromosome 11 band
q23.125, 126 Notably, MLL gene rearrangements (denoted “MLL+”) are observed among
just 6% of pediatric ALL patients overall, but the vast majority of these occur in infants
(80%).127 Similarly, 14% of childhood AML cases present with MLL rearrangements and
65% of these are found in infants.127 These rearrangements also occur commonly in
secondary AML patients (70-90%) as a result of treatment with DNA topoisomerase II
inhibitors, such as epipodophyllotoxins and anthracyclines;127 MLL+ secondary

52
leukemias are also associated with a markedly brief latency period (26 months on
average).8 The presence of an MLL gene rearrangement confers an appreciably lower
survival in infant ALL cases compared with MLL- cases (5-year survival: 5-34% versus
42-92%, respectively),128 but does not appear to affect the prognosis of infant AML.129
Twin studies have demonstrated a high concordance rate for infant leukemia
between monozygotic twins (~100% versus ~10% in older children/adolescents);
transmission of an affected clone via shared monochorionic placental circulation is
thought to be responsible.8 (Of note, the first case report of discordance was recently
published.130) This observation, coupled with evidence from backtracking studies of
neonatal blood spots demonstrating that MLL translocations are consistently present at
birth in infant leukemia cases5 provide compelling evidence that the leukemias are
initiated in utero. Further, the extremely short latency period indicates that the disease
may progress to subclinical preleukemia prior to birth.8 Infant leukemia therefore
provides a unique opportunity for etiologic research, since it occurs at the very beginning
of the life cycle, thus limiting the time period under study and the possibility of recall
bias in exposure measurement.
Folate metabolism
Vitamin B9, commonly called folic acid (in supplements) or folate (in food and in
vivo),131 plays a critical role in embryonic development due to its contributions to DNA
synthesis, cell and tissue proliferation, and DNA methylation.132 Sufficient maternal
consumption of folic acid during pregnancy has been shown in randomized controlled
trials to significantly reduce the incidence of neural tube defects (NTDs, including spina

53
bifida, anencephaly, and encephalocele) in offspring133-135 and is also postulated to play a
preventative role in the pathogenesis of childhood leukemia (as summarized below).
Since 1992, the U.S. Public Health Service has recommended a minimum daily folate
intake of 400 μg (up to a maximum of 1000 μg/day) for women of childbearing age to
reduce the prevalence of NTDs.136 To ensure this minimum level is achieved, vitamin
supplements are recommended, but tend to be underutilized in the general population
(25-41% of pregnant women across 19 U.S. states reported regular multivitamin
supplementation in the month prior to pregnancy),137 leading the governments of the U.S.
and Canada to implement mandatory folic acid fortification programs in 1998.138, 139
Specifically, the U.S. Food and Drug Administration mandated in March of 1996 that all
enriched grain products be fortified with folic acid by January 1, 1998.140 Similarly,
Health Canada required the fortification of flour, as well as some corn and rice products,
by November 1, 1998.139
A comparison of mean serum folate concentrations among women ages 15 to 44
years participating in NHANES pre- and post-fortification showed a significant increase
between NHANES III (1988-1991) and NHANES 1999 (6.3 vs. 16.2 ng/mL,
respectively); similar results were observed for red blood cell folate concentrations.141 In
addition, a 19% reduction in the incidence of neural tube defects was detected among
children conceived after the mandatory fortification program was introduced.142 Parallel
results have been observed in Canada.139, 143 These observations indicate that the
fortification programs have been successful in increasing folic acid intake among women
of childbearing age, notably decreasing the possibility of folate deficiency among
participants in this study. Of note, an ecologic study of the effects of mandatory folic acid

54
fortification in Canada found evidence supporting a protective role for folate in
neuroblastoma development (IRR = 0.55, 95% CI: 0.39-0.78), but no evidence with
respect to infant ALL or hepatoblastoma.144
Another analysis of NHANES data post-fortification (2001-2004) by Yeung et al
indicates that among non-pregnant U.S. adults, vitamin supplementation accounts for the
greatest source of variation in dietary folic acid across the population and constitutes
about 61% of total daily consumption; there was some variation in folic acid consumed
via prepared breakfast cereals but little variation in folate consumed via enriched cereal-
grain products.145 These data indicate supplement use may be a useful measure of
variation in exposure to folic acid, although supplement use is expected to be greater and
the dietary composition different among pregnant women.
Folic acid is consumed in dietary supplements as 5-methyltetrahydrofolate
monoglutamate, a bioavailable form that can be directly absorbed in the small intestine
via a transport mechanism involving solute carrier family 19 member 1 (SLC19A1, also
called reduced folate carrier, RFC1), prior to transport into the cell via the folate
receptors FOLR1 in adults and FOLR2 in the fetus.146, 147 Folate is a vital component of
two overlapping cellular pathways, including (1) the de novo synthesis of purines and
thymidylate, important building blocks of DNA, and (2) the conversion of homocysteine
to methionine, ultimately resulting in the biosynthesis of S-adenosylmethionine (SAM),
which contributes a methyl group to >100 biochemical reactions, including the
methylation of cytosine in DNA.148 These conjoined pathways are shown in Figure 4-1
below.

55
Some enzymes involved in the purine/thymidylate synthesis pathway include
5,10-methylenetetrahydrofolate reductase (MTHFR), 5-methyltetrahydrofolate-
homocysteine methyltransferase (MTR, also called methionine synthase), 5-
methylenetetrahydrafolate-homocysteine methyltransferase reductase (MTRR, also called
methionine synthase reductase), 5,10-methylenetetrahydrofolate dehydrogenase
(MTHFD1), hydroxymethyltransferase (SHMT1), thymidylate synthase (TYMS), and
dihydrofolate reductase (DHFR). Transcobalamin II (TCN2) is responsible for
transporting Vitamin B12 (cobalamin), a MTR cofactor, into the cell. Additionally,
enzymes catalyzing the synthesis and degradation of homocysteine include paraoxonase 1
(PON1), cystathionine-β-synthase (CBS), and betaine-homocysteine methyltransferase
(BHMT), which is folate-independent.147 Several non-synonymous single nucleotide
polymorphisms (SNPs) in genes encoding folate metabolism enzymes (shown in black
boxes in Figure 4-1) have been identified.
MTHFR, the most widely investigated of the folate metabolizing enzymes,
catalyzes the irreversible conversion of 5,10-methylenetetrahydrofolate to 5-
methyltetrahydrofolate (5-methyl THF). Two non-synonymous SNPs in the coding exons
of MTHFR, C677T (resulting in a valine substitution for alanine at codon 222) and
A1298T (causing alanine to replace glutamic acid at codon 429), are in strong linkage
disequilibrium and have been associated with reduced enzyme function.149 Individuals
that are heterozygous and homozygous carriers of the 677 T allele have 60% and 30% of
the activity of the wild type enzyme, respectively, while individuals with the 1298 CC
genotype display 60% of the enzymatic activity of the wild type; compound
heterozygotes (CT/AC) exhibit 50-60% of the MTHFR wild-type activity.149
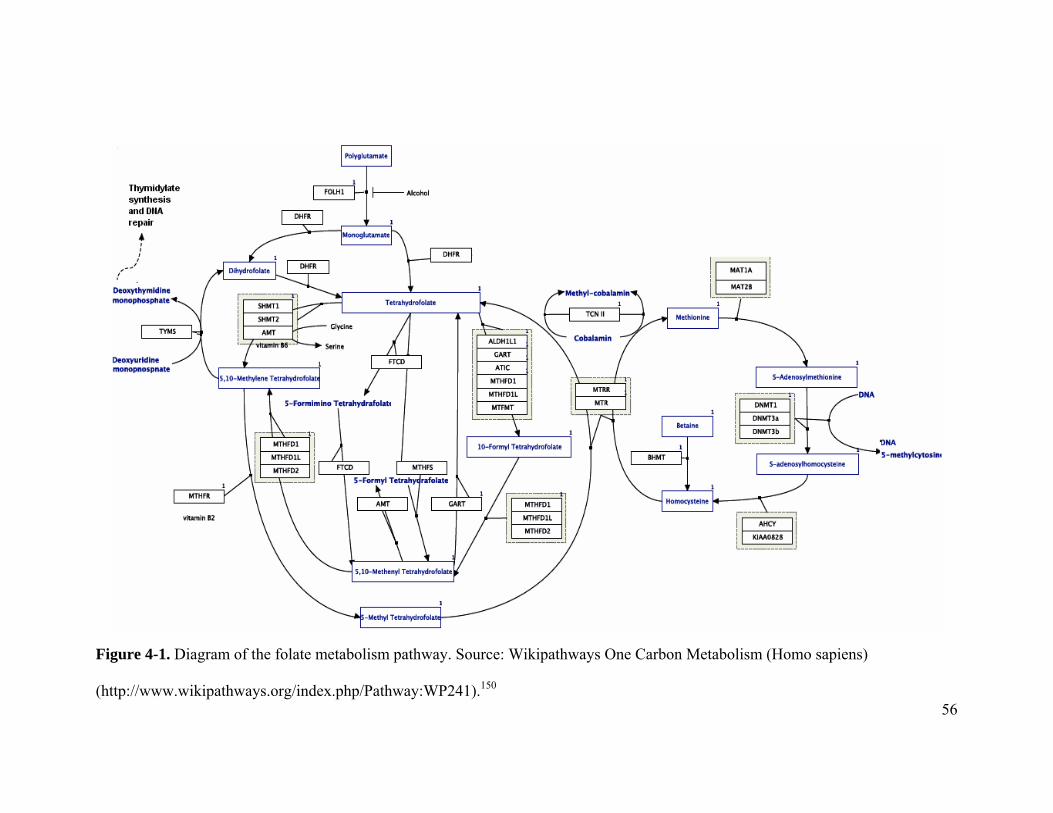
56
Figure 4-1. Diagram of the folate metabolism pathway. Source: Wikipathways One Carbon Metabolism (Homo sapiens)
(http://www.wikipathways.org/index.php/Pathway:WP241).150

57
Review of literature on vitamins, folate, iron supplementation, and childhood
leukemia
Case-control studies investigating the associations between maternal
multivitamin/folic acid and/or iron supplementation during pregnancy and pediatric
leukemia are summarized in Appendix H and are described below.
Infant leukemia. Two prior studies examining the associations between maternal prenatal
supplementation and the development of infant acute leukemia in offspring were
identified. Pombo-de-Oliveria et al reported no association between maternal
consumption of vitamins or iron supplements during pregnancy and infant leukemia
(including both ALL and AML) among those diagnosed at <21 months in Brazil (OR =
0.90, 95% CI: 0.63-1.28).151 Similarly, in a report from the Children’s Cancer Group
(CCG), Wen et al observed no association with maternal vitamin use in the year before
and during the index pregnancy (OR = 0.9, 99% CI: 0.1-7.1) or iron use during the index
pregnancy (OR = 1.1, 99% CI: 0.3-3.9) in those diagnosed with ALL at <1 year.41
Childhood ALL. An additional 10 population-based case-control studies analyzed the
associations with childhood leukemia (including infants). Of the 7 studies examining
maternal vitamin supplementation and childhood ALL, 4 reported significant inverse
effects in the range 0.40 ≤ OR ≤ 0.84,39-42 while another reported a nonsignificant inverse
association92 and 2 reported associations near the null.93, 94

58
The largest study to date, conducted by the CCG, reported a 30% reduction in risk
of ALL associated with maternal vitamin consumption (99% CI: 0-50%).41 The
association was found to vary by time period of exposure, such that vitamin
supplementation during the index pregnancy was associated with a reduction in risk of
ALL (OR = 0.7, 99% CI: 0.5-1.0), while supplementation in the year before pregnancy
was not. They also reported an inverse association for iron supplementation during
pregnancy only (OR = 0.8, 99% CI: 0.7-1.0).
Ross et al, in a Children’s Oncology Group (COG) study of leukemia among
children with Down syndrome, observed an overall reduction in risk of ALL, although
there was no evidence of a monotonic dose response with respect to the number of
supplements consumed.40 Importantly, they also noted differences in the effect based on
the time period of observation. Vitamin supplementation in the periconceptional period
(before pregnancy and early in pregnancy prior to knowledge of pregnancy) was
associated with reduced risk (OR = 0.51, 95% CI: 0.30-0.89), while supplementation
after knowledge of pregnancy was associated with increased risk (OR = 1.70, 95% CI:
0.98-2.92). This latter observation is consistent with results from recent studies of folic
acid supplementation and colorectal cancer, where a dual role for folate has been
postulated. Supplementation prior to polyp formation (the initiating event in colorectal
cancer) is thought to be protective, while supplementation after polyp formation is
thought to promote tumor growth.152, 153 No association was observed between iron
supplement use and ALL.40 The questionnaire items regarding vitamin and iron
supplementation were identical to those used in the current study.

59
Thompson et al also observed an inverse effect (OR = 0.40, 95% CI: 0.21-0.73),
although they were unable to determine whether folic acid alone or in combination with
iron was important etiologically.42 (Iron supplementation without folic acid was not
significantly associated with ALL.) Unlike the COG study, the initiation of vitamin
supplementation across each of the three time periods examined, as well as each of the
three durations of use, was associated with a significant reduction in risk; the strength of
the association did not vary by either of these exposure variables.
Schüz et al observed an overall inverse association with vitamin, folate, and/or
iron use; however, they note that the prevalence of maternal vitamin consumption was
positively correlated with familial income levels in their study.39 Since individuals with
higher socioeconomic status (SES) tend to participate in case-control studies of childhood
cancer,124 they caution that the observed effect may be attributable to selection bias.39
Kwan et al reported an inverse association between iron supplement use from 3
months prior to pregnancy through the end of breastfeeding and childhood leukemia (OR:
0.70, 95% CI: 0.51-0.97),154 while McKinney et al did not find evidence of an association
between iron use during pregnancy and leukemia or ALL, respectively.155
Two meta-analyses were conducted on subsets of these studies with respect to
childhood ALL. Upon pooling of 3 studies, the fixed effects summary odds ratio
computed by Goh et al indicated a significant reduction associated with childhood ALL
(OR = 0.61, 95% CI: 0.50-0.74).31 Dockerty et al did not find evidence of an association
with ALL upon pooling results from 3 different studies (OR = 0.9, 95% CI: 0.8-1.1).93

60
An analysis from the Northern California Childhood Leukemia Study examining
total folate consumption and iron intake, respectively, in the pre-pregnancy diet (a
surrogate for maternal prenatal diet) resulted in nonsignificant inverse associations.156
The authors acknowledge the limitation that supplement use generally increases during
pregnancy and therefore, pre-pregnancy diet may not be an adequate surrogate measure.
They also noted the positive correlation between SES and vitamin use as a possible
source of selection bias.
Finally, a case-case analysis did not find evidence of an association between
maternal prenatal vitamin consumption and ras gene mutations among childhood ALL
cases.157
Childhood AML. For AML (and acute non-lymphocytic leukemia, ANLL), each of the 3
identified studies failed to find evidence of an association with maternal prenatal vitamin
and/or iron supplementation.39, 40, 95
It is important to note that there was heterogeneity in the specific exposures
measured and the exposure windows considered across all of the identified studies.
Review of the literature regarding SNPs in the folate metabolism pathway and
childhood leukemia
Infant Leukemia. A single study examining folate metabolism SNPs and infant leukemia
has been reported in the literature, to our knowledge. Wiemels et al examined the
distribution of two non-synonymous coding SNPs in MTHFR at nucleotide positions 677
61
(C>T) and 1298 (A>C) in 37 cases of MLL+ infant leukemia versus 200 cord blood
controls.158 Although the number of cases was modest, they reported a reduced risk for
acute leukemia (ALL and AML) associated with the CT (OR = 0.29, 95% CI: 0.09-0.79)
and TT (OR = 0.67, 95% CI: 0.16-2.53) genotypes at position 677, as well as for the CT
and TT genotypes combined (ORCT+TT = 0.36, 95% CI: 0.15-0.85). They did not find
evidence of an association with the SNP at nucleotide 1298 (ORAC = 1.35, 95% CI: 0.53-
3.63; ORCC = 1.33, 95% CI: 0.32-5.29) or among carriers of the C allele (ORAC+CC =
1.14, 95% CI: 0.49-2.73). In contrast, there were no significant associations for SNPs at
these loci among childhood ALL cases with TEL-AML1 translocations.
Although subject ages were not specified, Lightfoot et al observed an association
between MLL+ leukemia (n = 34 cases) and the homozygous variant GG genotype of the
MTR SNP at position 2756 (OR = 4.90, 95% CI: 1.30-18.45).159 They did not observe
associations for polymorphisms in MTHFR, SHMT1, or TYMS, however.
Childhood leukemia. Results of prior childhood leukemia studies of polymorphisms in
the folate metabolizing genes MTHFR, MTR, MTRR, MTHFD1, NNMT, RFC1, SHMT1,
and TYMS, as well as those examining gene-gene and gene-environment interactions, are
described below. Of note, all but 2 of these investigations were restricted to childhood
ALL (2 examined AML159, 160) and all but 2 of them159, 161 evaluated the child’s, but not
the mother’s, genotype. Only 1 childhood leukemia study has examined gene-
environment interactions of 2 SNPs in the folate metabolism pathway162 and 3 studies
have assessed gene-gene interactions.159, 163, 164

62
MTHFR.
A number of studies have investigated the association between childhood ALL
and SNPs in MTHFR, allowing for the conduct of two meta-analyses published in 2006.
The first meta-analysis by Zintaras et al included 4 studies of the C677T SNP.165 An
analysis contrasting the frequency of the T versus C allele yielded a statistically
significant inverse summary OR of 0.74 (95% CI: 0.57-0.96); the inverse association at
position 677 held when different allelic contrasts were conducted (i.e., comparison of
homozygotes, recessive model, dominant model). In addition, 3 studies investigating the
A1298C SNP were pooled to compare the frequency of the C versus A allele and resulted
in a nonsignificant inverse summary estimate (OR = 0.87, 95% CI: 0.68-1.11). The
authors caution that there is moderate to high heterogeneity among the results of the
included studies for the SNP at position 1298.
The second meta-analysis by Pereira et al included a greater number of studies
(677: 10 studies and 1289: 8 studies) but failed to find evidence of an association at either
locus under a recessive model (677: ORTT vs. CT+CC = 0.88, 95% CI: 0.73-1.06; 1289:
ORCC vs. AC+AA = 0.80, 95% CI: 0.56-1.16).166 The authors note that the results of the
pooled analysis for the 677 locus are robust to model selection (fixed versus random
effects and different genetic models) and various sensitivity analyses. There was modest
heterogeneity in the studies of the 1298 SNP. In contrast to the pediatric results, they
observed a statistically significant inverse association for the 677 SNP among adult ALL
patients upon pooling data from three studies (ORTT vs. CT+CC = 0.45, 95% CI: 0.26-0.77).
There was no association at nucleotide position 1298 in adult cases.

63
At least 5 additional studies of childhood ALL and MTHFR SNPs have been
published subsequent to the two meta-analyses. In an analysis of UKCCS data, Lightfoot
et al observed an inverse association with the T allele at position 677 among AML (n =
58; ORCT = 0.51, 95% CI: 0.30-0.87; ORCT+TT = 0.61, 95% CI: 0.38-0.98) but not ALL
cases.159 Conversely, an inverse association with the C allele at position 1298 was found
among ALL (n = 685; ORAC = 0.79, 95% CI: 0.64-0.97; ORAC+CC = 0.79, 95% CI: 0.64-
0.97) but not AML cases. The latter association was restricted to B-lineage ALL cases
upon stratification by subtype. In a Dutch study of 245 pediatric ALL cases and 500
controls, de Jonge et al detected an inverse association with the 677 T allele (ORCT = 0.7,
95% CI: 0.5-1.0; ORCT+TT = 0.7, 95% CI: 0.5-1.0) and failed to detect an association for
the 1298 C allele.164 In a Slovenian study, Petra et al reported no significant difference in
the distribution of the C677T/A1298C haplotypes between 68 ALL cases and 258
controls; the ORs were >1 for 5 of the 6 variant haplotypes observed (range: 0.81 ≤ OR ≤
2.34).163
A Korean study involving 66 cases and 100 controls did not find evidence of an
association with one or more copies of the T allele at position 677, although a monotonic
dose response was suggested (no p-value was provided for the trend).167 They reported
elevated odds of ALL associated with the AC genotype at position 1298 (ORAC = 2.22,
95% CI: 1.09-4.51) but there were only 1 case and 2 control participants with the CC
genotype, limiting their power to detect an association. Similarly, a Filipino study, which
included 191 ALL cases and 394 controls, did not report a greater frequency of the CT
and TT genotypes at nucleotide 677 among cases, but did observe a higher case

64
frequency of the AC and CC genotypes at position 1298 (ORAC = 1.48, 95% CI: 1.00-
2.19; ORCC = 1.86, 95% CI: 1.11-3.10; ORAC+CC = 1.57, 95% CI: 1.08-2.28).168
Interestingly, the 677 T allele is much less prevalent in Filipino children then in
Caucasian children (10% versus 30%, respectively) while the 1298 C allele is more
common (37% versus 32%, respectively). The elevated ORs reported in the latter two
studies for the 1298 SNP are in direct opposition to the inverse associations reported
earlier.
A Brazilian study examined the distribution of the same MTHFR SNPs among
182 childhood and adolescent AML patients and 315 healthy controls.160 They did not
observe an association with respect to either SNP among white children/adolescents;
however, among non-whites they found a 2.7-fold decreased risk associated with the
heterozyote genotype at position 677 (ORCT = 0.37, 95% CI: 0.14-0.92), as well as an
inverse association for one or more copies of the variant (T) allele (ORCT+TT = 0.45; 95%
CI: 0.20-1.02), and a 2.9-fold increased risk associated with the 1298 heterozygote
genotype (ORAC = 2.90, 95% CI: 1.26-6.71), with an increased risk for one or more
copies of the variant (C) allele (ORAC+CC = 2.32; 95% CI: 1.06-5.11).
Two studies have examined maternal genotype in reference to leukemia in
offspring. UKCCS investigators examined associations between maternal genotype for
MTHFR SNPs C677T and A1298C and childhood ALL and AML, respectively; they did
not find evidence for an association with either locus for either malignancy.159 In a
Canadian case-control study, Krajinovic et al also failed to observed an association
between maternal genotype for these SNPs and childhood ALL, although the relatively

65
small number of mothers included in this analysis (n = 94) may have limited statistical
power to detect an association.161
MTR. The A-to-G transition at nucleotide position 2756 of MTR has been investigated in
4 prior studies of childhood leukemia. Lightfoot et al reported significant positive
associations for ALL (ORAG = 1.24, 95% CI: 1.00-1.53; ORGG = 1.88, 95% CI: 1.16-
3.07; ORAG+GG = 1.31, 95% CI: 1.07-1.60) and AML (ORGG = 2.74, 95% CI: 1.07-7.01;
ORAG+GG = 1.62, 95% CI: 1.01-2.60) upon genotyping the index children, but no
associations among their mothers.159 Gast et al genotyped 460 childhood ALL patients
and 552 controls and found a positive association among heterozygotes (ORAG = 1.2,
95% CI: 1.0-1.8), but no association among homozygotes.169 Petra et al reported no
association for one or more copies of the variant allele, although their results may
indicate an inverse association.163 No association was observed in the Dutch study for this
locus.164
MTRR. Associations between childhood ALL and 4 MTRR polymorphisms have been
explored in the literature. For the A66G SNP, Gast el al reported an inverse association
for both heterozygotes (ORAG = 0.7, 95% CI: 0.5-1.0) and homozygotes (ORGG = 0.6,
95% CI: 0.4-0.9),169 while de Jonge et al and Petra et al observed nonsignificant inverse
associations.163, 164 Gast et al did not compute significant ORs for SNPs at positions 524
(C>T), 1049 (A>G), or 1783 (C>T), however.169 Results of a haplotype analysis
(A66G/C524T/A1049G/C1783T) indicate that the ACAC (OR = 2.3, 95% CI: 1.8-2.9)

66
and GTAC (OR = 1.8, 95% CI: 1.4-2.3) haplotypes are associated with increased risk of
ALL, while the GCAC haplotype is associated with reduced risk (OR = 0.5, 95% CI: 0.4-
0.6).169
MTHFD1. Gast et al evaluated two polymorphisms of MTHFD1, including SNPs at
positions 401 (G>A) and 1958 (G>A), yielding no statistically significant associations
with pediatric ALL.169
NNMT. de Jonge et al examined the IVS -151 (C>T) polymorphism and found a positive
association for pediatric ALL among homozygous variants (ORTT = 2.2, 95% CI: 1.1-
4.6).164
RFC1. In examining the RFC1 SNP at position 80 (G>A), Gast et al reported a positive
association with ALL among heterozygotes (ORGA = 1.4, 95% CI: 1.1-1.9) and a null
association among homozygous variants. de Jonge et al also observed a positive
association with ALL at this locus (ORAA = 2.1, 95% CI: 1.3-3.2; ORGA+AA = 1.5, 95%
CI: 1.1-2.1).164
SHMT1. There were no observed associations for the C-to-T transition at position 1420 in
relation to childhood ALL in the studies by Lightfoot et al, de Jonge et al, and Gast et
al.159, 164, 169 There was also no association observed for pediatric AML in the UKCCS
study.159

67
TYMS. The TYMS polymorphisms of interest include a 28-base pair (bp) repeat in the 5’
untranslated region (UTR), where 2 repeats (2R) is the more prevalent allele and 3
repeats (3R) can be considered the variant, and a 6-bp deletion in the 3’UTR. deJonge et
al observed a reduced risk for pediatric ALL among heterozygotes for the 2R/3R
polymorphism (OR2R/3R = 0.7, 95% CI: 0.5-1.0);164 none of the other 3 studies examining
this polymorphism indicated an effect with respect to childhood ALL159, 163, 169 or
AML,159 however, although a monotonic dose response was suggested in the Slovenian
study (no p-value was provided for the trend). Lightfoot et al observed a positive
association between homozygous variants for the 6-bp deletion among both ALL (OR6bp-
/6bp- = 1.46, 95% CI: 1.02-2.08) and AML cases (OR6bp-/6bp- = 2.04, 95% CI: 1.03-4.03).159
There was no evidence of an association with the 6-bp deletion in the German study,
however.169
Gene-gene interactions. Petra et al evaluated multiplicative gene-gene interactions
between MTHFR, MTR, MTRR and TYMS via logistic regression.163 They report an
interaction of borderline significance between carriers and non-carriers of the MTHFR
677 T allele and the MTR 2756 G allele across cases and controls (OR = 0.45, 95% CI:
0.19-1.04), as well as a significant interaction between carriers and non-carriers of the
MTHFR 677 T allele, the MTR 2756 G allele, and the MTRR 66 G allele (OR = 0.31,
95% CI: 0.11-0.91). De Jonge et al found 2 significant multiplicative interactions, such
that those who are homozygous for the wild-type NNMT IVS-151 C allele and carriers of

68
the MTHFR 677 T allele have reduced risk of pediatric ALL (OR = 0.5, 95% CI: 0.4-0.8),
and those who are homozygous for the RFC1 80 A allele and carriers of the NNMT IVS-
151 T allele have increased risk (OR = 4.2, 95% CI: 1.8-9.7).164 Lightfoot et al observed
evidence of a multiplicative interaction between the MTR 2756 SNP and the TYMS 6bp
deletion among ALL cases, such that heterozygotes for the MTR SNP were more likely to
have ≥1 copies of the TYMS deletion (p = 0.05).159 There were also 2 suggested
interactions between the MTHFR 1298 SNP and the SHMT1 1420 SNP (p = 0.09) and the
TYMS 3R polymorphism (p = 0.11), respectively.
Gene-environment interactions. In a case-only analysis involving 82 case-mother pairs,
Milne et al observed no statistically significant evidence of an interaction between child’s
genotype and maternal prenatal vitamin supplementation on the multiplicative scale for
either the 677 or 1298 MTHFR SNP, after adjustment for sex, age, and the genotype at
the other locus.162 For both loci, the ORs suggested that the odds of ALL were greater
than the products of the independent effects when one or more copies of the variant allele
were present and the mother reported no prenatal folate consumption (OR677 = 1.40, 95%
CI: 0.73-2.67, OR1298 = 1.25, 95% CI: 0.65-2.40), but were lower than expected in the
presence of folate (OR677 = 0.59, 95% CI: 0.26-1.31, OR1298 = 0.49, 95% CI: 0.20-1.19).
Of note, a prior case-control analysis from this study indicated an inverse association
with maternal prenatal vitamin supplementation;42 the main effects of the SNPs could not
be investigated via this study design.

69
Krajinovic et al investigated the potential for modification of the effect of the two
MTHFR SNPs by national folic acid fortification in Canada beginning in 1996.161 Upon
stratification on date of birth (before January 1, 1996 versus January 1, 1996 or
thereafter), they observed a significant inverse association for MTHFR haplotypes
including one or more variant alleles only among children born prior to 1996, with ORs
in the range 0.3-0.6. The ORs among children born in 1996 or later were nonsignificant,
but may suggest an increase in risk overall (1.3≤OR≤3.0).
Possible mechanisms of leukemogenesis
Two potential mechanisms involving DNA instability have been suggested in the
literature to explain the association between folate deficiency and cancer (reviewed in 170,
171). The first mechanism concerns folate’s involvement in the synthesis of nucleotide
precursors. The theory suggests that in a state of folate deficiency, the methylation of
deoxyuridine monophosphate (dUMP, a uracil precursor) by TYMS to produce thymidine
monophosphate (TMP) is diminished, causing uracil to be inserted into DNA instead.170,
172 Uracil DNA glycosylase excises the misplaced uracil, thereby creating a transient
single strand break (SSB); when two of these SSBs arise simultaneously in close
proximity (within ~14 bp), double strand breaks (DSBs) ensue.172 Of note, in situations of
folate deficiency, high levels of uracil are misincorporated in DNA (at a rate of 4 million
per cell) and results of mathematical modeling suggest the probability of two proximal
uracil moieties increases rapidly with increasing uracil insertion.172 It has also been
demonstrated that DNA extracted from blood and bone marrow of folate deficient
individuals has increased numbers of DSBs.172

70
DSBs may be repaired by either homologous recombination (HR) or by non-
homologous end-joining (NHEJ).10, 173 NHEJ is responsible for the majority of DSB
repairs in multicellular eukaryotes and although it is a very flexible mechanism, it is also
less accurate than HR and can result in translocations or other chromosomal
rearrangements.10, 173 Chronic folate deficiency with repeated uracil misincorporation and
excision is thought to lead to a “catastrophic” DNA repair cycle, chromosomal
aberrations, and ultimately to malignant transformation.170
There is support for this potential mechanism with respect to MLL+ infant
leukemia. In a study of t(4;11) translocations, Reichel et al observed that (1) a minimum
of one DSB on one chromosome and a SSB on another must have occurred prior to the
translocation event and (2) small segments of DNA adjacent to the break points had been
deleted, inverted, or duplicated in the translocation.174 A follow-up report from the same
research group indicates that the observed t(4;11) translocations are consistent with
NHEJ repair.175
The most frequently observed MLL rearrangements include translocations t(4;11)
(MLL-AF4), t(11;19) (MLL-ENL), and t(9;11) (MLL-AF9) in infant ALL128 and t(6;11)
(MLL-AF6), t(9;11) (MLL-AF9), t(10;11) (MLL-AF10) and t(11;19) (MLL-ENL) in
infant AML;10, 129 these translocations are similar to one another in that they occur in-
frame and result in functional chimeric fusion gene proteins that act as modified
transcription factors.10 The novel transcription factors have been shown in to act in a
dominant gain-of-function manner to promote hematopoietic cell transformation in
mouse models.176 They do not appear to be sufficient for leukemogenesis, however, as a

71
latency period follows the MLL rearrangement, suggesting additional hits are needed.176
Possible mechanisms of action by which they increase cell susceptibility to additional
genetic aberrations include inducing rapid proliferation of the affected cell, increasing
DNA instability, or blocking DNA repair mechanisms.8 Notably, MLL+ cells show an
accumulation of other chromosomal abnormalities at diagnosis, such as alterations in
tumor suppressor gene p53, the ras oncogene, and FLT3, which is important to the
proliferation and differentiation of primitive hematopoietic stem cells.8 (Copy number
variation was notably absent, however, among infant MLL+ cases with t(4;11)
translocations.177) A modified version of the mechanism as it applies to infant leukemia is
shown in Figure 4-2 below.
The second mechanism relates to potential epigenetic effects due to the
participation of folate as a cofactor in the DNA methylation pathway. Here, folate
deficiency reduces the available pool of SAM, the principle methyl donor for DNA,
leading to DNA hypomethylation. Hypomethylation occurring within a proto-oncogene
promoter region can result in the activation of the proto-oncogene, eventually resulting in
malignant transformation.170
Folatedeficiency
Uracilmisincorporation DSB NHEJ MLL
rearrangementp53, RAS,
FLT3mutations
Infant leukemia
Altered transcriptional
regulation
?
Figure 4-2. Proposed mechanism for the development of MLL+ infant leukemia

72
Global hypomethylation has been observed in several malignancies.178 In a study
of 307 childhood and adult ALL cases, Roman-Gomez et al observed global
hypomethylation within leukemic cells; the functional significance of this observation is
not yet known.178 More specifically, prior studies of solid tumors have found
hypomethylation within proto-oncogenes170 and Watt et al observed that the promoter
region of HOX11 was demethylated in leukemic cells from ALL cases expressing the
gene, suggesting that hypomethylation activates the proto-oncogene.179 Importantly,
results of murine feeding studies indicate that folate deficiency is sufficient to induce
hypomethylation of proto-oncogenes.170
At this point it is not clear whether maternal or fetal genes, or a combination of
the two, are the most important determinants of folate metabolism with respect to infant
leukemia. Labuda et al reported that parental genes at some loci may be important
predictors of ALL in offspring.180 Most prior studies of childhood leukemia have been
limited to evaluation of the child’s genotype, however; the 2 prior studies examining
maternal SNPs failed to show an association with ALL or AML in their children.159, 161
Christensen et al observed that the risk of NTDs increased when mothers were carriers of
the variant T allele for the MTHFR SNP at position 677; the observed risk was greater
when both mother and child were carriers.181 Further, research by Jirtle and colleagues
has demonstrated that varying the levels of maternal gestational folic acid consumption
can modulate offspring phenotype (i.e., size, coat color) via DNA methylation in the
viable yellow agouti (Avy/a) mouse.182

73
Iron supplementation and leukemogenesis
Prenatal iron supplementation may indicate low iron levels, anemia, or a desire to
prevent anemia, and maternal anemia was associated with childhood leukemia in three
prior case-control studies.81, 82, 102 The inverse associations between maternal prenatal
iron supplementation and childhood leukemia previously observed in some41, 154, but not
all, studies are consistent with an etiologic model in which iron deficiency is related to
childhood leukemia. Notably, in a prior report from the first phase of the current study,
there was no evidence for an association between maternal iron supplement use or
maternal anemia during pregnancy, as recorded in the medical record, and infant
leukemia, ALL, or AML, or among the MLL subgroups.183
On the contrary, high iron levels may be detrimental to developing fetuses184 and
have been associated with increased cancer risk in adults.185 The biological mechanism is
unknown, however, it has been hypothesized that excess iron may generate reactive
oxygen species that exert a genotoxic effect or may act by increasing cell proliferation or
altering immune function.186 An association between prenatal iron supplementation and
childhood leukemia may exist only in the presence of genetic variants. Associations
between SNPs in two iron homeostasis genes (i.e., hereditary hemochromatosis gene
(HFE), hepcidin antimicrobial peptide (HAMP)) and childhood leukemia have been
observed on the order of 2.00<OR<3.00 among British populations.187, 188
Theoretical model of causation
The hypothesized association between maternal folic acid consumption and infant
leukemia is depicted in the directed acyclic graph (DAG) in Figure 4-3 below, where

74
folic acid (F) causes underlying biological changes (B), leading ultimately to a reduced
risk of infant leukemia (L).
Figure 4-3. Directed acyclic graph depicting the hypothesized association between folic
acid consumption and infant leukemia, where D = demographic factors (e.g., sex, race,
maternal age, socioeconomic status), F = folic acid, B = underlying biological changes, L
= infant leukemia, G = genetic susceptibility, and K = lifestyle factors (e.g., maternal
prenatal consumption of alcohol or tobacco).
The commonly cited epidemiological definition of a confounder is a variable that
is a risk factor for the outcome of interest, associated with the exposure of interest in the
source population, and is not on the causal pathway.189 This definition has been found to
be insufficient, however. The structural definition of confounding is bias that is created
by an unblocked backdoor path via a common cause of the exposure and disease of
interest.190 In the analysis, conditioning on one or more confounding variables in a path
blocks the backdoor path.190 Here, potential confounders include demographic factors
(D), such as the sex and race of the child, maternal age, and familial socio-economic
status (SES), and lifestyle factors (K), such as maternal consumption of alcohol or
F B L
G
K
D

75
tobacco products. A brief literature review of these factors is provided below. (Please
note that it is difficult to represent gene-environment interactions in a DAG.)
Sex. The incidence rate of infant leukemia is 24% higher among female infants than
among male infants (RRLeukemia = 1.24, 95% CI: 1.01-1.52; RRALL = 1.74, 95% CI: 1.29-
2.37; RRAML = 1.15, 95% CI: 0.80-1.66).191 Although it seems improbable that mothers
would vary their vitamin consumption based on the gender of their unborn child (if the
gender was even known), the possibility remains that the vitamins may be processed
differently by male versus female fetuses. Therefore, sex will be considered as a potential
confounder.
Race/Ethnicity. Maternal vitamin consumption has been associated with race. A report
from the CDC’s Pregnancy Risk Assessment Monitoring System (PRAMS) 2000 data
indicates that women reporting a race of white or other were significantly more likely
than black women, and non-Hispanic women were more likely than Hispanic women, to
report multi-vitamin consumption in the month before the index pregnancy (a surrogate
for pregnancy vitamin use) in a majority of U.S. states surveyed.137 These data do not
support a protective role for folate with respect to leukemogenesis, however, as infant
leukemia is diagnosed 30% and 15% more often among white children in the U.S. than
among black or Asian/Pacific Islander children, respectively (RRwhite/black = 1.30 95% CI:
0.93-1.82; RRwhite/API = 1.15, 95% CI: 0.81-1.67).191

76
Maternal age. Increasing maternal age was positively correlated with multi-vitamin
supplementation in the month prior to conception in the PRAMS report in all of the 19
states examined,137 suggesting older mothers would be more likely to ingest prenatal
vitamins. Similarly, a United Kingdom study of determinants of folic acid
supplementation in the first trimester of pregnancy observed that women <21 years were
less likely than women ≥21 years to report supplement use.192 Maternal age at the time of
the index child’s birth has been inconsistently associated with infant leukemia, however.
A recent report found the distribution of age among case mothers was significantly
greater than that of control mothers,151 while a second study indicated a lower risk for
maternal age <20 years (OR = 0.53, 95% CI: 0.32-0.88) and no association with maternal
ages ≥35 years,193 and a third study did not report any statistically significant
associations, but did observe a suggested protective effect for maternal age >20 years.194
Two earlier studies did not find evidence of an association with maternal age.195, 196 It is
therefore difficult to predict the degree or direction of confounding that maternal age may
have on the association of interest.
Maternal education level. In all 19 states queried in PRAMS, women reporting >12 years
of education were significantly more likely to confirm preconceptional multivitamin use
than women with ≤12 years of education.137 The association between maternal
educational attainment and infant leukemia has been inconsistently reported in three prior
studies. A report from a series of three studies conducted by the CCG described a trend of
reduced risk of infant leukemia with increasing maternal education compared with those

77
who had attended some high school or less (ORHS graduate = 0.49, 95% CI: 0.28-0.85;
OR>HS graduate = 0.40, 95% CI: 0.24-0.69),194 and a Brazilian study found a different
distribution of education among case and control mothers (p = 0.001), but no obvious
pattern was observed,151 while a study in California reported null associations across all
levels of maternal educational attainment.193 Of note, each of these studies used slightly
different definitions of “infants.”
SES/Income. Medicare recipients were significantly less likely to indicate multivitamin
use prior to conception than those not receiving Medicare across all 19 states
participating in PRAMS.137 Likewise, the UK study reported lower folic acid use in the
first trimester of pregnancy among women in lower social classes.192 An analysis of the
1987 National Health Interview Survey (NHIS) responses also indicated a similar
finding; multivitamin use increased incrementally among U.S. adults with increasing
income (<$5,000: 11.1% versus >$50,000: 20.9%).197 In contrast, higher socioeconomic
status is considered an established risk factor for childhood leukemia, although the
underlying mechanism has not been confirmed.4 Infant leukemia data presented by
Pombo-de-Oliveira et al are consistent with this general finding; they observed a greater
distribution of wealth among families of cases (p = 0.001).151 Ross et al found the
converse in their analysis of three CCG studies; compared to the lowest income group
(<$10,000), they observed an inverse association with infant leukemia for all higher
income groups examined (ptrend = 0.03).194

78
Maternal prenatal alcohol exposure. Alcohol consumption may block the absorption of
folate from food.149 An analysis of the 1987 NHIS data failed to find evidence of an
association between frequency of alcohol use and multivitamin supplementation among
U.S. adults, however.197 Surprisingly, the 1999-2000 National Health and Nutrition
Examination Survey (NHANES) data indicated that supplement use increased with
increasing consumption of wine and distilled spirits, but found no differences by
frequency of beer consumption.198 The literature on the association between maternal
prenatal alcohol use and childhood leukemias has also been inconsistent. In study of
infant leukemia, Alexander et al reported no association with maternal alcohol
consumption during pregnancy overall or for any of the diagnostic subgroups examined
(MLL+, MLL-, ALL, AML).97 Of the 11 studies evaluating maternal prenatal alcohol
consumption and childhood leukemia or ALL, 5 observed no evidence of an
association,38, 85, 90, 96, 97 while 3 found significantly increased risk associated with any use
during pregnancy, with ORs in the range of 1.4-2.0,98-100 and a fourth study reported a
nonsignificant positive association for any alcohol use during pregnancy.101 Two studies
observed inverse ORs of 0.57 (95% CI: 0.34-0.95)102 and 0.7 (95% CI: 0.5-0.9),103
respectively. Of the 7 studies investigating the association with AML, 3 failed to find
evidence of an association,97, 99, 100 while 3 found evidence of a sizable positive
association with ORs in the range 1.9-2.6,96, 98, 101 and a fourth reported a nonsignificant
positive association.104

79
Maternal prenatal tobacco smoke exposure. Data from the 1987 NHIS indicate that
current smokers (15.7%) are significantly less likely than never (23.6%) and former
smokers (26.0%) to report multi-vitamin use.197 This pattern was also observed in the
1999-2000 NHANES data (26.6% vs. 36.0% vs. 41.6%, respectively).198 Similarly, the
U.K. study indicated that smokers were less likely to consume folic acid supplements
during the first trimester of pregnancy (p<0.001).192Although the data are consistent with
respect to tobacco use and vitamin supplementation, they are less consistent with respect
to maternal smoking during pregnancy and childhood leukemia. Alexander et al did not
observe an association between maternal smoking during pregnancy and infant leukemia
overall or for any of the subgroups examined (MLL+, MLL-, ALL, AML).97 A meta-
analysis did not provide evidence of increased risk of acute leukemias/ALL in children
with maternal prenatal smoking (8 studies, OR = 1.05, 95% CI: 0.82-1.34). Several
studies have been published since that meta-analysis was conducted. For acute leukemia,
an additional 10 studies found no association,85, 99-101, 107-112 while a large cohort study in
Sweden computed an inverse association between maternal smoking in the first trimester
and ALL (HR = 0.73, 95% CI: 0.58-0.91), but reported a nonsignificant positive
association with AML (HR = 1.41, 95% CI: 0.74-2.67).113
Significance of the research
Leukemias diagnosed in infants have specific biological features compared to
leukemias in older children, resulting in poor infant survival rates. These characteristics
implicate a distinctive leukemic etiology among this unique patient population. Due to
the early onset of disease, the prenatal time period and the maternal environment (as

80
determined by maternal genotype and exposure to other agents) are thought to play a
particularly important role. The beneficial effects of prenatal folic acid consumption in
preventing neural tube defects have been documented in randomized controlled trials.
There is reasonable evidence to suspect a beneficial effect with respect to childhood
leukemias as well, particularly among ALL cases. Based on one estimate, up to 900 cases
of pediatric leukemia could be prevented in the U.S. annually by multivitamin
supplementation;31 it is unknown what proportion of these would be infant leukemias.
The Epidemiology of Infant Leukemia study is the largest study to date to
investigate the unique etiology of acute leukemia among infants. The study enrolled 443
infant cases from participating Children’s Oncology Group institutions across the U.S.
and Canada, as well as 324 population-based controls. Mothers were asked to complete a
one-hour telephone interview, provide access to their child’s diagnostic information, and
to provide biological specimens from themselves and/or their child for the purpose of
genetic analysis.
In the current analysis, maternal prenatal vitamin and iron supplementation were
assessed via maternal interview to estimate the main effects of these exposures with
respect to the risk of infant leukemia.

81
Chapter 5: Maternal vitamin and iron supplementation and risk of infant leukemia:
A report from the Children’s Oncology Group
Sufficient maternal prenatal folic acid consumption reduces neural tube defects in
offspring; epidemiologic evidence also suggests a preventative role in childhood
leukemia. Infant leukemia originates in utero and may have a distinct etiology, as
evidenced by the high prevalence of mixed lineage leukemia (MLL) gene translocations.
This case-control analysis was performed to examine the associations between maternal
prenatal vitamin and iron supplementation and infant leukemia. Mothers of 443 cases (n
= 264 acute lymphoblastic leukemia (ALL), n = 172 acute myeloid leukemia (AML))
diagnosed at <12 months at COG institutions in 1996-2006 and mothers of 324
frequency-matched controls completed telephone interviews. The associations were
evaluated via unconditional logistic regression, resulting in odds ratios (ORs) and 95%
confidence intervals (CIs). After adjustment for race/ethnicity and income, there was
little evidence supporting an association between periconceptional vitamin use (OR =
0.89, 95% CI: 0.64-1.24), use after knowledge of pregnancy (OR = 0.78, 95% CI: 0.48-
1.28), or use in all periods (OR = 0.84, 95% CI: 0.62-1.14) and infant leukemia.
Likewise, there was little evidence of an effect of periconceptional iron supplementation
(OR = 1.23, 95% CI: 0.63-2.38), use after knowledge of pregnancy (OR = 1.06, 95% CI:
0.74-1.53), or use in all periods (OR = 2.54, 95% CI: 0.69-9.39). Similar results were
observed among ALL and AML cases analyzed separately. Reduced risk was suggested
in ALL MLL+ cases for vitamin use throughout the periconceptional/prenatal period (OR

82
= 0.66, 95% CI: 0.44-1.00). Overall, we found little evidence supporting these
associations and speculate this may be attributable to high rates of supplementation
and/or folic acid fortification programs implemented during the study period.
Introduction
Leukemias diagnosed in children ages <12 months (“infant leukemia”) are distinct
from leukemias in older children/adolescents. Most infant leukemias (~75% of acute
lymphoblastic leukemias (ALLs) and ~60% of acute myeloid leukemias (AMLs)) are
preceded by rearrangements of the mixed lineage leukemia (MLL) gene on chromosome
11 band q23.125, 126 MLL rearrangements (denoted “MLL+”) confer appreciably lower
survival in infant ALL cases compared with MLL- cases (5-year survival: 5-34% versus
42-92%, respectively),128 but may not affect the prognosis of infant AML.129
A high concordance rate of infant leukemia has been demonstrated for
monozygotic twins (~100% versus ~10% in older children/adolescents); transmission of
an affected clone via shared monochorionic placental circulation may be responsible.8
This observation, coupled with results from backtracking studies of neonatal blood spots
demonstrating that MLL translocations are consistently present at birth in infant leukemia
cases5, provides compelling evidence of in utero initiation. Further, the extremely short
latency indicates the disease may progress to subclinical preleukemia prior to birth.8
There are few established risk factors for childhood leukemia, including
predisposing genetic conditions, exposure to in utero or postnatal therapeutic irradiation,
and exposure to chemotherapeutic agents.4 Folic acid is a critical nutrient for developing
fetuses; sufficient prenatal consumption of folic acid significantly reduces the incidence

83
of neural tube defects (NTDs) and congenital heart defects.133, 135 Accordingly, the U.S.
Public Health Service has recommended a minimum daily folate intake of 400 μg for
women of childbearing age since 1992136 and the U.S. and Canada implemented national
folic acid fortification programs in 1998.138, 139 Folic acid may be preventative for
childhood leukemia as well, particularly among ALL cases.39-42 Prenatal iron
supplementation (30mg/day) is also recommended to meet high iron demands during
pregnancy.199 Maternal prenatal iron supplementation has been investigated as a risk
factor for childhood leukemia with inconsistent results.40-42, 93, 154, 155 The current analysis
was conducted to investigate the effects of maternal prenatal vitamin and iron
supplementation, respectively, on the risk of acute infant leukemia.
Methods
Details regarding this study have been previously published200, 201 and are
described below.
Participant eligibility/identification
Cases. Infants (<12 months) with confirmed diagnoses of ALL or AML (ICD-O codes202:
9801, 9803, 9805, 9821, 9823, 9835, 9836, 9837, 9861, 9863, 9867, 9871-9874, 9891,
9895-9897, 9910, 9913) during two time periods (Phase 1: January 1996 – October 2002
and Phase 2: January 2003 – December 2006) were eligible if they were
diagnosed/treated at Children’s Oncology Group (COG) institutions in the U.S. or
Canada and had no prior Down syndrome diagnosis, physician approval for contact,

84
residential telephones, and biological mothers that spoke English (Phases 1 and 2) or
Spanish (Phase 2) and consented to participate. Deceased cases were eligible.
Controls. Controls were frequency matched to cases on year of birth and location of
residence. Controls were required to have a biological mother that spoke English or
Spanish, consented to participate, and had a residential telephone.
In Phase 1, controls were identified via random digit dialing (RDD) via a revised
version of the Waksberg method,203 wherein telephone numbers were constructed from
area codes and exchanges of cases, and remaining digits were randomly generated.
Several contact attempts were made for each telephone number generated (≤9); if the
number did not correspond to an eligible control, the family refused, or no contact was
made, the next potential number was queried.
Due to secular trends in telephone usage,204 RDD was not considered a viable
option for Phase 2. Instead, rosters of potential controls, randomly selected based on the
anticipated distribution of birth year of Phase 2 cases, were requested from state birth
registries. Rosters were received from 15 states to represent the northeastern (NJ and
PA), southeastern (FL, KY, NC, and TN), Midwestern (MI, MN, and MO), south central
(LA and TX), northwestern (OR and WA), and southwestern (CA and UT) regions of the
United States. Potential controls were randomly selected from these rosters. If mothers
refused participation, replacement subjects were selected until willing participants were
identified.
85
Data collection
Mothers were asked to complete 1-hour telephone interviews in which they were
asked if they consumed vitamin supplements in four time periods (anytime in the year
before or during the index pregnancy; in the year before pregnancy; early in but prior to
knowledge of pregnancy; and after knowledge of pregnancy).l For each of these time
periods, they were asked to specify the type of supplement(s) consumed and whether or
not the supplement was prescribed by a health care professional. Indicator variables were
then created to assess vitamin use in the periconceptional period (year before pregnancy
and early in but prior to knowledge of pregnancy) and from 1 year before through the
index pregnancy. An equivalent set of items concerned iron supplementation that
exceeded the iron found in multivitamins.
Mothers of cases were also asked to release their child’s diagnostic information,
including results of any fluorescent in situ hybridization (FISH), Southern blot, or reverse
transcription polymerase chain reaction (RT-PCR) analyses and/or other cytogenetics
testing. Three independent reviewers (J.M.H., S.M.D., and N.A.H.) evaluated the
submitted materials to determine if there was evidence of an MLL gene rearrangement
(MLL+, n = 228), evidence of no translocation (MLL-, n = 146), or insufficient evidence
to make a determination (n = 69).
l Items from the interview instrument regarding maternal prenatal vitamin and iron supplementation are shown in Appendix I.

86
Statistical methods
Unconditional logistic regression (SAS 9.2, SAS Institute Inc., Cary, NC) was
performed to quantify associations between maternal supplement consumption and acute
leukemia among combined cases, and among ALL, AML, MLL+, MLL-, ALL MLL+,
ALL MLL-, AML MLL+ and AML MLL- cases analyzed separately. Odds ratios (ORs)
and 95% confidence intervals (CIs) were produced. Potential confounders selected a
priorim are listed in Table 5-1. Variables were retained in the multivariable models if they
substantially (≥10%) changed effect estimates for ALL and/or AML on the natural
logarithm scale after adjustment for the other factors. Factors retained include maternal
race/ethnicity (white, black, Hispanic, other) and household income in the year of the
child’s birth (≤$30,000, $30,001-$75,000, >$75,000). Adjustment for matching factors
(year of birth, region of residence) did not materially alter point estimates, although
confidence intervals were wider;n these factors were therefore not included in the final
models, as they did not appear to act as confounders in these data.
To assess the robustness of the results, a number of stratifications were
performed. The proportions of case mothers reporting vitamin use in the two phases and
ORs corresponding to the two phases were compared to identify secular changes in
vitamin use. To detect effects of folic acid fortification of the food supply, the ORs for
vitamin use in three different time periods (before folic acid fortification, during
implementation, after implementation) were compared. The time periods differed slightly
m Potential confounders selected a priori included infant sex, birthweight, and gestational age; maternal age, race/ethnicity, and educational attainment; prior fetal loss; morning sickness; smoking during pregnancy; alcohol consumption during pregnancy; and household income in the year of the child’s birth. n Three cases born outside of North America had to be excluded for this analysis.
87
between the U.S. and Canada; these differences were accounted for in the analysis.
Finally, ORs for vitamin use were compared across U.S. regions (defined above) or
Canadian residence to detect geographic differences in supplementation.
Institutional Review Boards at the University of Minnesota and participating
COG institutions approved the study. Ethics board approvals were also sought from states
providing birth certificate data.
Results
A total of 443 case (n = 264 ALL and n = 172 AML) and 324 control interviews
were completed across the two study phases. As previously reported, maternal interviews
were completed for 240 of 348 eligible cases (69%) and for 255 of 430 eligible controls
(59%) in Phase 1.200 One control was subsequently excluded from analysis, as he/she was
discovered in the interview to have Down syndrome. In Phase 2, 345 potential cases were
identified through 133 participating COG institutions and 240 were enrolled. Of those
eligible, 203 (59%) mothers completed interviews, while the remainder did not due to
maternal refusal (22%), inability to locate the mother (11%), physician refusal (6%), and
institutional failure to approach the mother during the study period (2%). Of 267 potential
birth certificate controls, 70 completed interviews and 1 partially completed an interview
(27%).201 Results of our prior analysis indicate that controls from the two phases were
similar enough on important demographic factors to warrant merging them.201
Cases and controls were similar with respect to infant gender, birthweight, and
length of gestation, and maternal age at the index child’s birth, prior fetal loss, and
smoking during pregnancy (Table 5-1). Compared with control mothers, case mothers

88
were more likely to have less education (34% versus 28% with less than a high school
diploma), be non-white (24% versus 15%), have a lower income (36% versus 30%
making ≤$30,000, difference is nonsignificant), experience morning sickness (71%
versus 63%), and report no alcohol consumption during the index pregnancy (86% versus
79%).
Notably, a large majority of case (91%) and control mothers (94%) reported any
vitamin use in the year before and/or during the index pregnancy. After adjustment for
race/ethnicity and income, there was little evidence supporting associations between any
maternal vitamin use in the year before and/or during pregnancy (OR = 0.79, 95% CI:
0.44-1.42), in the periconceptional period (OR = 0.89, 95% CI: 0.64-1.24), after
knowledge of pregnancy (OR = 0.78, 95% CI: 0.48-1.28), or use in all of these periods
(OR = 0.84, 95% CI: 0.62-1.14) and infant leukemia (Table 5-2), although all ORs were
<1.00. Restricting exposure to use only after knowledge of pregnancy generated
comparable results to those described above (data not shown). Similar results were
observed among ALL and AML cases analyzed separately (Table 5-2); ORs for ALL
were consistently <1.00, while ORs for AML fluctuated around the null. Stratification on
the presence of MLL translocations did not provide additional information, with the
exception of ALL MLL+ cases, in whom a reduced risk was suggested for vitamin use
throughout the periconceptional/prenatal periods (OR = 0.66, 95% CI: 0.44-1.00; Table
5-3).
The proportions of case mothers reporting vitamin use in the two phases were
nearly identical (91% reported any vitamin use in both phases) and there was no evidence
89
of heterogeneity of the ORs for vitamin use across the phases (data not shown). There
was also no evidence of heterogeneity upon stratification by folate fortification period or
region of residence, although there was limited power to detect differences given the
smaller cell counts after stratification (data not shown).
Fewer mothers reported any iron supplement use beyond multi- or prenatal
vitamins (24% of cases versus 22% of controls). There was little evidence of an effect of
additional iron supplement use any time in the year before and/or during pregnancy (OR
= 1.07, 95% CI: 0.75-1.52), in the periconceptional period (OR = 1.23, 95% CI: 0.63-
2.38), after knowledge of pregnancy (OR = 1.06, 95% CI: 0.74-1.53), or use in all periods
(OR = 2.54, 95% CI: 0.69-9.39) after accounting for race/ethnicity and income (Table 5-
2), although each of these ORs was >1.00. Among those who reported iron
supplementation, there was no association with prescription by a health care professional
(data not shown). Further analysis by leukemic subtype (ALL vs. AML, MLL+ vs.
MLL-) did not yield additional insight (Tables 5-2 and 5-3).

90
Table 5-1. Selected characteristics of 443 infant leukemia cases and 324 controls and associations with leukemia. Controls Combined Cases ALL AML N (%) N (%) OR 95% CI N (%) OR 95% CI N (%) OR 95% CI Infant characteristics Gender Male 156 (48.2) 218 (49.2) 1.00 133 (50.4) 1.00 84 (48.8) 1.00 Female 168 (51.9) 225 (50.8) 0.96 0.72 – 1.28 131 (49.6) 0.91 0.66 – 1.27 88 (51.2) 0.97 0.67 – 1.41 Birthweight <2500 grams 17 (5.3) 23 (5.2) 0.99 0.52 – 1.90 9 (3.4) 0.65 0.29 – 1.50 14 (8.1) 1.57 0.75 – 3.29 2500-4000 grams 258 (79.6) 351 (79.2) 1.00 209 (79.2) 1.00 135 (78.5) 1.00 >4000 grams 49 (15.1) 69 (15.6) 1.04 0.69 – 1.54 46 (17.4) 1.16 0.75 – 1.80 23 (13.4) 0.90 0.52 – 1.54 Length of gestation <38 weeks 35 (10.8) 55 (12.4) 1.17 0.75 – 1.84 31 (11.7) 1.10 0.66 – 1.84 23 (13.4) 1.27 0.72 – 2.23 38-42 weeks 288 (88.9) 387 (87.4) 1.00 232 (87.9) 1.00 149 (86.6) 1.00 >42 weeks 1 (0.3) 1 (0.2) 0.74 0.05 – 11.95 1 (0.4) 1.24 0.08 – 19.98 0 (0.0) -- Maternal characteristics Age at index child's birth <35 years 265 (82.0) 372 (84.2) 1.00 228 (86.4) 1.00 139 (81.3) 1.00 ≥35 years 58 (18.0) 70 (15.8) 0.86 0.59 – 1.26 36 (13.6) 0.72 0.46 – 1.13 32 (18.7) 1.05 0.65 – 1.70 Previous fetal loss None 241 (74.4) 337 (76.1) 1.00 199 (75.4) 1.00 133 (77.3) 1.00 1 64 (19.8) 76 (17.2) 0.85 0.59 – 1.23 44 (16.7) 0.83 0.54 – 1.28 31 (18.0) 0.88 0.54 – 1.42 ≥2 19 (5.9) 30 (6.8) 1.13 0.62 – 2.05 21 (8.0) 1.34 0.70 – 2.56 8 (4.7) 0.76 0.33 – 1.79

91
Educational attainment < High school graduate 91 (28.2) 149 (33.7) 1.47 1.02 – 2.11 94 (35.7) 1.52 1.01 – 2.29 53 (30.8) 1.36 0.84 – 2.19 Some post-high school 112 (34.7) 125 (28.3) 1.00 76 (28.9) 1.00 48 (27.9) 1.00 College graduate 120 (37.2) 168 (38.0) 1.25 0.89 – 1.77 93 (35.4) 1.14 0.77 – 1.70 71 (41.3) 1.38 0.88 – 2.16 Ethnicity White 273 (84.5) 334 (75.6) 1.00 199 (75.7) 1.00 130 (75.6) 1.00 African-American 18 (5.6) 18 (4.1) 0.82 0.42 – 1.60 11 (4.2) 0.84 0.39 – 1.81 7 (4.1) 0.82 0.33 – 2.00 Hispanic 15 (4.6) 55 (12.4) 3.00 1.66 – 5.42 29 (11.0) 2.65 1.39 – 5.08 24 (14.0) 3.36 1.71 – 6.62 Other 17 (5.3) 35 (7.9) 1.68 0.92 – 3.07 24 (9.1) 1.94 1.01 – 3.70 11 (6.4) 1.36 0.62 – 2.98 Household income ≤$30,000 95 (29.6) 157 (35.8) 1.27 0.91 – 1.77 100 (38.2) 1.45 1.00 – 2.12 54 (31.8) 1.01 0.65 – 1.55 $30,001 - $75,000 145 (45.2) 189 (43.1) 1.00 105 (40.1) 1.00 82 (48.2) 1.00 >$75,000 81 (25.2) 93 (21.2) 0.88 0.61 – 1.27 57 (21.8) 0.97 0.64 – 1.48 34 (20.0) 0.74 0.46 – 1.20 Morning sickness No 120 (37.0) 128 (28.9) 1.00 76 (28.8) 1.00 51 (29.7) 1.00 Yes 204 (63.0) 315 (71.1) 1.45 1.07 – 1.96 188 (71.2) 1.46 1.03 – 2.06 121 (70.4) 1.40 0.94 – 2.08 Smoking during pregnancy
No 258 (79.9) 368 (83.3) 1.00 213 (81.0) 1.00 149 (86.6) 1.00 Yes 65 (20.1) 74 (16.7) 0.80 0.55 – 1.15 50 (19.0) 0.93 0.62 – 1.41 23 (13.4) 0.61 0.37 – 1.03 Drinking during pregnancy
No 254 (78.6) 377 (85.7) 1.00 220 (83.7) 1.00 151 (88.8) 1.00 Yes 69 (21.4) 63 (14.3) 0.62 0.42 – 0.90 43 (16.4) 0.72 0.47 – 1.10 19 (11.2) 0.46 0.27 – 0.80
OR = odds ratio; 95% CI = 95% confidence interval; ALL = acute lymphoblastic leukemia; AML = acute myeloid leukemia

92
Table 5-2. Association between vitamin use and infant leukemia Controls Combined Cases ALL AML N N OR* 95% CI N OR* 95% CI N OR* 95% CI Prenatal vitamins Any prenatal vitamin consumption
No 19 40 1.00 28 1.00 11 1.00 Yes 303 402 0.79 0.44 – 1.42 235 0.63 0.34 – 1.18 161 1.20 0.53 – 2.75 Periconceptional consumption No 100 162 1.00 104 1.00 56 1.00 Yes 222 280 0.89 0.64 – 1.24 159 0.77 0.54 – 1.11 116 1.05 0.68 – 1.61 Consumption during pregnancy, after confirmation of pregnancy No 29 58 1.00 39 1.00 18 1.00 Yes 293 384 0.78 0.48 – 1.28 224 0.66 0.39 – 1.11 154 1.05 0.55 – 2.04 Consumption in year before and throughout pregnancy No 137 222 1.00 137 1.00 83 1.00 Yes 185 220 0.84 0.62 – 1.14 126 0.77 0.55 – 1.09 89 0.88 0.60 – 1.31

93
Controls Combined Cases ALL AML N N OR* 95% CI N OR* 95% CI N OR* 95% CI Prenatal iron supplements Any prenatal iron consumption
No 253 334 1.00 195 1.00 136 1.00 Yes 70 108 1.07 0.75 – 1.52 68 1.22 0.82 – 1.80 36 0.82 0.51 – 1.33 Periconceptional consumption No 308 414 1.00 247 1.00 160 1.00 Yes 15 28 1.23 0.63 – 2.38 16 1.30 0.62 – 2.72 12 1.26 0.55 – 2.88 Consumption during pregnancy, after confirmation of pregnancy No 260 345 1.00 201 1.00 141 1.00 Yes 63 97 1.06 0.74 – 1.53 62 1.22 0.81 – 1.84 31 0.77 0.46 – 1.27 Consumption in year before and throughout pregnancy No 320 431 1.00 256 1.00 168 1.00 Yes 3 11 2.54 0.69 – 9.39 7 3.04 0.77 – 12.03 4 1.72 0.33 – 9.06
OR = odds ratio; 95% CI = 95% confidence interval; ALL = acute lymphoblastic leukemia; AML = acute myeloid leukemia * ORs adjusted for maternal race (white, black, Hispanic, other) and household income (≤$30,000, $30,001 - $75,000, >$75,000).

94
Table 5-3. Association between vitamin use and infant leukemia by MLL gene status Controls MLL+ MLL- N N OR* 95% CI N OR* 95% CI Prenatal vitamins Any prenatal vitamin consumption
No 19 22 1.00 7 1.00 Yes 303 205 0.72 0.37 – 1.41 139 1.34 0.54 – 3.32 Periconceptional consumption No 100 87 1.00 50 1.00 Yes 222 140 0.83 0.57 – 1.22 96 0.94 0.61 – 1.46 Consumption during pregnancy, after confirmation of pregnancy No 29 30 1.00 14 1.00 Yes 293 197 0.75 0.43 – 1.33 132 1.01 0.51 – 2.01 Consumption in year before and throughout pregnancy No 137 116 1.00 71 1.00 Yes 185 111 0.81 0.56 – 1.17 75 0.85 0.56 – 1.28

95
Controls MLL+ MLL- N N OR* 95% CI N OR* 95% CI Prenatal iron supplements
Any prenatal iron consumption
No 253 174 1.00 105 1.00 Yes 70 53 1.10 0.72 – 1.68 41 1.23 0.77 – 1.97 Periconceptional consumption No 308 218 1.00 132 1.00 Yes 15 9 0.85 0.35 – 2.03 14 1.89 0.87 – 4.11 Consumption during pregnancy, after confirmation of pregnancy No 260 176 1.00 113 1.00 Yes 63 51 1.18 0.76 – 1.82 33 1.04 0.64 – 1.71 Consumption in year before and throughout pregnancy No 320 222 1.00 143 1.00 Yes 3 5 2.55 0.57 – 11.36 3 2.08 0.40 – 10.87
OR = odds ratio; 95% CI = 95% confidence interval; ALL = acute lymphoblastic leukemia; AML = acute myeloid leukemia; MLL = mixed lineage leukemia * ORs adjusted for maternal race (white, black, Hispanic, other) and household income (≤$30,000, $30,001 - $75,000, >$75,000).

96
Table 5-3 (Continued). Association between vitamin use and infant leukemia by MLL gene status Controls ALL MLL+ ALL MLL- AML MLL+ AML MLL- N N OR* 95% CI N OR* 95% CI N OR* 95% CI N OR* 95% CI Prenatal vitamins Any prenatal vitamin consumption
No 19 18 1.00 3 1.00 4 1.00 4 1.00 Yes 303 138 0.60 0.29–1.21 74 1.54 0.44–5.45 64 1.13 0.35–3.68 62 1.14 0.37–3.55 Periconceptional consumption No 100 66 1.00 25 1.00 21 1.00 24 1.00 Yes 222 90 0.69 0.45–1.05 52 1.00 0.57–1.73 47 1.11 0.60–2.04 42 0.89 0.50–1.59 Consumption during pregnancy, after confirmation of pregnancy No 29 24 1.00 8 1.00 6 1.00 6 1.00 Yes 293 132 0.64 0.35–1.17 69 0.86 0.37–2.01 62 1.10 0.42–2.91 60 1.17 0.45–3.01 Consumption in year before and throughout pregnancy
No 137 87 1.00 35 1.00 29 1.00 35 1.00 Yes 185 69 0.66 0.44–1.00 42 0.95 0.56–1.59 39 1.13 0.64–2.01 31 0.73 0.42–1.28
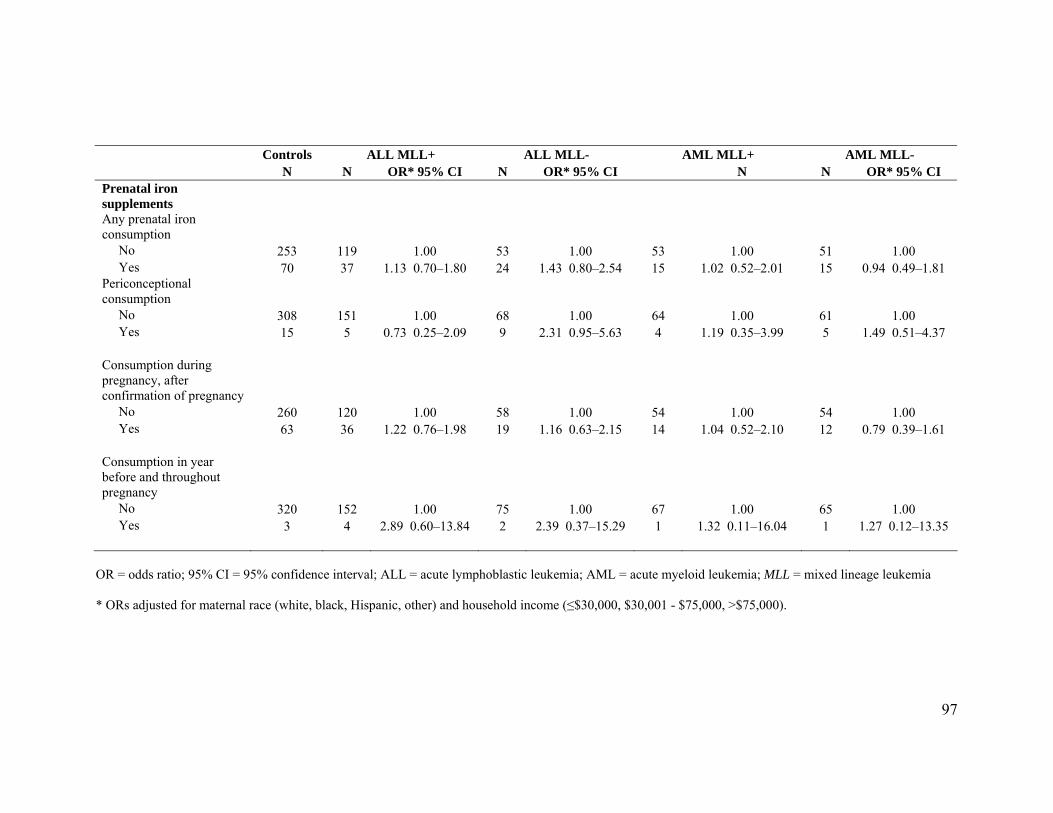
97
Controls ALL MLL+ ALL MLL- AML MLL+ AML MLL- N N OR* 95% CI N OR* 95% CI N N OR* 95% CI Prenatal iron supplements
Any prenatal iron consumption
No 253 119 1.00 53 1.00 53 1.00 51 1.00 Yes 70 37 1.13 0.70–1.80 24 1.43 0.80–2.54 15 1.02 0.52–2.01 15 0.94 0.49–1.81 Periconceptional consumption No 308 151 1.00 68 1.00 64 1.00 61 1.00 Yes 15 5 0.73 0.25–2.09 9 2.31 0.95–5.63 4 1.19 0.35–3.99 5 1.49 0.51–4.37 Consumption during pregnancy, after confirmation of pregnancy No 260 120 1.00 58 1.00 54 1.00 54 1.00 Yes 63 36 1.22 0.76–1.98 19 1.16 0.63–2.15 14 1.04 0.52–2.10 12 0.79 0.39–1.61 Consumption in year before and throughout pregnancy
No 320 152 1.00 75 1.00 67 1.00 65 1.00 Yes 3 4 2.89 0.60–13.84 2 2.39 0.37–15.29 1 1.32 0.11–16.04 1 1.27 0.12–13.35
OR = odds ratio; 95% CI = 95% confidence interval; ALL = acute lymphoblastic leukemia; AML = acute myeloid leukemia; MLL = mixed lineage leukemia
* ORs adjusted for maternal race (white, black, Hispanic, other) and household income (≤$30,000, $30,001 - $75,000, >$75,000).

98
Discussion
Overall, we found little evidence supporting an association between prenatal
vitamin or iron supplementation and infant leukemia. These results are consistent with a
prior report of no association between maternal consumption of vitamin or iron
supplements during pregnancy and infant leukemia (ALL and AML) among those
diagnosed at <21 months in Brazil,151 and another report indicating no association with
maternal vitamin or iron use during the index pregnancy in those diagnosed with ALL at
<1 year.41
Of 7 studies examining maternal vitamin and/or iron supplementation and
childhood ALL, 4 observed significant inverse effects in the range 0.40 ≤ OR ≤ 0.84,39-42
while another reported a nonsignificant inverse association92 and 2 found associations
near the null.93, 94 Iron supplement use was associated with reduced odds of ALL in 2
studies 41, 154 and was not associated in 4 others.40, 42, 93, 155 Notably, Thompson et al
observed an inverse effect for folic acid supplementation (OR = 0.40, 95% CI: 0.21-
0.73), although they were unable to determine whether folic acid alone or in combination
with iron was important etiologically; the OR for iron supplementation without folic acid
was not significant.42 For AML (and acute non-lymphocytic leukemia, ANLL), each of 3
identified studies failed to find evidence of an association with maternal vitamin and/or
iron supplementation.39, 40, 95
In examining different time periods, we found no evidence of an association with
vitamin or iron supplementation, respectively, relevant to the year before pregnancy and
prior to knowledge of pregnancy, or after knowledge of pregnancy, or use in all of these

99
periods. In contrast, Thompson et al reported that the initiation of vitamin
supplementation across each of three periods examined, as well as each of three durations
of use, was associated with a considerable reduction in risk; the strength of the
association did not vary by either of these exposure variables. Wen et al observed that
prenatal vitamin and iron supplementation, respectively, were associated with reduced
risk of ALL (ORvitamins = 0.7, 99% CI: 0.5-1.0; ORiron = 0.8, 99% CI: 0.7-1.0), while
supplementation in the year before pregnancy was not.41 Ross et al found that vitamin
supplementation in the periconceptional period was associated with reduced risk of
leukemia in children with Down syndrome (OR = 0.51, 95% CI: 0.30-0.89), while
supplementation after knowledge of pregnancy was associated with increased risk (OR =
1.70, 95% CI: 0.98-2.92).40
The reduced odds observed in ALL MLL+ cases is of interest, given that maternal
vitamin supplementation has been inversely associated with childhood ALL but not
AML,39-42, 95 folate deficiency has been associated with increased levels of DNA double
strand breaks (which precede MLL translocations174) in blood and bone marrow,172 and
that mothers of ALL MLL+ cases are expected to recall vitamin supplementation
similarly to mothers in other diagnostic subgroups.
Two mechanisms have been suggested to explain the association between folate
deficiency and cancer (reviewed in 170, 171). The first mechanism concerns folate’s
involvement in the synthesis of nucleotide precursors. In a state of folate deficiency,
biosynthesis of thymine is diminished, causing uracil to be inserted into DNA instead.170,
172 In the process of excising a misplaced uracil, a transient single strand break (SSB) is

100
created; when two such SSBs arise simultaneously in close proximity (within ~14 bp),
double strand breaks (DSBs) ensue.172 Errors in DSB repairs can result in translocations
or other chromosomal rearrangements.10, 173 Chronic folate deficiency with repeated
uracil misincorporation and excision is thought to lead to a “catastrophic” cycle of DNA
repair, resulting in chromosomal damage, and ultimately in malignancy.170 The second
mechanism relates to potential epigenetic effects due to the participation of folate as a
cofactor in the DNA methylation pathway, wherein folate deficiency reduces the
available pool of S-adenosylmethionine (SAM), the principle methyl donor for cytosine
in DNA, leading to DNA hypomethylation.170 Hypomethylation of a promoter region can
result in activation of a proto-oncogene, and ultimately malignant transformation.170
Common variants in folate metabolizing genes may confer different risk for infant
leukemia due to altered protein function. In the single published study examining folate
metabolism single nucleotide polymorphisms (SNPs) and infant leukemia, Wiemels et al
reported a reduced risk for acute infant leukemia associated with one or more copies of
the variant allele (ORCT = 0.29, 95% CI: 0.09-0.79; ORTT = 0.67, 95% CI: 0.16-2.53;
ORCT+TT = 0.36, 95% CI: 0.15-0.85) at 5,10-methylenetetrahydrofolate reductase
(MTHFR) position 677.158 They did not find evidence of an association with the MTHFR
SNP at nucleotide 1298.158 Although subject ages were not specified, Lightfoot et al
observed an association between MLL+ leukemia and the homozygous variant GG
genotype of the MTR SNP at position 2756 (OR = 4.90, 95% CI: 1.30-18.45).159 They did
not observe associations for polymorphisms in MTHFR, SHMT1, or TYMS, however.

101
Several childhood leukemia studies have examined MTHFR SNPs166 and a few
have also assayed polymorphisms in 8 other folate metabolizing genes with varying
results by locus.159, 163, 164, 169
It is also possible that maternal or fetal genotype may modify the effect of folic
acid supplementation. Krajinovic et al investigated the potential for modification of the
effect of the two MTHFR SNPs by national folic acid fortification in Canada beginning in
1996.161 Upon stratification on birth year, they observed a significant inverse association
for MTHFR haplotypes including ≥1 variant alleles among children born prior to 1996,
with ORs in the range 0.3 to 0.6. The ORs among children born in 1996 or later were
nonsignificant, but may suggest an increase in risk overall (1.3 ≤ OR ≤ 3.0). In a case-
only analysis, Milne et al observed no statistically significant evidence of a multiplicative
interaction between child’s genotype and maternal prenatal vitamin use for either the 677
or 1298 MTHFR SNPs.162
Prenatal iron supplementation may indicate low iron levels, anemia, or a desire to
prevent anemia, and maternal anemia was associated with childhood leukemia in three
prior case-control studies.81, 82, 102 The inverse associations between maternal prenatal
iron supplementation and childhood leukemia previously observed in some41, 154, but not
all, studies are consistent with an etiologic model in which iron deficiency is related to
childhood leukemia. Notably, in a prior report from the first phase of this study, there was
no evidence for an association between maternal iron supplement use or maternal anemia
during pregnancy, as recorded in the medical record, and infant leukemia, ALL, or AML,
or among the MLL subgroups, respectively.183

102
On the contrary, high iron levels may be detrimental to developing fetuses184 and
have been associated with increased cancer risk in adults.185 The biological mechanism is
unknown, however, it has been hypothesized that excess iron may generate reactive
oxygen species that exert a genotoxic effect or may act by increasing cell proliferation or
altering immune function.186 An association between prenatal iron supplementation and
childhood leukemia may exist only in the presence of genetic variants. Associations
between SNPs in two iron homeostasis genes (i.e., hereditary hemochromatosis gene
(HFE), hepcidin antimicrobial peptide (HAMP)) and childhood leukemia have been
observed on the order of 2.00 < OR < 3.00 among British populations.187, 188
The current study features unique strengths. It comprises the largest study of
infant leukemia conducted to date, and likely ever to be conducted; 2 prior infant
leukemia studies included 136 and 202 cases, respectively.97, 151 Use of the COG registry
in case ascertainment results in a nearly population-based sample, since COG institutions
see nearly 100% of childhood leukemia cases aged 0-4 years.123
Differential recall across cases and controls is a noteworthy concern, as case
mothers may exert extra effort to accurately recall prior exposures to understand why
their child developed cancer. The majority of women in a validation study accurately
reported their folic acid supplement use during pregnancy, while ≤7% over-reported
supplementation.205 In another study of pregnancy outcomes, self-reported rates of
vitamin use dropped significantly from early pregnancy to post-delivery among mothers
of cases (7.3% versus 2.5%, respectively) and controls (6.0% versus 3.5%); the resulting
ORs did not differ significantly across the two time points, however.206 Case mothers in a

103
study of sudden infant death syndrome recalled prenatal iron use 3% (95% CI: -9%-13%)
better than control mothers and were 7% (95% CI: -20%-8%) more likely to report iron
use that was not recorded in the medical record.207 These differences equated to a
modestly higher interview OR than that calculated from medical records. Together these
results suggest that although the maternal recall of supplementation may vary somewhat
by case-control status and time period of assessment, the inferences to be drawn are
similar. In the current study, infant leukemia provides a unique opportunity for etiologic
research, since it limits the recall time period and therefore the possibility of recall bias.
There are additional potential sources of misclassification in these data. Most
mothers reported taking multi- or prenatal vitamins, which contain many vitamins and
minerals including folic acid and iron; it is therefore impossible to identify which is the
etiologically relevant component. To partially address this concern, we restricted our
analysis to vitamins containing folic acid and found that a large majority of mothers (98%
of cases and controls, respectively) consumed vitamins with folic acid; results were
nearly identical to those shown in Tables 5-2 and 5-3 (data not shown). Similarly,
questions regarding iron supplementation requested information regarding
supplementation in excess of multi- and prenatal vitamins, but all mothers taking
multivitamins received some level of iron supplementation.
We were also unable to assess the contribution of maternal diet to total folate or
iron intake. An analysis examining total folate and iron consumption, respectively, in the
pre-pregnancy diet (a surrogate for prenatal diet) resulted in nonsignificant inverse
associations with childhood ALL.156 The authors acknowledged the limitation that pre-
104
pregnancy diet may not be an adequate surrogate measure because supplement use
generally increases during pregnancy.156 An analysis of National Health and Nutrition
Examination Survey (NHANES) data post-fortification (2001-2004) indicated that
vitamin supplementation accounted for the greatest source of variation in dietary folic
acid among non-pregnant U.S. adults and constitutes ~61% of total daily consumption;
there was some variation in folic acid consumed via prepared breakfast cereals but little
variation in folic acid consumed via enriched cereal-grain products.145 These data suggest
supplement use may be a useful measure of variation in folic acid exposure, although
supplement use is expected to be greater and the dietary composition different among
pregnant women.
Another potential limitation is that we might only expect to see evidence of an
effect in the presence of folate deficiency,149 however, fortification programs have been
successful in increasing folic acid intake among women of childbearing age,139, 141-143o
thereby decreasing the prevalence of folate deficiency among participants in this study.
Of note, an ecologic study of the effects of fortification in Canada found evidence
supporting a protective role for folate in neuroblastoma development (IRR = 0.55, 95%
CI: 0.39-0.78), but no association with infant ALL or hepatoblastoma.144
o A comparison of mean serum folate concentrations pre- and post-fortification among U.S. women ages 15-44 years showed a significant increase between NHANES III (1988-1991) and NHANES 1999 (6.3 vs. 16.2 ng/mL, respectively); similar results were observed for red blood cell folate concentrations (Folate Status in Women of Childbearing Age - United States, 1999. MMWR Weekly 49: 962-965). A 19% reduction in the incidence of neural tube defects was also detected among children conceived after the mandatory fortification program was introduced (Honein MA, Paulozzi LJ, Mathews TJ, Erickson JD, Wong LY (2001) Impact of folic acid fortification of the US food supply on the occurrence of neural tube defects. Jama 285: 2981-6). Parallel results have been observed in Canada (Ray JG, Meier C, Vermeulen MJ, Boss S, Wyatt PR, Cole DE (2002a) Association of neural tube defects and folic acid food fortification in Canada. Lancet 360: 2047-8; and Ray JG, Vermeulen MJ, Boss SC, Cole DE (2002b) Increased red cell folate concentrations in women of reproductive age after Canadian folic acid food fortification. Epidemiology 13: 238-40).

105
Differential response rates across cases and controls are a potential limitation, as
they may indicate selection bias. Individuals with higher SES tend to participate in case-
control studies of childhood cancer,124 and maternal prenatal vitamin use has been shown
to vary by SES, race, and educational attainment.137, 192 A comparison of baseline
characteristics showed that RDD and birth certificate controls were very similar on
important demographic factors, however, participants differed from the U.S. population
in maternal age, race, education, and marital status and in the child’s gestational age and
birthweight.201 Participating mothers identified by birth certificates were also older and
had higher educational levels than non-participants.201 We adjusted for maternal
race/ethnicity and income in our analysis to minimize confounding by SES, but
acknowledge that residual confounding may remain.
Overall, we found little evidence supporting an association between maternal
prenatal vitamin use and infant leukemia, and speculate that this may be attributable to
high rates of folic acid supplementation, including personal vitamin use and national folic
acid fortification programs implemented in the U.S. and Canada early in the study period.
Similarly, we did not observe an association with iron supplement use above that found
in multi- or prenatal vitamins.
106
Chapter 6: Review of the literature regarding the association between childhood
and adolescent leukemia and atopic disease
Childhood/adolescent leukemia
Leukemia is the most commonly diagnosed cancer among children and
adolescents in the United States with an incidence rate of 42 cases per 1,000,000 persons;
the incidence has been increasing in recent years (average annual percent change for
1992-2004: 0.7%, 95% confidence interval (CI): -0.1-1.5%).3 The incidence varies by
age, with 40 cases/1,000,000 diagnosed among infants, 85/1,000,000 among those ages
1-4 years at diagnosis, 38/1,000,000 among those 5-9 years, 28/1,000,000 in those ages
10-14 years and 27/1,000,000 among those aged 15-19 years.3
Acute leukemia is a malignancy of the bone marrow, resulting in the excess
production of leukocytes. It is a heterogeneous disease, affecting the lymphocytes in
acute lymphoblastic leukemia (ALL), myeloid cells in acute myeloid leukemia (AML), or
both (biphenotypic or mixed lineage leukemia). ALL is further classified depending on
the involvement of precursor B cells or T cells. The peak in ALL incidence observed in
early childhood (≤5 years) is mainly attributable to a subtype of B-lineage cells
expressing CD10 surface antigens and is therefore often called common ALL (cALL).208
Immune-related hypotheses specific to the development of cALL have been proposed by
Greaves11, 12 and Schmiegelow,209 and Kinlen has also described a more general
hypothesis for leukemogenesis;210, 211 these hypotheses are discussed briefly below.
As noted in the Overview above, there is a paucity of information regarding the
etiology of childhood leukemia; established risk factors include predisposing genetic

107
conditions, such as Down syndrome,13 neurofibromatosis type I,14 and fanconi anemia,15
exposure to in utero16 or postnatal therapeutic irradiation,17-19 and exposure to
chemotherapeutic agents, such as alkylating agents20 or epidopophyllotoxins.21, 22 There
is also reasonable evidence for an association with high birthweight,75 although the
underlying mechanism is unknown. Atopic disease has been studied as a risk factor for a
variety of malignancies212, 213 and is the subject of the current meta-analysis.
Atopy
The prevalence of atopic disease has been increasing over time worldwide,
including the U.S.214, 215 The estimated prevalence for any atopic condition among
pediatric populations ranges from 32% to 52%,37, 43, 216 while the estimated population
prevalence for the individual atopic conditions ranges from 7% to 22%37, 43, 215-218 (see
Appendix J for reported prevalence rates). The reasons for the observed increase are not
entirely known, however, the hygiene hypothesis (described below) presents one
potential mechanism.219
Varying definitions of atopy are found in the literature;220-223 we will use the
definition presented by Bottema et al: “a hereditary predisposition to produce
[immunoglobulin E] IgE antibodies against environmental allergens that is associated
with one or more atopic diseases such as bronchial asthma, urticaria [hives], eczema, and
allergic rhinitis [hay fever]”.223, 224 Atopy is the consequence of gene-environment
interactions.224 Atopic individuals generate an exaggerated response to environmental
allergens initiated by CD4+ Type 2 helper T (Th2) cells. The allergen is processed and
presented to Th2 cells by the antigen presenting cells.225 This precipitates the release of

108
cytokines (interleukin-4, -5, -9 and -13) by Th2 cells, leading to IgE antibody production
by B cells, as well as the growth and activation of mast cells, basophils, and
eosinophils.225, 226 The activation of eosinophils stimulates toxic enzyme release in the
mucosa and dermis, ultimately causing chronic inflammation in affected tissues.222
Figure 6-1. Diagram of the atopic response to environmental allergens. Source:
Robinson, DS. Br Med Bull 2000; 56:956-968.225
Allergic conditions are detected via positive skin prick tests or elevated serum IgE
levels, while asthma diagnosis involves evaluation of bronchial hyperresponsiveness,224
although all forms of asthma involve elevated serum IgE levels.227 The majority of
published studies regarding atopy and cancer have measured self-reported atopic
phenotype via interview or questionnaire.212 Biomarkers for disease, including positive
skin prick tests to specific allergens, and total and allergen-specific IgE levels, have been
used less commonly; eosinophil levels have not been previously utilized.212, 213

109
Total IgE levels vary by age, sex, and race. Low levels have been observed
among healthy newborns (mean = 0.20 IU/mL);228 levels rise during childhood to reach a
maximum between 8-12 years before declining.223 IgE concentrations within an
individual are correlated over time,229 such that infants with high IgE serum
concentrations tend to have higher levels in adulthood.223 Sensitization to specific
allergens, resulting in elevated levels of specific IgE antibodies, generally varies by age
as well. In infants, transient food allergies are observed, while enduring sensitization to
aeroallergens increases during childhood and adolescence, to reach a peak between ages
20-30 years.223 There is little difference in IgE levels in neonates of both genders;
however, the concentrations rise faster in males than females, such that males have
greater levels beginning at 6 months and extending throughout the life cycle.223 With
respect to specific allergens, the evidence does not point to any clear distinctions between
the sexes.223 White individuals generally have lower IgE levels than those of other
races.230
Brief descriptions of the specific atopic conditions are provided below.
Allergic rhinitis. Hay fever is an allergic response of the nasal passages to airborne
allergens. Marked by nasal itching, sneezing, redness, and tenderness, and by postnasal
drip,231 hay fever is usually first observed in children aged 8-11 years.214 Common
allergens include any type of tree or grass, components of house dust, cigarette smoke,
cosmetics, cleaning products, and industrial chemicals.231

110
Atopic Dermatitis. Often underdiagnosed, eczema is a reaction of the skin characterized
by intense itching, scaling or lichenification, swelling, and very dry skin.214, 231 An
important symptom considered in the diagnosis is flexural involvement, meaning there is
eczema present in skin folds (i.e., behind the knees, inside the elbows).34 Atopic eczema
may result from stress, or as an allergic response to plant resins, fruit or vegetable
consumption, cleaning products, chlorine, perfumes, or topical medications.231 The age of
onset is typically 12-24 months, which is earlier than the peak age for cALL.34
Bronchial asthma. Asthma is a condition of airway constriction and inflammation; the
most notable symptoms are wheezing, coughing, tightness in the chest, dyspnea, and
nasal congestion.214, 231 There are several environmental triggers for asthma, including
animal dander, house dust, indoor mold, pollen, industrial chemicals, tobacco smoke, and
cold air. A vast majority of asthmatics (80-90%) are diagnosed by the age of 6 years.214
Urticaria. Hives are a hypersensitivity reaction of the skin resulting in red, swollen, itchy
patches lasting 1-7 days typically. Common causes include foods, such as nuts, seafood,
eggs, wheat, milk, strawberries, and additives/preservatives, antibiotics including
penicillin, tetanus vaccination, gamma globulin, and insect bites.231

111
Possible biological mechanisms linking atopic disease and childhood leukemia
Although no biological mechanism has been established with respect to atopic
disease and childhood leukemia, the immune system is known to play a role in both atopy
and malignancy. Two conflicting hypotheses have been proposed for a causal relationship
between atopy and cancer. The first theory is the immune surveillance hypothesis, which
asserts that the immune system recognizes antigens of malignant cells as foreign and
mounts a response to them, thus preventing a majority of potential cancers from
developing.232 The presence of an atopic condition is thought to increase the vigilance of
the immune system in monitoring for, identifying, and eliminating malignant cells.212, 233
An important piece of evidence in support of this hypothesis is the observation that
immunocompromised individuals have higher incidence rates of specific malignancies
than those with intact immune systems (reviewed in 234). Notably, immunosupressed
persons have an increased risk of non-Hodgkin lymphoma,26-28 a malignancy with an
identical histology to ALL.4 Further, increased levels of natural killer cells, eosinophils,
and cytokines interleukin (IL)-4 and IL-10 in atopic individuals may contribute to a
reduction in cancer risk (reviewed in 212). Experiments conducted in laboratory animals
indicate that tumor advancement can be slowed or prevented by IgE-mediated
hypersensitivity responses (reviewed in 235). Finally, the observation that some tumors
have the capacity to evade the immune system232 provides further support for this
hypothesis.212
The second hypothesis is that chronic stimulation of the immune system by
allergens could increase the risk of carcinogenesis.233, 234 A greater number of

112
proliferating cells increases the probability of genetic errors, such as pro-oncogenic
mutations, that may not be repaired prior to subsequent divisions.233 This mechanism has
been proposed as an explanation for the positive association observed between
autoimmune disease and malignancy,236 for example.
The principal factor linking atopic disease and childhood leukemia is thought to
be the rate at which the immune system matures,34 which is mediated by exposure to
various factors. The concept of Th2 versus Th1 cell predominance is often presented with
respect to atopy, wherein Th2 cells express cytokines IL-4, stimulating IgE production by
B cells, and IL-5, activating eosinophils, and do not express interferon (IFN)-γ.237
Conversely, Th1 cells are marked by expression of IFN-γ (inhibiting IgE production) and
IL-2, but not IL-4 and IL-5.237 Infants are born with a Th2-dominated immune profile;
non-atopic infants gradually migrate to a Th1-dominant process by the age of 2 years,
while infants with a family history of atopy fail to make the transition from Th2 to
Th1.238 The currently available evidence in immunology indicates a complex relationship
between infections and atopy, with a significant body of research implicating IL-10 as an
immune regulator that is upregulated in response to infection and that serves as a
suppressor of allergic responses.219 Two additional T-cell types, T-regulatory and Th17,
may also play a role in the complex interplay between atopy, infections, and autoimmune
diseases (reviewed in 239). A complicating factor is the idea that not all cases of asthma,
eczema or hay fever are considered atopic,240, 241 and may be attributable to other factors,
such as infections, cold air, exercise, stress, and anxiety.231, 241

113
The hygiene hypothesis, originally proposed by Strachan in a 1989 publication
about the reduced incidence of hay fever among those with older siblings,242 postulates
that several factors in developed countries have contributed to the rise in atopic/allergic
conditions, including smaller family size, good public sanitation, increased use of
antibiotics, low incidence of helminth infestation and oralfecal transmission of infection,
and a stable population of micro-flora in the intestines.219 A study by Smith et al
demonstrated that the hygiene hypothesis may also apply to childhood leukemia.243 In
that ecologic study, decreases in the prevalence of hepatitis A infection, a marker for
hygiene due to the fecal-oral mode of transmission, was associated with subsequent
increased risk of ALL in the United States and Japan.243 Importantly, the incidence of
childhood leukemia is generally greater in developed countries,244 however, this
observation may result partially or wholly from better ascertainment in developed
countries. Further, individuals in developed countries with higher socioeconomic status
(SES) have a (modestly) greater risk of leukemia than those with lower SES (reviewed in
245), where higher SES may be considered a surrogate marker for better hygiene.
Three hypotheses have been proposed that suggest an etiologic role for the
immune system in the development of childhood leukemia via exposure (or lack thereof)
to early life infections. Greaves’ Hypothesis provides a potential explanation for the peak
in cALL incidence in early life (2-5 years).12 He postulates that two spontaneous
mutations are required for the leukemic transformation of B cell precursors, both of
which are due to proliferative stress.11 The first mutation is thought to arise in utero, as a
result of the high rate of precursor B cell proliferation in the prenatal period. The affected

114
cell then replicates, creating many clones. The second spontaneous mutation is thought to
occur after birth in a clonal cell, as a result of increased precursor B cell proliferation due
to an abnormal response to delayed exposure to a common infectious agent.11, 12 Factors
thought to modulate this relationship include breastfeeding, exposure to infectious agents
during infancy (via older siblings, crowding, daycare attendance, or lack of hygiene),
vaccinations, and HLA type (or other genetic factors affecting susceptibility).11, 12
Greaves cites a body of laboratory and epidemiologic research as consistent with or
supportive of his hypothesis,11, 12 including research by Kinlen.12
Kinlen’s Hypothesis is not restricted to a particular subtype of childhood
leukemia and is based on observations of population mixing.210, 211 He argues that
isolated, sparsely populated areas may lack herd immunity to common infectious agents.
During periods of intense population growth, immigrants may introduce specific
infectious agents to the isolated population, resulting in outbreaks/mini-epidemics. In rare
cases, an abnormal response to the infective agent among susceptible individuals may
result in childhood leukemia.211 A notable difference between the two hypotheses is that
Kinlen speculates that the common infectious agent acts directly upon the precursor cells
to induce leukemogenesis,210, 211 while Greaves favors an indirect effect.11, 12
The adrenal hypothesis, compatible with the hypotheses by Greaves and Kinlen,
has been proposed more recently.209 It postulates that early childhood infections are
protective for childhood leukemia (and cALL in particular) because they alter the
hypothalamus-pituitary-adrenal axis with the effect of raising plasma cortisol levels. The
increased cortisol concentrations may in turn shift the Th1 versus Th2 balance toward the

115
production of Th2 cytokines and/or may eliminate circulating leukemic or preleukemic
cells directly. Importantly, no virus or other infectious agent responsible for human
leukemias has been identified to date.246, 247
It is not clear if any of the mechanisms described above are applicable to
childhood cancers;35 however, the leukemia studies identified to date provide evidence in
support of the immune surveillance hypothesis.
Identified studies of the atopy-leukemia association
Ten prior studies examining the association between atopic disease and the
development of childhood/adolescent leukemia were identified and included in the meta-
analysis.34-38, 43, 248-251 These studies are summarized below and in Table 7-1.
Leukemia overall. United Kingdom Childhood Cancer Study (UKCCS) results suggested
an inverse association between allergies and leukemia overall (OR = 0.87, 95% CI: 0.73-
1.04), which was attributable to ALL but not AML cases, as described below.34 Results
of the National Cooperative Leukemia Study, one of the first epidemiological
investigations of the causes of childhood leukemia, were similar (OR = 0.82, 95% CI:
0.53-1.27),251 however, the Tri State Survey reported a large, positive association
between allergic diseases (such as asthma and hives) and pediatric leukemia (OR = 4.25,
95% CI: 2.54-7.12).250
ALL. Results of the UKCCS indicate an inverse association between ALL and a prior
history of at least one allergy (OR = 0.77, 95% CI: 0.60-0.98), eczema (OR = 0.70, 95%

116
CI: 0.51-0.97), or hay fever (OR = 0.47, 95% CI: 0.26-0.85).34 Rosenbaum et al observed
that any parent-reported allergy in the index child (defined as asthma, eczema, pollen-
dust, cat-dog dander, or food-drug-bee allergies) prior to ALL diagnosis was associated
with a reduced risk of ALL (OR = 0.58, 95% CI: 0.38-0.88) in a population-based case-
control study in New York.35 Each of the individual exposures was associated with
reduced risk; inhaled allergens and food-drug-bee allergies analyzed separately had
statistically significant inverse associations. A population-based case-control study in
Germany reported inverse associations between parent-reported atopic disease (including
hay fever, asthma, and neurodermatitis, OR = 0.52, 95% CI: 0.40-0.68) and childhood
ALL, as well as hay fever, neurodermatitis, and eczema examined separately.36 The
results of a Children’s Cancer Group (CCG) case-control study by Wen et al indicated an
inverse association between childhood ALL and any allergic disorder (i.e., asthma, hay
fever, food or drug allergies, eczema or hives) (OR = 0.7, 95% CI: 0.6-0.8) and
significant inverse associations with asthma, hay fever, food or drug allergies, and
eczema examined independently.37 Nishi and Miyake reported that a history of asthma or
atopic dermatitis in the index child prior to a diagnosis of non-T-cell ALL was associated
with significantly reduced risk (OR = 0.26, 95% CI: 0.11-0.59) in a Japanese case-control
study.38
Two additional studies examined associations between asthma and
pediatric/adolescent ALL. Investigators of a population-based case-control study in
France observed a strong inverse association with maternally reported asthma (OR = 0.5,
95% CI: 0.3-0.9).249 An analysis of the Swedish cancer registry linked to the Swedish

117
hospital registry reported very similar results for prior hospitalization for asthma (OR =
0.5, 95% CI: 0.2-1.1).248 It should be noted that the latter measure of atopic disease was
qualitatively different than the exposure classifications used in other studies, and likely
involved substantial underascertainment of asthma; it is unlikely that false positive
asthma diagnoses were included, however.
Conversely, no association was observed for any allergic condition diagnosed ≥1
year prior to a diagnosis of ALL in a case-control study of abstracted medical records in
the western United States (OR = 1.24, 95% CI: 0.82-1.86). Further, a prior diagnosis of
atopy or hives diagnosed ≥1 year prior to ALL diagnosis was associated with increased
odds of ALL (OR = 2.20, 95% CI: 1.16-4.16).43 Diagnoses of atopy or hives (OR = 3.78,
95% CI: 1.00-14.29) or asthma (OR = 3.10, 95% CI: 1.39-6.95) within the year prior to
ALL diagnosis were also positively associated with ALL.
The fact that an inverse association was observed in a majority of studies
involving different populations is intriguing.
AML. The UKCCS results did not show an association between AML and a prior history
of at least one allergy (OR = 0.92, 95% CI: 0.55-1.53), nor was there an observed
association with asthma, hay fever, or eczema examined separately.34 Likewise, the
German study failed to find an association between AML and a history of atopic disease
overall (OR = 0.95, 95% CI: 0.55-1.63) or with hay fever, neurodermatitis, or contact
eczema.36 The French study reported a nonsignificant inverse association between asthma
and AML (OR = 0.4, 95% CI: 0.1-1.7).249 Conversely, the Swedish registry-based study

118
reported a nonsignificant increase in the risk of AML associated with prior
hospitalization for asthma (OR = 1.7, 95% CI: 0.5-5.4).248 Of note, there was
considerably less power to observe an association in these studies, with 65 to 132 AML
cases per study.
Family history of atopy. As indicated in the definition, atopy is a hereditary condition and
therefore, investigators have also examined the association of cancer with a family
history (in parents or siblings) of atopy. Two case-control studies observed a 20%
reduction in the odds of childhood ALL associated with parental atopy35, 36 and two
studies also observed a 10-34% reduction in ALL if at least one sibling had an atopic
disease.36, 37 Conversely, eczema and dermatitis were reported more commonly in parents
of children with leukemia and lymphoma by McKinney et al78 and Buckley et al found a
positive association between a family history of allergies and pre-B-cell ALL.252 With
respect to AML, the results of Schüz et al indicate inverse associations for maternal (OR
= 0.58, 95% CI: 0.33-1.03) and sibling (OR = 0.48, 95% CI: 0.24-0.98) histories of atopic
disease, but not with respect to paternal history (OR = 1.09, 95% CI: 0.64-1.86).36
Additional studies were identified but excluded from the meta-analysis due to
hospital- or specialty clinic-based control groups, study populations overlapping included
studies, and inclusion of subjects exceeding the age range of interest (Table 7-3).

119
Theoretical model of causation
The hypothesized association between atopy and childhood leukemia is depicted
in the directed acyclic graph (DAG) in Figure 6-2 below, where atopy (A) causes
underlying biological changes (B), leading ultimately to a reduced risk of childhood
leukemia (L).
Figure 6-2. Directed acyclic graph depicting the hypothesized association between atopy
and childhood leukemia, where F = family history of atopy, A = atopy, B = underlying
biological changes, L = childhood leukemia, G = genetic susceptibility factors, D =
demographic factors (e.g., sex, age, race, sibship, socio-economic status, location of
residence), and K = method of infant feeding.
The commonly cited epidemiological definition of a confounder is a variable that
is a risk factor for the outcome of interest, associated with the exposure of interest in the
source population, and is not on the causal pathway.189 This definition has been found to
be insufficient, however. The structural definition of confounding is bias that is created
A B L
G
D
F
K

120
by an unblocked backdoor path via a common cause of the exposure and disease of
interest.190 In the analysis, conditioning on one or more confounding variables in a path
blocks the backdoor path.190 In this case, potential confounders include family history of
atopy (F), which is likely causally related to genetic factors (G) modifying susceptibility
to both atopy and leukemia and is also likely related to demographic factors (D), such as
the sex, age, and race of the child, sibship, and the familial socio-economic status and
location of residence. Method of infant feeding (K) is another potential confounding
variable due to the observed associations with atopic disease and childhood leukemia. A
brief literature review of these factors is provided below.
Age at diagnosis. The prevalence of atopic diseases and total serum IgE levels have been
shown to increase with increasing age among children.215, 223 For example, recent data
collected by the National Health Interview Survey (NHIS) suggest rates of asthma
increase between ages 0-4 (6.2%) to 5-9 years (10.6%) and then are stable throughout
adolescence (10-17 years: 10.4%), while rates of hay fever peak later (4.7% in 0-4 year-
olds versus 12.3% in 10-17 year-olds); conversely, rates of skin allergies decrease
slightly over time (11.7% in 0-4 year-olds versus 8.9% in 10-17 year-olds).253, 254 Our
recent analysis of the Surveillance, Epidemiology, and End Results (SEER) Program data
confirm that the age-standardized incidence of leukemia is greatest among those ages 1-4,
with lower rates among infants (0 years) and children and adolescents ages 5-19 years.3

121
Sex. The prevalence of atopic diseases and IgE concentrations differ by gender.215, 223, 255
The NHIS data indicate that males between the ages of 0-17 years have a greater
prevalence of asthma (10.7% of males vs. 7.8% of females) and hay fever (10.5% of
males versus 8.8% females), although the rates of skin allergies are more similar (9.7% in
males versus 10.5% in females). 253, 254 These gender patterns are not consistent with a
protective effect for leukemia, as an analysis of SEER Program data show that male
children and adolescents (ages 0-19 years) are also 23% more likely to receive a
diagnosis of childhood leukemia than females.3
Race/Ethnicity. Atopy and IgE levels have been associated with race/ethnicity.215, 230, 255
In NHIS, 14.6% of black children had asthma compared with 8.2% of white, 8.3% of
Hispanic and 5.4% of Asian children.253 Hay fever was more prevalent among white
children (10.3%) than among the other groups (7.5% in Asians, 7.5% in Hispanics, and
7.1% in blacks,), while skin allergies were more common in black children (12.7% versus
9.5% in whites, 8.9% in Asians, and 8.1% in Hispanics).254 Childhood leukemia is
diagnosed 88% and 41% more often among white children in the U.S. than among black
or Asian/Pacific Islander children, respectively.3
Sibship. Having one or more older siblings has been consistently associated with
decreased risk of atopy,256, 257 atopic eczema,258-260 and hay fever.242, 257-259, 261 The
association between birth order and asthma development has been less consistent.258
Notably, results of a large cohort study in the UK indicate increased risk of asthma for

122
those diagnosed at ≤2 years and decreased risk thereafter.259 Further, having one or more
siblings has been positively associated with atopy, as measured by skin prick tests and
specific IgE levels, but not with respect to airway hyperresponsiveness.256, 258 The
available evidence regarding a potential relationship between sibship and childhood
leukemia is inconclusive, however. As reviewed by McNally, the association between
having an older sibling and leukemia/ALL was examined in 14 studies from 1996-2004,
with inconsistent findings.262 A majority of studies failed to observe an association,85, 102,
110, 155, 263-266 while 4 studies reported a positive association with one or more older
siblings193, 249, 267, 268 and 1 reported an inverse association.269 Infante-Rivard et al
reported a positive relationship among those diagnosed at <4 years and an inverse
relationship among those diagnosed at ≥4 years.270 Of the two subsequent reports on this
topic, one failed to find an association between either ALL or AML and birth order,271
while the other reported inverse associations between three or more older siblings and
both ALL and acute monocytic leukemia, respectively.272
Socio-economic status (SES). Atopic disease has been related to SES.212, 255 The NHIS-
reported asthma rates are highest among the “poor” (11.7%) and lowest among the “non-
poor” (8.2%), while rates of hay fever are lowest among the poor (6.6%) and highest
among the non-poor (11.4%); rates of skin allergies are more similar among the socio-
economic groups examined (10.3% in the poor and non-poor).253, 254 Higher
socioeconomic status is considered an established risk factor for childhood leukemia,
although the underlying mechanism has not been confirmed.4

123
Location of residence. Children living in metropolitan areas were slightly more likely to
have prevalent skin allergies (10.3%) than those living in non-metropolitan areas (8.8%),
but were approximately equally likely to report asthma (9.5% and 8.4%, respectively)
and hay fever (9.6% and 9.8%, respectively) in NHIS data.253, 254 Higher population
density has been associated with increased risk of childhood leukemia in 5 studies,273-277
while the risk was greatest for intermediate population density in a sixth study.278
Method of infant feeding. After 17 years of follow-up, a prospective study found the
highest rates of atopy among those not breastfed as infants; the authors concluded that
breastfeeding is protective during childhood and adolescence.279 Similarly, breastfeeding
in the first three months after birth was associated with a 30% reduced risk of atopy in
one study280 and exclusive breastfeeding in infancy was associated with a 53% reduction
of risk of atopic dermatitis in another.281 With respect to childhood leukemia, two meta-
analyses have been conducted. Kwan et al observed a significant inverse summary
association between both short-term (≤6 months; OR = 0.88, 95% CI: 0.80-0.97)) and
long-term (>6 months; OR = 0.76, 95% CI: 0.68-0.84) breastfeeding with childhood ALL
upon pooling the results of 14 studies.282 Similarly, they observed a nonsignificant 10%
and 15% reduction in the odds of AML, respectively (8 studies).282 Martin et al reported
inverse associations for short-term and long-term breastfeeding and ALL (OR = 0.93,
95% CI: 0.86-1.00 and OR = 0.81, 95% CI: 0.72-0.91, respectively) in a meta-analysis of
12 studies and reported similar results for AML (8 studies).283 Of note, both meta-

124
analyses indicate a dose response relationship, such that increased duration of breast-
feeding results in lower odds of leukemia.
Significance of the research
Although there has been controversy surrounding the use of meta-analytic
techniques on data from observational studies,284 due to the vast potential for bias and the
great heterogeneity of populations that can be included in epidemiologic studies, meta-
analyses of observational studies are nevertheless growing in frequency in the medical
literature.285 Meta-analysis is a useful tool for childhood cancer epidemiologists and
clinicians for at least two important reasons. First, it aids the researcher by condensing a
vast quantity of literature and summarizes what is known about a given association in a
systematic way. Childhood cancers are rare malignancies and as such, it is difficult to
obtain sufficient power to detect modest associations in individual studies. Second, an
important function of systematic reviews of observational studies is to carefully inspect
existing heterogeneity in an effort to explain it.286 Such heterogeneity may help in
identifying areas warranting further research.
The current study aimed to examine the existing evidence regarding the role of
atopy, including bronchial asthma, urticaria, atopic dermatitis, and allergic rhinitis, in the
etiology of acute childhood leukemia among those diagnosed at ages 0-18 years. This
research was of interest given that the incidence of leukemia and the prevalence of atopic
conditions have both increased over time among children in the U.S. and other parts of
the world. Further, experimental/clinical evidence has illustrated that the immune system
plays an etiologic role in the development of both cancer and atopic disease. The

125
epidemiologic evidence gathered to date is not entirely consistent, however, with respect
to childhood ALL and immune modulating factors.262
Ten studies examining associations between atopic disease and
childhood/adolescent leukemia were selected for inclusion in the meta-analysis. For ALL,
six of seven reported inverse associations,34-38, 248 while one found an increased risk
associated with atopy.43 The four studies reporting associations with AML were less
consistent.34, 36, 248, 249 To achieve the study aims, a thorough search of the literature was
conducted, in consultation with a biomedical librarian, followed by a survey of pediatric
cancer epidemiologists, both in the U.S. and internationally, requesting any other relevant
published or unpublished results. All retrieved data were summarized and random effects
summary odds ratios were calculated for associations reported by 2 or more prior studies.

126
Chapter 7: The association between atopy and childhood/adolescent leukemia: A
meta-analysisp
Atopic disease is hypothesized to be protective for several malignancies, including
childhood/adolescent leukemia. To summarize the available epidemiologic evidence,
meta-analysis of the associations between atopy/allergies, asthma, eczema, hay fever, and
hives, and childhood/adolescent leukemia, acute lymphoblastic leukemia (ALL), and
acute myeloid leukemia (AML), respectively, was performed. To identify eligible studies,
a MEDLINE literature search (1952–March 2009) and a query of international experts
were conducted. Ten case-control studies were included; summary odds ratios (ORs) and
95% confidence intervals (CIs) were computed via random effects models. ORs for
atopy/allergies were 1.42 (95% CI: 0.60-3.35) for three studies of leukemia overall, 0.69
(95% CI: 0.54-0.89) for six ALL studies, and 0.87 (95% CI: 0.62-1.22) for two AML
studies, with high levels of heterogeneity detected for leukemia overall and ALL. Inverse
associations were observed for ALL and asthma (OR = 0.79, 95% CI: 0.61-1.02), eczema
(OR = 0.74, 95% CI: 0.58-0.96), and hay fever (OR = 0.55, 95% CI: 0.46-0.66) examined
separately. ORs for ALL differed across strata of study design, exposure data source, and
latency period, indicating these factors impact study results. Although these results
should be interpreted cautiously given the modest number of studies, substantial
p This work was published in the American Journal of Epidemiology (Linabery AM, Jurek AM, Duval S, Ross JA. The association between atopy and childhood/adolescent leukemia: A meta-analysis. Am J Epidemiol. doi:10.1093/aje/kwq004).

127
heterogeneity, and potential exposure misclassification, they are useful in designing
future research.
Introduction
Leukemia is the most common malignancy among individuals ages 0-19 years;
the incidence rate (42 per 1,000,000 person-years) increased at an average annual rate of
0.7% (95% CI: -0.1%-1.5%) in the U.S. in recent years.3 Nonetheless, there are few
established risk factors for pediatric/adolescent leukemia, including predisposing genetic
conditions, and exposure to in utero or postnatal therapeutic irradiation, or
chemotherapeutic agents.4 Atopic disease (i.e., asthma, eczema, hay fever, hives) has
been studied as a risk factor for several malignancies,212 including childhood/adolescent
leukemia, and is the subject of the current meta-analysis.
The prevalence of atopic disease increased worldwide over the latter part of the
20th century and continues to increase in some areas.218 Estimated prevalences for
asthma, skin allergies, and hay fever among those ages 0-17 years in the U.S. are 9.1%,
10.0%, and 9.7%, respectively.287, 288 Reasons for the observed increase are not entirely
known, however, the hygiene hypothesis presents one explanation.242 This hypothesis
postulates that several factors in developed countries contributed to the rise in
atopic/allergic conditions, including smaller family size, public sanitation, increased
antibiotic use, low incidences of helminth infestation and fecal-oral transmission of
infection, and stable micro-flora population in the intestines.219
128
The current study aims to systematically summarize the etiologic evidence
regarding the atopy-childhood/adolescent leukemia association, to identify sources of
heterogeneity in the existing literature, and to identify gaps in the current state of
knowledge. This research is of interest given secular trends described above in leukemia
incidence and atopy prevalence, and the immune system’s role in the development of
both leukemia and atopic disease.
Methods
Study identification and selection
Eligible studies included individuals diagnosed with leukemia between ages 0 and
18 years; representative, healthy control groups; and reports of any atopic disease,
allergies, asthma, atopic dermatitis/eczema, allergic rhinitis/hay fever, or urticaria/hives.
Number of exposed and unexposed cases and controls and/or measures of association
describing risk of childhood leukemia must also have been provided for inclusion; crude
odds ratios (ORs) and standard errors (SEs) were computed from cell counts if not
reported. Studies involving inappropriate control groups, such as siblings (who are not
independent from cases in atopic status) and hospital- or specialty clinic-based controls
(who may have been inadvertently selected on exposure status), and those with data
overlapping other studies were excluded.
To identify all eligible studies published prior to April 1, 2009, the MEDLINE
database was searched via PubMed, using a combination of MeSH subject headings and
keywords ((("Allergy and Immunology"[Mesh] OR "Hypersensitivity"[Mesh]) OR
"Asthma"[Mesh] OR ("Eczema"[Mesh] OR "Dermatitis, Atopic"[Mesh]) OR "Rhinitis,
129
Allergic, Seasonal"[Mesh] OR "Urticaria"[Mesh]))AND "Leukemia"[Mesh]) OR
(((atopy OR atopic OR atop*) OR (allergy OR allergic OR allerg*)) AND leukemia) and
limiting results to children ages 0-18 years and English language. The Cochrane Library
Database of Systematic Reviews was also searched using relevant keywords. (The
EMBASE database was not accessed, as it was deemed unlikely to yield additional
references.) Abstracts from resulting articles were reviewed by two independent
reviewers to determine eligibility (A.M.L. and A.M.J.). In the infrequent event of
discrepancies, the two reviewers reached consensus through discussion. Reference lists
from retrieved articles were manually examined to identify additional studies.
Additionally, 36 international experts in pediatric cancer etiology were surveyed
to request any other relevant published or unpublished results, as direct contact with
experts has been shown to be an effective method of study ascertainment.289q
Data extraction
Data from eligible studies, including general study characteristics (study design,
participant ages, diagnostic dates, number and source of cases and controls, source of
exposure data, and matching variables), quality-related factors (listed below), and results
(cell counts, ORs, and 95% confidence intervals (CIs)), were abstracted by the two
reviewers onto a standardized form developed by the authorsr and were compared to
ensure accuracy. Dichotomous exposures abstracted included atopy, allergy, asthma,
eczema, hay fever, or hives; dichotomous outcomes included childhood leukemia, acute
lymphoblastic leukemia (ALL), or acute myeloid leukemia (AML). A dichotomous q A list of the 36 international experts queried is provided in Appendix K. r The data abstraction form developed for this study is shown in Appendix L.

130
variable indicating any report of atopy or allergies was created due to the variability in
definitions of composite atopy/allergy variables across eligible studies. If >1 definition of
an exposure was evaluated in a given study, results for the most general definition were
abstracted to attain comparability across studies.34, 249 If a definition included a latency
period, the corresponding results were abstracted preferentially.43 Adjusted estimates
were generally selected over unadjusted estimates; however, in one study, estimates from
the most parsimonious model were abstracted due to the wide spectrum of adjustment
factors included in the full multivariate model and the similarity between the two
estimates.38 Two authors were contacted for study results specific to
children/adolescents;248, 290 additional information was received from one of these (Karin
Söderberg, Karolinska Institutet, personal communication, 2009).
Statistical methods
Ten exposure-disease associations were examined, representing all identified
associations with ≥2 eligible studies. Stata was used to conduct all analyses and produce
forest plots.291 Summary ORs and 95% CIs were computed from study-specific ORs and
corresponding SEs using DerSimonian and Laird random effects (RE) models,292 since
RE models incorporate between-study heterogeneity. Fixed effect (FE) summary ORs
were also calculated for comparison. To quantify the degree of heterogeneity across
studies, Higgins’ I2 statistic and 95% CIs were generated, representing the proportion of
the variance attributable to between-study variability;293 CIs could not be calculated for
statistics with degrees of freedom <2.
131
Analysis of the influence of individual studies was conducted, wherein each
study was omitted in turn, to identify studies contributing disproportionately to the
observed heterogeneity.s Summary ORs for ALL were calculated across strata of factors
selected a priori as potentially related to study quality to examine potential sources of
heterogeneity. (There were not enough studies of leukemia overall or AML to permit
similar stratification.) These factors include study design (nested versus other case-
control), source of controls (population-based versus other), source of exposure data
(medical record versus parental report), latency period (yes versus no), response rates for
cases and controls (≥80% versus <80%), and adjustment for potential confounders (yes
versus no for age, sex, race, socioeconomic status (SES), method of infant feeding, and
location of residence).
Notably, there were too few studies for a given association to warrant a formal
assessment of publication bias; however, the thorough search strategy executed in
combination with the query of experts should have eliminated most sources of
publication bias (except possible English language bias).
Results
Of the 442 manuscripts identified via the MEDLINE search, 417 were excluded
and 25 were retrieved for review; 10 were determined eligible upon further review
s Cumulative analysis was also conducted to assess whether the conduct of the most recent studies has advanced our understanding of these associations. Results of the cumulative analysis are shown in Appendix M. The summary OR for the ALL-atopy/allergy association has not changed materially since 2003, while the summary ORs for the associations between ALL and asthma and eczema, respectively, have remained fairly constant since the initial study in 2000. Results of the influence analysis are shown in Appendix N. With the possible exception of the study by Bross and Natarajan, there does not appear to be any other single study contributing too much weight to any of the summary ORs.

132
(Figure 7-1). 34-38, 43, 248-251 No additional eligible studies resulted from the Cochrane
Database search, manual examination of references, or query of experts.
Characteristics of the 10 case-control studies meeting the inclusion criteria are
provided in Table 7-1. A majority were published in 2000 or thereafter and half were
conducted in the U.S.; the remainder originated in Europe and Japan. They collectively
included 6,592 childhood/adolescent leukemia cases and 24,171 controls, although
individual studies investigated different exposure-disease associations. Most examined
children ages 0-14 years, with a few exceptions.
The distribution of selected quality-related factors is summarized in Table 7-2. A
minority of studies (30%) were nested within a larger cohort, although most used
population-based control groups (80%), which should better represent the cases had they
not developed leukemia. Seven studies used parental report to determine atopic
phenotype, while three used medical records; none used biomarkers for atopic disease
classification. Four included a latency period between the onset of atopy and leukemia.
Case response rates were ≥80% in half of the studies, while this high level of
participation was only reached in 20% of control groups. Finally, all but one study
adjusted for age, none adjusted for sibship, and an intermediate number adjusted for sex,
race, SES, method of infant feeding, and location of residence, all of which are possible
confounders.
Table 7-3 lists excluded case-control studies, reasons for exclusion, and key study
results. Primary reasons for exclusion were hospital- or specialty clinic-based control

133
groups, study populations overlapping included studies, and inclusion of subjects
exceeding the age range of interest.
Results of the meta-analysis are depicted in Figure 7-2. For leukemia overall, the
summary OR for any reported atopic disease or allergies was 1.42 (95% CI: 0.60-3.35)
with substantial heterogeneity present across the three studies reporting on this outcome
(I2 = 94%). The study by Bross and Natarajan250 accounts for the observed variability;
there was no detectable heterogeneity upon omission of this study (I2 = 0%). Summary
ORs were not calculated for specific atopic diseases, as these were not assessed in two of
the three studies of leukemia overall.
A 0.69-fold reduced odds of ALL was observed for any atopy/allergies (95% CI:
0.54-0.89), although there was evidence of considerable heterogeneity across the six
included studies (I2 = 80%). The influence analysis did not reveal an obvious outlier
among the six studies. For atopic diseases examined separately, inverse associations were
observed for ALL and asthma (7 studies; OR = 0.79, 95% CI: 0.61-1.02), eczema (5
studies; OR = 0.74, 95% CI: 0.58-0.96), and hay fever (3 studies; OR = 0.55, 95% CI:
0.46-0.66), but not for hives (2 studies; OR = 0.93, 95% CI: 0.73-1.19).
For AML, a nonsignificant inverse association with any atopy/allergies was
calculated (OR = 0.87, 95% CI: 0.62-1.22) among two studies; there was no appreciable
heterogeneity detected (I2 = 0%). Of note, there was less power to detect an association in
these studies, with 164 and 101 AML cases, respectively. The summary ORs did not
indicate evidence of an association for AML and asthma (3 studies; OR = 1.05, 95% CI:

134
0.56-1.95), eczema (2 studies; OR = 0.78, 95% CI: 0.53-1.15), or hay fever (2 studies;
OR = 1.10, 95% CI: 0.65-1.86) assessed individually.
The FE models produced identical or very similar ORs to those generated by RE
models, with identical or narrower CIs but equivalent interpretations. One possible
exception is the FE OR for atopy/allergies and leukemia overall, which was attenuated
compared with the RE OR (ORFE = 1.01, 95% CI: 0.86-1.18). This is not surprising,
considering that the high heterogeneity present in this set of studies is attributable to the
smallest study with a large, positive association and this smallest study does not
contribute substantially to the FE OR.
The stratified analyses indicate the inverse associations for ALL are nearly
completely attenuated by a nested case-control study design, medical records as the
source of exposure data, and inclusion of a latency period, collectively (ORatopy/allergies =
0.99, 95% CI: 0.72-1.37; ORasthma = 0.97, 95% CI: 0.60-1.59; OReczema = 0.92, 95% CI:
0.77-1.11); the effect of each could not be evaluated, since the same studies mutually
included these factors (Figure 7-3). Similarly, summary ORs for studies with case and
control response rates ≥80% were closer to the null compared with rates <80%.
Controlling for race, SES, or location of residence, respectively, did not produce
meaningful differences in summary ORs across strata. Adjusting for sex or breastfeeding
generated identical or very similar ORs across strata, although precision of the stratum-
specific ORs differed.

135
Table 7-1. Characteristics of 10 Case-control Studies Included in the Meta-analysis of the Atopy-Leukemia Association
First author, Country (Year)
Study design Age
range (years)
Source of cases Source of controls Ncases Ncontrols
Assessment of exposure
Exposure variables
Matching/ adjustment
factors Fraumeni, USA (1964)251*
Case-control study (National Cooperative Leukemia Study)
0-15 12 Medical centers participating in National Cooperative Leukemia Study Participation rate: NA
Neighborhood controls Participation rate: NA
498 498 Parental interview
Atopic allergy (i.e., asthma, eczema, hay fever)
Matching: Neighborhood, age, birth order, family size, race Adjustment: None
Bross, USA (1972)250†
Case-control study (Tri-State Survey)
1-14 Cancer registries in the sample areas (NY, MD, MN) Participation rate: NA
Multi-stage random sample of households in sample areas Participation rate: NA
141 357 Parental interview
Allergic diseases (i.e., asthma, hives)
Matching: NA Adjustment: Age group (1-4, 5-9, 10-14 years)
Nishi, Japan (1989)38
Case-control study
0-14 All children with immunologic-ally ascertained non-T-cell ALL at 9 hospitals in Hokkaido Prefecture, Japan Participation rate: 100%
Health centers and hospitals in case residential areas, recruited at routine health examinations Participation rate: NA
63 ALL 126 Maternal interview
Atopic diathesis (i.e., history of asthma or atopic dermatitis)
Matching: Age, sex, district of residence at diagnosis Adjustment: Age, sex, district of residence at diagnosis
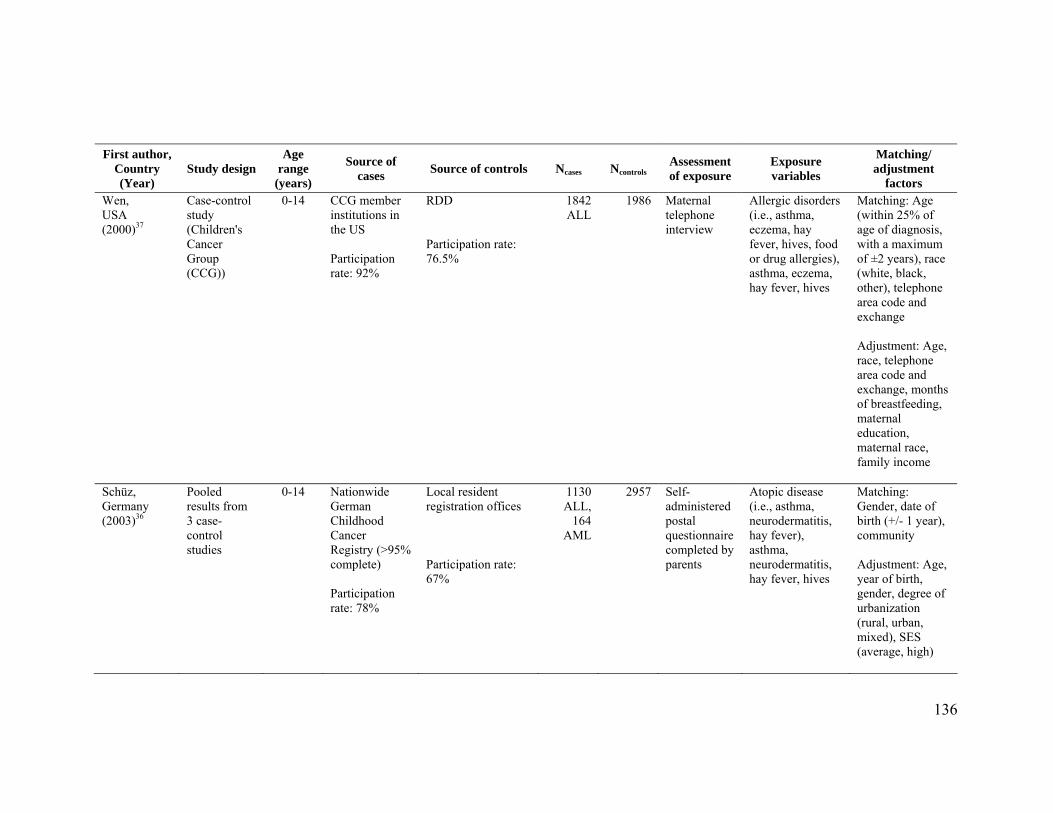
136
First author, Country (Year)
Study design Age
range (years)
Source of cases Source of controls Ncases Ncontrols
Assessment of exposure
Exposure variables
Matching/ adjustment
factors Wen, USA (2000)37
Case-control study (Children's Cancer Group (CCG))
0-14 CCG member institutions in the US Participation rate: 92%
RDD Participation rate: 76.5%
1842 ALL
1986 Maternal telephone interview
Allergic disorders (i.e., asthma, eczema, hay fever, hives, food or drug allergies), asthma, eczema, hay fever, hives
Matching: Age (within 25% of age of diagnosis, with a maximum of ±2 years), race (white, black, other), telephone area code and exchange Adjustment: Age, race, telephone area code and exchange, months of breastfeeding, maternal education, maternal race, family income
Schüz, Germany (2003)36
Pooled results from 3 case-control studies
0-14 Nationwide German Childhood Cancer Registry (>95% complete) Participation rate: 78%
Local resident registration offices Participation rate: 67%
1130 ALL,
164 AML
2957 Self-administered postal questionnaire completed by parents
Atopic disease (i.e., asthma, neurodermatitis, hay fever), asthma, neurodermatitis, hay fever, hives
Matching: Gender, date of birth (+/- 1 year), community Adjustment: Age, year of birth, gender, degree of urbanization (rural, urban, mixed), SES (average, high)

137
First author, Country (Year)
Study design Age
range (years)
Source of cases Source of controls Ncases Ncontrols
Assessment of exposure
Exposure variables
Matching/ adjustment
factors Spector, USA (2004)43
Case-control study
0-6 Databases of 4 health maintenance organizations (HMOs) in Western USA Participation rate: 100%
Databases of 4 HMOs in Western USA Participation rate: 100%
180 ALL
718 Subjects' medical records (diagnosis by a physician)
Allergic conditions (i.e., asthma, eczema, atopy or hives, food-drug-bee allergy, pollen-dust-dander allergy), asthma, eczema
Matching: HMO, gender, date of birth (+/- 2 weeks) Adjustment: Age, gender, race, HMO. Individual allergic conditions mutually adjusted.
Jourdan-Da Silva, France (2004)249
Population-based case-control study
0-14 National Registry of Childhood Leukemia and Lymphoma in France (all cases <15 years) Participation rate: 73%
Randomly selected from general population via RDD based on expected distribution of cases Participation rate: 71%
408 ALL,
65 AML
567 Self-administered questionnaire completed by mothers
Asthma Matching: Age, gender, region of residence at diagnosis Adjustment: Gender, age, region
Rosenbaum, USA (2005)35
Case-control study (31 counties of New York State)
0-14 Institutional tumor registries and departmental records at 4 major medical centers Participation rate: 71%
Randomly selected via Live Birth Certificate Registry (New York State Department of Health) Participation rate: 55%
255 ALL
760 Self-administered postal questionnaire completed by parents
Allergy history (i.e., asthma, eczema, food-drug-bee, pollen-dust, or cat-dog dander allergy), asthma, eczema
Matching: Sex, race (white/non-white), birth year Adjustment: Maternal smoking (yes/no), maternal education (years), breast fed (yes/no), race, birth year

138
First author, Country (Year)
Study design Age
range (years)
Source of cases Source of controls Ncases Ncontrols
Assessment of exposure
Exposure variables
Matching/ adjustment
factors Söderberg, Sweden (2006)248‡
Population-based case-control study
0-18 All cases in Swedish Cancer Registry Participation rate: 100%
Randomly selected from Swedish nationwide population registry Participation rate: 100%
875 ALL,
132 AML
14865 Swedish Hospital Discharge Registry
Asthma Matching: Sex, 5-year age group, year of diagnosis Adjustment: Sex, age, SES
Hughes, UK (2007)34
Population-based case-control study (United Kingdom Childhood Cancer Study)
0-14 Residents of Great Britain diagnosed with malignancy Participation rate: 92%
Randomly selected from primary care population registers Participation rate: 70%
839 (720
ALL, 101
AML)
1337 Primary care records
Allergies (i.e., asthma, eczema, hay fever), asthma, eczema, hay fever
Matching: Age, sex, region of residence at diagnosis Adjustment: Age (single years), sex, region of residence, deprivation index
ALL = acute lymphoblastic leukemia; AML = acute myeloid leukemia; HMO = health maintenance organization; NA = not available; RDD = random digit
dialing; SES = socio-economic status
* Crude odds ratio (OR) calculated from data provided.
† Age-adjusted OR calculated from data provided in (55).
‡ Results for subjects ages 0-18 years obtained from first author via personal communication.

139
Table 7-2. Distribution of Factors Related to Quality in the 10 Case-control Studies
Included in the Meta-analysis of the Atopy-Leukemia Association
Total
Leukemia overall ALL AML
Factor N % N % N % N %
Study design
Nested case-control study 3 30% 1 33% 3 38% 2 50%
Population-based controls 8 80% 2 67% 7 88% 4 100%
Exposure assessment
Medical records 3 30% 1 33% 3 38% 2 50%
Latency period 4 40% 2 67% 3 38% 2 50%
Participation rates
Cases (≥80%) 5* 50% 1* 33% 5 63% 2 50%
Controls (≥80%) 2* 20% 0* 0% 2* 25% 1 25%
Control for confounders
Age at diagnosis 9 90% 2 67% 8 100% 4 100%
Sex 6 60% 1 33% 6 75% 4 100%
Race 3 30% 0 0% 3 38% 0 0%
Sibship 0 0% 0 0% 0 0% 0 0%
SES 5 50% 1 33% 5 63% 3 75%
Breastfeeding 2 20% 0 0% 2 25% 0 0%
Residence 5 50% 1 33% 5 63% 3 75% ALL = acute lymphoblastic leukemia; AML = acute myeloid leukemia; SES = socio-economic status
* Participation rates not available for 2 studies of leukemia overall and 1 study of ALL.

140
Table 7-3. Description of Case-control Studies Excluded from the Meta-Analysis of the Atopy-Leukemia Association
First author, Country (Year)
Study design Reason for exclusion Results
Manning, USA (1957)294
Case-control Specialty clinic-based control group Suggestion of increased risk of childhood leukemia associated with allergies (i.e., asthma, eczema, hay fever, hives, other) (OR = 2.44, 95% CI: 0.97-6.14).*
Stewart, UK (1958)295
Case-control Results presented for childhood cancer cases overall, not for leukemia cases
No evidence for an association between allergic conditions and childhood malignancy (OR = 1.12, 95% CI: 0.65-1.94).*
Ager, USA (1965)296
Case-control Very low prevalence of atopic disease reported among cases and controls ages 0-4 years. This may be due to misclassification since exposure measured first via maternal interview, then followed up with medical record verification only for those with a positive maternal report.
No evidence for an association between death from childhood leukemia and asthma, eczema, or hives, respectively (ORasthma = 0.66, 95% CI: 0.11-4.03; OReczema = 0.99, 95% CI: 0.14-7.16; ORhives = 0.99, 95% CI: 0.14-7.16).*
Smith, USA (1973)297
Case-control Study overlaps with Bross (1972).250 Cell counts from this paper used to calculate overall age-adjusted OR.
Results included in meta-analysis
Natarajan, USA (1973)298
Case-control Study overlaps with Bross (1972)250 The association between allergic disease (i.e., asthma, hives, eczema) and childhood leukemia is greater among those with maternal exposure to preconception radiation (OR = 4.6, P = 0.0001) than those with no preconception radiation (OR = 1.9, P = 0.03).
Viadana, USA (1974)299
Case-control Results presented for leukemia cases ≥15 years of age. Unable to locate author to request data for 15-18 year olds.
Not applicable

141
First author, Country (Year)
Study design Reason for exclusion Results
Bross, USA (1974)300
Case-control Study overlaps with Bross (1972)250 The association between allergic disease (i.e., asthma, hives, eczema) or bacterial disease (i.e., pneumonia, dysentery, rheumatic fever) and childhood leukemia is greater among those with exposure to maternal preconception, intrauterine, and postnatal radiation (OR = 4.1, P = 0.0001) than those with no prior radiation history (OR = 1.6, P = 0.23).
Gibson, USA (1976)301
Case-control Results presented for leukemia cases ≥15 years of age. Unable to locate author to request data for 15-18 year olds.
Not applicable
Magnani, Italy (1990)302
Case-control Hospital-based control group Inverse association observed between allergic diseases and childhood ALL after adjusting for SES (OR = 0.4, 95% CI: 0.2-0.8).
Zheng, China (1993)290
Case-control Results presented for leukemia cases ≥15 years of age. Per personal communication with first author, unable to obtain data for 15-18 year olds.
Not applicable
Buckley, USA (1994)252
Case-control Results presented for family history of allergy, not for personal history of allergy
Family history of allergies (i.e., asthma, hay fever, hives, food or drug allergy) in siblings, parents and/or grandparents associated with a modest increased risk for childhood ALL after adjusting for birth year, race, income, geographical region, and family size (OR = 1.3, P < 0.05).
Petridou, Greece (1997)102
Case-control Hospital-based control group and exposure of hospitalization for allergic disease
Nonsignificant inverse association observed between hospitalization for allergic disease and childhood leukemia after adjustment for gender, age, location of residence, and other biomedical variables of interest (OR = 0.36, 95% CI: 0.09-1.43).

142
First author, Country (Year)
Study design Reason for exclusion Results
Kaatsch, Germany (1998)303
2 case-control studies
Study overlaps with Schüz (2003)36 Nonsignificant inverse association observed between allergy and childhood leukemia after adjusting for age, sex, place of residence, and SES (OR = 0.90, 95% CI: 0.63-1.29).
Schüz, Germany (1999)304
2 case-control studies
Study overlaps with Schüz (2003)36 Inverse association observed between allergy and childhood leukemia after adjusting for gender, date of birth, district of residence, and SES (OR = 0.6, 95% CI: 0.5-0.8).
ALL = acute lymphoblastic leukemia; CI = confidence interval; OR = odds ratio; SES = socioeconomic status
* Crude OR calculated from data provided.

143
Figure 7-1. Flow diagram of the search strategy and study selection process.
442 MEDLINE search hits
146 140
56 50 7 6
Case reports/case series Treatment studies Reviews Biology studies Editorials/commentaries/letters Descriptive epidemiologic studies
5 Case-control studies with different exposure or outcome
4 3
Survivor/QOL studies Meeting reports
3 Identified via manual search of references
25 Retrieved for review
1 Identified via query of experts
2 Hospital or clinic controls
5 3
Overlap with included studies Different age range
1 Case-control study with different exposure
1 Case-control study with different outcome
3 Case-control studies with different exposure or outcome
2 1 1
Case series Hospital or clinic controls Method of exposure assessment
0 Eligible 10 Eligible 0 Eligible
10 Included in meta-analyses
15 Ineligible:
417 Excluded:
3 Ineligible: 1 Ineligible:

144
Figure 7-2. Study-specific and random effects summary odds ratios (ORs) and 95% confidence intervals (CIs) for the associations
between leukemia overall, acute lymphoblastic leukemia (ALL), and acute myeloid leukemia (AML) and A) atopy or allergies, B)
asthma, C) eczema, D) hay fever, and E) hives. The size of each box indicates the relative study weight; the bars indicate the 95% CI.
Higgins’ I2 statistic and 95% CI, a measure of the degree of heterogeneity across studies, is also shown for each summary OR. Of
note, the 95% CI could not be calculated for I2 with fewer than 2 degrees of freedom. For Fraumeni et al., 1964, the crude OR was
calculated from data provided in 251. For Bross and Natarajan, 1972, the age-adjusted OR was calculated from data provided in 297. For
Söderberg et al., 2006, results for children/adolescents ages 0-18 years were obtained from first author (Karin Söderberg, Karolinska
Institutet, personal communication, 2009).

145
Leukemia
Fraumeni et al., 1964 (251)
Bross and Natarajan, 1972 (250)
Hughes et al., 2007 (34)
Overall (I2 = 94%, 95% CI: 86%, 97%)
ALL
Nishi and Miyake, 1989 (38)
Wen et al., 2000 (37)
Schüz et al., 2003 (36)
Spector et al., 2004 (43)
Rosenbaum et al., 2005 (35)
Hughes et al., 2007 (34)
Overall (I2 = 80%, 95% CI: 57%, 91%)
AML
Schüz et al., 2003 (36)
Hughes et al., 2007 (34)
Overall (I2= 0%)
Author, Year (Reference)
32.87
4.25 (2.54, 7.12)
0.87 (0.73, 1.04)
0.26 (0.11, 0.59)
0.7 (0.6 , 0.8)
0.52 (0.40, 0.67)
1.24 (0.82, 1.86)
0.58 (0.38, 0.88)
0.87 (0.72, 1.06)
0.91 (0.53, 1.57)
0.84 (0.54, 1.28)
31.82
35.31
100.00
6.67
22.58
19.35
15.17
14.61
21.62
100.00
39.90
60.10
100.00
% Weight
0.82 (0.53, 1.27)
4.25 (2.54, 7.12)
0.87 (0.73, 1.04)
0.26 (0.11, 0.59)
0.7 (0.6 , 0.8)
0.52 (0.40, 0.67)
1.24 (0.82, 1.86)
0.58 (0.38, 0.88)
0.87 (0.72, 1.06)
0.91 (0.53, 1.57)
0.84 (0.54, 1.28)
OR (95% CI)
10.1 1 10
Odds Ratio
1.42 (0.60, 3.35)
0.69 (0.54, 0.89)
0.87 (0.62, 1.22)
7-2A)

146
ALL
Wen et al., 2000 (37)
Schüz et al., 2003 (36)
Jourdan-Da Silva et al., 2004 (249)
Spector et al., 2004 (43)
Rosenbaum et al., 2005 (35)
Söderberg et al., 2006
Hughes et al., 2007 (34)
Overall (I2 = 44%, 95% CI: 0%, 77%)
AML
Jourdan-Da Silva et al., 2004 (249)
Söderberg et al., 2006
Hughes et al., 2007 (34)
Overall (I2 = 19%, 95% CI: 0%, 92%)
Author, Year (Reference)
27.00
7.86
13.93
12.23
7.58
7.58
23.83
100.00
17.16
23.53
59.30
100.00
% Weight
0.8 (0.6 , 1.0)
0.61 (0.26, 1.40)
0.5 (0.3 , 0.9)
1.56 (0.85, 2.87)
0.59 (0.25, 1.37)
0.5 (0.2 , 1.1)
0.97 (0.71, 1.33)
0.4 (0.1 , 1.7)
1.7 (0.5 , 5.4)
1.14 (0.61, 2.15)
OR (95% CI)
10.1 1 10
Odds Ratio
0.79 (0.61, 1.02)
1.05 (0.56, 1.95)
7-2B)

147
ALL
Wen et al., 2000 (37)
Schüz et al., 2003 (36)
Spector et al., 2004 (43)
Rosenbaum et al., 2005 (35)
Hughes et al., 2007 (34)
Overall (I2 = 62%, 95% CI: 0%, 86%)
AML
Schüz et al., 2003 (36)
Hughes et al., 2007 (34)
Overall (I2 = 0%)
Author, Year (Reference)
72.13
% Weight OR (95% CI)
24.95
20.98
12.22
12.76
29.09
100.00
27.87
72.
100.00
0.7 (0.5 , 0.9)
0.49 (0.34, 0.71)
1.09 (0.60, 1.96)
0.71 (0.40, 1.28)
0.90 (0.74, 1.10)
0.81 (0.39, 1.70)
0.77 (0.49, 1.21)
OR (95% CI)
10.1 1 10
Odds Ratio
0.74 (0.58, 0.96)
0.78 (0.53, 1.15)
7-2C)

148
ALL
Wen et al., 2000 (37)
Schüz et al., 2003 (36)
Hughes et al., 2007 (34)
Overall (I2 = 3%, 95% CI: 0%, 90%)
AML
Schüz et al., 2003 (36)
Hughes et al., 2007 (34)
Overall (I2 = 0%)
Author, Year (Reference)
100.00
OR (95% CI)
66.54
23.75
9.71
56.47
43.53
100.00
% Weight
0.6 (0.5 , 0.8)
0.45 (0.31, 0.66)
0.45 (0.25, 0.82)
1.02 (0.50, 2.08)
1.23 (0.54, 2.78)
OR (95% CI)
10.1 1 10
Odds Ratio
0.55 (0.46, 0.66)
1.10 (0.65, 1.86)
7-2D)
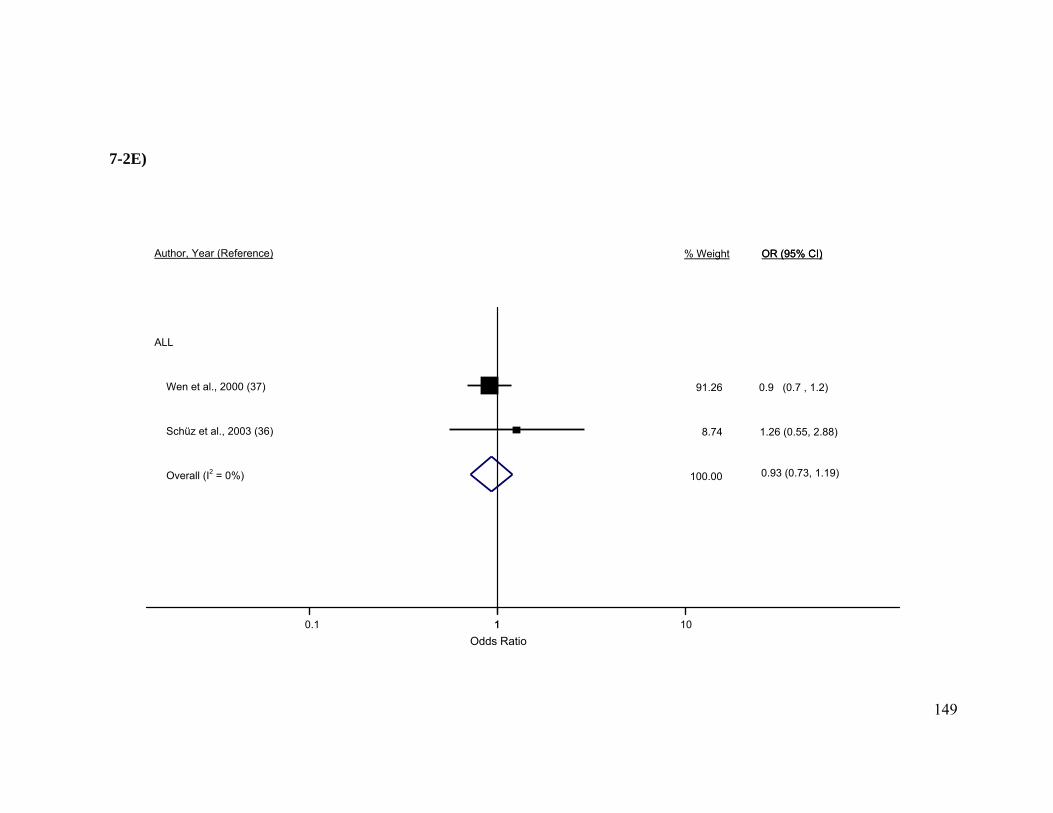
149
ALL
Wen et al., 2000 (37)
Schüz et al., 2003 (36)
Overall (I2 = 0%)
Author, Year (Reference) OR (95% CI)
91.26
8.74
100.00
% Weight
0.9 (0.7 , 1.2)
1.26 (0.55, 2.88)
OR (95% CI)
10.1 1 10
0.93 (0.73, 1.19)
7-2E)
Odds Ratio

150
Figure 7-3. Random effects summary odds ratios (ORs) and 95% confidence intervals
(CIs) upon stratification by quality-related factors for the association between acute
lymphoblastic leukemia (ALL) and A) atopy or allergies, B) asthma, and C) eczema. Of
note, the control response rate was not available for one study.38

151
Nested Case-control Study Other Case-control Study
Source of Controls Population-based Controls Other Controls
Source of Exposure Data Medical Records Parental Report
Accounted for Latency Latency Period No Latency Period
Case Response Rate, % ≥ 80 < 80
Control Response Rate, % ≥ 80 < 80
Adjustment for Sex Yes No
Adjustment for Race Yes No
Adjustment for SES Yes No
Adjustment for Breastfeeding Yes No
Adjustment for Location Yes No
Stratification Variable
2 4
5 1
2 4
2 4
4 2
1 4
4 2
3 3
4 2
2 4
4 2
No. Studies
0.99 (0.72, 1.37)0.57 (0.43, 0.74)
0.63 (0.50, 0.81)1.24 (0.82, 1.86)
0.99 (0.72, 1.37)0.57 (0.43, 0.74)
0.99 (0.72, 1.37)0.57 (0.43, 0.74)
0.78 (0.58, 1.06)0.54 (0.43, 0.67)
1.24 (0.82, 1.86)0.68 (0.55, 0.84)
0.69 (0.44, 1.07)0.69 (0.61, 0.79)
0.79 (0.55, 1.13)0.56 (0.33, 0.94)
0.68 (0.55, 0.84)0.59 (0.13, 2.71)
0.69 (0.61, 0.79)0.69 (0.44, 1.07)
0.64 (0.48, 0.84)0.85 (0.41, 1.77)
OR (95% CI)
0.99 (0.72, 1.37)0.57 (0.43, 0.74)
0.63 (0.50, 0.81)1.24 (0.82, 1.86)
0.99 (0.72, 1.37)0.57 (0.43, 0.74)
0.99 (0.72, 1.37)0.57 (0.43, 0.74)
0.78 (0.58, 1.06)0.54 (0.43, 0.67)
1.24 (0.82, 1.86)0.68 (0.55, 0.84)
0.69 (0.44, 1.07)0.69 (0.61, 0.79)
0.79 (0.55, 1.13)0.56 (0.33, 0.94)
0.68 (0.55, 0.84)0.59 (0.13, 2.71)
0.69 (0.61, 0.79)0.69 (0.44, 1.07)
0.64 (0.48, 0.84)0.85 (0.41, 1.77)
OR (95% CI)
10.1 1 10
Odds Ratio
7-3A)

152
Study Design Nested Case-control Study Other Case-control Study
Source of Controls Population-based Controls Other Controls
Source of Exposure Data Medical Records Parental Report
Accounted for Latency Latency Period No Latency Period
Case Response Rate, % ≥ 80 < 80
Control Response Rate, % ≥ 80 < 80
Adjustment for Sex Yes No
Adjustment for Race Yes No
Adjustment for SES Yes No
Adjustment for Breastfeeding Yes No
Adjustment for Location Yes No
Stratification Variable
3 4
6 1
3 4
3 4
4 3
2 5
5 2
3 4
5 2
2 5
4 3
No. Studies
0.97 (0.60, 1.59)0.72 (0.58, 0.89)
0.75 (0.61, 0.93)1.56 (0.85, 2.87)
0.97 (0.60, 1.59)0.72 (0.58, 0.89)
0.97 (0.60, 1.59)0.72 (0.58, 0.89)
0.91 (0.68, 1.23)0.55 (0.37, 0.82)
0.92 (0.30, 2.77)0.77 (0.62, 0.96)
0.79 (0.52, 1.19)0.78 (0.61, 1.00)
0.92 (0.57, 1.47)0.68 (0.45, 1.01)
0.82 (0.68, 0.98)0.88 (0.29, 2.65)
0.78 (0.61, 1.00)0.79 (0.52, 1.19)
0.78 (0.60, 1.00)0.81 (0.38, 1.72)
OR (95% CI)
0.97 (0.60, 1.59)0.72 (0.58, 0.89)
0.75 (0.61, 0.93)1.56 (0.85, 2.87)
0.97 (0.60, 1.59)0.72 (0.58, 0.89)
0.97 (0.60, 1.59)0.72 (0.58, 0.89)
0.91 (0.68, 1.23)0.55 (0.37, 0.82)
0.92 (0.30, 2.77)0.77 (0.62, 0.96)
0.79 (0.52, 1.19)0.78 (0.61, 1.00)
0.92 (0.57, 1.47)0.68 (0.45, 1.01)
0.82 (0.68, 0.98)0.88 (0.29, 2.65)
0.78 (0.61, 1.00)0.79 (0.52, 1.19)
0.78 (0.60, 1.00)
OR (95% CI)
10.1 1 10
Odds Ratio
7-3B)

153
Study Design Nested Case-control Study Other Case-control Study
Source of Controls Population-based Controls Other Controls
Source of Exposure Data Medical Records Parental Report
Accounted for Latency Latency Period No Latency Period
Case Response Rate, % ≥ 80 < 80
Control Response Rate, % ≥ 80 < 80
Adjustment for Sex Yes No
Adjustment for Race Yes No
Adjustment for SES Yes No
Adjustment for Breastfeeding Yes No
Adjustment for Location Yes No
Stratification Variable
2 3
4 1
2 3
2 3
3 2
1 4
3 2
3 2
4 1
2 3
3 2
No. Studies
0.92 (0.77, 1.11)0.62 (0.49, 0.80)
0.70 (0.53, 0.93)1.09 (0.60, 1.96)
0.92 (0.77, 1.11)0.62 (0.49, 0.80)
0.92 (0.77, 1.11)0.62 (0.49, 0.80)
0.84 (0.69, 1.03)0.55 (0.39, 0.77)
1.09 (0.60, 1.96)0.70 (0.53, 0.93)
0.77 (0.49, 1.21)0.71 (0.55, 0.90)
0.75 (0.60, 0.95)0.68 (0.37, 1.23)
0.70 (0.53, 0.93)1.09 (0.60, 1.96)
0.71 (0.55, 0.90)0.77 (0.49, 1.21)
0.70 (0.50, 0.97)0.87 (0.58, 1.32)
OR (95% CI)
0.92 (0.77, 1.11)0.62 (0.49, 0.80)
0.70 (0.53, 0.93)1.09 (0.60, 1.96)
0.92 (0.77, 1.11)0.62 (0.49, 0.80)
0.92 (0.77, 1.11)0.62 (0.49, 0.80)
0.84 (0.69, 1.03)0.55 (0.39, 0.77)
1.09 (0.60, 1.96)0.70 (0.53, 0.93)
0.77 (0.49, 1.21)0.71 (0.55, 0.90)
0.75 (0.60, 0.95)0.68 (0.37, 1.23)
0.70 (0.53, 0.93)1.09 (0.60, 1.96)
0.71 (0.55, 0.90)0.77 (0.49, 1.21)
0.70 (0.50, 0.97)0.87 (0.58, 1.32)
OR (95% CI)
10.1 1 10
Odds Ratio
7-3C)

154
Discussion
Results of this meta-analysis indicate an inverse association between
atopy/allergies and childhood ALL; the pooled odds of any reported atopy/allergy were
31% lower among cases than controls and was 21% lower for asthma, 26% lower for
eczema, and 45% lower for hay fever, respectively. No association was observed for
leukemia overall or AML, or for any of the specific atopic conditions and AML
examined separately, although there were fewer studies of AML and fewer AML cases.
The divergent results observed for ALL and AML are of interest, given that atopic status
should have been captured similarly across the two case groups.
Two conflicting hypotheses have been proposed to explain a causal relationship
between atopy and cancer. The immune surveillance hypothesis asserts that the immune
system recognizes antigens of malignant cells as foreign and mounts a response to them,
preventing a majority of potential cancers from developing.232 The presence of an atopic
condition is thought to increase the vigilance of the immune system in monitoring for,
identifying, and eliminating malignant cells.212, 233 In support of this hypothesis is the
observation that immunocompromised individuals have higher incidence of specific
malignancies than those with intact immune systems.234 Notably, immunosupressed
persons have increased risk of non-Hodgkin lymphoma,26 a malignancy with identical
histology to T-cell ALL.4
The second hypothesis is that chronic stimulation of the immune system by
allergens increases the risk of carcinogenesis.233, 234 A greater number of proliferating
cells increases the probability of genetic errors, such as pro-oncogenic mutations, that

155
may not be repaired prior to subsequent divisions.233 This mechanism has been proposed
as an explanation for the positive association between autoimmune disease and
malignancy,236 for example.
It is not clear if either of these mechanisms is applicable to childhood/adolescent
cancers; however, the majority of childhood/adolescent leukemia studies reported inverse
associations, potentially supporting the immune surveillance hypothesis. Other possible
explanations include reverse causality, where the leukemic process induces atopic
manifestations, or a common etiology for both atopy and leukemia. There are case reports
exemplifying the former explanation.305-307 As an example of the latter, Smith et al
demonstrated that the hygiene hypothesis may also apply to childhood leukemia.243 In
that ecologic study, decreases in the prevalence of hepatitis A infection, a marker for
hygiene due to the fecal-oral mode of transmission, were associated with increased ALL
risk in the U.S. and Japan.243 Neither of these is consistent with the observed inverse
association, however.
If an inverse relationship existed, then ALL incidence would be expected to
decrease with increasing atopy prevalence. The observed increase in ALL incidence3 is
not inconsistent, however, as ALL is multifactorial, requiring ≥2 “hits,”8 and atopy would
constitute a single “hit” (i.e., it is neither sufficient nor necessary). Assuming
ORatopy/allergies = 0.69 and atopy prevalencecases = 30%–40%, the attributable fraction for
atopy is -14% to -18%.308 It is possible that other putative risk factors with increasing
secular trends (e.g., birthweight75) may contribute to the increase in ALL and offset any
decrease attributable to atopy.

156
Although no biological mechanism has been established, the principal factor
linking childhood/adolescent leukemia and atopic disease is the rate at which the immune
system matures.34 Hypotheses by Greaves and Kinlen suggest an etiologic role for the
immune system in the development of childhood leukemia via delayed exposure and
abnormal response to early life infections;11, 210 no responsible virus or other infectious
agent has been identified to date.246, 247 T helper 2 cell (Th2) versus Th1 cell
predominance is often described with respect to atopy,237 where each cell type has a
specific cytokine profile and associated sequelea. Infants are born with a Th2-dominated
immune profile; non-atopic infants gradually migrate to a Th1-dominant process by 2
years, while infants with a family history of atopy fail to make the Th2-to-Th1
transition.238 Early exposure to infectious agents is thought to stimulate this transition.
Two additional T cell types, T-regulatory and Th17, may also play a role in the complex
interplay between atopy, infections, and autoimmune diseases (reviewed in 239).
There are several notable sources of heterogeneity across the 10 included studies.
Results of the stratified analysis indicate the most important of these is case-control study
design, source of exposure data, and/or inclusion of a latency period. Only three studies
were nested within a larger cohort;34, 43, 248 these have the advantage of temporality over
other case-control designs, in that exposures were measured prior to leukemia diagnosis.
Two aspects of exposure measurement, which data were collected and how they
were collected, likely contributed to the observed heterogeneity. As shown in Table 7-1,
definitions for composite atopy/allergy variables differed across studies in that authors
included different permutations of asthma, eczema, hay fever, and hives. One study

157
included neurodermatitis instead of eczema.36 In two studies, composite variables
incorporated food, drug, bee sting, pollen, dust, or pet dander allergies, accounting for a
large proportion of exposed individuals and potentially driving the observed
associations.35, 37 Söderberg et al used the Swedish hospital discharge registry to identify
those discharged for asthma, which is qualitatively different than exposure classifications
used in other studies, and likely involves substantial underascertainment.248 Of note,
some authors presented definitions that included the presence of symptoms34 or the use of
medications.249 Although not used in the current meta-analysis, these definitions, in
concert with physician diagnosis, may increase sensitivity and could be considered in
future studies.
Three studies used subject medical records for exposure assessment,34, 43, 248
which also has the notable advantage of temporality. Medical records are typically
considered the gold standard for medical history data; however, this is only applicable if
medical records from all sources are obtainable and complete, which is not always the
case.309
Atopic disease was measured via parental report in the remaining studies,35-38, 249-
251 introducing several potential sources of misclassification and/or recall bias.
Subclinical atopy may not be diagnosed by physicians or recognized by parents. For
example, it has been estimated that 30–40% of “healthy” individuals are atopic,222
meaning they produce an immunoglobulin E response to an environmental stimulus. A
related issue is that atopic individuals experience changes in symptoms over time.223
Conversely, not all cases of asthma, eczema or hay fever are atopic.240 Parents of cases

158
may be more motivated and more likely to recall exposures than parents of controls.310 It
is also possible that early symptoms of leukemia may be mistaken for atopic disease.212
Or, parents of cases may be underreporting allergic diseases if immunosuppressive
therapy administered for leukemia reduced allergic symptoms and parents report allergy
status after initiation of treatment.36 Parents of controls may report allergic disease arising
after a specified reference date, since the reference date does not carry the personal
significance of a diagnosis date.36 A sensitivity analysis by Schüz et al, wherein reference
dates for controls were reclassified to interview dates, revealed that the observed
associations were attenuated somewhat, but they could not be wholly attributed to recall
bias.36
Results of one validation study indicated that parental recall of an asthma
diagnosis was high (87% agreement with medical records).311 A second validation study
by Hughes et al demonstrated that accuracy of maternal recall of asthma was high and
approximately equal between cases and controls (sensitivitycases = 81% versus
sensitivitycontrols = 83%), although the level of agreement between maternal recall and
medical records was marginally higher among cases (κcases = 0.69 versus κcontrols = 0.60).34
Recall of eczema was somewhat lower (sensitivitycases = 51% versus sensitivitycontrols =
57%), but agreement with medical records was equivalent between cases and controls (κ
= 0.46). Parental recall of atopic diagnosis is therefore predicted to be similar across
cases and controls, although degree of recall will likely vary by condition.
To minimize concerns about misclassification, a latency period should be
incorporated between onset of atopic symptoms and leukemia diagnosis. Importantly,

159
only four included studies incorporated a latency period, and among those, the length of
the latency period varied (3 months34, 6 months250, or 1 year43, 248).
The age range of included subjects is another potential source of heterogeneity.
Most studies examined children/adolescents ages 0–14 years, however, Bross and
Natarajan did not include infants,250 Spector et al limited their analysis to children ≤6
years,43 and Söderberg et al included children and adolescents ≤18 years (by request).248
Age is an important consideration because the prevalence of atopy increases with
increasing age.223 Further, the age-standardized incidence of leukemia is greatest among
those ages 1–4 years, with lower rates among infants and children/adolescents ages 5–19
years.3 Importantly, three studies presented ORs by age group, however, categories
differed across studies and could not be reasonably pooled.37, 38, 250
The principal limitation for any meta-analysis is the great potential for selection
bias, encompassing publication, English language, citation, and multiple publication
bias.312 Failure to include all studies of a given association may produce a summary OR
that overestimates the true effect.313 To minimize publication bias, we contacted
international experts of childhood cancer etiology to inquire about unpublished or
unidentified studies in addition to the systematic electronic database search. Additional
limitations include the small number of studies for each exposure-disease association and
relatively high level of heterogeneity detected across studies, which may restrict the
generalizability of the summary ORs produced.
There are also limitations within the individual case-control studies. Recall bias,
as discussed above, is a primary concern with retrospective designs; selection bias is also

160
of concern. Selection bias was likely absent in the registry- or HMO-based studies43, 248,
but cannot be ruled out in other studies with lower participation rates, especially since
ORs for ALL were closer to the null for both cases and controls for response rates ≥80%
versus <80% in the stratified analyses. Also noteworthy, very sick or deceased cases were
excluded from one study, potentially introducing survival bias.249 Further, individuals
with higher SES tend to participate in case-control studies of childhood cancer124, and
SES is associated with both atopy314 and leukemia.245 Adjustment for SES did not result
in disparate stratum-specific ORs for ALL for atopy/allergies or asthma, but there was a
possible effect for eczema. The potential effects of misclassification and other sources of
bias are best evaluated by conducting a formal uncertainty analysis.315
Although the results of this meta-analysis indicate inverse associations between
atopy/allergies and childhood/adolescent ALL, causes of the observed statistical
associations must be investigated thoroughly to rule out explanations other than a direct
causal relationship, such as reverse causality or selection or recall bias. Ideally, future
studies would include a prospective design with analysis of biological specimens to avoid
the pitfalls of temporality and misclassification plaguing existing studies.

161
Chapter 8: Conclusions
The ultimate aim of etiologic research is to identify underlying causes of disease.
The current body of work has contributed to the general scientific knowledge about the
causes of childhood and adolescent hematologic malignancies as described below.
NBS from all U.S. infants would ideally be cataloged and properly stored such
that they could be retrieved and released for etiologic research with proper scientific
justification, ethics review board oversight, and subject consent. From the FROGS Study,
we can conclude that state newborn screening program policies regarding NBS retention
and release for research are evolving rapidly; this report reflects a snapshot in time.
Currently, retrospective population-based case-control studies of childhood/adolescent
cancers using NBS are limited to a few states. For example, out of 39 states queried,
residual NBS were retrieved with signed (parental or adult child) consent from
California, Michigan, New York, Texas and Washington in this study. Fortunately, most
of these states have large populations to provide reasonable pediatric case and control
groups. Depending on the age range of participants and state policies in the future, NBS
could potentially be retrieved from Iowa, Indiana, Maine, Maryland, Massachusetts,
Minnesota, Missouri, North Carolina, and New Jersey as well. Studies of cancers in
young children stand the greatest chance of success (versus studies in older children and
adolescents) and may be the most relevant with respect to prenatal exposures. It will be
of interest to observe state NBS retention and release policies moving forward.
In our analysis of the Epidemiology of Infant Leukemia Study dataset, we found
little evidence supporting associations between maternal prenatal vitamin use in the year
162
before and/or during pregnancy, use in the periconceptional period (year before
pregnancy and early in, but prior to knowledge of pregnancy), use after knowledge of
pregnancy, or use in all of these periods and infant leukemia, ALL, or AML, although
ORs for ALL were consistently <1.00. Similarly, we did not observe associations with
iron supplement use above that found in multi- or prenatal vitamins, although the ORs for
each of the etiologic time periods were >1.00. We speculate that the failure to observe
associations with prenatal vitamin use in this study may be attributable to high rates of
folic acid supplementation in the unique study population, including personal vitamin use
and national folic acid fortification programs implemented in the U.S. and Canada early
in the study period. The fortification programs have helped to ensure there is little chance
for folate deficiency in these countries and therefore, the folic acid-leukemia association
is no longer a relevant public health concern. It is still of interest from an etiologic
perspective, however, and future research directions may include assessment of genetic
susceptibility, such as an association study of SNPs in the conjoined pathways of folate
and homocysteine metabolism, or experiments conducted in animal models.
In the meta-analysis of atopic disease and childhood leukemia, inverse
associations were observed for ALL and atopic disease, and for asthma, eczema, and hay
fever examined separately. High levels of heterogeneity were detected across studies. No
association was observed for leukemia overall or AML, or for any of the specific atopic
conditions and AML examined separately, although there were fewer studies of AML
and fewer AML cases. The divergent results observed for ALL and AML are of interest,
given that atopic status should have been captured similarly across the two case groups.

163
Upon further investigation, ORs for ALL differed across strata of study design, exposure
data source, and latency period, indicating these factors impact study results. Although
inverse associations between atopy/allergies and childhood/adolescent ALL were
observed, causes of the observed statistical associations must be investigated thoroughly
to rule out explanations other than a direct causal relationship, such as reverse causality
or selection or recall bias. Ideally, future studies would include a prospective design with
analysis of biological specimens to avoid the pitfalls of temporality and misclassification
plaguing existing studies. Due to the difficulty in obtaining blood samples for
immunoglobulin E (IgE) analysis prior to initiation of leukemia, genetic association
studies may be a better avenue for future research.
The causes of most childhood hematologic malignancies remain elusive. Etiologic
studies of pediatric malignancies have been generally restricted to registry-based or
retrospective case-control study designs due to their rarity, and the interpretation of such
studies must therefore be tempered by residual confounding, selection bias, and/or recall
bias considerations. Novel exposure measurement methods will be needed to further the
field. For example, analysis of biomarkers, such as substrates extracted from NBS, and
genetic analyses, such as genome-wide association studies, allow investigators to
circumvent some of these limitations.

164
Bibliography 1. WISQARS 10 Leading Causes of Deaths, United States, 2006, All Races, Both
Sexes, Ages: 1-19: Office of Statistics and Programming, National Center for Injury Prevention and Control, Centers for Disease Control and Prevention (http://webappa.cdc.gov/sasweb/ncipc/leadcaus10.html).
2. American Cancer Society. Cancer Facts and Figures 2009. Atlanta, GA: American Cancer Society; 2009.
3. Linabery AM, Ross JA. Trends in childhood cancer incidence in the U.S. (1992-2004). Cancer. Jan 15 2008;112(2):416-432.
4. Ries LAG, Smith MA, Gurney JG, Linet M, Tamra T, Young JL, Bunin GR (eds). Cancer Incidence and Survival among Children and Adolescents: United States SEER Program 1975-1995. Bethesda, MD: National Cancer Institute, SEER Program, NIH Pub. No. 99-4649; 1999.
5. Gale KB, Ford AM, Repp R, et al. Backtracking leukemia to birth: identification of clonotypic gene fusion sequences in neonatal blood spots. Proc Natl Acad Sci U S A. Dec 9 1997;94(25):13950-13954.
6. Taub JW, Ge Y. The prenatal origin of childhood acute lymphoblastic leukemia. Leuk Lymphoma. Jan 2004;45(1):19-25.
7. Mori H, Colman SM, Xiao Z, et al. Chromosome translocations and covert leukemic clones are generated during normal fetal development. Proc Natl Acad Sci U S A. Jun 11 2002;99(12):8242-8247.
8. Greaves MF, Maia AT, Wiemels JL, Ford AM. Leukemia in twins: lessons in natural history. Blood. Oct 1 2003;102(7):2321-2333.
9. Knudson AG, Jr. Mutation and cancer: statistical study of retinoblastoma. Proc Natl Acad Sci U S A. Apr 1971;68(4):820-823.
10. Greaves MF, Wiemels J. Origins of chromosome translocations in childhood leukaemia. Nat Rev Cancer. Sep 2003;3(9):639-649.
11. Greaves MF. Speculations on the cause of childhood acute lymphoblastic leukemia. Leukemia. Feb 1988;2(2):120-125.
12. Greaves MF, Alexander FE. An infectious etiology for common acute lymphoblastic leukemia in childhood? Leukemia. Mar 1993;7(3):349-360.
13. Ross JA, Spector LG, Robison LL, Olshan AF. Epidemiology of leukemia in children with Down syndrome. Pediatr Blood Cancer. Jan 2005;44(1):8-12.
165
14. Bader JL, Miller RW. Neurofibromatosis and childhood leukemia. J Pediatr. Jun 1978;92(6):925-929.
15. Bloomfield CD, Brunning RD. Acute leukemia as a terminal event in nonleukemic hematopoietic disorders. Semin Oncol. Sep 1976;3(3):297-317.
16. Doll R, Wakeford R. Risk of childhood cancer from fetal irradiation. Br J Radiol. Feb 1997;70:130-139.
17. Simpson CL, Hempelmann LH. The association of tumors and roentgen-ray treatment of the thorax in infancy. Cancer. Jan-Feb 1957;10(1):42-56.
18. Ron E, Modan B, Boice JD, Jr. Mortality after radiotherapy for ringworm of the scalp. Am J Epidemiol. Apr 1988;127(4):713-725.
19. Murray R, Heckel P, Hempelmann LH. Leukemia in children exposed to ionizing radiation. N Engl J Med. Sep 17 1959;261:585-589.
20. Michels SD, McKenna RW, Arthur DC, Brunning RD. Therapy-related acute myeloid leukemia and myelodysplastic syndrome: a clinical and morphologic study of 65 cases. Blood. Jun 1985;65(6):1364-1372.
21. Pui CH, Ribeiro RC, Hancock ML, et al. Acute myeloid leukemia in children treated with epipodophyllotoxins for acute lymphoblastic leukemia. N Engl J Med. Dec 12 1991;325(24):1682-1687.
22. Andersen MK, Christiansen DH, Jensen BA, Ernst P, Hauge G, Pedersen-Bjergaard J. Therapy-related acute lymphoblastic leukaemia with MLL rearrangements following DNA topoisomerase II inhibitors, an increasing problem: report on two new cases and review of the literature since 1992. Br J Haematol. Sep 2001;114(3):539-543.
23. Tower RL, Spector LG. The epidemiology of childhood leukemia with a focus on birth weight and diet. Crit Rev Clin Lab Sci. 2007;44(3):203-242.
24. Mack TM, Cozen W, Shibata DK, et al. Concordance for Hodgkin's disease in identical twins suggesting genetic susceptibility to the young-adult form of the disease. N Engl J Med. Feb 16 1995;332(7):413-418.
25. Grufferman S, Cole P, Smith PG, Lukes RJ. Hodgkin's disease in siblings. N Engl J Med. Feb 3 1977;296(5):248-250.
26. Kersey JH, Shapiro RS, Filipovich AH. Relationship of immunodeficiency to lymphoid malignancy. Pediatr Infect Dis J. May 1988;7(5 Suppl):S10-12.

166
27. McClain KL, Joshi VV, Murphy SB. Cancers in children with HIV infection. Hematol Oncol Clin North Am. Oct 1996;10(5):1189-1201.
28. Taylor AM, Metcalfe JA, Thick J, Mak YF. Leukemia and lymphoma in ataxia telangiectasia. Blood. Jan 15 1996;87(2):423-438.
29. Armstrong AA, Alexander FE, Paes RP, et al. Association of Epstein-Barr virus with pediatric Hodgkin's disease. Am J Pathol. Jun 1993;142(6):1683-1688.
30. Niedobitek G, Young LS, Herbst H. Epstein-Barr virus infection and the pathogenesis of malignant lymphomas. Cancer Surv. 1997;30:143-162.
31. Goh YI, Bollano E, Einarson TR, Koren G. Prenatal multivitamin supplementation and rates of pediatric cancers: a meta-analysis. Clin Pharmacol Ther. May 2007;81(5):685-691.
32. Belson M, Kingsley B, Holmes A. Risk factors for acute leukemia in children: a review. Environ Health Perspect. Jan 2007;115(1):138-145.
33. Lightfoot T, Bunch K, Ansell P, Murphy M. Ovulation induction, assisted conception and childhood cancer. Eur J Cancer. Mar 2005;41(5):715-724; discussion 725-716.
34. Hughes AM, Lightfoot T, Simpson J, et al. Allergy and risk of childhood leukaemia: results from the UKCCS. Int J Cancer. Aug 15 2007;121(4):819-824.
35. Rosenbaum PF, Buck GM, Brecher ML. Allergy and infectious disease histories and the risk of childhood acute lymphoblastic leukaemia. Paediatr Perinat Epidemiol. Mar 2005;19(2):152-164.
36. Schüz J, Morgan G, Bohler E, Kaatsch P, Michaelis J. Atopic disease and childhood acute lymphoblastic leukemia. Int J Cancer. Jun 10 2003;105(2):255-260.
37. Wen W, Shu XO, Linet MS, et al. Allergic disorders and the risk of childhood acute lymphoblastic leukemia (United States). Cancer Causes Control. Apr 2000;11(4):303-307.
38. Nishi M, Miyake H. A case-control study of non-T cell acute lymphoblastic leukaemia of children in Hokkaido, Japan. J Epidemiol Community Health. Dec 1989;43(4):352-355.
39. Schüz J, Weihkopf T, Kaatsch P. Medication use during pregnancy and the risk of childhood cancer in the offspring. Eur J Pediatr. May 2007;166(5):433-441.

167
40. Ross JA, Blair CK, Olshan AF, et al. Periconceptional vitamin use and leukemia risk in children with Down syndrome: a Children's Oncology Group study. Cancer. Jul 15 2005;104(2):405-410.
41. Wen W, Shu XO, Potter JD, et al. Parental medication use and risk of childhood acute lymphoblastic leukemia. Cancer. Oct 15 2002;95(8):1786-1794.
42. Thompson JR, Gerald PF, Willoughby ML, Armstrong BK. Maternal folate supplementation in pregnancy and protection against acute lymphoblastic leukaemia in childhood: a case-control study. Lancet. Dec 8 2001;358(9297):1935-1940.
43. Spector L, Groves F, DeStefano F, et al. Medically recorded allergies and the risk of childhood acute lymphoblastic leukaemia. Eur J Cancer. Mar 2004;40(4):579-584.
44. Liu L, Krailo M, Reaman GH, Bernstein L. Childhood cancer patients' access to cooperative group cancer programs: a population-based study. Cancer. Mar 1 2003;97(5):1339-1345.
45. Kumar A, Soares H, Wells R, et al. Are experimental treatments for cancer in children superior to established treatments? Observational study of randomised controlled trials by the Children's Oncology Group. Bmj. Dec 3 2005;331(7528):1295.
46. Ross JA, Olshan AF. Pediatric cancer in the United States: the Children's Oncology Group Epidemiology Research Program. Cancer Epidemiol Biomarkers Prev. Oct 2004;13(10):1552-1554.
47. Steele JR, Wellemeyer AS, Hansen MJ, Reaman GH, Ross JA. Childhood cancer research network: a North American Pediatric Cancer Registry. Cancer Epidemiol Biomarkers Prev. Jul 2006;15(7):1241-1242.
48. Guthrie R, Susi A. A Simple Phenylalanine Method for Detecting Phenylketonuria in Large Populations of Newborn Infants. Pediatrics. Sep 1963;32:338-343.
49. Michigan Department of Community Health. Newborn Screening in Michigan, 2004 Annual Report. March 2005. Available at: http://michigan.gov/documents/2005_NBS__Annual_Report_139259_7.pdf.
50. Mei JV, Alexander JR, Adam BW, Hannon WH. Use of filter paper for the collection and analysis of human whole blood specimens. J Nutr. May 2001;131(5):1631S-1636S.
168
51. Hannon WH, Baily CM, Bartoshesky LE, Davin B, Hoffman GL, King PP, Neier SS, Peter JA, Therrell BL. Blood Collection on Filter Paper for Newborn Screening Programs; Approved Standard - Fourth Edition. National Committee for Clinical Laboratory Standards Document LA4-A4. Wayne, PA: NCCLS; 2003.
52. National Newborn Screening Information System. Infant's age at time of initial testing in the U.S. in 2008. [Last accessed January 27, 2010]. http://www2.uthscsa.edu/nnsis/.
53. National Newborn Screening and Genetics Resource Center. National Newborn Screening Status Report, Updated 12/17/09. [Last accessed January 27, 2010]. http://genes-r-us.uthscsa.edu/nbsdisorders.pdf.
54. Therrell BL, Johnson A, Williams D. Status of newborn screening programs in the United States. Pediatrics. May 2006;117(5 Pt 2):S212-252.
55. The Newborn Screening Saves Lives Act of 2007, Pub. L. No. 110-204, 122 Stat. 705-712 (April 24, 2008)
56. Olshan AF. Meeting report: the use of newborn blood spots in environmental research: opportunities and challenges. Environ Health Perspect. Dec 2007;115(12):1767-1779.
57. McDade TW, Williams S, Snodgrass JJ. What a drop can do: dried blood spots as a minimally invasive method for integrating biomarkers into population-based research. Demography. Nov 2007;44(4):899-925.
58. Skogstrand K, Ekelund CK, Thorsen P, et al. Effects of blood sample handling procedures on measurable inflammatory markers in plasma, serum and dried blood spot samples. J Immunol Methods. Jul 20 2008;336(1):78-84.
59. Schutt BS, Weber K, Elmlinger MW, Ranke MB. Measuring IGF-I, IGFBP-2 and IGFBP-3 from dried blood spots on filter paper is not only practical but also reliable. Growth Horm IGF Res. Apr-Jun 2003;13(2-3):75-80.
60. O'Broin SD, Gunter EW. Screening of folate status with use of dried blood spots on filter paper. Am J Clin Nutr. Sep 1999;70(3):359-367.
61. Hansen C, Sorensen LD, Asmussen I, Autrup H. Transplacental exposure to tobacco smoke in human-adduct formation in placenta and umbilical cord blood vessels. Teratog Carcinog Mutagen. 1992;12(2):51-60.
62. Shirtcliff EA, Reavis R, Overman WH, Granger DA. Measurement of gonadal hormones in dried blood spots versus serum: verification of menstrual cycle phase. Horm Behav. Jun 2001;39(4):258-266.

169
63. Chen L, Wang M, Villalta PW, Hecht SS. Liquid chromatography-electrospray ionization tandem mass spectrometry analysis of 7-ethylguanine in human liver DNA. Chem Res Toxicol. Oct 2007;20(10):1498-1502.
64. Wang M, Cheng G, Villalta PW, Hecht SS. Development of liquid chromatography electrospray ionization tandem mass spectrometry methods for analysis of DNA adducts of formaldehyde and their application to rats treated with N-nitrosodimethylamine or 4-(methylnitrosamino)-1-(3-pyridyl)-1-butanone. Chem Res Toxicol. Aug 2007;20(8):1141-1148.
65. Chen L, Wang M, Villalta PW, et al. Quantitation of an acetaldehyde adduct in human leukocyte DNA and the effect of smoking cessation. Chem Res Toxicol. Jan 2007;20(1):108-113.
66. Spector LG, Hecht SS, Ognjanovic S, Carmella SG, Ross JA. Detection of cotinine in newborn dried blood spots. Cancer Epidemiol Biomarkers Prev. Sep 2007;16(9):1902-1905.
67. Tarini BA, Goldenberg A, Singer D, Clark SJ, Butchart A, Davis MM. Not without my Permission: Parents' Willingness to Permit Use of Newborn Screening Samples for Research. Public Health Genomics. Jul 11 2009.
68. Loffredo CA, Ewing CK. Use of stored newborn blood spots in research on birth defects: variation in retrieval rates by type of defect and infant characteristics. Am J Med Genet. Mar 3 1997;69(1):85-88.
69. Klotz J, Bryant P, Wilcox HB, Dillon M, Wolf B, Fagliano J. Population-based retrieval of newborn dried blood spots for researching paediatric cancer susceptibility genes. Paediatr Perinat Epidemiol. Sep 2006;20(5):449-452.
70. Searles Nielsen S, Mueller BA, De Roos AJ, Checkoway H. Newborn screening archives as a specimen source for epidemiologic studies: feasibility and potential for bias. Ann Epidemiol. Jan 2008;18(1):58-64.
71. Olney RS, Moore CA, Ojodu JA, Lindegren ML, Hannon WH. Storage and use of residual dried blood spots from state newborn screening programs. J Pediatr. May 2006;148(5):618-622.
72. National Newborn Screening and Genetics Resource Center. National Newborn Screening Status Report, Updated 04/23/08. [accessed April 21, 2008]. http://genes-r-us.uthscsa.edu/nbsdisorders.pdf.
73. Cordovado SK, Earley MC, Hendrix M, et al. Assessment of DNA contamination from dried blood spots and determination of DNA yield and function using archival newborn dried blood spots. Clin Chim Acta. Apr 2009;402(1-2):107-113.

170
74. Skogstrand K, Thorsen P, Norgaard-Pedersen B, Schendel DE, Sorensen LC, Hougaard DM. Simultaneous measurement of 25 inflammatory markers and neurotrophins in neonatal dried blood spots by immunoassay with xMAP technology. Clin Chem. Oct 2005;51(10):1854-1866.
75. Caughey RW, Michels KB. Birth weight and childhood leukemia: a meta-analysis and review of the current evidence. Int J Cancer. Jun 1 2009;124(11):2658-2670.
76. Ross JA, Perentesis JP, Robison LL, Davies SM. Big babies and infant leukemia: a role for insulin-like growth factor-1? Cancer Causes Control. Sep 1996;7(5):553-559.
77. Lei U, Wohlfahrt J, Hjalgrim H, Hjalgrim LL, Simonsen H, Melbye M. Neonatal level of thyroid-stimulating hormone and acute childhood leukemia. Int J Cancer. Nov 1 2000;88(3):486-488.
78. McKinney PA, Cartwright RA, Saiu JM, et al. The inter-regional epidemiological study of childhood cancer (IRESCC): a case control study of aetiological factors in leukaemia and lymphoma. Arch Dis Child. Mar 1987;62(3):279-287.
79. Shu XO, Clemens J, Zheng W, Ying DM, Ji BT, Jin F. Infant breastfeeding and the risk of childhood lymphoma and leukaemia. Int J Epidemiol. Feb 1995;24(1):27-32.
80. Adami J, Glimelius B, Cnattingius S, et al. Maternal and perinatal factors associated with non-Hodgkin's lymphoma among children. Int J Cancer. Mar 15 1996;65(6):774-777.
81. Roman E, Ansell P, Bull D. Leukaemia and non-Hodgkin's lymphoma in children and young adults: are prenatal and neonatal factors important determinants of disease? Br J Cancer. 1997;76(3):406-415.
82. Roman E, Simpson J, Ansell P, Lightfoot T, Mitchell C, Eden TO. Perinatal and reproductive factors: a report on haematological malignancies from the UKCCS. Eur J Cancer. Mar 2005;41(5):749-759.
83. Yeazel MW, Ross JA, Buckley JD, Woods WG, Ruccione K, Robison LL. High birth weight and risk of specific childhood cancers: a report from the Children's Cancer Group. J Pediatr. Nov 1997;131(5):671-677.
84. Petridou ET, Dikalioti SK, Skalkidou A, Andrie E, Dessypris N, Trichopoulos D. Sun exposure, birth weight, and childhood lymphomas: a case control study in Greece. Cancer Causes Control. Nov 2007;18(9):1031-1037.

171
85. Schüz J, Kaatsch P, Kaletsch U, Meinert R, Michaelis J. Association of childhood cancer with factors related to pregnancy and birth. Int J Epidemiol. Aug 1999;28(4):631-639.
86. McLaughlin CC, Baptiste MS, Schymura MJ, Nasca PC, Zdeb MS. Birth weight, maternal weight and childhood leukaemia. Br J Cancer. Jun 5 2006;94(11):1738-1744.
87. Podvin D, Kuehn CM, Mueller BA, Williams M. Maternal and birth characteristics in relation to childhood leukaemia. Paediatr Perinat Epidemiol. Jul 2006;20(4):312-322.
88. Wright VC, Chang J, Jeng G, Macaluso M. Assisted reproductive technology surveillance--United States, 2005. MMWR Surveill Summ. Jun 20 2008;57(5):1-23.
89. Raimondi S, Pedotti P, Taioli E. Meta-analysis of cancer incidence in children born after assisted reproductive technologies. Br J Cancer. Oct 31 2005;93(9):1053-1056.
90. van Steensel-Moll HA, Valkenburg HA, Vandenbroucke JP, van Zanen GE. Are maternal fertility problems related to childhood leukaemia? Int J Epidemiol. Dec 1985;14(4):555-559.
91. Kobayashi N, Matsui I, Tanimura M, et al. Childhood neuroectodermal tumours and malignant lymphoma after maternal ovulation induction. Lancet. Oct 12 1991;338(8772):955.
92. Sarasua S, Savitz DA. Cured and broiled meat consumption in relation to childhood cancer: Denver, Colorado (United States). Cancer Causes Control. Mar 1994;5(2):141-148.
93. Dockerty JD, Herbison P, Skegg DC, Elwood M. Vitamin and mineral supplements in pregnancy and the risk of childhood acute lymphoblastic leukaemia: a case-control study. BMC Public Health. 2007;7(147):136.
94. Shaw AK, Infante-Rivard C, Morrison HI. Use of medication during pregnancy and risk of childhood leukemia (Canada). Cancer Causes Control. Nov 2004;15(9):931-937.
95. Robison LL, Buckley JD, Daigle AE, et al. Maternal drug use and risk of childhood nonlymphoblastic leukemia among offspring. An epidemiologic investigation implicating marijuana (a report from the Childrens Cancer Study Group). Cancer. May 15 1989;63(10):1904-1911.

172
96. van Duijn CM, van Steensel-Moll HA, Coebergh JW, van Zanen GE. Risk factors for childhood acute non-lymphocytic leukemia: an association with maternal alcohol consumption during pregnancy? Cancer Epidemiol Biomarkers Prev. Sep 1994;3(6):457-460.
97. Alexander FE, Patheal SL, Biondi A, et al. Transplacental chemical exposure and risk of infant leukemia with MLL gene fusion. Cancer Res. Mar 15 2001;61(6):2542-2546.
98. Shu XO, Ross JA, Pendergrass TW, Reaman GH, Lampkin B, Robison LL. Parental alcohol consumption, cigarette smoking, and risk of infant leukemia: a Childrens Cancer Group study. J Natl Cancer Inst. Jan 3 1996;88(1):24-31.
99. Menegaux F, Ripert M, Hemon D, Clavel J. Maternal alcohol and coffee drinking, parental smoking and childhood leukaemia: a French population-based case-control study. Paediatr Perinat Epidemiol. Jul 2007;21(4):293-299.
100. MacArthur AC, McBride ML, Spinelli JJ, Tamaro S, Gallagher RP, Theriault G. Risk of childhood leukemia associated with parental smoking and alcohol consumption prior to conception and during pregnancy: the cross-Canada childhood leukemia study. Cancer Causes Control. Apr 2008;19(3):283-295.
101. Menegaux F, Steffen C, Bellec S, et al. Maternal coffee and alcohol consumption during pregnancy, parental smoking and risk of childhood acute leukaemia. Cancer Detect Prev. 2005;29(6):487-493.
102. Petridou E, Trichopoulos D, Kalapothaki V, et al. The risk profile of childhood leukaemia in Greece: a nationwide case-control study. Br J Cancer. 1997;76(9):1241-1247.
103. Infante-Rivard C, Krajinovic M, Labuda D, Sinnett D. Childhood acute lymphoblastic leukemia associated with parental alcohol consumption and polymorphisms of carcinogen-metabolizing genes. Epidemiology. May 2002;13(3):277-281.
104. Severson RK, Buckley JD, Woods WG, Benjamin D, Robison LL. Cigarette smoking and alcohol consumption by parents of children with acute myeloid leukemia: an analysis within morphological subgroups--a report from the Childrens Cancer Group. Cancer Epidemiol Biomarkers Prev. Sep-Oct 1993;2(5):433-439.
105. Roman E, Watson A, Beral V, et al. Case-control study of leukaemia and non-Hodgkin's lymphoma among children aged 0-4 years living in west Berkshire and north Hampshire health districts. Bmj. Mar 6 1993;306(6878):615-621.

173
106. Boffetta P, Tredaniel J, Greco A. Risk of childhood cancer and adult lung cancer after childhood exposure to passive smoke: A meta-analysis. Environ Health Perspect. Jan 2000;108(1):73-82.
107. Brondum J, Shu XO, Steinbuch M, Severson RK, Potter JD, Robison LL. Parental cigarette smoking and the risk of acute leukemia in children. Cancer. Mar 15 1999;85(6):1380-1388.
108. Infante-Rivard C, Krajinovic M, Labuda D, Sinnett D. Parental smoking, CYP1A1 genetic polymorphisms and childhood leukemia (Quebec, Canada). Cancer Causes Control. Jul 2000;11(6):547-553.
109. Sorahan T, McKinney PA, Mann JR, et al. Childhood cancer and parental use of tobacco: findings from the inter-regional epidemiological study of childhood cancer (IRESCC). Br J Cancer. Jan 5 2001;84(1):141-146.
110. Okcu MF, Goodman KJ, Carozza SE, et al. Birth weight, ethnicity, and occurrence of cancer in children: a population-based, incident case-control study in the State of Texas, USA. Cancer Causes Control. Sep 2002;13(7):595-602.
111. Pang D, McNally R, Birch JM. Parental smoking and childhood cancer: results from the United Kingdom Childhood Cancer Study. Br J Cancer. Feb 10 2003;88(3):373-381.
112. Chang JS, Selvin S, Metayer C, Crouse V, Golembesky A, Buffler PA. Parental smoking and the risk of childhood leukemia. Am J Epidemiol. Jun 15 2006;163(12):1091-1100.
113. Mucci LA, Granath F, Cnattingius S. Maternal smoking and childhood leukemia and lymphoma risk among 1,440,542 Swedish children. Cancer Epidemiol Biomarkers Prev. Sep 2004;13(9):1528-1533.
114. Watson MS. Newborn screening: toward a uniform screening panel and system--executive summary. Pediatrics. May 2006;117(5 Pt 2):S296-307.
115. National Newborn Screening Information System. Staff List for 2009. [Last accessed January 27, 2010]. http://www2.uthscsa.edu/nnsis/.
116. Therrell BL, Hannon WH, Pass KA, et al. Guidelines for the retention, storage, and use of residual dried blood spot samples after newborn screening analysis: statement of the Council of Regional Networks for Genetic Services. Biochem Mol Med. Apr 1996;57(2):116-124.
117. Pelias MK, Markward NJ. Newborn screening, informed consent, and future use of archived tissue samples. Genet Test. Fall 2001;5(3):179-185.

174
118. State sued over blood storage. St. Paul Pioneer Press. March 11, 2009;Minnesota-Twin Cities.
119. Roser MA. State sued over babies' blood. Austin American-Statesman. March 13, 2009;Metro: B01.
120. Roser MA. Samples of newborns' blood to be destroyed. Austin American-Statesman. December 23, 2009;Main: A01.
121. Hennepin County District Court rules MDH not in violation of privacy laws. The Minnesota Lawyer. December 7, 2009;News.
122. National Newborn Screening Information System. Laboratory Specimen Information for Newborn Screening in the U.S. in 2010. [Last accessed January 27, 2010]. http://www2.uthscsa.edu/nnsis/.
123. Ross JA, Severson RK, Pollock BH, Robison LL. Childhood cancer in the United States. A geographical analysis of cases from the Pediatric Cooperative Clinical Trials groups. Cancer. Jan 1 1996;77(1):201-207.
124. Law GR, Smith AG, Roman E. The importance of full participation: lessons from a national case-control study. Br J Cancer. Feb 1 2002;86(3):350-355.
125. Greaves MF. Infant leukaemia biology, aetiology and treatment. Leukemia. Feb 1996;10(2):372-377.
126. Pui CH, Kane JR, Crist WM. Biology and treatment of infant leukemias. Leukemia. May 1995;9(5):762-769.
127. Chowdhury T, Brady HJ. Insights from clinical studies into the role of the MLL gene in infant and childhood leukemia. Blood Cells Mol Dis. Mar-Apr 2008;40(2):192-199.
128. Stam RW, den Boer ML, Pieters R. Towards targeted therapy for infant acute lymphoblastic leukaemia. Br J Haematol. Mar 2006;132(5):539-551.
129. Ishii E, Kawasaki H, Isoyama K, Eguchi-Ishimae M, Eguchi M. Recent advances in the treatment of infant acute myeloid leukemia. Leuk Lymphoma. May 2003;44(5):741-748.
130. Chuk MK, McIntyre E, Small D, Brown P. Discordance of MLL-rearranged (MLL-R) infant acute lymphoblastic leukemia in monozygotic twins with spontaneous clearance of preleukemic clone in unaffected twin. Blood. Jun 25 2009;113(26):6691-6694.

175
131. Kim YI. Folic acid fortification and supplementation--good for some but not so good for others. Nutr Rev. Nov 2007;65(11):504-511.
132. Morrison K, Papapetrou C, Hol FA, et al. Susceptibility to spina bifida; an association study of five candidate genes. Ann Hum Genet. Sep 1998;62(Pt 5):379-396.
133. Prevention of neural tube defects: results of the Medical Research Council Vitamin Study. MRC Vitamin Study Research Group. Lancet. Jul 20 1991;338(8760):131-137.
134. Czeizel AE, Dudas I, Metneki J. Pregnancy outcomes in a randomised controlled trial of periconceptional multivitamin supplementation. Final report. Arch Gynecol Obstet. 1994;255(3):131-139.
135. Czeizel AE, Dobo M, Vargha P. Hungarian cohort-controlled trial of periconceptional multivitamin supplementation shows a reduction in certain congenital abnormalities. Birth Defects Res A Clin Mol Teratol. Nov 2004;70(11):853-861.
136. Recommendations for the use of folic acid to reduce the number of cases of spina bifida and other neural tube defects. MMWR Recomm Rep. Sep 11 1992;41(RR-14):1-7.
137. Williams LM, Morrow B, Lansky A, et al. Surveillance for selected maternal behaviors and experiences before, during, and after pregnancy. Pregnancy Risk Assessment Monitoring System (PRAMS), 2000. MMWR Surveill Summ. Nov 14 2003;52(11):1-14.
138. Food and Drug Administration. Food standards: amendment of standards of identity for enriched grain products to require addition of folic acid. Federal Register. 1996;61:8781-8797.
139. Ray JG, Vermeulen MJ, Boss SC, Cole DE. Increased red cell folate concentrations in women of reproductive age after Canadian folic acid food fortification. Epidemiology. Mar 2002;13(2):238-240.
140. FDA. Food Standards: Amendment of Standards of Identity for Enriched Grain Products to Require Addition of Folic Acid. Federal Register. 1996;61:8781-8797.
141. CDC. Folate Status in Women of Childbearing Age - United States, 1999. MMWR Weekly. 2000;49(42):962-965.

176
142. Honein MA, Paulozzi LJ, Mathews TJ, Erickson JD, Wong LY. Impact of folic acid fortification of the US food supply on the occurrence of neural tube defects. Jama. Jun 20 2001;285(23):2981-2986.
143. Ray JG, Meier C, Vermeulen MJ, Boss S, Wyatt PR, Cole DE. Association of neural tube defects and folic acid food fortification in Canada. Lancet. Dec 21-28 2002;360(9350):2047-2048.
144. French AE, Grant R, Weitzman S, et al. Folic acid food fortification is associated with a decline in neuroblastoma. Clin Pharmacol Ther. Sep 2003;74(3):288-294.
145. Yeung L, Yang Q, Berry RJ. Contributions of total daily intake of folic acid to serum folate concentrations. Jama. Dec 3 2008;300(21):2486-2487.
146. van der Linden IJ, Afman LA, Heil SG, Blom HJ. Genetic variation in genes of folate metabolism and neural-tube defect risk. Proc Nutr Soc. May 2006;65(2):204-215.
147. Boyles AL, Billups AV, Deak KL, et al. Neural tube defects and folate pathway genes: family-based association tests of gene-gene and gene-environment interactions. Environ Health Perspect. Oct 2006;114(10):1547-1552.
148. Kim YI, Pogribny IP, Basnakian AG, et al. Folate deficiency in rats induces DNA strand breaks and hypomethylation within the p53 tumor suppressor gene. Am J Clin Nutr. Jan 1997;65(1):46-52.
149. Robien K, Ulrich CM. 5,10-Methylenetetrahydrofolate reductase polymorphisms and leukemia risk: a HuGE minireview. Am J Epidemiol. Apr 1 2003;157(7):571-582.
150. Pico AR, Kelder T, van Iersel MP, Hanspers K, Conklin BR, Evelo C. WikiPathways: pathway editing for the people. PLoS Biol. Jul 22 2008;6(7):e184.
151. Pombo-de-Oliveira MS, Koifman S. Infant acute leukemia and maternal exposures during pregnancy. Cancer Epidemiol Biomarkers Prev. Dec 2006;15(12):2336-2341.
152. Mason JB, Dickstein A, Jacques PF, et al. A temporal association between folic acid fortification and an increase in colorectal cancer rates may be illuminating important biological principles: a hypothesis. Cancer Epidemiol Biomarkers Prev. Jul 2007;16(7):1325-1329.
153. Cole BF, Baron JA, Sandler RS, et al. Folic acid for the prevention of colorectal adenomas: a randomized clinical trial. Jama. Jun 6 2007;297(21):2351-2359.
177
154. Kwan ML, Metayer C, Crouse V, Buffler PA. Maternal illness and drug/medication use during the period surrounding pregnancy and risk of childhood leukemia among offspring. Am J Epidemiol. Jan 1 2007;165(1):27-35.
155. McKinney PA, Juszczak E, Findlay E, Smith K, Thomson CS. Pre- and perinatal risk factors for childhood leukaemia and other malignancies: a Scottish case control study. Br J Cancer. Aug 1999;80(11):1844-1851.
156. Jensen CD, Block G, Buffler P, Ma X, Selvin S, Month S. Maternal dietary risk factors in childhood acute lymphoblastic leukemia (United States). Cancer Causes Control. Aug 2004;15(6):559-570.
157. Shu XO, Perentesis JP, Wen W, et al. Parental exposure to medications and hydrocarbons and ras mutations in children with acute lymphoblastic leukemia: a report from the Children's Oncology Group. Cancer Epidemiol Biomarkers Prev. Jul 2004;13(7):1230-1235.
158. Wiemels JL, Smith RN, Taylor GM, Eden OB, Alexander FE, Greaves MF. Methylenetetrahydrofolate reductase (MTHFR) polymorphisms and risk of molecularly defined subtypes of childhood acute leukemia. Proc Natl Acad Sci U S A. Mar 27 2001;98(7):4004-4009.
159. Lightfoot TJ, Johnston WT, Painter D, et al. Genetic variation in the folate metabolic pathway and risk of childhood leukemia. Blood. Jan 25 2010.
160. da Costa Ramos FJ, Cartaxo Muniz MT, Silva VC, et al. Association between the MTHFR A1298C polymorphism and increased risk of acute myeloid leukemia in Brazilian children. Leuk Lymphoma. Oct 2006;47(10):2070-2075.
161. Krajinovic M, Lamothe S, Labuda D, et al. Role of MTHFR genetic polymorphisms in the susceptibility to childhood acute lymphoblastic leukemia. Blood. Jan 1 2004;103(1):252-257.
162. Milne E, de Klerk NH, van Bockxmeer F, et al. Is there a folate-related gene-environment interaction in the etiology of childhood acute lymphoblastic leukemia? Int J Cancer. Jul 1 2006;119(1):229-232.
163. Petra BG, Janez J, Vita D. Gene-gene interactions in the folate metabolic pathway influence the risk for acute lymphoblastic leukemia in children. Leuk Lymphoma. Apr 2007;48(4):786-792.
164. de Jonge R, Tissing WJ, Hooijberg JH, et al. Polymorphisms in folate-related genes and risk of pediatric acute lymphoblastic leukemia. Blood. Mar 5 2009;113(10):2284-2289.

178
165. Zintzaras E, Koufakis T, Ziakas PD, Rodopoulou P, Giannouli S, Voulgarelis M. A meta-analysis of genotypes and haplotypes of methylenetetrahydrofolate reductase gene polymorphisms in acute lymphoblastic leukemia. Eur J Epidemiol. 2006;21(7):501-510.
166. Pereira TV, Rudnicki M, Pereira AC, Pombo-de-Oliveira MS, Franco RF. 5,10-Methylenetetrahydrofolate reductase polymorphisms and acute lymphoblastic leukemia risk: a meta-analysis. Cancer Epidemiol Biomarkers Prev. Oct 2006;15(10):1956-1963.
167. Kim NK, Chong SY, Jang MJ, et al. Association of the methylenetetrahydrofolate reductase polymorphism in Korean patients with childhood acute lymphoblastic leukemia. Anticancer Res. Jul-Aug 2006;26(4B):2879-2881.
168. Alcasabas P, Ravindranath Y, Goyette G, et al. 5,10-methylenetetrahydrofolate reductase (MTHFR) polymorphisms and the risk of acute lymphoblastic leukemia (ALL) in Filipino children. Pediatr Blood Cancer. Aug 2008;51(2):178-182.
169. Gast A, Bermejo JL, Flohr T, et al. Folate metabolic gene polymorphisms and childhood acute lymphoblastic leukemia: a case-control study. Leukemia. Feb 2007;21(2):320-325.
170. Duthie SJ. Folic acid deficiency and cancer: mechanisms of DNA instability. Br Med Bull. 1999;55(3):578-592.
171. Kim YI. Folate and carcinogenesis: evidence, mechanisms, and implications. J Nutr Biochem. Feb 1999;10(2):66-88.
172. Blount BC, Mack MM, Wehr CM, et al. Folate deficiency causes uracil misincorporation into human DNA and chromosome breakage: implications for cancer and neuronal damage. Proc Natl Acad Sci U S A. Apr 1 1997;94(7):3290-3295.
173. Lieber MR. The mechanism of human nonhomologous DNA end joining. J Biol Chem. Jan 4 2008;283(1):1-5.
174. Reichel M, Gillert E, Nilson I, et al. Fine structure of translocation breakpoints in leukemic blasts with chromosomal translocation t(4;11): the DNA damage-repair model of translocation. Oncogene. Dec 10 1998;17(23):3035-3044.
175. Gillert E, Leis T, Repp R, et al. A DNA damage repair mechanism is involved in the origin of chromosomal translocations t(4;11) in primary leukemic cells. Oncogene. Aug 19 1999;18(33):4663-4671.
176. Ayton PM, Cleary ML. Molecular mechanisms of leukemogenesis mediated by MLL fusion proteins. Oncogene. Sep 10 2001;20(40):5695-5707.

179
177. Bardini M, Spinelli R, Bungaro S, et al. DNA copy-number abnormalities do not occur in infant ALL with t(4;11)/MLL-AF4. Leukemia. Jan;24(1):169-176.
178. Roman-Gomez J, Jimenez-Velasco A, Agirre X, et al. Promoter hypermethylation and global hypomethylation are independent epigenetic events in lymphoid leukemogenesis with opposing effects on clinical outcome. Leukemia. Aug 2006;20(8):1445-1448.
179. Watt PM, Kumar R, Kees UR. Promoter demethylation accompanies reactivation of the HOX11 proto-oncogene in leukemia. Genes Chromosomes Cancer. Dec 2000;29(4):371-377.
180. Labuda D, Krajinovic M, Sabbagh A, Infante-Rivard C, Sinnett D. Parental genotypes in the risk of a complex disease. Am J Hum Genet. Jul 2002;71(1):193-197.
181. Christensen B, Arbour L, Tran P, et al. Genetic polymorphisms in methylenetetrahydrofolate reductase and methionine synthase, folate levels in red blood cells, and risk of neural tube defects. Am J Med Genet. May 21 1999;84(2):151-157.
182. Waterland RA, Jirtle RL. Transposable elements: targets for early nutritional effects on epigenetic gene regulation. Mol Cell Biol. Aug 2003;23(15):5293-5300.
183. Peters AM, Blair CK, Verneris MR, et al. Maternal hemoglobin concentration during pregnancy and risk of infant leukaemia: a children's oncology group study. Br J Cancer. Nov 6 2006;95(9):1274-1276.
184. Scholl TO. Iron status during pregnancy: setting the stage for mother and infant. Am J Clin Nutr. May 2005;81(5):1218S-1222S.
185. Mainous AG, 3rd, Gill JM, Everett CJ. Transferrin saturation, dietary iron intake, and risk of cancer. Ann Fam Med. Mar-Apr 2005;3(2):131-137.
186. Huang X. Iron overload and its association with cancer risk in humans: evidence for iron as a carcinogenic metal. Mutat Res. Dec 10 2003;533(1-2):153-171.
187. Dorak MT, Burnett AK, Worwood M, Sproul AM, Gibson BE. The C282Y mutation of HFE is another male-specific risk factor for childhood acute lymphoblastic leukemia. Blood. Dec 1 1999;94(11):3957.
188. Dorak MT, Mackay RK, Relton CL, Worwood M, Parker L, Hall AG. Hereditary hemochromatosis gene (HFE) variants are associated with birth weight and childhood leukemia risk. Pediatr Blood Cancer. Dec 15 2009;53(7):1242-1248.

180
189. Rothman KJ, Greenland S. Modern epidemiology. 2nd ed. Philadelphia: Lippincott-Raven; 1998.
190. Hernan MA. Counfounding. In: Everitt B, Melnick, E., ed. Encyclopedia of Quantitative Risk Assessment. New York: John Wiley & Sons; 2008 (in press).
191. Surveillance, Epidemiology, and End Results (SEER) Program (www.seer.cancer.gov) Limited-Use Data (1973-2004): National Cancer Institute, DCCPS, Surveillance Research Program, Cancer Statistics Branch; released April 2007, based on the November 2006 submission.
192. Langley-Evans SC, Langley-Evans AJ. Use of folic acid supplements in the first trimester of pregnancy. J R Soc Health. Sep 2002;122(3):181-186.
193. Reynolds P, Von Behren J, Elkin EP. Birth characteristics and leukemia in young children. Am J Epidemiol. Apr 1 2002;155(7):603-613.
194. Ross JA, Potter JD, Shu XO, Reaman GH, Lampkin B, Robison LL. Evaluating the relationships among maternal reproductive history, birth characteristics, and infant leukemia: a report from the Children's Cancer Group. Ann Epidemiol. Apr 1997;7(3):172-179.
195. Cnattingius S, Zack MM, Ekbom A, et al. Prenatal and neonatal risk factors for childhood lymphatic leukemia. J Natl Cancer Inst. Jun 21 1995;87(12):908-914.
196. Stark CR, Mantel N. Maternal-age and birth-order effects in childhood leukemia: age of child and type of leukemia. J Natl Cancer Inst. May 1969;42(5):857-866.
197. Subar AF, Block G. Use of vitamin and mineral supplements: demographics and amounts of nutrients consumed. The 1987 Health Interview Survey. Am J Epidemiol. Dec 1990;132(6):1091-1101.
198. Radimer K, Bindewald B, Hughes J, Ervin B, Swanson C, Picciano MF. Dietary supplement use by US adults: data from the National Health and Nutrition Examination Survey, 1999-2000. Am J Epidemiol. Aug 15 2004;160(4):339-349.
199. Recommendations to prevent and control iron deficiency in the United States. Centers for Disease Control and Prevention. MMWR Recomm Rep. Apr 3 1998;47(RR-3):1-29.
200. Spector LG, Xie Y, Robison LL, et al. Maternal diet and infant leukemia: the DNA topoisomerase II inhibitor hypothesis: a report from the children's oncology group. Cancer Epidemiol Biomarkers Prev. Mar 2005;14(3):651-655.
201. Puumala SE, Spector LG, Robison LL, et al. Comparability and representativeness of control groups in a case-control study of infant leukemia: a
181
report from the Children's Oncology Group. Am J Epidemiol. Aug 1 2009;170(3):379-387.
202. Fritz AG, World Health Organization. International classification of diseases for oncology : ICD-O. 3rd ed. Geneva: World Health Organization; 2000.
203. Waksberg J. Sampling methods for random digit dialing. J Am Stat Assoc. 1978;73:40-46.
204. Ross JA, Spector LG, Olshan AF, Bunin GR. Invited commentary: Birth certificates--a best control scenario? Am J Epidemiol. May 15 2004;159(10):922-924; discussion 925.
205. Burton A, Wilson S, Gillies AJ. Folic acid: Is self reported use of supplements accurate? J Epidemiol Community Health. Nov 2001;55(11):841-842.
206. Mackenzie SG, Lippman A. An investigation of report bias in a case-control study of pregnancy outcome. Am J Epidemiol. Jan 1989;129(1):65-75.
207. Drews CD, Kraus JF, Greenland S. Recall bias in a case-control study of sudden infant death syndrome. Int J Epidemiol. Jun 1990;19(2):405-411.
208. Greaves MF, Colman SM, Beard ME, et al. Geographical distribution of acute lymphoblastic leukaemia subtypes: second report of the collaborative group study. Leukemia. Jan 1993;7(1):27-34.
209. Schmiegelow K, Vestergaard T, Nielsen SM, Hjalgrim H. Etiology of common childhood acute lymphoblastic leukemia: the adrenal hypothesis. Leukemia. Dec 2008;22(12):2137-2141.
210. Kinlen L. Evidence for an infective cause of childhood leukaemia: comparison of a Scottish new town with nuclear reprocessing sites in Britain. Lancet. Dec 10 1988;2(8624):1323-1327.
211. Kinlen LJ. Epidemiological evidence for an infective basis in childhood leukaemia. Br J Cancer. Jan 1995;71(1):1-5.
212. Turner MC, Chen Y, Krewski D, Ghadirian P. An overview of the association between allergy and cancer. Int J Cancer. Jun 15 2006;118(12):3124-3132.
213. Wang H, Diepgen TL. Is atopy a protective or a risk factor for cancer? A review of epidemiological studies. Allergy. Sep 2005;60(9):1098-1111.
214. O'Connell EJ. The burden of atopy and asthma in children. Allergy. Aug 2004;59 Suppl 78:7-11.

182
215. Mannino DM, Homa DM, Akinbami LJ, Moorman JE, Gwynn C, Redd SC. Surveillance for asthma--United States, 1980-1999. MMWR Surveill Summ. Mar 29 2002;51(1):1-13.
216. von Mutius E, Schwartz J, Neas LM, Dockery D, Weiss ST. Relation of body mass index to asthma and atopy in children: the National Health and Nutrition Examination Study III. Thorax. Nov 2001;56(11):835-838.
217. Dykewicz MS, Fineman S. Executive Summary of Joint Task Force Practice Parameters on Diagnosis and Management of Rhinitis. Ann Allergy Asthma Immunol. Nov 1998;81(5 Pt 2):463-468.
218. Asher MI, Montefort S, Bjorksten B, et al. Worldwide time trends in the prevalence of symptoms of asthma, allergic rhinoconjunctivitis, and eczema in childhood: ISAAC Phases One and Three repeat multicountry cross-sectional surveys. Lancet. Aug 26 2006;368(9537):733-743.
219. Wills-Karp M, Santeliz J, Karp CL. The germless theory of allergic disease: revisiting the hygiene hypothesis. Nat Rev Immunol. Oct 2001;1(1):69-75.
220. Pepys J. "Atopy": a study in definition. Allergy. Jul 1994;49(6):397-399.
221. Lilja G, Wickman M. Allergy--atopy--hypersensitivity--a matter of definition. Allergy. Nov 1998;53(11):1011-1012.
222. Wuthrich B. What is atopy? Condition, disease or a syndrome? Curr Probl Dermatol. 1999;28:1-8.
223. Bottema RW, Reijmerink NE, Koppelman GH, Kerkhof M, Postma DS. Phenotype definition, age, and gender in the genetics of asthma and atopy. Immunol Allergy Clin North Am. Nov 2005;25(4):621-639.
224. Kay AB. Allergy and allergic diseases. First of two parts. N Engl J Med. Jan 4 2001;344(1):30-37.
225. Robinson DS. Th-2 cytokines in allergic disease. Br Med Bull. 2000;56(4):956-968.
226. Kumar V, Cotran RS, Robbins SL. Robbins basic pathology. 7th ed. Philadelphia: Saunders; 2003.
227. Beeh KM, Ksoll M, Buhl R. Elevation of total serum immunoglobulin E is associated with asthma in nonallergic individuals. Eur Respir J. Oct 2000;16(4):609-614.

183
228. Johnson CC, Peterson EL, Ownby DR. Gender differences in total and allergen-specific immunoglobulin E (IgE) concentrations in a population-based cohort from birth to age four years. Am J Epidemiol. Jun 15 1998;147(12):1145-1152.
229. Cline MG, Burrows B. Distribution of allergy in a population sample residing in Tucson, Arizona. Thorax. May 1989;44(5):425-431.
230. Wittig HJ, Belloit J, De Fillippi I, Royal G. Age-related serum immunoglobulin E levels in healthy subjects and in patients with allergic disease. J Allergy Clin Immunol. Oct 1980;66(4):305-313.
231. Longe JL, Gale Group. The Gale encyclopedia of medicine. 3rd ed. Detroit: Thomson Gale; 2006.
232. Markiewicz MA, Gajewski TF. The immune system as anti-tumor sentinel: molecular requirements for an anti-tumor immune response. Crit Rev Oncog. 1999;10(3):247-260.
233. Eriksson NE, Mikoczy Z, Hagmar L. Cancer incidence in 13811 patients skin tested for allergy. J Investig Allergol Clin Immunol. 2005;15(3):161-166.
234. Penn I. Depressed immunity and the development of cancer. Cancer Detect Prev. 1994;18(4):241-252.
235. Jui S, Zhang YH. On the relationship between type I hypersensitivity and cancer: a review. Asian Pac J Allergy Immunol. Jun 1990;8(1):61-64.
236. Kinlen LJ. Malignancy in autoimmune diseases. J Autoimmun. Apr 1992;5 Suppl A:363-371.
237. Robinson DS. The Th1 and Th2 concept in atopic allergic disease. Chem Immunol. 2000;78:50-61.
238. Prescott SL, Macaubas C, Smallacombe T, et al. Reciprocal age-related patterns of allergen-specific T-cell immunity in normal vs. atopic infants. Clin Exp Allergy. Nov 1998;28 Suppl 5:39-44.
239. Chang JS, Wiemels JL, Buffler PA. Allergies and childhood leukemia. Blood Cells Mol Dis. Mar-Apr 2009;42(2):99-104.
240. Novak N, Bieber T. Allergic and nonallergic forms of atopic diseases. J Allergy Clin Immunol. Aug 2003;112(2):252-262.
241. Williams H, Flohr C. How epidemiology has challenged 3 prevailing concepts about atopic dermatitis. J Allergy Clin Immunol. Jul 2006;118(1):209-213.

184
242. Strachan DP. Hay fever, hygiene, and household size. Bmj. Nov 18 1989;299(6710):1259-1260.
243. Smith MA, Simon R, Strickler HD, McQuillan G, Ries LA, Linet MS. Evidence that childhood acute lymphoblastic leukemia is associated with an infectious agent linked to hygiene conditions. Cancer Causes Control. May 1998;9(3):285-298.
244. Parkin DM, International Agency for Research on Cancer., International Association of Cancer Registries. International incidence of childhood cancer. Oxford: International Agency for Research on Cancer ; Oxford University Press (distributor); 1998.
245. Little J, International Agency for Research on Cancer. Epidemiology of childhood
cancer. Lyon, France: International Agency for Research on Cancer; Distributed by Oxford University Press; 1999.
246. MacKenzie J, Greaves MF, Eden TO, et al. The putative role of transforming viruses in childhood acute lymphoblastic leukemia. Haematologica. Feb 2006;91(2):240-243.
247. Vasconcelos GM, Kang M, Pombo-de-Oliveira MS, et al. Adenovirus detection in Guthrie cards from paediatric leukaemia cases and controls. Br J Cancer. Nov 18 2008;99(10):1668-1672.
248. Söderberg KC, Jonsson F, Winqvist O, Hagmar L, Feychting M. Autoimmune diseases, asthma and risk of haematological malignancies: a nationwide case-control study in Sweden. Eur J Cancer. Nov 2006;42(17):3028-3033.
249. Jourdan-Da Silva N, Perel Y, Mechinaud F, et al. Infectious diseases in the first year of life, perinatal characteristics and childhood acute leukaemia. Br J Cancer. Jan 12 2004;90(1):139-145.
250. Bross ID, Natarajan N. Leukemia from low-level radiation: identification of susceptible children. N Engl J Med. Jul 20 1972;287(3):107-110.
251. Fraumeni JF, Jr., Manning MD, Stark CR. Diseases of Hypersensitivity and Childhood Leukemia. Jama. May 4 1964;188:459.
252. Buckley JD, Buckley CM, Ruccione K, et al. Epidemiological characteristics of childhood acute lymphocytic leukemia. Analysis by immunophenotype. The Childrens Cancer Group. Leukemia. May 1994;8(5):856-864.
253. Centers for Disease Control and Prevention. National Center for Health Statistics. Health Data Interactive. Asthma and chronic obstructive pulmonary disease: US,

185
1997-2008 (Source: NHIS). Available at: www.cdc.gov/nchs.hdi.htm. [February 9, 2009].
254. Centers for Disease Control and Prevention. National Center for Health Statistics. Health Data Interactive. Allergic conditions, ages 0-17: US, 1997-2008 (Source: NHIS). Available at: www.cdc.gov/nchs.hdi.htm. [February 9, 2009].
255. McGill KA, Sorkness CA, Ferguson-Page C, et al. Asthma in non-inner city Head Start children. Pediatrics. Jul 1998;102(1 Pt 1):77-83.
256. Koppelman GH, Jansen DF, Schouten JP, et al. Sibling effect on atopy in children of patients with asthma. Clin Exp Allergy. Feb 2003;33(2):170-175.
257. Zekveld C, Bibakis I, Bibaki-Liakou V, et al. The effects of farming and birth order on asthma and allergies. Eur Respir J. Jul 2006;28(1):82-88.
258. von Mutius E. The influence of birth order on the expression of atopy in families: a gene-environment interaction? Clin Exp Allergy. Dec 1998;28(12):1454-1456.
259. McKeever TM, Lewis SA, Smith C, et al. Siblings, multiple births, and the incidence of allergic disease: a birth cohort study using the West Midlands general practice research database. Thorax. Oct 2001;56(10):758-762.
260. Gibbs S, Surridge H, Adamson R, Cohen B, Bentham G, Reading R. Atopic dermatitis and the hygiene hypothesis: a case-control study. Int J Epidemiol. Feb 2004;33(1):199-207.
261. Jarvis D, Chinn S, Luczynska C, Burney P. The association of family size with atopy and atopic disease. Clin Exp Allergy. Mar 1997;27(3):240-245.
262. McNally RJ, Eden TO. An infectious aetiology for childhood acute leukaemia: a review of the evidence. Br J Haematol. Nov 2004;127(3):243-263.
263. Paltiel O, Harlap S, Deutsch L, et al. Birth weight and other risk factors for acute leukemia in the Jerusalem Perinatal Study cohort. Cancer Epidemiol Biomarkers Prev. Jun 2004;13(6):1057-1064.
264. Murray L, McCarron P, Bailie K, et al. Association of early life factors and acute lymphoblastic leukaemia in childhood: historical cohort study. Br J Cancer. Feb 1 2002;86(3):356-361.
265. Perrillat F, Clavel J, Auclerc MF, et al. Day-care, early common infections and childhood acute leukaemia: a multicentre French case-control study. Br J Cancer. Apr 8 2002;86(7):1064-1069.

186
266. Neglia JP, Linet MS, Shu XO, et al. Patterns of infection and day care utilization and risk of childhood acute lymphoblastic leukaemia. Br J Cancer. Jan 2000;82(1):234-240.
267. Shu XO, Han D, Severson RK, et al. Birth characteristics, maternal reproductive history, hormone use during pregnancy, and risk of childhood acute lymphocytic leukemia by immunophenotype (United States). Cancer Causes Control. Feb 2002;13(1):15-25.
268. Bener A, Denic S, Galadari S. Longer breast-feeding and protection against childhood leukaemia and lymphomas. Eur J Cancer. Jan 2001;37(2):234-238.
269. Dockerty JD, Draper G, Vincent T, Rowan SD, Bunch KJ. Case-control study of parental age, parity and socioeconomic level in relation to childhood cancers. Int J Epidemiol. Dec 2001;30(6):1428-1437.
270. Infante-Rivard C, Fortier I, Olson E. Markers of infection, breast-feeding and childhood acute lymphoblastic leukaemia. Br J Cancer. Dec 2000;83(11):1559-1564.
271. Ma X, Metayer C, Does MB, Buffler PA. Maternal pregnancy loss, birth characteristics, and childhood leukemia (United States). Cancer Causes Control. Nov 2005;16(9):1075-1083.
272. Altieri A, Castro F, Bermejo JL, Hemminki K. Number of siblings and the risk of lymphoma, leukemia, and myeloma by histopathology. Cancer Epidemiol Biomarkers Prev. Jul 2006;15(7):1281-1286.
273. McNally RJ, Alston RD, Cairns DP, Eden OB, Birch JM. Geographical and ecological analyses of childhood acute leukaemias and lymphomas in north-west England. Br J Haematol. Oct 2003;123(1):60-65.
274. Hjalmars U, Gustafsson G. Higher risk for acute childhood lymphoblastic leukaemia in Swedish population centres 1973-94. Swedish Child Leukaemia Group. Br J Cancer. Jan 1999;79(1):30-33.
275. Gilman EA, Knox EG. Geographical distribution of birth places of children with cancer in the UK. Br J Cancer. Mar 1998;77(5):842-849.
276. Li CY, Lin RS, Lin CH. Urbanization and childhood leukaemia in Taiwan. Int J Epidemiol. Aug 1998;27(4):587-591.
277. Muirhead CR. Childhood leukemia in metropolitan regions in the United States: a possible relation to population density? Cancer Causes Control. Sep 1995;6(5):383-388.

187
278. Alexander FE, Boyle P, Carli PM, et al. Population density and childhood leukaemia: results of the EUROCLUS Study. Eur J Cancer. Mar 1999;35(3):439-444.
279. Saarinen UM, Kajosaari M. Breastfeeding as prophylaxis against atopic disease: prospective follow-up study until 17 years old. Lancet. Oct 21 1995;346(8982):1065-1069.
280. Gdalevich M, Mimouni D, Mimouni M. Breast-feeding and the risk of bronchial asthma in childhood: a systematic review with meta-analysis of prospective studies. J Pediatr. Aug 2001;139(2):261-266.
281. Schoetzau A, Filipiak-Pittroff B, Franke K, et al. Effect of exclusive breast-feeding and early solid food avoidance on the incidence of atopic dermatitis in high-risk infants at 1 year of age. Pediatr Allergy Immunol. Aug 2002;13(4):234-242.
282. Kwan ML, Buffler PA, Abrams B, Kiley VA. Breastfeeding and the risk of childhood leukemia: a meta-analysis. Public Health Rep. Nov-Dec 2004;119(6):521-535.
283. Martin RM, Gunnell D, Owen CG, Smith GD. Breast-feeding and childhood cancer: A systematic review with metaanalysis. Int J Cancer. Dec 20 2005;117(6):1020-1031.
284. Blettner M, Sauerbrei W, Schlehofer B, Scheuchenpflug T, Friedenreich C. Traditional reviews, meta-analyses and pooled analyses in epidemiology. Int J Epidemiol. Feb 1999;28(1):1-9.
285. Stroup DF, Berlin JA, Morton SC, et al. Meta-analysis of observational studies in epidemiology: a proposal for reporting. Meta-analysis Of Observational Studies in Epidemiology (MOOSE) group. Jama. Apr 19 2000;283(15):2008-2012.
286. Egger M, Smith GD, Altman DG. Systematic reviews in health care : meta-analysis in context. 2nd ed. London: BMJ; 2001.
287. Centers for Disease Control and Prevention. National Center for Health Statistics. Health Data Interactive. Allergic conditions, ages 0-17: US, 1999-2007 (Source: NHIS). Available at: www.cdc.gov/nchs.hdi.htm. [July 9, 2009].
288. Centers for Disease Control and Prevention. National Center for Health Statistics. Health Data Interactive. Asthma and chronic obstructive pulmonary disease: US, 1999-2007 (Source: NHIS). Available at: www.cdc.gov/nchs.hdi.htm. [July 9, 2009].

188
289. McManus RJ, Wilson S, Delaney BC, et al. Review of the usefulness of contacting other experts when conducting a literature search for systematic reviews. Bmj. Dec 5 1998;317(7172):1562-1563.
290. Zheng W, Linet MS, Shu XO, Pan RP, Gao YT, Fraumeni JF, Jr. Prior medical conditions and the risk of adult leukemia in Shanghai, People's Republic of China. Cancer Causes Control. Jul 1993;4(4):361-368.
291. Stata Corporation. Stata statistical software, release 10.1. College Station, TX: Stata Corporation LP; 2007.
292. DerSimonian R, Laird N. Meta-analysis in clinical trials. Control Clin Trials. Sep 1986;7(3):177-188.
293. Higgins JP, Thompson SG. Quantifying heterogeneity in a meta-analysis. Stat Med. Jun 15 2002;21(11):1539-1558.
294. Manning MD, Carroll BE. Some epidemiological aspects of leukemia in children. J Natl Cancer Inst. Dec 1957;19(6):1087-1094.
295. Stewart A, Webb J, Hewitt D. A survey of childhood malignancies. Br Med J. Jun 28 1958;1(5086):1495-1508.
296. Ager EA, Schuman LM, Wallace HM, Rosenfield AB, Gullen WH. An Epidemiological Study of Childhood Leukemia. J Chronic Dis. Feb 1965;18:113-132.
297. Smith PG, Pike MC, Hamilton LD. Multiple factors in leukaemogenesis. Br Med J. May 26 1973;2(5864):482-483.
298. Natarajan N, Bross ID. Preconception radiation and leukemia. J Med. 1973;4(5):276-281.
299. Viadana E, Bross ID. Use of the medical history to predict the future occurrence of leukemias in adults. Prev Med. Mar 1974;3(1):165-170.
300. Bross ID, Natarajan N. Risk of leukemia in susceptible children exposed to preconception, in utero and postnatal radiation. Prev Med. Sep 1974;3(3):361-369.
301. Gibson R, Graham S, Lilienfeld A, Schuman L, Levin M, Swanson M. Epidemiology of diseases in adult males with leukemia. J Natl Cancer Inst. May 1976;56(5):891-898.

189
302. Magnani C, Pastore G, Luzzatto L, Terracini B. Parental occupation and other environmental factors in the etiology of leukemias and non-Hodgkin's lymphomas in childhood: a case-control study. Tumori. Oct 31 1990;76(5):413-419.
303. Kaatsch P, Kaletsch U, Meinert R, et al. German case control study on childhood leukaemia--basic considerations, methodology and summary of the results. Klin Padiatr. Jul-Aug 1998;210(4):185-191.
304. Schüz J, Kaletsch U, Meinert R, Kaatsch P, Michaelis J. Association of childhood leukaemia with factors related to the immune system. Br J Cancer. May 1999;80(3-4):585-590.
305. Heath JA. Leukaemia presenting as respiratory distress in a child with asthma. J Paediatr Child Health. Aug 2001;37(4):397-399.
306. Breda L, Di Marzio D, Rollo V, De Sanctis S, La Barba G, Chiarelli F. Acute myeloid leukaemia presenting as recurrent generalized urticaria in infancy. Eur J Pediatr. Jun 2008;167(6):697-698.
307. Chien AJ, Argenyi ZB, Colven RM, Kirby P. Acute lymphoblastic leukemia presenting with urticarial plaques and hypereosinophilia in a child. J Am Acad Dermatol. Nov 2004;51(5 Suppl):S151-155.
308. Greenland S. Applications of Stratified Analysis Methods. In: Rothman KJ, Greenland S, Lash TL, eds. Modern Epidemiology. 3rd ed. 3rd ed. Philadelphia, PA: Wolters Kluwer Health/Lippincott Williams & Wilkins; 2008:283-302.
309. Seidman DS, Slater PE. Accuracy of the medical interview. Br J Obstet Gynaecol. Aug 1987;94(8):721-723.
310. Infante-Rivard C, Jacques L. Empirical study of parental recall bias. Am J Epidemiol. Sep 1 2000;152(5):480-486.
311. Pless CE, Pless IB. How well they remember. The accuracy of parent reports. Arch Pediatr Adolesc Med. May 1995;149(5):553-558.
312. Egger M, Davey Smith G, Schneider M, Minder C. Bias in meta-analysis detected by a simple, graphical test. Bmj. Sep 13 1997;315(7109):629-634.
313. Duval SJ, Tweedie RL. A non-parametric 'Trim and Fill' method of accounting for publication bias in meta-analysis. JASA. 2000;95(449):89-98.
314. Bloom B, Cohen RA, Freeman G. Summary health statistics for U.S. children: National Health Interview Survey, 2007. Vital Health Stat 10. Jan 2009(239):1-80.

190
315. Greenland S, Lash TL. Bias analysis. In: Rothman KJ, Greenland S, Lash TL, eds. Modern Epidemiology. 3rd ed. 3rd ed. Philadelphia, PA: Wolters Kluwer Health/Lippincott Williams & Wilkins; 2008:345-380.

191
Appendix A. Children’s Oncology Group Institutions participating in AADM01P1 Pilot
study
†‡Albany Medical Center (NY)
Cancer Research Center of Hawaii (HI) †Children’s Hospitals and Clinics of Minnesota (MN)
Children’s Medical Center Dayton (OH)
Connecticut Children’s Medical Center (CT)
Dartmouth-Hitchcock Medical Center (NH) †Driscoll Children’s Hospital (TX)
East Tennessee Children’s Hospital (TN) †Hackensack University Medical Center (NJ)
Lutheran General Children’s Medical Center (IL)
*McGill University Health Center - Montreal Children’s Hospital (QC) †Michigan State University (MI) †Miller Children’s Hospital/Harbor-UCLA (CA) †Mission Hospitals (NC) †New York University Medical Center (NY)
Primary Children’s Medical Center (UT)
St. Christopher’s Hospital for Children (PA)
*Stollery Children’s Hospital (formerly Cross Cancer Institute) (AB)
The Children’s Hospital of Southwest Florida, Lee Memorial Health System (FL) ‡Tod Childrens Hospital - Forum Health (OH)
University of Florida (FL) †University of Texas Health Science Center at San Antonio (TX)
University of Vermont College of Medicine (VT)
* Canadian institution; not eligible for FROGS Study † Institution located in state that stores NBS ≥5 years and state indicated it would release NBS for research ‡ Institution did not provide information for FROGS Study

192
Appendix B. NCCLS procedure for the collection of NBS The National Committee on Clinical Laboratory Standards (NCCLS, now the Clinical and Laboratory Standards Institute, CLSI) standard procedure for the collection of NBS specifies that individuals responsible for the blood spot collection should:51
• Check the date printed on the card to ensure it has not expired. • Fill out the form completely using a ballpoint pen, taking care not to touch the
blood collection area at any time. • Wash hands and wear powder-free gloves. • Warm the child’s heel and/or position the child’s leg lower than heart level to
ensure adequate blood flow. • Disinfect the heel by wiping with 70% isopropanol/30% water solution • Puncture the plantar surface of the heel (either the most medial or most lateral
area) using a disposable, sterile lancet with a depth of 2.0 mm or less. • Wipe away the first drop of blood using sterile gauze or a cotton ball (as it
might contain tissue fluids, which would dilute the sample). • Allow a large second drop to form and then gently apply the blood to the filter
paper such that it completely fills a pre-printed circle via capillary action, taking care not to press the filter paper directly against the skin.
• Repeat for the remaining spots, filling from only one side of the paper. Spots should be examined to ensure the blood was uniformly and completely applied to the circles.
• Elevate the foot above the body to halt the bleeding. • Lay the cards flat and allow them to dry on a non-absorbent surface at ambient
temperatures (15-22 °C) out of direct sunlight for 3-4 hours. • Send to the testing laboratory within 24 hours of collection, due to the urgent
nature of the testing in reducing morbidity/mortality.

193
Appendix C. Examples of analytes that have been extracted from dried blood spots
Source: Mei, JV. J Nutr. 2001;131:1631S-1636S.50

194
Appendix D. FROGS Study self-administered paper questionnaire for mothers

195
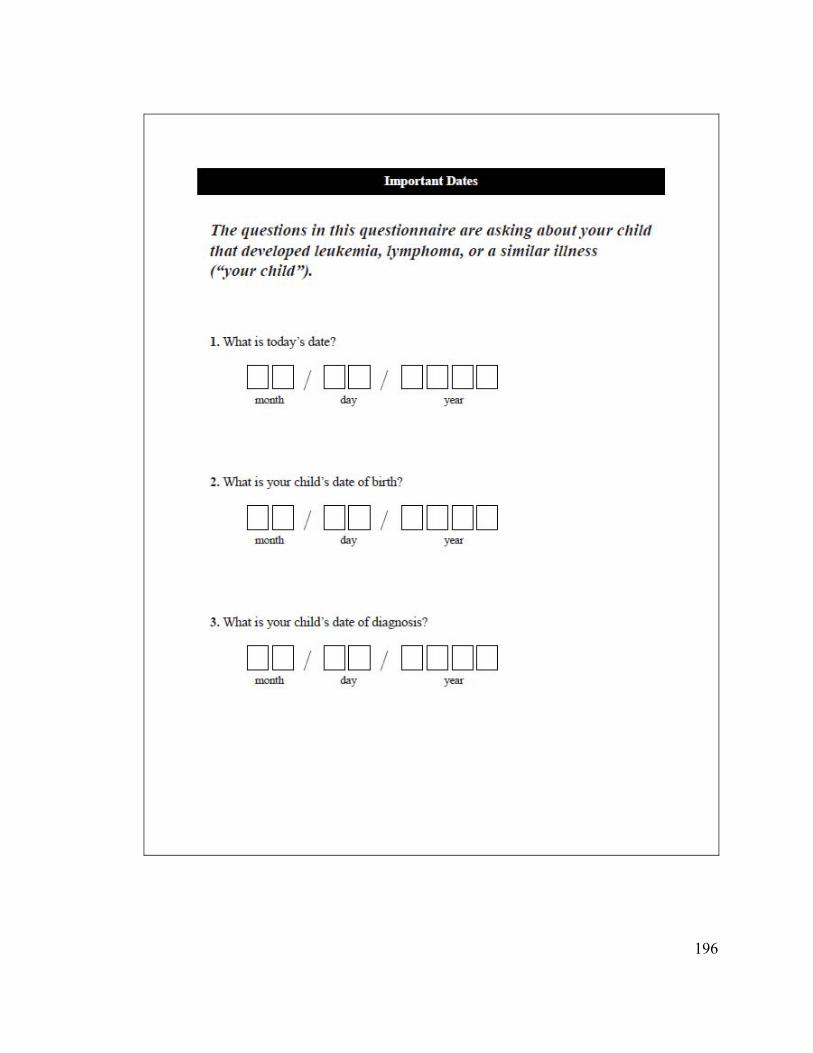
196
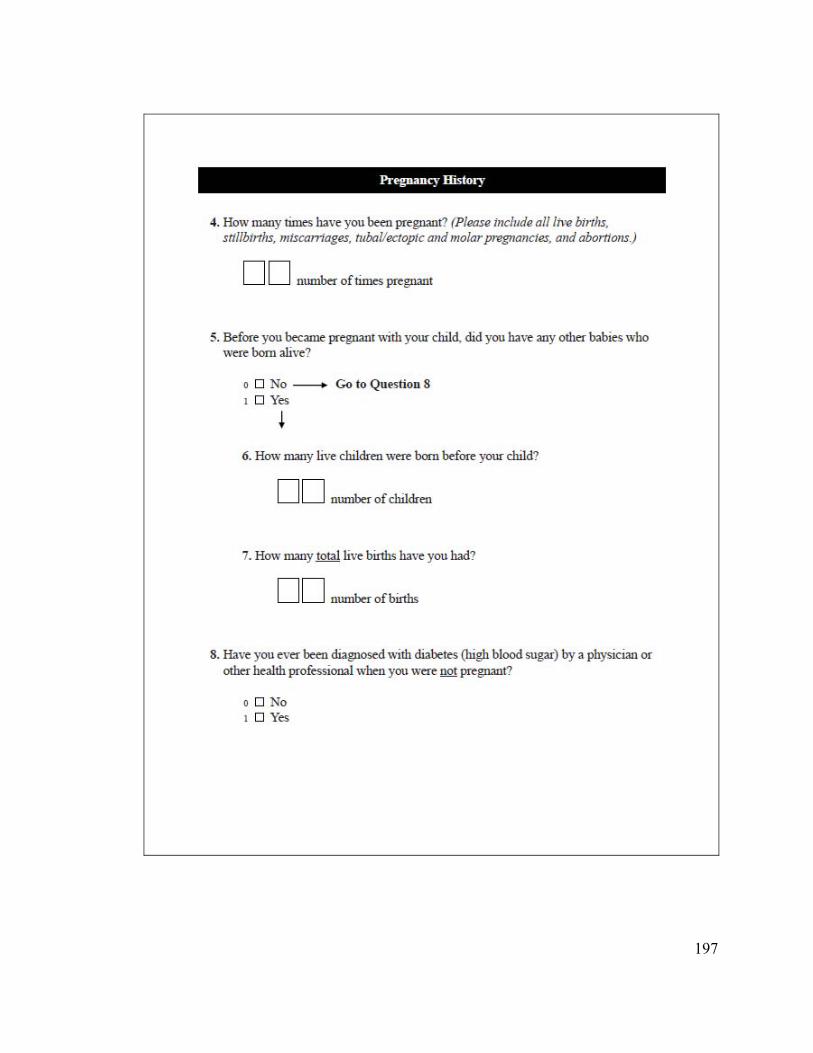
197

198

199

200

201
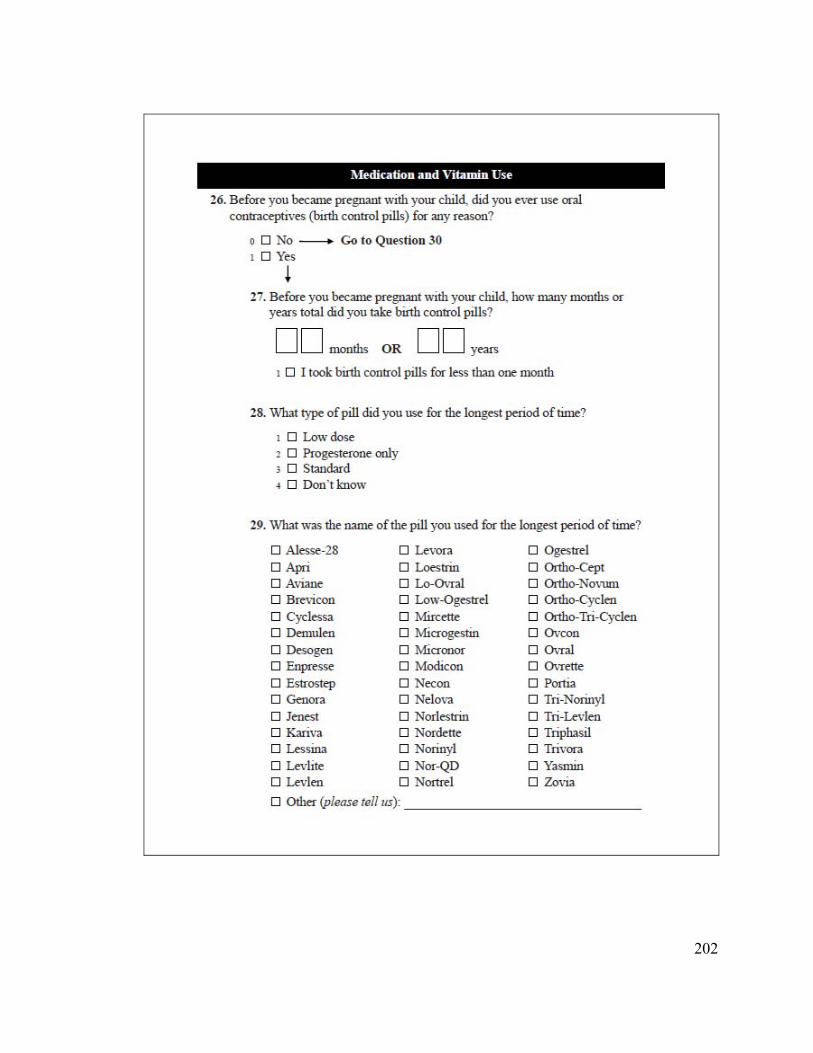
202

203

204

205
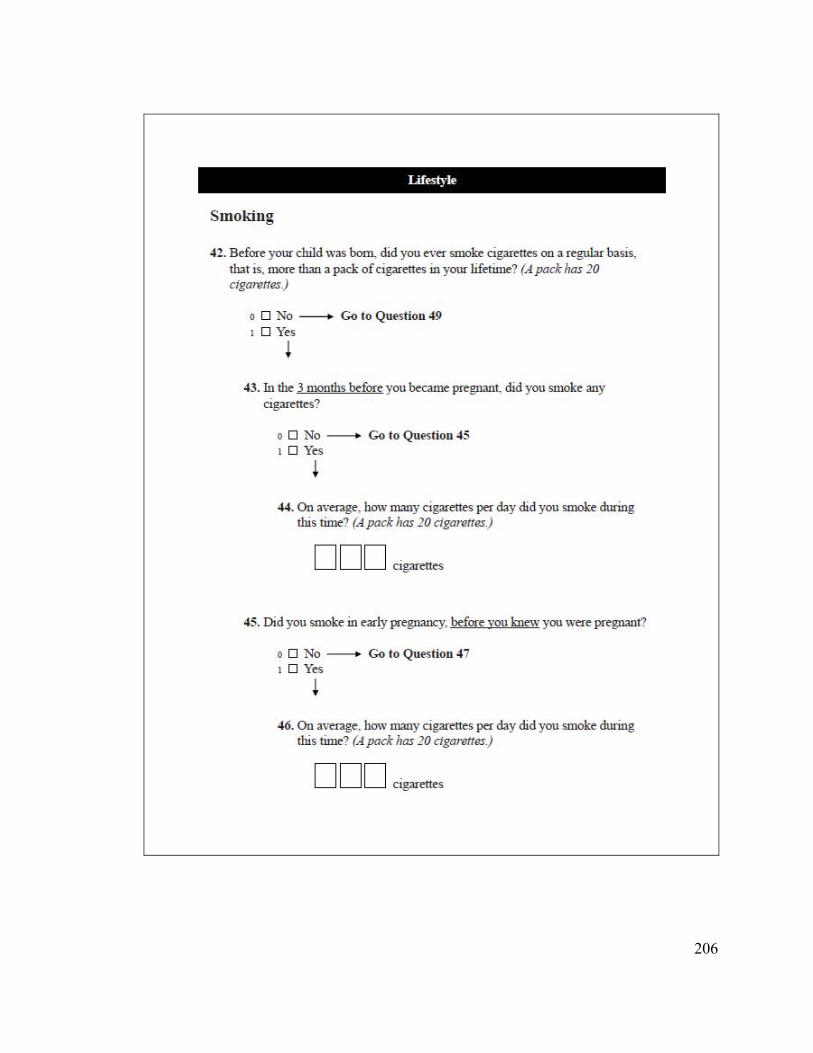
206

207

208

209

210

211

212

213

214

215

216
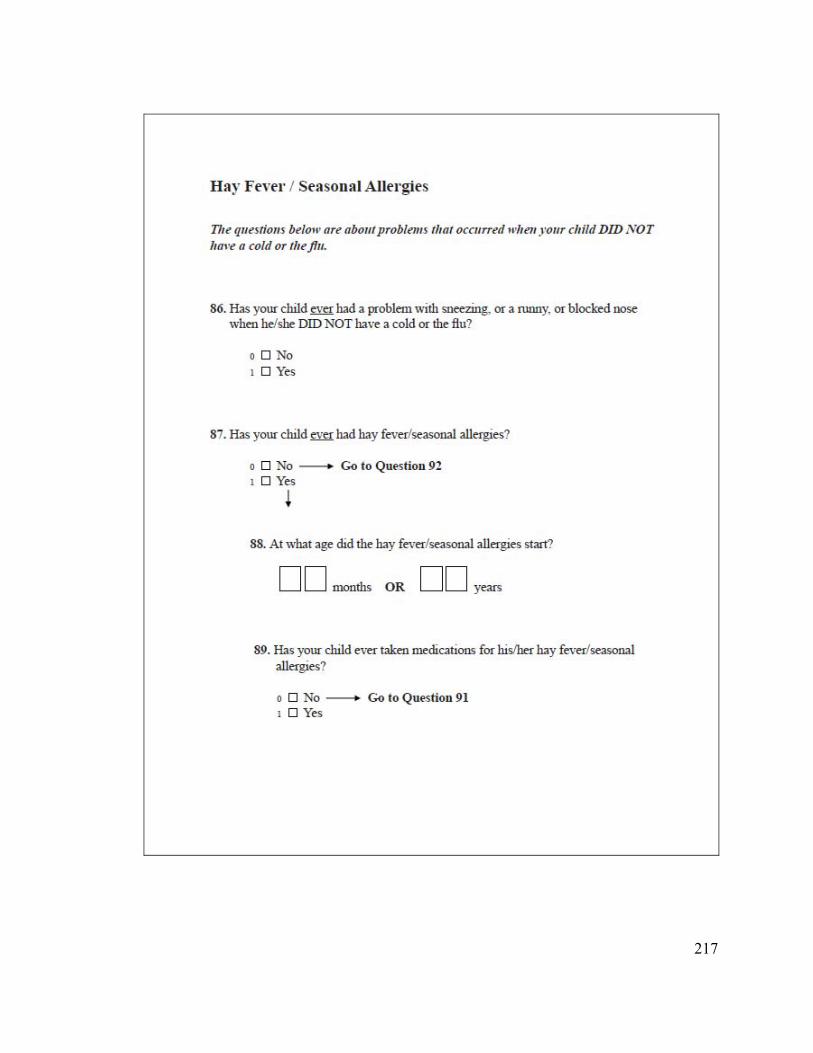
217

218

219

220
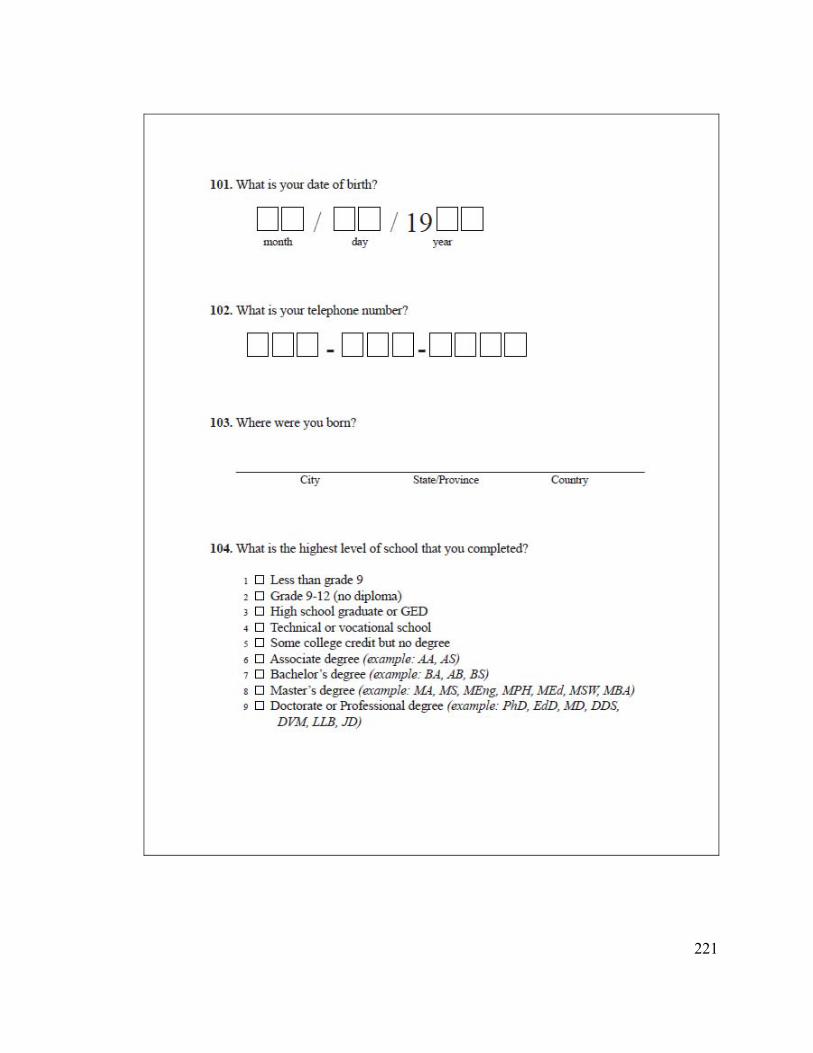
221

222
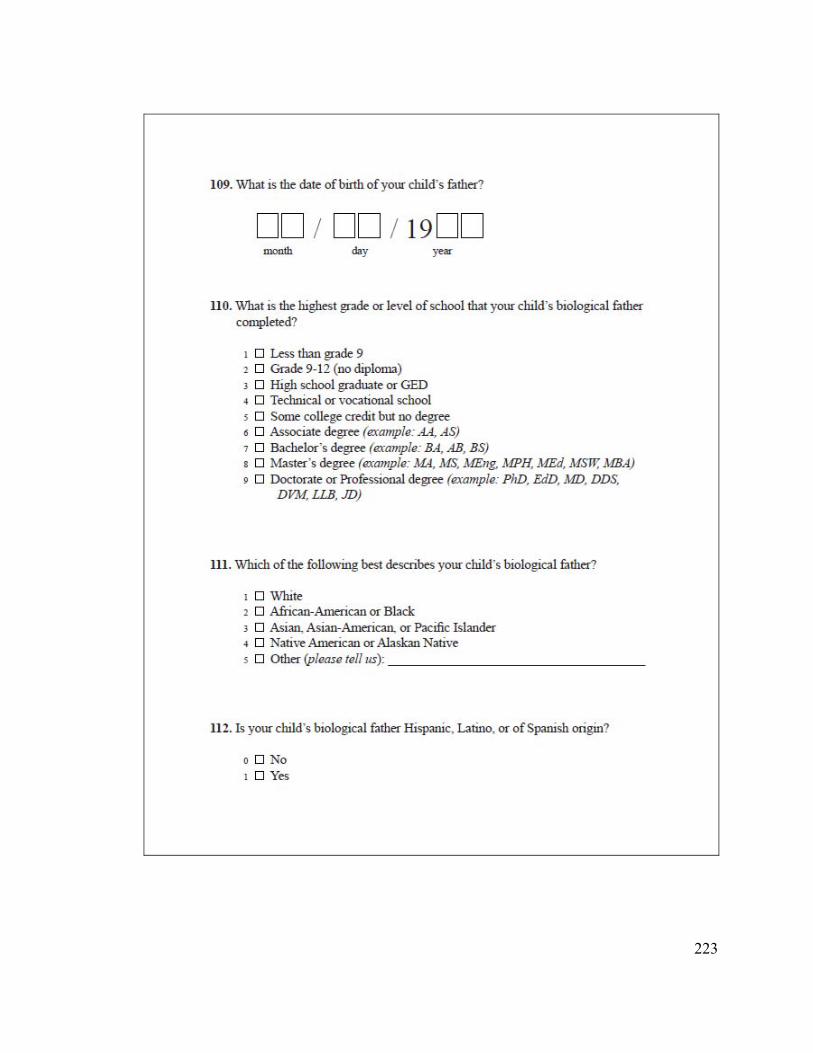
223

224
225

226
Appendix E. FROGS Study forms and ancillary materials
Samples of the FROGS Study ancillary materials have been included herein. Please note that several versions of each of these materials may have been created due to the different groups contacted (i.e., mothers of children <8 years, mothers of children 8-17 years, mothers of children ≥18 years, guardians of children <8 years, guardians of children 8-17 years, guardians of children ≥18 years, children ≥18 at time of consent to COG AADM01P1, children ≥18 years at time of contact). Further, the materials were translated into Spanish as needed to facilitate participation of native Spanish-speakers. Sample materials include:
• Initial contact letter • 1st questionnaire packet cover letter • Instruction sheet • Frequently asked questions • Consent form • Assent form • HIPAA form • Thank you/reminder postcard • 2nd questionnaire packet cover letter • Adult child contact information form (for guardians) • Telephone script for telephone follow-up

227
<Date> <First Name> <Last name> <Street Address> <City>, <State> <Zip> Dear <First Name> <Last name>,
In the next two weeks, you will be sent a packet of materials and will be asked to participate in an important study of children’s health. The study is being conducted by the Department of Pediatrics at the University of Minnesota in partnership with the Children’s Oncology Group. In this study, we will gather information about things that mothers or their children may have come into contact with during pregnancy or afterwards. We wanted to let you know that you will receive these materials because many people like to think about their participation ahead of time. This study is important because little is known about the causes of leukemia, lymphoma, and similar illnesses in children and adolescents. It is only by asking questions about different experiences mothers and their children may have had that we can learn more about how these illnesses develop in young people. Thank you in advance for considering taking part in our study. Sincerely,
Amy M. Linabery and Julie A. Ross Principal Investigators

228
Amy M. Linabery and Julie A. Ross Principal Investigators
<Date> <First Name> <Last name> <Street Address> <City>, <State> <Zip> Dear <First Name> <Last name>, On behalf of the Department of Pediatrics at the University of Minnesota, and in partnership with the Children’s Oncology Group, we invite you to take part in a study of children’s health called the FROGS Study. The purpose of the study is to learn more about factors that may be related to the development of leukemia, lymphoma, and similar illnesses in children and adolescents. You were selected for this study because you participated in the Children’s Oncology Group Childhood Cancer Research Network Pilot Study and agreed to receive information about future studies. We are asking you to participate by completing and returning the questionnaire included in this packet. Questions in the survey booklet will ask for information related to pregnancy history, events surrounding your child’s birth, personal habits such as smoking, medical history, and family health history. Please note that some of the questions are personal in nature. We are also asking you to provide your written permission to obtain dried blood spots collected from your child at birth. These blood spots were created when a few drops of blood were taken at birth, placed on filter paper (also called “Guthrie Cards”), and dried. These blood spots were originally collected to check for some serious diseases (metabolic conditions) in newborns. Some states have stored the dried spots in case they could be used in the future. If you agree, we will ask the state where your child was born for the blood spots. The blood spots are useful because they provide a snapshot of your child’s blood biology at the time of birth. Please see the yellow sheet included in this packet for step-by-step instructions on what to do to take part in the study. We want to stress that we do not know the reasons why most leukemias, lymphomas, and similar illnesses develop in children and adolescents. For that reason, we are studying a lot of different factors that mothers or their children may have encountered during pregnancy or afterwards. A good way to gather this type of information is to ask mothers to tell us. Another good way is to measure different components of the blood. Your participation in this research study is entirely voluntary. All of the information we collect will be kept strictly confidential and your name will not be used in any publication of our findings. If you have questions about the study, please feel free call us, toll-free, at 888-663-2707. If you do not want to be contacted further or if you decide not to participate, you can call us (888-663-2707), or write to us at the address on the letterhead. If you have any questions or concerns regarding this study and would like to talk to someone other than the researchers, you are encouraged to contact the Research Subjects' Advocate Line, D528 Mayo, 420 Delaware St. Southeast, Minneapolis, Minnesota 55455; 612-625-1650. Thank you for your time and effort spent completing the questionnaire and other forms. We are grateful to you and to all mothers of children diagnosed with leukemia, lymphoma, and similar illnesses for providing information and biological materials for important research like this. Sincerely,

229
To participate in this study:
Step 1. Read the pink consent form and decide if you would like to release your
child's dried blood spots. This form describes the blood spots, why they are of interest to researchers, and what will be done with them. If you agree to release the spots, please sign the back page of the consent form. There are three consent questions asked; please be sure to read each of them.
Step 2. Read and sign the green privacy (HIPAA) form. This form describes how we will
keep the blood spots private. HIPAA is the Health Insurance Portability and Accountability Act of 1996, a federal law related to privacy of health information.
Step 3. Ask your child to read the blue assent form or read it to your child and ask
him/her to decide if he/she would like to release the dried blood spots. This form briefly describes the blood spots, why they are of interest to researchers, and what will be done with them. If he/she agrees to release the spots, please ask him/her to sign the bottom of the assent form.
Step 4. Complete the questionnaire. The questionnaire may take up to 30 minutes to
complete. If you do not know the exact answers to some of the questions, please provide your best guess.
Step 5. Mail the materials back to us. Place the signed consent, assent, and privacy
forms, along with the completed questionnaire, in the postage-paid return envelope and drop the envelope in the mail.
Questions? Please call the University of Minnesota study staff, toll-free, at 888-663-2707.
Thank you for your help!
FROGS Feasibility of Retrospectively Obtaining Guthrie Spots
Study Instructions
The following have been included in this study packet: Cover letter
Frequently asked questions and answers (see back of this sheet)
Consent form (2 copies: 1 to keep and 1 to sign and return)
Privacy (HIPAA) form (2 copies: 1 to keep and 1 to sign and return)
Assent form (2 copies: 1 to keep and 1 for your child to sign and return)
Questionnaire booklet
Postage-paid return envelope

230
Frequently asked Questions and Answers Q: Why did I receive a letter about this study? A: You are being contacted because you participated in the Children’s Oncology Group (COG) Childhood Cancer Research Network (CCRN) Pilot Study. In that study, you agreed to receive information about future COG-approved non-therapeutic studies such as this one. Q: What is this study about? A: This is a national study that is being conducted in the United States by researchers at the University of Minnesota Department of Pediatrics in partnership with the Children’s Oncology Group. It is funded by the Children’s Cancer Research Fund. The study concerns factors during pregnancy or childhood that may be related to the development of leukemia, lymphoma, and similar illnesses in children and adolescents. We are contacting 1,000 mothers and children diagnosed with leukemia, lymphoma, and similar illnesses at ages 0-21 years that participated in the COG CCRN Pilot Study. Q: What am I being asked to do? A: We are asking mothers to complete a brief questionnaire. The questions ask about reproductive history, events surrounding your child’s birth, personal habits such as smoking, medical history, and family health history. We are also asking mothers for permission to obtain dried blood spots collected at birth. Q: What are dried blood spots? A: Dried blood spots were created when a few drops of blood were taken at birth, placed on filter paper (also called a “Guthrie Card”), and dried. These blood spots were originally collected to check for some serious diseases (metabolic conditions) in newborns. Some states have stored the dried spots in case they could be used in the future. The blood spots are interesting to researchers because they provide a snapshot of a child’s blood biology at birth. If you and your child agree (by providing your written consent and assent), we will contact the state where your child was born and ask for the blood spots. Q: How much time will it take? A: The questionnaire takes about 20 minutes to complete. Providing consent and assent for the release of dried blood spots takes about 10 minutes or less to complete. Q: Can I receive the study results? A: So little is known about the factors we are studying that the results will not provide useful information to you or your family. This information is for research purposes only and you will not be informed of the results. However, you can receive the overall findings from the study once the study has been completed. To request these results, please call the study staff, toll-free, at 888-663-2707. Q: How can I get more information about this study? A: If you have any questions or concerns about the study, now or later, you are encouraged to contact the study staff toll-free at 888-663-2707. If you have any questions or concerns regarding this study and would like to talk to someone other than the researchers, you are encouraged to contact the Research Subjects' Advocate Line, D528 Mayo, 420 Delaware St. Southeast, Minneapolis, Minnesota 55455; 612-625-1650.

231
CONSENT FORM
Feasibility of Retrospectively Obtaining Guthrie Spots (FROGS) Study Consent Form for Mothers
The Children’s Oncology Group, a cooperative group of hospitals in the United States and elsewhere, along with the Department of Pediatrics at the University of Minnesota, are conducting a study of environmental and biologic factors affecting the health of children and their families. Amy Linabery, M.S., M.P.H., and Julie Ross, Ph.D., from the University of Minnesota Department of Pediatrics are responsible for this study. You were selected as a possible participant in this study because your child was diagnosed with leukemia, lymphoma, or a similar illness and because you participated in the Children’s Oncology Group Childhood Cancer Research Network Pilot Study and agreed to receive information about future non-therapeutic studies. This study is funded by grants from the National Cancer Institute and the University of Minnesota Children’s Cancer Research Fund. We ask that you read this form and ask any questions you may have before agreeing to be in the study. Study Purpose Not a lot is known about the causes of leukemia, lymphoma, and similar illnesses in children and adolescents. The purpose of the study is to learn about factors that may or may not be related to childhood illnesses. We are asking mothers to provide permission to release their child’s dried blood spots. These blood spots were created when a few drops of blood were taken at birth, placed on filter paper (also called “Guthrie Cards”), and dried. These blood spots were originally collected to check for some serious diseases (metabolic conditions) in newborns. Some states have stored the dried spots in case they could be used in the future. If mothers agree, the researchers will ask the states where their children were born for the blood spots. The blood spots are interesting to researchers because they provide a snapshot of a child’s blood biology at birth. We will use the blood spots to see if we can measure different compounds in your child’s blood in the laboratory. For example, we would like to look at the levels of different growth hormones, vitamins, and tobacco smoke markers that may have been present at the time of birth. The researchers want to stress that we do not know the reasons why most leukemias, lymphomas, and similar illnesses develop in children and adolescents. For that reason, we are studying a lot of different factors that mothers or their children may have encountered during pregnancy or afterwards. Study Procedures If you agree to participate in this study, we would ask you to do the following:
o Agree to release your child’s blood spots that were collected at birth and may have been stored by the state where your child was born. If you provide your written permission by signing this form, we will ask the state where your child was born to release one or two blood spots to us.

232
o We may also send you a separate release form and ask you to sign it. This form has been approved by the state where your child was born and allows the state to send the blood spots to the researchers.
So little is known about the factors we are studying that the results will not provide useful information to you or your family. This information is for research purposes only and you will not be informed of the results. However, if you wish, you can be informed of the overall findings from the study once the study has been completed. Your participation in this study will last until your child’s dried blood spots have been obtained from the state of birth, you request to withdraw from the study, or the study has ended. Research that uses your child’s blood spots may be done a long time after they are obtained by the researchers. These samples will be used for research by Amy M. Linabery, M.S., M.P.H. and Julie A. Ross, Ph.D. and their associates for the purposes of learning more about leukemia, lymphoma, and similar illnesses. In some cases, the spots could be sent to other research groups or laboratories for analysis. You would not be notified if this material was sent to another researcher, but any samples we send will be identified only with a number and will not be able to be traced back to you. If we ever want to study the blood spots for a reason other than for things related to this research study, we will get in touch with you and ask for your permission. You will not be identified in any publication or reports of this data. You can request that your sample be destroyed at any time by contacting the researchers at the phone number provided below. There are laws that require that research records that have your name on them be shown to people who make sure the research is being done the way it should be. These are the only people, besides Amy M. Linabery, M.S., M.P.H. and Julie A. Ross, Ph.D. and their associates, who would be able to trace these spots back to you. Risks of Study Participation The risks associated with allowing researchers to obtain dried blood spots from state health departments are few. There is a slight risk that the personal information collected in this study about you or your child could accidentally be released to someone other than study staff. We would keep all personal information in locked file cabinets or in computer databases protected by passwords. Only the study staff would have access to these documents and files. Benefits of Study Participation There are no direct benefits to you for participating. The results of this study may help us to better understand the biologic and environmental causes of childhood leukemias, lymphomas, and similar illnesses. Alternatives to Study Participation The alternative to participating in this study is to decide not to take part.

233
Study Costs/Compensation There is no cost to you for participating in this study. You will not receive any payment for taking part in this study. Confidentiality If you agree to let us keep the blood spots in the storage bank, they will be labeled with a number,not your name. The records of this study will be kept private. In any publications or presentations, we will not include any information that will make it possible to identify you as a subject. Your record for the study may, however, be reviewed by the Children’s Oncology Group and by departments at the University of Minnesota with appropriate regulatory oversight. To these extents, confidentiality is not absolute. Your participation in this study will not be noted in your medical record.
The Children's Oncology Group has received a Certificate of Confidentiality from the federal government, which will help us protect the privacy of our research subjects. The Certificate protects against the involuntary release of information about subjects collected during the course of our covered studies. The researchers involved in the studies cannot be forced to disclose the identity or any information collected in the study in any legal proceedings at the federal, state, or local level, regardless of whether they are criminal, administrative, or legislative proceedings. However, the subject or the researcher may choose to voluntarily disclose the protected information under certain circumstances. For example, if the subject or his/her guardian requests the release of information in writing, the Certificate does not protect against that voluntary disclosure. Furthermore, federal agencies may review our records under limited circumstances, such as a DHHS request for information for an audit or program evaluation or an FDA request under the Food, Drug and Cosmetics Act. The Certificate of Confidentiality will not protect against the required reporting by hospital staff of information on suspected child abuse, reportable communicable diseases, and/or possible threat of harm to self or others.
Protected Health Information (PHI) Your PHI created or received for the purposes of this study is protected under the federal regulation known as HIPAA. Refer to the attached HIPAA authorization for details concerning the use of this information. Voluntary Nature of the Study Participation in this study is voluntary. Your decision whether or not to participate in this study will not affect your current or future relations with the University of Minnesota or any of the Children’s Oncology Group institutions. If you decide to participate, you are free to withdraw at any time without affecting those relationships. Contacts and Questions The researchers conducting this study are Amy M. Linabery, MS, MPH and Julie A. Ross, PhD and their associates at the University of Minnesota Department of Pediatrics. If you have any

234
questions or concerns regarding the study, now or later, you are encouraged to contact them at 612-626-2707 or toll-free at 888-663-2707. If you have any questions or concerns regarding this study and would like to talk to someone other than the researchers, you are encouraged to contact the Research Subjects' Advocate Line, D528 Mayo, 420 Delaware St. Southeast, Minneapolis, Minnesota 55455; 612-625-1650. You will be given a copy of this form to keep for your records. Statement of Consent – Dried blood spot release I have read the above information. I have asked questions and have received answers. I consent to allow these researchers to obtain my child’s dried blood spots from the department of health (or other agency) from the state where my child was born. Signature of Subject______________________________________________Date_________________ Signature of Investigator___________________________________________Date_________________ Statement of Consent – Dried blood spot storage and future use I have read the above information. I have asked questions and have received answers. I consent to allow these researchers to store my child’s dried blood spots indefinitely for future use. Signature of Subject______________________________________________Date_________________ Signature of Investigator___________________________________________Date_________________ Statement of Consent – Future contact regarding this study I have read the above information. I have asked questions and have received answers. I consent to being contacted again in the future regarding this study. Signature of Subject______________________________________________Date_________________ Signature of Investigator___________________________________________Date_________________

235
ASSENT FORM
Feasibility of Retrospectively Obtaining Guthrie Spots (FROGS) Study Assent Form for Children/Adolescents Ages 8-17 years
About the blood spots We want to know if you want to take part in a research study. This study is being done by Amy Linabery and Julie Ross at the University of Minnesota. If you agree, we will ask the state that you were born in to give us one or two blood spots that were collected from you when you were born. All babies give a few drops of blood when they are born so that the blood can be checked. The drops of blood are placed on a special piece of paper and are then dried to make spots. Sometimes the state has extra spots left over. We want to ask if the state where you were born has any of your spots left over. If they do, we would like to do some tests on the blood spots in our laboratory to learn about vitamins and other things that might be in the spot. The research that is done with your blood spots will not be able to help you, but we hope we will learn things that may help us with the care that we can give to other kids with leukemia, lymphoma, and similar illnesses. We will keep the spots for a long time in case there are things in the future that we want to look at that we haven’t thought of yet. If we ever want to study the blood spots for a different reason, we will get in touch with you and ask if that’s okay first. Making your choice You get to choose if you want to let us get your blood spots, do some tests on them, and store them for an unknown amount of time. No one will be mad at you if you don’t want to do it. You can ask any questions you have about letting us get your blood spots. If you have questions, you can have one of your parents call us. Our toll-free phone number is 888-663-2707. If you sign here, it means you have read this paper or had it read to you and you are willing to be in the study. If you don’t want to give us permission to get, use, and store your blood spots, don’t sign this paper. Remember, being in this study is up to you and no one will be mad at you if you don’t sign this or even if you change your mind later. Signature of Subject______________________________________________Date_________________ Signature of Investigator___________________________________________Date_________________

236
HIPAA1 AUTHORIZATION TO USE AND DISCLOSE INDIVIDUAL HEALTH INFORMATION FOR RESEARCH PURPOSES
1. Purpose. As a research participant, I authorize Amy M. Linabery and Julie A. Ross and the researchers’ staff to use and disclose my individual health information for the purpose of conducting the research project entitled, “Feasibility of Retrospectively Obtaining Guthrie Spots (FROGS) Study” [HS # 0803M28241].
2. Individual Health Information to be Used or Disclosed. My individual health information that may be used or disclosed to conduct this research includes: neonatal blood spots collected at birth from , as well as name and date of birth. __________________________________________________________________________________________________________________________
patient’s name 3. Parties Who May Disclose My Individual Health Information. The researcher and the researcher’s staff may obtain my individual health information from:
Hospitals: __________________________________________________________________
Clinics: ____________________________________________________________________
Other Providers: _____________________________________________________________
Health Plan: ________________________________________________________________,
and from hospitals, clinics, health care providers and health plans that provide my health care during the study.
4. Parties Who May Receive or Use My Individual Health Information. The individual health information disclosed by parties listed in item 3 and information disclosed by me during the course of the research may be received and used by Amy M. Linabery and Julie A. Ross and the researchers’ staff. 5. Right to Refuse to Sign this Authorization. I do not have to sign this Authorization. If I decide not to sign the Authorization, I may not be allowed to participate in this study or receive any research related treatment that is provided through the study. However, my decision not to sign this authorization will not affect any other treatment, payment, or enrollment in health plans or eligibility for benefits. 6. Right to Revoke. I can change my mind and withdraw this authorization at any time by sending a written notice to Amy M. Linabery or Julie A. Ross, 420 Delaware Street SE, MMC 422, Minneapolis, MN 55455 to inform the researcher of my decision. If I withdraw this authorization, the researcher may only use and disclose the protected health information already collected for this research study. No further health information about me will be collected by or disclosed to the researcher for this study. 7. Potential for Re-disclosure. Once my health information is disclosed under this authorization, there is a potential that it will be re-disclosed outside this study and no longer covered by this
1 HIPAA is the Health Insurance Portability and Accountability Act of 1996, a federal law related to privacy of health information.

237
authorization. However, the research team and the University’s Institutional Review Board (the committee that reviews studies to be sure that the rights and safety of study participants are protected) are very careful to protect your privacy and limit the disclosure of identifying information about you.
7A. Also, there are other laws that may require my individual health information to be disclosed for public purposes. Examples include potential disclosures if required for mandated reporting of abuse or neglect, judicial proceedings, health oversight activities and public health measures.
This authorization does not have an expiration date. I am the research participant or personal representative authorized to act on behalf of the participant. I have read this information, and I will receive a copy of this authorization form after it is signed. _______________________________ ___________________________________ signature of research participant or research participant’s date personal representative _______________________________ ___________________________________ printed name of research participant or research participant’s description of personal representative’s authority to act on behalf personal representative of the research participant
238
Amy Linabery, M.S., M.P.H., and Julie Ross, Ph.D.
Principal Investigators
<First Name> <Last name> <Address 1> <Address 2> <City>, <State> <Zip>
FROGS Study University of Minnesota 420 Delaware Street SE, MMC 422 Minneapolis, MN 55455
FROGS
<Date>
We recently sent materials to you for the Feasibility of Retrospectively Obtaining Guthrie Spots (FROGS) Study. This national study is being conducted at the University of Minnesota in partnership with the Children’s Oncology Group. The goal of the study is to learn more about environmental and biologic factors affecting children’s health.
If you have already mailed a questionnaire and signed forms back to us, Thank You! If you have not yet completed the questionnaire, we would still like to hear from you.
If you have questions or do not want us to contact you further about the study, please call us toll-free at 888-663-2707. If you did not receive the study materials or if you need another questionnaire, please call us and we will send one out immediately.
Sincerely,
FROGS

239
<Date> <First Name> <Last name> <Street Address> <City>, <State> <Zip> Dear <First Name> <Last name>, A number of weeks ago, we invited you to participate in the FROGS Study, a study of factors during pregnancy and childhood that may be related to the development of leukemia, lymphoma, and similar illnesses in children and adolescents. We sent you a questionnaire and other study forms, but to our knowledge, we have not yet received your completed materials. We are contacting you again to ask for your help because of the importance of gathering information from as many mothers as possible. It is only by obtaining questionnaire answers and permission to obtain dried blood spots from nearly all mothers and children invited to participate that we can be sure the results are representative, accurate and useful. Our end goal is to learn what causes leukemia, lymphoma, and similar illnesses to develop in young people. We think the results of this study will be very useful in deciding what environmental and biological factors should be researched further and whether or not we can use neonatal blood spots to do so. The information you provide in this study will be kept strictly confidential and will only be seen by the research staff. Any information that can directly identify you or your child, such as your names, address, and telephone number will be stored separately from your other answers to the questionnaire and will be linked only through the questionnaire identification number. If you agree to let us use and store the blood spots, they will be labeled with a number, not your child’s name. Your names will not be used in any publication or presentation of our findings. We hope you will decide to fill out and return your questionnaire and other forms soon. The yellow page explains the materials included in this packet and provides step-by-step directions on what to do to participate. If you decide not to participate for any reason, please let us know by returning a blank questionnaire or a brief note in the envelope provided. Sincerely,
Amy M. Linabery and Julie A. Ross Principal Investigators P.S. Please feel free to call us, toll-free, at 888-663-2707 with any questions about the study. Or, if you would like to speak to someone else about the research, please call the Research Subjects' Advocate Line at 612-625-1650.

240
1. What is your child’s full name?
______________________________________________________________________ First Middle Last 2. What is your child’s date of birth? ___ ___ / ___ ___ / ___ ___ ___ ___ Month Day Year 3. Where was your child born? ______________________________________________________________________ Hospital name City State/Province Country 4. Is your child 18 years of age or older? □ Yes Go to question 5
□ No
□ He/she is deceased 5. Is his/her home address and telephone number the same as yours?
□ Yes, he/she has the same contact information as me
□ No, he/she has the following contact information:
____________________________________________________________________
Street Address ____________________________________________________________________
City State/Province Zip/Postal Code Phone number: ___ ___ ___ - ___ ___ ___ - ___ ___ ___ ___
FROGS Feasibility of Retrospectively Obtaining Guthrie Spots
Your Child’s Birth and Contact Information

241
Feasibility of Retrospectively Obtaining Guthrie Spots (FROGS) Study Telephone Script
Initial phone contact Hello, my name is ___________ and I’m calling from the University of Minnesota Department of Pediatrics. We are working with the Children’s Oncology Group on a childhood cancer study. First of all, I want to check to see whether or not you received the questionnaire and other materials that we recently mailed to you. [Refer to prior mailings if needed.]
IF NOT RECEIVED, VERIFY MAILING ADDRESS -- INCLUDING SPELLINGS
Do you have any questions about the materials you received? I would like to ask whether or not you are interested in receiving more information about the study. Do you have a few minutes now to go over the material or would another time be better? And I just need to double check a few things to make sure the information we have from COG is correct.
Your child is a __boy/girl__ born on ___date of birth___. Is that correct? I have the __leukemia/lymphoma__ diagnosis date as __diagnosis date__. Is that right? (Within a few days is fine.) And what is your child's first name? (If we don't have it.)
As you saw in the materials, we are contacting you because you participated in the COG Childhood Cancer Research Network (CCRN) pilot study awhile back. We are conducting a study of factors that may be related to the development of leukemia and lymphoma in children and adolescents. We would like to do a questionnaire with you either in writing or over the telephone. The questions we ask are about medical and family health history, personal habits such as smoking, pregnancy history, and events surrounding your child’s birth. Answering the questions usually takes about 20-30 minutes. [IF COMPLETING OVER THE TELEPHONE THEN THE INTERVIEW CAN BE SPLIT INTO DIFFERENT SESSIONS IF NECESSARY]
SILENT PROBE -- ALLOW FOR QUESTIONS If it’s okay, we can schedule a time now for sometime next week to run through the questions with you over the telephone.

242
IF NOT READY TO DECIDE We will call back <<next week OR in the amount of time specified by participant>> to answer any questions you might have about the materials and to set up a time for the interview.
Also, there is a second, optional portion of the study where we are asking for your child’s permission to get your child’s dried blood spots from the state health department in the state where your child was born. Since your child is now aged 18 years or older, we would need to get consent from __him/her__ directly for this part of the study. What is the best way to get in touch with __him/her__? [TALK TO CHILD IF AVAILABLE OR FOLLOW INSTRUCTIONS PROVIDED BY MOTHER FOR GETTING IN TOUCH WITH THE CHILD. SEE SCRIPT BELOW.] Our toll-free number is 1-8XX-XXX-XXXX and it is included it the packet of materials. Please call us with any questions regarding the study. Thank you for your time. We appreciate your participation in this important study and look forward to talking to you/hearing from you soon. If completing questionnaire over the telephone We've gone over a lot of information (or There's a lot of information in the study materials) and I want to be sure we've gone over everything. 1. Can you describe for me the purpose of the study? 2. What more would you like to know about the study? 3. Do you have the toll-free number in case you have questions in the future? 4. And I would like to confirm whether or not you would like to participate. At time of interview Everything you tell us will be kept confidential and seen only by the researchers involved with the study. If there is any question you do not wish to answer, please let me know. If you have any questions as we go along please stop me. If you want to take a break let me know that too.

243
Discussion with the adult child Hello, my name is ___________ and I’m calling from the University of Minnesota Department of Pediatrics. We are working with the Children’s Oncology Group on a childhood cancer study. Your mom told us that this would be the best way to get in touch with you. First of all, I want to check to see whether or not you received the materials that we recently mailed to you. [Refer to prior mailings if needed.] Do you have any questions about the materials you received? I would like to ask whether or not you are interested in receiving more information about the study. Do you have a few minutes now to go over the material or would another time be better? As you saw in the materials, we are contacting you because you and your mom participated in the COG Childhood Cancer Research Network (CCRN) pilot study awhile back. We are conducting a study of factors that may be related to the development of leukemia and lymphoma in children and adolescents. In addition to the questionnaire we have asked your mom to fill out, there is a second, optional portion of the study where we are asking for your written permission to get your dried blood spots from the state health department in the state where you were born. These blood spots are created when a few drops of blood are collected from babies at birth, placed on filter paper (also called “Guthrie Cards”), and dried. The blood spots are collected to check for some serious diseases (metabolic conditions) in newborns. Some states have stored the dried spots in case they could be used in the future. If you agree (by signing the forms we sent), we will ask the state where you were born for the blood spots. These blood spots are useful because they provide a snapshot of your blood biology at the time of your birth.
SILENT PROBE -- ALLOW FOR QUESTIONS Do you have any questions about the study that I can answer? Our toll-free number is 1-8XX-XXX-XXXX and it is included it the packet of materials. Please call us with any questions regarding the study or filling out the forms. Thank you for your time. We appreciate your participation in this important study and look forward to hearing from you soon.
244
Appendix F. FROGS Study letters of approval Includes letters from the COG Scientific Council, the University of Minnesota Cancer Protocol Review Committee (CPRC) and Institutional Review Board (IRB), and response letters from state IRBs, including: Minnesota Department of Health, State of New York Department of Health, Washington State Department of Health, Michigan Department of Community Health, and Texas Department of State Health Services. We currently await a response from the New Jersey Department of Health and Senior Services.

245

246

247

248

249

250

251

252

253

254
Appendix G. Response rates for the questionnaire, written consent and assent, and adult contact information forms, and NBS retrieval
rates overall and by age at diagnosis, year of birth, and years since diagnosis.
Total Age at diagnosis 0-4 years 5-9 years 10-14 years 15-20 years N (%) N (%) N (%) N (%) N (%)
Questionnaire Completed 366 (41.3) 138 (38.5) 65 (33.7) 69 (40.8) 94 (56.3) Refused, active 27 (3.0) 14 (4.3) 4 (2.1) 6 (3.6) 3 (1.8) Refused, passive (contact made) 156 (17.6) 60 (16.8) 43 (22.3) 32 (18.9) 21 (12.6) Unsure if contact made 291 (32.8) 121 (33.8) 73 (37.8) 56 (33.1) 41 (24.6) Returned to sender 47 (5.3) 25 (7.0) 8 (4.1) 6 (3.6) 8 (4.8) Consent Completed 310 (37.1) 136 (36.3) 62 (30.5) 51 (36.2) 61 (52.6) Wrong party signed consent 1 (0.1) 1 (0.3) 0 (0.0) 0 (0.0) 0 (0.0) Refused, active 26 (3.1) 14 (4.1) 6 (3.0) 4 (2.8) 2 (1.7) Refused, passive (contact made) 200 (24.0) 69 (18.4) 48 (23.6) 39 (27.7) 44 (37.9) Unsure if contact made 253 (30.3) 127 (33.9) 78 (38.4) 41 (29.1) 7 (6.0) Returned to sender 45 (5.4) 28 (7.5) 9 (4.4) 6 (4.3) 2 (1.7) Assent Completed 148 (32.0) 70 (36.3) 56 (29.6) 21 (26.3) 1 (100) Wrong party signed assent 7 (1.5) 4 (2.1) 2 (1.1) 1 (1.3) 0 (0.0) Refused, active 13 (2.8) 5 (2.6) 5 (2.6) 3 (3.8) 0 (0.0) Refused, passive (contact made) 100 (21.6) 35 (18.1) 47 (24.9) 18 (22.5) 0 (0.0) Unsure if contact made 169 (36.5) 66 (34.2) 70 (37.0) 33 (41.3) 0 (0.0) Returned to sender 26 (5.6) 13 (6.7) 9 (4.8) 4 (5.0) 0 (0.0)

255
Total Age at diagnosis 0-4 years 5-9 years 10-14 years 15-20 years N (%) N (%) N (%) N (%) N (%) Adult child information form Completed 132 (54.1) 0 (0.0) 0 (0.0) 39 (49.4) 93 (56.7) Refused, active 9 (3.7) 0 (0.0) 0 (0.0) 4 (5.1) 5 (3.0) Refused, passive (contact made) 31 (12.7) 0 (0.0) 0 (0.0) 14 (17.7) 17 (10.4) Unsure if contact made 61 (25.0) 0 (0.0) 0 (0.0) 21 (26.6) 40 (24.4) Returned to sender 11 (4.5) 0 (0.0) 1 (100) 1 (1.3) 9 (5.5) NBS Received 46 (4.9) 23 (6.1) 10 (4.9) 5 (2.8) 8 (4.3) State not responded 67 (7.1) 34 (9.1) 10 (4.9) 7 (3.9) 16 (8.6) State stores spots <1 year 72 (7.6) 30 (8.0) 15 (7.4) 14 (7.7) 13 (7.0) State stores spots 1-5 years, not age-eligible 33 (3.5) 15 (4.0) 4 (2.0) 7 (3.9) 7 (3.7) State stores spots >5 years, not age-eligible 19 (2.0) 5 (1.3) 4 (2.0) 3 (1.7) 7 (3.7) Insufficient information to release 2 (0.2) 1 (0.3) 0 (0.0) 1 (0.6) 0 (0.0) State does not release NBS 60 (6.3) 23 (6.1) 16 (7.8) 11 (6.1) 10 (5.4) NBS not requested* 648 (68.4) 244 (65.1) 145 (71.1) 133 (73.5) 126 (67.4)
* Includes cases with no consent/assent, lost to follow up, and not born in U.S.

256
Year of birth Years since diagnosis 1982-1986 1987-1991 1992-1996 1997-2001 2002-2006 2-4 years 5-10 years N (%) N (%) N (%) N (%) N (%) N (%) N (%)
Questionnaire Completed 36 (50.7) 104 (54.2) 57 (30.5) 122 (39.0) 47 (37.9) 158 (42.5) 208 (40.4) Refused, active 0 (0.0) 8 (4.2) 3 (1.6) 12 (3.8) 4 (3.2) 10 (2.7) 17 (3.3) Refused, passive (contact made) 11 (15.5) 27 (14.1) 45 (24.1) 47 (15.0) 26 (21.0) 65 (17.5) 91 (17.7) Unsure if contact made 20 (28.2) 45 (23.4) 75 (40.1) 112 (35.8) 39 (31.5) 121 (32.5) 170 (33.0) Returned to sender 4 (5.6) 8 (4.2) 7 (3.7) 20 (6.4) 8 (6.5) 18 (4.8) 29 (5.6) Consent Completed 23 (43.4) 69 (53.5) 55 (27.9) 116 (35.6) 47 (36.2) 131 (36.8) 179 (37.4) Wrong party signed consent 0 (0.0) 0 (0.0) 0 (0.0) 1 (0.3) 0 (0.0) 0 (0.0) 1 (0.2) Refused, active 2 (3.8) 1 (0.8) 4 (2.0) 15 (4.6) 4 (3.1) 11 (3.1) 15 (3.1) Refused, passive (contact made) 21 (39.6) 46 (35.7) 49 (24.9) 56 (17.2) 28 (21.5) 85 (23.9) 115 (24.0) Unsure if contact made 5 (9.4) 10 (7.8) 80 (40.6) 116 (35.6) 42 (32.3) 113 (31.7) 140 (29.2) Returned to sender 2 (3.8) 3 (2.3) 9 (4.6) 22 (6.7) 9 (6.9) 16 (4.5) 29 (6.1) Assent Completed 0 (0.0) 3 (27.3) 51 (28.3) 94 (34.6) 0 (0.0) 44 (28.4) 104 (33.8) Wrong party signed assent 0 (0.0) 1 (9.1) 0 (0.0) 6 (2.2) 0 (0.0) 3 (1.9) 4 (1.3) Refused, active 0 (0.0) 0 (0.0) 3 (1.7) 10 (3.7) 0 (0.0) 4 (2.6) 9 (2.9) Refused, passive (contact made) 0 (0.0) 3 (27.3) 47 (26.1) 50 (18.4) 0 (0.0) 36 (23.2) 64 (20.8) Unsure if contact made 0 (0.0) 3 (27.3) 70 (38.9) 96 (35.3) 0 (0.0) 60 (38.7) 109 (35.4) Returned to sender 0 (0.0) 1 (9.1) 9 (5.0) 16 (5.9) 0 (0.0) 8 (5.2) 18 (5.8)
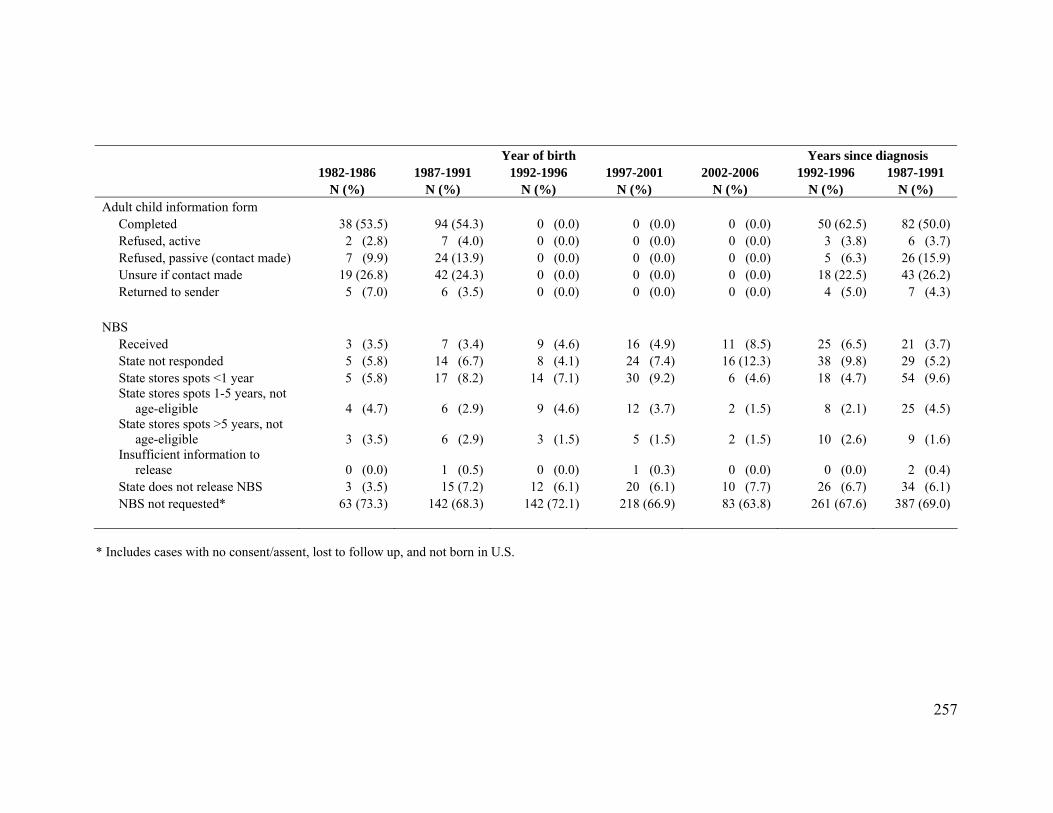
257
Year of birth Years since diagnosis 1982-1986 1987-1991 1992-1996 1997-2001 2002-2006 1992-1996 1987-1991 N (%) N (%) N (%) N (%) N (%) N (%) N (%) Adult child information form Completed 38 (53.5) 94 (54.3) 0 (0.0) 0 (0.0) 0 (0.0) 50 (62.5) 82 (50.0) Refused, active 2 (2.8) 7 (4.0) 0 (0.0) 0 (0.0) 0 (0.0) 3 (3.8) 6 (3.7) Refused, passive (contact made) 7 (9.9) 24 (13.9) 0 (0.0) 0 (0.0) 0 (0.0) 5 (6.3) 26 (15.9) Unsure if contact made 19 (26.8) 42 (24.3) 0 (0.0) 0 (0.0) 0 (0.0) 18 (22.5) 43 (26.2) Returned to sender 5 (7.0) 6 (3.5) 0 (0.0) 0 (0.0) 0 (0.0) 4 (5.0) 7 (4.3) NBS Received 3 (3.5) 7 (3.4) 9 (4.6) 16 (4.9) 11 (8.5) 25 (6.5) 21 (3.7) State not responded 5 (5.8) 14 (6.7) 8 (4.1) 24 (7.4) 16 (12.3) 38 (9.8) 29 (5.2) State stores spots <1 year 5 (5.8) 17 (8.2) 14 (7.1) 30 (9.2) 6 (4.6) 18 (4.7) 54 (9.6) State stores spots 1-5 years, not age-eligible 4 (4.7) 6 (2.9) 9 (4.6) 12 (3.7) 2 (1.5) 8 (2.1) 25 (4.5) State stores spots >5 years, not age-eligible 3 (3.5) 6 (2.9) 3 (1.5) 5 (1.5) 2 (1.5) 10 (2.6) 9 (1.6) Insufficient information to release 0 (0.0) 1 (0.5) 0 (0.0) 1 (0.3) 0 (0.0) 0 (0.0) 2 (0.4) State does not release NBS 3 (3.5) 15 (7.2) 12 (6.1) 20 (6.1) 10 (7.7) 26 (6.7) 34 (6.1) NBS not requested* 63 (73.3) 142 (68.3) 142 (72.1) 218 (66.9) 83 (63.8) 261 (67.6) 387 (69.0)
* Includes cases with no consent/assent, lost to follow up, and not born in U.S.

258
Appendix H. Studies examining prenatal vitamin and/or iron supplementation and childhood leukemia
Author, Location (Year)
Diagnosis dates
included
Ages Matching/ adjustment variables
Ncases Ncontrols Exposure Outcome OR (95% CI) Comments
INFANT LEUKEMIA
Pombo-de-
Oliveira, Brazil
(2006)151
1999-2005
0-21 months
Age, region of residence, sex, income, maternal age, birthweight
202 440 Maternal consumption of vitamins/iron supplements during pregnancy
IAL 0.90 (0.63-1.28)
CHILDHOOD LEUKEMIA
Schüz, Germany (2007)39
1992-1994
0-14 years
Age (± 1 year), sex, community of residence, year of birth, degree of urbanization, SES
650 2057 Maternal vitamin, folate and/or iron supplement use during pregnancy
ALL 0.84 (0.69-1.01) Maintaining the original matching moved OR closer to null (OR = 0.96, 95% CI: 0.75-1.22). Upon stratification by child’s age, OR<5 years = 0.98 (95% CI: 0.76-1.25) and OR≥5 years = 0.67 (0.50-0.90).
105 2057 Maternal vitamin, folate and/or iron supplement use during pregnancy
AML 1.13 (0.74-1.72)

259
Author, Location (Year)
Diagnosis dates
included
Ages Matching/ adjustment variables
Ncases Ncontrols Exposure Outcome OR (95% CI) Comments
Dockerty, New
Zealand (2007)93
1990-1993
0-14 years
97 303 Mother's use of folic acid during pregnancy
ALL 1.1 (0.5-2.7)
Mother's use of multivitamins during pregnancy
ALL 0.8 (0.2-3.1)
Age, sex, marital status, maternal education level
Mother's use of other vitamin or mineral supplements during pregnancy
ALL 1.5 (0.7-3.1)
No association for 3 months before pregnancy or while breastfeeding (data not shown).
Mother’s use of iron (with or without folic acid) during pregnancy
ALL 1.2 (0.7-2.1)
Mother’s use of iron without folic acid during pregnancy
ALL 1.3 (0.8-2.3)
Kwan, USA
(2007)154
1995-2002
0-14 years
Date of birth, sex, Hispanic ethnicity, maternal race, age, and education, household income, country of residence at birth
365 460 Overall: Iron supplement use from 3 months prior to pregnancy to end of breastfeeding
Leukemia 0.70 (0.51-0.97) Case participation rate: 86%, control participation rate: 85%

260
Author, Location (Year)
Diagnosis dates
included
Ages Matching/ adjustment variables
Ncases Ncontrols Exposure Outcome OR (95% CI) Comments
Kwan, USA
(2007)154, con’t
Peripregnany: Iron supplement use from 3 months prior to pregnancy to end of pregnancy
Leukemia 0.76 (0.52-1.11)
Overall iron supplement use
ALL 0.67 (0.47-0.94)
Peripregnancy iron supplement use
ALL 0.72(0.47-1.09)
Ross, USA
(2005)40
1997-2002
0-18 years
Age, sex, maternal age, maternal race, maternal education level
97 173 Maternal vitamin use in the year before and throughout pregnancy
ALL 0.49 (0.29-0.84)
Maternal vitamin use during periconceptional period (year before pregnancy and during pregnancy before knowledge of pregnancy)
ALL 0.51 (0.30-0.89)
Maternal vitamin use only after knowledge of pregnancy
ALL 1.70 (0.98-2.92)
Study conducted in children with Down syndrome. No evidence of an interaction with advanced maternal age (≥35 years vs. <35 years). No differences observed upon stratification by child’s age.

261
Author, Location (Year)
Diagnosis dates
included
Ages Matching/ adjustment variables
Ncases Ncontrols Exposure Outcome OR (95% CI) Comments
Ross, USA
(2005)40, con’t
Number of vitamins taken during year before pregnancy = 1
ALL 0.56 (0.32-0.98)
Number of vitamins taken during year before pregnancy = 2
ALL 0.55 (0.20-1.49)
Iron supplements taken in addition to multi-vitamin
ALL No association Results not provided; text indicates no association with time periods examined.
61 173 Maternal vitamin use in the year before and throughout pregnancy
AML 0.98 (0.51-1.86)
Maternal vitamin use during periconceptional period (year before pregnancy and during pregnancy before knowledge of pregnancy)
AML 0.92 (0.48-1.76)
Reduced risk in those <2 years at diagnosis (OR = 0.48, 95% CI: 0.21-1.07) and no association in those 2-5 years at diagnosis (OR = 1.02, 95% CI: 0.21-5.04).

262
Author, Location (Year)
Diagnosis dates
included
Ages Matching/ adjustment variables
Ncases Ncontrols Exposure Outcome OR (95% CI) Comments
Ross, USA
(2005)40, con’t
Maternal vitamin use only after knowledge of pregnancy
AML 1.45 (0.75-2.78)
Number of vitamins taken during year before pregnancy = 1
AML 0.83 (0.43-1.60)
Number of vitamins taken during year before pregnancy = 2
AML 1.07 (0.36-3.20)
Iron supplements taken in addition to multi-vitamin
AML No association Results not provided; text indicates no association with time periods examined.
Shaw,
Canada (2004)94
1980-2000
0-14 years
Age, sex, maternal age, maternal education level
789 789 Maternal use of vitamins (with folic acid) during pregnancy
ALL 1.0 (0.8-1.2)
Maternal use of vitamins (with folic acid) during pregnancy, <50 times
ALL 1.1 (0.6-2.1)

263
Author, Location (Year)
Diagnosis dates
included
Ages Matching/ adjustment variables
Ncases Ncontrols Exposure Outcome OR (95% CI) Comments
Shaw, Canada
(2004)94, con’t
Maternal use of vitamins (with folic acid) during pregnancy, 50-100 times
ALL 1.4 (0.9-2.3)
Maternal use of vitamins (with folic acid) during pregnancy, >100 times
ALL 0.9 (0.7-1.1)
Jensen, USA
(2004)156
1995-1999
0-14 years
138 138 Total folic acid in the maternal diet (1 year prior to index pregnancy)
ALL 0.78 (0.33-1.81) Authors note that supplement use increases during pregnancy and therefore, pre-pregnancy diet may not be an adequate surrogate.
Date of birth, sex, maternal race, parental Hispanic ethnicity, county of residence, energy intake, income, prior fetal loss, hours child in preschool, indoor pesticide exposure during pregnancy, proportion of portion sizes reported as large or extra large
Iron intake in year before pregnancy
ALL 0.89 (0.51-1.53)

264
Author, Location (Year)
Diagnosis dates
included
Ages Matching/ adjustment variables
Ncases Ncontrols Exposure Outcome OR (95% CI) Comments
Wen, USA
(2002)41
1989-1993
0-14 years
1842 1986 Ever used vitamins during year before pregnancy through pregnancy and nursing
ALL 0.7 (0.5-1.0)
Ever used vitamins during year before pregnancy through pregnancy
ALL 0.7 (0.5-1.0)
Ever used vitamins during year before pregnancy
ALL 1.2 (0.4-3.0)
Age (±2 years), race, telephone area code and exchange, immunophenotype, gender, household income, maternal race, maternal education, maternal smoking before or during pregnancy, maternal drinking before or during pregnancy, other medication use Ever used vitamins
during pregnancy
ALL 0.7 (0.5-1.0)
99% CIs reported
<1 year 64 81 Ever used vitamins during year before pregnancy through pregnancy
ALL 0.9 (0.1-7.1)
0-14 years
1842 1986 Ever used iron supplements during year before pregnancy through pregnancy and nursing
ALL 0.9 (0.7-1.0) Also looked at paternal iron supplement use

265
Author, Location (Year)
Diagnosis dates
included
Ages Matching/ adjustment variables
Ncases Ncontrols Exposure Outcome OR (95% CI) Comments
Wen, USA
(2002)41, con’t
Ever used iron supplements during year before pregnancy through pregnancy
ALL 1.5 (0.8-2.6)
Ever used iron supplements during year before pregnancy
ALL 1.4 (0.6-3.6)
Iron supplement use only during pregnancy
ALL 0.8 (0.7-1.0)
<1 year 64 81 Iron supplement use only during pregnancy
ALL 1.1 (0.3-3.9)
Thompson, Australia (2001)42
1984-1992
0-14 years
Sex, date of birth (± 6 months), region of residence
83 166 Maternal use of folate (with or without iron) during pregnancy
ALL 0.40 (0.21-0.73)
First use of folate (with or without iron) at ≤7 weeks
ALL 0.18 (0.04-0.80)
First use of folate (with or without iron) at 8-11 weeks
ALL 0.39 (0.13-1.16)
OR robust to adjustment by potential confounders examined separately and in combination. No effect modification observed across strata of sex or age at diagnosis (<5 vs. ≥5 years).

266
Author, Location (Year)
Diagnosis dates
included
Ages Matching/ adjustment variables
Ncases Ncontrols Exposure Outcome OR (95% CI) Comments
Thompson, Australia (2001)42,
con’t
First use of folate (with or without iron) at >11 weeks
ALL 0.33 (0.14-0.81)
Duration of use of folate (with or without iron) in pregnancy of 1-26 weeks
ALL 0.28 (0.10-0.76)
Duration of use of folate (with or without iron) in pregnancy of 27-33 weeks
ALL 0.39 (0.15-1.02)
Duration of use of folate (with or without iron) in pregnancy of ≥34 weeks
ALL 0.21 (0.04-0.98)
Maternal iron use (without folate) during pregnancy
ALL 0.75 (0.37-1.51)
Maternal use of iron and folate during pregnancy
ALL 0.41 (0.22-0.75)
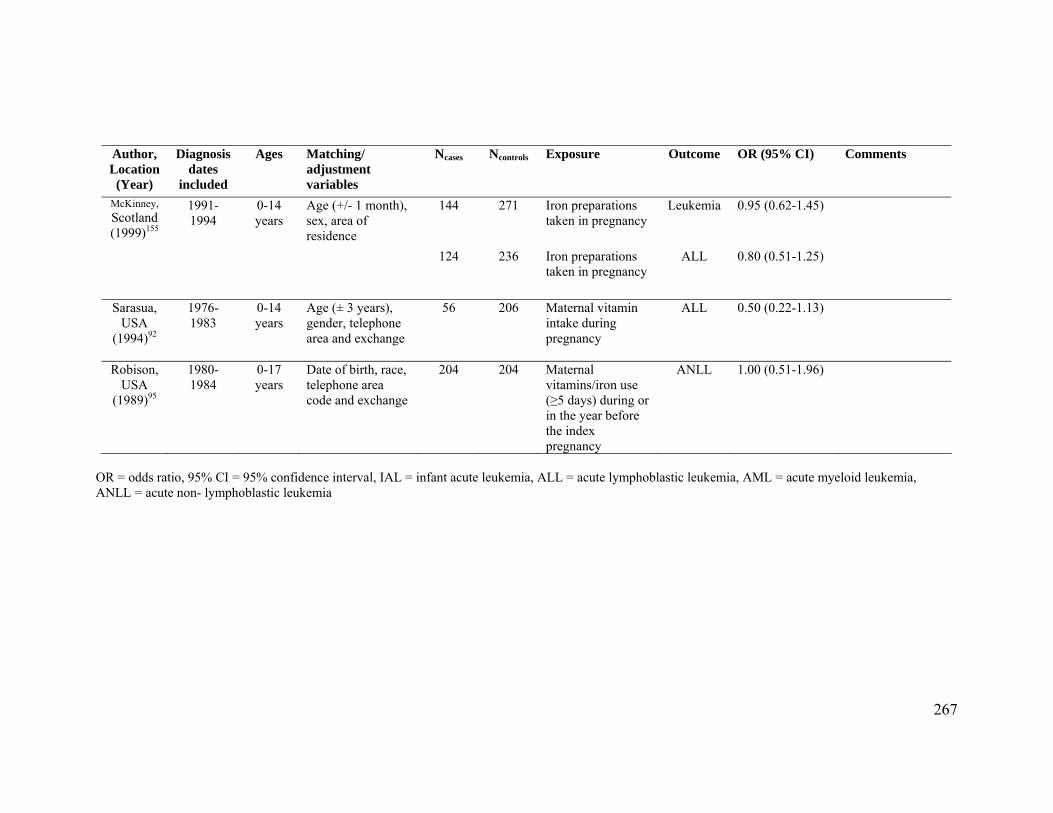
267
Author, Location (Year)
Diagnosis dates
included
Ages Matching/ adjustment variables
Ncases Ncontrols Exposure Outcome OR (95% CI) Comments
McKinney, Scotland (1999)155
1991-1994
0-14 years
Age (+/- 1 month), sex, area of residence
144 271 Iron preparations taken in pregnancy
Leukemia 0.95 (0.62-1.45)
124 236 Iron preparations taken in pregnancy
ALL 0.80 (0.51-1.25)
Sarasua, USA
(1994)92
1976-1983
0-14 years
Age (± 3 years), gender, telephone area and exchange
56 206 Maternal vitamin intake during pregnancy
ALL 0.50 (0.22-1.13)
Robison, USA
(1989)95
1980-1984
0-17 years
Date of birth, race, telephone area code and exchange
204 204 Maternal vitamins/iron use (≥5 days) during or in the year before the index pregnancy
ANLL 1.00 (0.51-1.96)
OR = odds ratio, 95% CI = 95% confidence interval, IAL = infant acute leukemia, ALL = acute lymphoblastic leukemia, AML = acute myeloid leukemia, ANLL = acute non- lymphoblastic leukemia

268
Appendix I. Questionnaire items regarding prenatal vitamin and iron supplementation

269

270
Appendix J. Prevalence of atopic disease among children and adolescents Exposure Prevalence Population/Source ReferenceAny atopic disease 31.5% Controls ages 0-6, medical record review
(U.S.) 43
37.5% Controls ages 0-11+ (U.S.) 37 52.3% NHANES III – ages 6-17 216 Allergic rhinitis (hay fever)
4.7% NHIS 2006-2008 – ages 0-4 254
10.4% NHIS 2006-2008 – ages 5-9 254 12.3% NHIS 2006-2008 – ages 10-17 254 7.5% Controls ages 0-11+ (U.S.) 37 10.8% ISAAC, Phase III (Canada) – ages 6-7 218 19.1% ISAAC, Phase III (U.S.) – ages 13-14 218 Asthma 6.2% NHIS 2006-2008 – ages 0-4 253 10.6% NHIS 2006-2008 – ages 5-9 253 10.4% NHIS 2006-2008 – ages 10-17 253 10.9% Controls ages 0-6, medical record review
(U.S.) 216
9.1% NHANES III – ages 6-17 8.9% Controls ages 0-11+ (U.S.) 37 18.2% ISAAC, Phase III (Canada) – ages 6-7 218 22.3% ISAAC, Phase III (U.S.) – ages 13-14 218 43 Atopic dermatitis (eczema)
10.6% Controls ages 0-6, medical record review (U.S.)
43
7.3% Controls ages 0-11+ (U.S.) 37 12.0% ISAAC, Phase III (Canada) – ages 6-7 218 8.3% ISAAC, Phase III (U.S.) – ages 13-14 218 Urticaria (hives) 8.4% Controls ages 0-11+ (U.S.) 37

271
Appendix K. International experts surveyed to request any other relevant published or unpublished results Investigator Location Institution E-mail address Responded
Judith R. Thompson Australia Cancer Foundation of Western Australia [email protected] No
Elizabeth Milne Australia University of Western Australia [email protected] Yes
Maria S. Pombo-De-Oliveira Brazil Instituto Nacional de Cancer Divisao de Medicina
Experimental Rua Andre Cavalcanti [email protected] No
Mary L. McBride British Columbia, Canada University of British Columbia [email protected] Yes
Claire Infante-Rivarde Quebec, Canada McGill University [email protected] Yes
Lisa Lyngsie Hjalgrim Denmark Statens Serum Institut [email protected] No
Mads Melbye Denmark Statens Serum Institut [email protected] No
Tine Westergaard Denmark Statens Serum Institut [email protected] No
Henrik Hjalgrim Denmark Statens Serum Institut [email protected] Yes
Joachim Schüz Denmark Danish Cancer Society [email protected] Yes
Jacqueline Clavel France Institut national de la sante et de la recherche medicale (INSERM)/ Universite de Paris-Sud [email protected] No

272
Investigator Location Institution E-mail address Responded
Florence Menegaux France Institut national de la sante et de la recherche medicale (INSERM)/ Universite de Paris-Sud [email protected] No
Peter Kaatsch Germany University of Mainz [email protected] No
Eleni Petridou Greece Athens University Medical School/Harvard School of Public Health [email protected] Yes
Corrado Magnani Italy Childhood Cancer Registry of Piedmont (CPO Piemonte) [email protected] No
John Dockerty New Zealand University of Otago [email protected] No
Estelle Naumburg Sweden Uppsala University [email protected] No
Sven Cnattingius Sweden Karolinska Institute [email protected] Yes
Eve Roman United Kingdom University of York [email protected] No
Tracy Lightfoot United Kingdom University of York [email protected] No
Mel Greaves United Kingdom Institute of Cancer Research [email protected] No
Leo Kinlen United Kingdom Oxford University [email protected] No
Jill Simpson United Kingdom University of York [email protected] No

273
Investigator Location Institution E-mail address Responded
Richard McNally United Kingdom Newcastle University [email protected] No
Patricia McKinney United Kingdom University of Leeds [email protected] Yes
Leslie L. Robison Tennessee, USA St. Jude Research Hospital [email protected] No
Patricia A. Buffler California, USA University of California, Berkeley [email protected] Yes
Peggy Reynolds California, USA Northern California Cancer Center [email protected] Yes
Xiaomei Ma Connecticut, USA Yale [email protected] Yes
Martha Linet Maryland, USA National Cancer Institute [email protected] Yes
Frederica P. Perera New York, USA Columbia University [email protected] Yes
Paula Rosenbaum New York, USA State University of New York Upstate Medical University [email protected] Yes
Andrew Olshan North Carolina, USA University of North Carolina, Chapel Hill [email protected] Yes
Greta R. Bunin Pennsylvania, USA Children's Hospital of Philadelphia [email protected] Yes
Xiao Ou Shu Tennessee, USA Vanderbilt University [email protected] Yes

274
Investigator Location Institution E-mail address Responded
Beth A. Mueller Washington, USA University of Washington [email protected] Yes

275
Appendix L. Meta-analysis data abstraction form

276

277

278
Appendix M. Results of cumulative meta-analysis for A) leukemia overall and atopy or allergies, B) ALL and atopy or allergies, C)
ALL and asthma, D) ALL and eczema, E) AML and asthma.
*Results for cases ages 0-18 years obtained from first author (Karin Söderberg, Karolinska Institutet, personal communication, 2009).

279
Fraumeni (1964) (251)
Bross (1972) (250)
Hughes (2007) (34)
First Author (Year) (Ref)
0.82 (0.53, 1.27)
1.86 (0.37, 9.31)
1.41 (0.60, 3.36)
OR (95% CI)
0.82 (0.53, 1.27)
1.86 (0.37, 9.31)
1.41 (0.60, 3.36)
OR (95% CI)
10.1 1 10Odds Ratio
P-A)

280
Nishi (1989) (38)
Wen (2000) (37)
Schüz (2003) (36)
Spector (2004) (43)
Rosenbaum (2005) (35)
Hughes (2007) (34)
First Author (Year) (Ref)
0.26 (0.11, 0.60)
0.47 (0.18, 1.21)
0.54 (0.38, 0.78)
0.65 (0.44, 0.95)
0.64 (0.47, 0.87)
OR (95% CI)
0.26 (0.11, 0.60)
0.47 (0.18, 1.21)
0.54 (0.38, 0.78)
0.65 (0.44, 0.95)
0.64 (0.47, 0.87)
0.69 (0.54, 0.89)
OR (95% CI)
10.1 1 10Odds Ratio
P-B)

281
Wen (2000) (37)
Schüz (2003) (36)
Jourdan-Da Silva (2004) (249)
Spector (2004) (43)
Rosenbaum (2005) (35)
Söderberg (2006)*
Hughes (2007) (34)
First Author (Year) (Ref)
0.80 (0.62, 1.03)
0.78 (0.61, 1.00)
0.70 (0.52, 0.93)
0.79 (0.52, 1.21)
0.76 (0.53, 1.10)
0.73 (0.53, 1.02)
OR (95% CI)
0.80 (0.62, 1.03)
0.78 (0.61, 1.00)
0.70 (0.52, 0.93)
0.79 (0.52, 1.21)
0.76 (0.53, 1.10)
0.73 (0.53, 1.02)
0.79 (0.61, 1.02)
OR (95% CI)
10.1 1 10Odds Ratio
P-C)
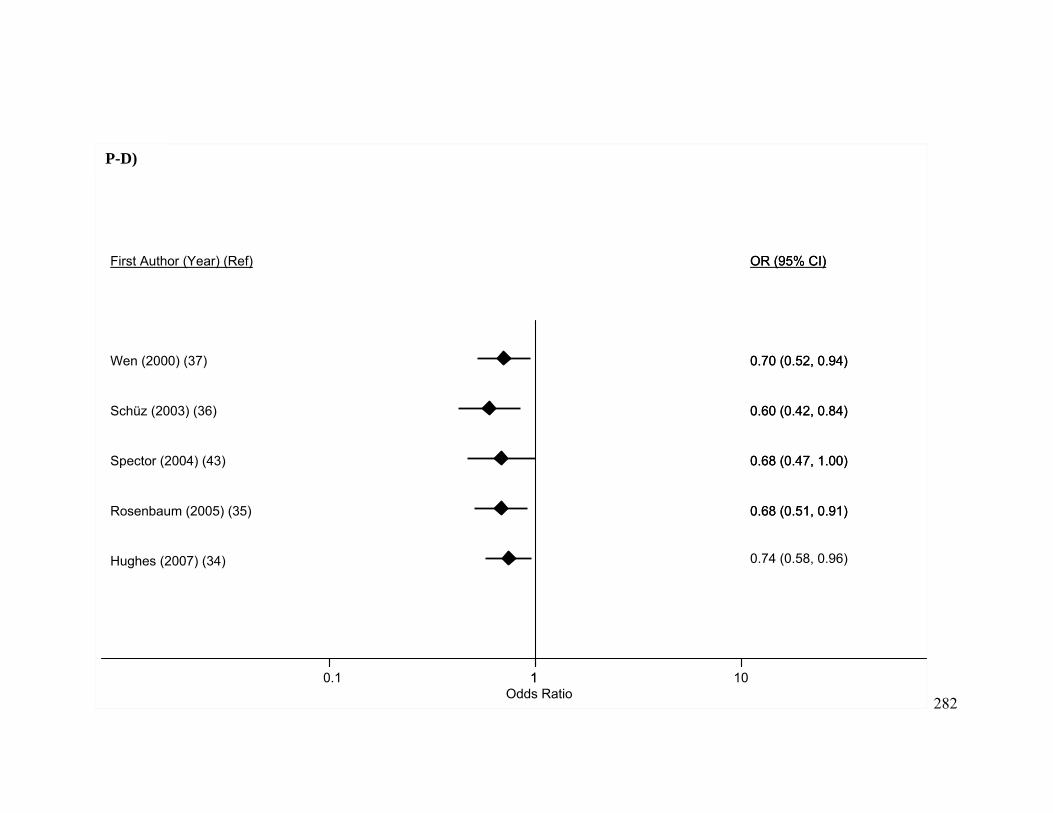
282
Wen (2000) (37)
Schüz (2003) (36)
Spector (2004) (43)
Rosenbaum (2005) (35)
Hughes (2007) (34)
First Author (Year) (Ref)
0.70 (0.52, 0.94)
0.60 (0.42, 0.84)
0.68 (0.47, 1.00)
0.68 (0.51, 0.91)
OR (95% CI)
0.70 (0.52, 0.94)
0.60 (0.42, 0.84)
0.68 (0.47, 1.00)
0.68 (0.51, 0.91)
0.74 (0.58, 0.96)
OR (95% CI)
10.1 1 10Odds Ratio
P-D)

283
Jourdan-Da Silva (2004) (249)
Söderberg (2006)*
Hughes (2007) (34)
First Author (Year) (Ref)
0.40 (0.10, 1.65)
0.87 (0.21, 3.58)
OR (95% CI)
0.40 (0.10, 1.65)
0.87 (0.21, 3.58)
1.05 (0.56, 1.95)
OR (95% CI)
1.1 1 10Odds Ratio
P-E)

284
Appendix N. Results of influential analysis for A) leukemia overall and atopy or
allergies, B) ALL and atopy or allergies, C) ALL and asthma, D) ALL and eczema, E)
AML and atopy or allergies, F) AML and asthma.
0.37 1.41 0.60 3.36 9.31
Fraumeni (1964) (251)
Bross (1972) (250)
Hughes (2007) (34)
Lower CI Limit Estimate Upper CI Limit Meta-analysis estimates, given named study is omittedQ-A)

285
0.53 0.79 0.60 1.02 1.10
Wen (2000) (37)
Schüz (2003) (36)
Jourdan-Da Silva (2004) (249)
Spector (2004) (43)
Rosenbaum (2005) (35)
Söderberg (2006)*
Hughes (2007) (34)
Lower CI Limit Estimate Upper CI Limit Meta-analysis estimates, given named study is omitted
0.46 0.69 0.53 0.88 0.97
Nishi (1989) (38)
Wen (2000) (37)
Schüz (2003) (36)
Spector (2004) (43)
Rosenbaum (2005) (35)
Hughes (2007) (34)
Lower CI Limit Estimate Upper CI Limit Meta-analysis estimates, given named study is omittedQ-B)
Q-C)

286
0.51 0.74 0.57 0.96 1.07
Wen (2000) (37)
Schüz (2003) (36)
Spector (2004) (43)
Rosenbaum (2005) (35)
Hughes (2007) (34)
Lower CI Limit Estimate Upper CI Limit Meta-analysis estimates, given named study is omitted
0.53 0.87 0.62 1.21 1.57
Schüz (2003) (36)
Hughes (2007) (34)
Lower CI Limit Estimate Upper CI Limit Meta-analysis estimates, given named study is omitted
Q-D)
Q-E)
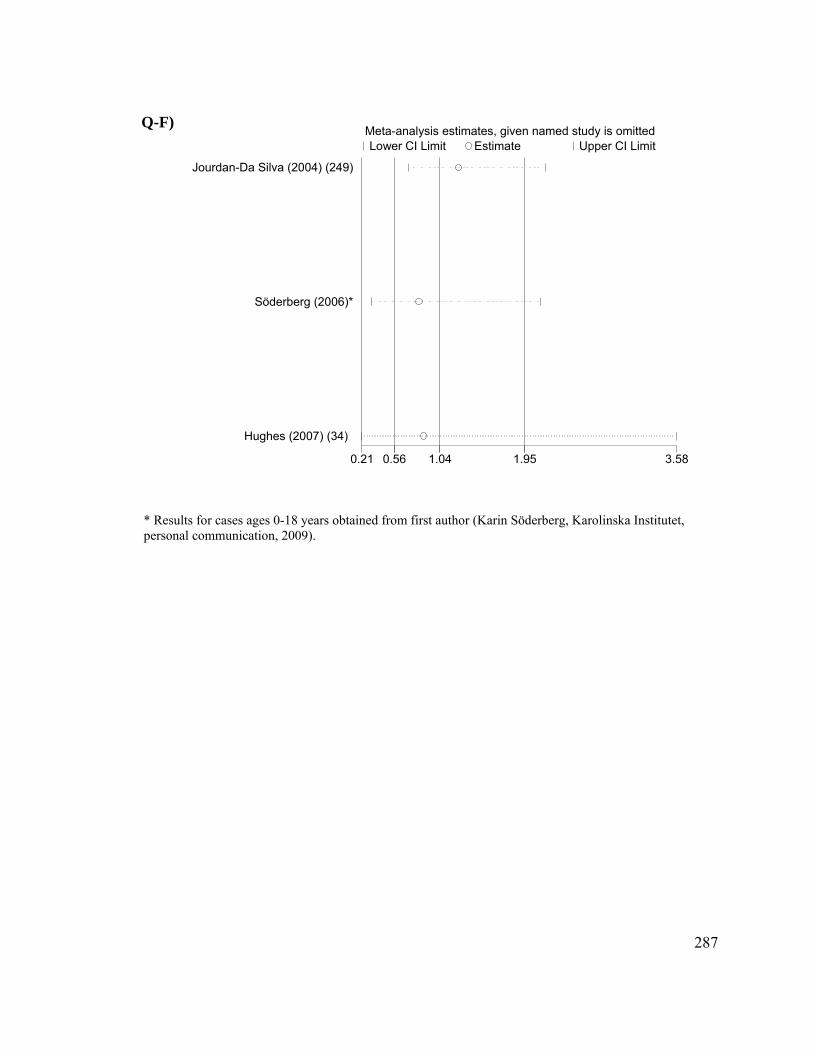
287
* Results for cases ages 0-18 years obtained from first author (Karin Söderberg, Karolinska Institutet, personal communication, 2009).
0.21 1.04 0.56 1.95 3.58
Jourdan-Da Silva (2004) (249)
Söderberg (2006)*
Hughes (2007) (34)
Lower CI Limit Estimate Upper CI Limit Meta-analysis estimates, given named study is omittedQ-F)