the eu-russia gas relationship: a mutual dependency
TRANSCRIPT

Stockholm Institute of Transition Economics (SITE) ⋅ Stockholm School of Economics ⋅ Box 6501 ⋅ SE-113 83 Stockholm ⋅ Sweden
Stockholm Institute of Transition Economics
WORKING PAPER November 2012
No. 18
The EU-Russia Gas Relationship: A Mutual Dependency
Chloé Le Coq and Elena Paltseva
Working papers from Stockholm Institute of Transition Economics (SITE) are preliminary by nature, and are circulated to promote discussion and critical comment. The views expressed here are the authors’ own and not necessarily those of the Institute or any other organization or institution.

1
The EU-Russia Gas Relationship: a mutual dependency1
Chloé Le Coq2 and Elena Paltseva3 September 2012
Abstract
Current debate on the energy security in the EU often stresses the EU dependency on gas imports from Russia. However, Russia is no less dependent on the EU – more than half of its gas exports goes to Europe. The purpose of this paper is to characterize this mutual dependency through an index-based approach, and to discuss how the development of gas markets may affect such dependency. We suggest a unified framework to assess the security of gas supply for the EU and the security of gas demand for Russia, and construct dependency indexes for both parties. Our approach accounts not only for the traditional import/export dependency measures but also for the balance of power between Russia and the EU. The proposed methodology is then used to address the evolution of the EU-Russia gas relationship in the view of gas market’s developments. New gas pipelines projects (e.g., South Stream, Nabucco) and increasing use of liquefied natural gas are all likely to impact both the demand side and the supply side of the EU-Russia gas trade, and affect mutual gas dependency between the EU and Russia. Key words: Energy Security, European Union, Gas transit risks, Index, Russia JEL codes: Q4, Q48, C8
1 Financial support from Jan Wallanders och Tom Hedelius Stiftelse is gratefully acknowledged. 2 SITE, Stockholm School of Economics, P.O. Box 6501, Stockholm 1183, Sweden, [email protected]. 3 SITE, Stockholm School of Economics, P.O. Box 6501, Stockholm 1183, Sweden and New Economic School, Russia, [email protected]

2
1. Introduction
Over last two decades roughly 20 percent of the EU gas exports has originated from
Russia.4 For several EU Member States this share exceeds 90 percent.5 Current debate
on the energy security in the EU often refers to these figures when stressing the EU
dependency on gas imports from Russia. It often proceeds to argue that the expected
increase in the EU gas consumption would make the dependency of the Russian gas
even more of a concern. However, Russia is no less dependent on the EU – with
approximately half of Russian budget revenues coming from energy-related exports6,
and about 55 percent of its gas exports going to Europe,7 Russia needs the EU gas
markets to facilitate development and growth. Some have even argued that Russia’s gas
dependency on the EU is stronger than the reverse dependency (e.g. Havlik 2010 or
Stern 2006).
The above argument clearly suggests that there are gains from trade for the gas
relationship between the EU and Russia. However, these economic gains can be
affected by geopolitical or economic tensions between Russia, the EU and/or a third
party. In particular, the continuity of the gas trade flows may be interrupted, as it was
indeed the case during several gas crises between Russia and the transit countries. This
implies that for both parties, security is a concern: (i) it is the security of gas supply for
the EU, who wants to avoid Russian gas supply disruption; (ii) it is the security of gas
demand for Russia, who would like to secure a stable gas market share in the EU
despite the geopolitical tensions. Clearly, these two objectives are closely interrelated
and represent the core of the mutual gas dependency between Russia and the EU.
Moreover, the development of the fuel markets is very likely to affect the state of this
4 BP (2011) 5 Eurostat 6 Economic Expert Group by the Ministry of Finance of Russian Federation 7 BP (2011)

3
mutual dependency. Dependency would be influenced by the launch of new pipeline
projects, such as South Stream and Nabucco, or the expansion of the liquefied natural
gas market. It could be affected by the EU energy policies such as increased
competitiveness and further integration of internal markets. The uncertainty associated
with the discovery and processing of the shale gas, as well as other aspects of
technological progress would also contribute to the evolution of the Russia-EU gas
relation.
The purpose of this chapter is to suggest a way to quantify mutual gas dependency
between the EU and Russia. We propose a unified framework, which allows us to focus
on the power and the dependency in this buyer-seller relationship. More specifically,
our approach accounts for the economic dependency on gas, the reliability of gas trade
routes and the balance of power between Russia and the EU. We construct an index for
each gas trading party, the Supply Dependency Index (SDI) for the EU, and the Demand
Dependency Index (DDI) for Russia.
We then demonstrate how the indexes can be used to evaluate future gas market
developments from the dependency angle. We consider South Stream and Nabucco in
2020, and, for each of the routes, we study how SDI and DDI vary depending on the
volume of gas sent through the route. Unsophisticated reasoning would suggest that SDI
should increase for South Stream and decrease for Nabucco. However, we find that for
a sizable range of export values, both South Stream and Nabucco decrease the EU
dependency on Russian gas, though the effect of Nabucco on SDI is stronger. The
surprising result for South Stream comes from the following observation: While an
increase in Russian gas imports raises the economic gas dependency of the EU, it is also
associated with the EU becoming more important gas customer for Russia. The latter
improves the EU bargaining position vis-à-vis Russia. Moreover, a new gas route
4
provides a better possibility to redirect the gas flows if needed, which also lowers SDI.
Thereby, the net effect of these three factors results in SDI decrease. In turn, Russia’s
dependency of the EU increases with Nabucco, but decreases with South Stream. So,
based on dependency, South Stream would be preferred by Russia, while Nabucco – by
the EU, creating tension in the EU-Russia relationship. We then show that a scenario
combining a moderate use of LNG with some imports through South Stream may be
preferred by both the EU and Russia. We conclude by discussing some policy
implications of our analysis.
The rest of the chapter is organized as follows. Section 2 presents the index
methodology and discusses related literature. Section 3 provides the estimates for the
SDI and DDI under alternative scenarios and discusses scenarios’ benefits and
drawbacks for Russia and the EU. Section 4 addresses the limitations of the approach,
and section 5 concludes.
2. Measuring the EU-Russia gas dependency
This section describes our methodology to assess the EU-Russia gas dependency.
We first outline the key features of this dependency. We then explain how these features
are incorporated into two indexes: the Supply Dependency Index (SDI) quantifying the
EU dependency of Russian gas, and the Demand Dependency Index (DDI) describing
Russia’s dependency on the EU’s demand for Russian gas. We conclude this section by
discussing related literature.
Our dependency indexes characterize the stability and the importance of the gas
relation for the EU and Russia. The EU and Russia’s objectives in this relationship do
not necessarily coincide – each party can be driven both by economic and by

5
geopolitical considerations. Further, this dependency may well be asymmetric between
the two involved parties due to different access to alternative markets, the features of
the domestic market, etc. As a result, we assess dependency separately for the EU and
Russia. Still, the bilateral nature of the gas trade relation implies that the dependency
indexes for the supplier and the consumer are based on a number of common principles.
More specifically,
Economic dependency principle: A dependency index should account for gas
export/import dependency.
It has been long recognized that the extent of exposure to gas trade is likely to
affect country’s gas dependency. The dependency is traditionally proxied by
import/export dependency measures, such as the share of gas trade in total consumption
(for consuming side of the market) or total exports (for supplying part). However, large
volumes of gas trade do not per se pose a threat to any of the trading parties. The
problem comes from the fact that the gas trade may be affected by geopolitical
developments, transportation risks, especially so for the pipeline gas with its low
fungibility. These concerns should be reflected in the dependency index, leading to our
next common principle:
Reliability principle: A dependency index should account for the reliability of gas trade
routes between the exporter and importer.
Gas trade between Russia and the EU takes place through a number of pipeline gas
routes, several of which are passing through so-called transit countries, such as
Belorussia and Ukraine. Moreover, most of these routes are serving several EU Member
6
states.8 As a result, shortage of gas supplies from Russia to a single EU Member state is
likely to affect other EU Member states served by the same gas route. That is, a
substantial part of gas trade uncertainty should be attributed to the reliability of the gas
routes (which we would also refer to as “transit risks”).
Transit risks associated with a particular route should therefore include the
probability of technical failure along the pipeline and the political risk associated with
the transit country(ies) located on this specific route. Further, the reliability of trade also
depends on the possibility to re-route the gas flows between Russia and the EU in case
of a possible route halt, and can be captured, for example, by gas route diversification.
Balance of Power Principle: A dependency index should reflect the allocation of
bargaining power between Russia and the EU Member States served by a particular
gas route.
Assume that the Member States served by some route i are predominantly
consuming Russian gas. Further, assume that these Member States do not have a solid
outside option in case of a Russian gas supply disruption – that is, they are very
dependent on gas and do not have an easy access to alternative gas suppliers. Then
Russia has a strong bargaining position vis-a-vis these Member States. This position can
be used to exercise monopolistic pricing or to have a certain political leverage.
Similarly, the larger is the amount of Russian gas consumed by the Member States
served by some route i, the stronger is their buyer power vis-a-vis Russia, that is, the
possibility to obtain certain concessions from Russia. Indeed, if the considered route
consumes a large share of Russian gas exported to Europe, Russia does not have a good
outside option, that is, the possibility to reallocate the gas trade to the alternative buyers
8 See appendix A.1 for the description of the pipeline gas routes from Russia to the EU.

7
in case of disagreement with the Member States in question. In this case the EU may
exercise its buyer power to obtain gas price discounts or exert certain political pressure
on Russia, for example, during a transit crisis. Further, the extent of such a buyer power
would also depend on the importance of EU gas export revenues for Russian economy.
The above considerations suggest a common framework for the construction of
both the Supply Dependency Index, and the Demand Dependency Index. Below we
present the two indexes in more detail.
2.1 EU’s dependency toward Russia: Supply Dependency Index
This section introduces the Supply Dependency Index (SDI). It assesses the EU
exposure to potential instability of the Russian gas supply, and resulting impact of this
instability on the EU economy.
To evaluate the dependency on Russian gas at the EU level, the Supply
Dependency Index aggregates the information across the EU Member States. More
specifically, it builds upon the individual Member State dependency indexes, so-called
Transit Risk Indexes (TRIs), developed in Le Coq and Paltseva (2012). In what follows
we first sketch the TRI approach, and then discuss the way to combine the TRIs for the
EU Member States into a unified EU dependency measure, the SDI.
Transit Risk Index is a country-level index quantifying the risk of Russian gas
import with special emphasis on the transit dimension. It consists of an import
dependency component and a transit risk component.
The import dependency component, in line with the Economic Dependency
Principle outlined above, reflects the importance of the Russian gas imports and, more
generally, of natural gas for the considered EU Member State. It is represented by the
share of Russian gas imports in the Member State’s gas consumption multiplied by the

8
share of natural gas in the total energy bundle of this Member State.
The transit risk component reflects the vulnerability of the gas pipeline transit.
According to the Reliability Principle, it accounts for the route diversification of
Russian gas supply to the considered Member State. It measures diversification by
using a Herfindahl-Hirshman-like sum of squared shares of Russian gas imports over all
routes serving the considered Member State. Then, for each such route i the respective
share of Russian gas imports is weighted by the route reliability characteristics, such as
political risks along the route, and risks of technical failure. Further, the route weights
also include a proxy for the “bargaining power”, BPi, of the group of the EU Member
States served by this gas route vis-à-vis Russia, as suggested by the Balance of Power
Principle. More precisely, for higher values of TRI to be associated with higher transit
risks, BPi is inversely related to the buyer power of the EU Member States served by
route i, the latter measured as a share of Russian gas to the EU via route i. That is,
higher buyer power would imply lower BPi and less risky gas imports.
Summing up, the TRI for the Member State c is defined as follows:9
TRIc =Import dependency component *Transit risk component ,
where
( ) .
cc c
c2c
c i i i ii Transit routesserving c
RussianGasImportImportDependency = GasShareInFuelsGasConsumption
TransitRisk = RussianGasImportShare * PolRisk *TechFailure * BP∈∑
Lower gas import dependency of country c, better route diversification of Russian gas
imports, more reliable transit routes (with lower political risks and/or risks of technical
failure), and higher buyer power along the route all lead to lower values of TRI.
We are now ready to present the overall EU’s dependency index, SDI, which is
9 See Le Coq and Paltseva (2011) for more details on the definition of TRI

9
constructed by aggregating the TRIs across the EU Member States. Specifically, SDI is
defined as a weighted sum of the TRIs across all EU-27 Member States consuming
Russian gas,10 with the weight of each TRI being the share of Russian gas imports of
the respective Member State in the total EU imports of Russian gas. Further, as argued
by Balance of Power Principle, the stability of a gas trade is related to value of this
trade for the trade partners. The value for the EU Member States is already taken into
account in each TRI through the share of Russian gas in their gas consumption.
Thereby, SDI is left to account for the importance of this trade for Russia. To do so, it
controls for the share of Russian gas exports to the EU in the budget revenue of Russia:
The lower is the budget share of EU-Russia gas trade, the less important is this market
for Russia, and the less would Russia be interested in ensuring the stability of supply to
this market.
Following this logic, the Supply Dependency Index is given by the following
expression:
EU Member States
* 1c EUEU c
c EU RU
RussianGasImport RussianGasExportValueSDI TRIRussianGasImport BudgetRevenues∈
⎡ ⎤⎛ ⎞= −⎜ ⎟⎢ ⎥⎣ ⎦⎝ ⎠
∑
Higher values of SDI correspond to higher EU’s dependency on Russian gas imports.
2.2 Russia’s dependency toward EU: Demand Dependency Index
This section addresses the Demand Dependency Index (DDI) that characterizes
Russia’s gas sales dependency from the EU. The DDI intends to capture potential
instability of the demand for Russian gas in the EU and the resulting impact on the
Russian economy. Similarly to above, the index is constructed based on the three main
principles outlined in the beginning of this section. However, unlike SDI, DDI is not
10 Note that for the EU Members not buying gas from Russia TRI=0, so including them into the sum does not change SDI.

10
build by aggregation over the sub-indexes characterizing bilateral relations between
Russia and individual EU Member States. Indeed, as mentioned above, a gas supply
shortage is likely to involve a group of the EU Member States served by the same
transit route, rather than a single Member State. Thereby, we argue that a measure of
gas demand vulnerability for the gas supplier, Russia, should be based on transit route-
level relations rather than country-level ones.
DDI can be roughly subdivided into an export dependency component and a
demand risk component. The export dependency reflects the economic importance of
the gas demand instability for the Russian economy, in line with the Economic
Dependency Principle. Two factors need to be taken into account here. Consider a
decrease in gas exports from Russia to the EU due, for example, an introduction of a
new pipeline to an alternative supplier. On one hand, such a decrease would lower the
dependence of Russia on the EU gas sales.11 On the other hand, due to low fungibility
of pipeline gas trade, it might be difficult for Russia to find an alternative market for the
freed-up gas volume, at least in a short-to-medium run. As a result, the decrease in
exports would imply a loss in profits and/or budget revenues, resulting in negative
impact on Russian economy. Thereby, the export dependency component consists of
two parts: the term given by the ratio of the EU gas export value to the Russian budget,
to capture the degree of importance of the Russia-EU gas trade for Russian economy;
and the term inversely related to the change in the budget revenues from the EU gas
exports resulting from a change in market conditions, to capture the loss (or gain) in gas
trade profits.
The demand risk component evaluates the reliability of the gas relationship
between Russia and the EU. To start with, it incorporates the diversification of gas
11 For example, in the limit, with no sales to the EU Russia will have zero dependency.
11
demand for Russia measured as a sum of squared shares of gas exports over different
transit routes between Russia and the EU, GasExpSharei. Notice that this measure
would also account for the possibility of re-routing gas supplies (in case of a political
conflict or a physical rupture), in line with the Reliability Principle. The export shares
in the above sum are weighted by a number of features of each route, such as political
instability along the route, and risk of pipeline rupture.
Further, as suggested by the Balance of Power Principle, the route weights also
account for the allocation of bargaining power between Russia and the EU. First, larger
Russia’s market power along these routes and the overall importance of gas for the EU
Member States served by this route would lower Russia’s gas dependency. For each
route, we aggregate these measures across the Member States served by this route into a
measure of a route’s dependency on Russian gas, RouteDepi. Higher values of
RouteDepi correspond to routes serving countries relatively independent on Russian
gas, and, consequently, to Russia having relatively little bargaining power along this
route. Further, the buyer power of the countries served by route i vis-a-vis Russia would
improve their bargaining position and limit the possibility of Russia to use gas trade for
geopolitical objectives, thus, increasing Russia’s dependency on the EU. In DDI we
proxy this buyer power by (1-BPi).12
Summing up, the Demand Dependency Index (DDI) for a gas-selling country
(Russia, in our case) supplying gas to the EU is given by the following equation:
DDIRU =Demand risk component * Export dependency component,
where
12 Recall that BPi is inversely related to the respective buyer power.

12
( )
1
)
new routesEU EU
RU RU
2
i i i i ii Transit routes to E
RussianGasExportValue RussianGasExportValueExportDependency =BudgetRevenue BudgetRevenue
DemandRisk = GasExpShare * PolRisk * TechFailure * RouteDep * (1 - BP∈
⎛ ⎞Δ−⎜ ⎟
⎝ ⎠
U
∑
Higher values of DDI correspond to higher Russia’s dependency on its gas exports to
the EU. More detailed description of DDI components can be found in Appendix A. 2.
2.3 Related literature
By focusing on the mutual dependency between Russia and EU, this paper relates
to the large literature on energy security. The energy supply security from the buyer’s
perspective has been heavily discussed, with several papers looking specifically into the
EU’s energy security. It is also quite common to assess the energy security
quantitatively, by the means of an index. The methodology may however differ among
studies, depending on the countries involved in the energy trade, the time frame, the
energy commodity considered, etc. (an overview of approaches is offered in e.g. Le Coq
and Paltseva (2009), Sovacool and Mukherjee (2011), or Cherp and Jewell (2011)).
Given the focus of our paper, the mutual gas dependency between Russia and EU,
energy supply security and demand security are central in our quantitative analysis. Le
Coq and Paltseva (2012), focusing on EU’s gas supply security, provide a Transit Risk
Index (TRI) designed to quantify the risks associated with pipeline gas imports. We
extend their methodology to quantitatively assess the risks associated with imports but
also, exports of pipeline gas. By doing so, we acknowledge that Russia is also gas-
dependent on the EU, the energy exports being determinant for a sustainable economic
growth in Russia. This solo fact has been stressed in many papers (see e.g. Havlik
(2010)). More importantly the literature has also recognized that the EU’s gas security

13
is the outcome of the balance of power between EU and Russia (see e.g. Stern (2006) or
Finon and Locatelli (2008)). However, while addressing the mutual dependency
between EU and Russia, the literature does not usually provide a unified framework to
characterize and quantify such mutual dependency, which is one of the key points of our
analysis.
Another key point of our approach is that in evaluating dependency we explicitly
account for the bargaining power of each of the gas trade parties. Hubert and
Ikonnikova (2011) and Hubert and Suleymanova (2008) also use the notion of
bargaining power when formalizing the EU-Russia gas trade. Their focus is however the
investment in pipelines and not the characterization of the mutual dependency and they
use cooperative game theory. Further the informal concept of the EU “buyer power”
used in our approach is motivated by the theoretical arguments in e.g. Inderst and
Shaffer (2008) and Inderst and Wey (2007), though they do not apply their analysis to
the energy markets.
Finally, our approach allows conducting a prospective analysis, looking at different
scenarios of gas market development. We therefore are able to discuss alternatives
available to the EU as well as Russia. In particular we contribute to discussion on the
possibilities and the difficulties of creating a common energy policy (e.g. Findlater and
Noel (2009)).
3. The EU-Russia dependency estimation
In this section we show how the above framework can be used to evaluate future
gas market developments through the EU-Russia gas dependency lens. As an example,
we consider three alternative scenarios of new gas supply to the EU in 2020: an increase
in Russian gas supplied via the South Stream pipeline, an increase in non-Russian gas

14
via the Nabucco pipeline, and a scenario, combining the use of South Stream with an
increase in the EU consumption of liquefied natural gas (LNG). For each of the three
scenarios, we discuss how DDI and SDI change depending on the volume of gas
received by the EU via the respective pipeline. We then compare the dependency
indexes under these three scenarios, and discuss scenarios’ advantages and
disadvantages for Russia and the EU.
3.1 Data
The 2020 forecasts of the EU Member States’ gas consumption and total gas
imports come from the European Commission publication “EU energy trends to 2030”
(2010). We choose year 2020 for our estimates for a number of reasons. On one hand,
among the years with the “EU energy trends to 2030” forecast available, 2020 is the
earliest year when both South Stream and Nabucco would be completed according to
the current planning. On the other hand, Russian gas trade with China is expected to
take off after 2020 (see IEA (2011), p. 314), so in our estimates we can ignore the
additional uncertainty associated with this new market. The forecasts for the EU imports
of Russian gas in 2020 are scenario-specific and will be discussed below (more detailed
description is available in Appendix A.3).
The idea behind the political risks of gas transit suggests that these risks should
take into account both the political stability in the supplier and transit countries, and the
potential conflicts between these countries. However, to our knowledge, no quantitative
forecast on the latter component of the political risk is available. Thereby, we base our
proxy of political risk of gas transit on the country-level Political Risk Rating (PRR)
forecasts suggested by the PRS group in their International Country Risk Guide.13 In
13 As the 2020 proxy was not available, we have used the closest available forecast date, 2015.

15
turn, the risk of technical failure is approximated by the length of the pipeline multiplied
by the probability of a rupture per km within a considered period of time (see Le Coq
and Paltseva (2012) for more details on both risk indicators).
As a forecast for the 2020’s share of the EU-Russia gas trade revenues in Russian
budget is, to our knowledge, not available, we approximate it by the following
procedure: First, we assume that, in the absence of any new routes (i.e. without South
Stream/Nabucco), the ratio of the EU gas export value to Russian budget revenues
would stay the same as in 2011. Then we adjust the ratio to the market developments in
our scenarios, such as an increase in Russian gas exports to the EU due to the use of
South Stream, etc. In turn, the 2011’s Russia-to-EU gas exports to budget ratio is
calculated based on the data from RossBusinessConsulting (2012), BP Statistical
Review (2012) and Russian Federation Federal State Statistics Service (2012).
3.2 South Stream effect on dependency indexes
The South Stream pipeline’s project is planned to transport Russian gas via the
Black Sea (to minimize the political risks of gas transit) to Bulgaria and further to
Greece and Italy via one branch, and Hungary and Austria via the other one. The project
is expected to start in December 2012 and to be completed in 2015. The maximum
planned capacity is 63 billion cubic meters per year (or 49.3*103 KToe).
We estimate SDI and DDI for different capacity usage of South Stream. The idea is
as follows: As was discussed above, an additional consumption of Russian gas would
increase the EU import dependency. However, it would also improve the EU bargaining
position vis-a-vis Russia due to stronger buyer power of the EU. Further, an
introduction of South Stream would facilitate reallocation of gas flows between Russian
and the EU in case of a gas crisis, thereby improving the gas route diversification. The

16
first effect raises SDI, while the two latter ones would lower it. Similar conflicting
effects can be identified for DDI. We want to see how the relative impact of these
effects on dependency changes with the volume of gas sent via South Stream.
In this exercise, we make a conservative assumption that the total gas imports of
the EU Member States do not change with the introduction of South Stream. However,
this implies that the allocation of gas imports between Russia and other gas suppliers
would be affected by South Stream: Russian gas sent via South Stream would “crowd
out” some gas sent through the previously existing transit routes, both Russian and non-
Russian ones. Thereby, the non-Russian gas imports will decrease and the Russian gas
imports will increase, but not at the rate of South Stream usage. Note that this crowding
out will have an effect on the bargaining power of both Russia and the EU, and, in turn,
on the dependency indexes.
Figure 1 provides SDI estimates for different capacity usages of the South Stream
pipeline. Contrary to the commonly expressed concerns, the EU dependency on Russian
gas does not monotonically increase with the usage of South Stream. Instead, SDI
graph is given by a convex curve with a minimum reached at around 20% of South
Stream’s total capacity. This shape of SDI curve illustrates the trade-off discussed
above: With low usage of South Stream, the EU buyer power effect combined with an
improved gas route diversification outweighs the increase in import dependency,
resulting in SDI reduction. When the South Stream capacity usage exceeds 20%, the
increase in import dependency becomes relatively more important and SDI starts to
increase. Further, at high levels of South Stream usage the affected Member States
import too much gas through South Stream, creating imbalance in gas transit
diversification and contributing to SDI increase.

17
Figure 1. SDI estimates for different usage of South Stream and Nabucco.
Figure 2 presents analogous graph for DDI. Unlike SDI, DDI is constantly
decreasing with the South Stream capacity usage: Better gas route diversification and
higher market share of Russia on the European gas market both lead to a reduction in
DDI. While South Stream increases Russia’s budget dependency toward gas exports to
Europe, quantitatively this effect is not sufficiently strong to counteract the two above
effects and increase DDI.
The above discussion suggests that, based on the dependency, Russia and the EU
would prefer different usage of South Stream capacity. However, Figure 1 shows that
whenever South Stream load is below app. 50% of its total capacity, SDI does not
exceed the level achieved in absence of South Stream (i.e., with zero capacity use).
Thereby, the introduction of South Stream may be beneficial for both Russia and the
EU if no more than 50% of the capacity is used.
0
1
2
3
4
5
6
7
8
0 3 6 9 12
15
18
21
24
27
30
33
36
39
42
45
48
51
SDI
ktoe*103
SDI | Nabucco
SDI | South Stream

18
Figure 2. DDI estimates for different usage of South Stream and Nabucco.
3.3 Nabucco effect on dependency indexes
The Nabucco pipeline project is planned to connect Turkey with Bulgaria,
Romania, Hungary and Austria. It is meant to diversify the EU gas import portfolio and
lessen the EU dependency on Russian gas. The gas would come from Iraq’s fields and,
to a lesser extend, from Azerbaijan, Turkmenistan, and Egypt. The maximal capacity
planned is 31 billion cubic meters per year (or 24*103 KToe). The project is expected to
take five years, but the starting date is not yet settled. Nabucco and South Stream
projects are often seen as direct competitors.
Similarly to above, we estimate SDI and DDI for different capacity usage of
Nabucco. Again, the goal is to look into the interaction of the change in import
dependency, diversification and bargaining power, based on the assumption that
Nabucco only influences the allocation of imports between Russia and the other
suppliers but not the total imports. Notice that signs of the effects would differ from
those in South Stream case. Indeed, Nabucco would provide gas from Iraq, Azerbaijan,
0
0.5
1
1.5
2
2.5
3
3.5
4
4.5
5
0 3 6 9 12
15
18
21
24
27
30
33
36
39
42
45
48
51
DDI
ktoe*103
DDI | Nabucco
DDI | South Stream

19
etc., leading to a crowding out of Russian gas consumed by the EU. Thereby, an extra
gas sent via Nabucco would imply a decrease in the EU gas import dependency on
Russia, accompanied by a decrease in the EU buyer power. The former component will
reduce SDI, while the latter would raise dependency. Moreover, Nabucco is unlikely to
have a sizable effect on the gas route diversification between Russia and the EU. In
turn, the effect of Nabucco on DDI would come through the falling EU market share of
Russian gas (implying higher DDI), decreasing gas profits (higher DDI) and decreasing
export dependency (lower DDI).
Figure 1 andFigure 2 present SDI and DDI estimates for different volumes of gas
sent via Nabucco. Consider the SDI graph first: Up until app. 75% of Nabucco capacity
the falling import dependency effect dominates and SDI decreases. Thereafter, the EU
buyer power loss becomes large enough to counteract the import dependency effect and
increase SDI. However, SDI never comes back to the original level. In turn, DDI curve
increases with the quantity of gas sent via Nabucco, suggesting that the loss in profits
and market power is stronger than the decrease in Russia’s exports exposure towards
Europe. Notice also, that the shape of SDI and DDI curves in case of Nabucco excludes
the possibility of a mutually beneficial capacity choice for both Russia and the EU.
Now we are ready to compare the dependency in the South Stream and Nabucco
scenarios. Notice that the traditional import dependency argument would suggest that
South Stream and Nabucco should have opposite effect on the EU dependency on
Russian gas: the dependency should increase in case of South Stream and decrease in
case of Nabucco.
However, this logic no longer holds when the changes in transit route
diversification and allocation of bargaining power are taken into account. While the

20
direction of the route diversification effect and the bargaining power effects differ for
South Stream and Nabucco (see the above discussion), the outcome is surprisingly
similar: SDI first decreases and then increases with South Stream/Nabucco usage. Still,
the decrease in SDI produced by Nabucco is noticeably steeper, suggesting that for any
volume of gas not exceeding Nabucco’s full capacity, Nabucco yields less EU
dependency on Russian gas than South Stream. This suggests that, were the EU choose
the new gas pipeline project based on the gas dependency, it would prefer Nabucco. 14
In turn, DDI is affected differently by the two projects; it decreases with South
Stream usage and increases with Nabucco one, suggesting that Russia would strongly
favour South Stream.
We see that the dependency-based project choices of the EU and Russia do not
coincide, potentially straining future Russia-EU relationship. A natural question to raise
is whether some gas market development, ignored in our analysis so far, can facilitate a
compromise between Russia and the EU.
For example, LNG is seen to be an important component of the future gas market
in the EU. Consider the following idea: Assume that the EU combines a (moderate)
increase in LNG share in the EU gas import portfolio with South Stream use. It is
natural to expect that higher share of LNG would decrease the EU dependency on
Russian gas. If the combined LNG-South Stream scenario can match the Nabucco SDI
performance, the EU could save on the costs of constructing Nabucco while not
sacrificing its (in)dependency on Russian gas. However, the LNG-South Stream
scenario would lower Russia’s budget revenues from EU gas sales, increasing its DDI.
Still, if this increase is not too high (as compared to the Nabucco outcome), both Russia
and the EU could prefer this scenario as a sensible compromise. In the next section we 14 It is important to remember that our exercise does not take into account the investment costs of either project: unlike South Stream, Nabucco is expected to be partially backed by the EU (European Parliament and the Council (2009)). These investment costs may ultimately affect the EU choice.

21
identify the minimum LNG import share that can realize the above scenario.
3.4 Combining LNG consumption and a South Stream
We consider the following scenario: First, we assume a certain share of LNG in the
EU gas imports. Given this share, we study the variation in SDI and DDI depending on
the usage of South Stream capacity similarly to the exercise in subsection 3.1.
Similarly to above, we assume that the total imports of the EU Member States do not
change. This has two implications: First, the presence of LNG implies less pipeline gas
imports, both from Russia and other sources. Second, combined with the assumption of
a fixed LNG import share, this implies that the South Stream crowds out only the
pipeline gas imports, both from Russia and other providers, but has no impact on LNG
imports.
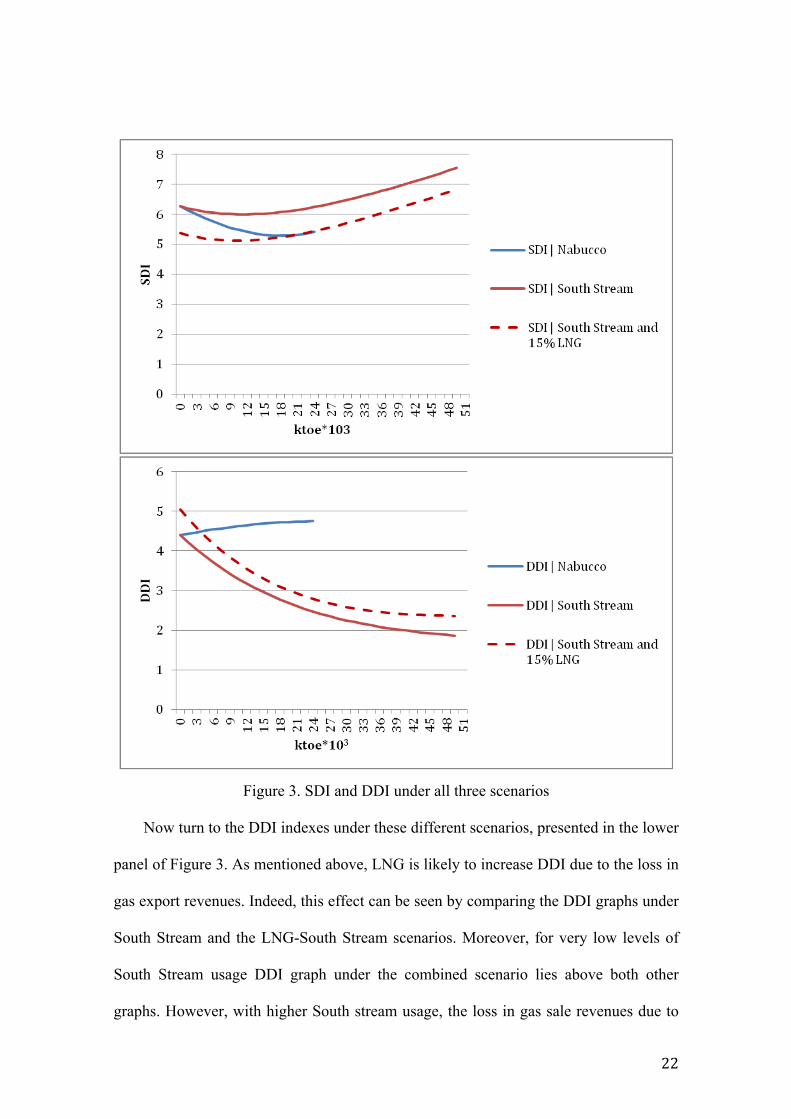
Figure 3 presents the outcome of the above exercise for the case when LNG
constitutes 15 percent of the EU gas imports. The upper panel of Figure 3 shows that
SDI graph for the combined LNG-South Stream scenario lies consistently below the
graph for the South Stream scenario. Indeed, a decrease in Russian gas imports due to
substitution by LNG means that the EU lowers its economic dependency of Russian
gas. Notice, that it also decreases the EU buyer power vis-a-vis Russia. However, for
sufficiently low levels of LNG imports the first effect dominates, implying a fall in SDI
for any volume of gas sent via South Stream.
More importantly, with 15 percent of LNG imports, the EU is at least as well off
under the combined LNG-South Stream scenario as under Nabucco (and often better
off, depending on the capacity usage): the SDI graph under the combined scenario lies
below the one for Nabucco. This result implies that the EU could avoid building
Nabucco if it consumes at least 15 percent of LNG gas while still using South Stream.
22
Figure 3. SDI and DDI under all three scenarios
Now turn to the DDI indexes under these different scenarios, presented in the lower
panel of Figure 3. As mentioned above, LNG is likely to increase DDI due to the loss in
gas export revenues. Indeed, this effect can be seen by comparing the DDI graphs under
South Stream and the LNG-South Stream scenarios. Moreover, for very low levels of
South Stream usage DDI graph under the combined scenario lies above both other
graphs. However, with higher South stream usage, the loss in gas sale revenues due to

23
LNG is offset by the revenue gain due South Stream imports. As a result, the combined
LNG-South Stream scenario outperforms Nabucco in terms of Russia’s dependency, as
long as the EU gas imports through South Stream are not too low.
Note that the Nabucco project could be realized without Russia’s consent, while the
South Stream needs an approval of both Russia and the EU. That is, in case of a
disagreement about new pipelines between the EU and Russia Nabucco is a likely
outcome. Thereby a compromise agreement between Russia and the EU should yield
each party at least its outside option – the Nabucco SDI/DDI, – and maybe more,
depending on the relative bargaining position. This means that a scenario combining 15
% of LNG gas imports with the South Stream use would represent a reasonable
compromise for Russia and the EU. It may seem that under this scenario Russia gains
much more than the EU as compared to the outside option of Nabucco. However, our
dependency indexes do not account for the investment costs that, in the case of South
Stream are largely born by Russia.
4. Limitations of the Approach
Our approach has a number of limitations. First of all, we assume only limited gas route
interconnection within Europe. While this assumption is reasonably realistic for the
current situation at the EU gas market, characterized by relatively low possibility for
reverse flow, it is perhaps less realistic when used in our 2020 SDI and DDI estimation.
However, it is currently unclear which reverse flow projects will be operational by
2020. Once this information becomes available, the indexes can be extended to
incorporate it. Second, in studying new gas projects our analysis does not account for
the associated investment costs. Note that our indexes provide a non-monetary measure
of gas dependency. Probably a better approach to the analysis of new gas routes would

24
be to combine the investment costs with the monetary costs of gas supply disruption.
However, the latter is difficult to assess. Thereby we chose to base out discussion on the
non-monetary dependency measure, addressing the investment costs only in informal
arguments. Further, our analysis overlooks the possibility of supply shortage due to
insufficient extraction capacity. Again, this is obviously a concern, especially in
creation of new gas routes. However, the existing information on the capacity of the
fields that may affect our estimation is rather unclear. Once this uncertainty is realized,
the extraction capacity constraints can be taken into account.
5. Conclusion
This chapter proposes a unified framework to characterize the mutual gas
dependency between the EU and Russia, with a special emphasis on the interaction
between the economic dependency and the allocation of bargaining power. It presents
the Supply Dependency Index (SDI) which evaluates the EU dependency on Russian
gas exports, and the Demand Dependency Index (DDI) which assesses Russia’s gas
dependency on the EU.
The indexes are then used to illustrate the impact of planned gas market
developments, such as an introduction of South Stream and Nabucco gas routes, on the
evolution of the EU-Russia dependency. Several messages are to be taken from this
analysis. First, contrary to a common perception, an increase in Russian gas
consumption via South Stream leads to a decline in the EU dependency on Russian gas,
at least for moderate usage of South Stream capacity. This effect is borne by the
improvement in the EU buyer power towards Russia. Second, a decrease in the EU
exposure to Russian gas due to Nabucco also weakens the EU buyer power vis-à-vis
Russia. Thus, while the presence of Nabucco reduces the EU dependency on Russian

25
gas, the effect is non-monotonic in Nabucco use. Third, the EU and Russia’s
dependency-based preferences over the choice between South Stream and Nabucco, as
well as the extent of their usage do not coincide. Not surprisingly, the EU prefers
Nabucco, while Russia favors South Stream. However, a moderate use of LNG
combined with South Stream may provide Russia and the EU with a sensible
compromise, and allow the EU to save on Nabucco investment costs.
These results suggest some implications for the energy policy in the EU and
Russia. First of all, in considering new energy options - new routes, alternative fuels,
such as shale gas or LNG, etc. – the EU policymakers would need to take into account
not only investment costs and change in the energy portfolio diversification, but also
associated change in the relative bargaining position of the affected parties. For
example, the same decrease in the EU gas dependency towards Russia (or any other
partner) could in some situations be achieved by creating a new gas route from an
alternative gas supplier, and by mobilizing the coordination between the EU Member
States to improve their buyer power vis-à-vis Russia. This argument is in line with the
recently revived idea of a “one-voice” EU energy policy, aimed at exercising “the
combined weight of the EU in external energy relations” (European Commission
(2011)).
Similarly, Russia would need to consider an analogous trade-off in making the
decision about securing its energy demand. Partial re-direction of gas export flows to
the new markets to achieve better demand diversification, – e.g. to South-East Asia, -
could be associated with a loss of the market power in each of the previously served
markets.

26
References
1. BP, 2011. Statistical review of the world energy
2. Cherp, A., Jewell, J., 2011. "Measuring energy security: from universal
indicators to contextualized frameworks." In The Routledge Handbook of Energy
Security, edited by B. K. Sovacool, 330-355. London and New York: Routledge
3. Eurogas, 2007. Eurogas long term outlook to 2030.
4. European Commission, 2010. “EU energy trends to 2030”.
5. European Commission, September 2011. Speaking with one voice – the key to
securing our energy interests abroad, press release
6. European Gas Pipeline Incident Data Group (EGIG) 2008. 7th EGIG-report
1970-2007 Gas Pipeline Incidents, Doc. No. EGIG 08.R.0002.
7. European Network of Transmission System Operators for Gas (ENTSOG), The
European Natural Gas Network map.
8. European Network of Transmission System Operators for Gas (ENTSOG),
2011. 10-Year Network Development Plan.
9. European Parliament and the Council, 2009. Regulation (EC) No 663/2009
establishing a programme to aid economic recovery by granting Community financial
assistance to projects in the field of energy.
10. European Regulators’ Group for Electricity and Gas (ERGEG), 2007.
"Assessment Summary on selected Transportation Routes, Report.
11. Eurostat, http://ec.europa.eu/eurostat
12. Findlater, S., Noël, P., 2009. "On the Draft Regulation on Gas Supply Security,"
Working paper 33, Regulation2point0.
13. Finon, D., Locatelli, C., 2008. "Russian and European gas interdependence:
Could contractual trade channel geopolitics?," Energy Policy, Elsevier, vol. 36(1), pp.

27
423-442.
14. GTE+ Reverse Flow Study TF, 2009, Gas Transmission Europe,
http://www.gie.eu.com/publications/indexframe_plus_reverse.html
15. The International Association of Oil & Gas Producers (OGP), 2010. Riser and
pipeline release frequencies, http://www.ogp.org.uk/pubs/434-4.pdf
16. Inderst, R., Shaffer, G., 2008. The Role of Buyer Power in Merger Control,
chapter prepared for the ABA Antitrust Section Handbook, Issues in Competition Law
17. Inderst, R., Wey, C., 2007, Buyer Power and Supplier Incentives, European
Economic Review, 51, pp. 647–667
18. International Energy Agency (IEA), 2011. World Energy Outlook, OECD/IEA.
19. Havlik, P., 2010. "European Energy Security in View of Russian Economic and
Integration Prospects," wiiw Research Reports 362, The Vienna Institute for
International Economic Studies, wiiw.
20. Hubert, F., Ikonnikova, S., 2011. Investment Options and Bargaining Power:
The Eurasian Supply Chain for Natural Gas, The Journal of Industrial Economics, Vol.
59, No. 1, pp. 85-116
21. Hubert, F., Suleymanova, I., 2008. Strategic Investment in International Gas-
Transport Systems: A Dynamic Analysis of the Hold-Up Problem, DIW Discussion
Paper 846
22. Le Coq, C., Paltseva, E., 2009. Measuring the security of external energy supply
in the European Union, Energy Policy, Elsevier, vol. 37(11)
23. Le Coq, C., Paltseva, E., 2012. "Assessing Gas Transit Risks: Russia vs. the EU"
Energy Policy, Elsevier, forthcoming
24. Economic Expert Group by the Ministry of Finance of Russian Federation,
2012. Overview of economic indicators.

28
25. Noël, P., 2008. Beyond dependence: How to deal with Russian gas, European
Council on Foreign Relations Brief, http://ecfr.eu/page/-/documents/Russia-gas-policy-
brief.pdf
26. Noël, P., 2009. A Market Between us: Reducing the Political Cost of Europe’s
Dependence on Russian Gas, EPRG Working Paper 0916, Electricity Policy Research
Group, University of Cambridge
27. Noël, P., 2010. Ensuring success for the EU Regulation on gas supply security,
Electricity Policy Research Group, University of Cambridge
28. The PRS (Political Risk Services) Group, http://www.prsgroup.com
29. RosBusinessConsulting, www.rbc.ru
30. Sovacool, B.K., Mukherjee, I., 2011. Conceptualizing and measuring energy
security: A synthesized approach, Energy, v.36
31. Stern J. (2006), Is Russia a threat to energy supplies?, Oxford institute for
Energy Studies, August 2006, p. 3-4.
32. Wingas, www.wingas.de
33. Van der Linde, C., Amineh, M. P., Correlje ́ A., de Jong, D., 2004. Study on
Energy Supply Security and Geopolitics, CIEP Report, Clingendael International
Energy Programme, The Hague.

29
Appendix A.1. Gas transit routes between Russia and the EU
Route Transit country
Entry node at the EU
border
Countries served by the route
1 Ukraine Velke Kapušany
Slovakia, Czech Republic, Austria, Germany, Slovenia, Hungary, France, Belgium, Netherlands, Italy
2 Ukraine Beregovo Hungary
3 Ukraine Tekovo Romania
4 Ukraine Isaccea Moldova, Romania, Bulgaria, Greece
5 Belarus Kondratki Poland, Germany, Belgium, Netherlands
6 Belarus Kotlovka Lithuania, Latvia
7 - Korneti Latvia, Lithuania
8 - Imatra Finland
9 - Värska Estonia
10 (Nord Stream)
- Greifswald Germany, Belgium, France, Netherlands, Czech Republic
11
(South Stream)
- Varna Bulgaria, Greece, Italy, Hungary, Austria, Slovenia
Table A.1
Appendix A.2. Components of Demand Dependency Index
• is the set of transit routes from Russia to its gas trade partners
in the EU, with indexing individual routes in this set,
• i iGasExpShare Exp Exp= , where Expi is the export of gas from Russia to the
EU through route i, and Exp is the total amount of Russian gas exports to the EU,
• PolRiski is a measure of political instability along the transit route. We assume
Transit Routes
i Routes∈

30
here that the political risk associated with the recipient EU countries is negligible, so
PolRiski simply captures instability in the transit country (ies);
• TechFailurei is given by the length of the pipeline multiplied by the
probability of a rupture per km within a considered period of time.
• * 1c c
ci ii c
c i i
Exp ExpRouteDep SGasExp Cons∈
⎡ ⎤⎛ ⎞= −⎢ ⎥⎜ ⎟
⎝ ⎠⎣ ⎦∑ is given by the weighted sum of
proxies for (the inverse of) Russian gas market power in country c served by route i,
calculated as one less the share of Russian gas in total gas consumption of country c
multiplied by the share of gas in the energy bundle of country c. The weights are
given by the share of Russian gas exports to country c through route i in total Russian
gas exports through route i. Countries with low market power of Russia along the
considered route increase its .
• 1/ 2 2i iBP MS= − , where MSi is the share of Russian gas exports through
route i in total Russian gas exports to the EU. In a hypothetical situation of a single
seller (Russia) and a single perfectly coordinated buyer (the EU) the bargaining power
would likely be split evenly. Our measure considers the deviation of the bargaining
power of countries served by route i vs. Russia from this hypothetical threshold.
Higher values of BPi imply lower bargaining power of the EU (and higher bargaining
power of Russia) along a route and, as a result less dependency of Russia on the EU.
• new routes new route no new routesEU EU EURussianGasExportValue ExpValue ExpValueΔ = −
represents the change in the value of Russian gas exports to the EU from the
introduction of a new route. For example, a decrease in exports in absence of any
price change results in negative new routesEURussianGasExportValueΔ .
iRouteDep

31
Appendix A.3. Scenario assumptions
In this appendix we provide a short summary of the assumptions used in the scenario
analysis to predict the volumes of Russian and non-Russian gas imports in 2020.
1. The total amount of 2020 gas imports by Member State i is given by the projection
of European Commission (2010) and does not change across scenarios or with new
route capacity usage.
2. In addition to the above, “South Stream” and “Nabucco” scenarios use the following
common set of assumptions:
a. The share of Russian gas in total imports of Member State i in absence of any
new route/new source of gas (that is, with zero capacity usage of either South
Stream or Nabucco) is the same as in the most recent available data year, 2010.
This assumption allows to project the volume of Russian gas imports in 2020 for
each EU Member State.
b. As the total gas imports of Member State i are assumed to be constant, a gas
inflow through a new route (i.e., South Stream or Nabucco) should crowd out
the same volume of gas from other sources. We assume that Russian/non-
Russian gas imports are crowded out proportionally to their import shares.
For example, assume that in absence of any new routes the gas import portfolio of Member State i consists of 80 percent of Russian gas and 20 percent of gas from other suppliers. Then ten extra units of Russian gas received through South Stream would imply an eight unit decrease in Russian gas imports through other pipelines, and a two unit decrease in non-‐Russian gas imports. Thereby, the net effect of this extra gas via South Stream on Member State i will be an increase in Russian gas imports by 10-‐8=2 unit met by same size decrease of gas imports from non-‐Russian sources. Similarly, ten units of non-‐Russian gas received through Nabucco will imply a decrease in Russian gas imports by eight units, and a net increase in non-‐Russian gas imports by 10-‐2=8 units.

32
c. The volume of gas sent via a new route (under different capacity levels) is
allocated between the recipient Member States proportionally to their total gas
imports.
3. The assumptions for the “South Stream + LNG” scenario are similar to the ones for
the previous two scenarios, but require an additional step. Recall that this scenario
studies the change of dependency indexes with the capacity of South Stream
assuming a certain share x of LNG in the total gas imports. This is taken into
account through the following set of assumptions
a. The gas import portfolio in 2020 with zero South Stream use is calculated as
follows: Total gas imports are given, as above, by the projection of European
Commission (2010). Share x of them is assumed to be the (new) LNG imports.
The remaining (1-x) import share is divided between the gas imports from
Russia and other sources proportionally to their shares in the original (i.e., 2010)
import portfolio.
b. In turn, additional gas imports through South Stream crowd out other pipeline
gas imports (in exactly same way as described above in 2b); however, they do
not affect LNG imports, so that LNG import share stays equal to x.
The evaluation procedure, thereby, becomes two-‐stage: First, identify the
volumes of Russian and non-‐Russian pipeline gas imports assuming that LNG
constitutes share x of total imports and South Stream does not operate. Then vary
the capacity use of South Stream, and calculate new import shares taking into
account the crowding out effect South Stream imports have on the other pipeline
imports.
c. As above, the volume of gas sent via South Stream is allocated between the
recipient Member States proportionally to their gas imports.
d. Finally, the list of Member States assumed to receive part of their gas imports as
LNG excludes Romania and Bulgaria. This assumption is based on ENTSOG

33
Ten-Year Network Development Plan (2011), which indicated that only for
these two Member States no investment decision on the LNG terminals has been
made.