the evaluation of drug regulation - tipharma.com · psur periodic safety update report qaly ......
TRANSCRIPT


The Evaluation of Drug Regulation -
Economic approaches into the valuation and evaluation of
the drug regulatory framework
Jacoline Bouvy

The evaluation of drug regulation – Economic approaches into the valuation and
evaluation of the drug regulatory framework
Bouvy, JC.
ISBN 000000
Author Jacoline Bouvy
Cover photo Bigstock.com
Printed by Drukkerij Mostert en Van Onderen!

The evaluation of drug regulation
–
Economic approaches into the valuation and evaluation of
the drug regulatory framework
Evaluatie van geneesmiddelenregulering – Economische toepassingen in de
waardering en evaluatie van het regulatoire geneesmiddelensysteem
(met een samenvatting in het Nederlands)
Proefschrift
ter verkrijging van de graad van doctor aan de Universiteit Utrecht op gezag van de
rector magnificus, prof.dr. G.J. van der Zwaan, ingevolge het besluit van het college
voor promoties in het openbaar te verdedigen op woensdag 23 januari 2013 des
middags te 12.45 uur
door
Jacoline Catharina Bouvy
geboren op 27 maart 1985 te Rotterdam

Promotor: Prof. dr. H. Schellekens
Co-promotor: Dr. M.A. Koopmanschap
The studies presented in this thesis were performed in the context of the Escher project (T6-
202), a project of the Dutch Top Institute Pharma.

‘It is our choices, Harry, that show what we truly are, far more than our abilities.’
Albus Dumbledore (In J.K. Rowling’s Harry Potter and the Chamber of Secrets)

Glossary
ADR Adverse drug reaction
CBG-MEB Dutch Medicines Evaluation Board
CKD Chronic Kidney Disease
DCE Discrete Choice Experiment
DHPC Direct Healthcare Professional Communication
ECG Electrocardiograph
EMA European Medicines Agency
EPAR European Public Assessment Report
FDA Food and Drug Administration
HRQL Health-related quality of life
HTA Health Technology Assessment
ICER Incremental cost-effectiveness ratio
ICH International Conference on Harmonisation
IAT Intra-arterial thrombolysis
IVT Intravenous thrombolysis
MAH Market Authorization Holder
mRS modified Rankin Scale
NMB Net Monetary Benefit
PASS Post-Authorization Safety Study
PRCA Pure Red Cell Aplasia
PSA Probabilistic sensitivity analysis
PSUR Periodic Safety Update Report
QALY Quality-adjusted life year
QTc QT interval corrected for heart rate
R&D Research and Development
rhBMP-2 recombinant human bone morphogenetic protein-2
RMP Risk Management Plan
rTPA recombinant plasminogen activator
SCD Sudden cardiac death
sICH Symptomatic intracranial hemorrhage
TdP Torsade de pointes
TQT study Thorough QT/QTc study
VF Ventricular fibrillation
WTP Willingness to pay

Contents 1 General introduction 9
2 Willingness to pay for adverse drug event regulatory actions 15
3 Trading off benefits and risks: Eliciting preferences for pharmaceuticals
using a discrete choice experiment 47
4 Value for money of drug regulation 71
5 The cost-utility of four endovascular treatment strategies
for acute ischemic stroke 77
6 The cost-effectiveness of drug regulation:
the example of thorough QT/QTc studies 99
7 The cost-effectiveness of Periodic Safety Update Reports (PSURs)
for biologicals 125
8 General Discussion 161
Summary 174
Samenvatting 179
Acknowledgments / Dankwoord 183
Curriculum Vitae 187


Chapter 1 General Introduction

Chapter 1
10
Regulation of the pharmaceutical market
The pharmaceutical market in Europe is strictly regulated. A pharmaceutical product has to
demonstrate sufficient levels of quality, safety, and efficacy before it is allowed to enter the
European market. The safety profile of a pharmaceutical, however, is usually incomplete at
market entry.[1] Therefore, a comprehensive pharmacovigilance system exists, intended to
monitor a product’s safety (and sometimes efficacy) throughout its life cycle. If new safety
issues are identified through post-marketing surveillance, the benefit-risk profile of a product
will be re-evaluated. Drug regulation has two aims: first, to protect public health by keeping
low-quality, unsafe, or inefficacious products from entering the market, and second, to
promote public health by ensuring needed drugs reach patients without unnecessary delay.[2]
These aims, however, are potentially conflicting. If regulatory requirements are not strict and
rigorous, dangerous products might not be recognized as such, enter the market, and harm
patients. Conversely, if regulatory requirements are too stringent, potentially needed drugs
might no longer reach the market. This occurs when the costs of compliance with regulatory
requirements outweigh potential profits and thus create a disincentive to develop new drugs
or when stringent regulatory requirements hinder efficacious drugs with acceptable or
manageable risks from entering the market.
The development of new regulatory requirements is often prompted by the identification of
novel safety issues. Thalidomide, which was highly used as a sleeping pill and morning-
sickness treatment in pregnant women during the 1950s and 1960s, caused an estimated
10,000 birth defects worldwide[3] before it was removed from the market and directly
resulted in the implementation of efficacy requirements for pharmaceuticals in 1962.[4] More
recently, the 2006 TeGenero scandal, in which six healthy volunteers developed life-
threatening symptoms during a first-in-man trial, led to adapted requirements for first-in-man
trials.[5] Also, guidelines for mandatory pre-clinical and clinical testing of a drug’s QT-
prolonging potential were implemented in 2005, in a response to a series of post-marketing
drug withdrawals due to QT-prolongation during the 1990s.[6] It seems, however, that
although regulatory requirements are often added to the regulatory framework, they are
hardly ever removed, even if removing certain requirements would not result in increased
drug safety risks.[7]
Strict regulatory requirements have resulted in a drug development process that is both
lengthier and more expensive than it was 30 years ago.[8,9] The usual patent life of a
pharmaceutical molecule is 20 years. A lengthier drug development process therefore leaves
a pharmaceutical company with a shorter time frame to earn back its investments before
patent expiration and the subsequent market entry of generic competitors. It could be

Introduction
11
argued, therefore, that adding regulatory requirements invokes additional development
costs and ultimately increases drug prices. Whether this is a desirable situation (assuming it
would result in safer and more effective drugs reaching the market) would be determined by
(i) the value society places upon drug safety and efficacy, (ii) the safety and efficacy levels
society is (un)willing to accept, and (iii) whether these regulatory requirements increase
public health in a cost-effective manner.
There is very little empirical evidence supporting the drug regulatory framework. We do not
know, either in general of for each drug separately, what level of drug safety is expected or
required.[10] At the moment, there is no information available supporting the idea that
pharmacovigilance activities improve public health in a cost-effective manner.[10] Even though
a comprehensive regulatory framework intended to protect and promote public health is in
place, we neither know its effectiveness nor its outcomes. Therefore, it needs to be
determined whether the drug regulatory framework has a measurable impact on preventable
drug harm in clinical practice.[10]
Health Technology Assessment
The rise in healthcare spending in most Western countries has urged governments to turn to
various policies aimed at controlling healthcare expenditures. Determining an efficient
allocation of scarce resources is becoming gradually more important, as every Euro a country
spends on healthcare cannot be spent elsewhere. Health Technology Assessment (HTA) is
used by governing bodies and decision-makers in several European countries to determine
whether new medical interventions provide value for money. The cost-effectiveness of a new
technology expresses the resources that are required to achieve increased public health (Box
1) and weighs both the incremental costs and benefits of a new technology against that for
an existing therapeutic option. Cost-effectiveness analysis is mostly used to inform
reimbursement decisions. The economic evaluation of medical technologies thus enables the
assessment of an efficient allocation of scarce resources.
The development of methods for the assessment of the cost-effectiveness of medical
technologies started in the 1970s.[11] Nowadays, HTA is predominantly used to assess the cost-
effectiveness of healthcare interventions. The preferred measurement of health gains is
through the quality-adjusted life year (QALY),[12] which combines the length of life lived with
the experienced health-related quality of life. Hence, one QALY can be interpreted as one
year of life lived in full health (Box 1). A particularly useful property of the QALY is that it
captures both gains from reduced morbidity and gains from reduced mortality in one single,
generic measure of health.[12] Consequently, it can be used as a measure in an economic

Chapter 1
12
evaluation of any intervention aimed at increasing health, regardless of the disease or health
issue in question, including drug regulatory measures.
Box 1. Example of the calculation of the incremental cost-effectiveness of a medical technology
Drug safety regulations have several features that are similar to medical interventions, most
notably, their aims being to increase public health. Furthermore, drug safety regulation will
most likely invoke implementation costs and might save costs by preventing healthcare
consumption and productivity losses through the prevention of adverse drug reactions. An
important distinction between drug safety regulation and medical interventions, however, is
the mechanism through which health gains are achieved. Medical interventions usually will
increase public health by improving the health of individual patients, whereas drug safety
regulation will increase health by preventing health losses due to adverse drug reactions in
individual patients. The drug regulatory framework is not only extensive but also expanding,
as illustrated by the implementation of a set of new pharmacovigilance legislations in Europe
in 2012.[13] However, no evidence currently is available that the drug regulatory framework
contributes to public health in a cost-effective manner, as the cost-effectiveness of drug
safety regulatory measures, as opposed to medical interventions, has not been studied.
Say a new drug is developed for the treatment of a certain disease. The current standard therapy for this
disease costs €500 per year (per patient) and results in a life expectancy of 70 years and an average health-
related quality of life of 0.6 for each patient with the disease. These patients fall ill, on average, at the age of
50.
The new drug will increase the length of life of these patients by one year and will improve the patients’
health-related quality of life to 0.8. The annual treatment costs of the new drug are €10,000.
The incremental cost-effectiveness of the new drug is calculated as follows:
Incremental costs:
The incremental costs per patients are €10,000 – €500 = €9,500.
Incremental effects:
The expected quality-adjusted life years (QALYs) per patient:
With the standard therapy: (70 - 50) * 0.6 = 12 QALYs
With the new drug: (71 - 50) * 0.8 = 16.8 QALYs.
The incremental health effects therefore are 16.8 - 12 = 4.8 QALYs per patients.
Incremental cost-effectiveness ratio (ICER):
The incremental cost-effectiveness ratio of the new drug versus the standard therapy is:
€9,500 / 4.8 = €1,979 per QALY gained.
The incremental cost-effectiveness ratio reflects the resources that are required to gain one QALY, if the
new drug were to be reimbursed.

Introduction
13
Objectives and scope of this thesis
Given the aims of the drug regulatory framework to protect and promote public health and
the probable impact of stringent regulatory requirements on drug development costs, the
objective of this thesis was the evaluation of the drug regulatory framework. The cost-
effectiveness of two safety-related drug regulatory measures was assessed. As the
application of HTA to the evaluation of drug regulation has never been systematically
performed, a cost-effectiveness analysis of a medical technology (endovascular treatment for
acute ischemic stroke) was performed to assess the similarities and differences between the
economic evaluation of healthcare technologies and drug regulatory measures. Furthermore,
to add to our understanding of how the weighing of benefits and safety risks of
pharmaceuticals (i.e. benefit-risk assessment) is applied within the drug regulatory
framework, a study that elicited benefit-risk preferences for pharmaceuticals was performed.
The societal valuation in monetary terms of safety-related regulatory actions was also
determined in a separate study.
Outline of this thesis
Chapter 2 of this thesis concerns the societal valuation of safety-related drug regulatory
actions and aimed to determine what the general public and patients are willing to pay to
reduce a specific drug safety risk. In Chapter 3, a discrete choice experiment regarding
benefit-risk assessment of pharmaceuticals is reported. Chapter 4 discusses the rationale for
the use of HTA in the evaluation of the drug regulatory framework. Chapter 5 is a cost-
effectiveness analysis of a medical technology which reports the cost-effectiveness of
endovascular treatment for acute ischemic stroke. Chapter 6* and Chapter 7* consist of two
regulatory cost-effectiveness analyses, in which HTA methods, as demonstrated in Chapter 5,
are applied to evaluate two different parts of the regulatory framework: the thorough
QT/QTc study (Chapter 6) and Periodic Safety Update Reports (Chapter 7). Chapter 8 is the
last chapter of this thesis and contains a general discussion of this thesis’ main findings.
* Chapter 6 and Chapter 7 have the following structure: Introduction, Results, Discussion, Methods due to Journal guidelines. The other chapters follow the standard structure (Introduction, Methods, Results, Discussion).

Chapter 1
14
References 1. Stricker BH, Psaty BM. Detection, verification, and quantification of adverse drug reactions. British
Medical Journal 2004;329:44-47.
2. Ratanawijitrasin S, Wondemagegnehu E. Effective drug regulation: A multicountry study. World
Health Organization, Geneva, Switzerland (2002).
3. Lary JM, Lyon KL, Erickson JD, Roberts HE, Moore CA. The return of thalidomide: can birth defects
be prevented? Drug Safety 1999;21(3):161-169.
4. Naci H, Cylus J, Vandoros S, Sato A, Perampaladas K. Raising the bar for market authorization of
new drugs. British Medical Journal 2012;344:e4261 doi: 10.1136/bmj.e4261.
5. Nada A, Somberg J. First-in-man (FIM) clinical trials post-TeGenero: a review of the impact of the
TeGenero trial on the design, conduct, and ethics of FIM trials. Am J Ther. 14, 594-604 (2007).
6. Shah RR. Can pharmacogenetics help rescue drugs withdrawn from the market?
Pharmacogenomics. 7, 889-908 (2006).
7. Scannell JW, Blanckley A, Boldon H, Warrington B. Diagnosing the decline in pharmaceutical R&D
efficiency. Nature Reviews Drug Discovery 2012;11:191-200.
8. Dickson M, Gagnon JP. Key factors in the rising cost of new drug discovery and development.
Nature Reviews Drug Discovery 2004;3:417-429.
9. Munos B. Lessons from 60 years of pharmaceutical innovation. Nature Reviews Drug Discovery
2009;8:959-968.
10. Edwards IR, Isah A. Pharmacovigilance and the null hypothesis. Do we do much for public health?
Drug Safety 2011;34(2):93-96.
11. Banta D, Jonsson E. History of HTA: Introduction. International Journal of Technology Assessment in
Health Care. 2009;25(Suppl 1):1-6.
12. Drummond MF, Sculpher MJ, Torrance GW, O’Brien BJ, Stoddart GL. Methods for the economic
evaluation of health care programmes. Third edition. Oxford University Press, Oxford, United
Kingdom 2005.

Chapter 2
Willingness to pay for adverse drug event
regulatory actions
JC Bouvy, J Weemers
H Schellekens
MA Koopmanschap
Published in:
Pharmacoeconomics 2011;29(11):963-975.

Chapter 2
16
Summary
Background: Regulatory requirements for the pharmaceutical industry have become
increasingly demanding with respect to the safety and effectiveness of drugs.
Objective: The objective of this study was to determine the willingness to pay (WTP), of both
the Dutch general public and dialysis patients, for regulatory requirements related to
reducing the risk of pure red cell aplasia (PRCA) associated with epoetin alpha use.
Methods: A survey was carried out in April 2009. The Dutch general public (n = 422) was
approached through a survey sampling agency. Patients (n = 112) were included through
several Dutch dialysis clinics because they are often treated with epoetin alpha and therefore
were expected to have a higher WTP than the general public. The survey aimed to determine
the WTP for reducing the risk of PRCA in epoetin alpha users from 4.5 to 0 per 10,000
patients per year, based on regulatory actions that have been taken by the European
Medicines Agency (EMA). WTP was determined via a payment scale and an open-ended
follow-up question. Patients were asked how much extra per year they would be willing to
pay for their basic healthcare insurance. We used two censored regression models to test the
association between WTP and a set of independent variables: a Tobit model with the stated
WTP as the dependent variable and an interval regression model with the interval between
the lower and upper bounds of the payment scale as the dependent variable.
Results: The patients’ mean WTP was significantly higher (€46.52) than that of the general
public (€24.40). The Tobit model showed significant associations (a = 0.05) with WTP for
dialysis patients, risk perception and respondents’ opinions on costs of healthcare. The
interval regression model showed significant associations with WTP for the same variables as
the Tobit model and for one additional variable (risk aversion). Income did not significantly
affect WTP. A scenario with a 10-fold larger risk reduction did not increase WTP significantly.
Conclusion: This study is, as far as we know, one of the first attempts to analyse the WTP for
drug regulation and should in future be used in studies of the societal costs of drug
regulation for epoetin alpha use. Our results indicate that the Dutch general public, especially
Dutch dialysis patients, are willing to pay limited amounts to reduce the risk of serious
adverse events associated with drug use.

Willingness to pay for adverse drug event regulatory actions
17
Introduction
Regulatory requirements for the pharmaceutical industry have become increasingly
demanding with respect to the safety and efficacy of drugs.[1] They are aimed at both drugs
under development and marketed drugs[2,3] and are intended to protect the general public
against unsafe, ineffective and potentially harmful drugs. In a heavily regulated industry, with
increasing drug development costs,[4] it is important to determine the public value of new
regulatory requirements as a response to newly identified safety threats.
Regulatory requirements often lead to increased resource consumption in the drug
development process and their effectiveness is not always evident. Within the Dutch
healthcare system, these costs are eventually covered by citizens in the form of higher health
insurance premiums. In the development and implementation of these regulatory
requirements, cost effectiveness has thus far not been an issue. We performed a willingness
to pay (WTP) study to evaluate the Dutch public’s valuation of risk reduction measures. The
WTP method has primarily been used in healthcare research to elicit preferences for
individual treatment programmes and, to our knowledge, no WTP studies have focused on
regulatory safety measures in healthcare. By determining people’s valuation of a risk
reduction in healthcare, we tried to establish whether people are willing to pay for regulatory
safety measures. Furthermore, we wanted to analyse whether WTP is a feasible approach for
the evaluation of drug risk reduction measures and what the public valuation of these
measures is in monetary terms. A survey was designed to obtain the WTP for a drug risk
reduction measure. We also measured several personal values and attitudes to test their
relationship with WTP.
Methods
The drug risk reduction measure considered for this study reduces the risk of a serious
adverse event known as pure red cell aplasia (PRCA), which has been associated with
subcutaneous use of human recombinant erythropoietin alpha (epoetin alpha).[5] Epoetin
alpha is often prescribed to patients with chronic kidney disease (CKD) who experience
chronic renal insufficiency and who undergo dialysis treatment. PRCA is a rare condition
defined as severe anaemia secondary to the virtual absence of red cell precursors in the bone
marrow.[6] The implications of PRCA are severe: patients need blood transfusions to survive,
and long-term blood transfusions also have major adverse effects.[7] Prior to 1998, hardly any
cases of PRCA had been associated with epoetin alpha use. Between 1998 and 2002, the
incidence of PRCA increased after a formulation change, reaching a maximum of

Chapter 2
18
approximately 4.5 per 10,000 patients per year in Europe.[8,9] Regulatory safety measures
were implemented to ensure appropriate storage, handling and administration (intravenous
rather than subcutaneous injection was indicated for CKD patients) and PRCA incidence
decreased to approximately baseline level after 2004 (0.02 per 10,000 per year).[6-8]
Dutch Healthcare System
The Dutch healthcare system is partially financed through mandatory health insurance
premiums (about €1,100 per year per person aged >18 years).[10] Annual premiums differ
slightly between health insurance providers, which are mandated to accept all people who
wish to be insured by that provider, and premium differentiation among insurees is not
allowed.[10] Furthermore, the healthcare system is financed through income taxes (maximum
of 7.05% of income).[11] Individuals with low incomes receive an income-dependent healthcare
allowance, which is capped at €735 per year for the lowest incomes.[11]
Survey
In April 2009, a survey was used to query two comparative populations: the general public
and dialysis patients in the Netherlands. Dialysis patients are at higher risk of developing
PRCA and are therefore expected to have a higher WTP. Not all dialysis patients use epoetin
alpha and the drug is also prescribed to non-dialysis patients who are anaemic. However,
most dialysis patients do use the drug and have experience with anaemia. Furthermore,
dialysis patients are relatively easy to access as they visit a dialysis clinic approximately three
times a week to undergo dialysis. Patients in five dialysis clinics in five different regions of the
Netherlands were asked to complete the questionnaire during their attendance at the clinic
or to hand in the survey at their next visit. Eligible participants were required to be
sufficiently fluent in Dutch and mentally and physically able to complete the questionnaire as
judged by the attending doctor or nurse. Approximately 50% of all patients (n = 396) were
excluded. The remaining 199 patients approached resulted in 112 respondents (56% response
rate). Patients dialyzing at home (n = 127) were sent a questionnaire by mail. The Dutch
general public was reached through a survey sampling agency (Survey Sampling International
[SSI], Rotterdam, the Netherlands) that randomly approached sample (n = 422) from their
online survey population stratified for age and sex (response rate 100%).
Two pilot studies were conducted; the first involved 56 respondents from various
educational levels and income classes – 19 of whom were patients. All comments were
analysed and the survey was adjusted for clarity. In the second pilot study, the final WTP
format was tested on an additional group of five people. The first pilot study showed that
some respondents had difficulty understanding some questions and descriptions of risks so

Willingness to pay for adverse drug event regulatory actions
19
we simplified the questions and descriptions. In particular, questions 17 and 18 – concerning
risk aversion – were judged too difficult (Appendix 2.A). These were originally three
questions, based on Barsky et al.,[12] about whether the respondent would accept a new,
similar job with a 50% probability of a 2-fold increase in income if combined with a 50%
probability of a loss in income of (i) one-third, (ii) 50% and (iii) 20%. Although this instrument
has been tested several times,[12,13] the pilot study indicated that it was too complicated. We
thus simplified the questions and limited the instrument to two questions.
Two versions of the questionnaire were allocated: the first presented an estimated risk
reduction due to safety measures from 4.5 to 0 per 10,000 patients as based on the
literature;[6,8,9] the second presented a 10-fold greater risk reduction (from 45 to 0 per 10,000
patients) to see whether the magnitude of risk reduction affected WTP.
No consensus exists on the best WTP format or the applicability of the contingent valuation
method in healthcare. The four most widely used techniques are open-ended questions,
bidding games, payment cards and closed-ended questions.[14] Building on the literature,[15,16]
the format we used was a payment scale with an open follow-up question (Appendix 2.A).
Respondents were first asked to indicate the highest amount per year they were definitely
willing to pay and the lowest amount per year they were definitely not willing to pay in
addition to their current health insurance premium. The subsequent open-ended question
asked respondents to indicate their specific WTP. We used the minimum and maximum
amounts specified to give respondents upper and lower reference points when indicating
their specific WTP. Those indicating a WTP of €0 were asked to explain their response so we
could differentiate between ‘actual’ and ‘protest’ responses. Respondents were also asked
to indicate their confidence in their response. Indication of the confidence in response has
been shown to increase the explanatory power of the determining variables.[17-19]
The first two questions introduced the respondents to the format of the WTP question and
the valuation of risk reductions in general. They presented reduction scenarios for familiar
risks such as motor vehicle accidents and influenza. The subject of the survey was then
introduced. The scenario description consisted of the indication of the drug, the population
at risk and the actual risk of the serious adverse event. To avoid information bias and
cognitive overload,[20] the explanation of the risk and the risk reduction was kept to a
minimum of relevant information and no scientific terms were used. The name of the drug
was not mentioned.
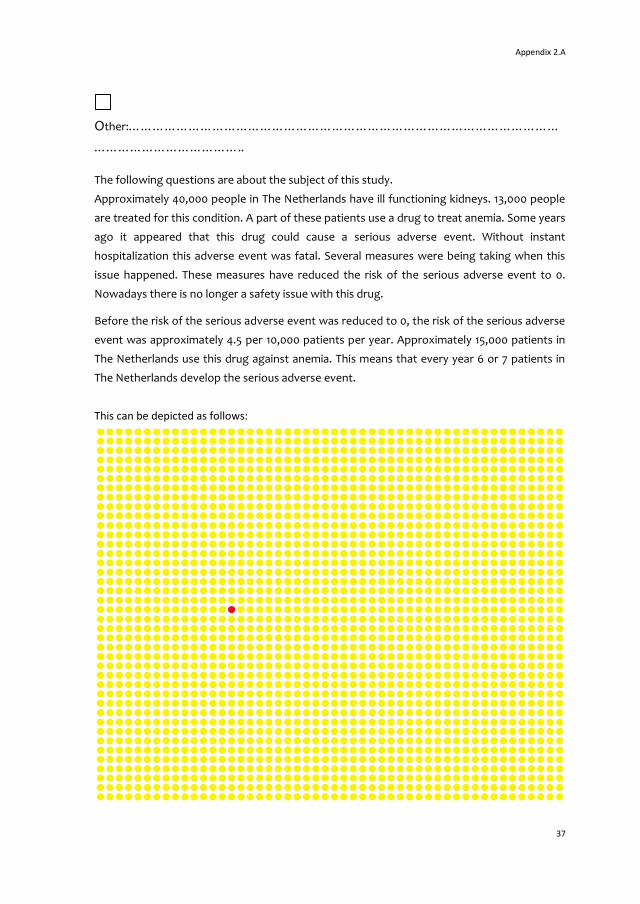
Several studies have stressed the importance of risk representation and the different forms
thereof.[18,20,21] In our scheme, the incidence of the drug-associated PRCA was first presented,
followed by the incidence of all types of PRCA per year in the Netherlands. In addition, a
visual representation of the risk was used: a square field with 1999 yellow dots and one red
Chapter 2
20
dot (nine red dots were used in the 10-fold risk representation). After the risk representation,
we explained that the safety measures decreased the risk of the serious adverse event to
zero and the serious adverse event was described as fatal if not treated. Subsequent
questions asked respondents to relate the risk to more familiar ones such as traffic accidents.
Respondents were also asked to indicate their respective interpretations of the magnitude of
the risk and risk reduction not in relation to any other risk.
The respondents’ health-related quality of life (HRQL) was measured using the EQ-5D and the
Dutch general public’s valuation was assigned to the self-reported HRQL-score.[22]
Respondents in good health were expected to have a lower WTP because they will perceive
the probability of having to use the drug as lower than those in worse health states.
Personal Values and Attitudes
Risk reduction of epoetin alpha-induced PRCA associated with the regulatory-issued
formulation change is considered a public good because the drug risk reduction measures
apply to all potential consumers of the drug and no consumer of the drug can be excluded
from the measures. We hypothesized that WTP for a public good is at least partially based on
values and attitudes and therefore investigated their influence in our study. Four sets of
statements designed to measure values and attitudes were included: collectivism versus
individualism (questions 11 and 12), uncertainty avoidance (questions 13 and 14), long-term
orientation (questions 15 and 16) and risk aversion (questions 17 and 18) [Appendix 2.A]. The
first three sets were based on the study by Hofstede and Hofstede[23] of cultural differences
across 70 nations. Respondents were asked to indicate whether they disagreed or agreed
with the statement using a five-point Likert scale. We expected a higher WTP in three types
of respondents: the more collectively minded, the more uncertainty avoidant and the more
long-term oriented.
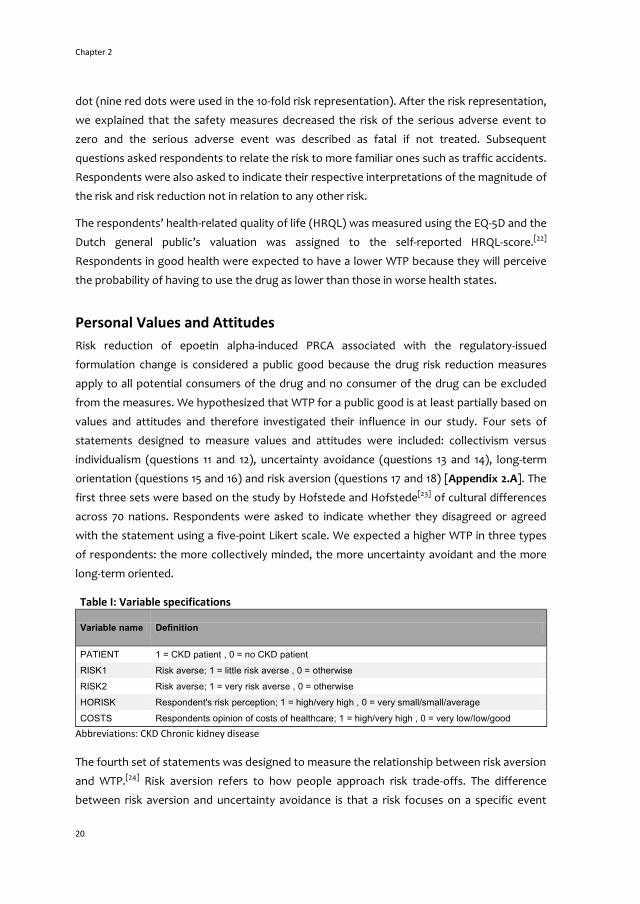
Table I: Variable specifications
Variable name Definition
PATIENT 1 = CKD patient , 0 = no CKD patient
RISK1 Risk averse; 1 = little risk averse , 0 = otherwise
RISK2 Risk averse; 1 = very risk averse , 0 = otherwise
HORISK Respondent's risk perception; 1 = high/very high , 0 = very small/small/average
COSTS Respondents opinion of costs of healthcare; 1 = high/very high , 0 = very low/low/good
Abbreviations: CKD Chronic kidney disease
The fourth set of statements was designed to measure the relationship between risk aversion
and WTP.[24] Risk aversion refers to how people approach risk trade-offs. The difference
between risk aversion and uncertainty avoidance is that a risk focuses on a specific event

Willingness to pay for adverse drug event regulatory actions
21
(e.g. losing income) with an attached probability, while uncertainty is a diffuse feeling with
no exact probability attached. The instrument developed by Barsky et al.[12] was used to
measure risk aversion. As stated previously, the results of the pilot study led to a
simplification of this instrument.
Respondents were asked for their opinions on the cost and quality of the Dutch healthcare
system, as we expected those who perceived the quality of healthcare as good and the costs
as low to have a higher WTP than respondents with more negative opinions on healthcare
costs and quality. Respondents were asked if they or a next of kin had ever had a seriously
debilitating disease, or if they had ever been an informal caregiver for a person with a
seriously debilitating disease. They were also asked if they knew a person with anaemia or
were anaemic themselves. We expected respondents with experience (either themselves or
a next of kin) of such disease to have a different risk perception. Several socio-demographic
questions on age, sex, working status, education, income and marital status were also
included.
Analysis
The appropriate model to use for the analysis of WTP data elicited using an open-ended
question format is the Tobit model as the ordinary least squares (OLS) does not always lead
to consistent estimates in the case of non-negative dependent variables.[25] WTP data have a
lower limit of €0 and often yield a considerable number of ‘zero’ responses; 15% (81
respondents) in our study. If a respondent indicates a WTP of €0 for reasons other than the
true value of the subject at hand, it is considered a ‘protest zero’, a common problem in WTP
studies. Protest zeros can lead to biased results and it is important to differentiate them from
a true WTP of €0.
The Tobit model coefficients do not have a direct interpretation as effects of the co-variates
on the dependent variable. Unlike the OLS model, the Tobit is a censored regression model
and expresses the observed dependent variable y in terms of an underlying latent variable y*
(equations 1 and 2):[26]
(1)
(2)
where XB is a scalar of the values on X (the independent variables multiplied by the
appropriate Tobit coefficient B) and e is the Normally distributed error term. Tobin’s formula
for the expected value of the dependent variable for all cases (Ey) is as shown in equation 3:

Chapter 2
22
(3)
where XB is defined as in equation 1. F(y) is the cumulative Normal distribution function, f(y)
is the Normal density function, and σ is the standard deviation of the error term.[24] In other
words, the coefficients of the Tobit model are ‘corrected’ for the probability of being above
the €0 limit, given XB. Deriving Ey for a set of independent variables using the formula in
equation 3 is beyond the scope of this paper.
Furthermore, the payment scale data were analysed. Respondents may find it difficult to
provide a specific value of their WTP.[27] Therefore, we also used an interval data regression
model, another form of the censored regression model, which analyses the effect of
independent variables on the dependent variable that is constructed by the lower and upper
bounds of WTP, as measured by the payment scales (question 8, Appendix 2.A) preceding
the specific WTP question.
The variables included in the regression analyses are listed in Table I. Being a patient, risk
perception, opinion on the costs of healthcare and risk aversion were included as
independent variables in all models. The software package Stata/IC 11 was used for all
analyses.
Results
Respondents were allocated to complete a questionnaire with either a risk reduction of 4.5
to 0 per 10,000 patients per year (n = 289 [70 patients, 219 general public]) or of 45 to 0 per
10,000 patients per year (n = 245 [42 patients, 203 general public]). The total number of
respondents was 534, comprising 112 CKD patients and 422 non-patients randomly selected
from the Dutch general public.
To determine possible protest zeros, the 81 ‘zero’ respondents were asked for their
motivation; 46 gave a reason. We regarded ‘‘I cannot afford it’’ as a true zero response, and
‘‘it should be in the health insurance basket,’’ ‘‘the government should pay’’ and ‘‘the health
insurance company should pay’’ as protest zeros. The protest zeros were removed from the
dataset because the respondents might actually have a WTP > €0. The data from those 35
‘zero’ respondents who did not give a reason were retained because we assumed that those
who did not feel the need to explain their response were giving true WTP values of €0. Of the
46 explained zeros, 34 were protest zeros, eight of which were from CKD patients.

Willingness to pay for adverse drug event regulatory actions
23
Incomplete questionnaires (36 patients) and protest zero responses (8 patients, 26 non-
patients) reduced the sample for statistical analysis to 68 patients and 396 members of the
general public. Table II shows the sample characteristics for all respondents included in the
analysis.
The mean WTP for all respondents and for subgroups are shown in Table III. The reported
WTP is the mean of the stated value respondents indicated as their WTP after specifying their
upper and lower bounds on a payment scale. The overall sample WTP was €27.64 (n = 464).
Patients were willing to pay considerably more than the general public: the mean WTP for
patients was €46.52 as opposed to the general public’s h24.40 (p = 0.00, Mann-Whitney test).
Table II: Sample characteristics
Patients (N=68) General Public (N=396)
Age* 62(1.79) 41(0.66)
Sex(male)** 60 50
quality of life(EQ-5D)* 0.74(0.03) 0.86(0.01)
Higher education** 30 41
Risk perception high/very high** 20 12
Risk adverse** 63 69
Quality of health care good/very good** 85 62
Costs of health care high/very high** 59 78
Income brackets (Euros per month)**
€0 - €1,500 19 14
€1,500 - €2,000 15 9
€2,000 - €2,500 12 8
€2,500 - €3,000 0 13
€3,000 - €3,500 18 9
€3,500 - €4,000 7 6
€4,000 - €4,500 4 3
€4,500 - €5,000 6 4
more than €5,000 6 7
Does not want to say income/other 13 27
* mean (standard error) ** percentage
True zero WTP values were given by 10% of the patients and 12% of the general public. The
mean WTP for only the non-zero WTP observations was €31.21. The mean value of the lower
WTP bound was €16.98 and the mean value of the upper WTP bound was €34.09. The
standard deviation, median and 25th and 75th percentile for all WTP values are also reported
in table III.

Chapter 2
24
Tables IV and V show the results of the Tobit regression including marginal effects (the Tobit
coefficients do not have a direct interpretation as effects on the dependent variable) (Table
IV) and the interval data regression with the interval of the lower and upper bounds indicated
by the respondents as the dependent variable (Table V). Initially, a large number of co-
variates were included in both models. However, many of these variables did not reach
significance (a = 0.05). All variables that did not reach significance in these unlimited models
were excluded and the reported Tobit and interval data regression models only included
those variables that reached significance in one of the unlimited models. However, a table
with all definitions of the variables that were included in the unlimited models can be found
in Appendix 2.B.
Table III: Willingness to pay estimates
mean WTP
St. dev.
Med. 25-
perc. 75-
perc. %
WTP=0 P N
all respondents €27.64 45.89 €10.5 €5 €40 11 - 464
Only positive WTP €31.21 47.61 €15 €4 €70 - - 411
Patients €46.52 48.51 €35 €0 €100 10 0.00* 68
Non-patients €24.40 44.69 €10 €0 €60 12 0.00* 396
4.5 per 10,000a €24.92 36.38 €10 €0 €60 13 0.1847** 247
45 per 10,000b €30.74 54.67 €15 €1 €75 10 0.1847** 217
Payment scale lower bound
€16.98 23.04 €5 €0 €50 - - 448c
Payment scale upper bound
€34.09 32.03 €20 €5 €100 - - 394d
a. Risk in questionnaire: PRCA incidence 4.5 per 10,000 patients per year. b. Risk in questionnaire: PRCA incidence 45 per 10,000 patients per year. c. Lower than overall sample size due to missing values (not all respondents indicated minimum WTP) d. Lower than overall sample size due to missing values (not all respondents indicated maximum WTP). *Mann-Whitney test for difference in means of patients and non-patients **Mann-Whitney test for difference in means of respondents with incidence of 4.5 per 10,000 patients per year and respondents with incidence 45 per 10,000 patients per year
In the Tobit model, being a patient was significantly associated with higher WTP (t-value =
2.65). Respondents who perceived the risk of PRCA as ‘high’ or ‘very high’ had a higher WTP
than those perceiving the risk as ‘very low’ to ‘average’ (see HORISK variable, t-value = 4.01).
Respondents who perceived the costs of Dutch healthcare as ‘high’ or ‘very high’ had a lower
WTP than those perceiving otherwise (t-value=-3.46). The personal value and attitude
variables did not explain respondents’ WTP in this model; i.e. they were not significant and
were therefore not included in the final Tobit model.

Willingness to pay for adverse drug event regulatory actions
25
Table IV also reports the results of the marginal effects of the Tobit model. The Tobit model
has three conditional means providing different marginal effects: (i) the marginal effect on
the probability that the dependent variable is greater than zero; (ii) the marginal effect on
the expected value (mean) of the dependent variable conditional on being greater than zero;
and (iii) the marginal effect for the expected value of the dependent variable unconditional
on being uncensored. The first marginal effects model (i) gives the marginal effects of each
variable on the probability of being greater than zero, their standard errors and z-values.
Being a dialysis patient resulted in a 12% higher probability of a WTP above zero. When the
PRCA risk was perceived as high, the probability of a positive WTP increased by 17%.
Conversely, when healthcare costs were perceived as high, the probability of a WTP of zero
was increased by 13%.
The second marginal effects model (ii) provides the marginal effects for the WTP
observations above zero, their standard errors and z-values. The marginal effects are all
considerably smaller than the Tobit coefficients, as they result from scaling the coefficients
by an adjustment factor between zero and one.[28] Furthermore, the marginal effects for all
WTP observations (both zero and positive responses, marginal effects [iii]) are larger than
the marginal effects for the positive-only WTP observations. The predicted mean WTP
estimates for these models are larger than the mean WTP values reported in Table III.
The interval data regression model (Table V) included the same independent variables as the
Tobit model but its dependent variable was the interval within which respondents indicated
their WTP fell (payment scale). All variables that reached significance in the Tobit model
(PATIENT, HORISK, COSTS) were also significantly associated with the dependent variable in
the interval model. Two additional variables reach significance in the interval model: RISK1 (z-
value=-1.99) and RISK2 (z-value=-3.07). These dummy variables (Table I) represent the
respondents’ risk aversion. However, the sign of the coefficients of RISK1 and RISK2 indicate
that being more risk averse was associated with a lower WTP (see the Discussion section).
The predicted mean WTP value of the interval regression model was €27.48. This value was
very close to the mean WTP value of the sample (€27.64). This indicates that analysis of the
payment scale yields results similar to the sample mean of the stated WTP values.
We did not analyse the effect of subgroup-specific (subgroup defined by being a patient or
not being a patient) variables we measured in the questionnaire. The patient sample was
small for sub-analysis and we limited the analysis to one model including the entire sample.

Ch
apter 2
26
Table IV: Tobit Model
Marginal Effectsa Marginal Effects
b Marginal Effects
c
Variable Coef. std. error
t-value
dy/dx std. error
z-value
dy/dx std. error
z-value
dy/dx Std. error
z-value
CONSTANT 41.96 7.52 5.58
PATIENT 16.92 6.39 2.65 0.12 0.04 2.88 8.87 3.59 2.47 12.46 4.97 2.51
HORISK 26.20 6.53 4.01 0.17 0.04 4.67 14.31 3.97 3.60 19.88 5.34 3.72
COSTS -18.04 5.21 -3.46 -0.13 0.03 -3.67 -9.30 2.84 -3.28 -13.10 3.94 -3.32
RISK1 -7.88 8.02 -0.98 -0.06 0.06 -0.96 -3.74 3.70 -1.01 -5.33 5.27 -1.01
RISK2 -13.02 6.71 -1.94 -0.09 0.05 -2.00 -6.55 3.47 -1.88 -9.26 4.88 -1.90
Sigma 47.32 1.67
53 left-censored observations at truezeros<=0
411 uncensored observations
0 right-censored observations
N 464
LR chi2(11) 43.17
Prob > chi2 0.00
Log likelihood -2215.20
Pseudo R2 0.01
Dependent variable: stated willingness to pay (WTP). Please see table I for definitions of variables. Abbreviations: Dy/dx derivative of y; LR likelihood ratio a. Marginal effect for the probability of being greater than zero: y = Probability WTP > 0 = 0.69 b. Marginal effect for the expected value of the dependent variable conditional on being uncensored: y = Expected(WTP) | WTP > 0 = €47.97 c. Marginal effect for the expected value of the dependent variable unconditional on being uncensored: y = Expected(WTP) | 0 < WTP < maximum = €33.34

Willingness to pay for adverse drug event regulatory actions
27
Willin
gness to
pay fo
r adverse d
rug even
t regulato
ry action
s
Table V: Interval Regression Model
Variable Coefficient Std. Error z-value
CONSTANT 40.54 4.36 9.31
PATIENT 18.53 4.20 4.42
HORISK 9.40 3.78 2.49
COSTS -9.40 2.99 -3.15
RISK1 -9.21 4.62 -1.99
RISK2 -11.77 3.83 -3.07
Sigma 24.39 0.95
43 uncensored observations
61 right-censored observations
343 interval observations
N 447
LR chi2(11) 54.27
Prob > chi2 0.00
Log likelihood -936.94
Dependent variable: interval payment scale willingness to pay (upper bound - lower bound). Please see table I for variable specifications. Abbreviations: LR log-likelihood.
Discussion
This study was designed to measure the WTP of the Dutch general public and Dutch CKD
patients for the PRCA-related drug risk reduction regulatory requirement regarding epoetin
alpha. The mean WTP was €27.64. CKD patients were willing to pay considerably more than
the general public: €46.52 versus €24.40. Two censored regression models indicated that
being a patient, the perception of the risk presented to the respondent, the respondent’s
opinion on costs of healthcare and risk aversion were significantly associated with WTP.
Personal values and attitudes (individualism, collectivism, uncertainty avoidance and long-
and short-term orientation) were not significant in explaining WTP. Our results indicate that
WTP in this study was influenced by the respondent’s risk perception, but not by the actual
magnitude of the risk presented to them. This result is consistent with other research: WTP
has often been found to be under-sensitive to the magnitude of the benefit[29,30] and people
tend to have difficulties distinguishing between small probabilities or risks.[31] Furthermore,
the relationship between the magnitude of the risk reduction and the WTP is not always
proportional.[18] In sum, there is evidence of reasonable construct validity of our findings
compared with other studies.
The variables RISK1 and RISK2, intended to measure risk aversion, were significant (a = 0.05)
in the interval regression model. However, the sign of the coefficient for these two variables

Chapter 2
28
was negative (see Table I for specification of variables). This is contradictory to economic
theory as it implies that more risk averse respondents in our study have a lower WTP or
indicate a lower interval for their WTP. We hypothesized that respondents who were more
risk averse would be willing to pay more to reduce the risk. There are several possible
explanations for this finding. We simplified the instrument we included in our questionnaire
intended to measure risk aversion according to feedback from the pilot study: respondents
found the original three questions too difficult. It is possible that, despite limiting the
instrument to two questions, it was still misunderstood by respondents. The instrument we
used to measure risk aversion consisted of an income lottery. It is possible that risk aversion
as measured by an income lottery is not identical to risk attitudes towards health and drug-
related risks. Furthermore, the risk presented to respondents in the income lottery is much
larger than the risk that was the subject of the risk reduction measures. For risk averse
respondents, the disutility of a very small risk might be so low it does not yet start to affect
their WTP. Future WTP studies wishing to study the determinants of WTP might want to look
at other instruments measuring risk aversion.
As far as we know, this study is the first to investigate WTP for drug risk reduction measures.
A study by Werner and Vered[32] used the contingent valuation method to evaluate WTP for a
regulatory framework. However, the regulatory framework they studied concerned the
introduction of public funding for osteoporosis drugs in Israel. This makes it difficult to
compare their findings to our valuation of safety regulation.
Our results suggest that both patients at risk of a drug-induced serious adverse event and
members of the general public are willing to pay for measures to lower the risk of serious
adverse events from drugs. Only 12% of the general public were not willing to pay anything,
which indicates the mean WTP for these measures is higher than zero. However, we were
surprised by the relatively high mean WTP in members of the general public (€24.40) as most
of them will never have to use the drug at which the risk reduction measures were aimed. We
used the standard methodology: asking the WTP for one scenario. However, we suggest that
future WTP studies of drug risk reduction regulatory measures should explore more
scenarios (different types of regulation aimed at risk reduction) simultaneously, combined
with a budget restriction. This approach might more closely resemble realistic choice
situations and might reduce hypothetical bias.
The explanatory power of models in WTP studies in general is limited and therefore we
included additional variables intended to measure respondents’ personal values and
attitudes. However, none of these variables were statistically significant at the a = 0.05 level
and the overall explanatory power of our models remains rather low. This suggests that a
person’s WTP depends on (i) other (socioeconomic) factors that we did not measure; and/or
Willingness to pay for adverse drug event regulatory actions
29
Willin
gness to
pay fo
r adverse d
rug even
t regulato
ry action
s
(ii) a random factor. We feel that, because the explanatory power of WTP studies is usually
quite low, factors other than demographic variables, such as income, age and sex, should be
studied.
We used the Tobit regression model to analyse the relationship between WTP and the
independent variables included in our study. There is no consensus on the proper model that
should be used for the analysis of contingent valuation WTP data. However, a considerable
proportion (11%) of our data consisted of zero responses, even after removing protest zeros.
Therefore, an OLS model would have led to biased results and our use of the Tobit model was
appropriate. Furthermore, we analysed not only the specific WTP answers of our
respondents but also the lower and upper bounds of their WTP, which we asked them to
indicate using a payment scale. Both models produced similar results.
Income was not significantly associated with WTP in our model, which is consistent with
other research.[33,34] Several other studies, however, did not find this result.[24,35-39] There are
several possible explanations: the mean WTP (€27.64) is low compared with both the annual
health insurance premium (around €1,100 per person) and total household income.
Additionally, the income-dependent healthcare allowance (a low income implies a higher
allowance) could subdue the income effect. Finally, this study concerns the valuation of a
public good in a contingent setting. Free-rider behaviour, protest answers and altruistic
answers can occur in any income class, distorting the relationship between income and WTP.
We found the perception of healthcare costs in the Netherlands to be associated with WTP:
respondents who perceived the costs of healthcare (COSTS) as ‘high’ or ‘very high’ were
willing to pay less for the risk reduction. Upon testing for whether COSTS correlated with
income, we found that the relationship was very low (correlation coefficient=-0.03),
suggesting that the ‘true income effect’ is not measured by the COSTS variable.
We hypothesized that WTP would be influenced by the respondent’s HR-QOL as others have
found such a relationship.[33] The average HR-QOL of patients in our study was relatively high
(0.74) compared with the average HR-QOL of the general public (0.86), which could explain
the absence of an association between WTP and HR-QOL. The high HR-QOL of patients in our
study indicates that they were in relatively good health. However, since the variable PATIENT
was associated with higher WTP, it could potentially pick up the influence of health on WTP.
Risk perception was significantly associated with WTP in our study. This result is consistent
with other WTP studies.[24,38] Respondents are expected to show rational decision making
(i.e. a higher valuation of a higher risk reduction). However, the ability to show rational
decision making depends on a correct interpretation of the risk and the risk reduction. In our
case, the actual risks and risk reductions were interpreted differently between respondents.

Chapter 2
30
The correlation between these variables was 0.11, which indicates either no relation or a
mixed relation between the variables. The risk they were presented with (4.5 or 45 per 10 000
patients per year) did not significantly influence their WTP. However, the respondents’ risk
perception influenced how much they were willing to pay for the risk reduction. Respondents
were still behaving rationally; their interpretation of the risk rather than the actual risk
magnitude determined their WTP.
We intended to use a sample size of at least 600 (400 members of the general public and 200
patients). However, it was difficult to collect enough patient questionnaires: we originally
approached 396 patients. Their eligibility to participate had to be assessed by either a doctor
or a nurse. We used questionnaires that patients had to complete on paper. Incomplete
questionnaires eventually led to a total of 76 patient observations. Due to protest zeros we
were able to use 68 patient observations in our analyses. Ideally, studies using a sample from
a patient population as well as the general public should try to collect a sufficient sample size.
We designed the questionnaire to prevent several forms of bias but the contingent valuation
method is known to be subject to some that are impossible to eliminate when performing a
WTP study. We could not eliminate hypothetical bias, despite the emphasis that was put on
the scenario description and the risk representation.[40-42] Selection bias might have occurred
as a result of using a survey sampling agency. While the agency specializes in providing
samples representative of the Dutch population, its population is limited to internet users.
The patients’ eligibility was assessed by the attending doctor or nurse and those judged to be
unable did not participate in the study. Approximately 50% of all patients at the clinics were
excluded for this reason. Because patients in worse health states might have had a higher
WTP for the risk reduction, eliminating this cohort from the study could have biased the
results. That notwithstanding, our results indicated that patients have a higher WTP than the
general public.
We asked respondents to indicate their confidence in their response after they had stated
their WTP (question 9, Appendix 2.A). There was no relationship between WTP and
confidence in response (correlation coefficient 0.01). However, confidence in response was
correlated with a WTP of €0 (correlation coefficient 0.41). This indicates respondents who
have a WTP of €0 are more confident about their WTP, which is consistent with results found
by others.[43,44]
Future research should focus on the representation and perception of risks. We have shown
that, even though the risk is represented in different ways, respondents interpret risks
differently. Our results show that the respondent’s perception of the risk determines their
WTP more than the actual risk presented to them. Having the risk perception approach the
actual risk would lead to a more reliable WTP estimate and could prevent hypothetical bias.
Willingness to pay for adverse drug event regulatory actions
31
Willin
gness to
pay fo
r adverse d
rug even
t regulato
ry action
s
An instrument that is able to make respondents better understand and perceive risks should
be developed.
Our study provides some indication of the existence of altruistic values in the case of drug
adverse event risk reduction measures. Altruistic values in healthcare can be compared to
existence values found in the environmental sciences (values for the existence rather than
the use of an environmental resource),[45] which have been shown to influence WTP.[46]
Individuals may derive utility from seeing another person receiving healthcare[47,48] or, in our
study, a person might derive utility from knowing that others are protected against a risk
they themselves most likely will never face. The number of zero responses, even when
‘protest zeros’ are included, was only 15%, meaning that most members of the general public
are willing to pay to have the risk of PRCA in epoetin alpha users reduced to zero, even
though they are unlikely to be ever faced with this risk. Altruism in healthcare has been
described by others.[45,49-51] When evaluating drug risk reduction measures, researchers
should take into account that altruistic values might influence WTP.
Conclusion
Our study is, as far as we know, the first study to provide empirical evidence for the public
valuation of drug adverse event regulatory actions intended to improve the safety of drugs.
People are willing to pay for these measures but the amount they are willing to pay is limited.
Therefore, the results of our study should be confronted with the societal costs of risk
reduction regulatory actions.

Chapter 2
32
References 1. Kola I. The state of innovation in drug development. Clin Pharmacol Ther 2008;83(2): 227-230.
2. Lasser KE, Allen PD, Woolhandler SJ, et al. Timing of new black box warnings and withdrawals for
prescription medications. JAMA 2002;287(17):2215-2220.
3. European Medicines Agency. CPMP Position statement on Creutzfeldt-Jakob disease and plasma-
derived and urine-derived medicinal products. 2003, London. Available from URL:
http://www.ema.europa.eu/htms/human/humanguidelines/biologicals.htm. [Accessed 2010 Jan 19].
4. DiMasi J, Hansen RW, Grabowski HG. The price of innovation: new estimates of drug development
costs. J Health Econ 2003;22: 151-185.
5. Casadevall N, Nataf J, Viron B, et al. Pure red-cell aplasia and antierythropoietin antibodies in
patients treated with recombinant erythropoietin. New Engl J Med 2002;346(7): 469-475.
6. Schellekens H. Immunologic mechanisms of EPO-associated pure red cell aplasia. Best Pract Res Cl
Ha 2005;18(3): 473-480.
7. Macdougall I. Antibody-mediated pure red cell aplasia (PRCA): epidemiology, immunogenicity and
risks. Nephrol Dial Transpl 2005;20(suppl 4): iv9-iv15.
8. Bennet C, Luminari S, Nissenson AR, et al. Pure Red-Cell Aplasia and Epoetin Therapy. New Engl J
Med 2004;351: 1403-1408.
9. Boven K, Stryker S, Knight J, et al. The increased incidence of pure red cell aplasia with an Epoetin
alpha formulation in uncoated rubber stopper syringes. Kidney Int 2005;67: 2346-2353.
10. van de Ven WPMM, Schut FT. Universal mandatory health insurance in the Netherlands: a model for
the United States? Health Affair 2008;27(3):771-881.
11. Belastingdienst. Hoe hoog is de inkomensafhankelijke bijdrage voor de Zorgverzekeringswet?
[Online] Available from URL:http://www.rijksoverheid.nl/documenten-en-publicaties/vragen-en-
antwoorden/hoe-hoog-is-de-inkomensafhankelijke-bijdrage-voor-de-zorgverzekeringswet.html
[Accessed 2010 June 23]
12. Barsky RB, Juster FT, Kimball MS, et al. Preference Parameters and Behavioral Heterogeneity: An
Experimental Approach in the Health and Retirement Study* Q J Econ 1997;112(2): 537.
13. Dave D, Saffer H. Alcohol demand and risk preference. J Econ Psychol 2008;29(6): 810-831.
14. Ryan M, Ratcliffe J, Tucker J. Using Willingness to Pay to value alternative models of antenatal care.
Social Science and Medicine 1997;44(3): 371-380.
15. Donaldson C, Shackley P, Abdalla M. Using Willingness To Pay To Value Close Substitutes: Carrier
Screening for Cystic Fibrosis Revisited. Health Econ 1998;6(2): 145-159.
16. Gyldmark M, Morrison G. Demand for heath care in Denmark: results of a national sample survey
using contingent valuation. Soc Sci Med 2001;53: 1023-1036.
17. Johannesson M, Johansson PO, Bengt K, et al. Willingness to pay for antihypertensive therapy --
further results. J Health Econ 1993;12(1): 95-108.
18. Hammitt J, Graham J. WTP for health protection: Inadequate sensitivity to probability?" J Risk
Uncertainty 1999;8: 33-62.
19. Nocera S, Bonato D, Telser H. The Contingency of Contingent Valuation How Much Are People
Willing to Pay against Alzheimer's Disease? Int J Health Care Finance Econ 2002;2(3): 219-240.

Willingness to pay for adverse drug event regulatory actions
33
Willin
gness to
pay fo
r adverse d
rug even
t regulato
ry action
s
20. Smith RD. Construction of the contingent valuation market in health care: a critical assessment.
Health Econ 2003;12(8): 609-628.
21. Zhai G, Suzuki T. Effect of risk representation and scope on WTP for reduced risks: evidence from
Tokyo bay, Japan. Risk Anal 2008;28(2).
22. Lamers LM, Stalmeier PFM, McDonnell J, et al. Kwaliteit van leven meten in economische
evaluaties: het Nederlands EQ-5D-tarief. Nederlands Tijdschrift Geneeskunde 2005;149: 1574-1578.
[in Dutch]
23. Hofstede G, Hofstede G. Cultures and Organizations: Software for the Mind. McGraw-Hill, 2005.
24. Wagner TH, Hu T-W, Dueñas GV, et al. Willingness to pay for mammography: item development and
testing among five ethnic groups. Health policy 2000;53: 105-121.
25. Donaldson C, Jones AM, Mapp TJ, et al. Limited dependent variables in willingness to pay studies:
applications in health care. Appl Econ 1998;30: 667-677.
26. Kealy MJ, Turner RW. A test of the equality of closed-ended and open-ended contingent valuations.
Am J Agr Econ 1993;75:321-331.
27. Roncek D. Learning more from Tobit coefficients: Extending a comparative analysis of political
protest. Am Sociol Rev 1992;57(4): 503-507.
28. Wooldridge JM. Introductory Econometrics: A Modern Approach, fourth Edition. Cincinnati, OH:
South-Western College Publishing, 2009.
29. Kahneman D, Knetsch J. Valuing public goods: the purchase of moral satisfaction. J Environ Econ
Manage 1992;22: 57-70.
30. Baron J, Greene J. Determinants of Insensitivity to Quantity in Valuation of Public Goods:
Contribution, Warm Glow, Budget Constraints, Availability, and Prominence. J Exp Psychol-Appl
1996;2: 107-125.
31. Bleichrodt H, Eeckhoudt L. Willingness to pay for reductions in health risks when probabilities are
distorted. Health Econ 2006;15: 211-214.
32. Werner P, Vered I. Women's Willingness to Pay Out-of-Pocket for Drug Treatment for Osteoporosis
Before and After the Enactment of Regulations Providing Public Funding: Evidence from a Natural
Experiment in Israel. Osteoporos Int. 2002 Mar;13(3):228-34.
33. Schiffner R, Schiffner-Rohe J, Gerstenhauer M, et al. Willingness to pay and time trade-off: sensitive
to changes of quality of life in psoriasis patients? Brit J Dermatol 2003;148: 1153-1160.
34. Boonen A, Severens JL, van Tubergen A, et al. Willingness of patients with ankylosing spondylitis to
pay for inpatient treatment is influenced by the treatment environment and expectations of
improvement. Ann Rheum Dis 2005;64(11): 1650-1652.
35. Neumann P, Johannesson M. The willingness to pay for in vitro fertilization: a pilot study using
contingent valuation. Med Care 1994;32(7): 686-99.
36. Wordsworth S, Ryan M, Waugh N. Costs and benefits of cervical screening IV: valuation by women
of the cervical screening programme. Cytopathology 2001;12(6): 367-376.
37. Marra CA, Frighetto L, Goodfellow AF, et al. Willingness to pay to assess patient preferences for
therapy in a Canadian setting. BMC Health Serv Res 2005;5(43).
38. Pinto-Prades J, Farreras V, de Bobadilla J. Willingness to pay for a reduction in mortality risk after a
myocardial infarction: an application of the contingent valuation method to the case of eplerenone.
Eur J Health Econ 2008;9: 69-78.

Chapter 2
34
39. Liu JT, Tsou MW, Hammitt JK. Willingness to pay for weight-control treatment. Health policy
2009;91(2): 211-218.
40. Liljas B, Blumenschein K. On hypothetical bias and calibration in cost-benefit studies. Health Policy
2000;52(1): 53-70.
41. Blumenschein K, Johannesson M, Yokoyama KY, et al. Hypothetical versus real willingness to pay in
the health care sector: results from a field experiment. J Health Econ 2001;20: 441.
42. van Exel NJA, Brouwer WBF, van den Berg B, et al. With a little help from an anchor: Discussion and
evidence of anchoring effects in contingent valuation. J Socio-Econ 2006;35: 836-853.
43. Samnaliev M, Stevens TH, More T. A comparison of alternative certainty calibration techniques in
contingent valuation. Ecolog Econ 2006;57(3):507-519.
44. Kosenius AK.Causes of Response uncertainty and its Implications for WTP Estimation in Choice
Experiment. 2009. Discussion paper No 29. Department of Economics and Management,University
of Helsinki.
45. Johannesson M, Jonsson B, Karlsson G. Outcome measurement in economic evaluation. Health
Econ 1996;5: 279-296.
46. Rollins K, Lyke A. The case for diminishing marginal existence values. J Environ Econ Manag
1998;36:324-344.
47. Wagstaff A, van Doorslaer E. Equity in health care finance and delivery. In: Culyer AJ, Newhouse JP,
editors. Handbook of Health Economics Volume IB. Amsterdam: Elsevier, 2000: 1803-1862.
48. Schut E, van Doorslaer E. Demand for health care. In: Schut E, Rutten, F, editors. Economics of
Health Care, third volume. [in Dutch]. Maarssen: Elsevier Gezondheidszorg, 2009: 83-128
49. Jones-Lee M. Altruism and the value of other people's safety. J Risk Uncertainty 1991;4: 213-219.
50. Jones-Lee M. Paternalistic Altruism and the Value of Statistical Life. Econ J 1992;102(410): 80-90.
51. Jacobsson F, Carstensen J, Borgquist L. Caring externalities in health economic evaluation: how are
they related to severity of illness? Health Policy 2005;73(2): 172-182.

Willingness to pay for adverse drug event regulatory actions
35
Willin
gness to
pay fo
r adverse d
rug even
t regulato
ry action
s
Appendix 2.A: Willingness to pay questionnaire
Risk reduction in health care
This research project is conducted by the institute of Health and Policy Management at the
Erasmus Medical Centre in Rotterdam. Measures are being taken to make drugs as safe as
possible. These measures are expensive and society will account for these costs. Therefore,
for every measure it has to be determined whether the measure offers value for money.
There always is a risk of a serious adverse event when using drugs. The goal of this study is to
determine how much money Dutch citizens are willing to pay to lower the risk of a serious
adverse event. Filling out this questionnaire will take approximately 15 minutes. The
questionnaire is anonymous. At the end of the questionnaire you will find additional
information about this study. This information is not necessary to answer the questions.
You can hand in the completed questionnaire at the dialysis clinic or mail it free of charge
using the return envelope.
The aim of these first two questions is to introduce you to these types of questions.
Every year approximately 8,000 pedestrians and cyclists are admitted to a hospital due to an
accident with a car involved. Approximately 300 of these 8,000 victims do not survive the
accident. By making an adjustment to cars, the number of casualties can be reduced to 200.
While answering this question please assume that you have a car.
1. If you take into account your household income, what is the maximum amount of
money you would be willing to pay to adjust your car? This is a one-off payment.
Below, mark the amount you are definitely willing to pay with a V. Mark the amount you are
definitely unwilling to pay with an X.
€
0
€
5
€
10
€
20
€
30
€
40
€
50
€
60
€
70
€
80
€
90
€
100 More
What is the exact amount you are willing to pay? This amount lies between the V and the X
you marked above. €……….
Only answer the following question when you answered € 0.

Chapter 2
36
Why did you answer € 0?
It is not worth more
I do not want to pay
Other:……………………………………………………………………………………
…………………………………………..
Each year approximately 280,000 people in The Netherlands get influenza. Approximately
200 people die due to complications as a result of influenza. A new vaccine becomes available
that reduces the number of casualties to 75 people per year. This vaccine could be added to
the basic insurance package.
2. If you take into account your household income, what is the maximum amount of
money you would be willing to pay extra per year for your basic health insurance to
have this vaccine added to the basic insurance package? This amount adds to the
cost of the basic health insurance premium. The basic health care insurance premium
is approximately € 1100 per year.
Below, mark the amount you are definitely willing to pay with a V. Mark the amount you are
definitely unwilling to pay with an X.
€
0
€
5
€
10
€
20
€
30
€
40
€
50
€
60
€
70
€
80
€
90
€
100 More
What is the exact amount you are willing to pay? This amount lies between the V and the X
you marked above. €……….
Only answer the following question when you answered € 0.
Why did you answer € 0?
It is not worth more
I do not want to pay
Appendix 2.A
37
Willin
gness to
pay fo
r adverse d
rug even
t regulato
ry action
s
Other:………………………………………………………………………………………………
………………………………..
The following questions are about the subject of this study.
Approximately 40,000 people in The Netherlands have ill functioning kidneys. 13,000 people
are treated for this condition. A part of these patients use a drug to treat anemia. Some years
ago it appeared that this drug could cause a serious adverse event. Without instant
hospitalization this adverse event was fatal. Several measures were being taking when this
issue happened. These measures have reduced the risk of the serious adverse event to 0.
Nowadays there is no longer a safety issue with this drug.
Before the risk of the serious adverse event was reduced to 0, the risk of the serious adverse
event was approximately 4.5 per 10,000 patients per year. Approximately 15,000 patients in
The Netherlands use this drug against anemia. This means that every year 6 or 7 patients in
The Netherlands develop the serious adverse event.
This can be depicted as follows:

Chapter 2
38
The yellow dots represent the patients receiving the drug. The red dot represents the 1
patient that would develop the serious adverse event.
The next questions are about the risk of the serious adverse event before measures were
taken to reduce the risk of the serious adverse event. You should therefore imagine that the
risk of the serious adverse event is still present.
3. What do you think of the risk of the serious adverse event?
Very small Small Average Large Very large
4. Do you think that your risk of ever developing the serious adverse event is bigger or
smaller than the risk that you will ever die in a plane crash? Assume you fly once a
year.
Much smaller Smaller Similar Larger Much larger
5. Do you think that your risk of ever developing the serious adverse event is bigger or
smaller than the risk that you are will ever die in a car crash? Assume you drive one
hour per day.
Much smaller Smaller Similar Larger Much larger
6. Do you think that your risk of ever developing the serious adverse event is bigger or
smaller than the risk that you will ever die in a train accident? Assume you travel by
train one hour per day
Much smaller Smaller Similar Larger Much larger
As mentioned before, measures were taken that have reduced the risk of the serious adverse
event to 0.
7. What do you think of the reduction of the risk?
Very small Small Average Large Very large

Appendix 2.A
39
Willin
gness to
pay fo
r adverse d
rug even
t regulato
ry action
s
The basic health care insurance premium is approximately € 1100, - per year. This is without
the health care allowance or additional health insurance. The drug against anemia for kidney
disease patients is being covered by the basic health care insurance package.
Imagine that the measures that reduced the risk of the serious adverse event to 0 had not
been taken yet. So you should imagine that the risk of the serious adverse event is still
present.
8. If you take your household income into account, what is the maximum amount of
money you would be willing to pay extra per year for your basic health care
insurance to lower the risk of the adverse event to 0? This amount adds to the cost
of the basic health care insurance premium.
Below, mark the amount you are definitely willing to pay with a V. Mark the amount you are
definitely unwilling to pay with an X.
€ 0 € 5 €
10
€
20
€
30
€
40
€
50
€
60
€
70
€
80
€
90
€
100 More
What is the exact amount you are willing to pay? This amount lies between the V and the X
you marked above. €……….
Only answer the following question when you answered € 0.
Why did you answer € 0?
It is not worth more
I do not want to pay
Other:……………………………………………………………………………………
…………………………………………..
9. How confident are you that you would definitely pay this amount?
Not at all confident Not confident In between Confident Very confident

Chapter 2
40
With the following statements we will determine how you value your own health.
10. By placing a tick in one box in each Group below, please indicate which statements
best describe your own health state today.
Mobility
I have no problems in walking about
I have some problems in walking about
I am confined to bed
Self-care
I have no problems with self-care
I have some problems washing or dressing myself
I am unable to wash or dress myself
Usual activities (e.g. work, study, housework, family or leisure activities)
I have no problems with performing my usual activities
I have some problems with performing my usual activities
I am unable to perform my usual activities
Pain/discomfort
I have no pain or discomfort
I have moderate pain or discomfort
I have extreme pain or discomfort
Anxiety/depression
I am not anxious or depressed
I am moderately anxious or depressed
I am extremely anxious or depressed

Appendix 2.A
41
Willin
gness to
pay fo
r adverse d
rug even
t regulato
ry action
s
To help people indicate how good or bad a health state is, we
created a scale (rather like a thermometer) on which
the best health state you can imagine is marked 100 and the
worst health state you can imagine is marked 0.
We would like you to indicate on this scale how good
or bad your own health is today.
Please do this by drawing a line from the box below to
the point on the scale that indicates how good or bad
your health is today.
Your own
health
state
today
9 0
8 0
7 0
6 0
5 0
4 0
3 0
2 0
1 0
10
0
Worst imaginable health state
0
Best imaginable health state

Chapter 2
42
Please indicate to what extent you agree or disagree with the following statements:
11. Society should focus on taking care of the more vulnerable, not on opportunities for
the stronger
Disagree Slightly disagree Neither Slightly agree
Agree
12. I am responsible for my own well-being, society should not have to take care of my
well-being.
Disagree Slightly disagree Neither Slightly agree Agree
13. Uncertainty is a normal feature of my life and I live from day to day.
Disagree Slightly disagree Neither Slightly agree Agree
14. I try to avoid risks and unclear situations as much as I can.
Disagree Slightly disagree Neither Slightly agree Agree
15. I save as much money as possible and work hard now for later in life.
Disagree Slightly disagree Neither Slightly agree Agree
16. I do not think about the long term in my daily operations and decisions.
Disagree Slightly disagree Neither Slightly agree Agree
Imagine that you are the sole provider in your family. Your current job guarantees you your
current income for the rest of your life.
17. Would you accept a similar job when there is a 50% chance that your income doubles,
or decreases with 30%?
Yes No
18. Would you accept a similar job when there is a 50% chance that your income doubles,
or decreases with 50%?
Yes No
19. How do you experience the quality of healthcare in The Netherlands?
Very bad Bad No opinion Good Very good

Appendix 2.A
43
Willin
gness to
pay fo
r adverse d
rug even
t regulato
ry action
s
20. What do you think of the costs of the basic insurance premium for healthcare?
Very low Low Good High Very high No opinion
Finally, we would also like to ask you some personal questions.
21. What is your year of birth?
…………………….
22. What is your gender?
Male Female
23. Which of the following descriptions best describes your daily activities?
Paid job or entrepreneur
Retired
Household work
Student
Volunteer
(long term) Sick leave
Unemployed
24. What is the highest level of education you completed?
None
Elementary (primary) school
Middle school
High (secondary) school
Vocational/technical institution
College
University
25. What is your household income (you and your (possible) partner combined)?
€0-€1,500 per month
€1,500-€2,000
€2,000-€2,500
€3,000-€3,500
€3,500-€4,000

Chapter 2
44
€4,000-€4,500
€4,500-€5,000
More than €5,000
Do not want to say/other
26. Are you:
Married?
Living together?
Single?
Do not want to say/other
Do you have any remarks?
………………………………………………………………………………………………………
………………………………………………………………………………………………………
………………………………………………………………………………………………………
………………………………………………………………………………………………………
………………………………………………………………………………………………………
………………………………………………………………………………………………………
………………………………………………………………………………………………………
……………………………………….
If you have any questions about the questionnaire or this study, you can send an email to: (e-
mail address researcher)
Thank you very much for your time and participating in this
study
You can hand in the completed questionnaire at the dialysis clinic or mail it free of charge
using the return envelope.
The research project
In The Netherlands and Europe measures are taken to make and keep drugs as safe as
possible. These measures are often precautionary measures that reduce the risk of serious
adverse events. This could be compared to the Dutch national vaccination program where
children are vaccinated to reduce the risk of certain diseases like measles, mumps and
rubella.

Appendix 2.A
45
Willin
gness to
pay fo
r adverse d
rug even
t regulato
ry action
s
Measures are also taken when afterwards (after a drug/treatment has been made available
for patients) it shows that a drug/treatment is not as safe as was initially thought. This could
happen when, for example, a certain serious adverse event is linked to a drug/treatment after
a longer period of time. Or, when a change in the production process of a drug is made or the
treatment process changed. Some measures have only a limited positive effect resulting in
the possibility of questions being raised about the societal support for such a measure. In the
end, it is the general public that pays for these measures through their health insurance
premiums or taxes.
The aim of this research is to determine whether it is possible to attach a financial value to
the general public’s societal support. In other words, we want to know how much the Dutch
general public is willing to pay for a risk reduction of a serious adverse event of a drug. In this
questionnaire we are trying to determine, using the example of a real drug and an associated
serious adverse event, how much you are really willing to pay for a reduction of the risk of a
serious adverse event.
A second goal of this research project is to determine what factors influence people’s
willingness to pay for a risk reduction. We made assumptions (hypotheses) about what we
think could influence the willingness to pay. Income, for example, will most probably be of
direct influence on someone’s willingness to pay. Whether this is true will show from the
results. This is also the reason why certain questions have been incorporated in the
questionnaire that might appear to have no relation to the subject, but might be related to
the willingness to pay.
Questions are also asked about how you approach risks. We are trying to determine whether
your attitude towards risks is related to your willingness to pay for the risk reduction of drug
use associated serious adverse events.

Chapter 2
46
Appendix 2.B Variable specifications
Table 2.B: Variable specifications of all variables included in original analysis
Variable name Definition
SEX Sex of respondent; 1=female . 0=male
RISK Risk reduction; 1=45 per 10,000 , 0=4.5 per 10,000
PATIENT 1=CKD patient , 0=no CKD patient
AGE Age of respondent in years
QOL Quality of life of respondent
EDUC Level of education: 1=college/university , 0=otherwise
INCOME1 Income; 1=2000-4000 Euros , 0=otherwise
INCOME2 Income; 1=4000 Euros and higher , 0=otherwise
RISK1 Risk averse; 1= little risk averse , 0=otherwise
RISK2 Risk averse; 1=very risk averse , 0=otherwise
HORIS Respondent's risk perception; 1=high/very high , 0=very small/small/average
RISKREDUC Respondent's opinion on risk reduction; 1=big/very big , 0=very small/small/average
QUALITY Respondents opinion of quality of HC; 1=good/very good , 0=very bad/bad/no opinion
COSTS Respondents opinion of costs of HC; 1=high/very high , 0=very low/low/good
TAKINGCARE1 Question 11; 1=neutral , 0=otherwise
TAKINGCARE2 Question 11; 1=agree , 0=otherwise
WELLBEING1 Question 12; 1=neutral , 0=otherwise
WELLBEING2 Question 12; 1=agree , 0=otherwise
UNCERTAINTY1 Question 13; 1=neutral , 0=otherwise
UNCERTAINTY2 Question 13; 1=agree , 0=otherwise
AVOIDRISK1 Question 14; 1=neutral , 0=otherwise
AVOIDRISK2 Question 14; 1=agree , 0=otherwise
SAVEMONEY1 Question 15; 1=neutral , 0=otherwise
SAVEMONEY2 Question 15; 1=agree , 0=otherwise
LONGTERM1 Question 16; 1=neutral , 0=otherwise
LONGTERM2 Question 16; 1=agree , 0=otherwise
Abbreviations: CKD chronic kidney disease; HC healthcare.
Chapter 3
Trading off benefits and risks:
Eliciting preferences for pharmaceuticals
using a discrete choice experiment
JC Bouvy
H Schellekens
MA Koopmanschap
Submitted

Chapter 3
48
Summary
Background: Benefit-risk assessment is used by regulatory agencies to weigh a
pharmaceutical’s benefits against its safety risks. This is the first discrete choice experiment
(DCE) that elicited benefit-risk preferences from four groups of stakeholders in benefit-risk
assessment, including Dutch regulators.
Methods: A stated choice survey was created, consisting of 20 choice sets each containing
two alternatives (Drug A and Drug B). An efficient, unlabeled design was used with five
attributes: target population, health status without any treatment, health status with
treatment, seriousness of adverse drug reaction (ADR), frequency of ADR, and alternative
treatments available. Data was analysed using a nested logit model to enable the comparison
of the relative utility functions of the groups.
Results: A sample of 26 regulators and 19 pharmacologists were found to have largely similar
preferences regarding benefit-risk profiles of pharmaceuticals but some differences were
observed. Both regulators as pharmacologists did not weigh health gains (benefits) and
health losses (risks) equally and regulators were found to exhibit more loss aversion, as they
were less willing to trade off large health gains for large ADR risk than the pharmacologists
group.
Conclusions: Although this study was exploratory and suffers from low sample size, we
established the feasibility of using the DCE format to investigate benefit-risk assessment.
Preferences for drugs with favorable benefit-risk profiles (large health gains, non-severe and
infrequent ADRs) were confirmed, although several preferential differences between
regulators and academics were found. Our results stipulate the need for more explicit and
transparent benefit-risk assessment, which could identify important factors (e.g. loss
aversion, fatality gap) that affect regulatory decision-making.

Trading off benefits and risks
49
Introduction
Pharmaceuticals contribute substantially to public health by producing therapeutic benefits
in patients. All pharmaceutical products, however, also cause harm through adverse drug
reactions (ADRs). Regulatory benefit-risk assessment is the cornerstone of the scientific
evaluation of a pharmaceutical’s market application and concerns the weighing of a
product’s expected beneficial health effects against its safety risks.[1] Benefit-risk assessment
is applied throughout a product’s life-cycle[2] and aims to determine whether sufficient levels
of quality, efficacy, and safety of a new product are demonstrated.[3] A pharmaceutical
product will only be granted a market license when the product is determined to have a
positive benefit-risk profile, which means that the expected benefits of the drug have to
outweigh its expected harms in a specific patient population.[1] ‘Intuitive expert judgment’ is
the basis of benefit-risk assessment for the authorization of pharmaceuticals in Europe.[3]
During the last years, both the European Medicines Agency (EMA) and the Food and Drug
Administration (FDA) in the US have recognized the need to improve the methodology,
consistency, transparency, and communication of benefit-risk assessment.[3,4]
Notwithstanding, currently hardly any evidence exists regarding the explicit preferences of
regulatory agencies regarding benefits, risks, and benefit-risk trade-offs of pharmaceuticals.
Furthermore, it is unclear to what extent regulatory decision-making reflects societal
preferences of both patients and the general public. The aim of this study therefore was to
study how trade-offs in benefit-risk assessment are made by (i) regulatory agencies, (ii)
pharmaceutical companies, (iii) academics (pharmacologists/pharmacoepidemiologists), and
(iv) hospital pharmacists.
We used a discrete choice experiment (DCE) to elicit benefit-risk preferences for
pharmaceuticals. DCEs are based on the notion that people’s preferences for products are
determined not by the product itself, but by the product’s characteristics. The attractiveness
of a pharmaceutical product, therefore, is assumed to be a function of its characteristics.
DCEs have been applied before to elicit benefit-risk preferences for pharmaceuticals, but so
far have only studied specific patient populations.[5-8] We used a study design that presented
benefits and risks in a general format, in order to study preferences regarding benefit-risk
assessment for all pharmaceuticals.

Chapter 3
50
Methods
Design
A DCE measures preferences by presenting respondents with a number of choice sets
consisting of two or more alternatives. DCEs are based on random utility theory which
assumes individuals always will choose the alternative from a choice set that they prefer
most, or in economic terms, that will generate the highest utility. For each choice set,
respondents are asked to indicate which of the alternatives (in our study, Drug A and Drug B)
they prefer. The utility of a product is determined by an observable component Vi (the
characteristics of the product) and an unobservable component εi. An individual’s utility for
an alternative can be expressed as follows:
(1)
A DCE therefore enables the estimation of a relative utility function. The relative utility
function examines the extent to which the different characteristics contribute to the
respondents’ preferences for a drug. In this study, we developed an unlabeled, experimental
design, which consisted of 20 choice sets of two alternatives (Drug A and Drug B). The
scientific literature, EMA documents on benefit-risk assessment, and expert opinion were
used to identify all attributes of pharmaceuticals that needed to be included (i.e., all
observable components of utility Vi).
Table I: Attributes and levels
Attributes Levels Expected sign
Target population 1 Adults -
2 Children +
Health status without any treatment
1 Patient experiences: Death +
2 Patient experiences: +
some problems in walking about
inability to wash or dress him/herself
inability to perform usual activities
moderate pain or discomfort
no anxiety/depression
3 Patient experiences: (ref.)
no problems in walking about
no problems washing or dressing him/herself
some problems performing usual activities
no pain/discomfort
extreme anxiety/depression

Trading off benefits and risks
51
Table I continued
Health status with treatment
1 Patient experiences: -
no problems in walking about. -
some problems washing or dressing him/herself
inability to perform usual activities.
no pain/discomfort
no anxiety/depression
2 Patient experiences: -
some problems in walking about
no problems washing or dressing him/herself
ability to perform usual activities
no pain/discomfort
no anxiety/depression
3 Patient experiences: Full health (ref.)
Seriousness adverse drug reaction
1 GRADE 2: Moderate +
Mild to moderate limitation in activity
No or minimal medical intervention needed
2 GRADE 3: Severe +
Marked limitation in activity, medical intervention required
3 GRADE 4: Life-threatening (ref.)
Extreme limitation in activity, Significant medical intervention required, hospitalization/hospice probable
Frequency adverse drug reaction
1 1 in 10,000 patients +
2 1 in 1,000 patients +
3 1 in 100 patients +
4 1 in 10 patients (ref.)
Alternative treatment available
1 Yes, three other treatments with: -
somewhat lower effectiveness than drug A/B
milder adverse drug reactions than drug A /B
2 Yes, one other treatment with: -
somewhat lower effectiveness than drug A/B
milder adverse drug reactions than drug A/B
3 Yes, one other treatment with: -
somewhat lower effectiveness than drug A/B
similar but less frequent adverse drug reactions than drug A/B
4 No (ref.)
All attributes were dummy coded. The last level of each attribute was chosen as the reference level. For all other levels, the expected sign of the coefficient (that was used for generating the design) is indicated. A plus sign indicates an expected increase in the relative utility of an alternative including the attribute level (relative to the reference level).
The design was piloted among a group of seven pharmacologists working in academia and
subsequently revised. The final design included the following attributes (Table I): ‘target

Chapter 3
52
population’, ‘health status without any treatment’ (as an indicator for the disease severity),
‘health status with treatment’, ‘seriousness of adverse drug reaction’ (ADR), ‘frequency of
ADR’, and ‘alternative treatments available’. We described all health-state levels with EQ-5D
health states. The EQ-5D is a validated instrument used to measure and value health-related
quality of life[9] which allowed us to use a non-disease specific description of the attributes
‘health status without any treatment’ and the attribute ‘health status with treatment’. For
the ADR severity attribute, we used the World Health Organization’s grading system of ADR
severity (moderate, severe, and life-threatening). We included four levels for the attribute
‘alternative treatments available’ as the pilot study revealed this as an important attribute.
We used an efficient multinomial logit (MNL) design with Bayesian priors that was generated
with NGene (Choice Metrics, Pty Ltd). The efficiency of the design was determined by the D-
error. A D-efficient design is generated by specifying the expected relative utility function for
the alternatives and it minimizes the variance-covariance matrix of the attributes included in
the design.[10] As argued by Bliemer and Rose (2006), an efficient design is preferred when
some information about the expected relative utility function is available, even if merely the
expected sign of the coefficient.[11] The assumed expected signs (negative or positive) are
indicated in Table I. The design was generated by giving uniform distributions for all priors,
ranging from -1.5 to 0 in case of a negative expected sign and from 0 to 1.5 in case of a
positive expected sign. The design was generated for an MNL model.
The electronic questionnaire started with an introduction screen, explaining the purpose and
subject of the questionnaire to the respondents. The questionnaire format was subsequently
introduced by means of an example question (where all attribute levels of drug A were set to
the hypothesized least preferred levels and all attribute levels of drug B were set to the
hypothesized most preferred levels). Each choice set was introduced as follows: ‘Both Drug A
and Drug B have been on the market in the European Union for several years. Below, you see the
characteristics of both drugs. When you take all characteristics into account, which drug do you
think has a better overall benefit-risk profile?’ An example of a choice set is shown in Table II.
With the introduction question, respondents were instructed to answers all questions, even if
they felt both drugs had an equally positive or negative benefit-risk profile. In such a case,
they were asked to indicate which drug they considered better or less bad. No opt-out option
was included.

Trading off benefits and risks
53
Tradin
g off b
enefits an
d risks
Table II: Example of a choice set
Drug A Drug B
Target Population Adults Adults
Health status without any treatment
Patient experiences:
some problems in walking about inability to wash or dress him/herself inability to perform usual activities moderate pain or discomfort no anxiety/depression
Patient experiences:
no problems in walking about. no problems washing or dressing him/herself. some problems performing usual activities. no pain/discomfort. extreme anxiety/depression
Health status with treatment
Patient experiences:
no problems in walking about. some problems washing or dressing
him/herself inability to perform usual activities. no pain/discomfort no anxiety/depression
Patient experiences:
some problems in walking about no problems washing or dressing
him/herself ability to perform usual activities no pain/discomfort no anxiety/depression
Seriousness adverse drug
reaction
GRADE 2: Moderate
Mild to moderate limitation in activity No or minimal medical intervention needed
GRADE 4: Life-threatening
Extreme limitation in activity Significant medical intervention required Hospitalization or hospice care probable
Frequency adverse drug reaction
1 in 100 patients. 1 in 10,000 patients.
Alternative treatment available?
No.
Yes, one other treatment with:
somewhat lower effectiveness than drug B similar but less frequent adverse drug reactions than drug B
Respondents were asked to indicate which alternative (Drug A or Drug B) they felt had a better overall benefit-risk profile
Data collection
An electronic version of the questionnaire was sent out to all assessors (pre-clinical, clinical,
and pharmacovigilance) at the Medicines Evaluation Board in the Netherlands (N=135),
originally in November 2011, after an instruction was given at an assessors meeting.
Reminders were sent in January and February 2012. Another instruction was given at a
meeting in April 2012 and this time, questionnaires were handed out to all assessors on the
spot. In total, this resulted in 26 completed questionnaires (response rate: 19.3%).
Originally, we had planned to include a patient group in our study as well. However, given the
nature of our experiment and the types of attributes included, we doubted whether lay
people would be able to trade-off the drug attributes we included. Therefore we approached
a sample of academics (at the division of Pharmacoepidemiology and Clinical Pharmacology
(N=114), Utrecht University, the Netherlands, and at Groningen University, the Netherlands).
We assumed this group of academics would have sufficient knowledge of pharmaceuticals to
participate in the experiment but would not necessarily have preferences similar to
assessors, and therefore could be viewed as a proxy for patients/the general public. We

Chapter 3
54
approached this sample through e-mail in February 2012, resulting in 19 completed
questionnaires (response rate 16.7%).
Furthermore, we included a sample of persons (N=200) working in Regulatory Affairs of a
large European pharmaceutical company by e-mail after an instruction was given during a
seminar at the company in May 2012. After two reminders were sent out, this resulted in 10
completed questionnaires (response rate 5%). Last, we approached a sample of hospital
pharmacists through the Dutch Association of Hospital Pharmacists by e-mail (N=522). This
resulted in a total of 7 responses (response rate 1.3%).
Analysis
A commonly used model for the analysis of stated choice data is the MNL model. It is
problematic, however, to directly compare the coefficients of the MNL functions of different
groups[12,13] as the scale parameters in the MNL model are correlated with the coefficients.
Therefore, observed differences in MNL functions between groups cannot be assumed to be
reflecting true preferential differences but could be caused by differences in unobserved
variance between groups. (see Appendix 3.A for a more detailed explanation). Therefore, we
used a nested logit (NL) model to estimate the relative utility functions of the four groups.
The NL model enables the comparison of coefficients of the relative utility function of
different groups and therefore was the appropriate model to use.[14] The observed choice
variable (a preference for either Drug A or Drug B in each choice set) is the dependent
variable. All attribute levels were dummy coded and added as explanatory variables. One
coefficient was treated as generic among subgroups,[15] resulting in 13 coefficients per utility
function (see Appendix 3.A for the utility functions). After testing for significance, no
constant was included as the design was unlabeled and a constant therefore does not convey
any behavioral information related to the alternative. We tested significant differences
between the coefficients of the relative utility functions of the different groups with the test
for equality of maximum likelihood regression coefficients described by Brame et al.
(1998).[16] All analyses were performed with Limdep NLOGIT 4.0 (Econometric Software, Inc.)
Results
NL model
The final sample consisted of 26 regulators, 19 academics (pharmacologists and pharmaco-
epidemiologists), 10 pharmaceutical company employees, and 7 hospital pharmacists (Table
III).

Trading off benefits and risks
55
Tradin
g off b
enefits an
d risks
Table III: Sample characteristics
Sample characteristics Regulators Pharmacologists Company Hospital
pharmacists
N 26 19 10 7
Age (mean) 44 43 31 46
Years of experience (mean) 8.2 n/a 3.4 17.7
Preclinical 4%
Safety 23%
Efficacy 27%
Pharmacovigilance 35%
CNS 31%
Cardiovascular/Diabetes 15%
Oncology 12%
Infectious diseases 12%
Abbreviations: CNS central nervous system.
The average age of the regulator group was 44 years and average number of years they
worked at the regulatory agency was 8.2. All coefficients of the NL model (Table IV) had the
expected sign (although not all were significant): a drug was more preferred when it was
intended to treat an otherwise fatal disease, if it had infrequent and non-severe ADRs, and
when no therapeutic alternatives were available. The attribute ‘target population’ was not
significant for any of the subgroups, indicating that a drug’s benefit-risk profile is not
significantly influenced by the target population being adults or children. The model fit was
particularly high with a McFadden pseudo-R2 of 0.74. Yet this was not surprising, as the
significance of the scale parameters (see Appendix 3.A) showed there were differences in
the unobserved variance of the different groups. Given the small number of observations for
the company group (N = 10) and the hospital pharmacists group (N = 7), we limit the
reporting of the DCE results to the regulator and pharmacologists group.
Three coefficients in the utility functions (corresponding to the attribute levels for ‘health
status without any treatment’ is death, ADR severity of moderate, and ADR severity of
severe) significantly (α=0.10) differed between the regulators and pharmacologists (Table
IV). These differences indicate that the regulators more strongly preferred the benefit-risk
profile of a drug intended either for a fatal disease or with a low ADR severity than the
pharmacologists.
Scenarios 1, 2, and 3: trading off benefits versus risks
In order to examine the preferential differences we identified, we simulated several choice
scenarios. The simulation was performed by calculation the predicted choice variables for a
given choice set. The estimated relative utility functions for all the groups (Table IV,
Appendix 3.B) were used to calculate the predicted choice probabilities for different choice

Chapter 3
56
scenarios. The first scenario (Table V) entailed a trade-off between health gains and risks. A
choice between Drug A and Drug B was simulated, where Drug A concerned a drug with
minimal health gains but also minimal ADR risks, whereas Drug B concerned a drug with
maximum health gains but also maximum ADR risks. In this scenario, 66% of the regulators
preferred the benefit-risk profile of Drug A over Drug B, whereas 52% of the pharmacologists
preferred Drug A over Drug B. indicating that the regulator group was less willing to trade off
a higher ADR risk for more health gains than the pharmacologists group.
In scenario 2, we only changed (as compared to scenario 1) the ADR frequency attribute of
Drug B (1 in 10,000 patients in scenario 2, whereas it was 1 in 10 patients under scenario 1).
Now, 43% of the regulators and 30% of the pharmacologists preferred Drug A over Drug B. In
this scenario, more respondents from both groups (23% increase of regulators and 23%
increase of pharmacologists as compared to scenario 1) are willing to trade off a severe ADR
(life-threatening, 1 in 10,000 patients) for maximum health gains, demonstrating that the
benefit-risk profile of a drug is considered more favorable when the risk of an ADR is
infrequent.
The ADR severity of Drug B in scenario 3 was changed from life-threatening to severe (as
compared to scenario 1). The preferences of the two groups now became much more equal:
43% of the regulators and 37% of the pharmacologists preferred the benefit-risk profile of
Drug A over Drug B, indicating that for both groups, more respondents are willing to trade
off the risk of a severe ADR for maximum health gains, than they are willing to trade off a life-
threatening ADR for maximum health gains.
Scenarios 4 and 5
We changed the health status without any treatment of Drug B to the second level (patient
experiencing some problems in walking about, inability to wash/dress him/herself and to
perform usual activities, moderate pain/discomfort, no anxiety/depression) in scenario 4
(Table VI), while all other attribute levels of Drug A and Drug B remained identical to scenario
1. This scenario demonstrates the major impact of a patient’s health status before treatment
and the total health gains on the willingness of both groups to trade off maximum health
risks for maximum benefit, as now 87% of the regulators and 79% of the pharmacologists
preferred the benefit-risk profile of Drug A over the benefit-risk profile of Drug B.
In scenario 5 (Table VI), the ‘alternative treatments available’ level of Drug A and the ADR
severity of Drug B were changed (as compared to scenario 1). This scenario indicates that the
benefit-risk profile of a drug substantially decreases when several therapeutic alternatives
are available, as now only 26% of the regulators and 13% of the pharmacologists preferred
Drug A over Drug B.

Tradin
g off b
enefits an
d risks
57
Table IV: Nested logit results
Attributes: Regulators Pharmacologists Pharmaceutical Company Hospital Pharmacists
Levels: Coef. St.Er. p Coef. St.Er. p Coef. St.Er. p Coef. St.Er. p
Target Population -0.09 0.13 0.47 0.05 0.09 0.59 -0.07 0.17 0.69 0.02 0.15 0.89
Health status no treatment:
1 Patient experiences: death 1.32 0.18 0.00 0.92** 0.14 0.00 1.22 0.27 0.00 0.73* 0.22 0.00
2 Patient experiences: some problems in walking about inability to wash or dress him/herself inability to perform usual activities moderate pain or discomfort no anxiety/depression
0.06 0.16 0.68 0.16 0.12 0.20 0.37 0.25 0.14 -0.01 0.20 0.95
Health status with treatment: 1 Patient experiences: no problems in walking about some problems washing or dressing him/herself inability to perform usual activities no pain/discomfort no anxiety/depression
-0.59 0.20 0.00 -0.55 0.16 0.00 -0.83 0.30 0.01 -0.86 0.25 0.00
2 Patient experiences: some problems in walking about no problems washing or dressing him/herself ability to perform usual activities no pain/discomfort no anxiety/depression
-0.14 0.17 0.40 -0.35 0.13 0.01 0.09 0.25 0.73 -0.08 0.19 0.66
Seriousness ADR: 1 moderate 1.62 0.22 0.00 0.92* 0.16 0.00 1.46 0.31 0.00 1.24 0.28 0.00 2 severe 0.93 0.17 0.00 0.39* 0.12 0.00 0.75 0.24 0.00 0.67 0.22 0.00

Ch
apter 3
58
Table IV continued
Frequency: 1 1 in 10,000 patients 0.95 0.26 0.00 0.61 0.19 0.00 0.72 0.35 0.04 1.05 0.32 0.00
2 1 in 1,000 patients 0.48 0.21 0.02 0.50 0.16 0.00 0.39 0.32 0.22 0.49 0.26 0.06 3 1 in 100 patients 0.58 0.18 0.00 0.24 0.12 0.05 0.83 0.26 0.00 0.54 0.21 0.01 Alternative treatments available: 1 Yes, three other treatments with milder ADRs
-0.77 0.19 0.00 -0.88 0.15 0.00 -1.11 0.31 0.00 -0.62 0.23 0.01
2 Yes, one other treatment with milder ADRs
-0.72 0.10 0.00 -0.72 0.10 0.00 -0.72 0.10 0.00 -0.72 0.10 0.00
3 Yes, one other treatment with similar but less frequent ADRs
-0.47 0.17 0.01 -0.56 0.14 0.00 -0.48 0.23 0.04 -0.40 0.20 0.04
IV parameter 1.00 0.64 0.83 0.54 Scale 1 1.57 1.21 1.84 McFadden pseudo-squared: 0.74
Abbreviations: ADR adverse drug reaction; Coef. Coefficient; st.er. standard error; p p-value. *These coefficients significantly differ from the regulators coefficients at α=0.05 **These coefficients significantly differ from the regulators coefficients at α=0.10 # this parameter was held constant across models for estimation purposes
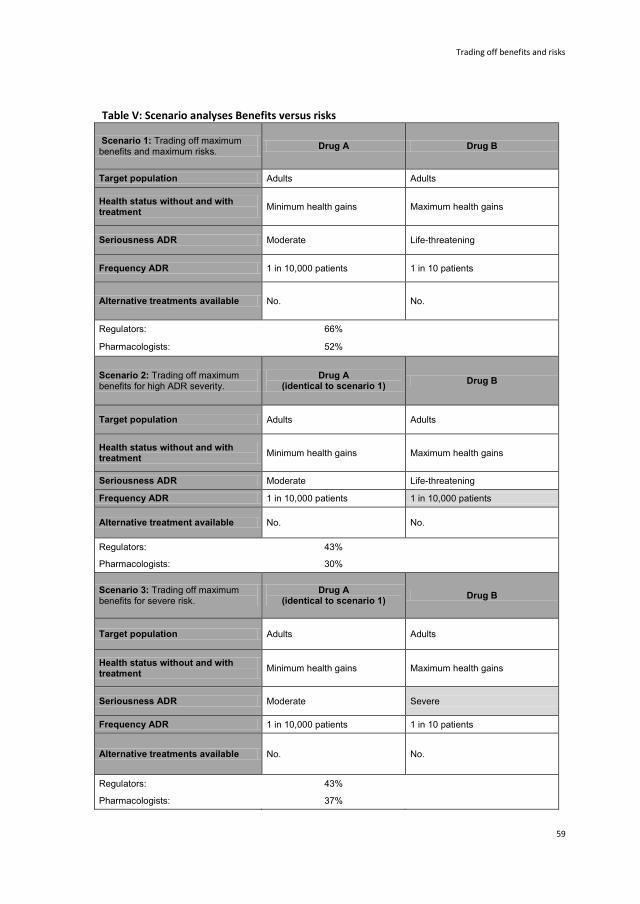
Trading off benefits and risks
59
Table V: Scenario analyses Benefits versus risks
Scenario 1: Trading off maximum benefits and maximum risks.
Drug A Drug B
Target population Adults Adults
Health status without and with treatment
Minimum health gains Maximum health gains
Seriousness ADR Moderate Life-threatening
Frequency ADR 1 in 10,000 patients 1 in 10 patients
Alternative treatments available No. No.
Regulators: 66%
Pharmacologists: 52%
Scenario 2: Trading off maximum benefits for high ADR severity.
Drug A (identical to scenario 1)
Drug B
Target population Adults Adults
Health status without and with treatment
Minimum health gains Maximum health gains
Seriousness ADR Moderate Life-threatening
Frequency ADR 1 in 10,000 patients 1 in 10,000 patients
Alternative treatment available No. No.
Regulators: 43%
Pharmacologists: 30%
Scenario 3: Trading off maximum benefits for severe risk.
Drug A (identical to scenario 1)
Drug B
Target population Adults Adults
Health status without and with treatment
Minimum health gains Maximum health gains
Seriousness ADR Moderate Severe
Frequency ADR 1 in 10,000 patients 1 in 10 patients
Alternative treatments available No. No.
Regulators: 43%
Pharmacologists: 37%

Chapter 3
60
Table VI: Scenario analyses 2
Scenario 4: Impact of disease severity
Drug A (identical to scenario 1)
Drug B
Target population Adults Adults
Health status without treatment
Minimum health gains
Patient experiences:
some problems in walking about inability to wash or dress him/herself inability to perform usual activities moderate pain or discomfort no anxiety/depression
Health status with treatment Patient experiences: Full health
Seriousness ADR Moderate Life-threatening
Frequency ADR 1 in 10,000 patients 1 in 10 patients
Alternative treatments available
No. No.
Regulators: 87%
Pharmacologists: 79%
Scenario 5: impact of alternative treatments available.
Drug A Drug B
Target population Adults Adults
Health status without and with treatment
Minimum health gains Maximum health gains
Seriousness ADR Moderate Severe
Frequency ADR 1 in 10,000 patients 1 in 10 patients
Alternative treatments available
Yes, three other treatments with: somewhat lower effectiveness than drug A milder adverse drug reactions than drug A
No
Regulators: 26%
Pharmacologists: 13%

Trading off benefits and risks
61
Discussion
This study demonstrated that regulators and pharmacologists in the Netherlands prefer
pharmaceutical products that are indicated for patients with an unfavorable health status
before treatment (i.e., high disease severity), pharmaceuticals with large health gains, with
non-severe and infrequent ADRs, and that have no therapeutic alternatives. Furthermore,
this study established the feasibility of stated choice surveys in the measurement of benefit-
risk preferences for pharmaceuticals. Preferences of regulators and pharmacologists were
largely similar, yet some differences were identified, most notably, that regulators are less
willing to trade-off large ADR risks for substantial health gains than pharmacologists.
We found that in benefit-risk assessment of pharmaceuticals, health gains (due to treatment)
and health losses (due to ADRs) are not valued equally. In scenario 1 (Table V), the expected
health gains for Drug B were higher (9 out of 10 patients would regain full health after
treatment whereas they would have died without treatment) than the expected health
losses (1 out of 10 patients would experience a substantial health loss) of Drug B, whereas the
expected net health gains for Drug A were much more modest. Yet, the choice probabilities
for this particular scenario (66% of the regulators and 52% of the pharmacologists preferred
Drug A over Drug B) indicate that substantial proportions of both groups prefer the benefit-
risk profile of a drug with minimum health gains and minimum ADR over a drug (Drug A) with
maximum health gains and maximum ADR risks (Drug B). According to prospect theory[17]
people tend be more sensitive to losses than to gains (loss aversion), meaning that ‘the
disappointment due to a loss is more extreme than the joy due to an equally-sized gain’.18] Our
results suggest that loss aversion is a component in benefit-risk assessment as well.
Furthermore, the observed differences in preferences (Table V and Table VI) between the
regulators and the pharmacologists suggest that regulators might exhibit more loss aversion
than pharmacologists.
The benefit-risk profile of a drug was strongly influenced by the health status before
treatment. In scenario 4, where the ‘health status without any treatment’ level was no longer
death (as it was under scenario 1), 88% of the regulators preferred Drug A over Drug B,
whereas under scenario 1, 66% of regulators preferred Drug A over Drug B. This substantial
preferential shift could be explained by the ‘rule of rescue’,[19] which is often observed in
reimbursement decisions for life-saving interventions and states that when interventions are
life-saving, strict utilitarian rationality is often disregarded.[19] Our results indicate that in
benefit-risk assessment, a similar effect could exist: high safety risks are much more
acceptable when treatments are life-saving. There might be a substantial benefit-risk ‘fatality

Chapter 3
62
gap’: the safety risks of pharmaceuticals indicated for severe but non-fatal indications are
much less acceptable than similar safety risks of pharmaceuticals indicated for fatal diseases.
Our results are consistent with studies regarding benefit-risk preferences of patients. Crohn’s
disease patients were found to be willing to trade off higher ADR risks for more benefits.[7,20]
Johnson et al. (2007) found that Crohn’s disease patients were willing to accept an annual
risk of progressive multifocal leukoencephalopathy (PML), an infection of the central nervous
system which is often fatal, of 0.7% if they would move from a severe health state to
remission, but the maximum acceptable risk was 0.19% if accompanied with minimum health
gains.[7] A DCE performed to elicit benefit-risk preferences of psoriasis patients found that
patients were willing to trade off time to achieve treatment improvement for lower risks of
serious ADRs.[6] Furthermore, people at risk of developing Alzheimer’s disease are willing to
accept a substantial risk of treatment-related death in exchange for the benefits of a
treatment for Alzheimer’s disease.[8] Our sample consisted of regulators and
pharmacologists, and even though regulators evaluate the benefit-risk profile of drugs on
behalf of patients, it is not to be said that their preferences are similar to those of patients. A
discussion into whose values should be reflected in regulatory benefit-risk assessment is
beyond the scope of this paper.
Our study has several limitations. First, we had a small sample size. We suspect the low
response rate might have been due to the length of the questionnaire and the electronic
format, which did not allow respondents to submit their filled-out questionnaire without
having completed all twenty choice sets. Second, our experiment was of hypothetical nature.
DCEs are based on random utility theory, which assumes that individuals strive to maximize
utility and will have normative preferences within a choice context.[21] In reality, however, not
all people will have clear and well-ordered preferences ready, but many respondents will
construct their preferences during a complex elicitation process, and preferences usually are
context-specific.[22] We forced respondents to choose between two hypothetical drugs,
which is not how ‘real-life’ benefit-risk assessment is performed, as decisions are usually
made evaluating one product as opposed to a set of alternatives, and more factors than the
included attributes have to be taken into account.[3] Therefore, our results cannot directly be
translated into implications for actual pharmaceutical products. Furthermore, the used
attribute levels for ‘health status without any treatment’ and ‘health status with treatment’
might have been difficult for respondents to interpret as they were quite extensive
descriptions of health states, which could have resulted in the non-significance of the middle
levels for both attributes. Another explanation might be that the valuation of the different
health states differed little to respondents and therefore the levels did not greatly impact
preferences.

Trading off benefits and risks
63
For the regulators, the coefficient of the ADR-frequency level of 1 in 1,000 patients was 0.48,
whereas this coefficient was 0.58 for the 1 in 100 patients level. Both coefficients were
significant at the α=0.05 level. The difference between the two coefficients was not
significant, suggesting that an ADR frequency level of 1 in 1,000 patients had an identical
impact on the relative utility of an alternative as an ADR frequency level of 1 in 100 patients.
This could imply scale invariance for the regulators: an ADR risk of 1 in 100 patients was
perceived to be virtually equal to an ADR risk of 1 in 1,000 patients. If scale invariance would
exist in regulators, this could result in subjective regulatory decision-making.
Our study should be seen as exploratory, and interpretations of our results should be made
with caution due to the low sample size. Notwithstanding, we established that the DCE is
feasible approach in studying regulatory benefit-risk assessment. Our study suggests that
regulatory decision-making in benefit-risk assessment is influenced by several factors that
result in a deviation from ‘rational’ decision-making – although it has long been recognized
that the view of a rational utilitarian decision maker does not reflect reality very well.[17] We
found evidence for loss aversion, possible scale invariance, and several differences between
regulators and pharmacologists. These results therefore stipulate the need for more explicit
regulatory benefit-risk assessment. A transparent, standardized, and more coherent benefit-
risk framework, as opposed ‘intuitive expert judgment’, would facilitate the assessment of
preferences and trade-offs that are actually made by regulators. Such a framework should
not be used to scrutinize regulators, but it would enable us to assess whether regulatory
benefit-risk assessment is in line with societal preferences regarding the acceptability and
unacceptability of benefits and risks. As we included the pharmacologist group as a ‘proxy’
for the general public and identified several preferential differences, this might imply that
regulator preferences do not necessarily reflect societal preferences - even though it is not
clear whose preferences should ‘count’ regarding benefit-risk assessment. An explicit
benefit-risk assessment framework would enable the identification of relevant factors
influencing regulatory decision-making, which would improve the communication of
regulatory decision-making to the general public and the pharmaceutical industry.
Furthermore, it would increase the social accountability of regulatory decision-making
regarding benefit-risk assessment.

Chapter 3
64
References 1. Garrison LP. Regulatory benefit-risk assessment and comparative effectiveness research.
Pharmacoeconomics 2010;28(10):855-865.
2. Garattini S. Evaluation of benefit-risk.Pharmacoeconomics 2010;28(11):981-986.
3. European Medicines Agency. Reflection paper on benefit-risk assessment methods in the context of
the evaluation of marketing authorization applications of medicinal products for human use. 2008
EMA/CHMP/15404/2007
4. IOM (Institute of Medicine) 2012. Ehtical and scientific issues in studying the safety of approved
drugs. Washington, DC: The National Academies Press.
5. Lloyd A, McIntosh E, Price M. The importance of drug adverse effects compared with seizure
control for people with epilepsy. Pharmacoeconomics 2005;23(11):1167-1181.
6. Seston EM, Ashcroft DM, Griffiths CEM. Balancing the benefits and risks of drug treatment. A stated
preference, discrete choice experiment with patients with psoriasis. Archives Dermatology
2007;143(9):1175-1179.
7. Johnson FR, Ozdemir S, Mansfield C, Hass S, Miller DW, Siegel CA, Sands BE. Crohn’s disease
patients’ risk-benefit-preferences: serious adverse event risks versus treatment efficacy.
Gastroenterology 2007;133:769-779.
8. Hauber AB, Johnson FR, Fillit H, Mohamed AF, Leibman C, Arrighi M, Grundman M, Townsend RJ.
Older american’s risk-benefit preferences for modifying the course of Alzheimer disease. Altzheimer
Disease Associated Disorders 2009;23(1):23-32.
9. Lamers LM, Stalmeier PF, McDonnell J, Krabbe PF, van Busschbach JJ. Measuring the quality of life
in economic evaluations: the Dutch EQ-5D tariff. Ned Tijds Geneeskd 2005;149(28):1574-1578.
10. Kuhfeld WF, Tobias RD, Garratt M. Efficient experimental design with marketing research
applications. In:Journal of Marketing Research 1994;31(4):545-557.
11. Bliemer, M.C.J., Rose, J.M., 2006. Designing stated choice experiments: state-of-the-art. In: Paper
presented at the 11th International Conference on Travel Behaviour Research, Kyoto, Japan, August.
12. Swait J, Louviere J. The role of the scale parameter in the estimation and comparison of multinomial
logit models. Journal of Marketing Research 1993;30(3):305-314.
13. Hensher DA, Rose JM, Greene WH. Applied choice analysis: A primer. New York: Cambridge
University Press; 2005.
14. Hensher DA. Accounting for scale heterogeneity within and between pooled data sources.
Transportation Research Part A: Policy and Practice. 2012;46(3):480-486.
15. Hensher DA, Greene WH. Specification and estimation of the nested logit model: alternative
normalisations. Transportation Research Part B: Methodological. 2002;36(1):1-17.
16. Brame R, Paternoster R, Mazerolle P, Piquero A. Testing for the equality of máximum-likelihood
regression coefficients between two independent equations. Journal of Quantitative Criminology
1998;14(3):245-261.
17. Kahneman D, Tversky A. Prospect theory: an analysis of decision under risk. Econometrica
1979;47:263-291.
18. Treadwell JR, Lenert LA. Health values and prospect theory. Medical Decision Making 1999;19:344.
19. McKie J, Richardson J. The rule of rescue. Social Science & Medicine 2003;56:2407-2419.

Trading off benefits and risks
65
20. Van Houtven G, Johnson FR, Kilambi V, Hauber AB. Eliciting benefit-risk preferences and probability-
weighed utility using choice-format conjoint analysis. Medical Decision Making 2011;31:469.
21. De Bekker-Grob EW, Ryan M, Gerard K. Discrete choice experiments in health econonomics: a
review of the literature. Health Economics 2012;21:145-172.
22. Shafir E, LeBoeuf RA. Rationality. Annual Reviews Psychology 2002;53:491-517.

Chapter 3
66
Appendix 3.A: Using the right discrete choice model
A problematic feature of the MNL model is the correlation of the error variance with the
parameters (through a scale parameter λ). In the MNL model, the scale parameter is
arbitrarily set to one (assuming that the error variances of all choice sets in the sample are
equal). The scale parameter hinders the comparison of coefficients of the relative utility
functions between groups when there are differences in the error variances, i.e., the
unobserved heterogeneity, between groups. As the scale parameter is inversely related to
the error variances (Hensher et al. 2005), this means that MNL coefficients of subgroups
cannot be directly compared. Therefore, when comparing different groups, differences in
coefficients of the relative utility functions can be caused either by a true difference in
preferences, sampling error, or a difference in error variance between the groups through
the scale parameter (Swait and Louviere 1993). As we surveyed four different groups of
respondents, whom cannot be assumed to be identical to each other (and we were
interested in possible differences in preferences among the groups), it would not be
appropriate to use an MNL model to compare the relative utility function coefficients.
The nested logit trick (Hensher 2012) is mostly used to pool sources of stated preferences and
revealed preferences data, but can be applied to pool different groups of stated preferences
data as well. The NL model is an extension of the MNL model, in which the assumption of
independence of irrelevant alternatives (i.e. all choice sets in the sample have an identical
error variance) is relaxed. Therefore, we used an NL model with a two level structure. The NL
model enables the estimation of the scale parameters as the inclusive value (IV) parameters
are estimated. It was shown (Hensher et al. 2005) that the scale parameter is equal to the IV
parameter at level 2 divided by the scale parameter at level 1. By normalizing the IV
parameters at level 2 (Random Utility Model 2 (RU2)), the IV parameters at level 1 are freely
estimated and the coefficients estimated for the utility functions of the subgroups can
subsequently be compared. We treated one coefficient (alternative treatments attribute
level two) as generic across all alternatives to ensure consistency with utility maximization
(Hensher & Greene 2002) and set the IV parameter for the regulator group to one as well, to
estimate the coefficients of the subgroups relative to those of the regulator group.
The utility functions of the different subgroups are specified as follows:

Appendix 3.A
67
Where the variables in the utility functions are:
TP = target population (two levels, dummy coded)
HS no treatment = Health status without any treatment (three levels, dummy coded)
HS with treatment = Health status with treatment (three levels, dummy coded)
Seriousness ADR = seriousness of adverse drug reaction (three levels, dummy coded)
Frequency ADR = frequency of adverse drug reaction (four levels, dummy coded)
Alt treatments = alternative treatments available (four levels, dummy coded)
References 1. Hensher DA, Rose JM, Greene WH. Applied choice analysis: A primer. New York: Cambridge
University Press; 2005.
2. Swait J, Louviere J. The role of the scale parameter in the estimation and comparison of multinomial
logit models. Journal of Marketing Research 1993;30(3):305-314.
3. Hensher DA. Accounting for scale heterogeneity within and between pooled data sources.
Transportation Research Part A: Policy and Practice. 2012;46(3):480-486.
4. Hensher DA, Greene WH. Specification and estimation of the nested logit model: alternative
normalisations. Transportation Research Part B: Methodological. 2002;36(1):1-17.

Chapter 3
68
Appendix 3.B: Multinomial Logit (MNL) models for all
subgroups
In Table 3.B1, all MNL models are reported that were estimated for the separate datasets for
all groups. We tested adding a constant to the utility functions for all groups but none were
significant. If a constant would be significant this could indicate left-right bias. In an unlabeled
choice experiment, there should be no significant preference for either the left or right
alternative in each choice set. A significant constant therefore would imply that respondents
have a preference for either the right or left alternative. As none of the constants were
significant, this indicates no left-right bias.

Ap
pen
dix 3.B
69
Attributes: Regulators Pharmacologists Pharmaceutical Company Hospital Pharmacists
Levels: Coef. St.Er. p Coef. St.Er. p Coef. St.Er. p Coef. St.Er. p
Target Population -0.09 0.13 0.47 0.08 0.14 0.59 -0.08 0.21 0.70 0.04 0.27 0.89
Health status no treatment:
1 Patient experiences: death 1.32 0.19 0.00 1.46 0.23 0.00 1.47 0.35 0.00 1.34 0.44 0.00
2 Patient experiences:
0.06 0.16 0.68 0.24 0.19 0.20 0.45 0.31 0.15 -0.02 0.38 0.95
some problems in walking about
inability to wash or dress him/herself
inability to perform usual activities
moderate pain or discomfort
no anxiety/depression
Health status with treatment:
1 Patient experiences:
-0.59 0.21 0.00 -0.86 0.25 0.00 -1.00 0.39 0.01 -1.58 0.51 0.00
no problems in walking about
some problems washing or dressing him/herself
inability to perform usual activities
no pain/discomfort
no anxiety/depression
2 Patient experiences:
-0.14 0.17 0.42 -0.56 0.21 0.01 0.11 0.32 0.74 -0.16 0.37 0.67
some problems in walking about
no problems washing or dressing him/herself
ability to perform usual activities
no pain/discomfort
no anxiety/depression
Seriousness ADR:
1 moderate 1.62 0.23 0.00 1.45 0.26 0.00 1.77 0.40 0.00 2.28 0.57 0.00
2 severe 0.93 0.17 0.00 0.62 0.20 0.00 0.91 0.31 0.00 1.23 0.47 0.01
Frequency:
1 1 in 10,000 patients 0.95 0.26 0.00 0.96 0.30 0.00 0.87 0.44 0.05 1.94 0.63 0.00
2 1 in 1,000 patients 0.48 0.22 0.03 0.78 0.26 0.00 0.47 0.39 0.24 0.89 0.49 0.07

Ch
apter 3
70
3 1 in 100 patients 0.58 0.18 0.00 0.38 0.20 0.05 1.00 0.32 0.00 0.99 0.40 0.01
Alternative treatments available:
1 Yes, three other treatments with milder ADRs -0.77 0.22 0.00 -1.39 0.27 0.00 -1.34 0.45 0.00 -1.15 0.51 0.02
2 Yes, one other treatment with milder ADRs -0.72 0.19 0.00 -1.13 0.23 0.00 -0.87 0.34 0.01 -1.32 0.47 0.01
3 Yes, one other treatment with similar but less frequent ADRs
-0.47 0.21 0.02 -0.88 0.25 0.00 -0.58 0.33 0.08 -0.74 0.47 0.11
Table 3.B1: Multinomial logit models estimated separately for all subgroups. Abbreviations: Coef. Coefficient; St.Er. standard error; p p-value; ADR adverse drug reaction.

Chapter 4
Value for money of drug regulation
JC Bouvy
MA Koopmanschap
H Schellekens
Published in:
Expert Reviews Pharmacoeconomics & Outcomes Research 2012;12(3):247-249.
Chapter 4
72
Ch
apte
r 3
Introduction
Three keystones of pharmaceutical market authorization are quality, safety and efficacy. The
required standards for market authorization are set out by regulatory authorities, such as the
US FDA and the EMA in Europe. The objective of drug regulation is to protect and promote
public health. Drug regulation protects public health by keeping low quality, unsafe and
inefficacious drugs from entering the market, and promotes public health through facilitating
needed drugs to enter the market without unnecessary delay[1]. These objectives are reached
through hundreds of guidelines that structure both drug development and post marketing
surveillance.
However, the pharmaceutical industry is struggling. It takes pharmaceutical companies many
years to discover and develop new products and to generate all the required data for market
authorization. Moreover, the costs of pharmaceutical R&D have been increasing
exponentially during the last four decades[2], and the costs of pharmaceutical R&D are
directly related to compliance with regulatory requirements. The drug regulatory framework
may have contributed substantially to public health. However, drug regulation could also
hinder public health by setting unnecessary hurdles for much-needed drugs entering the
market through ineffective and costly regulatory requirements. Until now, the potential
negative impact that drug regulation might have on the costs and output of pharmaceutical
R&D has received relatively little attention in the literature, even though the need for an
efficient and effective drug regulatory framework has been stipulated before[1]. If regulatory
requirements do not result in promoting health by ensuring that more safe and efficacious
drugs reach the market, but do yield substantial costs, they should be revoked from the drug
regulatory framework.
The WHO’s 2002 report ‘Effective Drug Regulation’ provided an elegant framework for
evaluating the efficiency and effectiveness of drug regulation by identifying all relevant parts
of drug regulation that should be examined, but concluded that “ideally, an assessment of
drug regulation should begin by studying regulatory outcomes to judge overall performance and
identify problem areas… [yet] outcomes are often not readily measurable”[1]. We believe that it
is not only possible but also essential to measure drug regulatory outcomes, as drug
regulation serves a societal objective and therefore should be subjected to social scrutiny.
Health technology assessment (HTA), a method that enables assessment of the cost–
effectiveness of any intervention aimed at increasing health, should be used to determine the
value of drug regulation.

Value for money of drug regulation
73
Drug regulation
The ‘cautious regulator’ problem has been named as one of the four main causes of
increasing R&D costs and declining R&D efficiency.[3] Often, the regulatory ratchet is
tightened after incidents that ignite the development of new regulatory requirements so as
to prevent a similar incident from occurring in the future. A well-known example is the
instigation of modern-day drug regulation after the thalidomide disaster in the 1960s. More
recent examples include the rofecoxib (Vioxx; Merck) withdrawal (owing to an increased risk
of heart attack and stroke) in 2004, which has been named a ‘wake-up call’ for regulatory
authorities[4] and created a greater public and regulatory awareness of drug safety.
TeGenero’s infamous 2006 TGN1412 clinical trial, in which six healthy volunteers developed
life-threatening complications after administration of the compound, resulted in adapted
regulatory requirements for first-in-man trials.[5] In addition, a Phase I clinical trial devoted to
studying a compound’s QT interval-prolonging abilities (the ‘thorough QT/QTc study’) has
been a mandatory part of drug development since 2005, after the QT-prolonging and
torsadogenic potential of several pharmaceuticals was the most common cause of drug
withdrawal during the 1990s.[6] New requirements are frequently added to the regulatory
framework but requirements are rarely removed, even if removing the regulatory
requirement would not result in a significant risk to drug safety.[3] A risk averse society might
prefer such a ‘better safe than sorry’ regulatory approach. However, if this risk-averse
approach significantly increases R&D costs without resulting in meaningful promotion of
public health, a new view on the drug regulatory framework is warranted, especially if by
revoking pointless regulatory requirements from the regulatory framework, savings could be
achieved without health losses.
HTA & the value of drug regulation
Drug regulation serves a societal function. Society pays for it through consumption of
medicines, through taxes that are used to finance regulatory authorities and medical
expenses, and through health insurance to cover the costs of medicines. Consequently, if
drug regulation is not cost effective, this will result in substantial opportunity costs for
society. HTA assesses the added value of health interventions by weighing incremental
effects against incremental costs. Although predominantly used to assess the cost–
effectiveness of medical interventions, any policy aimed at increasing public health, including
drug regulation, can be subjected to a cost–effectiveness analysis. Furthermore, if all

Chapter 4
74
Ch
apte
r 3
regulatory requirements were cost effective, drug regulation would be highly efficient in
producing good health outcomes at acceptable costs.
The structures and processes that are in place in the drug regulatory framework produce
regulation outcomes that can be assessed by the availability of safe, effective and good-
quality drugs, rational prescribing and appropriate dispensing.[1] However, drug regulation
outcomes should also produce actual health outcomes, in the form of better treatment of
illness, increased prevention of disease and decreased morbidity and mortality.[1] Cost–
effectiveness analysis could identify whether the costs of drug regulations produce
acceptable returns in the form of increased public health.
We have performed a cost–effectiveness analysis of the guideline requiring a thorough
QT/QTc study to assess a product’s QT-prolonging ability during clinical development, which
was adapted by the regulatory authorities of the USA, Europe and Japan in 2005. This
guideline intends to increase patient safety by minimizing the risk of products that could
cause drug-induced sudden cardiac deaths from entering the market. Our results show that it
is very unlikely that this regulation is cost effective.[7] Health gains achieved through its
implementation result in incremental cost–effectiveness far beyond what is considered
acceptable for medical interventions. If this guideline is withdrawn as a clinical development
requirement, total R&D costs would decrease (a thorough QT/QTc study costs between €1
and 5 million) and a modest reduction in clinical development times could be achieved.
Society seems to value safety-related regulatory actions. In a recent willingness-to-pay (WTP)
study, we found that the general public was willing to accept a small increase of their annual
health insurance premium (median WTP of €10, total annual premium of ±€1,100) in order to
protect epoetin users from the risk of pure red cell aplasia.[8] However, our study also shows
that WTP for regulatory actions is not unlimited. Therefore, it is important to also determine
the cost–effectiveness of safety-related regulatory requirements post approval.
Cost–effectiveness analysis of drug regulation is not without challenges. In particular, when
using quality-adjusted life years in a study, patient-specific life expectancy and health-related
quality-of-life estimates based on published sources will have to be used. However, a paradox
that has been encountered in the cost–effectiveness analysis of drug regulation is of greater
concern. Drug regulation should, directly or indirectly, protect or promote public health, as is
also stated by regulatory authorities. Nevertheless, identifying the actual mechanism through
which health gains from a regulatory requirement are to be achieved proves to be daunting
in reality. This mechanism is often indirect, nonexistent or unclear, but is essential in
assessing a regulatory requirement’s cost–effectiveness. Therefore, regulators developing
new guidelines should define directly how the guideline will contribute to public health. Such
a definition is needed for an ex-post evaluation of a guideline after implementation.

Value for money of drug regulation
75
The impact of drug regulation on the current crisis in the pharmaceutical industry has long
been overlooked. Therefore, the assessment of the effects of drug regulation on the
development of innovative drugs is necessary. Systematically evaluating the cost–
effectiveness of drug regulation in order to determine whether adding a requirement to the
development process offers value for money would be an essential step toward a more
sustainable system of drug development.
References 1. Ratanawijitrasin S, Wondemagegnehu E. Effective drug regulation: A multicountry study. World
Health Organization, Geneva, Switzerland (2002).
2. Munos B. Lessons from 60 years of pharmaceutical innovation. Nature Rev Drug Discov. 8, 959-968
(2009).
3. Scannell JW, Blanckley A, Boldon H, Warrington B. Diagnosing the decline in pharmaceutical R&D
efficiency. Nature Rev Drug Discov. 11(March), 191-200 (2012).
4. Greener M. First do no harm. Improving drug safety through legislation and independent research.
EMBO Reports. 9(3), 221-224 (2008).
5. Nada A, Somberg J. First-in-man (FIM) clinical trials post-TeGenero: a review of the impact of the
TeGenero trial on the design, conduct, and ethics of FIM trials. Am J Ther. 14, 594-604 (2007).
6. Shah RR. Can pharmacogenetics help rescue drugs withdrawn from the market?
Pharmacogenomics. 7, 889-908 (2006).
7. Bouvy JC, Koopmanschap MA, Shah RR, Schellekens H. The cost-effectiveness of drug regulation:
the example of thorough QT/QTc studies. Clin Pharmacol Ther. 91(2), 281-288 (2012).
8. Bouvy JC, Weemers J, Schellekens H, Koopmanschap MA. Willingness to pay for adverse drug event
regulatory actions. Pharmacoecon. 29(11), 963-975 (2011).

Chapter 4
76
Ch
apte
r 3

Chapter 5
The cost-effectiveness of two endovascular
treatment strategies versus intravenous
thrombolysis
JC Bouvy
PSS Fransen
SA Baeten
MA Koopmanschap
LW Niessen
DWJ Dippel
Accepted for publication:
Acta Neurologica Scandinavica

Chapter 5
78
Ch
apte
r 3
Summary
Objective: To assess the cost-effectiveness of endovascular treatment against intravenous
thrombolysis (IVT) when varying assumptions concerning its effectiveness.
Methods: We developed a health economic model including a hypothetical population
consisting of patients with ischemic stroke, admitted within 4.5 hours from onset, without
contra-indications for IVT or IAT. A decision tree and life-table were used to assess 6 month-
and lifetime costs (in Euros) and effects in quality-adjusted life years (QALY) treatment with
IVT alone, IAT alone, and IVT followed by IAT if the patient did not respond to treatment.
Several analyses were performed to explore the impact of considerable uncertainty
concerning the clinical effectiveness of endovascular treatment.
Results: Probabilistic sensitivity analysis demonstrated a 54% probability of positive
incremental lifetime effectiveness of IVT-IAT versus IVT alone. Sensitivity analyses showed
significant variation in outcomes and cost-effectiveness of the included treatment strategies
at different model assumptions.
Conclusions: Acceptable cost-effectiveness of IVT-IAT compared to IVT will only be possible if
recanalization rates are sufficiently high (>50%), treatment costs of IVT-IAT do not increase,
and complication rates remain similar to those reported in the few randomized studies
published to date. Large randomized studies are needed to reduce the uncertainty
concerning the effects of endovascular treatment.

The cost-effectiveness of endovascular treatment
79
Introduction
Thrombolysis with intravenous recombinant tissue plasminogen activator (rtPA) significantly
improves clinical outcome in patients with acute ischemic stroke when administered within
4.5 hours after symptom onset.[1-3] However, the effectiveness of intravenous thrombolysis
(IVT) is limited in patients with large intracranial occlusions.[4] Only a few randomized
controlled trials have tested the safety and efficacy of intra-arterial treatment (IAT) for acute
ischemic stroke caused by proximal intracranial arterial occlusion.[5-8] These studies suggest
IAT might be beneficial if treatment is started within 6 hours from onset of stroke symptoms -
compared to conservative treatment[6] or even IVT.[8]
Several other endovascular interventions have emerged in the last decade: mechanical clot
removal by means of aspiration and retraction devices,[9,10] IVT followed by IAT if
recanalization is not achieved and the use of a retrievable stent.[4] However, these studies
only provide limited evidence of safety and efficacy as they consist of selected and non-
randomized patient groups.[11,12]
As endovascular treatment remains an experimental treatment to date, the cost-
effectiveness against IVT has not been established, but is crucial if endovascular treatment is
introduced as a standard therapy in clinical practice. Therefore, we created a health economic
model that combines available published evidence to assess the cost-effectiveness of
endovascular treatment against IVT. Furthermore, we report cost-effectiveness at different
levels of key parameters determining the potential cost-effectiveness of endovascular
treatment against IVT: successful recanalization, the complication rate, and total treatment
costs of endovascular treatment.
Methods
Overview
We included four treatment strategies for acute ischemic stroke patients eligible for
endovascular treatment in our model: (1) conservative treatment for all, (2) IVT for all, (3)
direct IAT for those with an intracranial arterial occlusion and IVT for all others, and (4) IVT-
IAT (IVT for all, followed by IAT for those with an intracranial arterial occlusion that has not
yet recanalized).
A health economic model was created in the program TreeAge Pro 2009 Healthcare Module
(TreeAge Software Inc., Williamstown, Mass.) as a decision tree to model costs in 2010 Euros

Chapter 5
80
Ch
apte
r 3
and effects in quality-adjusted life years (QALYs) up to 6 months after initial stroke. A
multistate life-table originally created for analyzing the cost-effectiveness of stroke
services[13] was adapted for use in this study to model the lifetime costs and effects of the
treatment strategies. The life-table was written in Microsoft Excel (Microsoft Office 2010).
The outcome distribution in modified Rankin Scale (mRS) of the decision tree at six months
was input for the life-table. The decision model (Figure 1) provided the partial effects of
different clinical mechanisms (arterial occlusion, recanalization and symptomatic intracranial
hemorrhage (sICH)) that combined, lead to the overall treatment effect of IVT and/or IAT.
Patient characteristics
In patients with a clinical diagnosis of ischemic stroke a CT scan is performed to rule out
intracerebral hemorrhage. In patients who may be candidates for intra-arterial treatment,
CTA or MRA is used to diagnose a relevant intracranial arterial occlusion. Patients who can be
treated within 4.5 hours from symptoms onset are included. The usual contra-indications for
IVT apply[14] and patient characteristics were assumed to be similar to those reported in the
NINDS trial.[15,16] Therefore the model calculated expected health outcomes (in QALYs) and
costs (in 2010 Euros) for an average patient eligible for IVT treatment.
Interventions
In the conservative treatment strategy, patients undergo CT scan and receive best medical
care including antiplatelet therapy, but no thrombolytics. The reported risk of symptomatic
intracranial hemorrhages in these conservatively treated patients varies between trials from
0% to 1%, depending on definitions and co-medication; we used a point value of 0.1%[2] (Table
I). The rate of recanalization of occluded vessels (TICI 2 or 3) without further treatment was
0. Even though spontaneous recanalization has been observed,[23,24] it was not included
separately as it is difficult to accurately quantify. The probability of conservatively treated
patients with no recanalization of occluded vessels to have a good outcome (mRS of 0-1 or 2-
3) was 50%, allowing for favourable outcome after conservative treatment. Conservatively
treated patients with no visible occlusion had a probability of good outcome of 60%.
In the model, effectiveness of different treatment strategies was achieved through the
recanalization rate of the treatment strategies. The relationship between recanalization and
good clinical outcome has not been well established in the literature, due to differences in
timing of the interventions, assessment of vessel recanalization, and exact definitions of
revascularization in different studies. The most comprehensive overview of recanalization
rates and good clinical outcome is reported by Rha and Saver (2007).

The cost-effectiveness of endovascular treatment
81
Figure 1: Outline of decision tree 0-6 months
They reported good outcome in recanalized patients of 58.1%, versus 24.8% in nonrecanalized
patients.[20] We used an estimated probability of 80% of good outcome after recanalization in
patients. Our estimate is higher as we define good outcome as mRS of 0-3 where Rha and
Saver define good outcome as either a mRS of 0-2, or whichever other definition of good
outcome was used in the studies they included. To validate the estimated relationship
between recanalization and good outcome, we included conservative treatment in our model
to check whether the model predicts a valid difference in mRS distribution at 6 months after
initial stroke between conservative treatment and IVT. The difference in clinical outcome
between conservative treatment and IVT has been well reported[1] and is similar to the
difference in clinical outcomes calculated by the model for conservative treatment and IVT
(Appendix 5.B). Although recanalization is not the only predictor of clinical outcome,[25] for
modeling purposes we only included recanalization and the occurrence of sICH as
determinants of clinical outcome in our model.
Patients in the IVT treatment strategy undergo CT scan and receive alteplase, 10% as bolus,
and remaining 90% as 1-hour infusion. Recanalization of occluded vessels after IVT is assumed
to be 30% in patients with a visible occlusion. Patients in the IAT treatment strategy undergo
CT and CTA scan. The proportion of patients with a proximal intracranial arterial occlusion
was estimated at 25%.[17] These patients will be treated with 0.3 mg/kg rtPA or an equivalent
dose of urokinase administered at-around the lesion within 1 hour from diagnosis using a
microcatheter. A retrievable stent is used in 50% of patients, based on clinical experience in a

Chapter 5
82
Ch
apte
r 3
Dutch University hospital. It was assumed that 70% of patients would achieve recanalization
after IAT[19,26] (Appendix 5.A). Patients who enter the IVT-IAT treatment strategy undergo CT
and CTA scan and will be treated with standard dose IV alteplase. Patients with an intracranial
occlusion will subsequently receive intra-arterial treatment as described above. Estimates of
the rate of recanalization (85% of patients that undergo IVT-IAT) were based on published
data from randomized and non-randomized studies (Appendix 5.A).
It is important to note that even in the IAT and IVT-IAT treatment strategies, 75% of patients
were treated with IVT only. The overall difference in clinical outcomes between the
treatment strategies is driven by the 25% of patients that would have a visible intracranial
occlusion at CTA/MRA <4.5 hours of symptom onset and subsequently would receive IAT or
IVT-IAT. Consequently, the probabilities for the actual IVT-IAT treatment group differ (and are
less favourable) to the overall treatment strategy probabilities: the proportion of patients
with a visible occlusion, with good outcome after IVT-IAT is 67%, and mortality risk at three
months for this subgroup is 22.4%.
Endpoints
The intermediary endpoints of the model were mRS scores six months after initial stroke.[27]
We assumed that the mRS and corresponding health utility as a result of the initial stroke did
not change after six months. To convert functional outcome as measured by mRS at six
months into a health utility measure, we used data from the PRACTISE trial.[16] We used the
Dutch general public’s valuation of EQ-5D health states[28] to assign utility values to the
different mRS categories in this study and used these in the model. A score on the mRS of 0-1
was assigned a utility of 0.90, mRS of 2-3 was assigned 0.66, mRS of 4 0.43 and a mRS score
of 5 was assigned a utility of 0.18 (Table 1).
Multistate Life-table
To calculate lifetime costs and effects we used a life-table with five transition states: mRS 0-1,
2-3, 4, 5, and death (Figure 1). Patient flows between these states were based on
epidemiological estimates from the Netherlands and have been described elsewhere.[13] All
transitions were assumed to take place at the end of a six-month cycle. Entry into the life-
table was based on functional outcome at six months after initial stroke, as provided by the
decision tree. The life table calculated lifetime QALYs and healthcare costs for each
treatment strategy. Transition probabilities in the life table were differentiated for stroke
severity, patient sex and age and are consecutively weighted by age- and sex-specific stroke
incidence rates from the Netherlands.[29] Death (by stroke recurrence, complications, other
cardiovascular events, or other cause mortality) was the only absorbing state.
The cost-effectiveness of endovascular treatment
83
Costs
Cost data from the EDISSE trial and PRACTISE trial, converted to 2010 Euros, were used for
cost estimates in the model. Details of these studies have been published elsewhere.[13,16,22]
The basic cost estimates (similar for all treatment strategies) were measured in the EDISSE
trial and represented averages of patient-level cost data for hospital care, rehabilitation,
nursing home, and home care costs, differentiated by functional outcome at six months
(Table I). These costs include personnel, overhead, and housing costs. We used cost-data
from the EDISSE trial intervention region (Delft) as nowadays all stroke care is provided
through stroke units and services in the Netherlands.[30] We collected additional cost data
from a University hospital in the Netherlands (Erasmus University Medical Center,
Rotterdam), providing additional costs components for IVT and IAT treatment: rt-PA,
additional nurse and physician time, catheters, vascular closure device, mechanical
thrombectomy device, retrievable stent, and radiology personnel. Additional treatment costs
were €971 for IVT, €3,847 for IAT, and €4,171 for IVT-IAT per patient (Table I). The life-table
distinguished between costs 0-6 months after stroke, 7-12 months after stroke, and half-
yearly costs after the first year per disability state. Costs and effects were discounted at 3%
annually.[31]
Sensitivity analyses
The sICH rate, recanalization rate after IVT-IAT, good outcome after recanalization, IVT-IAT
treatment costs, and percentage of visible occlusions were varied in a sensitivity analysis. We
performed probabilistic sensitivity analysis (PSA) using Monte Carlo simulation for the 6-
month and lifetime cost-effectiveness. We used standard distributions[32] for all parameters
(indicated in Table I) in the model in the PSA after six months. We performed the lifetime PSA
by using a distribution (Appendix 5.B) for the mRS scores at 6-months that are entered into
the life-table. We used a threshold willingness to pay of €50,000 per QALY to determine what
percentage of the simulations resulted in cost-effective outcomes.
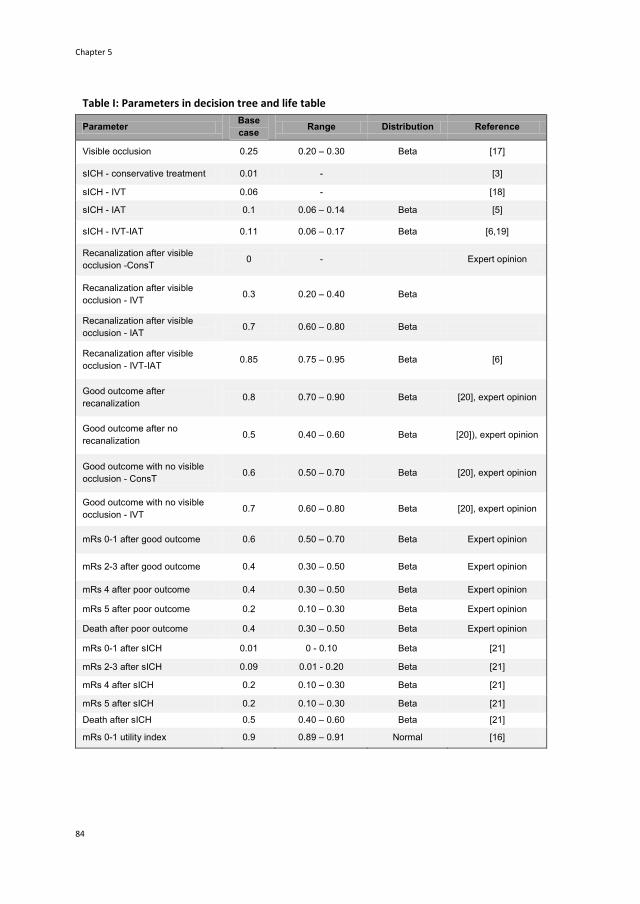
Chapter 5
84
Ch
apte
r 3
Table I: Parameters in decision tree and life table
Parameter Base
case Range Distribution Reference
Visible occlusion 0.25 0.20 – 0.30 Beta [17]
sICH - conservative treatment 0.01 - [3]
sICH - IVT 0.06 - [18]
sICH - IAT 0.1 0.06 – 0.14 Beta [5]
sICH - IVT-IAT 0.11 0.06 – 0.17 Beta [6,19]
Recanalization after visible
occlusion -ConsT 0 - Expert opinion
Recanalization after visible
occlusion - IVT 0.3 0.20 – 0.40 Beta
Recanalization after visible
occlusion - IAT 0.7 0.60 – 0.80 Beta
Recanalization after visible
occlusion - IVT-IAT 0.85 0.75 – 0.95 Beta [6]
Good outcome after
recanalization 0.8 0.70 – 0.90 Beta [20], expert opinion
Good outcome after no
recanalization 0.5 0.40 – 0.60 Beta [20]), expert opinion
Good outcome with no visible
occlusion - ConsT 0.6 0.50 – 0.70 Beta [20], expert opinion
Good outcome with no visible
occlusion - IVT 0.7 0.60 – 0.80 Beta [20], expert opinion
mRs 0-1 after good outcome 0.6 0.50 – 0.70 Beta Expert opinion
mRs 2-3 after good outcome 0.4 0.30 – 0.50 Beta Expert opinion
mRs 4 after poor outcome 0.4 0.30 – 0.50 Beta Expert opinion
mRs 5 after poor outcome 0.2 0.10 – 0.30 Beta Expert opinion
Death after poor outcome 0.4 0.30 – 0.50 Beta Expert opinion
mRs 0-1 after sICH 0.01 0 - 0.10 Beta [21]
mRs 2-3 after sICH 0.09 0.01 - 0.20 Beta [21]
mRs 4 after sICH 0.2 0.10 – 0.30 Beta [21]
mRs 5 after sICH 0.2 0.10 – 0.30 Beta [21]
Death after sICH 0.5 0.40 – 0.60 Beta [21]
mRs 0-1 utility index 0.9 0.89 – 0.91 Normal [16]

The cost-effectiveness of endovascular treatment
85
Table I continued
mRs 2-3 utility index 0.66 0.65 – 0.67 Normal [16]
mRs 4 utility index 0.43 0.42 – 0.44 Normal [16]
mRs 5 utility index 0.18 0.17 – 0.19 Normal [16]
Death utility index 0 - [16]
mRs 0-1 total costs 6 months -
ConsT €2.769 ± 20% Gamma [13,22]
mRs 2-3 total costs 6 months -
ConsT €10.508 ± 20% Gamma [13,22]
mRs 4 total costs 6 months -
ConsT €32.947 ± 20% Gamma [13,22]
mRs 5 total costs 6 months -
ConsT €29.775 ± 20% Gamma [13,22]
Death total costs 6 months -
ConsT €6.403 ± 20% Gamma [13,22]
Additional costs 6 months IVT €971 ± 20% Gamma 2010 prices
Additional costs 6 months IAT €3.847 ± 20% Gamma 2010 prices
Additional costs 6 months IVT-
IAT €4.171 ± 20% Gamma 2010 prices
Additional costs IVT: additional physician time, additional nurse time, tPA. Additional costs IAT and IVT-IAT: additional physician time, additional nurse time, tPA, radiologist time, retrievable stent (costs per stent €4,000 used in 50% of patients), catheter, Angio seal. All parameters were included in the PSA (apart from sICH after conservative and intravenous thrombolysis, as they is little uncertainty regarding these estimates, as well as the utility for health state death, as there is no uncertainty regarding this value either). The used distributions and corresponding plausible ranges are provided. Abbreviations: sICH symptomatic intracranial hemorrhage; IVT intravenous thrombolysis; IAT intra-arterial thrombolysis; mRs modified Rankin score; ConsT conservative treatment.
Results
Base-case
The incremental cost-effectiveness ratio (ICER) of IVT-IAT compared to IVT was €31,687 at six
months and €1,922 at the lifetime horizon (Table II; see Appendix 5.C for an explanation of
the calculation of the ICERS). However, as our base-case estimates were surrounded by
considerable uncertainty concerning the treatment effect of IVT-IAT, sensitivity analysis was
undertaken to investigate the impact of varying effect assumptions on the ICER.
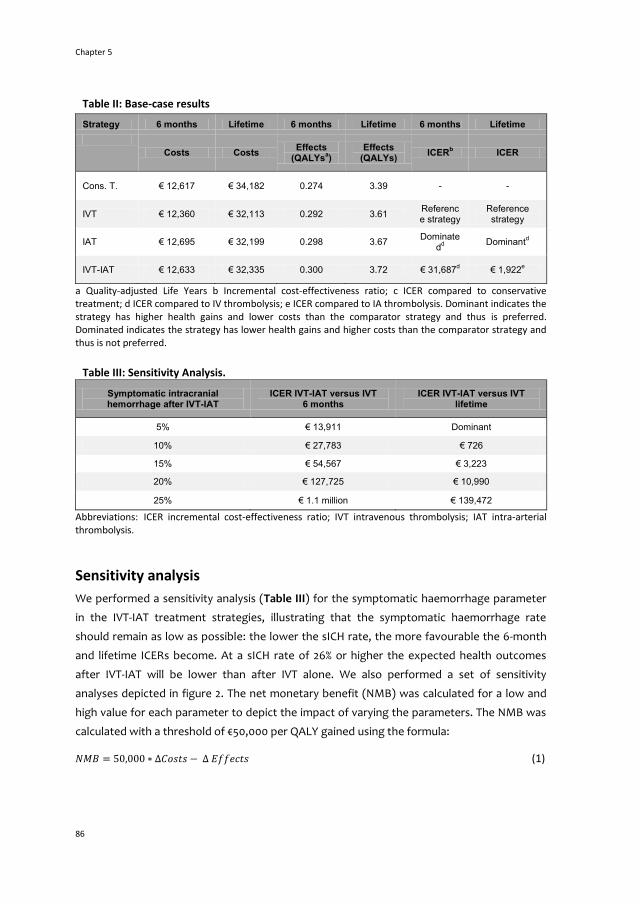
Chapter 5
86
Ch
apte
r 3
Table II: Base-case results
Strategy 6 months Lifetime 6 months Lifetime 6 months Lifetime
Costs Costs Effects
(QALYsa)
Effects (QALYs)
ICERb ICER
Cons. T. € 12,617 € 34,182 0.274 3.39 - -
IVT € 12,360 € 32,113 0.292 3.61 Reference strategy
Reference strategy
IAT € 12,695 € 32,199 0.298 3.67 Dominate
dd
Dominantd
IVT-IAT € 12,633 € 32,335 0.300 3.72 € 31,687d € 1,922
e
a Quality-adjusted Life Years b Incremental cost-effectiveness ratio; c ICER compared to conservative treatment; d ICER compared to IV thrombolysis; e ICER compared to IA thrombolysis. Dominant indicates the strategy has higher health gains and lower costs than the comparator strategy and thus is preferred. Dominated indicates the strategy has lower health gains and higher costs than the comparator strategy and thus is not preferred.
Table III: Sensitivity Analysis.
Symptomatic intracranial hemorrhage after IVT-IAT
ICER IVT-IAT versus IVT 6 months
ICER IVT-IAT versus IVT lifetime
5% € 13,911 Dominant
10% € 27,783 € 726
15% € 54,567 € 3,223
20% € 127,725 € 10,990
25% € 1.1 million € 139,472
Abbreviations: ICER incremental cost-effectiveness ratio; IVT intravenous thrombolysis; IAT intra-arterial thrombolysis.
Sensitivity analysis
We performed a sensitivity analysis (Table III) for the symptomatic haemorrhage parameter
in the IVT-IAT treatment strategies, illustrating that the symptomatic haemorrhage rate
should remain as low as possible: the lower the sICH rate, the more favourable the 6-month
and lifetime ICERs become. At a sICH rate of 26% or higher the expected health outcomes
after IVT-IAT will be lower than after IVT alone. We also performed a set of sensitivity
analyses depicted in figure 2. The net monetary benefit (NMB) was calculated for a low and
high value for each parameter to depict the impact of varying the parameters. The NMB was
calculated with a threshold of €50,000 per QALY gained using the formula:
(1)

The cost-effectiveness of endovascular treatment
87
A positive NMB therefore indicates an ICER below the threshold whereas a negative NMB
indicates an ICER above the threshold. The tornado diagram (Figure 2) demonstrates that
results are most sensitive to the probability of good outcome after recanalization and the
probability of recanalization after IVT-IAT. Results become more favorable at lower sICH rates
after IVT-IAT.
Figure 2: Tornado diagram. The impact of varying one parameter on the results is shown in this figure. The net monetary benefit was calculated with a threshold willingness to pay of €50,000 per QALY gained. A positive NMB indicates an incremental cost-effectiveness ratio below this threshold, whereas a negative NMB indicates an ICER higher than the threshold. This tornado diagram shows that the results are most sensitive to the probability of good outcome after recanalization.
Probabilistic sensitivity analysis
We performed a PSA for both the results (IVT-IAT versus IVT) at six months and lifetime. At a
willingness to pay threshold of €50,000 per QALY, the probability of six-month cost-
effectiveness was 54.6% and the probability of lifetime cost-effectiveness was 67.3% (Figure
3). The PSA illustrated that there is substantial uncertainty whether IVT-IAT versus IVT alone
will produce positive incremental health effects and acceptable cost-effectiveness.
Discussion
Our model indicates that in only 54% of simulations of the lifetime PSA, IVT-IAT yielded higher
effectiveness for ischemic stroke patients compared to IVT alone, although the point

Chapter 5
88
Ch
apte
r 3
estimate for the lifetime ICER was €1,922 per QALY gained. This demonstrates the high
uncertainty regarding the clinical effectiveness of IVT-IAT versus IVT alone. If recanalization
(TICI 2 or 3) in 50% of all large vessel occlusion patients is achieved, IVT-IAT could be cost-
effective (considering a societal maximum willingness to pay per QALY of €50,000).
Furthermore, sensitivity analyses demonstrated that the rate of symptomatic intracerebral
haemorrhage following endovascular treatment needs to remain lower than 20% in order to
result in acceptable cost-effectiveness.
Our study has several limitations. First, there is substantial uncertainty concerning the
effectiveness of various endovascular treatment strategies. Therefore our study should be
seen as exploratory and our aim was not to estimate the cost-utility of IVT-IAT, but to explore
at what levels of effectiveness of IVT-IAT would be considered cost-effective. These levels
could be used as relevant targets for controlled trials of endovascular treatment. Second, we
combined data from different sources and trials not specifically designed for measuring costs
and effects of IVT and/or IAT. Studies investigating the clinical effectiveness of different
endovascular treatment strategies therefore ideally should also measure the costs of
different treatment strategies in clinical practice, especially since endovascular treatment is
more expensive than IVT treatment. Furthermore, our model is a simplified depiction of
endovascular treatment: recanalization may not necessarily result in nutritive reperfusion of
the target bed and sICH is not the only predictor of poor outcome. Additionally, time-to-
treatment is quite heterogeneous in the literature but we did not include a time-dependent
treatment effect. Hospitals managing to reduce the “door-to-groin” time may have better
results than we estimated.
The costs and effects our model calculates for the conservative and IVT treatment strategies
are similar to those reported by others.[33,34] The distribution of patients in the disability
states at six months for conservative treatment and IVT (Appendix 5.B) are quite similar to
those reported by a meta-analysis of several IVT trials reporting the distribution of the control
group patients and IVT.[1] We believe this supports the reliability of the predicted values
produced by our model.
We used a ‘lean’ intervention cost estimate: a retrievable stent or mechanical clot removal
device is only used in 50% of patients, no additional intensive care is needed, and additional
specialist time is limited. Therefore our estimated treatment costs of IVT-IAT might be lower
than in clinical practice. If actual treatment costs would be considerably higher than we
estimated, which could be the case when more stents or other costly materials are used, this
would negatively affect our results (Figure 2).

The co
st-effectiveness o
f end
ovascu
lar treatm
ent
89
Figure 3: Probabilistic sensitivity analysis. A: Cost-effectiveness plane at 6 months, IVT-IAT versus IVT alone. Each dot represents one iteration (Monte Carlo simulation, 10,000 iterations). B: Cost-effectiveness plane at lifetime, IVT-IAT versus IVT alone. Each dot represents one iteration (Monte Carlo simulation, 1,000 iterations). The line indicates a maximum willingness to pay per QALY of €50,000. At six months, 51.2% of all iterations resulting in both positive incremental costs and effects are below the threshold. At lifetime, 99% of all iterations with both positive incremental costs and effects are below the threshold.

Chapter 5
90
Ch
apte
r 3
Differences in expected costs and effects of the intervention strategies we included in the
model are small. Only patients with an intracranial occlusion (25%) are eligible for
endovascular treatment. Subsequently, 75% of patients in the model will only receive IVT,
regardless of the intervention strategy deployed. The model thus calculates expected costs
and effects of implementing IVT-IAT as an available treatment strategy for all acute ischemic
stroke patients eligible for IVT reaching the hospital within 4.5 hours of onset. Consequently
our results should be interpreted at the aggregated level of all ischemic stroke patients,
regardless of the presence of a visible intracranial occlusion.
Three cost-utility analyses of endovascular treatment strategies have been performed to
date[35-37] that all found evidence of reasonable cost-effectiveness of mechanical
thrombectomy as compared to conservative treatment. However, all three studies only
included hypothetical patients presenting with large vessel occlusion. As only approximately
25% of all acute ischemic stroke patients presenting within 4.5 hours after symptom onset will
have a visible occlusion, our results cannot be directly compared to the published studies. All
studies report more favourable ICERs and less uncertainty surrounding their results than our
study. However, the differences in hypothetical patient cohorts between our study and the
three currently published might well account for this difference. Kim et al. (2011)[37] report a
threshold recanalization rate of 52%, which is quite similar to our results. Nevertheless,
regional cost differences hinder a direct comparison, and all articles only report incremental
costs for base case scenarios, which makes it impossible to compare our total expected
lifetime costs and effects to those reported.
Empirical evidence is warranted before more general statements about the cost-
effectiveness of endovascular treatment for acute ischemic stroke can be made. Therefore
more randomized controlled studies investigating the effectiveness of intra-arterial
treatment for acute ischemic stroke are evidently needed to reduce the current uncertainty
concerning the effect of endovascular treatment on functional outcome of stroke patients.
Furthermore, the costs of these highly expensive treatment strategies should also be
assessed.
We tested the validity of our model by assessing its calculations of functional outcome for
conservatively and IVT – treated patients and performed extensive sensitivity analyses
exploring the substantial uncertainty concerning the actual treatment effect and costs of
endovascular treatment. Concluding, we believe that if endovascular treatment is ever to
make its way into clinical practice and become an accepted treatment option for acute
ischemic stroke patients, three conditions will have to be met: (1) endovascular treatment
costs should not increase beyond our base-case scenario estimated costs, (2) fair
recanalization rates and improved functional outcome have to be confirmed by randomized

The cost-effectiveness of endovascular treatment
91
controlled studies, and (3) the rate of symptomatic haemorrhage following treatment should
not exceed rates reported by the few randomized controlled studies published to date.[5-8]
References 1. Lees KR, Bluhmki E, von Kummer R, et al. Time to treatment with intravenous alteplase and
outcome in stroke: an updated pooled analysis of ECASS, ATLANTIS, NINDS, and EPITHET trials.
Lancet 2010;375:1675-1703.
2. Wardlaw JM, Murray V, Berge E, del Zoppo GJ. Thrombolysis for acute ischaemic stroke. Cochrane
Database Syst Rev 2009;4:CD000213.
3. Hacke W, Kaste M, Bluhmki E, et al. Thrombolysis with Alteplase 3 to 4.5 hours after acute ischemic
stroke. N Engl J Med 2008;359(13):1317-1329.
4. Cohen JE, Itshayek E, Moscovici S, et al. State-of-the-art reperfusion strategies for acute ischemic
stroke. J Clin Neurosci 2011;18:319-323.
5. Del Zoppo GJ, Higashida RT, Furlan AJ, Pessin MS, Rowley HA, Gent M. PROACT: a phase II
randomized trial of recombinant pro-urokinase by direct arterial delivery in acute middle cerebral
artery stroke. Stroke 1998;29:4-11
6. Furlan A, Higashida R, Wechsler L, et al. Intra-arterial Prourokinase for Acute Ischemic Stroke. The
PROACT II Study: A randomized controlled trial. JAMA 1999; 282: 2003-2011.
7. Ogawa A, Mori E, Minematsu K, et al. Randomized trial of intraarterial infusion of urokinase within 6
hours of middle cerebral artery stroke. The middle cerebral artery embolism local fibrinolytic
intervention trial (MELT) Japan. Stroke 2007;38:2633-2639
8. Ciccone A, Valvassori L, Ponzio M, et al. Intra-arterial of intravenous thrombolysis for acute ischemic
stroke? The SYNTHESIS pilot trial. J NeuroInterv Surg 2010;2(1):74-79.
9. Shi ZS, Loh Y, Walker G, Duckwiler GR, for the MERCI and Multi-MERCI Investigators. Clinical
outcomes in middle cerebral artery trunk occlusions versus secondary division occlusions after
mechanical thrombectomy: Pooled analysis of the MERCI and Multi-MERCI trials. Stroke
2010;41:953-960.
10. The Penumbra Pivotal Trial Investigators. The Penumbra pivotal stroke trial: the safety and
effectiveness of a new generation of mechanical devices for clot removal in intracranial large vessel
occlusive disease. Stroke 2009;40:2761-2768.
11. Higashida RT, Furlan AJ. Trial design and reporting standards for intra-arterial cerebral thrombolysis
for acute ischemic stroke. Stroke 2003;34;e109-e137.
12. Janjua N, Brisman JL. Endovascular treatment of acute ischaemic stroke. Lancet Neurol
2007;6:1086-1093.
13. Baeten S, Exel van NJA, Dirks M, Koopmanschap MA, Dippel DWJ, Niessen L. Lifetime health effects
and medical costs of integrated stroke services - a non-randomized controlled cluster-trial based life
table approach. Cost Eff Resour Alloc 2010;8(21):1-10.
14. Adams HP, del Zoppe G, Alberts MJ, et al. Guidelines for the early management of adults with
ischemic stroke. Stroke 2007;38:1655-1711.

Chapter 5
92
Ch
apte
r 3
15. The National Institute of Neurological Disorders and Stroke rt-PA Stroke Study Group. Tissue
plasminogen activator for acute ischemic stroke. N Engl J Med 1995; 333: 1581–1587.
16. Dirks M, Niessen LW, Wijngaarden van J, et al. Promoting thrombolysis in acute ischaemic stroke.
Stroke 2011;42:1325-1330.
17. Van Dijk EJ, Kranenburg RA, Van der Lugt A, Den Hertog MH, Dirks M, Dippel DWJ. CT angiography
and CT perfusion in acute ischemic stroke: safety, Feasibility and clinical relevance. Cerebrovasc Dis
2009; 27:177-178.
18. Graham GD. Tissue plasminogen activator for acute ischemic stroke in clinical practice: A meta-
analysis of safety data. Stroke 2003;34:2847-2850.
19. Lewandowski CA, Frankel M, Tomsick TA, et al. Combined intravenous and intra-arterial r-TPA
versus intra-arterial therapy of acute ischemic stroke. Emergency management of stroke (EMS)
Bridging Trial. Stroke 1999;30:2598-2605
20. Rha JH, Saver JL. The impact of recanalization on ischemic stroke outcome: a meta-analysis. Stroke
2007;38:967-973.
21. Brekenfeld C, Remonda L, Nedeltchev K, et al. Symptomatic intracranial haemorrhage after intra-
arterial thrombolysis in acute ischaemic stroke: assessment of 294 patients treated with urokinase.
Journal of Neurology, Neurosurgery and Psychiatry 2007;78:280-285.
22. Exel van NJA, Koopmanschap MA, Scholte op Reimer W, Niessen LW, Huijsman R. Cost-
effectiveness of integrated stroke services. Q J Med 2005; 98:415-425.
23. Molina CA, Montaner J, Abilleira S, et al. Timing of spontaneous recanalization and risk of
hemorrhagic transformation in acute cardioembolic stroke. Stroke 2001;32:1079-1084.
24. Kassem-Moussa H, Graffagnino C. Nonocclusion and spontaneous recanalization rates in acute
ischemic stroke. Arch Neurol 2002;59:1870-1873.
25. Hill MD, Khatri P, Tomsick TA, Simpson KN, Broderik JP. Letter by Hill et al Regarding article ‘A cost-
utility analysis of mechanical thrombectomy as an adjunct to intravenous tissue-type plasminogen
activator for acute large-vessel ischemic stroke. Stroke 2011;42:e641-e642.
26. The IMS Study Investigators. Combined intravenous and intra-arterial recanalization for acute
ischemic stroke: The Interventional Management of Stroke Study. Stroke 2004;35:904-911
27. Van Swieten JC, Koudstaal PJ, Visser MC, Schouten HJA, van Gijn J. Interobserver agreement for the
assessment of handicap in stroke patients, Stroke 1988;19:604-607.
28. Lamers LM, Stalmeier PFM, McDonnell J, Krabbe PFM, van Busschbach JJ. Measuring the quality of
life in economic evaluations: the Dutch EQ-5D tariff. Ned Tijdschr Geneeskd 2005;149:1574-1578. [in
Dutch]
29. Jager-Geurts MH, Peters RJG, van Dis SJ, Bots ML. Hart- en vaatziekten in Nederland 2006, cijfers
over ziekte en sterfte. Den Haag: Nederlandse Hartstichting 2006. [In Dutch]
30. Epstein D, Mason A, Manca A. The hospital costs of care for stroke in nine European countries.
Health Econ 2008 17:S21-S31.
31. Tan-Torres Edejer T, Baltrussen R, Adam T, et al, editors. Making choices in health: WHO guide to
cost-effectiveness analysis. Geneva, Switzerland: World Health Organization;2003.
32. Briggs A, Claxton K, Schulpher M. Decision modeling for health economic evaluation. Oxford,
United Kingdom: Oxford University Press; 2006.
The cost-effectiveness of endovascular treatment
93
33. Ehlers L, Andersen G, Beltoft Clausen L, Bech M, Kølby M. Cost-effectiveness of intravenous
thrombolysis with alteplase within a 3-hour window after acute ischemic stroke. Stroke 2007;38:85-
89.
34. Sandercock P, Berge E, Dennis M, et al. Cost-effectiveness of thrombolysis with recombinant tissue
plasminogen activator for acute ischemic stroke assessed by a model based on UK NHS costs.
Stroke 2004;35(6):1490-1497.
35. Patil CG, Long EF, Lansberg MG. Cost-effectiveness analysis of mechanical thrombectomy in acute
ischemic stroke. J Neurosurg 2009;110(3):508-513.
36. Nguyen-Huynh MN, Johnston SC. Is mechanical clot removal or disruption a cost-effective
treatment for acute stroke? Am J Neuroradiol 2011;32:244-249.
37. Kim AS, Nguyen-Huynh M, Johnston SC. A cost-utility analysis of mechanical thrombectomy as an
adjunct to intravenous tissue-type plasminogen activator for acute large-vessel ischemic stroke.
Stroke 2011;42:2013-2018.

Chapter 5
94
Ch
apte
r 3
Appendix 5.A: Overview of recanalization rates in randomized
controlled trials and observational studies
Study N Mean OTN
TIMI 2-3 TIMI 3 NIHSS‡
No thrombolysis
PRO-ACT II2
50 306 min 18% 2% 17 (4-28)
PRO-ACT I1
14 330 min 14.3% - 19*
Iv alteplase
CLOTBUST3
63 130 min - 13% 16 *
RECANALISE 107 163 min 52% 46% 16 (11-19)
IA alteplase or (pro) urokinase
PRO-ACT II2
108 280 min 66% 19% 17 (5-27)
PRO-ACT I1
26 330 min 58% 19% 17 *
MELT4
57 200 min 74% 5% 14 *
EMS7
10 180 min 50% 10% 11 (9-16)
Mattle et al6
55 240 min 71% 16% 16.7 (±5.1)
IV+IA alteplase
EMS7
11 220 min 82% 55% 16 (9-21)
IMS I8
62 210 min 56% 11% 18 *
IMS II9
55 180 min 60% 4% 19 *
Shaltoni et al
10 69 285 min 72% - 18 (6-39)
IA alteplase /urokinase followed by mechanical thrombectomy if deemed necessary
MERCI –II11
141 <8hrs 48% 24% 20.1(± 6.6)
Multi MERCI final12
164 270 min 68% - 19 (15-23)
Devlin13
25 < 8 hrs
56% - 18 *
Kim14
24 177 min 50% 25% 21 (11-30)
Bose15
21 < 8 hrs 100% 52% 21
McDougall16
125 260 min 82% 27.2% 17.6 (± 5.2)
RECANALISE5 53 132 min 87% 77% 14 (10-18)
Table 5.A Recanalization rates. ‡ Data are mean (SD) or median*(IQR). † OTN=Onset to needle
time
References to table 5.A
1. del Zoppo GJ, Higashida RT, Furlan AJ, Pessin MS, Rowley HA, Gent M. PROACT: a phase II
randomized trial of recombinant pro-urokinase by direct arterial delivery in acute middle cerebral
Appendix 5.A
95
artery stroke. PROACT Investigators. Prolyse in Acute Cerebral Thromboembolism. Stroke 1998
January;29(1):4-11.
2. Furlan A, Higashida R, Wechsler L, Gent M, Rowley H, Kase C, Pessin M, Ahuja A, Callahan F, Clark
WM, Silver F, Rivera F. Intra-arterial prourokinase for acute ischemic stroke. The PROACT II study: a
randomized controlled trial. Prolyse in Acute Cerebral Thromboembolism. JAMA 1999 December
1;282(21):2003-11.
3. Alexandrov AV. Ultrasound enhanced thrombolysis for stroke. Int J Stroke 2006 February;1(1):26-9.
4. Ogawa A, Mori E, Minematsu K, Taki W, Takahashi A, Nemoto S, Miyamoto S, Sasaki M, Inoue T.
Randomized trial of intraarterial infusion of urokinase within 6 hours of middle cerebral artery
stroke: the middle cerebral artery embolism local fibrinolytic intervention trial (MELT) Japan. Stroke
2007 October;38(10):2633-9.
5. Mazighi M, Serfaty JM, Labreuche J, Laissy JP, Meseguer E, Lavallee PC, Cabrejo L, Slaoui T, Guidoux
C, Lapergue B, Klein IF, Olivot JM, Raphaeli G, Gohin C, Claeys ES, Amarenco P. Comparison of
intravenous alteplase with a combined intravenous-endovascular approach in patients with stroke
and confirmed arterial occlusion (RECANALISE study): a prospective cohort study. Lancet Neurol
2009 September;8(9):802-9.
6. Mattle HP, Arnold M, Georgiadis D, Baumann C, Nedeltchev K, Benninger D, Remonda L, von
Budingen C, Diana A, Pangalu A, Schroth G, Baumgartner RW. Comparison of Intraarterial and
Intravenous Thrombolysis for Ischemic Stroke With Hyperdense Middle Cerebral Artery Sign. Stroke
2008 February 1;39(2):379-83.
7. Lewandowski CA, Frankel M, Tomsick TA, Broderick J, Frey J, Clark W, Starkman S, Grotta J, Spilker
J, Khoury J, Brott T. Combined Intravenous and Intra-Arterial r-TPA Versus Intra-Arterial Therapy of
Acute Ischemic Stroke : Emergency Management of Stroke (EMS) Bridging Trial. Stroke 1999
December 1;30(12):2598-605.
8. The IMS Study Investigators. Combined Intravenous and Intra-Arterial Recanalization for Acute
Ischemic Stroke: The Interventional Management of Stroke Study. Stroke 2004 April 1;35(4):904-11.
9. The IMS II Trial Investigators. The Interventional Management of Stroke (IMS) II Study. Stroke 2007
July 1;38(7):2127-35.
10. Shaltoni HM, Albright KC, Gonzales NR, Weir RU, Khaja AM, Sugg RM, Campbell MS, III, Cacayorin
ED, Grotta JC, Noser EA. Is intra-arterial thrombolysis safe after full-dose intravenous recombinant
tissue plasminogen activator for acute ischemic stroke? Stroke 2007 January;38(1):80-4.
11. Smith WS, Sung G, Starkman S, Saver JL, Kidwell CS, Gobin YP, Lutsep HL, Nesbit GM, Grobelny T,
Rymer MM, Silverman IE, Higashida RT, Budzik RF, Marks MP. Safety and efficacy of mechanical
embolectomy in acute ischemic stroke: results of the MERCI trial. Stroke 2005 July;36(7):1432-8.
12. Smith WS, Sung G, Saver J, Budzik R, Duckwiler G, Liebeskind DS, Lutsep HL, Rymer MM, Higashida
RT, Starkman S, Gobin YP, for the Multi MERCI Investigators. Mechanical Thrombectomy for Acute
Ischemic Stroke: Final Results of the Multi MERCI Trial. Stroke 2008 April 1;39(4):1205-12.
13. Devlin TG, Baxter BW, Feintuch TA, Desbiens NA. The Merci Retrieval System for acute stroke: the
Southeast Regional Stroke Center experience. Neurocrit Care 2007;6(1):11-21.
14. Kim D, Jahan R, Starkman S, Abolian A, Kidwell CS, Vinuela F, Duckwiler GR, Ovbiagele B, Vespa PM,
Selco S, Rajajee V, Saver JL. Endovascular mechanical clot retrieval in a broad ischemic stroke
cohort. AJNR Am J Neuroradiol 2006 November;27(10):2048-52.

Chapter 5
96
Ch
apte
r 3
15. Bose A, Henkes H, Alfke K, Reith W, Mayer TE, Berlis A, Branca V, Sit SP. The Penumbra System: a
mechanical device for the treatment of acute stroke due to thromboembolism. AJNR Am J
Neuroradiol 2008 August;29(7):1409-13.
16. McDougall CG, Clark WM, Mayer TE. The Penumbra II Trial: Safety and Effectiveness of a Novel
Device for Clot Extraction in Acute Ischemic Stroke [abstract]. Stroke 2008;40(4):e105.

Appendix 5.B
97
Appendix 5.B Outcome distributions at six months for all
treatment strategies
mRSa 0-1 mRS 2-3 mRS 4 mRS 5 Death
Conservative treatment 34% 23% 17% 9% 17%
IVTb
Range for PSAc
38% (26%-52%)
26% (18%-37%)
14% (11%-17%)
7% (0.04%-0.11%)
15% (-)
IATd alone 39% 27% 12% 7% 15%
IVT-IAT Range for PSA
40% (30%-49%)
27% (18%-37%)
12% (9%-15%)
7% (4%-10%)
14% (-)
Table 5.B Outcome distributions. a mRS modified Rankin Score; b IVT intravenous thrombolysis; c Range for probabilistic sensitivity analysis at lifetime costs and effects. All probabilities are assumed to follow a beta distribution. No range is reported for ‘death’ as patients who are deceased at six months never enter the multi-state life table. d IAT intra-arterial thrombolysis
Figure 5.B Outcome distributions of the model at six months for conservative treatment and intravenous thrombolysis and reported distributions of NINDS trial

Chapter 5
98
Ch
apte
r 3
Appendix 5.C Additional information Results
Results – Base Case
At six months after initial stroke, the expected health outcome for a patient is 0.274 QALYs
after conservative treatment, 0.292 QALYs after IVT, 0.298 QALYs after IAT and 0.300 QALYs
after IVT-IAT. The expected costs per patient are €12,617 after conservative treatment,
€12,800 after IVT, €13,003 after IAT, and €12,941 after IVT-IAT treatment.
The expected health outcome during the remaining lifetime of a patient after initial stroke is
3.39 QALYs after conservative treatment, 3.61 QALYs after IVT, 3.67 QALYs after IAT and 3.72
QALYs after IVT-IAT. The expected lifetime costs per patient are €34,182 for conservative
treatment, €32,113 for IVT, €32,199 for IAT and €32,335 for IVT-IAT.
Results – Incremental cost-effectiveness ratios
We calculated all ICERs by dividing the incremental costs of IVT-IAT by the incremental QALYs
of IVT-IAT compared to IVT alone. At six months, the expected health outcomes of IVT-IAT
are highest, but the expected costs of IAT are highest of all strategies. When comparing both
endovascular treatment strategies to the current standard treatment of IVT, we can conclude
that IAT alone is dominated by IVT-IAT as the expected outcomes are higher and expected
costs are lower (Table 3). The ICER of IVT-IAT versus IVT is €31,687 per QALY gained, implying
that if IVT-IAT would become an available treatment for all acute ischemic stroke patients,
€31,687 would have to be spent to gain one QALY after six months.
The expected lifetime costs of IAT and IVT-IAT are both lower than the expected lifetime
costs of IVT and both endovascular treatment strategies have higher expected lifetime
QALYs than IVT. However, IAT is not dominated by IVT-IAT as the expected costs are no
longer highest for IAT but for IVT-IAT. Therefore, first the ICER of IAT versus IVT was
calculated. As the expected costs of IAT are lower than the expected costs of IVT but the
expected health outcomes are higher, IAT is dominant over IVT (implicating that for each
QALY gained, money is saved when the new treatment is implemented). Subsequently the
ICER of IVT-IAT versus IAT was calculated: €1,922 per QALY gained. Therefore, when taking a
lifetime perspective IVT-IAT is the preferred treatment strategy as it produces the highest
expected lifetime QALYs at acceptable costs: €1,922 will have to be spent for every QALY
gained if IVT-IAT would be implemented as a standard treatment for acute ischemic stroke
patients.

Chapter 6
The cost-effectiveness of drug regulation:
The example of thorough QT/QTc studies
JC Bouvy
MA Koopmanschap
RR Shah
H Schellekens
Published in:
Clinical Pharmacology & Therapeutics 2012;91(2):281-288.

Chapter 6
100
Ch
apte
r 3
Summary
We analyzed the cost-effectiveness of the International Conference on Harmonisation (ICH)
E14 guideline that requires a thorough QT/QTc (TQT) study for all drugs under development.
We compared two pharmacoeconomic scenarios: the health effects and costs resulting from
implementing ICH E14 (“regulation” scenario) vs. not implementing ICH E14 (“no regulation”
scenario). We used a dynamic population model to calculate the cost-effectiveness of ICH E14
for a prototype QT-prolonging antipsychotic drug entering the US and European markets.
The incremental cost-effectiveness ratios of regulation vs. no regulation were ∼€2.4 million
per sudden cardiac death prevented and ∼€187,000 per quality-adjusted life year (QALY)
gained in users of antipsychotic drugs. The main driver of cost was the requirement for
electrocardiogram (ECG) monitoring of users of QTc-prolonging drugs. Even when several of
the assumptions in the model were varied, there were no results in favor of regulation. Our
study shows that cost-effectiveness analysis of drug regulatory measures is feasible and
should be considered before developing such measures.

The cost-effectiveness of thorough QT/QTc studies
101
Introduction
The pharmaceutical industry is one of the world’s most intensively regulated industries. The
average time between discovery and approval for a new drug is 10 to 13 years,[1] during which
the quality, safety, and efficacy of the product must be demonstrated as required by all major
regulatory agencies. The costs of developing and bringing a new drug to the market are high
and continue to rise, although the exact costs remain disputed.[1,2] As these rising costs
threaten to make the development of new drugs increasingly unaffordable, Rawlins (2004)
has called for efforts to address this problem, recommending that all aspects of the drug
discovery and development process be examined for potential cost savings.[3]
Restricted health-care budgets have forced governments worldwide to carefully scrutinize
the cost-effectiveness of novel interventions, including drugs. A standard approach to
evaluating the cost-effectiveness of health-care interventions is the quantification of health
gains in terms of quality-adjusted life years (QALYs). Regulatory measures implemented to
promote drug safety legitimately fall within the scope of such interventions. The costs of
drug development are an integral part of the cost-effectiveness of a drug and are directly
related to compliance with regulatory requirements. Therefore, regulatory measures that are
not themselves cost-effective could ultimately have an adverse effect on the cost-
effectiveness of new drugs. Currently, there is hardly any evidence regarding the cost-
effectiveness of regulatory requirements.[4,5]
Prolongation of the QT interval in the surface electrocardiogram (ECG), which could result in
potentially fatal ventricular tachyarrhythmias, most commonly torsade de pointes (TdP), was
a leading cause for drug withdrawals during 1988–2001.[6] The QT interval represents the
duration from the beginning of ventricular depolarization to the end of its repolarization.
Drugs are a common cause of QT prolongation, but the extent of drug-induced QT interval
prolongation is an imperfect marker of the proarrhythmic risk it poses clinically. However, a
heart-rate corrected QTc interval of ≥500 ms is widely accepted as representing an increased
risk of TdP, which could degenerate into ventricular fibrillation and result in sudden cardiac
death.[7]
In 2005, the International Conference on Harmonisation (ICH) promulgated a guideline (ICH
E14) aimed at characterizing the QT liability of a drug during its development. ICH E14, which
calls for a “thorough QT/QTc” (TQT) study for all new drugs before approval, has been
adopted by the US Food and Drug Administration, the European Medicines Agency, and the
Japanese Pharmaceutical and Medical Devices Agency. ICH E14 requires the design of a TQT
study to be rigorous enough to quantify the magnitude of drug-induced QT prolongation but
does not necessarily imply that a QT-prolonging drug is proarrhythmic.[8]

Chapter 6
102
Ch
apte
r 3
The aim of this study was to determine, from a societal perspective, the cost-effectiveness
and cost utility of ICH E14 as applied to antipsychotic drugs, including all medical costs plus
drug development costs and health effects resulting from the regulation. We compared two
scenarios: regulation (ICH E14 implemented) and no regulation (ICH E14 not implemented).
This way, the incremental cost-effectiveness ratio (ICER) of regulation vs. no regulation could
be estimated, yielding the amount society would have to pay to achieve the health gains
envisaged by ICH E14.
The frequency and intensity of drug-induced QT prolongation vary between drugs. However,
as a class, antipsychotic agents are particularly known to be associated with QT
prolongation.[9,10] Consequently, antipsychotic drugs that enter the market are more likely to
be those with a QT liability, and it is in this therapeutic class that ICH E14 can be expected to
have maximum benefits in terms of cost-effectiveness. Therefore, we limit our calculation
only to the effects of the regulation on the health of users of antipsychotic drugs. We also
briefly comment on the implications of our findings for other therapeutic classes that include
QT-prolonging drugs.
Results
Base case
On the basis of the discount rate in the Netherlands, the total discounted costs of 20 years of
regulation were €715 million: 21% from TQT studies (€150 million) and 79% from ECG
monitoring (€565 million). The total discounted health-care costs of no regulation (i.e., the
health-care costs of sudden cardiac deaths) were €513,000. Regulation prevented 296
(discounted) sudden cardiac deaths and gained 5,317 life years and 3,819 QALYs during 20
years. The ICERs of regulation as compared to no regulation were approximately €134,000
per life year gained, €2.4 million per sudden cardiac death prevented, and €187,000 per QALY
gained (Table I). Therefore, ICH E14 costs society €187,000 to gain one QALY and €2.4 million
to prevent one drug-induced sudden cardiac death. The use of US discount rates for the
calculation yielded values of approximately €169,000 ($246,000) per life year gained, €3 ($4.4)
million per sudden cardiac death prevented, and €235,000 ($343,000) per QALY gained
(exchange rate 1.4617; April 26, 2011). A more detailed description of the calculations used to
derive these results can be found in Appendix 6.A.

The cost-effectiveness of thorough QT/QTc studies
103
Table I: Results
Regulatory scenario
Total costs (mil€)
SCDs prev.
LYs gained
QALYs gained
Incr costs per LY gained
Incr costs per SCD
prevented ICER
Regulation (discount rate: costs 4%, health effects 1.5%)
€715 296 5,317 3,819 €134,418 €2,412,749 €187,175
Costs of TQT studies
€150
Costs of ECG monitoring
€565
No regulation (discount rate: costs 4%, health effects 1.5%)
€0.6 0 0 0 - - -
Costs of SCDs €0.6 0 0 0 - - -
Regulation
(US discount rate: costs 5%, health effects 5%)
€673 222 3,993 2,867 €168,516 €3,024,781 €234,655
Costs of TQT studies
€150
Costs of ECG monitoring
€523
No regulation (US discount rate: costs 5%, health effects
5%)
€0.5 0 0 0
Costs of SCDs €0.5 0 0 0
The incremental cost-effectiveness ratios (ICERs) of regulation compared to no regulation are reported in Euros per health effect gained. The ICER can be interpreted as the amount society will have to pay in order to gain one life year, prevent one sudden cardiac death, or gain one QALY when moving from an unregulated scenario to a regulated scenario. All total costs are discounted and summed over 20 years: e.g., the total costs of 20 years of ECG monitoring of new users are €565 million. All health effects and costs reported in this table are discounted, except the costs of TQT studies as they occur in year 0. Equation 1 was used to calculate all costs, health effects, and ICERs. Also see Supplementary Data online for explanation of the calculations. ECG, electrocardiograph; LY, life year; QALY, quality-adjusted life year; SCD, sudden cardiac death; TQT, thorough QT/QTc.
Sensitivity analyses
We performed several sensitivity analyses to determine the extent to which variations in the
parameters would impact the results (Table II). Increasing proarrhythmic QTc prolongation
to 2% resulted in lowering the ICER to €93,510 per QALY gained. Setting the number of TQT
studies to 1 decreased the ICER to €148,157 per QALY gained. Decreasing the number of
annual new users to 100,000 and setting the number of TQT studies to 1 changed the ICER to
€150,514 per QALY gained, thereby identifying ECG monitoring as the main cost driver. We
also analyzed two assumed outcomes of a virtual scenario in which compliance with ECG

Chapter 6
104
Ch
apte
r 3
monitoring is lowered by 70%: (i) health gains also decrease by 70% (ICER: €278,830 per QALY
gained), and (ii) health gains decrease by only 20% (ICER: €104,464 per QALY gained). The
latter outcome, corresponding to a situation in which the use of ECG monitoring is effectively
restricted to individuals with risk factors for proarrhythmic QTc prolongation, would lead to
preventing 80% of health losses.
Probabilistic sensitivity analysis
We performed a probabilistic sensitivity analysis to address the uncertainty surrounding
various model parameters. The cost-effectiveness plane (Figure 1) shows the cost-
effectiveness ratio for 10,000 iterations. Of these, 6.3% of ICERs were <€80,000 and 13.1%
were <€100,000. Also, 28.9% of the ICERs were >€250,000 and 7.7% were >€400,000. The
probabilistic sensitivity analysis shows the results to be robust to parameter uncertainty.
Furthermore, the probabilistic sensitivity analysis indicates that there is an 86.9% possibility
that the regulation requires society to pay more than €100,000 to gain one QALY (see
Appendix 6.A).
Discussion
Our results indicate that the regulatory requirement for TQT studies during the clinical
development of proarrhythmic drugs costs approximately €187,000 per QALY gained, a
substantially higher sum than society is at present willing to pay per QALY gained for health-
care programs in Europe (€20,000-80,000 per QALY).[11,12] In the United States, a threshold of
$50,000– $100,000 per QALY gained is commonly cited.[13] In users of antipsychotic drugs, the
health gains resulting from evaluating all drugs for their QT-prolonging properties do not
outweigh the costs associated with the regulation.
We altered several parameters to demonstrate variation in the results under different
assumptions in the model. None of these changes resulted in more favorable results for cost-
effectiveness of the regulatory requirements, showing that although under our assumptions
the model calculated maximum possible health gains for a prototype antipsychotic, changing
assumptions about the regulatory scenarios is unlikely to produce favorable results.
It seems paradoxical that, although the purpose of ICH E14 is to promote drug safety and
prevent drug-induced sudden cardiac deaths, if users of QT-prolonging drugs are not
routinely monitored by ECG recordings, fewer sudden cardiac deaths will be prevented in
clinical practice. However, our results indicate that, even for the current QTc-prolonging
antipsychotics on the market, routine ECG monitoring of all new users in clinical practice is

The cost-effectiveness of thorough QT/QTc studies
105
not cost-effective: when only the costs of one TQT study and ECG monitoring are included in
the analysis, the ICER for the regulation scenario remains at €148,000 per QALY gained.
Table II: Sensitivity Analysis
Parameter, base-case value
Costs per LY gained
Costs per SCD avoided
Costs per QALY gained
Base-case analysis € 134,418 € 2,4 million € 187,175
Incidence of proarrhythmic QTc prolongation 1%
Low estimate 0.5% € 268,948 € 4,827,500 € 374,506
High estimate 2% € 71,591 € 1,205,374 € 93,510
Costs of TQT study 1 million Euros
Low estimate 500,000 Euros € 120,314 € 2,159,580 € 167,535
High estimate 2 million Euros € 162,627 € 2,919,087 € 226,456
Costs of ECG 20 Euros
Low estimate 10 Euros € 81,258 € 1,458,543 € 113,150
High estimate 50 Euros € 293,900 € 5,275,369 € 409,251
3 ECGs per users € 187,579 € 3,366,956 € 261,201
Number of TQT studies performed N=150
Low estimate N=1 € 106,397 € 1,909,787 € 148,157
High estimate N=300 € 162,627 € 2,919,087 € 226,456
Costs of SCD 2,500 Euros
10-fold increase: costs 25,000 Euros € 133,415 € 2,394,734 € 185,778
Multivariate sensitivity analysis:
New users + number of TQT studies
Low estimate 100,000 , number of TQT studies =1 € 108,090 € 1,940,167 € 150,514
30% of users 2 ECGs, 30% of SCDs avoided € 200,239 € 3,594,204 € 278,830
30% of users 2 ECGs, 80% of SCDs avoided € 75,020 € 1,346,576 € 104,464
For each sensitivity analysis, one (or two) parameters in the model were varied while all other parameters were held constant, demonstrating the impact on the incremental cost-effectiveness ratios. The base-case results (first row) are also included. ECG, electrocardiograph; LY, life year; QALY, quality-adjusted life year; SCD, sudden cardiac death; TQT, thorough QT/QTc.
It may be argued that a TQT study effectively prevents proarrhythmic drugs from ever
entering the market, thereby justifying the current regulation. We did not consider potential
health gains resulting from this scenario. In practice, it might be questionable whether a drug
would fail to reach the market solely because of QT prolongation: it is a poor surrogate of a
risk that can be managed by appropriate labeling and compliance, and the benefit/risk of a
drug encompasses more than just the drug’s QT-prolonging potential, as evidenced by the
fact that several antipsychotics remain on the market despite their intense QT-prolonging
potential.
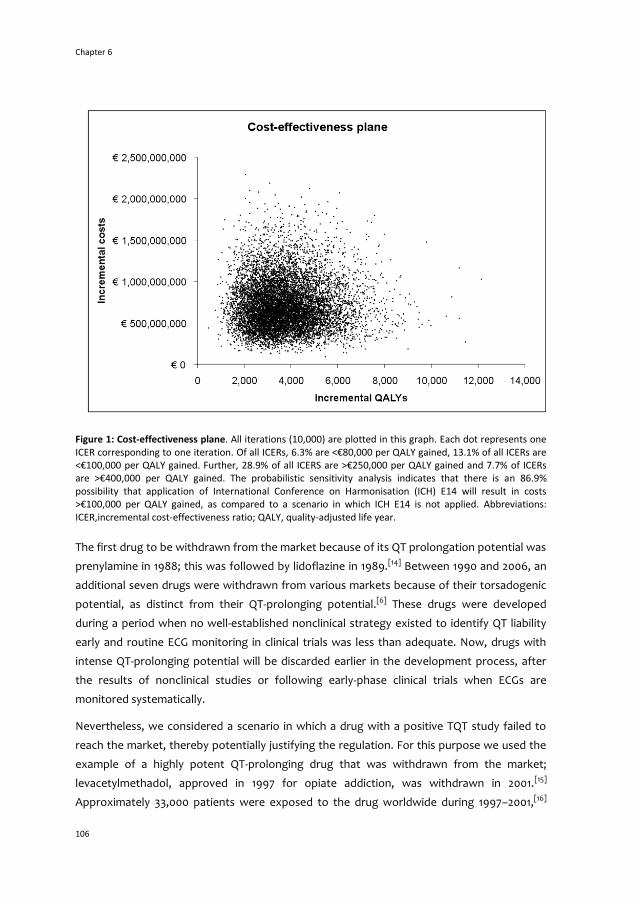
Chapter 6
106
Ch
apte
r 3
Figure 1: Cost-effectiveness plane. All iterations (10,000) are plotted in this graph. Each dot represents one ICER corresponding to one iteration. Of all ICERs, 6.3% are <€80,000 per QALY gained, 13.1% of all ICERs are <€100,000 per QALY gained. Further, 28.9% of all ICERS are >€250,000 per QALY gained and 7.7% of ICERs are >€400,000 per QALY gained. The probabilistic sensitivity analysis indicates that there is an 86.9% possibility that application of International Conference on Harmonisation (ICH) E14 will result in costs >€100,000 per QALY gained, as compared to a scenario in which ICH E14 is not applied. Abbreviations: ICER,incremental cost-effectiveness ratio; QALY, quality-adjusted life year.
The first drug to be withdrawn from the market because of its QT prolongation potential was
prenylamine in 1988; this was followed by lidoflazine in 1989.[14] Between 1990 and 2006, an
additional seven drugs were withdrawn from various markets because of their torsadogenic
potential, as distinct from their QT-prolonging potential.[6] These drugs were developed
during a period when no well-established nonclinical strategy existed to identify QT liability
early and routine ECG monitoring in clinical trials was less than adequate. Now, drugs with
intense QT-prolonging potential will be discarded earlier in the development process, after
the results of nonclinical studies or following early-phase clinical trials when ECGs are
monitored systematically.
Nevertheless, we considered a scenario in which a drug with a positive TQT study failed to
reach the market, thereby potentially justifying the regulation. For this purpose we used the
example of a highly potent QT-prolonging drug that was withdrawn from the market;
levacetylmethadol, approved in 1997 for opiate addiction, was withdrawn in 2001.[15]
Approximately 33,000 patients were exposed to the drug worldwide during 1997–2001,[16]

The cost-effectiveness of thorough QT/QTc studies
107
and the drug was withdrawn after 10 reports of ventricular arrhythmia.[15] Although no
sudden cardiac deaths were reported to regulatory agencies, it is likely that some occurred.
For the purpose of this scenario, we therefore assumed that all 10 cases resulted in a sudden
cardiac death. The inclusion of these cases (assuming a mean QALY loss of 13 per sudden
cardiac death) into the no-regulation scenario only slightly affected the cost-effectiveness of
regulation: the ICER became €181,057 per QALY gained.
We did not consider the health benefits forfeited when a positive TQT study prevents an
otherwise effective drug from reaching the market. In such a case, the health benefits lost
would be substantial only if no alternative treatment is available for the target patient
population. However, as Figure 2 illustrates, if the health losses resulting from an effective
drug not reaching the market are significant, they will further lower the total health gains of
regulation.
Our study shows that the economic evaluation of drug regulation is not without challenges.
Measuring patient-specific characteristics such as life expectancy and health-related quality
of life (HRQL) is crucial to estimating health gains; in practice, however, such estimates will
be based only on the data in the literature. In addition, if drug regulation is intended to
increase health across patient populations, estimating health gains will become increasingly
complex. Therefore, we propose that in such a scenario one should start by estimating
regulatory cost-effectiveness for patient groups in which maximum health gains could be
expected.
Our study has several limitations. The analysis should be viewed as a best-case scenario for
the regulation in terms of number of users (the assumption being that all new users of
antipsychotic drugs in Europe and the United States start using the prototype QT-prolonging
drug) and 100% compliance with and effectiveness of ECG monitoring. In clinical practice, the
compliance with monitoring recommendations is generally low.[17] In addition, as the
predictive value of single ECGs recorded sporadically is believed to be well below 100%, the
net effect in clinical practice is a further decrease in health gains and an increase in the costs
per QALY gained (Table II).
Uncertainty exists regarding the estimates we used to calculate health effects: the precise
incidence of drug-induced sudden cardiac death in users of antipsychotic drugs is not known.
Our estimates combined the best available evidence from the literature, but it is possible that
the actual incidence of drug-induced sudden cardiac death is different. Given the rarity of
drug-induced sudden cardiac death, the real incidence of such deaths might be lower than
our estimate. The risk of a sudden cardiac death in users of other non-cardiac QT-prolonging
drugs is even lower.[18–20] Our results therefore indicate that for non-cardiac QT-prolonging
drugs as well, it would not be cost-effective to perform routine ECG monitoring of all new
Chapter 6
108
Ch
apte
r 3
users in clinical practice, unless mean QALY losses resulting from drug-induced sudden
cardiac death in those users would be considerably higher than QALY losses in users of
antipsychotic drugs.
Off-label use of antipsychotics might account for a significant proportion of total use. Our
data - encompassing a representative patient population receiving antipsychotics, including
off-label use - clearly identified a significant proportion of users >65 years of age. Among
users <65 years of age, variations in the underlying diagnoses are likely to exist. Because we
had no information on the specific diagnoses, we assumed two different indications: serious
mental illness in users <65 years and dementia in users >65 years. In clinical practice, there
may be more variation in diagnoses, and therefore in quality of life and life expectancy, than
is reflected in the assumptions for our model. There are alternative regulatory scenarios that
we did not consider because these are beyond the scope of our study. Such alternative
scenarios include restricting the requirement for a TQT study to drugs for which nonclinical
and/or early phase I clinical data suggest possible QT prolongation and substituting a TQT
study with adequate pharmacokinetic/pharmacodynamics monitoring in early-phase clinical
pharmacology studies.[21,22] Regulatory agencies could therefore consider alternatives to the
current universal requirement of TQT studies for all drugs. These alternatives, as well as new
regulatory measures, should also be subjected to analyses for cost-effectiveness.
The motivation for issuing regulations relating to drug safety might go beyond the goal of
achieving measurable health gains; it might also involve reassurance and comfort
considerations that lie beyond the health effects captured by QALYs. This may explain the
high “costs per QALY gained” that we found vis-à-vis what is considered reasonable cost-
effectiveness for medical interventions. In effect, however, regulatory measures intended to
promote drug safety might also entail considerable additional costs in clinical practice.
Our study highlights the need to determine acceptable levels of risks related to the use of
drugs and acceptable cost-effectiveness of safety-related regulatory actions. In a world of
rising healthcare expenditures and increasing drug development costs, regulatory agencies
and society at large should think carefully about what they are willing to pay for reassurance
with respect to drug safety to the extent of determining the magnitude of very small risks.
This is particularly relevant if determining these risks does not ultimately translate into
substantial health gains, or when health gains can be achieved only by spending vast
amounts of money.

The cost-effectiveness of thorough QT/QTc studies
109
Methods
Comparison of regulatory scenarios
Because a cost-effectiveness analysis compares at least two policy interventions, we
compared two regulatory scenarios (Figure 2, Table III). In the first scenario (no regulation),
ICH E14 is not applied, and therefore TQT studies are not performed during the clinical
development of the drug; as a result, QT-prolonging drugs might enter the market and their
users would be at risk of drug-induced TdP and sudden cardiac death. This scenario would
increase health-care costs associated with sudden cardiac death.
In the second scenario (regulation), all new drugs undergo a TQT study and an antipsychotic
drug will enter the market after a TQT study has quantified its QT-prolonging potency. All
new users of the QT-prolonging antipsychotic drug are assumed to undergo one baseline and
one follow-up ECG. ICH E14 explicitly refers to several implications of a positive TQT study,
including a label warning about the proarrhythmic risk and recommendations for ECG
monitoring of patients.[8] Therefore, performing ECGs in clinical practice is both a direct result
of the regulation and essential for achieving any potential health gains as a result of the
regulation. We set the number of ECGs at two in our base-case analysis because this is the
minimum number of ECGs necessary to detect QT prolongation. In practice, more than two
ECGs may be recorded for users of QT-prolonging drugs if the dose is altered or the patient is
switched to an alternative drug.
We compared the regulation scenario with the no-regulation scenario for a prototype
antipsychotic; in the regulation scenario, drug-induced sudden cardiac deaths are prevented,
but costs of TQT studies and ECG monitoring are incurred. We analyzed both regulatory
scenarios for the combined 800 million US and European Union (EU) population.[23,24]
The items in the bold-bordered boxes in Figure 2 are taken into account in our analysis. In our
main analysis, we do not include the situation in which a positive TQT study results in a drug
not reaching the market. However, we address such a scenario in the Discussion section.
Figure 2 depicts the total impact of ICH E14 on clinical drug development. Health effects are
drug-specific and are expressed as patient-specific characteristics (i.e., life expectancy and
HRQoL).
We compared the regulation scenario with the no-regulation scenario for a prototype
antipsychotic; in the regulation scenario, drug-induced sudden cardiac deaths are prevented,
but costs of TQT studies and ECG monitoring are incurred. We analyzed both regulatory
scenarios for the combined 800 million US and European Union (EU) population.[23,24]

Chapter 6
110
Ch
apte
r 3
The items in the bold-bordered boxes in Figure 2 are taken into account in our analysis. In our
main analysis, we do not include the situation in which a positive TQT study results in a drug
not reaching the market. However, we address such a scenario in the Discussion section.
Table III: Regulatory Scenarios
Scenarios Measures Costs Health Effects
1: No regulation No TQT studies will be performed
Healthcare costs SCDs
Health losses (SCDs) due to QT-prolonging drugs entering the market
2: Regulation TQT studies mandatory for all drugs under development
Costs of TQT studies No health losses (SCDs) due to QT-prolonging drugs entering the market
ECG monitoring of patients taking QT-prolonging drugs that enter the market
Costs of ECG monitoring of patients
Abbreviations: TQT thorough QT/QTc; SCD sudden cardiac death; ECG electrocardiograph.
Model
We used a dynamic population model that calculated the health effects (life years gained,
sudden cardiac deaths prevented, QALYs gained) and costs (in year 2009 Euros) resulting
from the regulation. Our analysis looked at effects over 20 years with a 1-year cycle length
(Figure 3). A 20-year period was chosen as the time horizon so as not to bias the results in
favor of any one scenario.[25] The model was developed in Microsoft Excel. Three sources of
data were used for the model parameters: published data concerning QTc prolongation and
sudden cardiac deaths, the Dutch Drug Information Database (GIP) for the number of new
and total users of antipsychotics in the Netherlands in 2009 (by 10-year age groups),[26] and
ClinicalTrials.gov for information on TQT studies.
Of 69 TQT studies registered with ClinicalTrials.gov, 47 were reported as “completed” at the
time of the search (5 positive studies, 18 negative studies, 24 studies with no reported
results). Of the 5 positive TQT studies reported, 3 involved antipsychotic drugs. The other
positive studies were for pazopanib, indicated for advanced renal cell carcinoma, and
granisetron, indicated for nausea caused by chemotherapy/radiation therapy. In users with
diminished life expectancy associated with these conditions, health losses due to
proarrhythmic QTc prolongation will be negligible.
Not all TQT studies are registered with ClinicalTrials.gov. eResearch Technology Inc (a
centralized ECG laboratory that analyses TQT studies) has performed more than 150 TQT
studies.[27] Therefore, we assumed that a total of 150 TQT studies had been performed by
2009 as a direct consequence of the ICH E14 regulation, and that these included all QTc-
prolonging drugs entering the market.
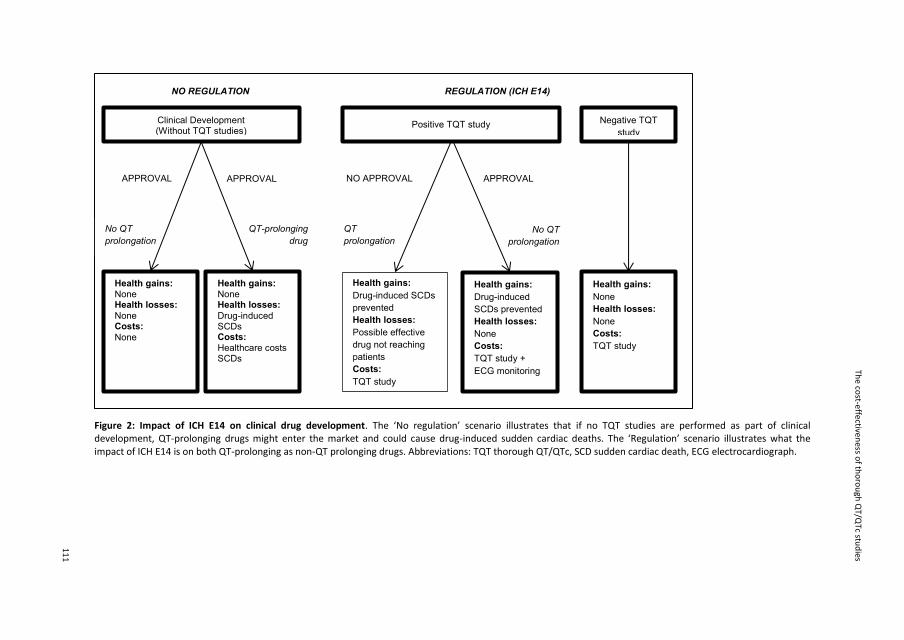
The co
st-effectiveness o
f tho
rou
gh Q
T/QTc stu
dies
111
Figure 2: Impact of ICH E14 on clinical drug development. The ‘No regulation’ scenario illustrates that if no TQT studies are performed as part of clinical development, QT-prolonging drugs might enter the market and could cause drug-induced sudden cardiac deaths. The ‘Regulation’ scenario illustrates what the impact of ICH E14 is on both QT-prolonging as non-QT prolonging drugs. Abbreviations: TQT thorough QT/QTc, SCD sudden cardiac death, ECG electrocardiograph.
NO REGULATION REGULATION (ICH E14)
No QT
prolongation QT
prolongation QT-prolonging
drug No QT
prolongation
NO APPROVAL APPROVAL
Health gains: None Health losses:
None Costs:
None
Health gains: None Health losses:
Drug-induced SCDs Costs: Healthcare costs SCDs
Health gains: Drug-induced SCDs
prevented Health losses: Possible effective
drug not reaching
patients Costs: TQT study
Health gains: None Health losses: None Costs: TQT study
Health gains: Drug-induced
SCDs prevented
Health losses: None Costs: TQT study +
ECG monitoring
Clinical Development (Without TQT studies)
Positive TQT study Negative TQT
study
APPROVAL APPROVAL

Chapter 6
112
Ch
apte
r 3
QTc prolongation
The reported proportion of patients that develop QTc prolongation while on treatment with
antipsychotic drugs ranges from 0 to 38% depending on the cutoff points used in different
studies.[10] QTc intervals ≤440 ms in male patients and ≤470 ms in female patients are normal,
whereas a QTc interval of ≥500 ms is considered proarrhythmic.[28,29] Given that
proarrhythmia is typically associated with QTc intervals ≥500 ms, this is a clinically relevant
cutoff point. Using this cutoff, the incidence varied from 0% to 2%.[30] Therefore, we set the
probability of proarrhythmic QTc prolongation in clinical practice at 1% in users of a QTc-
prolonging antipsychotic.
TdP has a reported frequency of ∼1 in 10,000 users of QTc-prolonging antipsychotics,
irrespective of QTc interval.[31] We set the probability of TdP in users with proarrhythmic QTc
prolongation at 1%. TdP is usually self-terminating: approximately 20% of cases develop into
ventricular fibrillation, which has a mortality rate of 85% (Figure 3, Table IV).[31–33]
Characteristics of new users
The model calculated health effects for the population of new users of antipsychotic drugs—
those who had received at least one prescription for any antipsychotic during the previous
one year but who had not received a prescription for any antipsychotic drug in the nine
months preceding that prescription—in Europe and the United States. Antipsychotic drugs
are typically prescribed for schizophrenia, schizoaffective disorder, and other serious mental
illnesses. The total number of users of antipsychotic drugs in the Netherlands in 2007 was
258,130 (population 16.4 million, 1.6% of the population),[26] and the number of users in the
United States in 2007 was 3.9 million (population 285.5 million, 1.4% of the population),[34]
showing similar prevalence of antipsychotic drug use.
Figure 3 : Outline of the dynamic population model. Abbreviations: ms milliseconds, TQT thorough QT/QTc study ECG electrocardiograph. A rectangular box denotes a health effect, an oval box denotes costs, a dashed box denotes explanation. In the no regulation scenario, a prototype QTc prolonging antipsychotic (without its proarrhythmic liabilities being characterized during clinical development) is introduced and all annual new users in Europe and the US (1 million) will start using the prototype antipsychotic. Of those new users, 1% will develop a QTc interval >500 ms. 1% of cases of proarrhythmic QTc prolongation will develop into TdP, which in 20% of cases will lead to ventricular fibrillation which is fatal in 85% of cases. Annual estimated incidence of a drug-induced sudden cardiac death in antipsychotic users = 17 per 1 million users. In the regulation scenario, TQT studies are performed for all drugs under development (150 during 2003-2009). Therefore a prototype QTc prolonging antipsychotic is introduced and all annual new users in Europe and the US (1 million) will start using the prototype antipsychotic. All new users will undergo 2 ECGs to detect proarrhythmic QTc prolongation. All users with QTc >500 ms will switch to other drug or dose will be adjusted to lower QTc interval <500 ms. The model assumes 100% effectiveness and compliance of ECG monitoring leading to the regulation being 100% effective in preventing drug-induced sudden cardiac deaths. Cycle length is 1 year. Model duration is 20 years.

The co
st-effectiveness o
f tho
rou
gh Q
T/QTc stu
dies
113
REGULATION
NO REGULATION
New users of prototype
QT-prolonging
antipsychotic
QTc >500 ms TdP Ventricular Fibrillation Sudden cardiac death
New users of prototype
QT-prolonging
antipsychotic
QTc >500 ms TdP Ventricular Fibrillation Sudden cardiac death
P = 1% P = 1%
P = 1%
P = 20% P = 85%
P = 0
Healthcare costs
2 ECGs per new
user
Users with QTc >500 ms will
switch to other drug or dose will
be adjusted to lower QTc interval
The model does not calculate the costs and effects of
drugs with a positive TQT study not reaching the
market; it assumes 150 TQT studies have been
performed as a result of the regulation at t=0
TQT studies for
all drugs under
development

Chapter 6
114
Ch
apte
r 6
In 2009, 22,535 persons started using antipsychotics in the Netherlands (9% of the total
users).[26] Extrapolating from this ratio, we assumed approximately 1 million new users in
Europe and the United States in 2009. We made the assumption that the risk of
proarrhythmic QTc prolongation exists only in the first year after drug use is started: patients
who develop TdP on a QT-prolonging drug usually do so within the first year after
commencing use.[28,35]
On average, patients with serious mental illness live 25 years less than the general
population.[36–38] Therefore, we set 65 years as the total life expectancy of users of
antipsychotic drugs, with an HRQoL of 0.74 (Table IV).[39] We used new-user data to estimate
the weighted (by age distribution) QALY loss from sudden cardiac death. To avoid
underestimation of the health effects, we set life expectancy at 70 years for users currently
between 45 and 65 years of age. New users were unevenly distributed among age groups:
one-third of them were >65 years of age. The likelihood of dementia developing into
psychosis or agitation, often requiring treatment with antipsychotic drugs, is 60–80%.[40] We
therefore assumed that new users >65 years of age were patients with dementia. We set the
mean total life expectancy at 76.7 years for the 64–74 age group and 83 for those ≥75 years
of age (Table IV).[41] The mean HRQoL of the older group was 0.50.[42] Combining these
estimates, a sudden cardiac death in the unregulated scenario entails an average health loss
of 17.9 life years and 12.9 QALYs (life years corrected for HRQoL).
Costs
The costs of a TQT study are hardly ever reported in the literature; they vary depending on
design, timing, and location of the study and can cost up to €2–4 million. We set a
conservative mean cost of one TQT study at €1 million.[43] The cost of an ECG is $35–50 in the
United States[44] and €20 in the Netherlands.[45] We therefore set the cost of one ECG at €20.
Health-care costs (pre-hospital, ambulance, emergency room, in-hospital) were set at €2,500
per sudden cardiac death.[46]

The cost-effectiveness of thorough QT/QTc studies
115
Table IV: Parameter estimates
Parameter Value Range Distribution Source
Proarrhythmic QTc prolongation
0.01 0.002 - 0.02 Beta [10,30]
TdP 0.01 - - [31]
VF 0.2 - - [31,32,33]
SCD 0.85 - - [33]
Cost per TQT study €1,000,000 €150,000 – €2.7 million
Gamma [33,35]
Cost per ECG € 20 €3.5 - €66 Gamma [36]
Number of TQT studies performed 2003-2009
150 - - [27]
Healthcare costs SCD € 2,500 €280 - €10,200 Gamma [37]
Number of ECGs per patient 2 - - -
Life expectancy user <65 years
65 49 - 82 Normal [38,39,40]
Life expectancy user 45-65 years
70 54 - 89 Normal -
Total life expectancy user >65 years
76.7 57 - 93 Normal [41]
Total life expectancy user >75 years
83 66 - 101 Normal [41]
HRQOL user <65 years 0.74 0.58 - 0.86 Beta [42]
HRQOL user antipsychotic >65 years
0.5 0.35 - 0.64 Beta [43]
Weighted life years lost per SCD
17.9 - - Computed
Weighted QALY loss per SCD 12.9 - - Computed
Abbreviations: TdP Torsade de pointes, VF ventricular fibrillation, SCD sudden cardiac death, TQT thorough QT/QTc, ECG electrocardiograph, HRQOL health-related quality of life, QALY quality-adjusted life year. The weighted life years lost and QALY losses are weighted by the distribution of number of users per age group. All ranges and distributions refer to the parameters that were made probabilistic for the probabilistic sensitivity analysis. See online-only supplement for a more detailed explanation of the probabilistic sensitivity analysis and the distributions used.
Sensitivity analyses
We used univariate, bivariate, and probabilistic sensitivity analyses to demonstrate the
impact of varying model parameters on our results. The costs of a TQT study were varied to
demonstrate the impact of a lower (€500,000) or higher (€2 million) cost per TQT study. The
total number of TQT studies performed was varied from one to 300. One TQT study reflects a
model assumption in which only the TQT study performed for our prototype antipsychotic is
a relevant cost. This could be the case if a strategy could be developed to effectively target
only drugs that need a TQT study, rather than all drugs under development. A total of 300
TQT studies carried out during 2003–2009 was chosen as the upper limit, given that our base-
case estimate (150 TQT studies) is a conservative one. ECG costs were varied from a low
estimate of €10 to a higher estimate of €50 to reflect possible cost differences between the

Chapter 6
116
Ch
apte
r 6
United States and Europe. Healthcare costs of a sudden cardiac death were increased to
€25,000 to reflect possible differences in costs between Europe and the United States. The
percentage of users with QTc prolongation was varied between 0.5 and 2% to reflect the
impact of proarrhythmic potential on the results. The annual number of new users was
lowered to 100,000, which might reflect a more realistic number of annual new users of a
specific antipsychotic drug, given that several antipsychotic drugs are licensed for use in
Europe and the United States. The base-case of the maximum number of new users is 1
million, per user data from the Netherlands and the United States. We lowered compliance
with ECG monitoring (base-case 100%) to 30% of users, which is a more realistic compliance
rate in clinical practice. We also lowered compliance with ECG monitoring to 30% while
simultaneously simulating the avoidance of 80% of sudden cardiac deaths. This last analysis
reflects a scenario in which the effective identification of each individual patient’s risk factors
for QTc prolongation would result in preventing 80% of all drug-induced sudden cardiac
deaths.
Cost-effectiveness ratios
The ICERs[47] are given by
T
t
T
tt
noreg
t
reg
T
tt
noreg
tqt
T
tt
reg
r
H
r
H
r
CC
r
C
ICER
0 011
01
01
)1()1(
)1()1(
(1)
where Creg are annual costs of regulation; Ctqt are the costs of TQT studies at t = 0 (cycle
length = 1 year); Cnoreg are the costs in the no-regulation scenario; Hreg (for regulation) and
Hnoreg (for no regulation) are the annual health effects in life years gained, sudden cardiac
deaths prevented or QALYs gained; r is the discount rate. The total costs for each of the
scenarios are calculated by summing all costs over 20 years. The total health effects are also
calculated by summing all health effects over 20 years. In our calculations, we used the
discount rate in the Netherlands: 1.5% for health effects and 4% for costs.[48] We also report
results calculated using the US discount rate of 5% for both health effects and costs.[49]

The cost-effectiveness of thorough QT/QTc studies
117
References 1. DiMasi, J.A., Hansen, R.W., Grabowski, H.G. The price of innovation: new estimates of drug
development costs. J. Health Econ. 2003;22:151-185.
2. Light, D., Warburton, R. Demythologizing the high costs of pharmaceutical research. BioSocieties
2011;6:34-50.
3. Rawlins, M. Cutting the cost of drug development? Nat. Rev. Drug Discov. 2004;April 3(4):360-364.
4. Hartley, K., Maynard, A. The regulation of the UK pharmaceutical industry: A cost-benefit analysis.
Manage. Decis. Econ. 1982;3(3):122-130.
5. Miller, W., Robinson, L.A., Lawrence, R.S. (editors). Valuing health for regulatory cost-effectiveness
analysis. 2006. National Academies Press, Washington DC, USA
6. Shah, R.R. Can pharmacogenetics help rescue drugs withdrawn from the market?
Pharmacogenomics 2006;7(6):889-908.
7. Straus, S.M. et al. Prolonged QTc interval and risk of sudden cardiac death in a population of older
adults. J. Am. Coll. Cardiol. 2006;47(2):362-367.
8. Guidance for industry. E14 Clinical evaluation of QT/QTc interval prolongation and proarrhythmic
potential for non-antiarrhythmic drugs. Food and Drug Administration, October 2005.
9. Ray, W.A., Chung, C.P., Murray, K.T., Hall, K., Stein, C.M. Atypical antipsychotic drugs and the risk of
sudden cardiac death. N. Engl. J. Med. 2009;360:225-235.
10. Ramos-Rios, R. et al. QTc interval in a sample of long-term schizophrenia inpatients. Schizophr. Res.
2010;116:35-43.
11. Dutch Council for Public Health. Meaningful and sustainable Health Care. Advice to the Minister of
Health (in Dutch). (RVZ, Zoetermeer, the Netherlands, 2006).
12. Donaldson, C. et al. The social value of a QALY: Raising the bar or barring the raise? BMC Health Serv.
Res. 2011, 11:8 doi:10.1186/1472-6963-11-8
13. Chambers, J.D., Neumann, P.J., Buxton, M.J. Does Medicare have an implicit cost-effectiveness
threshold? Med. Decis. Making 2010;published online March 15 2010. DOI: 10.1177/0272989X10371134
14. Shah, R.R. Cardiac repolarization and drug regulation: assessing cardiac safety 10 years after the
CPMP guidance. Drug Safety 2007;30(12):1093-1110.
15. European Medicines Agency. EMEA public statement on the recommendation to suspend the
marketing authorization for orlaam (levacetylmethadol) in the European Union. London, April 2001.
(Accessed May 3, 2011 at
ww.ema.europa.eu/docs/en_GB/document_library/Public_statement/2009/12/WC500018335.pdf)
16. Shah, R.R. Drug-induced prolongation of the QT interval: regulatory dilemmas and implications for
approval and labeling of a new chemical entity. Fund. Clin. Pharmacol. 2002;16:147-156.
17. Van der Sijs, H., Kowlesar, R., Aarts, J., Berg, M., Vulto, A., van Gelder, T. Unintended consequences
of reducing QT-alert overload in a computerized physician order entry system. Eur. J. Clin.
Pharmacol. 2009;65:919-925.
18. Straus, S.M., Bleumink, G.S., Dieleman, J.P., van der Lei, J., Stricker, B.H., Sturkenboom, M.C.. The
incidence of sudden cardiac death in the general population. J. Clin. Epidemiol. 2004;57:98-102.
19. Straus, S.M. et al. Antipsychotics and the risk of sudden cardiac death. Arch. Intern. Med.
2004;164:1293-1297.

Chapter 6
118
Ch
apte
r 6
20. Straus, S.M. et al. Non-cardiac QTc-prolonging drugs and the risk of sudden cardiac death. Eur.
Heart. J. 2005;26:2007-2012.
21. Shah, R.R., Morganroth, J. Evaluating the QT-liability of a drug during its development. Pharm. Med.
2008;22(3):151-164.
22. Rohatagi, S., Carrothers, T.J., Kuwabara-Wagg, J., Khariton, T. Is a thorough QTc study necessary?
The role of modeling and simulation in evaluation the QTc prolongation potential of drugs. J. Clin.
Pharmacol. 2009;49(11):1284-1296.
23. European Commission. Eurostat. Size of the total EU population (27 countries) 2010. (Accessed
September 14, 2010 at
http://epp.eurostat.ec.europa.eu/tgm/table.do?tab=table&language=en&pcode=tps00001&tableSel
ection=1&footnotes=yes&labeling=labels&plugin=1.)
24. US Census. Bureau 2010. Population of the United States. (Accessed September 14, 2010 at
www.census.gov.)
25. Drummond, M.F., Schulper, M.J., Torrance, G.W., O’Brien, B.J., Stoddart, G.L. Methods for the
economic evaluation of health care programmes. Third edition. (Oxford University Press, Oxford,
United Kingdom, 2005).
26. GIP/College voor Zorgverzekeringen 2010. Dutch data on users of prescription drugs. (Accessed on
January 14, 2011 via www.gipdatabank.nl.)
27. ERT Labs. Thorough ECG trials (thorough QT/QTc studies).2011.(Accessed January 14, 2011 at
http://www.ert.com/thorough-ecg-trials-thorough-qt-qtc/).
28. Glassman, A.H., Bigger, J.T. Antipsychotic drugs: Prolonged QTc interval, torsade de pointes, and
sudden death. Am. J. Psychiatry 2001;158(11):1774-1782.
29. Shah, R.R. Interpretation of clinical ECG data: understanding the risk from non-antiarrhythmic
drugs. In: Cardiac toxicity from non-cardiac drugs (eds Morganroth, J. and Gussaki, I. Totowa,
Humana Press, 2004).
30. FDA background on Zeldox.Psychopharmacological Drugs Advisory Committee, Food and Drug
Administration, 2000. (Accessed December 12, 2010 at
www.fda.gov/ohrms/dockets/ac/00/backgrd/3619b1b.pdf).
31. Titier, K. et al. Atypical antipsychotics: From potassium channels to torsade de pointes and sudden
death. Drug Safety 2005;28(1):35-51.
32. Shah, R.R., Hondeghem, L.M. Refining detection of drug-induced proarrhythmia: QT interval and
TRIaD. Heart Rhythm 2005;2:758-772.
33. Abdelmawla, N., Mitchell, A.J. Sudden cardiac death and antipsychotics. Part I: Risk factors and
mechanisms. Adv. Psychiat. T. 2006;12:35-44.
34. Tyl, M., Kabbaj, B., De Jode, P., Wheeler, W. Comparison of semiautomated and fully automated
methods for QI measuring during a thorough QT/QTc study: variability and sample size
considerations. J. Clin. Pharmacol. 2009;49:905-915.
35. Natekar, M. et al. Effect of number of replicate electrocardiographs recorded at each time point in a
thorough QT study on sample size and study cost. J. Clin. Pharmacol. 2010 DOI:
10.1177/0091270010376962
36. Dutch Healthcare Authority 2010. Dutch DRG-Tariffs application. (Accessed September 14, 2010 at
http://ctg.bit-ic.nl/Nzatarieven/top.do.)

The cost-effectiveness of thorough QT/QTc studies
119
37. Berdowski, J., Kuiper, M.J., Dijkgraaf, M.G.W., Tijssen, J.G.P., Koster, R.W. Survival and health care
costs until hospital discharge of patients treated with onsite, dispatched or without automated
external defibrillator. Resuscitation 2010;81:962-967.
38. Parks, J., Svendsen, D., Singer, P., Foti, M. Morbidity and mortality in people with serious mental
illnesses. National Association of State Mental Health Program Directors (NASMHPD) Medical
Directors Council.
39. Tiihonen, J. et al. 11-year follow-up of mortality in patients with schizophrenia: a population-based
cohort study (FIN11 study). Lancet 2009;374:620-627.
40. Chang, C.K. et al. All-cause mortality among people with serious mental illness (SMI), substance use
disorders, and depressive disorders in southeast London: a cohort study. BMC Psychiatry 2010, 10:77
doi:10.1186/1471-244X-10-77
41. Rait, G., Walters, K., Bottomly, C., Petersen, I., Iliffe, S. Survival of people with clinical diagnosis of
dementia in primary care: cohort study. Brit. Med. J. 2010;341:c3584 doi:10.1136/bmj.c3584
42. Alonso, J. et al. Health-related quality of life (HRQL) and continuous antipsychotic treatment: 3-year
results from the schizophrenia health outcomes (SOHO) study. Value Health 2009;12(4):536-543.
43. Kunz, S. Psychometric properties of the EQ-5D in a study of people with mild to moderate
dementia. Qual. Life Res. 2010;19:425-434.
44. Stagnitti, M.N. Trends in antipsychotics purchases and expenses for the US civilian noninstitutionalized
population, 1997 and 2007. Statistical Brief #275. January 2010. Agency for Healthcare Research and
Quality, Rockville, MD. (Accessed September 14, 2010 at
http://www.meps.ahrq.gov/mepsweb/data_files/publications/st275/stat275.pdf.)
45. Wysowski, D.K., Corken, A., Gallo-Torres, H., Talarico, L., Rodriguez, E.M. Postmarketing reports of
QT prolongation and ventricular arrhythmia in association with cisapride and food and drug
administration regulatory actions. Am. J. Gastroenterol. 2001;96:1698-1703.
46. Ventimiglia, J., Kalali, A.H., Vahia, I.V., Jeste, D.V. An analysis of the intended use of antipsychotics in
dementia. Psychiatry 2010(7);11:14-17.
47. Briggs, A., Claxton, K., Schulper, M. Decision modeling for health economic evaluation. (Oxford
University Press, Oxford, United Kingdom, 2006).
48. Rodenburg-van Dieten, H.E.M. Guidelines for Pharmacoeconomic Research; Evaluation and
Actualization (in Dutch). (Diemen, the Netherlands: College voor Zorgverzekeringen; 2005:20–21).
49. Gold, M.R., Siegel, J.E., Russel, L.B., Weinstein, M.C. (editors). Cost-effectiveness in health and
medicine. (Oxford University Press, New York, USA, 1996).

Chapter 6
120
Ch
apte
r 6
Appendix 6.A: Additional information results
Model assumptions
Time horizon
A 20-year time horizon was chosen in the model. In cost-effectiveness analysis, the choice of
time horizon should not bias the analysis in favor of one intervention over the other.[1] The
costs of performing thorough QT/QTc (TQT) studies occur in year 0 while the costs of ECG
monitoring occur during year 1-20 and the health benefits also occur during year 1-20. As it is
reasonable to assume a new antipsychotic entering the market (given that it is not
withdrawn) will remain on the market and will be used for several years, choosing a short-
term perspective (e.g. 5 years) would weigh the regulation costs more heavily as health
benefits occurring further in the future would be discarded.
Incremental cost-effectiveness ratios
The incremental cost-effectiveness ratio (ICER) is calculated as follows: the sum of all costs of
regulation is subtracted by the sum of all costs of no regulation. Also, the sum of all health
benefits of regulation is subtracted by the sum of all health benefits of no regulation.
Consequently, the difference in costs is divided by the difference in health benefits. The ICER
in costs per quality-adjusted life year (QALY) gained can be interpreted as follows: if the
regulation is implemented, this is the amount society will have to pay in order to gain one
QALY. The ICER in costs per sudden cardiac death avoided can thus be interpreted as follows:
if the regulation is implemented, this is the amount society will have to pay to prevent one
drug-induced sudden cardiac death.
The incremental cost-effectiveness ratios (ICER) are given by
T
t
T
tt
noreg
t
reg
T
tt
noreg
tqt
T
tt
reg
r
H
r
H
r
CC
r
C
ICER
0 011
01
01
)1()1(
)1()1(
where Creg are annual costs of regulation; Ctqt are the cost of TQT studies at t=0 (cycle
length=1 year); Cnoreg are the costs in the no regulation scenario; Hreg for regulation and Hnoreg
for no regulation are the annual health effects in life years gained; sudden cardiac deaths
prevented or QALYs gained; r is the discount rate. We used the Dutch discount rate of 1.5% for

Appendix 6.A
121
health effects and 4% for costs and also report results with the US discount rate of 5% for
both health effects and costs.
In the model, 1 million new users enter the unregulated scenario as antipsychotic users each
year. Of those users, 17 per 1 million users will die from a drug-induced sudden cardiac death.
Healthcare costs of a sudden cardiac death occur in this scenario.
In the regulation scenario, 1 million new users enter the model each year. All new users
undergo two ECGs to rule out proarrhythmic QT prolongation. Users who develop
proarrhythmic QTc prolongation are either switched to a non-QT-prolonging drug or the dose
is lowered. It is assumed that the ECG monitoring is 100% effective: no drug-induced sudden
cardiac deaths occur in this scenario. Costs of TQT studies do occur as costs of ECG
monitoring.
The model calculates all costs and health benefits in each scenario, over the total time
horizon of 20 years. In the no regulation scenario no health benefits occur, as no drug-
induced sudden cardiac deaths are prevented.
Quality-adjusted life years
A QALY is a measure of health that is calculated by correcting the life expectancy of a person
for the health-related quality of life that person will spend his or hers life in. For example, if an
antipsychotic user of 60 years has a life expectancy of 70, that person is expected to live for 5
more years. However, if the user’s health-related quality of life (where a value of one
(maximum) is equal to full health, and any health state lower than one corresponds with a
health state not equal to full health, with a value of 0 representing death) is 0.50, then the
number of QALYs is 5*0.50=2.5 QALYs. One QALY can therefore be interpreted as one life
year of full health.
Probabilistic sensitivity analysis (PSA)
In a PSA, several or all model parameters are given a distribution with a mean value and
standard deviation. A PSA is performed to explore the uncertainty surrounding the model
parameters. It shows the impact on the results when the model parameters are not fixed but
are varied. Given the different parameter distributions, a total of 10,000 iterations are
performed. During each iteration, a random value is drawn for the provided distribution for
each parameter. Consequently, the incremental costs and effects are calculated. This results
in 10,000 different ICERs, one corresponding with each iteration. The results of the PSA can
be seen in the cost-effectiveness plane (Figure 1). Clearly, the variation in the model
parameters results in different ICERs. Usually, patient-level data is used to fit distributions for
parameters in a PSA. As our parameters were estimates from the literature, we felt it was not
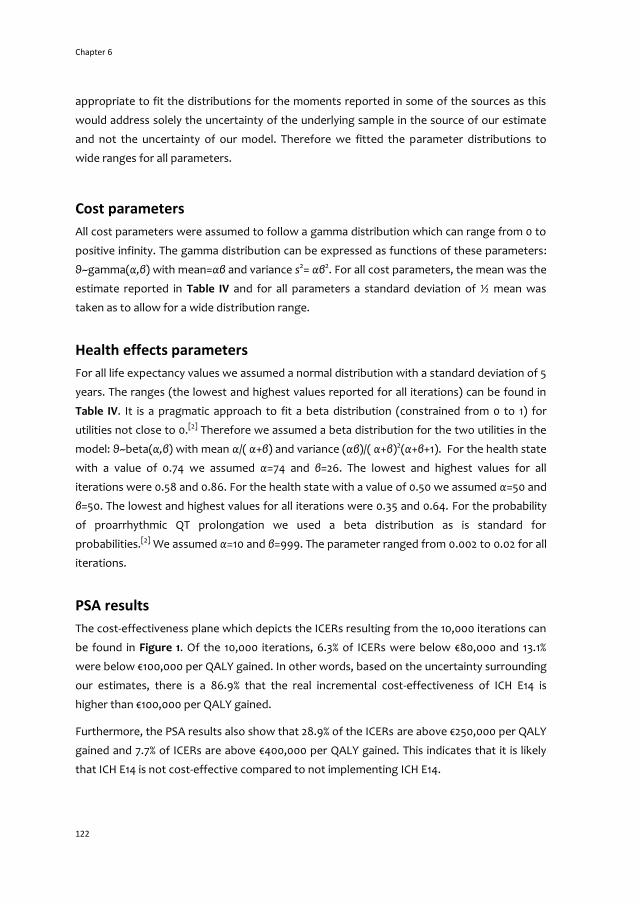
Chapter 6
122
appropriate to fit the distributions for the moments reported in some of the sources as this
would address solely the uncertainty of the underlying sample in the source of our estimate
and not the uncertainty of our model. Therefore we fitted the parameter distributions to
wide ranges for all parameters.
Cost parameters
All cost parameters were assumed to follow a gamma distribution which can range from 0 to
positive infinity. The gamma distribution can be expressed as functions of these parameters:
θ~gamma(α,β) with mean=αβ and variance s2= αβ2. For all cost parameters, the mean was the
estimate reported in Table IV and for all parameters a standard deviation of ½ mean was
taken as to allow for a wide distribution range.
Health effects parameters
For all life expectancy values we assumed a normal distribution with a standard deviation of 5
years. The ranges (the lowest and highest values reported for all iterations) can be found in
Table IV. It is a pragmatic approach to fit a beta distribution (constrained from 0 to 1) for
utilities not close to 0.[2] Therefore we assumed a beta distribution for the two utilities in the
model: θ~beta(α,β) with mean α/( α+β) and variance (αβ)/( α+β)2(α+β+1). For the health state
with a value of 0.74 we assumed α=74 and β=26. The lowest and highest values for all
iterations were 0.58 and 0.86. For the health state with a value of 0.50 we assumed α=50 and
β=50. The lowest and highest values for all iterations were 0.35 and 0.64. For the probability
of proarrhythmic QT prolongation we used a beta distribution as is standard for
probabilities.[2] We assumed α=10 and β=999. The parameter ranged from 0.002 to 0.02 for all
iterations.
PSA results
The cost-effectiveness plane which depicts the ICERs resulting from the 10,000 iterations can
be found in Figure 1. Of the 10,000 iterations, 6.3% of ICERs were below €80,000 and 13.1%
were below €100,000 per QALY gained. In other words, based on the uncertainty surrounding
our estimates, there is a 86.9% that the real incremental cost-effectiveness of ICH E14 is
higher than €100,000 per QALY gained.
Furthermore, the PSA results also show that 28.9% of the ICERs are above €250,000 per QALY
gained and 7.7% of ICERs are above €400,000 per QALY gained. This indicates that it is likely
that ICH E14 is not cost-effective compared to not implementing ICH E14.

Appendix 6.A
123
References 1. Drummond, M.F., Schulper, M.J., Torrance, G.W., O’Brien, B.J., Stoddart, G.L. Methods for the
economic evaluation of health care programmes. Third edition. (Oxford University Press, Oxford,
United Kingdom, 2005).
2. Briggs, A., Claxton, K., Schulper, M. Decision modeling for health economic evaluation. (Oxford
University Press, Oxford, United Kingdom, 2006).

Chapter 6
124

Chapter 7
The cost-effectiveness of Periodic Safety
Update Reports (PSURs) for biologicals
JC Bouvy
HC Ebbers
H Schellekens
MA Koopmanschap
Submitted

Chapter 7
126
Summary
We analyzed the cost-effectiveness of all periodic safety update reports (PSURs) submitted
for biologicals in Europe from 1995 to 2009. We evaluated two regulatory scenarios: Full
Regulation (PSUR reporting) and Limited Regulation (no PSUR reporting). PSUR reporting
during the period revealed two urgent safety issues for biologicals: (i) distant spread of
botulinum toxin and (ii) edema/fluid collection from off-label use of dibotermin-alfa. We used
Markov-chain life tables to calculate effects of PSURs. The incremental cost-effectiveness
ratio of full versus limited regulation for the base-case scenario was €342,110 per quality-
adjusted life year gained. Results indicate that PSUR reporting costs are unlikely to outweigh
their health gains.

The cost-effectiveness of Periodic Safety Update Reports
127
Introduction
The benefit-risk profile of new medicinal products in real-life patient populations is usually
not fully established upon market entry, giving cause for Europe’s comprehensive
pharmacovigilance system.[1] The main pillar of pharmacovigilance has historically been the
voluntary reporting of adverse drug reactions (ADRs) in the scientific literature and national
reporting schemes such as the United Kingdom’s “yellow card.” In recent decades, the
pharmacovigilance toolkit has been complemented with post-authorization safety studies
(PASS).[2] A key regulatory vehicle to communicate the outcomes of pharmacovigilance
activities deployed by a product’s marketing authorization holder (MAH) is the Periodic
Safety Update Report (PSUR), which summarizes a product’s worldwide safety data and
facilitates periodic assessment of its benefit-risk profile.[3] MAHs are obligated to submit a
PSUR every six months during the first two years after marketing authorization, annually
through years 3 to 5, and every three years for the remaining life-cycle of the product, or if
requested by regulatory authorities.[4] If a new safety issue is identified, several regulatory
actions can be taken: new safety information can be added to the product’s summary of
product characteristics (SPC) through so-called ‘Type II variations’, a Direct Healthcare
Professional Communication (DHPC) can be sent to physicians to alert them of the safety
issue, or a product’s marketing license may be suspended or revoked.
In most Western countries, rising healthcare expenditures have resulted in increasing
pressure regarding cost containment. Health Technology Assessment is an established tool
to assess the added value of new healthcare technologies, but has also been demonstrated a
feasible approach to the evaluation of drug regulatory requirements.[5] A regulatory cost-
effectiveness analysis can assess whether drug regulation provides value for money.[6] PSURs
result in considerable expenditure; an average MAH submits more than 100 PSURs annually
and a single PSUR costs up to €28,000.[7,8] The total number of submitted PSURs throughout
the European Economic Area (EEA) in 2004 was over 17,000.[8] Whether the costs associated
with preparing and assessing PSURs are justified by the health gains they generate requires
assessing the effectiveness, or cost-effectiveness, of PSURs. Because of the large number of
PSURs that are annually submitted throughout the European Union (EU), we included a
selection of all marketed products in Europe. A previous study analyzed the outcome of
PSUR evaluations of all biologicals centrally authorized in the EU.[9] Therefore, we assessed
the cost-effectiveness of all PSURs submitted during 1995-2009 for biologicals, using a
societal perspective.

Chapter 7
128
Ch
apte
r 6
Results
Base-case scenario
Ebbers et al. reported that of all the DHPCs issued in the EU for biologicals between 1995 and
2009, PSURs contributed to the identification of two urgent safety issues: distant spread of
botulinum toxin and edema/fluid collection after off-label use of dibotermin-alfa.[10] The total
estimated costs of full regulation were €44,748,955 and total quality-adjusted life years
(QALYs) for the scenario were 434,605. The total estimated limited regulation costs were
€31,298,691 with QALYs of 434,566 (Table I). The incremental cost-effectiveness ratios
(ICERs) were calculated as follows:
∑ ∑
∑ ∑
(1)
The total incremental costs of regulation versus limited regulation were €13,450,264 and total
incremental QALYs were 39. The ICER of full regulation versus limited regulation for the base-
case scenario (with assumed risk reduction of 25%) was €343,110 per QALY gained (not
discounted; see Methods). The total societal (direct and indirect) costs that were prevented
by the full regulation scenario were €1,807,104, but the additional total regulatory costs of full
regulation were €15,257,368.
Discounting costs and effects starting in 1995 resulted in an ICER of €335,802 versus €366,524
when discounting from 2012 onwards. A scenario in which the European Medicines Agency
(EMA) fees were used as PSUR cost estimates (1995-2009, corrected for inflation) resulted in
an ICER of €1,192,362. When only direct costs (regulatory and healthcare) were taken into
account, the ICER was €359,566. A scenario in which the pharmacovigilance system under
limited regulation was assumed to be more effective than the base-case scenario (safety
issues were detected after 2.5 years instead of 5 years) resulted in an ICER of €775,408
because the incremental costs remained unchanged and the incremental effects decreased
from 39 (base-case) to 19 QALYs.

The co
st-effectiveness o
f Perio
dic Safety U
pd
ate Rep
orts
129
Table I: Results cost-effectiveness analysis
FULL REGULATION
LIMITED REGULATION Incremental
costs & effects ICER
Base case
Total PSUR costs € 15,257,368 Total PSUR costs € 0
Total botulinum toxin costs € 29,360,140 Total botulinum toxin costs € 31,158,644
Total rhBMP-2 costs € 131,447 Total rhBMP-2 costs € 140,048
Total costs € 44,748,955 Total costs € 31,298,691 € 13,450,264
Total QALYs botulinum toxin 352,057 Total QALYs botulinum toxin 352,019
Total QALYs rhBMP-2 82,548 Total QALYs rhBMP-2 82,547
Total QALYs 434,605 Total QALYs 434,566 39 € 343,110
Healthcare perspective
Total PSUR costs € 15,257,368 Total PSUR costs € 0
Total botulinum toxin costs € 18,899,056 Total botulinum toxin costs € 20,056,808
Total rhBMP-2 costs € 64,792 Total rhBMP-2 costs € 69,036
Total costs € 34,221,217 Total costs € 20,125,844 € 14,095,373
Total QALYs botulinum toxin 352,057 Total QALYs botulinum toxin 352,019
Total QALYs rhBMP-2 82,548 Total QALYs rhBMP-2 82,547
Total QALYs 434,605 Total QALYs 434,566 39 € 359,566
Detection safety issues more effective (2.5 years)
Total PSUR costs € 15,257,368 Total PSUR costs € 0
Total botulinum toxin costs € 29,360,140 Total botulinum toxin costs € 30,143,329
Total rhBMP-2 costs € 131,447 Total rhBMP-2 costs € 134,752
Total costs € 44,748,955 Total costs € 30,278,081 € 14,470,874
Total QALYs botulinum toxin 352,057 Total QALYs botulinum toxin 352,039
Total QALYs rhBMP-2 82,548 Total QALYs rhBMP-2 82,547
Total QALYs 434,605 Total QALYs 434,586 19 € 775,408

Ch
apter 7
13
0
Table I continued
Discounting, 1995=t0
Total costs € 25,147,927 Total costs € 15,440,860 € 9,707,067
Total QALYs 321,651 Total QALYs 321,623 29 € 335,802
Discounting, 2012=t0
Total costs € 40,165,968 Total costs € 26,716,128 € 13,449,840
Total QALYs 401,294 Total QALYs 401,257 37 € 366,524
With EMA fees for regulation costs
Total costs € 78,040,527 Total costs € 31,298,691 € 46,741,835
Total QALYs 434,605 Total QALYs 434,566 39 € 1,192,362
Assumption base-case: risk reduction 25% for both safety issues. PSUR, periodic safety update report, rhBMP-2, recombinant human bone morphogenetic protein-2, Abbreviations: QALY, quality-adjusted life year, ICER, incremental cost-effectiveness ratio

The cost-effectiveness of Periodic Safety Update Reports
131
Table II: Sensitivity analyses
Parameter Lower value:
Higher values:
PSUR-related parameters
Risk reduction (25%) 10% 50% 70% 90% 100%
ICERs: € 927,668 € 148,250 € 92,572 € 61,636 € 50,808
Costs Regulator hour (€49) € 25 € 75 € 100
ICERs: € 329,620 € 357,724 € 371,775
Costs of small PSUR (€6,000)
€ 3,000 € 12,000
ICERs: € 310,294 € 408,741
Costs of medium PSUR (€14,000)
€ 7,000 € 28,000
ICERs: € 313,845 € 401,639
Costs of large PSUR (€28,000)
€ 14,000 € 56,000
ICERs: € 224,357 € 580,616
Botulinum toxin parameters
Probability mild botulism (0.4%)
0.04% 0.60% 0.80% 1.00%
ICERs: € 379,134 € 325,563 € 309,496 € 294,729
Probability moderate botulism (0.09%)
0.009% 0.15% 0.20% 0.40%
ICERs: € 424,511 € 298,770 € 268,793 € 187,182
Probability severe botulism (0.01%)
0.001% 0.02% 0.05% 0.10%
ICERs: € 964,310 € 186,994 € 160,243 € 13,304
rhBMP-2 parameters
Use of rhBMP-2 (1%) 0.1% 10% 20% 30%
ICERs: € 353,070 € 267,239 € 214,011 € 178,079
Probability of edema (1%) 0.1% 5% 10% 20%
ICERs: € 353,070 € 267,239 € 214,011 € 178,079
Probability of hospitalization (30%)
1% 10% 60% 90%
ICERs: € 353,831 € 350,434 € 332,669 € 322,834
Costs operation (€1,094) € 600 € 2,200 € 5,000 € 10,000
ICERs: € 343,128 € 343,068 € 342,964 € 342,777
The base case values for all parameters are given in brackets. For each sensitivity analysis, the value of one parameter in changed and the corresponding new ICER is reported. Abbreviations: PSUR periodic safety update report; ICERs incremental cost-effectiveness ratios; rhBMP-2 recombinant bone morphogenetic protein.
Sensitivity analysis
We performed univariate sensitivity analyses for all key model parameters (Table II). Only
two produced ICERs in a range that could be considered cost-effective: (i) a risk reduction
(base-case: 25%) of 100% (ICER: €50,808 per QALY), or (ii) a probability of 0.1% per botulinum
toxin injection of severe botulism (base-case: 0.01%) (ICER: €13,304 per QALY). All other

Chapter 7
132
Ch
apte
r 6
sensitivity analyses did not result in favorable cost-effectiveness at a €100,000 per QALY
threshold except for percentage risk reductions, which produced an ICER of €92,572 per
QALY at 70% and an ICER of €61,636 per QALY at 90%. The risk parameters for mild (base-case:
0.4%) and moderate (base-case: 0.09%) botulism had little effect: at a probability of 1% for mild
botulism the ICER became €294,729 per QALY gained and at a probability of 0.4% for
moderate botulism the ICER became €187,182 per QALY gained.
We also performed a probabilistic sensitivity analysis (PSA), in which all parameters are varied
together by fitting a distribution to the parameters and performing a Monte-Carlo simulation
with 10,000 iterations (Figure 1, Appendix 7.A). Nearly 96% (95.7%) of the iterations resulted
in ICERs with positive incremental effects and positive incremental costs. A small number
(0.01%) of the iterations resulted in positive incremental effects and negative incremental
costs; 4.2% of the iterations resulted in positive incremental costs and negative incremental
effects, even though the risk reduction parameter was positive in all iterations. The utilities
fitted to the disease states in the life-tables were, however, also made probabilistic, which in
some iterations resulted in a lower assigned utility for disease states which are assumed to
have a higher utility in the base-case scenario. This issue cannot be resolved by fitting less
wide distributions, because doing so would falsely reflect less uncertainty. Of the 95.7%
iterations with positive incremental costs and effects, only 1.2% resulted in an ICER of
<€50,000 per QALY gained and 3.3% resulted in an ICER of <€80,000 per QALY gained.
Discussion
Our results indicate that PSUR reporting for biologicals during 1995-2009, when compared to
a regulatory scenario in which PSUR reporting would not have been mandatory, resulted in
an incremental cost-effectiveness of about €343,110 per QALY gained. Although no explicit
maximum willingness to pay threshold exists for healthcare interventions, different
thresholds have been applied for reimbursement decisions varying from £30,000 per QALY in
the United Kingdom, €80,000 per QALY in the Netherlands (with high disease severity), and
$50,000-$100,000 in the US. All these thresholds are considerably lower than our base-case
estimate. Sensitivity analyses indicate that the incremental cost-effectiveness of PSUR
reporting for biologicals had been more favorable if the risk reduction of the two urgent
safety issues had been 100% effective, or if the risk of severe botulism following botulinum
toxin injections had been 10-fold higher than our estimate (1 per 1,000 patients per injection
as opposed to 1 in 10,000 patients per injection in the base-case analysis). PSUR reporting did
result in lower healthcare costs and more health, yet the total costs of compliance with PSUR
reporting far outweigh the beneficial outcomes. The PSA furthermore indicates, albeit

The cost-effectiveness of Periodic Safety Update Reports
133
considerable uncertainty surrounding our model estimates and assumptions, a slim likelihood
that PSUR reporting for biologicals would be cost-effective.
Figure 1. Cost-effectiveness plane. The results of the Monte-Carlo simulation (10,000) iterations are plotted in this graph. Each iteration resulted in an incremental cost-effectiveness ratio (ICER). The line indicated the threshold of 50,000 per QALY gained.
In our analysis, we conservatively assumed that, had PSUR reporting not been deployed for
biologicals during 1995-2009, both urgent safety issues would have gone unnoticed for
another five years. It might be, however, that these safety issues would have been identified
through other pharmacovigilance instruments, most notably, the scientific literature or
national pharmacovigilance centers. The new pharmacovigilance legislation mandates that
EMA and national authorities will become responsible for periodic signal detection through
screening spontaneous reports and literature case reports.[11] For both safety issues, case
reports had emerged in the literature years before the respective DHPCs were issued. A
sensitivity analysis, in which the period of detecting the safety issues between the two
regulatory scenarios was set to 2.5 years instead of 5 years, resulted in an ICER of €775,408
per QALY gained, since the incremental effects do not change compared to the base-case
scenario yet the health effects decrease. Furthermore, the effectiveness of PSURs is
determined by the risk reduction achieved in clinical practice. This stipulates the need for
effective strategies to not only communicate an identified risk to the medical community, but
to also change prescribing and treatment behavior.

Chapter 7
134
Ch
apte
r 6
Our study has several limitations. A major challenge has been to find empirical estimates for
all required model parameters to perform a cost-effectiveness analysis. We systematically
searched the scientific literature but in some cases we had to resort to expert opinion. This
resulted in considerable uncertainty regarding some model parameters. We performed
extensive sensitivity analyses varying model parameters and assumptions to determine how
these variations changed our results. Only two model parameters (risk reduction after the
safety issues are detected and the risk of severe botulism) resulted in an ICER below a
€50,000 per QALY threshold. We estimated the number of botulinum toxin users in the
European Union (EU) to be 18,081 in 2001, based on the number of cervical dystonia patients
and the percentage of patients treated. We did not take other therapeutic indications into
account, for three reasons: (i) the indication for the botulinum toxin product approved in
2001 was for cervical dystonia patients only, (ii) the DHPC explicitly stated that the risk of
iatrogenic botulism existed at therapeutic doses only (as opposed to cosmetic use), and (iii)
health utilities are indication-specific. There are, however, other therapeutic indications for
botulinum toxin products (Appendix 7.B). The ICER was €96,683 per QALY gained when we
increased the total number of patients to 50,000, and €25,085 per QALY gained when
increased to 100,000.
For regulatory costs, we included only the hours spent on PSUR assessment in our base-case
analysis. Recently, the EMA proposed new PSUR-assessment fees, covering all costs related
to PSUR assessment. If these proposed fees are truly representative of the regulator cost for
a single PSUR assessment, the ICER would become more than €1 million per QALY gained,
and therefore much more unfavorable than the base-case results.
We used several estimates for the Netherlands (hospital costs, productivity costs, spinal
fusions performed annually) that we extrapolated to the EU-27 population. Regional cost and
clinical practices differ between countries. Although regional costs and clinical practices
differ, we did not find empirical evidence of large differences between countries. We cannot,
however, exclude the possibility that rhBMP-2 (recombinant human bone morphogenetic
protein-2; following the scientific literature we use this name for Dibotermin-alfa) is used
more often in some countries or that the risk of iatrogenic botulism varies across regions.
A PSUR summarizes worldwide safety data. For rhBMP-2, usage levels in spinal fusions (both
on- and off-label) were much higher in the US than in Europe. Although sensitivity analysis
demonstrated that even at US usage rates (in 30% of spinal fusions), the ICER remained
€178,079 per QALY gained, it illustrates that the cost-effectiveness of PSURs in preventing
urgent safety issues depends on the total population at risk.
It is possible that PSUR reporting has contributed to identifying more than the two urgent
safety issues for biologicals identified by Ebbers et al.[10] The cost-effectiveness of PSUR

The cost-effectiveness of Periodic Safety Update Reports
135
reporting would increase with the number of urgent safety issues detected, provided that a
substantial risk reduction would have followed a DHPC and that measures to reduce the ADR
risk would not invoke substantial healthcare costs. Additionally, we disregarded all instances
in which PSURs identified non-urgent safety issues (Type II variations); in such cases PSURs
were more often the source of regulatory action.[10]
More stringent regulatory requirements are regarded as a barrier to drug innovation and
driver of research and development costs.[12,13] Healthcare systems are under growing cost
pressure and therefore regulatory requirements should be assessed for their capacity to
increase drug safety in a cost-effective manner. Our results indicate that it is unlikely that
PSUR reporting for biological during 1995-2009 has been cost-effective, however, PSUR
reporting produces considerable costs, for both regulatory authorities as pharmaceutical
companies. It could be questioned what the contribution of PSUR reporting to promoting
drug safety is in addition to other pharmacovigilance instruments. Regulatory authorities
should start defining and measuring the intended health effects of regulatory requirements,
especially if these requirements yield high costs of compliance. Rational regulation at
acceptable costs could make a substantial contribution towards more sustainable drug
development.
Methods
Regulatory Scenarios
As a cost-effectiveness analysis is always comparative, we evaluated two regulatory
scenarios: a scenario with PSUR reporting (‘Full Regulation’) and a scenario without PSUR
reporting (‘Limited Regulation’) (Figure 2, Table III). Full regulation is the pharmacovigilance
system (pre-2012), encompassing of spontaneous ADR reports and PASS as the two main
sources of post-marketing drug safety information, and Risk Management Plans (RMPs) and
PSURs as regulatory instruments. The combination of these instruments and activities
comprise the pharmacovigilance framework (for biologicals) in Europe.
Under the limited regulation scenario, we assumed that all parts of the pharmacovigilance
system were in place from 1995 to 2009 except for PSUR reporting (Figure 2); in other words,
detection of safety signals and subsequent communications might not have been optimal.
We thus assessed all urgent safety issues (i.e., type II variations accompanied by a DHPC) that
occurred for biologicals in that period.[10]
From 1995 to 2009, 24 urgent safety issues were identified for all biologicals.[10] We assessed
how often a PSUR identified the safety issue, which was positive if any European Public

Chapter 7
136
Ch
apte
r 6
Assessment Report (EPAR), SPC, or DHPC text referred to a PSUR evaluation.[10] Two of 24
urgent safety issues were identified through PSURs: distant spread of botulinum toxin and
edema/fluid collection after off-label use of dibotermin-alfa. The effectiveness of PSUR
reporting (full regulation) is thus determined by the increased health in users of these two
products. The relevant costs and health effects for both regulatory scenarios are summarized
in Table III.
Table III: Regulatory scenarios.
FULL REGULATION (Pharmacovigilance)
LIMITED REGULATION (Pharmacovigilance without PSURs)
Costs Health effects Costs Health effects
PSUR reporting MAHs 1995-2009
All urgent safety issues detected
Costs related to urgent safety issue rhBMP-2
Health losses due to urgent safety issue rhBMP-2
PSUR evaluation EMA 1995-2009
Costs related to urgent safety issue botulinum toxin
Health losses due to urgent safety issue botulinum toxin
Only costs and health effects that differ between the regulatory scenarios are included. Under the full regulation, all parts of the pharmacovigilance system are implemented. Relevant costs are all PSUR-related costs and costs of DHPCs for both products. Relevant health effects are that all urgent safety issues will be identified. Under the limited regulation, the pharmacovigilance system is implemented but without any PSUR reporting. It is assumed 2 urgent safety issues relating to two biologicals will go undetected. Therefore relevant costs include those related to the two urgent safety issues, in the period after a DHPC is issued for these safety issues. PSUR, periodic safety update report. DHPC, direct healthcare professional communication.
PSUR- identified urgent safety issues
Botulinum toxin type B was approved in January 2001 and is indicated for the treatment of
cervical dystonia. In March 2007 a DHPC was issued, warning healthcare professionals about
rare but serious side effects related to the peripheral spread of botulinum toxin. rhBMP-2 was
approved for use in tibia fractures in 2002 and for anterior lumbar spine fusion in February
2005. In September 2007 a DHPC was issued alerting physicians to the risk of complications
(e.g. pseudocysts, localized edema, implant site effusion) after unapproved use in posterior
lumbar spine surgery, or after inappropriate use (e.g. overfilling the implant/cage). These
complications can lead to nerve compression, neurological deficit, or pain, and clinical
intervention has been needed when symptoms persisted.

The cost-effectiveness of Periodic Safety Update Reports
137
Figure 2: Two regulatory scenarios We assumed that under both regulatory scenarios these safety issues would have developed.
Under the full regulation scenario, PSUR reporting resulted in the detection of the safety
issues and DHPCs were consequently issued. Under limited regulation however, no PSURs are
required and therefore the safety issues would have gone unnoticed or would have been
detected later. For botulinum toxin, we assumed that in the limited regulation scenario the
safety issue would have been detected ten years after marketing authorization (January
2012). For rhBMP-2, we assumed the safety issue would have been detected in 2012 also (five
years after the indication was approved) given the highly publicized controversy in the US
regarding the off-label use of rhBMP-2 in spinal fusions.[14]
There is little empirical evidence concerning the effect of a DHPC in reducing ADR incidence.
A systematic review of the impact of drug safety warnings identified 52 studies, 45% of which
used volume (i.e. drug use) as the outcome measure of the assessed impact and four of
which used spontaneous ADR reporting, mortality, or ADR incidence.[15] In two of those four
studies the rate of ADR reports increased after the safety warning, most likely due to
underreporting before the safety warning was issued.[16,17] A study investigating the impact of
a safety warning regarding oral contraceptives and venous thromboembolism found no
difference in ADR cases before and after the warning.[18] An ecological study regarding the
use of COX-2 inhibitors and rates of gastrointestinal hemorrhage and myocardial infarction
found no strong evidence of a long-term impact of regulatory action on hospital admission
Pharmacovigilance System
(PSURs)
Pharmacovigilance System (no
PSURs)
Spontaneous Adverse Drug
Reaction (ADR) reports
Post-Authorization Safety Studies
Periodic Safety Update Reports
(PSURs)
Spontaneous Adverse Drug
Reaction (ADR) reports
Post-Authorization Safety Studies
FULL REGULATION LIMITED REGULATION
Risk Management Plan (RMP) Risk Management Plan (RMP)

Chapter 7
138
Ch
apte
r 6
rates related to the ADRs.[19] A recent study concerning the impact of DHPCs on drug use
volume in the Netherlands found that 32.8% of DHPCs resulted in a long-term significant
decrease of use, with a mean volume decrease of 26.7%.[20] Drug volume was assessed for
ambulatory care, however, whereas both products in our study are primarily dispensed for
hospitalized patients. Notwithstanding, we assumed the incidence of both safety issues
decreased by 25% after the DHPCs were issued with PSUR reporting.
Model structure
An extensive description of the assumptions regarding all model parameters can be found in
Appendix 7.B, Appendix 7.C and Appendix 7.D and the model parameters are provided in
Table IV. The model started in 1995, the year the central authorization procedure was
initiated (when PSUR reporting starts under full regulation), with a time horizon of 34 years.
The model comprised five life tables: : one Markov-chain life table calculating costs and
effects for botulinum toxin for each of the regulation scenarios (full and limited), one
dynamic population life table calculating costs and effects for rhBMP-2 for each scenario, and
one life table calculating the costs of PSUR reporting under full regulation (Figure 3). The
structures of the life tables for each safety issue were identical except for the transition
probabilities, as they varied under the full and limited regulation scenarios with the
assumptions regarding ADR risks. Under the full regulation scenario, we assumed the risk of
both safety issues was reduced by 25% after the DHPC was issued. Under the limited
regulation scenario, no DHPC was issued in 2007 but we assumed the risk reduction occur in
2012. The differences in costs and effects for both safety issues therefore occurred between
2007 and 2012, and the transition probabilities of the life tables become identical after 2012.
The model calculated the health effects in QALYs. A QALY corrects life years lived with the
health-related quality of life. One QALY therefore can be interpreted as one year lived in full
health.
The botulinum toxin life table consisted of five possible health states following treatment: no
ADR, dysphagia, mild botulism, moderate botulism, severe botulism, and death. Cycle length
was 13 weeks based on average treatment intervals of 12 weeks (13 weeks was chosen for
calculating convenience).[21] We estimated a total of 18,000 patients with an average age of
50 would enter the model January 2001 (averaged estimated number of cervical dystonia
patients in EU-27 undergoing botulinum toxin injections).[21] Death (22.5% after severe
botulism) was the only absorbing state. As we assumed all-cause mortality in cervical
dystonia patients would be equal under both regulatory scenarios, we did not include the
state in the model. Transition probabilities, direct and indirect costs, and utilities for all health
states can be found in Table IV.

The cost-effectiveness of Periodic Safety Update Reports
139
The life tables for rhBMP-2 had a one-year cycle length with 33,848 patients (all estimated off-
label lumbar fusions in EU-27) entering the model annually (mean age 50 years). The life
tables consisted of two health states: lumbar operation-no complications and edema-
hospitalization. All transition probabilities, utilities, and direct and indirect cost estimates are
listed in Table IV.
MAH and regulatory costs
Under the full regulation scenario, relevant costs included all PSUR-related costs for the
pharmaceutical industry and regulatory agencies during the 1995-2009 period. For a
pharmaceutical company, a small PSUR (< 100 ADR cases, 76 preparation hours) costs €6,000,
a medium PSUR (101-500 cases, 173 hours) costs €14,000 and a large PSUR (>500 cases, 362
hours) costs €28,000 (all in 2006 euros).[7,8] We also took marketing periods into account: in
our PSUR sample, the distribution of small, medium, and large PSURs was 65%, 16%, and 19%
for 6-month PSURs, 29%, 17%, and 54% for 1-year PSURs, and 30%, 20%, and 50% for more than 1-
year PSURs (Table II).[9] For all marketed biologicals during 1995-2009 we estimated the
number of PSURs that would have been submitted after market approval. More than 50% of
all biologicals older than 5 years still follow the annual reporting scheme.[9] Therefore we
assumed 50% of products >5 years marketed followed the 1-year reporting scheme and 50%
followed the 3-year scheme. This resulted in an estimated total of 964 reported PSURs for all
biologicals during 1995-2009. Using the small, medium and large distribution among 6-month,
1-year, and 3-year PSURs from our sample, the total estimated costs of all PSURs were €14.2
million during 1995-2009 for pharmaceutical companies.[9]
Every submitted PSUR for a biological is assessed by the EMA. PSUR costs are estimated by
the time spent preparing it (the MAH) and assessing it (the regulatory authority). Regulatory
estimates of PSURs obtained from two European Competent authorities were 7 rapporteur
hours per small PSUR, 15 hours (medium), and 40 hours (large). We used 25% of the
rapporteur time to estimate the co-rapporteur hours per PSUR. We assigned a cost of €49 per
hour for a public official in the EU-27.[8] The total estimated regulatory PSUR cost was
€1,079,645 for our 15-year period. The EMA has proposed new fees for PSUR assessment
(€40,150 for a PSUR on a biological marketed for less than two years and €80,300 for a
biological marketed more than 2 years.[22] We used these fees as cost estimates in a
sensitivity analysis.

Ch
apter 7
14
0
Table IV: All model parameters
Parameter Value Source Distribution Parameter Value Source Distribution
General Botulinum toxin - followed
PSUR small costs € 6,000 [8] Normal House days mild 5 [24] Normal
PSUR medium costs € 14,000 [8] Normal House days moderate 7 [24] Normal
PSUR large costs € 28,000 [8] Normal Hospital days moderate 7 [24] Normal
Proportion S-M-L PSURs 6-month 65%-16%-19% [9] Bed days moderate 7 [24] Normal
Proportion S-M-L PSURs 1-year 29%-17%-54% [9] House days severe 53 [24] Normal
Proportion S-M-L PSURs 3-year 30%-20%-50% [9] Hospital days severe 53 [24] Normal
Inpatient day university hospital € 575 [25] Normal Intensive care days severe 30 Assumptio
n Normal
Intensive care unit € 2,183 [25] Normal Bed days severe 23 [24] Normal
Productivity costs per hour € 30.02 [25] Normal Productivity days lost moderate 21 [24] Normal
Informal care per hour € 12.50 [25] Normal Productivity days lost severe 159 [24] Normal
Productivity hours lost per sick day 8 Assumption Normal rhBMP-2
Hours of informal care per bed day 8 Assumption Normal Spondylodese procedures NL 2,203 [26]
Botulinum toxin Percentage lumbar off-label 60% [27,28] Beta
Proportion of CD patients treated 80% [29] Beta Probability edema 1% [27,30] Beta
Mean number CD patients 2001 22,601 Calculated Probability hosptitalization 30%
EudraVigilance, expert opinion
Beta
Mean age CD patients 50 [21] Use of rhBMP-2 1% expert opinion
Beta
Life expectancy CD patient 80
EU-27 LE weighted by male/female
ratio
Hospital days required 3 expert opinion
Normal
Utility treatment 0.71 [31] Beta Productivity days lost swelling 10 expert opinion
Normal
Utility dysphagia 0.66 [31] Beta Costs operation € 1,094 [32] Normal

The co
st-effectiveness o
f Perio
dic Safety U
pd
ate Rep
orts
141
Table IV continued
Utility mild 0.66 [31] Beta utility index 1 year - fluid collection 0.500 [33] Beta
Utility moderate 0.31 calculated Beta utility index 1 year - no complication 0.621 [33] Beta
Utility severe 0.00 Expert opinion utility index 2 years 0.638 [33] Beta
Utility death 0.00 Expert opinion utility index 3 years 0.630 [33] Beta
P dysphagia 17% [21] Beta utility index 4 years 0.646 [33] Beta
P mild botulism 0.40% [21] Beta utility index 5 years 0.653 [33] Beta
P moderate botulism 0.09% [21] Beta
P severe botulism 0.01% [21] Beta
P death 22.5% [24] Beta
Values are base-case assumptions. Distribution indicates the distribution used for probabilistic sensitivity analysis. See Appendix 7.A for detailed description of all parameter assumptions that were made and Appendix IV for probabilistic sensitivity analysis details. Abbreviations: CD Cervical dystonia

Chapter 7
142
Ch
apter 7
1995
FULL REGULATION LIMITED REGULATION
Start model
Annually:
PSUR costs MAHs PSUR costs Regulatory Agency
2001
Botulinum toxin enters the market Botulinum toxin enters the market
Life table:
18,081 patients enter life table
Cycle length 13 weeks
Probability dysphagia: 17%
Probability mild botulism: 0.4%
Probability moderate botulism: 0.09%
Probability severe botulism: 0.01%
Probability death │severe botulism:
22.5%
Life table: 18,081 patients enter life table Cycle length 13 weeks Probability dysphagia: 17% Probability mild botulism: 0.4% Probability moderate botulism: 0.09% Probability severe botulism: 0.01% Probability death │severe botulism:
22.5% 2005
rBMP indication spinal fusion
approved rBMP indication spinal fusion
approved Life table: 39,848 lumbar fusions EU annually Cycle length 1 year Use of rBMP: 1% of lumbar fusions Probability edema: 1% Probability hospitalization │edema: 30%
Life table: 39,848 lumbar fusions EU annually Cycle length 1 year Use of rBMP: 1% of lumbar fusions Probability edema: 1% Probability hospitalization │edema: 30%
March 2007: DHPC rBMP
Risk of edema reduced by 25%
July 2007: DHPC botulinum toxin Risk of botulism reduced by 25%
2009
Last year PSUR costs
2012
Detection of both safety issues
through other pharmacovigilance
activities Risk of edema reduced by 25%
Risk of botulism reduced by 25% 2028
End of life tables. After 2012, the costs and effects are identical for both
regulatory scenarios.

The cost-effectiveness of Periodic Safety Update Reports
143
Figure 3. Model outline. The model consists of five separate life tables: botulinum toxin limited and full regulation (2001-2028), rBMP limited and full regulation (2005-2028), and PSUR costs (1995-2009). Abbreviations: MAH Market authorizaton holder; rBMP Bone morphogenetic protein; DHPC Direct healthcare professional communication; PSUR Periodic Safety Update Report.
Discounting
Discounting is usually applied in economic evaluations to allow for time preferences (benefits
today are more valuable than future benefits) and uncertainty. We performed a retrospective
analysis, however, in which part of the costs and effects occur in the past (and are corrected
for inflation using the EU-27 Harmonized Indices of Consumer Prices (HICPs).[23] The model
takes a lifetime perspective to estimate the total costs and effects of the two regulatory
scenarios. The difference between the costs and effects of the two regulatory scenarios
originates in the years 2007-2012, during which the reporting of the urgent safety issues
between the full and limited regulation scenarios varies. Some of the relevant health effects
occur after 2012, as some cases of botulism that would have occurred under limited
regulation were prevented by full regulation. To allow the estimation of all health effects a
lifetime perspective needs to be used. As these events have occurred in the past, we are
certain about their occurrence and therefore the base case results are not discounted. We
did include two alternative scenarios to demonstrate the impact of discounting: we
discounted all costs and effects (4% and 1.5% respectively and according to Dutch guidelines)
using 1995 as t=0 and another scenario discounting all future costs and effects using 2012 as
t=0.
Sensitivity analysis
Because of our several assumptions regarding model parameters and combinations of
sources of evidence to estimate the parameters, we undertook extensive sensitivity analyses
to investigate the impact of varying model assumptions on the results. We varied all key
model assumptions through univariate sensitivity analyses. We also performed a PSA in which
a distribution is fitted to a set of model parameters to express their uncertainty and used a
sampling process (Monte-Carlo simulation) used to indicate how the results are impacted by
this uncertainty (Table IV, Appendix 7.A).

Chapter 7
144
Ch
apte
r 6
References
1. Stricker BH, Psaty BM. Detection, verification, and quantification of adverse drug reactions. BMJ
2004 Jul 3;329(7456):44-47.
2. Wise L, Parkinson J, Raine J, Breckenridge A. New approaches to drug safety: a pharmacovigilance
tool kit. Nat Rev Drug Discov 2009 Oct;8(10):779-782.
3. Klepper MJ. The periodic safety update report as a pharmacovigilance tool. Drug Saf
2004;27(8):569-78.
4. European Medicines Agency. (2008). Volume 9A of The Rules Governing Medicinal Products in the
European Union. Available from: http://ec.europa.eu/enterprise/pharmaceuticals/eudralex/vol-
9/pdf/vol9a_09-2008.pdf [Accessed 2 August 2011]. .
5. Bouvy JC, Koopmanschap MA, Shah RR, Schellekens H. The cost-effectiveness of drug regulation:
the example of thorough QT/QTc studies. Clin Pharmacol Ther 2012 Feb;91(2):281-288.
6. Bouvy JC, Koopmanschap MA, Schellekens H. Value for money of drug regulation. Expert Rev
Pharmacoecon Outcomes Res 2012 Jun;12(3):247-249.
7. Ridley DB, Kramer JM, Tilson HH, Grabowski HG, Schulman KA. Spending on postapproval drug
safety. Health Aff (Millwood) 2006 Mar-Apr;25(2):429-36.
8. European Commission. (2008) Proposal for a regulation amending, as regards pharmacovigilance of
medicinal products for human use. Regulation (EC) No 726/2004. Impact Assessment. Available
from: http://ec.europa.eu/health/files/pharmacos/pharmpack_12_2008/pharmacovigilance-ia-
vol1_en.pdf [Accessed Aug 6, 2012].
9. Ebbers HC, Mantel-Teeuwisse AK, Sayed-Tabatabaei FA, Moors EH, Schellekens H, Leufkens HG. The
role of Periodic Safety Update Reports in the safety management of biopharmaceuticals. Eur J Clin
Pharmacol 2012 Jun 17.
10. Ebbers HC, Mantel-Teeuwisse AK, Moors EH, Sayed Tabatabaei FA, Schellekens H, Leufkens HG. A
cohort study exploring determinants of safety-related regulatory actions for biopharmaceuticals.
Drug Saf 2012 May 1;35(5):417-427.
11. European Medicines Agency. (2012). Guideline on good pharmacovigilance practices (GVP)4 Module
IX - Signal management (draft). Available from;
http://www.ema.europa.eu/docs/en_GB/document_library/Scientific_guideline/2012/02/WC50012320
9.pdf [Accessed August 6, 2012].
12. Scannell JW, Blanckley A, Boldon H, Warrington B. Diagnosing the decline in pharmaceutical R&D
efficiency. Nat Rev Drug Discov 2012 Mar 1;11(3):191-200.
13. Paul SM, Mytelka DS, Dunwiddie CT, Persinger CC, Munos BH, Lindborg SR, et al. How to improve
R&D productivity: the pharmaceutical industry's grand challenge. Nat Rev Drug Discov 2010
Mar;9(3):203-214.
14. Carragee EJ, Ghanayem AJ, Weiner BK, Rothman DJ, Bono CM. A challenge to integrity in spine
publications: years of living dangerously with the promotion of bone growth factors. Spine J 2011
Jun;11(6):463-468.
15. Piening S, Haaijer-Ruskamp FM, de Vries JT, van der Elst ME, de Graeff PA, Straus SM, et al. Impact
of safety-related regulatory action on clinical practice: a systematic review. Drug Saf 2012 May
1;35(5):373-385.

The cost-effectiveness of Periodic Safety Update Reports
145
16. Malgarini RB, Pimpinella G. Thrombotic thrombocytopenic purpura induced by ticlopidine: the
power of "dear health professional" letters. Ann Pharmacother 2000 Mar;34(3):404-405.
17. Motola D, Vargiu A, Leone R, Conforti A, Moretti U, Vaccheri A, et al. Influence of regulatory
measures on the rate of spontaneous adverse drug reaction reporting in Italy. Drug Saf
2008;31(7):609-16.
18. Farmer RD, Williams TJ, Simpson EL, Nightingale AL. Effect of 1995 pill scare on rates of venous
thromboembolism among women taking combined oral contraceptives: analysis of general practice
research database. BMJ 2000 Aug 19-26;321(7259):477-479.
19. Wheeler BW, Metcalfe C, Gunnell D, Stephens P, Martin RM. Population impact of regulatory
activity restricting prescribing of COX-2 inhibitors: ecological study. Br J Clin Pharmacol 2009
Nov;68(5):752-764.
20. Piening S, Reber KC, Wieringa JE, Straus SM, de Graeff PA, Haaijer-Ruskamp FM, et al. Impact of
safety-related regulatory action on drug use in ambulatory care in the Netherlands. Clin Pharmacol
Ther 2012 May;91(5):838-845.
21. Kessler KR, Skutta M, Benecke R. Long-term treatment of cervical dystonia with botulinum toxin A:
efficacy, safety, and antibody frequency. German Dystonia Study Group. J Neurol 1999
Apr;246(4):265-274.
22. European Commission. (2012) Introduction of fees to be charged by the EMA for
pharmacovigilance: Concept paper submitted for public consultation. Available from:
http://ec.europa.eu/health/files/pharmacovigilance/2012-06_concept_paper_en.pdf [Accessed
August 6, 2012].
23. Eurostat. (2012) Harmonised indices for consumer prices (HICP). Available from:
http://epp.eurostat.ec.europa.eu/tgm/table.do?tab=table&language=en&pcode=tsieb060&tableSel
ection=1&footnotes=yes&labeling=labels&plugin=1 [Accessed August 6, 2012].
24. Mauskopf JA, French MT. Estimating the value of avoiding morbidity and mortality from foodborne
illnesses. Risk Anal 1991 Dec;11(4):619-631.
25. Tan SS, Bouwmans CA, Rutten FF, Hakkaart-van Roijen L. Update of the Dutch Manual for Costing in
Economic Evaluations. Int J Technol Assess Health Care 2012 Apr;28(2):152-158.
26. National Medical Registration (LMR). (2012) Hospital admissions the Netherlands. Availble from:
http://cognosserver.prismant.nl/cognos7/cgi-bin/ppdscgi.cgi?DC=Q&E=/Prisma-Landelijke-
LMR/Landelijke+LMR-informatie+-+Verrichtingen. [Accessed August 1, 2012].
27. Williams BJ, Smith JS, Fu KM, Hamilton DK, Polly DW,Jr, Ames CP, et al. Does bone morphogenetic
protein increase the incidence of perioperative complications in spinal fusion? A comparison of
55,862 cases of spinal fusion with and without bone morphogenetic protein. Spine (Phila Pa 1976)
2011 Sep 15;36(20):1685-1691.
28. Cahill KS, Chi JH, Day A, Claus EB. Prevalence, complications, and hospital charges associated with
use of bone-morphogenetic proteins in spinal fusion procedures. JAMA 2009 Jul 1;302(1):58-66.
29. Martikainen KK, Luukkaala TH, Marttila RJ. Working capacity and cervical dystonia. Parkinsonism
Relat Disord 2010 Mar;16(3):215-217.
30. Glassman SD, Howard J, Dimar J, Sweet A, Wilson G, Carreon L. Complications with recombinant
human bone morphogenic protein-2 in posterolateral spine fusion: a consecutive series of 1037
cases. Spine (Phila Pa 1976) 2011 Oct 15;36(22):1849-1854.

Chapter 7
146
Ch
apte
r 6
31. Hilker R, Schischniaschvili M, Ghaemi M, Jacobs A, Rudolf J. Health related quality of life is improved
by botulinum neurotoxin type A in long term treated patients with focal dystonia. J Neurol
Neurosurg Psychiatry 2001 Aug;71(2):193-199.
32. Dutch Healthcare Authority. (2102) Diagnosis-related group (DBC) tariffs for the Netherlands.
Available from: http://dbc-tarieven.nza.nl/Nzatarieven/top.do [Accessed August, 2012].
33. Glassman SD, Polly DW, Dimar JR, Carreon LY. The cost effectiveness of single-level instrumented
posterolateral lumbar fusion at 5 years after surgery. Spine (Phila Pa 1976) 2012 Apr 20;37(9):769-
774.

Appendix 7.A
147
Appendix 7.A: Probabilistic sensitivity analysis
In order to demonstrate the combined uncertainty of the model parameters, we performed a
probabilistic sensitivity analysis (PSA). A PSA is performed by fitting a distribution to all or a
selection of model parameters. Subsequently, a sampling procedure (Monte-Carlo
simulation) is performed. During the simulation, a value is drawn from its fitted distribution
for each probabilistic parameter and the costs, effects, and incremental cost-effectiveness
are subsequently calculated. This process is repeated 10,000 times (iterations). Each iteration,
corresponding to one ICER, is plotted in a cost-effectiveness (CE) plane (Figure 1). The CE
plane demonstrates the variability or uncertainty surrounding our model estimates. We
calculated how many of the iterations resulted in (a) lower incremental effectiveness and
lower incremental costs, (b) higher incremental effectiveness and lower costs, (c) lower
incremental effectiveness and higher costs, and (d) higher incremental effectiveness and
higher costs. For the iterations under (d), we used a threshold of €50,000 per quality-adjusted
life year gained (QALY) for the maximum willingness to pay per QALY for those iterations
resulting in higher effectiveness and higher costs.
Distributions and ranges
It is common practice to use a beta distribution (that is bounded between 0 and 1) for
probabilities, and for utilities that are not close to zero. Therefore, we fitted a beta
distribution for all probability and utility estimates. The moments of the distributions are
given in table A5. We had no sample information available for any of our parameters, which
can be used to estimate the range of uncertainty and subsequent moments of the
distribution. Therefore, we estimated the distribution moments α and β by taking the point
estimate and a relatively large standard deviation (Briggs et al. 2006).
It is common to use a gamma distribution for patient-level cost estimates (Briggs et al. 2006).
However, it would not be appropriate to fit such a distribution to the PSUR cost estimates, as
well as our other cost estimates, as there is no reason to assume these would follow a
gamma distribution. Therefore we used a normal distribution with a wide range. For these
cost estimates, we had no sample information to estimate the distribution moments either.
Therefore we set the standard deviation to 1/10th of the mean to estimate a normal
distribution for all cost parameters. All parameters, their distributions and distribution
moments are provided in table A1.

Chapter 7
148
Ch
apte
r 6
PSUR-related parameters base case value Distribution St. Dev. Alpha Beta
PSUR small costs € 6,000 Normal 600
PSUR medium costs € 14,000 Normal 1400
PSUR large costs € 28,000 Normal 2800
Costs per regulator hour
Hours rapporteur MHRA small PSUR
7 Normal 0.7
Hours co-rapporteur MHRA small
1 Normal 0.1
Hours rapporteur MHRA
medium PSUR 15 Normal 1.5
Hours co-rapporteur MHRA medium
3 Normal 0.3
Hours rapporteur MHRA large PSUR
40 Normal 4
Hours co-rapporteur MHRA large
8 Normal 0.8
General parameters
Risk reduction 0.25 Beta 0.1 4.4 13.3
Inpatient day university hospital € 575 Normal 5.8
Intensive care unit € 2,183 Normal 218.3
Productivity costs per hour € 30.02 Normal 3.6
Informal care per hour € 12.50 Normal 1.3
Productivity hours lost per sick day
8 Normal 0.8
Hours of informal care per bed day
8 Normal 0.8
Botulinum toxin parameters
Proportion of CD patients treated
80% Beta 0.1 12.0 3.0
% of people with paid work age 50-65 NL 2011*
0.6 Beta 0.1 13.8 9.2
Utility treatment 0.71 Beta 0.1 13.9 5.7
Utility dysphagia 0.66 Beta 0.1 14.2 7.3
Utility mild 0.66 Beta 0.1 14.2 7.3
Utility moderate 0.31 Beta 0.1 6.3 14.1
P dysphagia 17% Beta 0.02 59.8 292
P mild botulism 0.40% Beta 0.001 15.9 3,967
P moderate botulism 0.09% Beta 0.0001 80.9 89,837
P severe botulism 0.01% Beta 0.0001 1.0 9,997
P death 22.5% Beta 0.05 15.5 53.3
House days mild 5.00 Normal 0.5
House days moderate 7.00 Normal 0.7
Hospital days moderate 7.00 Normal 0.7
Bed days moderate 7.00 Normal 0.7
House days severe 53.00 Normal 5.3
Hospital days severe 53.00 Normal 5.3
Intensive care days severe 30.00 Normal 3
Bed days severe 23.00 Normal 2.3

Appendix 7.A
149
Productivity days lost moderate 21.00 Normal 2.1
Productivity days lost severe 159.00 Normal 15.9
rhBMP-2 parameters
Percentage lumbar off-label 60% Beta 0.1 13.8 9.2
Probability edema 1% Beta 0.008 1.5 152.2
Probability hosptitalization 30% Beta 0.1 6.0 14.0
Use of dibotermin 1% Beta 0.008 1.5 152.2
Hospital days required 3 Normal 0.3
Productivity days lost swelling 10 Normal 0.1
Costs operation € 1,094 Normal 109.4
utility index 1 year - fluid collection
0.500 Beta 0.1 12.0 12.0
utility index 1 year - no complication
0.621 Beta 0.1 14.0 8.5
utility index 2 years 0.638 Beta 0.1 14.1 8.0
utility index 3 years 0.630 Beta 0.1 14.1 8.3
utility index 4 years 0.646 Beta 0.1 14.1 7.7
utility index 5 years 0.653 Beta 0.1 14.1 7.5
Table 7.A: All probabilistic parameters and distributions used for probabilistic sensitivity analysis.

Chapter 7
150
Ch
apte
r 6
Appendix 7.B: All indications for botulinum toxin
Three types of botulinum toxin products with therapeutic indications are marketed in the
European Union: BOTOX (botulinum toxin type A), Dysport (botulinum toxin type A), and
NeuroBloc (botulinum toxin type B). NeuroBloc is the only product that was approved
between 1995-2009 and therefore was included in our analysis, yet, the urgent safety issue
(botulism after therapeutic use) and consequent DHPC was issued for all botulinum toxin
products. NeuroBloc only has an indication for cervical dystonia. As this was the product of
interest in our analysis, we did not take other therapeutic indications into account. However,
the other two botulinum toxin products have more therapeutic indications that we have
summarized here (all indications during 1995-2009), including the maximum recommended
dose (taken from the Summary of Product Characteristics (SPC)) of all the products.
Dysport has additional therapeutic indications for blefarospasm, hemifacilispasm, axillary
hyperhidrosis, and spasticity of the arm after stroke. BOTOX has one additional indication for
equinus foot due to cerebral palsy in peadiatric patients. All indications and their respective
maximum recommended dose (unique for each product) are summarized in table 7.B1.
Product Name Indication Maximum dose
NeuroBloc botulinum toxin type B Cervical dystonia 10,000 U
Dysport botulinum toxin type A Cervical dystonia 1,000 U
Dysport botulinum toxin type A Blefarospasm 40 U per eye
Dysport botulinum toxin type A Hemifacilispasm 40 U per eye
Dysport botulinum toxin type A axillary hyperhidrosis 200 U per arm
Dysport botulinum toxin type A Spasticity arm after stroke 1000 U
BOTOX botulinum toxin type A Cervical dystonia 200 U
BOTOX botulinum toxin type A Blefarospasm 25 U per eye
BOTOX botulinum toxin type A Hemifacilispasm 25 U per eye
BOTOX botulinum toxin type A axillary hyperhidrosis 50 U
BOTOX botulinum toxin type A Spasticity arm after stroke 360 U
BOTOX botulinum toxin type A Equinus foot due to pediatric cerebral palsy 4 U/kg
Table 7.B1: indications and maximum recommended dose per indications. The units (U) are not interchangeable between the different products
Table 7.B1 shows that for most therapeutic indications, the maximum dose is much lower
than the dose used in cervical dystonia patients. We have provided a (rough) estimate of the
total number of annual patients for each indication in the EU, using published prevalence or
incidence estimates (Table 7.B2).

Appendix 7.B
151
Indication Estimated incidence / prevalence EU Estimated annual
patients EU Source
Cervical dystonia 57 per 1 million people 28,482 Warner (2000)
Blefarospasm 36 per 1 million people 17,989 Warner (2000)
Hemifacilispasm 98 per 1 million people 48,969 Nilsen & Dietrich (2004)
axillary hyperhidrosis
1.4% of population 6,995,612 Strutton et al. (2004)
Spasticity arm after stroke
Stroke: 112 per 100,000, incidence all spasticity after stroke: 38% of surviving patients, of which 83% arm is affected
176,513 Watkins et al. (2002) Bejot et al. (2007)
Equinus foot due to pediatric cerebral palsy
Spastic CP 2.1 per 1,000 births, severe walking restrictions in 32% of spastic CP patients
3,609 Andersen et al. (2008)
Table 7.B2. Prevalence or incidence and estimated annual number of patients in the European
Union.
The potential number of patients who would be eligible for botulinum toxin treatment for
spasticity after stroke is quite large (Table A3). Yet, botulinum toxin treatment is not a first-in-
line treatment for post stroke spasticity (Sheean 2009). Therefore we find it unlikely that a
large group of these patients will be treated with botulinum toxin, although we were not
able to find estimates of botulinum toxin treatment among these patients.
The largest estimated number of patients is the number of patients with axillary
hyperhidrosis (almost 7 million people estimated in the EU (Strutton et al 2004)). The
proportion of these people receiving botulinum toxin treatment is not known, however, it
was indicated that of the identified patients with axillary hyperhidrosis, only about 30% of
these patients consults a healthcare professional about their condition. Furthermore, only
about 33% of the patients indicated that their symptoms were barely tolerable or intolerable,
as opposed to tolerable symptoms that never or barely interfered with their daily life.
Therefore we assume only a small number of these patients will be treated with botulinum
toxin injections. Furthermore, the maximum recommended dose for these patients is about
25% of the maximum recommended dose for cervical dystonia patients, putting them at much
lower risk than those patients as well.

Chapter 7
152
Ch
apte
r 6
Appendix 7.C Sources used and assumptions made regarding
the urgent safety issue of distant spread of botulinum toxin
after therapeutic use
Mechanism of systemic spread
Several case reports describing patients experiencing symptoms of systemic spread after
therapeutic use of botulinum toxin (both type A as type B) have been published (Bakheit et
al. 1997, Bhatia et al. 1999, Tugnoli et al. 2002, Goldstein et al.2006, Souayah et al. 2006,
Duffey et al. 2006, Crowner et al. 2007, Partikian et al. 2007, Roche et al. 2008, Coban et
al.2010). The case reports varied in severity of symptoms that ranged from mild dysphagia to
respiratory distress and paralysis. All cases reported symptoms (generalized weakness,
fatigue) that are consistent with iatrogenic botulism and mean time until full recovery was 3.5
months.
Iatrogenic botulism is caused by botulinum toxin spreading by blood flow (Garner et al. 1993).
Different mechanisms causing systemic spread of botulinum toxin have been proposed:
accidental overdose (Brin 1997), accidental injection of botulinum toxin into the capillary field
or venous system (Crowner et al 2010, Coban et al. 2010), very efficient local uptake and
retrograde axonal transport via spinal motor neurons, or systemic distribution via blood
circulation (Garner et al. 1993). The potency and consequent dose (in mouse units U) of
botulinum toxin type A and type B are significantly different and have a dosage ratio of
roughly 3:1 to 4:1 (Brin 1997). This could result in accidental overdose due to conversion errors
(Brin 1997). However, severe systemic effects are unlikely as overdose would require
intramuscular injection of many more vials of toxin than are required for treatment (Brin
1997).
The threshold systemic toxicity or lethal dose in humans is not known, but studies in primates
suggest a clear dose-response relationship between dosage and severity of symptoms after
both intravenous as intramuscular injections, and a dose of 40 U/kg causes systemic toxicity
resembling botulism (Herrero et al. 1967, Scott and Suzuki 1988), which is consistent with a
case report of a patient that developed iatrogenic botulisum after receiving a 40 U/kg dose
(Crowner et al. 2007). Extrapolating the results from Herrero et al. (1967) and Scott and
Suzuki (1988), results in an estimated lethal parental dose of nearly 3000 U of botulinum
toxin type A (Brin 1997). The maximum recommended dose of botulinum toxin type A per
treatment session is 300-400 U, making overdose an unlikely main cause of systemic spread.
A large proportion of the case reports of systemic spread of botulinum toxin after

Appendix 7.C
153
therapeutic use in a wide range of conditions were patients who had tolerated similar dosage
well before developing botulism-like symptoms and several patients continued with
injections after developing botulism without developing symptoms of systemic spread again
(Crowner et al. 2010). Therefore we assumed that cases of systemic spread after botulinum
toxin injection in cervical dystonia patients are mainly caused by accidental injection into the
capillary field or venous system, causing iatrogenic botulism of varying severity.
Probability of iatrogenic botulism
The DHPC reported ‘very rare reports’ (post-marketing) of serious ADRs after therapeutic use
of botulinum toxin, with symptoms related to the peripheral spread of botulinum toxin,
which in ‘extremely rare cases’ had resulted in death. Two types of ADRs can be
distinguished: peripheral or local spread beyond the injection site, that can cause dysphagia,
speech difficulties and neck weakness, and systemic spread, which can cause general
weakness, paralysis, and botulism-like symptoms. Peripheral spread however occurs
frequently, is caused by local spread beyond the injection site, and is a non-preventable ADR.
Iatrogenic botulism will differ in severity. Mild botulism symptoms include malaise, fatigue,
and weakness, have duration of 5 days, a fatality rate of 0%, and will result in 5 house days
(Mauskopf and French 1991). Moderate botulism symptoms also include nausea/vomiting,
diarrhea, abdominal pain, fever, headache, and dizziness, duration of 21 days, result in 7
hospital days, 7 bed days and 7 house days, and have a fatality rate of 0% (Mauskopf and
French 1991). Severe botulism symptoms also include respiratory paralysis, muscular
paralysis, and pulmonary infection, duration of 180 days, respiratory support is required,
result in 90 hospital days (including 30 intensive care days), 30 bed days, and 60 house days,
and have a fatality rate of 22.5% (Mauskopf and French 1991).
Cote et al (2005) reported a series of ADR reported to the Food and Drug Administration
(FDA) after botulinum toxin injections for both therapeutic and cosmetic use. During 2002, a
total of 217 serious ADRs were reported after therapeutic use (with therapeutic uses
encompassing a number of therapeutic indications apart from cervical dystonia). Of these
reports, several are consistent with symptoms of botulism (respiratory system (33),
pneumonia (9), respiratory compromise (18), flu-like syndrome (10), muscle weakness (13),
dysphagia (26), fatigue/malaise (3), among other reported symptoms), which is an indication
that botulism-like symptoms do occur with therapeutic use (Cote et al. 2005). Furthermore, a
total of 28 deaths were reported after therapeutic use, of which 6 were attributed to
respiratory arrest, and 2 to pneumonia (1 confirmed aspiration pneumonia), which indicate
the possibility of death caused by botulism (yet not confirmed). It is important to note that

Chapter 7
154
Ch
apte
r 6
26 of 28 deaths occurred in patients with underlying systemic diseases with elevated risk of
death (Cote et al. 2005).
Kessler et al. (1999) reported all ADRs after long-term botulinum toxin injections (>2 years) in
a group of 303 cervical dystonia patients that received a total of 3088 injections (Kessler et al.
1999). Dysphagia (symptom of peripheral spread) was reported in 17% of injections, which is
consistent with the EPAR for botulinum toxin type B which lists dry mouth and dysphagia as
very commonly reported symptoms (>1 in 10 patients). General weakness, a symptom of
botulism, was reported in 0.5% of all injections. Therefore we assume a probability of 0.5%
systemic spread per injection. Kessler et al. (1999) report vertigo/nausea in 0.1% of all
injections which are symptoms of moderate botulism as defined by Mauskopf and French
(1991). However, none of the other moderate botulism symptoms (diarrhea, abdominal pain,
fever, malaise, weakness, and headache) are reported, and Kessler et al. (1999) conclude that
there is no indication from their study that systemic effects become clinically relevant during
long-term exposure to botulinum toxin type A (Kessler et al. 1999). We assumed an overall
probability of botulism of 0.5% per injection (Kessler et al. 1999), and based on a reported
dose-response relationship for systemic effects and the 0.1% probability of vertigo/nausea
reported by Kessler et al. (1999) consistent with moderate botulism, we assumed out of all
cases of botulism, 80% were mild and 20% were either moderate or severe (consistent with
the 0.5% general weakness and 0.1% vertigo/nausea). Furthermore we assumed 90% of
moderate/severe botulism cases were moderate and 10% were severe. Combined, these
estimates resulted in risk per injection of 40 per 10,000 patients for mild botulism, 9 per
10,000 of moderate botulism, and 1 per 10,000 patients severe botulism with a mortality risk
of 22.5%. We believe the real probability of moderate or severe botulism after injection in
cervical dystonia patients under normal use is likely to be lower in clinical practice, as not all
symptoms consistent with these disease states are reported by Kessler et al. (1999) and their
study did not include a single case of severe botulism.
Utilities of different health states in botulinum toxin life tables
Treatment with no ADR was assigned a health utility of 0.71 (Hilker et al. 2001). The dysphagia
health state was assigned a health utility of 0.66 (Hilker et al. 2001), the health state mild
botulism was assigned a utility of 0.66, the moderate botulism health state was assigned a
health utility of 0.31 (assigning a Dutch tariff (Lamers et al. 2005) valuation of EQ-5D health
status of 32321 which was derived using the Mauskopf and French (1991) description of
moderate botulism symptoms), health state severe botulism was assigned a utility of 0, and
death 0.

Appendix 7.C
155
Direct and indirect costs of iatrogenic botulism
We assigned no costs to the health state ‘dysphagia’ as these symptoms are minor and
usually require no additional care. The direct and indirect costs of mild, moderate, and severe
botulism are estimated based on Mauskopf and French (1991). For each disability state, we
assumed 8 hours of productivity were lost per house/bed/hospital day, 60% of patients had
paid work (CBS 2012), and 8 hours of informal care are required for each bed day. For mild
botulism, 5 house days (but no additional care) are assumed. For moderate botulism, 7
hospital days, 7 bed days, and 7 house days are assumed (total duration 21 days). For severe
botulism, 90 hospital days (of which 30 intensive care unit days), 30 bed days, and 60 house
days were assumed (total duration 180 days). The probability of death after this state was
22.5%. See table 2 for cost parameters used. Total estimated direct and indirect costs per
patient for mild botulism were €1,201, moderate botulism €5,355, and severe botulism
€146,219. All patients surviving after severe botulism transitioned to moderate botulism after
one cycle to allow for the duration (two model cycles, total duration 26 weeks) of severe
botulism. We corrected the total length of house, bed, hospital and productivity losses days
of severe botulism for those in the consequent moderate botulism state as to no
overestimate the costs of severe botulism.
Direct costs Direct and indirect costs
Costs mild botulism case € 0 € 924
Costs moderate botulism case € 4,351 € 5,593
Costs severe botulism case € 103,745 € 135,613
Table 7.C: Direct and indirect costs per case (in 2012 Euros)

Chapter 7
156
Ch
apte
r 6
Appendix 7.D Sources used and assumptions made regarding
the urgent safety issue of fluid collection and edema after
spinal fusion using rhBMP-2
Mechanism of edema after rhBMP-2 use in spinal fusion
rhBMP-2-induced inflammation may induce ADRs such as swelling, seroma formation, and
implant size effusions (Choudry et al. 2012). The risk of such complications after the use of
rhBMP-2 in lumbar fusions with posterior approaches (not indicated) was communicated by
means of a DHPC in 2007. Several case reports of patients experiencing swelling
complications after fusion surgery of different segments, including the lumbar and cervical
spine, have been published (Perry et al. 2007, Shah et al. 2008, Shahlaie et al. 2008, McDonald
et al. 2010, Muchow et al. 2010, Robin et al. 2010, Anderson et al. 2011, Lindley et al. 2011). The
reports of fluid collection mentioned in the DHPC resulted in nerve compression, neurological
deficit, or pain in more than 50% of the cases. Surgical removal has been required in cases
where symptoms persisted.
Spine fusion procedures with rhBMP-2: probability of complications
In the Netherlands, 2,203 spinal fusion operations (spondylodese) were performed in 2010
(LMR 2012). Williams et al. (2011) and Cahill et al. (2009) reported large samples of fusion
operations in the US and report a breakdown by different procedures. Assuming the off-label
posterior lumbar approaches as referenced in the DHPC include interlaminar/facet fusion,
posterolateral fusion, posterior lumbar interbody fusion, and transforanimal lumbar fusion,
we estimated that 60% of all fusion procedures were posterior lumbar approaches (Williams
et al. 2011, Cahill et al. 2009). Extrapolating the number of procedures in the Netherlands to
the EU-27 population, we estimated a total of 66,414 fusion procedures per year in total of
which 39,848 were posterior lumbar approaches.
In the US rhBMP-2 is used in about 35% of all lumbar fusions (Williams et al. 2011, Cahill et al.
2009). However, in the Netherlands and EU usage levels are much lower (Prof. Öner,
personal communication). Many European countries finance hospitals through diagnosis-
related groups (DRGs) where one tariff is used for a procedure. The costs of rhBMP-2 in the
Netherlands are about €3,000 per kit, yet, the DRG for lumbar fusions does not cover the
costs of rhBMP-2, creating a disincentive to use rhBMP-2 in lumbar fusions. The same
disincentive has been reported for Germany (Alt and Heissel 2006). Although we have not
been able to find data regarding the use of rhBMP-2 in lumbar fusions in other European

Appendix 7.D
157
countries, widespread use of DRG-based financing systems throughout the EU leads us to
believe that the Dutch situation is exemplary for the EU. Therefore we assumed that rhBMP-2
was used in 1% of all lumbar fusions (no/low quality autograft, very high probability of non-
fusion with autograft).
Williams et al. (2011) report the number of cases that developed epidural hematoma/seroma
after spinal fusion with dibotermin: 0.5% interlaminar/facet, 0.2% posterolateral, 0.3%
posterior lumbar interbody fusion, and 0.3% transforaminal lumbar interbody fusion, out of a
sample of 55,862 cases in total. Glassman et al. (2011) report a consecutive series of 1037
patients who underwent posterolateral fusion with dibotermin between 2003-2006. They
report hematoma in 0.96% of patients, epidural hematoma in 0.29% of patients, and psoas
hematoma in 0.77% of cases. Combining these studies, we estimated the probability of a
swelling complication after posterior lumbar approaches using rhBMP-2 to be 1%.
The proportion of patients experiencing swelling complications that required clinical
intervention has not been reported. We requested all ADR reports from the EudraVigilance
database for rhBMP-2 up to January 4, 2012. A total of 33 ADR reports were submitted
between 2007 and 2012, 31 of which were reported from Europe. The reports do not indicate
however whether the use was in tibia fractures, on-label or off-label in spinal fusion. Of these
reports, 11 reported symptoms related to fluid collections after the use of rhBMP-2: six
reports of a (pseudo)cyst, two reports of implant site effusion, one report of implant site
inflammation, one report of radicular syndrome, and one report of edema. Only two reports
(radicular syndrome and implant site effusion) were not serious (i.e. not life-threatening or
resulting in death; none actually resulted in death). Whether the ADR resulted in
hospitalization was not reported for five of the serious cases, the pseudocyst and implant site
inflammation did result in hospitalization, and all other reports did not result in
hospitalization. For five of the cyst cases, it is not reported what the outcome was; all other
ADRs were reported as resolved/recovered. Based on these ADR reports, we assumed that
30% of all cases of a swelling complication were serious and required surgical intervention.
We assumed that surgical intervention entailed a reoperation to remove the swelling,
resulted in three hospital days and 10 productivity days lost (i.e. two weeks).
Utilities used for the health states in the rhBMP-2 life tables
Health utility for operation-no complication was 0.621 in year one post-operation, 0.638 in
year two, 0.630 in year three, 0.646 in year four, and 0.653 in year five and subsequent years
(Glassman et al. 2012). We assumed patients in health state edema-hospitalization had a
health utility of 0.500 (baseline in Glassman et al. 2012) during year one, 0.621 in year two, and
all subsequent health utilities as reported by Glassman et al. (2012): patients experiencing the

Chapter 7
158
Ch
apte
r 6
safety issue therefore benefited from the operation with a one year delay due to the
complications in year one.
Direct and indirect costs of edema after use of rhBMP-2
We assumed that 30% of all patients experiencing edema/fluid collection required a
reoperation and were hospitalized for 3 days. Furthermore, we assumed they lost ten
productivity days (two weeks). The estimated costs of the reoperation were €1,094 (based on
the Dutch diagnosis-related group for a reoperation in lumbar fusion patients (NZA 2012)). All
other costs (productivity costs, hospital day) were equal to the estimates used for the
botulinum toxin model.
Direct costs Direct and indirect costs
Costs edema after rhBMP-2 use per patient € 2,988 € 6,068
Table 7.D: Costs per patient with edema complications (in 2012 Euros)
References 1. Briggs A, Claxton K, Sculpher M. Decision modeling for health economic evaluation. Oxford
University Press, Oxford, United Kingdom, 2006.
2. Warner TT. A prevalence study of primary dystonia in eight European countries. Journal of
Neurology 2000;247:787-792.
3. Nilsen B, Le KD, Dietrichs E. Prevalence of hemifacial spasm in Oslo, Norway. Neurology
2004;63(*):1532-1533.
4. Strutton DR, Kowalski JW, Glaser DA, Stang PE. US prevalence of hyperhidrosis and impact on
individuals with axillary hyperhidrosis: Results from a national survey. J Am Acad Dermatol
2004;51(2):241-248.
5. Watkins CL, Leathley MJ, Gregson JM, Moore AP, Smith TL, Sharma AK. Prevalence of spasticity
post stroke. Clinical Rehabilitation 2002;16:515-522.
6. Bejot Y, Benatru I, Rouaud O, Fromont A, Besencenot JP, Moreau T, Giroud M. Epidemiology of
stroke in Europe: geographic and environmental differences. Journal of the Neurological Sciences
2007;262(1-2):85-88.
7. Andersen GL, Irgens LM, Haagaas I, Skranes JS, Meberg AE, Vik T. Cerebral palsy in Norway:
Prevalence, subtypes and severity. European Journal of Pediatric Neurology 2008;12:4-13.
8. Sheean G. Botulinum toxin should be first-line treatment for poststroke spasticity. J Neurol
Neurosurg Psychiatry 2009;80:359.
9. Bakheit AM, Ward CD, McLellan DL. Generalized botulism-like syndrome after intramuscular
injections of botulinum toxin type A: a report of two cases. J Neurol Neurosurg Psychiatry
1997;62:198.

Appendix 7.D
159
10. Bhatia KP, Munchau A, Thompson PD, Houser M, Chauhan VS, Hutchinson M, Shapira AHV, Marsden
CD. Generalised muscular weakness after botulinum toxin injections for dystonia: a report of three
cases. J Neurol Neurosurg Psychiatry 1999;67:90-93.
11. Tugnoli V, Eleopra R, Quatrale R, Capone JG, Sensi M, Gastaldo E. Botulism-like syndrome after
botulinum toxin type A injections for focal hyperhidrosis. British Journal of Dermatology
2002;147:808-840.
12. Goldstein EM. Safety of high-dose botulinum toxin type A therapy for the treatment of pediatric
spasticity/ Journal of Child Neurology 2006;21:189-193.
13. Souayah N, Karim H, McArdle J, Marcus S. Severe botulism after focal injection of botulinum toxin.
Neurology 2006;67:1855-1856.
14. Duffey P, Brown C. Iatrogenic botulism in an amateur weight-lifter. Movement disorders
2006;21(7):1056.
15. Crowner BE, Brunstrom JE, Racette BA. Iatrogenic botulism due to therapeutic botulinum toxin A
injection in a pediatric patient. Clinical Neuropharmacology 2007;30(5)Sep/Oct:310-313.
16. Partikian A, Mitchell G. Iatrogenic botulism in a child with spastic quadriparesis. Journal of Child
Neurology 2007;22:1235-1237.
17. Roche N, Schnitzler A, Genet F, Durand MC, Bensmail D. Undesirable distant effects following
botulinum toxin type A injection. Clinical Neuropharmacology 2008;31(5):272-280.
18. Coban A, Matur Z, Hanagasi H, Parman Y. Iatrogenic botulism after botulinum toxin type A
injections. Clinical Neuropharmacology 2010;33(3)May/June:158-160.
19. Garner CG, Straube A, Witt TN, Gasser T, Oertel WH. Time course of distant effects of local injections
of botulinum toxin. Movement Disorders 1993;8(1):33-37.
20. Brin MF. Botulinum toxin: Chemistry, Pharmacology, Toxicity, and Immunology. Muscle Nerve
1997;20(suppl 6):S146-S168.
21. Crowner BE, Torres-Russotto D, Carter AR, Racette BA. Systemic weakness after therapeutic
injections of botulinum toxin A: a case series and review of the literature. Clinical
Neuropharmacology 2010;33:243-247.
22. Herrero BA, Ecklund AE, Street CS, Ford DF, JK King. Experimental botulism in monkeys-a clinical
pathological study. Experimental and Molecular Pathology 1967;6:84-95.
23. Scott AB, Suzuki D. Systemic toxicity of botulinum toxin by intramuscular injection in the monkey.
Movement Disorders 1988;3(4):333-335.
24. Mauskopf JA, French MT. Estimating the value of avoiding morbidity and mortality from foodborne
illness. Risk Analysis 1991;11(4):619-631.
25. Cote TR, Mohan AK, Polder JA, Walton MK, Braun MM. Botulinum toxin type A injections: adverse
events reported tot he US Food and Drug Administration in therapeutic and cosmetic cases. J Am
Acad Dermatol 2005;53:407-415.
26. Kessler KR, Skutta M, Benecke R. Long-term treatment of cervical dystonia with botulinum toxin A:
efficacy, safety, and antipbody frequency. Journal of Neurology 1999;246:265-274.
27. Hilker R, Schischniaschvili M, Ghaemi M, Jacobs A, Rudolf J. Health-related quality of life is improved
by botulinum neurotoxin type A in long term treated patients with focal dystonia. Journal of
Neurology, Neurosurgery and Psychiatry 2001;71:193-199.

Chapter 7
160
Ch
apte
r 6
28. Lamers LM, Stalmeier PFM, McDonnell J, Krabbe PFM, van Busschbach JJ. Measuring the quality of
life in economic evaluations: the Dutch EQ-5D tariff. Ned Tijdschr Geneeskd 2005;149:1574-1578. [in
Dutch]
29. CBS Statline. Labour participation Dutch population 2011. Via
[http://statline.cbs.nl/StatWeb/publication/?DM=SLNL&PA=71886ned&D1=18&D2=a&D3=0,14-
17&D4=55-64&VW=T]
30. Choudry OJ, Christiano LD, Singh R, Golden BM, Liu JK. Bone morphogenetic protein-induced
inflammatory cyst formation after lumbar fusion causing nerve root compression. J Neurosurg
Spine 2012;16:296-301.
31. Perri, B, Cooper M, Lauryssen C, Anand, N. Adverse swelling associated with use of rh-BMP-2 in
anterior cervical discectomy and fusion: a case study. The Spine Journal 2007:235-239.
32. Shah MM, Smyth MD, Woo AS. Adverse facial edema associated with off-label use of recombinant
human bone morphogenetic protein-2 in cranial reconstruction for craniosynostosis. J Neurosurg
Pediatrics 2008;1:255-257.
33. Shahlaie K, Kim KD. Occipitocervical fusion using recombinant human bone morphogenetic protein-
2. Adverse effects due to tissue swelling and seroma. Spine 2008;33(21):2361-2366.
34. MacDonald KM, Swanstrom MM, McCarthy JJ, Nemeth BA, Guliani TA, Noonan KJ. Exaggerated
inflammatory response after use of recombinant bone morphogenetic protein in recurrent
unicameral bone cysts. J Pediatr Orthop 2010;30(2):199-205.
35. Muchow RD, Hsu WK, Anderson PA. Histopathalogic inflammatory response induced by
recombinant bone morphogenetic protein-2 causing radiculopathy after transforaminal lumbar
interbody fusion. The Spine Journal 2010;10:e1-e6.
36. Robin BN, Chaput CD, Zeitouni S, Rahm MD, Zerris VA, Sampson HW. Cytokine-mediated
inflammatory reaction following posterior cervical decompression and fusion associated with
recombinant human bone morphogenetic protein-2. Spine 2010;35(23):E1350-E1354.
37. Anderson DW, Burton DC, Jackson RS. Postoperative cervical myelopathy and cord compression
associated with the use of recombinant bone morphogenetic protein-2 in posterior cervical
decompression, instrumentation, and arthrodesis. Spine 2011;36(10):E682-E686.
38. Lindley TE, Dahdaleh NS, Menezes AH, Abode-Iyamah KO. Complications associated with
recombinant bone morphogenetic protein use in pediatric craniocervical arhrodesis. J Neurosurg
Pediatrics 2011;7:468-474.
39. Williams BJ, Smith JS, KMG Fu, et al. Does bone morphogenetic protein increase the incidence of
perioperative complications in spinal fusion? Spine 2011;36(20):1685-1691.
40. Cahill KS, Chi JH, Day A, Claus EB. Prevalence, complications, and hospital charges associated with
use of bone-morphogenetic proteins in spinal fusion procedures. JAMA 2009;302(1):58-66.
41. Alt V, Heissel A. Economic considerations for the use of recombinant human bone morphogenetic
protein-2 in open tibial fractures in Europe: the German model. Curr Med Res Opin 2006;22 Suppl
1:S19-S22.
42. Diagnosis-related group (DBC) tariffs for the Netherlands. Dutch Healthcare Authority 2012. Via
http://dbc-tarieven.nza.nl/Nzatarieven/top.do [01-08-2012]

Chapter 8
General Discussion
“You can’t have everything you want, you can’t get something for nothing, and you
should think about what you have to give up to get something you do want.”
Scott Grosse and colleagues (In: Lessons from cost-effectiveness research for United States Public
Health Policy. Annual Review of Public Health, 2007)

Chapter 8
162
Ch
apte
r 6
Introduction
The work in this thesis was dedicated to the valuation and evaluation of the drug regulatory
framework by means of different methodological approaches. This final chapter contains a
general discussion of the work reported in this thesis and consists of three parts. First, the
main findings of this thesis are reported and discussed. Chapter 6 and chapter 7 present the
application of health technology assessment (HTA) as a feasible tool to evaluate
pharmaceutical regulation. As this concerns a novel methodological approach to
pharmaceutical policy evaluation, the second part of this chapter is dedicated to a separate
discussion of a number of identified methodological challenges and suggestions for future
regulatory cost-effectiveness studies. The last part of this chapter is dedicated to a discussion
of the scientific, societal, and monetary implications of our findings.
Main findings
The societal valuation of safety-related regulatory actions is high. Chapter 2 reports a study
into the willingness to pay (WTP) for the reduction of the risk for pure red cell aplasia (PRCA)
in users of epoetin. The general public was willing to accept an average annual increase of
€24.40 (median: €10) in their health insurance premium whereas chronic kidney disease
patients were willing to accept an annual increase of €46.52 (median: €35). Acknowledging
several possible biases that could have inflated these results, they nonetheless reflect a high
societal (monetary) valuation of regulatory measures aimed at increasing drug safety.
Furthermore, the WTP estimates might reflect altruistic or existence values regarding safety
regulation: people derive utility from knowing that others are protected from drug safety
risks, even if they will presumably never face the risk. Interestingly, risk magnitude was not
significantly associated with WTP whereas risk perception was (two different PRCA risks were
used: 4.5 per 10,000 patients and 45 per 10,000 patients). Respondents who felt the PRCA
risk was substantial were willing to pay significantly more to avoid the PRCA risk than those
respondents who felt the PRCA risk was small. In addition, this finding illustrates that the
validity of WTP studies might be limited by the difficulty respondents have in interpreting
small safety risks.
Benefit-risk assessment of pharmaceuticals was studied in chapter 3 by means of a discrete
choice experiment. We elicited benefit-risk preferences of (i) employees of a regulatory
agency and (ii) a sample of academics. We found that both groups preferred pharmaceuticals
with a low frequency and severity of adverse drug reactions, pharmaceuticals aimed at
treating a high disease severity and with large health gains, and pharmaceuticals with no

General Discussion
163
therapeutic alternatives. The results indicate that health gains resulting from treatment were
not valued equally to health losses resulting from adverse drug reactions. For both groups, a
substantial proportion of respondents were not willing to trade-off a high risk of a life-
threatening adverse drug reaction for a substantial health gain of recovering to full health
from a disease that would have been fatal if not treated. Furthermore, regulators were less
willing to trade off high risks for large health gains than the academics. These results indicate
the existence of loss aversion regarding adverse drug reactions. Also, as we found that the
general public was willing to pay considerably to avoid a small albeit severe drug safety risk
(Chapter 2), and both regulators as well as academics strongly disliked pharmaceuticals with
substantial safety risks, even if these safety risks were accompanied by large health gains
(Chapter 3), we conclude that the regulation of drug safety risks is highly valued.
The methods employed in chapter 2 (contingent valuation) and chapter 3 (discrete choice
experiment) are intended to measure preferences or values for non-market goods. In both
studies respondents had to construct their preferences on the spot. Although little can be
done to prevent different types of limitations when valuing non-market goods or policies,
more effort should be made to gain insight into the cognitive process of constructing
preferences. Face-to-face interviews or a group discussion following data collection could
facilitate the elicitation of such feedback from respondents. Such activities would have
helped in interpreting the results of both studies. Furthermore, future studies that deploy
similar techniques to study benefit-risk assessment or the societal valuation of drug
regulation should engage in such activities.
In order to determine whether the aims of the drug regulatory framework (i.e., to protect
and promote public health) are sufficiently achieved at acceptable costs, the cost-
effectiveness of drug regulatory requirements should be assessed (chapter 4). The feasibility
of regulatory cost-effectiveness analysis was demonstrated in chapters 6 and 7. The guideline
evaluated in chapter 6 intends to increase drug safety through the prevention of drug-
induced sudden cardiac deaths by mean of performing thorough QT/QTc studies. We
identified an incremental cost-effectiveness ratio (ICER) of €187,175 per quality-adjusted life
year (QALY) gained by this guideline, as compared to no regulation. Periodic Safety Update
Reports (PSURs) aim to increase drug safety by detecting safety issues post-marketing. The
ICER of PSUR reporting for biologicals was €342,110 per QALY gained (chapter 7). Both
regulatory cost-effectiveness analyses found ICERs that are considerably higher than what
would be considered ‘favorable’ for medical interventions.
There is no consensus regarding the willingness-to-pay per QALY threshold in the
Netherlands or in most other Western countries. The United Kingdom uses a threshold of
£30,000 per QALY gained to determine whether treatments should be reimbursed[1] and a

Chapter 8
164
Ch
apte
r 6
£50,000 per QALY gained threshold for life-extending treatments. A Dutch threshold of
€20,000 to €80,000 per QALY, with the threshold depending on disease severity, was
proposed in 2006[2] but thus far is not consistently applied in decision making. In the US, a
$50,000-$100,000 per QALY threshold is commonly cited,[3] but decision making regarding
reimbursement of treatments is fragmented within the US healthcare system. All of the
willingness-to-pay per QALY thresholds mentioned here are considerably lower than the
ICERs reported in chapters 6 and 7. However, the societal valuation of regulatory measures
aimed at increasing drug safety is high (chapter 2) and health losses are not weighed equally
to health gains (chapter 3). Therefore, the results of economic evaluations of healthcare
programs (where effectiveness is achieved through health gains) and the economic
evaluation of drug safety regulatory measures (where effectiveness is achieved through the
prevention of health losses) cannot simply be valued within one decision-making framework
without an assessment of the societal willingness to pay per QALY gained by drug safety
regulation.
In both regulatory cost-effectiveness analyses (chapter 6 and chapter 7), the effectiveness of
the regulation is determined by reducing adverse drug reactions in patients. Compliance with
safety regulation in clinical practice therefore is the essential mechanism through which
increased public health is to be achieved. ECG monitoring of starting antipsychotic users in
order to identify proarrhythmic QT prolongation resulted in health gains in chapter 6. In
chapter 7, a Direct Healthcare Professional Communication (DHPC) lead to health gains as a
result of PSUR reporting. Yet in both of these cases, compliance was found to be limited. It
can be questioned, therefore, whether it would not be more efficient to increase the
effectiveness of existing regulatory requirements rather than developing new safety-related
regulations. Furthermore, new regulatory requirements hardly ever explicitly state how (i.e.,
through which mechanism) the requirement is expected to increase public health. This
mechanism is either implicit or non-existent but essential to determine the cost-effectiveness
of regulation. Therefore, regulators should be required to explicitly state how a new
regulatory guideline is expected to increase public health (chapter 4).
Methodological considerations in regulatory cost-
effectiveness analysis
One of the aims of this thesis was to establish whether health technology assessment could
be used as a tool to evaluate the cost-effectiveness of drug regulation. Performing a
regulatory cost-effectiveness according to the principles of economic evaluation as they are

General Discussion
165
outlined by Drummond et al. (2005)[4] is not problematic in most areas. We found that
including direct and indirect costs, applying a discount rate to account for differential timing,
and allowing for uncertainty regarding cost- and effectiveness estimates through the use of
sensitivity analyses posed few challenges as compared to a cost-effectiveness analysis of a
medical intervention. However, several methodological issues were identified that are
inherent to the regulatory cost-effectiveness analysis. Here, we discuss the most important
issues we identified and make recommendations for the future conduct of regulatory cost-
effectiveness analysis.
Choosing the right comparator
A first encountered difference between the economic evaluation of a regulatory requirement
and a medical intervention concerns the comparison of alternatives. Cost-effectiveness
analysis is always comparative, with at least two alternatives included in the analysis.[4] When
evaluating medical interventions, the standard treatment for patients is usually the logical
comparator. In chapter 5, the cost-effectiveness of endovascular treatment for acute
ischemic stroke patients was assessed. Intra-arterial thrombolysis is an experimental
treatment for which a subset of acute stroke patients is eligible. As intravenous thrombolysis
is the current standard treatment for acute ischemic stroke, the cost-effectiveness of
endovascular treatment was assessed as compared to intravenous thrombolysis. Identifying
a comparator in regulatory cost-effectiveness is less straightforward. When a regulatory
requirement would be evaluated ex-ante, a sensible comparator would be the current
standard, which often might be ‘no regulation’. When a regulatory requirement already exists
at the time of evaluation, which was the case in both chapters 6 as 7, several different
strategies could be pursued.
We chose to compare ‘regulation’ to a (hypothetical) situation of ‘no regulation’. Even if a
situation of ‘no regulation’ whatsoever is not very realistic, comparing costs and health
effects of a regulatory requirement to a ‘no regulation’ scenario enables the assessment of
maximum achievable health effects, assuming that health losses due to safety issues are
highest when there is no regulation in place aimed at preventing the adverse drug reaction.
Given that many safety-related regulatory requirements are intended to increase public
health through preventing adverse drug reactions, we believe that the potential health gains
of a regulatory requirement should be established before identifying a range of different
regulatory scenarios through which these health gains could be achieved - even though this
would be an important second step of regulatory cost-effectiveness analysis. Therefore, for
the selection of relevant alternatives in regulatory cost-effectiveness analysis, we
recommend the use of a no-regulation comparator. If there are clear competing alternative
regulatory scenarios identifiable, these scenarios should be included in the analysis as well.

Chapter 8
166
Ch
apte
r 6
Including the ‘no regulation’ scenario furthermore enables the assessment of opportunity
costs. When a ‘no regulation’ baseline would not be included, this could result in the better of
two generally undesirable regulatory scenarios being chosen.[5]
Identifying the patient population affected by the regulation
Regulatory requirements are sometimes implemented for a specific indication, drug, or
patient population, but often requirements are implemented for all or a large group of drugs.
This is a distinctive feature of a regulatory cost-effectiveness analysis. In chapter 5, the
patient population consists of acute ischemic stroke patients admitted to the hospital within
4.5 hours of symptoms onset. In chapter 7 however, the regulation is found to have impacted
health in two very different patient populations: patients with cervical dystonia and lumbar
spine fusion patients. Quantifying all patient characteristics, which is essential for estimating
health effects, will become increasingly complicated when these characteristics need to be
assessed for multiple patient populations. When a regulatory requirement is aimed at all
drugs, quantifying its health effects and costs will be practically impossible. Yet in chapter 6
we did evaluate a regulatory requirement aimed at all new drugs under development. In such
a case, we recommend identifying those patient populations in which the most health gains
are to be expected, which was the approach we took in chapter 6 by assessing the health
effects in a population of antipsychotic users. As a result, if the regulation is found to be not
cost-effective in a population in which maximum health gains can be expected, one can infer
a low likelihood that the regulation will be cost-effective in populations with lower expected
health gains, given that costs associated with the adverse drug reaction are proportionate to
its incidence (Box 1). An exception could be a situation in which the combined health gains
across patient populations would result in significantly more health gains without an equal
increase in costs associated with the regulation. For example, in chapter 7, all regulatory
costs are invoked by PSUR reporting and there are no costs related to the prevention of the
two safety issues that were identified. If PSUR reporting would have detected more urgent
safety issues, the health gains of the regulation would have been higher but regulatory costs
would have remained identical. This hypothetical example would have resulted in a more
favorable ICER.
Evidence used for effectiveness and cost estimates
We found that the main issue in regulatory cost-effectiveness analysis concerns the ability to
reliably establish the health effects and costs of the regulation. In cost-effectiveness analysis,
establishing the health effects of an intervention (and its comparator) is preferably done
through a clinical trial, systematic overview of clinical studies, or observational studies.[4] In
chapter 5, the effectiveness of endovascular treatment and its comparator treatments are

General Discussion
167
estimated based on different published clinical studies. Cost estimates were used from a
clinical trial (EDISSE) and health utility estimates originated from another trial (PRACTISE)
and therefore were based on patient-level observations. In a randomized controlled trial,
several measures are taken (e.g., randomization and strict in- and exclusion criteria to create
homogenous patient groups) to minimize the possibility that any observed difference in
health outcomes between treatment arms can be attributed to anything but the effect of the
intervention. Modeling employed in economic evaluation therefore is based on observed
differences in health outcomes in actual patients. In estimating the effectiveness of safety-
related regulatory requirements, clinical trials are not a valid source for estimating health
effects. Extensive post-marketing surveillance is required for marketed products exactly
because clinical trials are insufficient for a complete safety profile of a pharmaceutical
product.[6,7] Therefore, as clinical trials cannot be used to estimate the health effects of any
regulatory requirement aimed at increasing public health through the prevention of adverse
drug reactions, other types of evidence will have to be used.
Box 1: Safety-related regulatory requirements will not be cost-effective if they do not result in substantial health gains accompanied by cost savings.
In both regulatory cost-effectiveness analyses reported in this thesis, various sources, mostly
from the scientific literature, were used to estimate all required parameters (i.e., direct- and
indirect costs, health utilities, life expectancy, and drug utilization data). Combining different
sources of evidence resulted in considerable uncertainty concerning the model parameters.
Therefore sensitivity analysis was used to study the impact of uncertainty, apart from
variation, on the outcomes. Especially when performing cost-effectiveness analysis using
literature estimates as opposed to patient-level data, which will usually be the case in
As additional costs are usually invoked by implementing a regulatory requirement, the findings in chapters 6
and 7 described below stipulate the prerequisite that a new regulation should always result in substantial
health gains accompanied by cost savings in order to become cost-effective:
In chapter 7, the costs of PSUR reporting amounting to €15.3 million during a 13-year period are not
outweighed by the cost savings resulting from PSUR reporting, as the incremental costs remain €13.5 million,
and health gains are modest at 39 incremental QALYs. A sensitivity analysis demonstrated, however, that a
larger risk reduction (100%) resulting from the regulation could result in an incremental cost-effectiveness
ratio of €50,808 per QALY gained.
In chapter 6, preventive measures to avoid drug-induced sudden cardiac deaths invoke additional costs as
each starting user will have to undergo at least two electrocardiographs at €20 each. These additional costs
are simply not outweighed by the health gains produced by the regulation and not even when assuming
maximum achievable health gains.

Chapter 8
168
Ch
apte
r 6
regulatory cost-effectiveness analysis, the application of sensitivity analysis is essential.
Therefore we recommend that, when performing univariate, multivariate, or probabilistic
sensitivity analysis, a wide range (distribution) of possible input parameters are chosen in
order to appropriately quantify uncertainty regarding model assumptions
In both chapter 6 and chapter 7, we believe it is more likely we have overestimated, as
opposed to underestimated, the adverse drug reaction risks. Suppose we perform a
regulatory cost-effectiveness and conclude that the regulation aimed at preventing an
adverse drug reaction is cost-effective, while in fact it is not (Type I error). The consequences
of such a mistake would be efficiency losses, but it is unlikely that a regulatory requirement
determined to be cost-effective would be removed from the drug regulatory framework. Yet,
if we would conclude the regulation was not cost-effective for example due to
underestimating a safety risk while in fact it is (Type II error), and the regulation would be
changed or removed from the regulatory framework, the consequence of this type of error
would be decreased public health. Considering the high social valuation of safety-related
regulatory actions (chapter 2) and the finding that health losses are not evaluated equal to
health gains (chapter 3), we believe that the first type of error (wrongfully concluding a
regulation is cost-effective) will be more acceptable to society than the second type of error
(wrongfully concluding a regulation is not cost-effective), even though opportunity costs
would be invoked in such a situation.
“Safety first” and the price of precaution
The willingness-to-pay threshold per QALY gained by safety regulation cannot be assumed to
be equal to any willingness-to-pay threshold per QALY for medical interventions. The societal
monetary valuation of safety-related regulatory measures is high (chapter 2), and we found
evidence for loss aversion with regard to drug safety risks (chapter 3), as respondents
unequally traded off health gains and health losses. Furthermore, two regulatory cost-
effectiveness analyses (chapter 6 and chapter 7) identified high ICERs for regulatory
measures aimed at increasing drug safety. In the final part of this chapter, the implications of
our findings for the drug safety regulatory framework are discussed.
Safety first
The ‘Vioxx debacle’ is often named as one of the instigators of a shifted societal and
regulatory focus on drug safety.[8,9] Vioxx (rofecoxib) was a widely prescribed anti-arthritis
drug and was withdrawn from the market in 2004, after an increased risk of myocardial
infarctions and stroke was found.[10] Nowadays, substantially more powerful safety-

General Discussion
169
evaluation methods are available[9] which were developed in response to ‘a fundamental shift
in the way society views medicine’.[10] Before these new methods can be translated into actual
public health benefits,[9] however, several unintended consequences of this shifted focus on
drug safety should be addressed. First, more powerful tools to detect safety signals are likely
to increase the number of false-positive safety signals.[9] This could distort the balance
between promoting and protecting public health, where effective drugs with manageable or
acceptable safety risks might have their marketing license revoked. Also, it could be argued
that these regulatory developments are a response to an increasingly risk-averse society, yet
convincing evidence that these developments reflect a societal preference is currently
lacking.[9] Furthermore, a shifting focus on drug safety might increase public awareness of
safety risks, which in turn could result in even more demand for high drug safety. This could
be prevented, as argued by Eichler et al. (2009), by moving from implicit to explicit decision
making with regard to benefit-risk assessment, which could add to greater consistency and
transparency of regulatory decision making.[9] However, the European Medicines Agency
stated in 2008 that ‘intuitive expert judgment’ was expected to remain the cornerstone of
benefit-risk assessment,[11] which makes a transition to more explicit regulatory decision-
making unlikely in the short-term.
This increased focus on drug safety only serves one of the two goals of drug regulation:
safety-related regulatory requirements aiming to protect public health by ensuring unsafe
drugs do not reach patients. High safety requirements do not only raise the bar for market
introduction but also increase the costs of drug development.[12] If these high safety
standards do not reflect a societal preference regarding drug safety levels, however, there
merely is a negative impact on public health, as it would result in effective treatments with
manageable or acceptable safety risks not reaching patients. This particular impact of the
current drug regulatory framework is highly probable. The consequences of approving a
harmful drug, as opposed to not approving a safe and effective drug, are much more serious
to regulators,[13] and these consequences are much more visible to the public as well.
According to Lundkvist & Jonsson (2004), cost-benefit studies of regulatory policy are
therefore needed to aid regulators in rational decision-making, and to justify regulatory
decision-making to the public.[13] However, cost-benefit analysis (in which both costs and
effects are weighed in monetary terms), is not commonly applied, and monetary valuation of
health benefits (i.e. by means of contingent valuation as used in chapter 2) has several
methodological issues. Therefore, the application of health technology assessment in
regulatory cost-effectiveness analysis, as demonstrated in this thesis, is a more feasible
approach. Regulatory cost-effectiveness studies could facilitate a shift away from the current
implicit regulatory decision making by identifying an explicit optimum of protecting and
promoting public health through the drug regulatory framework. Furthermore, regulatory

Chapter 8
170
Ch
apte
r 6
decision making needs to become more transparent to improve the accountability and
reasonableness of regulatory decisions.[14]
The price of precaution
More stringent regulatory safety requirements have increased the costs of drug
development,[12,15] and yet the potential opportunity costs of stringent regulatory safety
requirements go largely unnoticed when proposals for more safety regulation are made.[16]
The central elements of economic evaluation are constrained resources, trade-offs, and
opportunity costs: ‘you can’t have everything you want, you can’t get something for nothing,
and you should think about what you have to give up to get something you do want’.[17] Every
Euro spent on compliance with a cost-ineffective regulatory requirement, would therefore be
better spent on cost-effective regulation, or not at all. As both regulatory cost-effectiveness
analyses reported in this thesis (chapters 6 and 7) demonstrated high ICERs of safety
regulation (compared to no regulation), it is probable that a non-optimal allocation of
resources in the drug regulatory framework currently exists, regardless of whether the actual
total costs of drug development are $800 million[18] or $34 million.[19] If the willingness to pay
per QALY for drug safety regulation would be €80,000 per QALY gained, both regulatory
requirements studied in chapters 6 and 7 should be removed from the regulatory framework,
and not removing them from the regulatory framework would result in both efficiency losses
and opportunity costs.
Figure 1 illustrates that the costs of adverse drug reactions are low when the incidence of the
adverse drug reaction is low and that in such a situation the costs of avoiding the adverse
drug reaction (i.e. safety regulation) are higher than the aggregated costs invoked by the
adverse drug reaction. This implies that when health effects of safety regulation are not
taken into account, a safety risk should only be regulated when the costs associated with the
risk are higher than the costs of avoiding the risk. However, in the current regulatory
framework costs are hardly considered at all and regulatory decision making is driven by
avoiding adverse drug reactions. Yet, if decision making would be based solely on costs, any
health effects invoked by avoiding safety risks would be disregarded. A decision-making
framework based on costs alone therefore is insufficient as well. Regulatory cost-
effectiveness analysis weighs both the costs and health effects of a regulation in deciding
whether safety risks should be regulated or not and therefore is a more comprehensive
framework for regulatory decision-making.
Regulatory cost-effectiveness analysis would be an essential tool in establishing a shift from
implicit to explicit regulatory decision making. The application of regulatory cost-
effectiveness analysis would have little value, however, if its outcomes cannot be confronted

General Discussion
171
with a societal willingness to pay per QALY gained by safety regulation. Furthermore, the
acceptability of drug safety risks, both in severity and magnitude, depends on several drug
characteristics (Chapter 3). Quantitative benefit-risk assessment tools could express health
gains and health losses of pharmaceuticals in terms of QALYs as well.[21-23] Therefore,
quantitative benefit-risk assessment would not only aid explicit decision making in benefit-
risk assessment, but could also facilitate regulatory decision making regarding safety risks as
the cost-effectiveness of safety regulation would be easier to assess with net health benefit
information available.
Figure 1. Relationship between the costs of safety regulation and the costs of adverse drug reactions. Total costs of regulation decrease when ADR incidence is high, whereas the costs of ADRs depend on the incidence of ADRs. For each ADR, the optimum (do the costs of ADRs require regulatory action) is determined by (a) the costs of ADRs, (b) the costs of regulation, and (c) the health gains associated with regulation (not depicted in this graph). Figure based on Pedroni (1984) and Lundkvist & Jonsson (2004).
Final remarks
Dutch writer Maarten ‘t Hart lives in a house that is situated several meters below sea level.
Although the actual risk of a flood is very low, nonetheless he keeps a rubber boat in his
attic.[24] While most people living below sea level do not have rubber boats in their attics, the
cost (as measured in both time and resources) of buying a rubber boat and placing it in the
attic are low and its impact could be potentially lifesaving. But what if Maarten ‘t Hart would
have thought that a rubber boat was not sufficient and would have dedicated his time and
resources to build an Ark of biblical proportions? Considering the opportunity cost of building
an Ark implies no time for writing beautiful books, it would make no sense to spend months
or years building an Ark when a rubber boat will suffice.
Co
sts
Incidence of ADRs
Costs of ADRs
Costs of safety regulation
Chapter 8
172
Ch
apte
r 6
The notion that regulating drug safety, no matter what the cost, can invoke substantial
efficiency losses has been largely ignored, both by regulators and the scientific literature, and
therefore was addressed in chapters 6 and 7 of this thesis. Chapters 2 and 3 provide possible
explanations for the observations made with regard to the high ICERs for safety regulation
that were identified. In conclusion, there is a need for a move to more explicit regulatory
decision making with regard to the acceptability and unacceptability of drug safety risks.
Regulatory cost-effectiveness analysis is the only tool that could support determining an
optimum between protecting and promoting public health. Furthermore, the use of
regulatory cost-effectiveness analysis, in combination with quantitative benefit-risk
assessment tools, will help regulators choosing between rubber boats and Arks in shaping a
more transparent drug regulatory framework.

General Discussion
173
References 1. Donaldson, C. et al. The social value of a QALY: Raising the bar or barring the raise? BMC Health
Serv. Res. 2011, 11:8 doi:10.1186/1472-6963-11-8
2. Dutch Council for Public Health. Meaningful and sustainable Health Care. Advice to the Minister of
Health (in Dutch). (RVZ, Zoetermeer, the Netherlands, 2006).
3. Chambers, J.D., Neumann, P.J., Buxton, M.J. Does Medicare have an implicit cost-effectiveness
threshold? Med. Decis. Making 2010;published online March 15 2010. DOI: 10.1177/0272989X10371134
4. Drummond M, Sculpher M, Torrance G, et al. . Methods for the Economic Evaluation of Health Care
Programmes. 3rd edn. Oxford: Oxford University Press, 2005.
5. Palmer S, Raftery J. Opportunity cost. BMJ 1999;318:1551-1552.
6. Brewer T, Colditz GA. Postmarketing surveillance and adverse drug reactions. Current perspectives
and future needs. JAMA 1999;281:824-829.
7. Stricker BH, Psaty BM. Detection, verification, and quantification of adverse drug reactions. BMJ
2004 Jul 3;329(7456):44-47
8. Ray A. Beyond debacle and debate: developing solutions in drug safety. Nature Reviews Drug
Discovery 2009;8:775-779.
9. Eichler HG, Adabie E, Raine JM, Salmonson T. Safe drugs and the cost of good intentions. New
England Journal of Medicine 2009;360(14):1378-1380.
10. Greener M. Drug Safety on trial. EMBO reports 2005;6(3):202-204.
11. European Medicines Agency. Reflection paper on benefit-risk assessment methods in the context of
the evaluation of marketing authorization applications of medicinal products for human use. 2008
EMA/CHMP/15404/2007
12. Scannell JW, Blanckley A, Boldon H, Warrington B. Diagnosing the decline in pharmaceutical R&D
efficiency. Nature Rev Drug Discov. 11(March), 191-200 (2012).
13. Lundkvist J, Jonsson B. Pharmacoeconomics of adverse drug reactions. Fundamental & Clinical
Pharmacology 2004;18:275-280.
14. Munos B. Lessons from 60 years of pharmaceutical innovation. Nature Rev Drug Discov. 8, 959-968
(2009).
15. Daniels N, Sabin JE. Accountability for reasonableness: an update. BMJ 2008;337:1850-1853.
16. European Commission. (2008) Proposal for a regulation amending, as regards pharmacovigilance of
medicinal products for human use. Regulation (EC) No 726/2004. Impact Assessment. Available
from: http://ec.europa.eu/health/files/pharmacos/pharmpack_12_2008/pharmacovigilance-ia-
vol1_en.pdf
17. Grosse SD, Teutsch SM, Haddix AC. Lessons for cost-effectiveness research for United States public
health policy. Annual Reviews Public Health 2007;28:365-391.
18. DiMasi J, Hansen RW, Grabowski HG. The price of innovation: new estimates of drug development
costs. J Health Econ 2003;22: 151-185
19. Light DW, Warburton R. Demythologizing the high costs of pharmaceutical research. BioSocieties
2011:1-17.
20. Garrison LP, Towse A, Bresnahan BW. Assessing a structured, quantitative health outcomes
approach to drug risk-benefit analysis. Health Affairs 2007;26(3):684-695.

Chapter 8
174
Ch
apte
r 6
21. Garattini S. Evaluation of benefit-risk. Pharmacoeconomics 2010;28(11):981-986.
22. Cross JT, Veenstra DL, Gardner JS, Garrison LP. Can modeling of health outcomes facilitate
regulatory decision-making? The benefit-risk tradeoff for rosiglitazone in 1999 vs. 2007. Clinical
Pharmacology & Therapeutics 2011;89(3):429-436.
23. Pedroni G. Drugs and adverse reactions: an economic view of a medical problem. Social Science &
Medicine 1984;18(2):173-182.
24. Dekkers, M, Kromhout, B, van Rossem, M. De evolutieleer was een inblazing van de duivel.
Maarten! 2012;4:63.

Summary
176
The European pharmaceutical market is strictly regulated. Sufficient levels of quality, safety,
and efficacy will have to be demonstrated before a pharmaceutical is allowed to enter the
market. Drug regulation has two aims: first, to protect public health by keeping low-quality,
unsafe, or inefficacious products from entering the market, and second, to promote public
health by ensuring needed drugs reach patients without unnecessary delay. There is little
evidence, however, that the current drug regulatory framework is achieving its goals in a
cost-effective manner. The aim of this thesis therefore was to assess the cost-effectiveness
of several parts of the drug regulatory framework in order to identify whether the aims of
safety-related drug regulation are met. Furthermore, several other methodological
approaches were used to assess the monetary valuation of safety-related regulatory actions,
as well as trade-offs made with regard to benefit-risk assessment of pharmaceuticals.
In chapter 2, we found that the societal valuation of safety-related drug regulation as
measured in monetary terms is high. In this study, the general public as well as chronic kidney
disease patients were asked how much they were willing to pay to reduce the risk of Pure
Red Cell Aplasia (PRCA) in users of epoetin. The general public was willing to accept an
average increase of their annual health insurance premium, which was about €1,100, of €24.40
(median €10). Chronic kidney disease patients were willing to accept an annual increase of
their health insurance premium of €46.52 (median €35). Although two different PRCA risks
were used in the study, as 50% of respondents were told the risk of PRCA was 4.5 per 10,000
patients, whereas the other 50% of respondents were told the PRCA risk was 45 per 10,000
patients, no significant risk magnitude effect was found. Risk perception, however, was
found to have a significant impact on willingness to pay, illustrating that risk perception
determines willingness to pay for safety-related regulatory actions rather than actual risk
magnitude. Furthermore, respondents have difficulty in the interpretation of small risks.
Although several limitations existed in this study, we believe the results indicate a high
societal valuation of drug safety regulation, as measured in monetary terms.
Chapter 3 was dedicated to the elicitation of preferences with regard to regulatory benefit-
risk assessment of pharmaceuticals. A discrete choice experiment (DCE) was used to study
trade-offs that are made by regulators, academics, a pharmaceutical company, and hospital
pharmacists. We found that both regulators and academics prefer drugs that are aimed at
treating diseases with a high disease severity, with non-severe and infrequent adverse drug
reactions, and that have no therapeutic alternatives. A substantial proportion of both the
regulator and the academics group was reluctant to trade-offs large adverse drug reaction
risks for substantial health benefits. This might indicate that in benefit-risk assessment,
health benefits and health losses are not valued equally, which is in line with economic
theory. Furthermore, we found that regulators exhibited slightly more loss aversion than

Summary
177
academics. The results of chapter 3 stipulate the need for a more explicit and transparent
framework for regulatory benefit-risk assessment.
Chapter 4 provided a brief overview of the most important arguments in favor of regulatory
cost-effectiveness analysis and was followed by chapter 5, in which the application of Health
Technology Assessment (HTA) in the evaluation of medical interventions is demonstrated.
Four different treatment strategies for acute ischemic stroke patients were evaluated:
conservative treatment, intravenous thrombolysis, intra-arterial thrombolysis, and
intravenous thrombolysis followed by intra-arterial thrombolysis. This exploratory study
found that the cost-effectiveness of intravenous thrombolysis followed by intra-arterial
thrombolysis depends on several factors: (i) recanalization rates, (ii) the costs of treatment,
and (iii) the rate of complications.
Chapter 6 and chapter 7 demonstrated the feasibility of HTA in the economic evaluation of
drug regulation. Chapter 6 was dedicated to assessing the cost-effectiveness of thorough
QT/QTc (TQT) studies. These clinical trials are aimed at assessing a pharmaceutical’s QT-
prolonging potential and have been implemented as a mandatory part of drug development
since 2005. The cost-effectiveness of TQT studies was assessed for the US and European
populations of antipsychotic users, as antipsychotics are a drug class in which QT-
prolongation is a common adverse event. The incremental cost-effectiveness of the TQT-
studies regulation, as compared to a scenario of no TQT-studies regulation, was about
€187,000 per quality-adjusted life year gained and about €2.4 million per sudden cardiac death
prevented.
In chapter 7, the cost-effectiveness of Periodic Safety Update Reports (PSURs) for biologicals
during 1995-2009 was assessed. During this time period, PSURs identified a total of 24 urgent
safety issues, of which two (swelling complications after dibotermin-alfa and systemic spread
of botulinum toxin with therapeutic use) were primarily identified through PSURs. The
incremental cost-effectiveness of PSUR-reporting for biologicals, as compared to no PSUR
reporting, was about €343,000 per QALY gained. Extensive sensitivity analyses indicated that
only two parameters could have resulted in much more favorable results: a high risk of severe
complications after systemic spread of botulimun toxin, and a risk reduction of 100% after
both urgent safety issues were identified.
Chapter 8 was dedicated to a general discussion of the work reported in this thesis. Both
chapter 2 and chapter 3 indicate a high societal valuation of safety-related regulatory
measures, which might explain the high incremental cost-effectiveness ratios (ICERs) we
found in chapter 6 and chapter 7. Nonetheless, it is argued in chapter 8 that the potential
opportunity costs of regulating small drug safety risks are often overlooked, yet, these
opportunity costs could be substantial and result in higher drug prices. Developments during
178
the last two decades have resulted in a regulatory and societal focus on drug safety, with
little regard for the potential adverse effects of this safety focus. Even though several
methodological challenges exist in regulatory cost-effectiveness analysis, this thesis
demonstrated the feasibility of this approach in the evaluation of the drug regulatory
framework. Regulatory cost-effectiveness analysis therefore could play an important role in
assessing regulatory measures, in order to determine a more efficient, and therefore more
sustainable, drug regulatory framework. Furthermore, regulatory cost-effectiveness analysis
is able to determine whether regulatory measures are risk proportionate, not only with
regard to the risk magnitude, but also with regard to the resources required to reduce drug
safety risks.

Samenvatting

180
Ch
apte
r 6
De Europese farmaceutische markt is sterk gereguleerd. Voordat een geneesmiddel op de
markt mag worden gebracht, moet eerst worden aangetoond dat de kwaliteit, veiligheid en
werkzaamheid van voldoende niveau zijn. Medicijnregulering heeft twee doelen: ten eerste,
het beschermen van de volksgezondheid door ervoor te zorgen dat medicijnen van lage
kwaliteit, onveilige medicijnen of niet-werkzame medicijnen niet op de markt worden
gebracht. Ten tweede heeft medicijnregulering tot doel de volksgezondheid te bevorderen
door ervoor te zorgen dat noodzakelijke medicijnen patiënten bereiken zonder onnodige
vertraging. Op het moment is er echter weinig bewijs dat het huidige systeem van
medicijnregulering ook daadwerkelijk deze doelen bereikt op een kosteneffectieve manier.
Het doel van dit proefschrift was daarom om vast te stellen wat de kosteneffectiviteit is van
verschillende onderdelen van het systeem van medicijnregulering, om te kijken of de doelen
van medicijnregulering ook daadwerkelijk worden bereikt. Bovendien worden in dit
proefschrift verscheidene andere methoden aangewend om zowel de monetaire waardering
van veiligheid-gerelateerde medicijnregulering, als de afwegingen zoals die in de baten-risico
afweging van medicijnen gemaakt worden, te onderzoeken.
In hoofdstuk twee stellen we vast dat de maatschappelijke waardering van veiligheid-
gerelateerde medicijnregulering (gemeten in monetaire termen) hoog is. In deze studie werd
zowel het algemene publiek als patiënten met chronische nieraandoeningen gevraagd naar
hun betalingsbereidheid om het risico op Pure Red Cell Aplasia (PRCA) in gebruikers van
epoetin te verminderen. Het algemene publiek was bereid om een gemiddelde toename van
€24,40 van hun jaarlijkse zorgverzekeringspremie (die rond de €1.100 lag ten tijde van de
studie) te accepteren. Hoewel twee verschillende PRCA risico’s gebruikt werden in deze
studie (50% van de respondenten werd verteld dat het PRCA risico 4.5 per 10.000 patiënten
was, terwijl de andere 50% werd verteld dat het risico 45 per 10.000 patiënten was), vonden
we geen significant effect van de risicogrootte. Risicoperceptie, echter, was wel significant
van invloed op de betalingsbereidheid van respondenten. Deze bevinding illustreert dat de
betalingsbereidheid voor veiligheid-gerelateerde medicijnregulering in grotere mate bepaald
wordt door de risicoperceptie dan door het daadwerkelijke risico. Hoewel er verschillende
beperkingen, inherent aan de gebruikte methode in deze studie, bestaan, geloven we dat
deze resultaten laten zien dat de maatschappelijke waardering voor veiligheid-gerelateerde
regulering, gemeten in monetaire termen, hoog is.
In hoofdstuk drie van dit proefschrift zijn de voorkeuren met betrekking tot de risico-baten
afweging van geneesmiddelen zoals deze door reguleerders wordt gemaakt, gemeten.
Hierbij werd gebruikt gemaakt van een discrete choice experiment (DCE). De voorkeuren van
vier verschillende groepen zijn bestudeerd: reguleerders, academici, een farmaceut, en
ziekenhuisapothekers. We vonden dat zowel reguleerders als academici voorkeuren hebben
voor geneesmiddelen die tot doel hebben om ziektes met een hoge ziektelast te behandelen,

Samenvatting
181
voor geneesmiddelen die niet-ernstige en in frequente bijwerkingen hebben, en voor
geneesmiddelen die geen therapeutische alternatieven hebben. Een substantieel gedeelte
van zowel de groep van reguleerders als ook de groep academici was niet bereid om een
hoog risico op ernstige bijwerkingen uit te ruilen tegen een hoge gezondheidswinst. Deze
bevinding illustreert mogelijkerwijs dat in risico-baten analyse gezondheidswinst en
gezondheidsverliezen niet identiek worden gewaardeerd, maar dat gezondheidsverlies
zwaarder weegt dan gezondheidswinst, wat in lijn is met economische theorie. Deze
resultaten benadrukken de noodzakelijkheid van een expliciet en transparant raamwerk voor
regulatoire risico-batenanalyse.
In hoofdstuk vier worden de belangrijkste argumenten voor de toepassing van
kosteneffectiviteitsanalyse voor het evalueren van medicijnregulering, beknopt uiteengezet.
In hoofdstuk vijf wordt de toepassing van Health Technology Assessment (HTA) bij de
evaluatie van een medische interventie gedemonstreerd. Vier behandelstrategieën voor
patiënten met een beroerte werden geëvalueerd: conservatieve behandeling, intraveneuze
trombolyse, intra-arteriële trombolyse, en intraveneuze trombolyse gevolgd door intra-
arteriële trombolyse. In deze exploratieve studie vonden we dat de kosteneffectiviteit van
intraveneuze trombolyse gevolgd door intra-arteriële trombolyse afhangt van (i) bij hoeveel
procent van de patiënten recanalizatie wordt bereikt, (ii) de behandelkosten, en (iii) het
aantal patiënten met complicaties.
Hoofdstuk zes en hoofdstuk zeven wordt de haalbaarheid van het toepassen van HTA bij de
economische evaluatie van medicijnregulering gedemonstreerd. In hoofdstuk zes werd de
kosteneffectiviteit van thorough QT/QTc studies gedemonstreerd. Deze klinische trials
hebben tot doel te onderzoeken of een geneesmiddel het QT interval (van het hart), een
risicofactor voor het optreden van plotselinge hartdood, verlengt. Deze studies zijn sinds
2005 een verplicht onderdeel van het ontwikkelingsprogramma voor nieuwe
geneesmiddelen. Uit hoofdstuk zes blijkt dat de incrementele kosteneffectiviteit van deze
studies ongeveer €187.000 per voor kwaliteit gecorrigeerd levensjaar is en ongeveer €2.4
miljoen per voorkomen plotselinge hartdood.
In hoofdstuk zeven is de kosteneffectiviteit van Periodieke Veiligheid Update Rapporten voor
biotechnologie geneesmiddelen gedurende 1995-2009 onderzocht. Tijdens deze periode
resulteerden de periodieke veiligheidsrapporten in de detectie van twee uit een totaal van 24
verschillende urgente veiligheidsproblemen voor biotechnologie geneesmiddelen. De
incrementele kosteneffectiviteit van periodieke veiligheidsrapporten voor deze groep
geneesmiddelen was ongeveer €343.000 per voor kwaliteit gecorrigeerd levensjaar.
Sensitiviteitsanalyses wezen uit dat slechts twee parameters een grote invloed hadden op de
uitkomsten: het risico op zeer ernstige complicaties bij het therapeutisch gebruikt van

182
Ch
apte
r 6
botuline toxine en de risicoreductie die volgt nadat een ernstig veiligheidsprobleem is
ontdekt.
Hoofdstuk acht bestaat uit een algemene discussie van het werk dat in dit proefschrift
gerapporteerd wordt. Zowel hoofdstuk twee als hoofdstuk drie laten een hoge
maatschappelijke waardering zien voor veiligheid-gerelateerde medicijnregulering. Deze
bevinding verklaart mogelijk de hoge incrementele kosteneffectiviteitsratio’s die we vonden
in hoofdstuk zes en hoofdstuk zeven. Desalniettemin wordt in hoofdstuk acht
beargumenteerd dat de potentiele opportuniteitskosten die het gevolg kunnen zijn van het
reguleren van (zeer) kleine veiligheidsrisico’s, vaak niet worden meegenomen, terwijl deze
opportuniteitskosten zowel substantieel kunnen zijn en ook kunnen resulteren in hogere
medicijnkosten. Het bepalen van de kosteneffectiviteit van medicijnregulering zou daarom
een belangrijke rol kunnen spelen in het ontwerpen van een meer efficiënt en dus een
duurzamer raamwerk van medicijnregulering. Bovendien is deze methode in staat om te
bepalen of medicijnregulering proportioneel is gezien het veiligheidsrisico en gezien de
kosten die verbonden zijn aan het reduceren van deze veiligheidsrisico’s.

Acknowledgments
Dankwoord

184
Ch
apte
r 6
Er zijn een aantal personen die, direct of indirect, een bijdrage hebben geleverd aan het
succesvol afronden van dit proefschrift en die ik hier graag voor wil bedanken.
Allereerst wil ik alle iMTA collega’s bedanken omdat zonder jullie de afgelopen jaren een stuk
saaier geweest zouden zijn. Lieve Saskia, beste kamergenoot ooit, sorry van alle keren dat ik
je van het werk heb gehouden door je mee te delen wat ik nu weer vond van een artikel dat ik
tegenkwam, het nieuws, het weer, of allerlei andere ontzettend belangrijke zaken. Dear Jen,
thank you for being an amazing friend! I am very happy you will be next to me during the
defense of this thesis. Het iMTA management wil ik bedanken voor de mogelijkheid om in
Rotterdam mijn onderzoek te doen. Graag bedank ik ook mijn collega’s in Utrecht die mijn
(enigszins spaarzame) tripjes naar Utrecht altijd bijzonder plezierig maakten. Verder heeft
Just Weemers tijdens zijn stage bij het iMTA in 2009 een belangrijk deel van het werk aan de
WTP paper gedaan, waarvoor veel dank. Beste Hans, mede Escher-aio en co-auteur van de
PSUR paper, dank voor de prettige en no-nonsense samenwerking die in relatief korte tijd tot
een mooie paper heeft geleid. Zonder jouw expertise en eerdere studies hadden we de paper
niet kunnen schrijven. Prof. Dr. Diederik Dippel, beste Diederik, hartelijk dank voor je
uitstekende begeleiding (in eerste instantie als mijn scriptiebegeleider) en je geduld bij het
schrijven van de stroke paper. Ook wil ik je graag bedanken voor de enige keer in mijn leven
dat ik ooit, 20 minuten lang, in een witte jas door een ziekenhuis heb rondgelopen, tijdens de
periode dat ik mijn masterscriptie schreef bij Neurologie en de MR CLEAN trial net van start
was gegaan. Dr. Rashmi Shah has been instrumental in the successful publication of the QT
studies paper. Dear Rashmi, thank you so much for your enthusiasm when I emailed you with
some questions on QT prolongation and your willingness to become involved in our study.
Your expertise on the topic has been invaluable. Dr. Christine Gispen-de Wied, dank voor de
hulp bij de dataverzameling binnen het CBG.
De leden van de beoordelingscommissie, prof. dr. Frans Rutten, prof. dr. Bert Leufkens, prof.
dr. Flora Haaijer-Ruskamp, en prof. dr. Maarten Postma dank ik voor hun bereidheid dit
proefschrift te beoordelen.
Mijn onderzoek maakte deel uit van het Escher project, gefinancierd door het Top Instituut
Pharma. Bert Leufkens, projectleider van Escher, en Pieter Stolk, program manager, veel
dank voor jullie interesse en enthousiasme de afgelopen jaren voor mijn onderzoek.
Mijn promotor Huub Schellekens en mijn co-promotor Marc Koopmanschap ben ik de meeste
dank verschuldigd. Beste Huub, ik heb de samenwerking met Marc en met jou, die vanwege
jouw woonplaats voornamelijk in Rotterdam heeft plaatsgevonden, altijd als bijzonder
prettig ervaren. Jouw uitgebreide kennis van zowel de farmaceutische industrie als van het
regulatoire systeem was onmisbaar bij het bepalen van de richting en voor het slagen van dit
onderzoek. Beste Marc, ik had me de afgelopen vier jaar geen betere begeleider kunnen

Dankwoord
185
wensen. Jij hebt zonder twijfel de belangrijkste bijdrage aan zowel dit proefschrift als aan
mijn ontwikkeling geleverd, door me wegwijs te maken in het wetenschappelijk onderzoek,
altijd hoge eisen te stellen aan mijn werk, en me vanaf dag één kritisch te laten nadenken
over de zin (en onzin!) van onderzoek. Jullie hebben beiden een enthousiasme voor jullie
vakgebied en voor de wetenschap dat ik aanstekelijk en inspirerend vind. Dank voor jullie
vertrouwen in mij en jullie uitstekende begeleiding!
Tot slot ben ik mijn vrienden, mijn hele familie, en in het bijzonder Tine, oma An, en oma
Truus, buitengewoon dankbaar voor hun hulp en steun, niet alleen de afgelopen jaren maar
ook in het verleden. Willem, Frans, Berend, Annika, ik vind het fijn dat ik deel uitmaak van
zo’n ‘groot’ gezin – Frans, ik ben blij dat jij, ook een beetje namens Willem, Berend en Annika,
mijn paranimf bent. Josien en papa, dank voor jullie steun en geloof in mij, en de vrijheid die
ik altijd van jullie heb gekregen om mijn eigen keuzes te maken. Mama, jouw afwezigheid is
nog steeds een groot gemis – ik hoop dat je trots op me geweest zou zijn.

186
Ch
apte
r 6

Curriculum Vitae

Ch
apte
r 6

Curriculum Vitae
189
Jacoline Bouvy was born on March 27, 1985, in Rotterdam. She graduated from Christelijk
Gymnasium Sorghvliet, the Hague, in 2003. After a obtaining a Bachelor degree in Health,
Policy, and Management (2007) and a Master degree in Health Economics (2009), both from
Erasmus University Rotterdam, she worked as a PhD student at the Utrecht Institute for
Pharmaceutical Sciences, department of Pharmaceutics, Utrecht University, and at the
institute for Medical Technology Assessment (iMTA), Erasmus University Rotterdam from
2008 until 2012, under the supervision of prof. dr. H. Schellekens (Utrecht) and dr. M.A.
Koopmanschap (Rotterdam). Jacoline currently holds a postdoctoral position at iMTA,
institute for Health Policy and Management, Erasmus University.