the evaluation of meat yield and quality in · pdf filethe evaluation of meat yield and...
TRANSCRIPT

Report Prepared for the Alberta Elk Assocation
The Evaluation of Meat Yield and Quality in Elk
Wayne Robertson, Allan Schaefer, Stan Landry, Don Brereton
Agriculture & Agri-Food Canada, Lacombe Research Centre, 6000 C & E Trail, Lacombe, Alberta, T4L 1W1
November, 2000 _____________________________________________________________

2
Introduction
The current research project was undertaken to evaluate velvet-antler removal methods,
velvet-antler assessment methods and venison yield and quality. An earlier report (Cook
et al., 2000) presented results of the assessment of management procedures in the
harvesting of velvet antler. This report presents new information on carcass and meat
quality of elk of different ages, evaluation of a method for improving tenderness and
means of estimating carcass value.
In the beef industry, it is recognized there is a direct relationship between animal age and
tenderness, and in general, increased age is associated with decreased tenderness. With
increasing animal age, there is an increase in the amount of cross-linking both within and
between molecules of collagen (connective tissue), and the collagen becomes less
susceptible to enzymes and is less soluble on heating (Lawrie, 1979). North American
beef grading systems take into account the relationship between animal age and
tenderness, and graders assess maturity based on the degree of ossification of various
parts of the skeleton. The Canadian beef grading system recognizes two maturity classes
and only those carcasses from the youthful maturity class qualify for the high quality
grades. Because of differences between early and late-maturing breeds, it is difficult to
give an exact age for the breakpoint between youthful and mature carcasses, but some
carcasses from 36 month old animals would not qualify for the Canada A grade series.
The USDA beef grading regulations specify 5 maturity levels, and only carcasses from
the two most youthful levels qualify for the top grades. Approximate ages corresponding
to Maturity Class A is 9 to 30 months and to Maturity Class B is 30 to 42 months (Tatum,
1997). There have been no reported research results examining the relationship between
animal age and tenderness in elk, and therefore it was of interest to seize the opportunity
provided by this study to examine the meat quality of 2, 3 and 4 year old elk. It was also
an opportunity to determine the effect of animal age on yield of valuable cuts and total
meat yield of elk carcasses, and to begin to develop a data base of information pertaining
to composition of elk carcasses.

3
Previous research at the Lacombe Research Centre on the meat quality of elk and
whitetail deer had identified a concern with respect to lack of consistency of meat quality,
specifically tenderness. High voltage electrical stimulation (470 V) of beef carcasses has
been shown to be very effective in reducing shear values (Aalhus et al., 1992). New
Zealand researchers reported improvements in tenderness of venison using low voltage
stimulation (Drew et al., 1988; Chrystall and Devine, 1983). However, results from the
Lacombe studies of whitetail deer failed to demonstrate any benefits of high voltage
electrical stimulation of the carcass on shear values (unpublished data). Among the
perceived mechanisms of electrical stimulation in improving tenderness is the earlier
onset of rigor mortis and the subsequent prevention of cold shortening or cold-induced
toughening which may occur when pre-rigor muscle is chilled too rapidly. Earlier studies
of venison quality of whitetail deer, then, also examined the effect of reducing the rate of
chilling on tenderness. High temperature conditioning (10oC for the first 24 or 48 h post-
mortem) was found to be very effective in attenuating shear values of deer venison
compared to conventionally chilled carcasses (1oC), particularly in the rib eye muscle.
However, carcass weight losses during chilling due to drip and evaporation were
prohibitively high in the conditioned sides. In the current study, it was decided to
investigate the effects of a moderate high temperature conditioning regime (6 to 7oC) on
tenderness of elk rib steaks.
Materials and Methods A total of 26 males (2, 3 and 4 year olds) were used in this study. All animals were
obtained from Canadian Rocky Mountain Ranch, and were transported to the Lacombe
Research Centre abattoir the morning of the day of slaughter. The two slaughter dates
were August 22, 2000 and August 29, 2000. Need something about pre-slaughter
Nutricharge trtmt.
A final live weight was obtained immediately prior to slaughter of the animals. Live
weights were not obtained on three animals which were uncooperative and were
dispatched in the holding area ahead of the live animal scale. Carcass side weights were

4
recorded following dressing of the carcass. Alternating between left and right sides,
carcass sides were assigned to conventional chilling (CC) or a moderate high temperature
conditioning (HTC) treatment. Average temperature of the coolers was 1.7oC and 6.2oC
for the CC and HTC sides, respectively. All sides were pasteurized in a hot water (85oC)
pasteurizer for 8 seconds prior to chilling.
Muscle pH and temperature was measured at 50 min post-mortem in the loin eye
(longissimus lumborum, LL) at the 1st lumbar vertebra. The pH and temperature
measurements were made by insertion of a spear type electrode and stainless steel
thermocouple through the overlaying silverskin. Temperature loggers were used to track
temperature decline at the center of the LL and the deep hip in two CC sides and two
HTC sides.
Following chilling the carcass sides were knife-ribbed between the 12th and 13th ribs.
Muscle color was measured on the exposed face of the rib eye muscle (longissimus
thoracis, LT) at the 12th rib after a 20 min bloom period using a Minolta CR300
reflectance meter. CIE L*, a* and b* values were recorded. Hue and chroma (saturation)
were calculated using the a* and b* values. Three fat thickness measurements were
made of the subcutaneous fat over the rib eye at the ¼, ½ and ¾ positions, and averaged.
The minimum thickness of fat in the 4th quadrant (distal to the chine bone) was also
recorded. The rib eye area was measured using a transparent grid ruled in 1 cm squares
and a GR measurement was made (total tissue depth 7 cm from the end of the rib eye).
Finally, muscle pH and temperature measurements were made by insertion of the
electrode and thermocouple in the exposed face of the LT.
Carcass sides were re-weighed to determine loss due to evaporation and drip during
cooling. The CC sides were cut out to determine yield of cuts and total meat yield. A 13
to 15 cm portion of the LT anterior to the 12th rib was collected from both CC and HTC
sides. A 20 mm thick chop was cut from the 12th rib end, weighed, placed on an
absorbent pad in a retail display tray and over-wrapped with oxygen-permeable film. The
steak was held for 48h at 4oC, blotted dry and re-weighed to determine drip loss. The

5
steaks used for determination of drip loss were then vacuum packaged and held at –1oC
for an additional time to provide a total of 7 d aging, then frozen for subsequent use in
determining the effect of end point cooking temperature on shear value (tenderness). The
remaining portion of the sample collected was also vacuum packaged, held at –1oC to
provide a 7 d aging period, and frozen for subsequent evaluation to determine the effect
of pre-slaughter nutritional therapy and HTC on shear value.
Shear values.
The chops from the drip loss procedure were used to determine the effect of end point
cooking temperature on shear values in order to establish the best temperature for
cooking the main body of samples for the experiment. The drip loss chops were assigned
to one of three end point temperatures with both CC and HTC sides assigned to the same
treatment. As much as possible samples were assigned so as to account for pre-slaughter
treatment and animal age. The chops were thawed for 48 h at 1oC, and then grilled on a
Garland grill (Model ED30B, Condon Barr Food Equipment Ltd., Edmonton, AB).
Temperature at the center of the chops was monitored using spear tip thermocouples
connected to a data logger. The chops were cooked on one side to 35oC, turned and
cooked to three different end points: 63, 67 and 71oC. An ice/water bath was used to
arrest the cooking process, and then the chops were held overnight at 4oC. Three cores of
19 mm diameter were removed from each chop parallel to the muscle fibers. Degree of
doneness was noted as the cores were removed. The cores were sheared at right angles to
the muscle fibers in a Warner-Bratzler shear cell attached to an Instron Materials Testing
System. Cross head speed was 200 mm/min. The peak shear force required to shear
through the cores was recorded.
The LT portions retained for the purpose of determining the effect of pre-slaughter
nutritional therapy and HTC on tenderness were also thawed for 48 h at 1oC. Two chops
of 25 mm thickness were fabricated from the 11th rib end, cooked to 67oC and sheared as
6
described above. Three cores were removed from each chop, providing 6 cores in total
for shear value determination.
Results and Discussion
Animal age
The effects of animal age on carcass characteristics are presented in Table 1. As one
would expect, live weight increased with age of the animal. Average weight of the 3 year
olds was approximately 25 kg heavier than 2 year olds, while there was a larger weight
difference between 4 and 3 year old animals of 47 kg. Hot carcass yield expressed as a
percentage of final live weight prior to slaughter also increased with age, and the 4 year
old elk in this trial had significantly higher hot carcass yields compared to the 2 year old
animals (P<0.05). Rib eye area, measured at the 12th rib, and the thickness of tissue at the
GR site increased along with carcass weight. There was also a tendency for older animals
to have higher levels of finish (subcutaneous fat), although the differences were not
statistically significant.
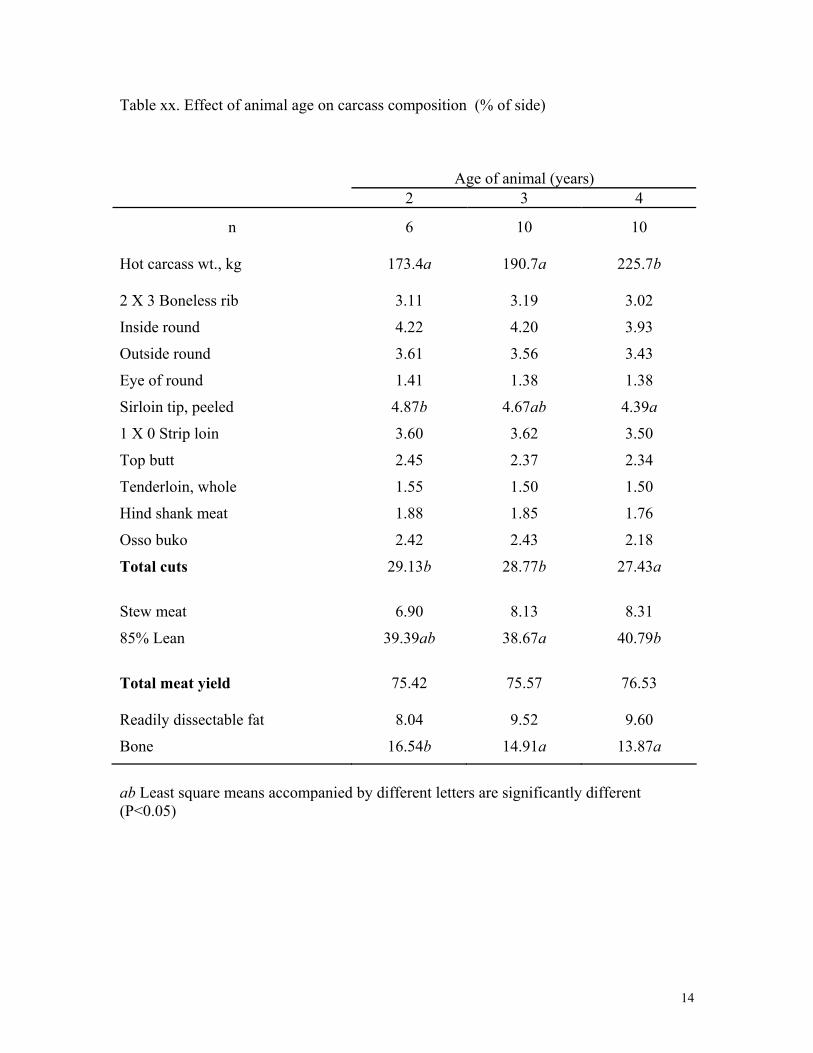
Results of the cut out are presented in Table 2. Total cuts refers to the combined weight
of specific cuts and specialty items (e.g. osso buko). Total meat yield includes all cuts,
stew meat and 85% lean trim. Carcasses from the 4 year old animals had a lower yield of
total cuts than carcasses from either 2 or 3 year old animals (P<0.05) but higher yields of
stew meat and 85% trim so that total meat yield was not significantly affected by animal
age. There was a higher proportion of bone in the carcasses of 2 year olds compared to
either 3 or 4 year old elk, and a lower proportion of readily dissectable fat although this
latter difference was not statistically significant. Differences in the yield of individual
cuts or specialty items between the age groups were not of a magnitude to be statistically
significant with the exception of the peeled sirloin tip which represented a smaller
proportion of the carcass in 4 year olds than in 2 year olds (P<0.05).

7
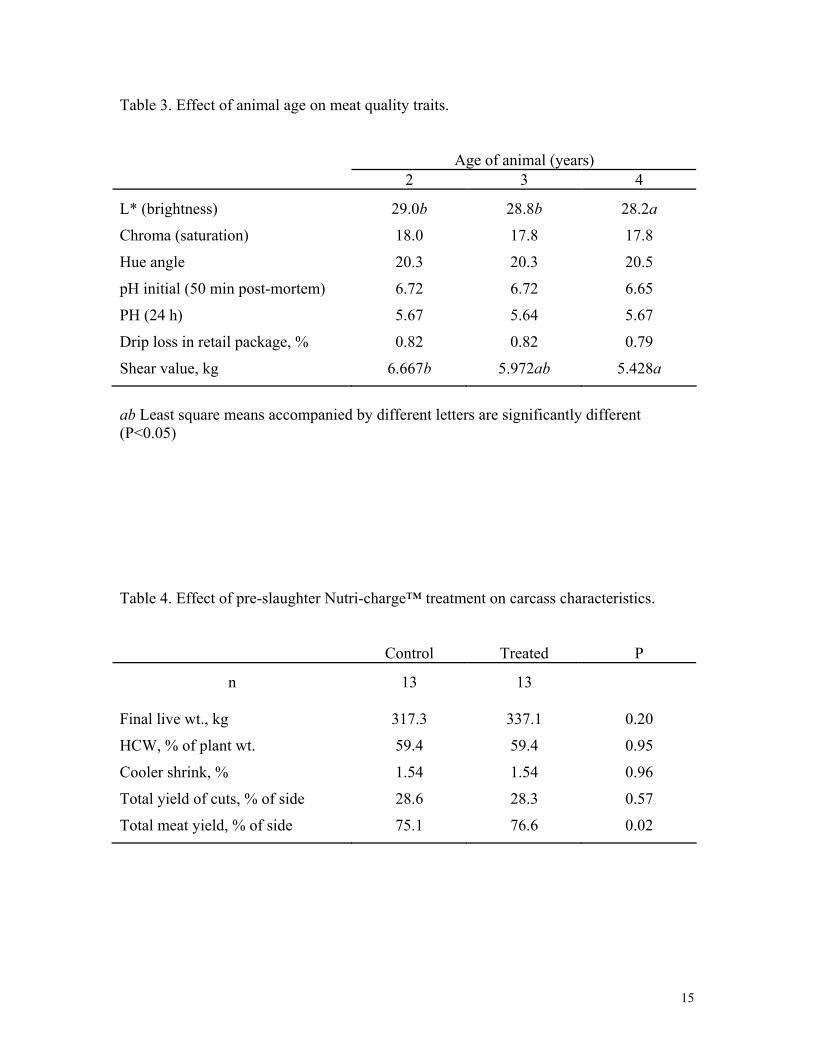
Animal age had no effect on rate or extent of pH decline in the LL muscle (Table 3).
Nonetheless, the 4 year old animals produced meat which was slightly darker (lower L*
values) than either 2 or 3 year olds (P<0.05). Darker muscle color in carcasses from older
animals is not unique to elk, and is seen in beef carcasses as well. The difference
observed in this trial of less than one full unit would have minimal, if any, impact on
acceptability of the product. Futhermore, the average 24 h pH values are not indicative of
“dark cutting”, and there were no incidences of LT muscle pH greater than 6.0 in this
trial, which is generally regarded as the critical ultimate pH for dark cutting in beef
carcasses. It is of interest to note the decline in shear value indicating that meat from 4
year old animals was more tender than the same cut from 2 year old animals (P<0.05),
with 3 year olds intermediate between the other two in tenderness. The variation of shear
value within the six cores from each animal was also significantly less in 4 year olds
compared to either 2 or 3 year olds (standard deviation of 1.655, 1.551 and 0.999 in 2, 3
and 4 year olds, respectively).
Pre-slaughter Nutri-charge™ treatment
There were very few differences in carcass characteristics (Table 4) or meat quality
(Table 5) which could be attributed to pre-slaughter treatment of the animals. Control and
treated animals had identical hot carcass yields expressed as a percentage of final live
weight recorded immediately prior to slaughter, and identical carcass weight losses
during cooling. While total percentage yield of cuts and specialty items were not
different, the total yield of meat including stew meat and 85% lean trim was 1.5% greater
in carcasses from treated animals compared to that of control animals (P<0.05).
Nutri-charge™ treatment had no effect on muscle color of the LT at 24 h post-mortem,
and drip loss of rib eye steaks were similarly unaffected. While initial muscle pH was
similar between carcasses from control and treated animals, pH measured at 24 h post-
mortem was slightly higher in carcasses from treated animals (P=0.011). There were no

8
statistically significant differences in shear values of grilled rib eye steaks obtained from
carcasses of control or treated animals.
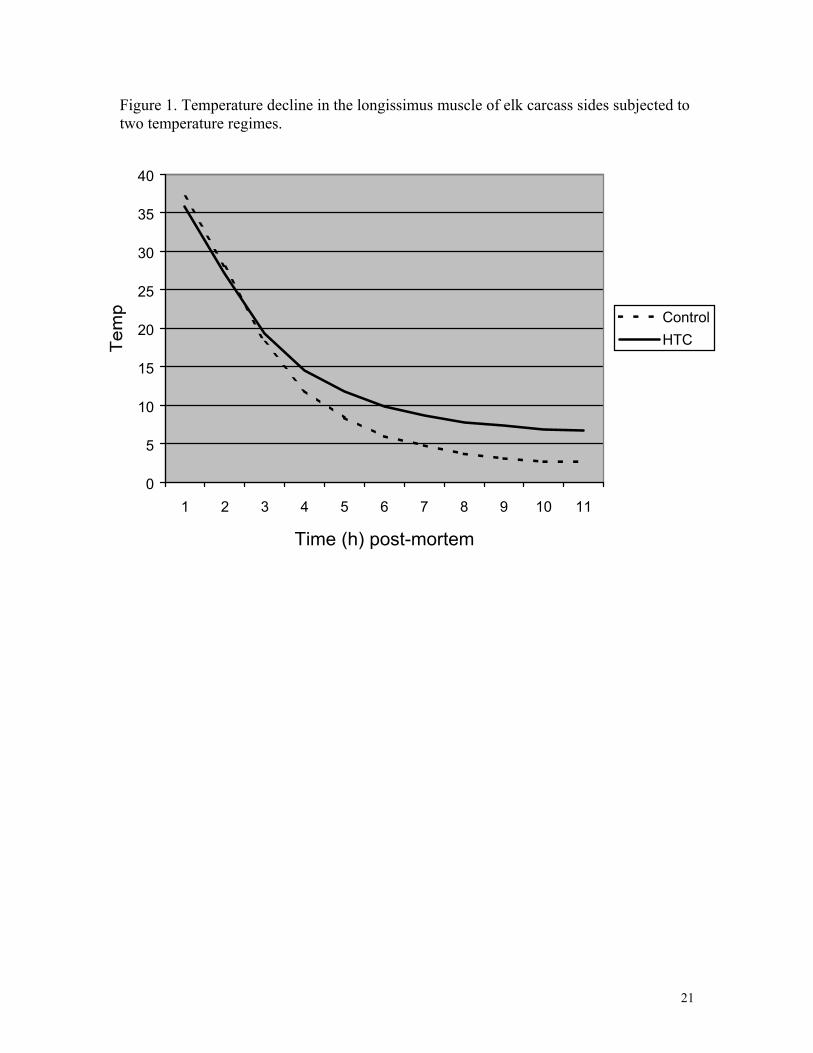
High temperature conditioning
While the difference in mean temperature between the conventional cooler and the HTC
cooling regime was only 4.5oC, it was sufficient to reduce the rate of cooling in the LL
muscle during the first ten hours post-mortem (Figure 1). Additionally, from
approximately 6 h post-mortem through to 24 h post-mortem, a temperature differential
of 4 to 4.5oC was maintained at the center of the muscle between control and HTC sides.
The effects of cooler temperature on carcass shrink and meat quality of the rib eye
muscle are presented in Table 6. Unlike experiments in which whitetail deer carcasses
were held at 10oC for periods of 24 or 48 h, the HTC sides of the more heavily muscled
elk carcasses held at 6oC for 24 h did not suffer any greater cooler weight losses during
chilling than their conventionally chilled counterparts. The LT muscles of the HTC sides
were brighter (P=0.0001), had a more highly saturated color (P=0.014), and lower 24 h
pH (P=0.004) compared to the contra-lateral control sides. Drip losses were not affected
by chilling treatment.
It is generally accepted that consumers who have no training in assessing sensory
attributes of meat would be unlikely to detect differences in tenderness of meat samples
differing in shear value by less than one unit (1 kg) (L.E. Jeremiah, personal
communication). A rather moderate high temperature conditioning regime employed in
this study reduced the average shear value of grilled elk steaks by 0.9 kg (P=0.009).
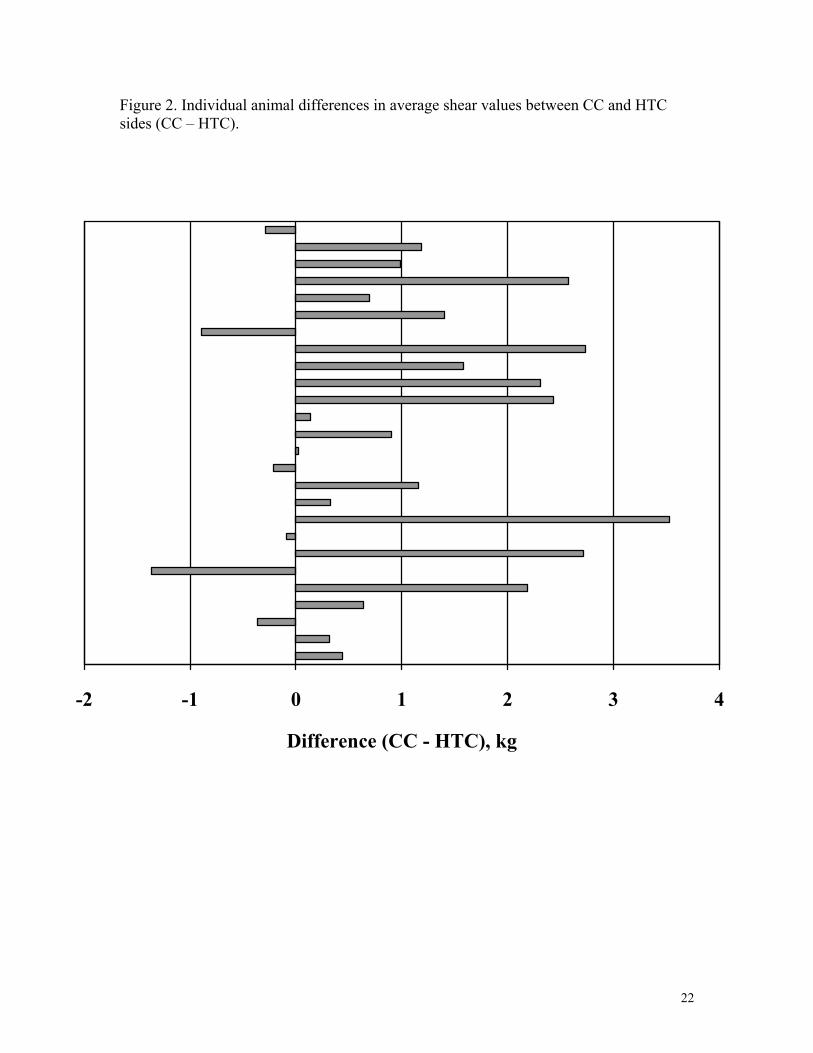
Average or mean values can be misleading, particularly where the number of samples is
small such as is the case in this study, where two or three high values can skew the results
in favor of one factor over the other. Therefore it is important to consider how the
differences in average shear values arose. Figure 2 presents the individual animal
differences between CC and HTC sides. In eleven of 26 cases (42%) the average shear
value of the CC side was more than 1 kg higher than the HTC side, while in only 1 of 26

9
cases (4%) did the average shear value of the HTC side exceed that of the CC side by
more than 1 kg. Furthermore, seven of 26 (27%) CC sides had average shear values
which were more than 2 kg higher than their contra-lateral HTC sides. The HTC
treatment also reduced the within animal variation (standard deviation) in shear value
from 1.760 in control samples compared to 1.043 in HTC samples (P=0.005). In
summary, then, the trial provided evidence of the efficacy of even a moderate high
temperature conditioning treatment for optimizing tenderness. Shear values in general,
for this experiment, were much lower than previous results obtained at Lacombe. This
may be due, in part, to improved pre-slaughter handling and lairage, degree of aging of
the muscle samples, different cooking methods, and the lower end point temperature used
for cooking in the current study. A significant portion of the difference in shear values is
likely due to handling of samples prior to cooking. In previous studies, the muscle
samples were cooked from the fresh state, while in the current study the samples were
frozen and slow thawed. Drew et al. (1988) found venison samples which had been
frozen and thawed were often considerably more tender than non-frozen ones, with
improvements in tenderness ranging from 10 to 40%, depending on species and muscle.
Cooking end point temperature
Various research reports describe cooking venison for tenderness evaluations by
immersion in a hot water bath for a specified period of time (Drew et al., 1987, Chrystall
et al., 1983), rather than cooking to a specified end point temperature. Prior to cooking
the main body of samples in this experiment, the drip steaks were used to establish the
end point temperature which would provide consistently lower and less variable shear
values. The results of this part of the study should be evaluated in the context that it was
done solely to establish the most suitable end point temperature for the rest of the trial,
and was not a properly designed experiment although care was taken to distribute
samples from different ages and treatments as evenly as possible among the three
temperatures chosen. Nonetheless it is of interest to note (Table 7) that average shear
values of steaks cooked to 67oC were approximately 1 kg lower than the average shear
10
values of steaks cooked to either 63oC or 71oC. In addition, the within steak variation
(standard deviation) of the samples cooked to the intermediate end point temperature was
27% lower than the variation found for steaks cooked to the lower or higher temperature.
Therefore the end point temperature selected for the experiment was 67oC. The steaks
cooked to 63oC were visually assessed as being blue rare to rare, those cooked to 67oC as
being rare to medium rare, and those cooked to 71oC as being medium to medium well.
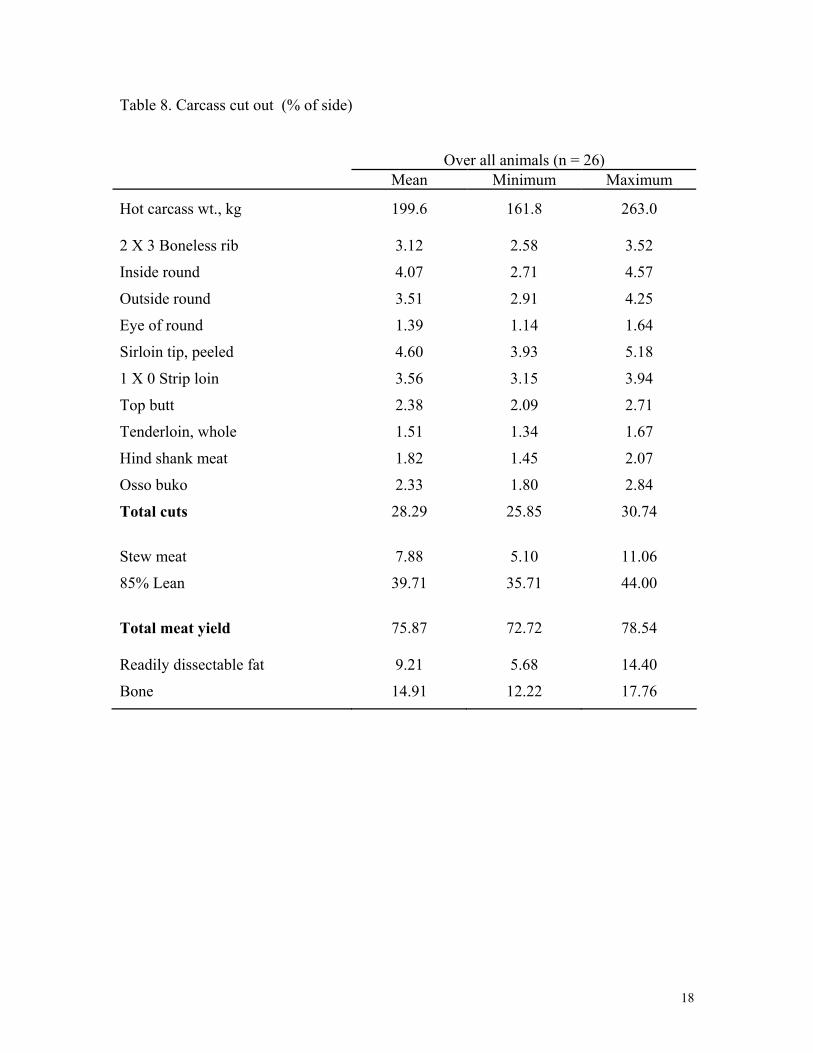
Potential for yield grading
Table 8 presents the cut out data for all 26 animals, showing the variation obtained in
yield of individual cuts, total cuts and total meat yield for carcasses from animals ranging
in age from 2 to 4 years. While these carcasses had relatively low levels of dissectable fat
compared to typical beef carcasses (Jones et al., 1987), there was still a range of 5 to 6%
in yield of total cuts and total meat yield suggesting a range in carcass value. Based on
the average hot carcass weight of 200 kg, the 5% range in total cuts would represent an
additional 10 kg of valuable cuts and specialty items, which is of significant economic
value. Consequently, and particularly if carcasses with a wider range of conformation and
fatness are presented for slaughter, it may be important to begin to lay the foundation for
a yield grading system. Simple carcass measurements were made using a ruler and
transparent grid, and various regression models developed to predict percentage yield of
total cuts (Table 9) and total meat yield (Table 10). Accuracy of the regression models is
expressed in the coefficient of determination (R2 value). A higher R2 value indicates that
the model explains a greater proportion on the variation in the variable being predicted, in
this case yield percentage. Precision is typically expressed as the standard deviation of
the difference between the predicted value and the actual value established by cut out. In
this study, models combining a single fat thickness measurement, the GR measurement
and hot carcass weight were able to explain approximately 70% of the variation in yield
of total cuts and/or total meat yield. The standard deviation of the difference in predicted
and actual yield was 0.74% and 0.84% for total cuts and total meat yield, respectively. A
slight improvement in prediction accuracy and precision was achieved by adding rib eye

11
area to the model for prediction of cut yield but not for prediction of total meat yield.
These values can be compared to similar types of equations used to predict lean yield in
beef carcasses which typically have R2 values in the order of 0.50 to 0.58, and residual
standard deviations of approximately 3% (Jones et al., 1989). Much greater accuracy and
precision can be achieved using image analysis, such as has been accomplished using the
Lacombe Computer Vision System for prediction of salable yield in beef carcasses, but
this type of technology will be economically prohibitive for the grading of small numbers
of elk carcasses, in the near term.
It should be stressed that the number of carcasses which were cut out in this trial is
grossly insufficient to establish robust regression equations for prediction of yield. It
should also be recognized that the preferred method for evaluating models is to establish
the model on one set of carcasses and test it against another set of carcasses. However,
the results do indicate that simple carcass measurements may be used successfully to
predict yield, and hence carcass value.
References
Aalhus, J.L., Jones, S.D.M., Tong, A.K.W., Jeremiah, L.E., Robertson, W.M. and
Gibson, L.L. 1992. The combined effects of time on feed, electrical stimulation and aging
on beef quality. Can. J. Anim. Sci. 72: 525-535.
Chrystall, B.B. and Devine, C.E. 1983. Electrical stimulation of deer carcasses. New
Zealand Journal of Agricultural Research, Vol. 26, 89-92.
Cook, N., Schaefer, A., Robertson, W., Church, T., Church, J. and Ritten, R. 2000. The
evaluation of meat yield and quality and the attenuation of transport, handling and
velveting stress in elk. Interim report prepared for the Alberta Elk Association, October,
2000.
12
Drew, K.R., Crosbie, S.F., Forss, D.A., Manley, T.R. and Pearse, A.J. 1988. Electrical
stimulation and ageing of carcasses from red, fallow and New Zealand elk-type male
deer. J. Sci. Food Agric. 43: 245-259.
Jones, S.D.M., Tong, A.K.W. and Robertson, W.M. 1987. The effects of carcass grade
and sex on the lean content of beef carcasses. Can. J. Anim. Sci. 67: 205-208.
Jones, S.D.M., Tong, A.K.W. and Robertson, W.M. 1989. The prediction of beef carcass
lean content by an electronic probe, a visual scoring system and carcass measurements.
Can. J. Anim. Sci. 69: 641-648.
Lawrie, R.A. 1979. Meat Science, Third Edition. Pergamon Press, Oxford, England. Pp.
328 – 330.
Tatum, D. 1997. Beef Facts: Beef Grading. National Beef Cattlemen’s Association.
Chicago, Ill 60611, 4 pp.

13
Table 1. Effect of animal age on carcass characteristics.
Age of animal (years) 2 3 4
n 6 10 10 Final live wt., kg 295.3a 319.6a 366.8b
Hot carcass wt., kg 173.4a 190.7a 225.7b
HCW, % of final live wt. 58.7a 59.3ab 60.2b
Cooler shrink, % 1.63 1.53 1.46
Rib eye area1, sq. cm. 58.5a 61.8ab 66.5b
Average fat1, mm 0.8 1.5 2.3
Minimum fat in 4th quadrant1, mm 1.1 2.0 2.8
GR measurement2, mm 32.5 38.7 41.6
ab Least square means accompanied by different letters are significantly different (P<0.05) 1 Measurements made at the 12th rib. 2 GR measurement is total thickness of tissue at 7 cm from the tip of the rib eye muscle.
14
Table xx. Effect of animal age on carcass composition (% of side)
Age of animal (years) 2 3 4
n 6 10 10 Hot carcass wt., kg 173.4a 190.7a 225.7b 2 X 3 Boneless rib 3.11 3.19 3.02
Inside round 4.22 4.20 3.93
Outside round 3.61 3.56 3.43
Eye of round 1.41 1.38 1.38
Sirloin tip, peeled 4.87b 4.67ab 4.39a
1 X 0 Strip loin 3.60 3.62 3.50
Top butt 2.45 2.37 2.34
Tenderloin, whole 1.55 1.50 1.50
Hind shank meat 1.88 1.85 1.76
Osso buko 2.42 2.43 2.18
Total cuts 29.13b 28.77b 27.43a
Stew meat 6.90 8.13 8.31
85% Lean 39.39ab 38.67a 40.79b
Total meat yield 75.42 75.57 76.53 Readily dissectable fat 8.04 9.52 9.60
Bone 16.54b 14.91a 13.87a
ab Least square means accompanied by different letters are significantly different (P<0.05)
15
Table 3. Effect of animal age on meat quality traits. Age of animal (years) 2 3 4
L* (brightness) 29.0b 28.8b 28.2a
Chroma (saturation) 18.0 17.8 17.8
Hue angle 20.3 20.3 20.5
pH initial (50 min post-mortem) 6.72 6.72 6.65
PH (24 h) 5.67 5.64 5.67
Drip loss in retail package, % 0.82 0.82 0.79
Shear value, kg 6.667b 5.972ab 5.428a
ab Least square means accompanied by different letters are significantly different (P<0.05) Table 4. Effect of pre-slaughter Nutri-charge™ treatment on carcass characteristics. Control Treated P
n 13 13 Final live wt., kg 317.3 337.1 0.20
HCW, % of plant wt. 59.4 59.4 0.95
Cooler shrink, % 1.54 1.54 0.96
Total yield of cuts, % of side 28.6 28.3 0.57
Total meat yield, % of side 75.1 76.6 0.02

16
Table 5. Effect of pre-slaughter Nutri-charge™ treatment on meat quality. Control Treated P
L* (brightness) 28.8 28.6 0.41
Chroma (saturation) 17.9 17.8 0.87
Hue angle 20.3 20.4 0.91
pH initial 6.72 6.69 0.38
pH (24 h) 5.64 5.68 0.011
Drip loss in retail package, % 0.83 0.80 0.39
Shear value, kg 5.751 6.293 0.11
Table 6. Effect of cooler temperature on carcass shrink and meat quality. Average cooler temperature 1.7oC 6.2oC P
Cooler shrink, % 1.49 1.59 0.31
L* (brightness) 28.1 29.2 0.0001
Chroma (saturation) 17.4 18.3 0.014
Hue angle 20.3 20.5 0.21
pH (24 h)1 5.69 5.64 0.004
Drip loss in retail package, % 0.83 0.79 0.34
Shear value, kg 6.476 5.569 0.009
1 Initial pH measured at 50 min post-mortem was 6.70 for both control (1.7oC) and high temperature conditioned (6.2oC) sides.

17
Table 7. Effect of end point temperature on shear value. End point temperature (oC) Average shear value, kg 63 67 71
n 18 16 18
Mean 6.890b 5.997a 6.986b
Standard deviation 1.450 1.060 1.484
ab Least square means accompanied by different letters are significantly different (P<0.05)
18
Table 8. Carcass cut out (% of side) Over all animals (n = 26) Mean Minimum Maximum
Hot carcass wt., kg 199.6 161.8 263.0 2 X 3 Boneless rib 3.12 2.58 3.52
Inside round 4.07 2.71 4.57
Outside round 3.51 2.91 4.25
Eye of round 1.39 1.14 1.64
Sirloin tip, peeled 4.60 3.93 5.18
1 X 0 Strip loin 3.56 3.15 3.94
Top butt 2.38 2.09 2.71
Tenderloin, whole 1.51 1.34 1.67
Hind shank meat 1.82 1.45 2.07
Osso buko 2.33 1.80 2.84
Total cuts 28.29 25.85 30.74
Stew meat 7.88 5.10 11.06
85% Lean 39.71 35.71 44.00
Total meat yield 75.87 72.72 78.54 Readily dissectable fat 9.21 5.68 14.40
Bone 14.91 12.22 17.76

19
Table 9. Utility of various carcass measurements for prediction of yield of total cuts expressed as a percentage of side weight.
Measurements included in the model R2 + HCW
GR measurement 0.53 0.68
Minimum fat in 4th quadrant 0.43 0.66
Average fat 0.51 0.66
Rib eye area (REA) 0.24 0.54
Minimum fat + GR (Equation 1) 0.54 0.69
Average fat + GR 0.59 0.69
Minimum fat + REA 0.46 0.68
Average fat + REA 0.52 0.67
Minimum fat + GR + REA (Equation 2) 0.55 0.71
Average fat + GR + REA 0.59 0.72
Hot carcass weight (HCW) 0.54
Equation 1 Estimated yield (%) of cuts = 34.603 – 0.121(minimum fat, mm) - 0.047(GR, mm) - 0.021(HCW, kg) Standard deviation of difference (predicted – actual) = 0.74% Equation 2 Estimated yield (%) of cuts = 33.052 - 0.144(minimum fat, mm) - 0.051(GR, mm) + 0.048(REA, cm2) –
0.028(HCW, kg) Standard deviation of difference (predicted – actual) = 0.71%

20
Table 10. Utility of various carcass measurements for prediction of total meat yield expressed as a percentage of side weight.
Measurements included in the model R2 + HCW
GR measurement 0.23 0.66
Minimum fat in 4th quadrant 0.24 0.56
Average fat 0.16 0.56
Rib eye area (REA) 0.005 0.098
Minimum fat + GR (Equation 1) 0.26 0.70
Average fat + GR 0.23 0.73
Minimum fat + REA 0.37 0.56
Average fat + REA 0.30 0.56
Minimum fat + GR + REA (Equation 2) 0.44 0.70
Average fat + GR + REA 0.42 0.73
Hot carcass weight (HCW) 0.069
Equation 1 Estimated total meat yield (%) = 72.349 – 0.260(minimum fat, mm) - 0.116(GR, mm) - 0.043(HCW, kg) Standard deviation of difference (predicted – actual) = 0.84% Equation 2 Estimated total meat yield (%) = 71.876 - 0.267(minimum fat, mm) - 0.117(GR, mm) + 0.015(REA, cm2) –
0.041(HCW, kg) Standard deviation of difference (predicted – actual) = 0.84%
21
Figure 1. Temperature decline in the longissimus muscle of elk carcass sides subjected to two temperature regimes.
0
5
10
15
20
25
30
35
40
1 2 3 4 5 6 7 8 9 10 11
Time (h) post-mortem
ControlHTC
22
Figure 2. Individual animal differences in average shear values between CC and HTC sides (CC – HTC).
-2 -1 0 1 2 3 4
Difference (CC - HTC), kg