the evaluation of the u.s. small business …. small business administration’s regional cluster...
TRANSCRIPT
The Evaluation of the
U.S. Small Business Administration’s
Regional Cluster Initiative
Year One Report
June 2012

This page is intentionally left blank for two-sided printing.
ii
The Evaluation of the
U.S. Small Business Administration’s Regional
Cluster Initiative
Year One Report
Berna Demiralp, Ph.D.
Mark Turner, Ph.D.
Alexandre Monnard, M.P.P.
Prepared for: U.S. Small Business Administration 409 3rd St, SW Washington, DC 20416
Prepared by: Optimal Solutions Group, LLC 5825 University Research Court, Suite 2800 College Park, MD 20740
June 2012
Contract No. SBAHQ-10-C-0051 The statements, findings, conclusions, and recommendations found in this study are those of the contractor and do not necessarily reflect the views of the Office of Entrepreneurial Development, the United States Small Business Administration, or the United States Government.
iii

Acknowledgments
We are grateful to Scott Henry and Meredith Olafson of the Small Business Administration for
their valuable feedback and comments on various phases and aspects of this project. We also
thank our Contracting Officer’s Technical Representative, Dionna Martin, for her assistance and
guidance. Additionally, our sincere thanks are given to the administration teams of the clusters in
SBA’s Regional Cluster Initiative who provided valuable insight about the implementation of the
SBA’s Initiative.
Finally, we appreciate the contribution of our colleagues at Optimal Solutions Group who
assisted in various stages of the project. We thank Soham Banerji, Kimberly Hahn, Claudia
Gonzalez-Martinez, Christabel Dadzie, Ernst Nilsson, and Tracye Turner for their valuable input.
iv
Table of Contents .............................................................................................List of Acronyms and Abbreviations ix
................................................................................................................................List of Figures . x
...............................................................................................................................List of Tables xiii
........................................................................................................................Executive Summary 1
................................................................................................................................1. Introduction . 6
......................................................................................1.1. Overview of the Evaluation 6
.......................................................................................................1.2. Report Roadmap 7
..................................................................................................................2. Overview of Clusters 8
.....................................................................................................2.1. What is a Cluster? 8
.................................................................................2.2. Common Features of Clusters 10
................................................................2.2.1. Composition of cluster participants . 10
...............................................................................2.2.2. Defined geographic scope 12
.........................................................2.2.3. Defined specialization or industry scope 14
......................................................2.2.4. Cluster linkages and competitive dynamic 15
................................................................................2.2.5. The need for critical mass 15
........................................................................................2.2.6. The cluster life cycle 16
........................................................................................2.3. The Cluster Environment 17
..........................................................................................2.4. Innovation and Clusters 19
...........................................................................2.5. The Policy Rationale for Clusters 22
..................................................................................3. Features of Clusters in SBA’s Initiative 27
............................................3.1. Geographic Scope of the Clusters in SBA’s Initiative 27
...............................................3.2. Industrial Scope of the Clusters in SBA’s Initiative 31
................................................................3.3. Structure of Clusters in SBA’s Initiative 32
................................................3.4. Maturity Stages of the Clusters in SBA’s Initiative 38
v

....................3.5. Different Business Models Used by the Clusters in SBA’s Initiative 41
.....................................................................................................................4. Evaluation Design 46
.................................................................................................................4.1. Overview 46
.....................................................................................................4.2. Survey Response 47
................................................................4.3. Analysis Using Secondary Data Sources 49
.......................................................................................4.4. Regional Impact Analysis 50
.....................................................................5. Implementing SBA’s Regional Cluster Initiative 51
...............................................................................................5.1. Cluster Stakeholders 51
..........................................................5.2. Small Business Participation in the Clusters 53
................................................................5.3. Reasons for Participation in the Cluster .. 57
...............................................................................5.4. Cluster Services and Activities 62
.........................................................................................................5.4.1. Overview 62
.........................................................................................5.4.2. Providers of service 65
....................5.4.3. Cluster provision of services and cluster management activities 67
..........................................................................5.4.4. Highlights of cluster services 68
..........5.5. Measures of Cluster Services and Activities Provided to Small Businesses 75
.....................................5.5.1. Cluster services and activities by type and frequency 75
...........................5.5.2. Frequency of participation in cluster services and activities 83
..........................5.5.3. Participants’ satisfaction with cluster services and activities 85
..............................................5.5.4. Quality of services provided: quality indicators 88
.............................................................................6. Outcomes of the Regional Cluster Initiative 96
.................................................................................................................6.1. Overview 96
.........................................................................6.2. Short-term/Intermediate Outcomes 97
................................6.2.1. Alliances and collaborations among cluster participants 98
................................................................6.2.2. Small businesses’ access to capital 101
vi
......................................6.2.3. Small businesses’ contract and subcontract awards 105
...6.2.4. Development of new products and commercialization of new technology 107
................................6.2.5. Assistance with small businesses’ marketing strategies 110
................................................................6.2.6. Assistance with increasing exports 111
....6.2.7. Assistance regarding intellectual property issues and patent applications 112
.......................................................6.2.8. Other short-term/intermediate outcomes 113
............................................6.2.9. Summary of short-term/intermediate outcomes 115
............................................................................................6.3. Long-term Outcomes 117
.............................................6.3.1. The number of employees of small businesses 117
.........................................................................6.3.2. Revenue of small businesses 129
...................................................................6.3.3. Total payroll of small businesses 135
.............................................6.3.4. Creation of new businesses within the clusters 141
.....................................................................................6.4. Regional Impact Analysis 142
..................................................................................7. Lessons Learned in Cluster Operations 149
....7.1. Lessons learned regarding service selection and delivery to small businesses 149
................................7.2. Lessons learned regarding cluster promotion in the region .. 151
......7.3. Lessons learned regarding the outreach and recruitment of small businesses 151
...............................7.4. Lessons learned regarding small business funding and sales 153
...................................................7.5. Lessons learned regarding cluster development 155
..........................................7.6. Lessons learned regarding teaming and collaboration 156
..............................................................................................................................8. Conclusion 158
...................................................................................................................................References 161
.......................9. Appendix A. San Diego Advanced Defense Technology Cluster Case Study 163
..............................................................A.1. San Diego Defense Cluster Structure 166
...............................................A.2. Small Business Identification and Recruitment 170
vii
...........................................................................A.3. Cluster Activities and Events 172
.......A.4. San Diego Defense Cluster’s Outcomes during SBA’s Cluster Initiative 174
......................................................................10. Appendix B. FlexMatters Cluster Case Study 177
...............................B.1. From Liquid Crystal Technology to Flexible Electronics 177
........B.2. Emergence of the FlexMatters – Northeast Ohio Technology Coalition 179
.....................................................B.3. Cluster Focus and Participant Composition 184
............................................................................B.4. Small Business Recruitment 189
...........................................................................B.5. Cluster Activities and Events 190
................................B.6. FlexMatters’ Outcomes during SBA’s Cluster Initiative . 195
............................................................................11. Appendix C. Additional Analysis Results 197
...................................................................................................12. Appendix D. Methodology 201
................................................................................D.1. Description of Data Sources 201
.........................................................................................................D.1.1. Surveys 201
.....................................................................................................D.1.2. Interviews 203
......................................................D.1.3. Cluster Proposals and Quarterly Reports 204
....................................................D.2. Secondary Data Sources Used in the Analysis 205
....................................................................................D.3. Regional Impact Analysis 208
................................................................................D.4. Quality Indicator Guidelines 214
viii
List of Acronyms and Abbreviations
ADT: Advanced Defense Technology
BEA: Bureau of Economic Analysis
BLS: Bureau of Labor Statistics
C4ISR: Command, Control, Communications, Computers, Intelligence, Surveillance, and
Reconnaissance
Carolinas’ Nuclear: Carolinas’ Nuclear Cluster
D&B: Dun and Bradstreet
Defense Alliance: Defense Alliance
Energy Storage: Northeast Electrochemical Energy Storage Cluster
FlexMatters: FlexMatters Northeast Ohio Technology Coalition
IFCs: Institutions for Collaboration
Geospatial Cluster: Enterprise for Innovative Geospatial Solutions
Green Aviation: Upper Michigan Green Aviation Coalition
Huntsville Defense: Huntsville Advanced Defense Technology Cluster
MSA: Metropolitan Statistical Area
NAICS: North American Industry Classification System
OEM: Original Equipment Manufacturer
Project 17: Project 17 Agricultural Technology Cluster
R&D: Research and Development
RIC: Regional Innovation Clusters
RIMS II: Regional Input-Output Modeling System
S&T: Science and Technology
San Diego Defense: San Diego Advanced Defense Technology Cluster
SBDC: Small Business Development Center
SBIR/STTR: Small Business Innovation Research/Small Business Technology Transfer
Research
Smart Grid: Illinois Smart Grid Regional Innovation Cluster
SMEs: Small and Medium Enterprises
SPAWAR: Space and Naval Warfare Systems Command
WBC: Women's Business Center
ix

List of Figures Figure 1. Visual representation of the structure of a generic cluster, highlighting the major actors
.........................................................................................................................................involved 11
.............................Figure 2. Visual representation of the five stages in the life cycle of clusters 16
Figure 3. The cluster and its environment, including underlying regional features and the ....................................................................................................................business environment 18
.........Figure 4. Illustration of the self-reinforcing cycle of innovation occurring within clusters 21
Figure 5. Map of the United States, identifying the location of each of the 10 clusters in SBA’s ............................................................................................................................Cluster Initiative 28
..........................Figure 6. Number of large companies participating in SBA’s Cluster Initiative 52
...............................................Figure 7. Reasons for small business participation in the clusters 58
..........................................Figure 8. Reasons for large organization participation in the clusters 60
Figure 9. Percentage of total small business participation in one-on-one counseling sessions by ................................................................................................................................area of focus .. 76
Figure 10. Percentage of total small business participation in training sessions by area of focus 79
...............................................Figure 11. Small business attendance frequency at cluster events 84
...................Figure 12. Small business participation frequency at cluster services and activities 84
................................Figure 13. Large organization frequency of participation in cluster events . 85
................Figure 14. Small businesses’ level of satisfaction with cluster services and activities 86
Figure 15. Percentage of small business responses to the question on whether they could have .............................................................received the same services elsewhere outside the cluster 87
Figure 16. Total quality indicators scores, assigned by the evaluation team and through self-......................................................assessment, of each cluster in the Regional Cluster Initiative 93
.........................................................Figure 17. The outcomes of the Regional Cluster Initiative 97
Figure 18. Reported number of alliances formed as a result of cluster participation during the .........................................................................................................first year of SBA’s Initiative 99
............................Figure 19. Average number of alliances formed by cluster small businesses 100
.....................Figure 20. Number of large organizations that reported having formed alliances 101
Figure 21. Number of small businesses reporting having made use of capital, including retained .......................................................................................................................................earnings 102
Figure 22. Number of small businesses reporting access to external financing (i.e., excluding ......................................................................................................retained earnings) per cluster 104
Figure 23. Reported influence of small business cluster participation on access to capital among ...................................................................................businesses that obtained external funding 105
......................Figure 24. Awarded a contract or subcontract as a result of cluster participation 106
x

...................Figure 25. Developed new products or services as a result of cluster participation 108
........................Figure 26. Commercialized new technology as a result of cluster participation 109
................................Figure 27. Revised marketing strategy as a result of cluster participation . 110
................Figure 28. Increased exports during the first year as a result of cluster participation 111
...........................................Figure 29. Applied for patent(s) as a result of cluster participation 112
........Figure 30. Acquired access to cleared secure facilities as a result of cluster participation 113
..................Figure 31. Participated in industry supply chain as a result of cluster participation 114
Figure 32. Baseline distribution of full-time employment in clusters’ small businesses as of ...................................................................................................................September 30, 2010. 118
Figure 33. Baseline distribution of full-time employment in clusters’ small businesses as of ....................................September 30, 2010, among businesses with fewer than 10 employees 119
.....................................................Figure 34. Increased staff as a result of cluster participation 126
Figure 35. Average number of full- and part-time employees retained by small businesses .........................................................................................................participating in the clusters 127
Figure 36. Reported influence of small business cluster participation on hires and employees ........................................................................retained during the first year of SBA’s Initiative 128
Figure 37. Large organization agreement level that cluster participation facilitated the hiring of ............................................................new employees during the first year of SBA’s Initiative 129
Figure 38. Baseline distribution of annual revenue of small businesses for the year ending in .........................................................................................................................September 2010. 130
Figure 39. Baseline distribution of annual revenue for the year ending in September 2010 among ...........................................................small businesses with annual revenue below $2 million. 131
Figure 40. Reported influence of small business cluster participation on revenue during the first ..............................................................................................................year of SBA’s Initiative 134
.....................................................Figure 41. Increased sales as a result of cluster participation 135
.......................................Figure 42. Increased profit margin as a result of cluster participation 135
...Figure 43. Baseline distribution of monthly payroll of small businesses in September 2010. 136
Figure 44. Baseline distribution of monthly payroll in September 2010 in small businesses with ...........................................................................................monthly payroll less than $100,000. 137
Figure 45. Reported influence of small business cluster participation on payroll during the first ..............................................................................................................year of SBA’s Initiative 140
Figure 46. Number of new businesses that were established after their first cluster participation..................................................................................................................................................... 141
............................Figure 47. Reported influence of cluster participation on starting a business 142
..................................................Figure A-1. Map of San Diego County and surrounding areas 165
xi
Figure A-2. Cluster organizational chart, including the key San Diego Defense Cluster ............................................................................................................stakeholders and partners 170
Figure B-1. Geographic scope of the FlexMatters cluster, comprised of 21 counties in Northeast .............................................................................................................................................Ohio 180
Figure B-2. Benchmarking of FlexMatters’ core competencies against those of four principal ................................................................................................................................competitors .. 182
.....................................Figure B-3. Results of the SWOT analysis for the FlexMatters cluster 182
Figure B-4. FlexMatters’ selected product segments (outer ring) and target markets (inner circle)...................................................................................................................................................... 185
Figure C-1. Made strides towards developing new products or services as a result of cluster ................................................................................................................................participation 197
Figure C-2. Made strides towards commercialization of new technology as a result of cluster ................................................................................................................................participation 197
......................Figure C-3. Made strides in increasing exports based on assistance from cluster 198
........Figure C-4. Made strides towards applying for patents as a result of cluster participation 198
Figure C-5. Made strides towards obtaining a contract or subcontract as a result of cluster ................................................................................................................................participation 199
Figure C-6. Made strides towards acquiring access to cleared secure facilities as a result of .....................................................................................................................cluster participation 199
Figure C-7. Made strides towards participating in the industry supply chain as a result of cluster ................................................................................................................................participation 200
xii
List of Tables Table 1. Geographic scope of clusters, by number of counties and states where participants are
...........................................................................................................................................located 30
................................Table 2. Summary of the industry scope and specific focus of each cluster 31
Table 3. Summary of the governance structure in place at each of the clusters in SBA’s Cluster ........................................................................................................................................Initiative 34
Table 4. Summary of the service provision structures in place within each of the clusters in ................................................................................................................SBA’s Cluster Initiative 37
Table 5. Cluster maturity, by year of establishment, focus of activities, and stage of life cycle.. 39
......Table 6. Summary of the business case selected by each cluster in SBA’s Cluster Initiative 42
.......................................................................................................Table 7. Survey response rate 48
.................Table 8. Number of various cluster stakeholders in October 2010 and October 2011 53
.........................Table 9. Number of small business participants in the SBA’s Cluster Initiative 54
Table 10. Number of small businesses with and without employees in the clusters in the SBA ............................................................................................................................Cluster Initiative 56
Table 11. The total number of small business participants in the cluster and the number of small ...................................................................businesses that were sent the Small Business Survey 57
...............................................Table 12. Reasons for small business participation in the clusters 59
.........................................Table 13. Reasons for large organization participation in the clusters 61
Table 14. Summary of the service provision structures in place within each of the clusters in ................................................................................................................SBA’s Cluster Initiative 66
Table 15. Percentage of SBA funding spent on providing services vs. cluster management ........................................................................................................................................activities 67
Table 16. Percentage of total small business participation in one-on-one counseling sessions by ...............................................................................................................area of focus and cluster 78
Table 17. Percentage of total small business participation in training sessions by area of focus .....................................................................................................................................and cluster 81
Table 18. Networking and showcase events: number of events and total small business ...................................................................................................................participation at events 82
Table 19. Percentage of small business responses to the question on whether they could have .............................................................received the same services elsewhere outside the cluster 87
Table 20. Quality indicator ratings, assessed by the evaluation team (in rows with a white background) and each cluster administrator (in rows with a shaded background) for each cluster
............................................................................................................in SBA’s Cluster Initiative 91
Table 21. Summary of the overall organizational capacity, assessed by the evaluation team and ...................................................................self-assessed for each of the seven quality indicators 94
xiii
Table 22: Value of external funding and contracts/subcontracts by small business participants during the first year of the SBA Regional Cluster Initiative, as reported by cluster administrators..................................................................................................................................................... 107
Table 23. Percentage of small businesses that indicated the attainment of short-term/intermediate .....................................................................outcomes as a result of participation in the cluster 116
................................Table 24. Average and median full-time employees of small businesses .. 120
Table 25. Average and median part-time employees of small businesses participating in the ........................................................................................................................................clusters 121
Table 26. Average employment (full-time and part-time) of small businesses participating in the ........................................................................................................................................clusters 122
Table 27. Comparison of percentage change in average change in employment (full-time + part-.................time) across three samples: a cluster sample, a QCEW sample, and a D&B sample 125
..........................................Table 28. Average and median annual revenue of small businesses 132
Table 29. Percentage change in revenue among small businesses participating in the 10 clusters ..........................................compared to the percentage change in revenue in the D&B sample 133
..............................Table 30. Monthly payroll of small businesses participating in the clusters 138
Table 31. Percentage change in payroll among the small businesses participating in the clusters compared to the percentage change in payroll computed using the BEA State Personal Income
.....................................................................................................................................Accounts 139
Table 32. Estimated regional economic impact associated with the change in employment of clusters’ small businesses between September 2010 and September 2011 (total number of
................................................................................................................................employees) .. 145
Table 33. Estimated regional economic impact associated with the change in annual revenue of ................the 10 clusters’ small businesses between September 2010 and September 2011 ($) 146
Table 34. Estimated regional economic impact associated with the change in monthly payroll of ..........................clusters’ small businesses between September 2010 and September 2011 ($) 148
Table A-1. Key stakeholders and partners in the San Diego Defense Cluster, by stakeholder .......................................................................category (see Figure A-2), as of November 2011 167
........Table B-1. Organizations, their classifications, and roles within the FlexMatters Cluster 186
............................................................Table D-1. Data sources for the creation of benchmarks 206
Table D-2. Change in total economic impact of Project 17 small businesses under scenario 1, ....................................................................................using state- and county-level multipliers 212
Table D-3. Change in total economic impact of Project 17 small businesses under scenario 2, ....................................................................................using state- and county-level multipliers 212
Table D-4. Change in total economic impact of Project 17 small businesses under scenario 3, ....................................................................................using state- and county-level multipliers 212
Table D-5. Change in total economic impact of FlexMatters small businesses under scenario 1, ....................................................................................using state- and county-level multipliers 213
xiv
Table D-6. Change in total economic impact of FlexMatters small businesses under scenario 2, ....................................................................................using state- and county-level multipliers 213
Table D-7. Change in total economic impact of FlexMatters small businesses under scenario 3, ....................................................................................using state- and county-level multipliers 213
............................................................................Table D-8. Indicator 1 (cluster business case) 214
.............................................................................Table D-9. Indicator 2 (participant targeting) 214
..........Table D-10. Indicator 3 (participation of small businesses in cluster services/activities) 215
............................................Table D-11. Indicator 4 (focus and relevance to small businesses) 215
...Table D-12. Indicator 5 (performance indicators, data sources and collection methodology) 215
................................Table D-13. Indicator 6 (program monitoring and delegation oversight) .. 216
.............................................................................Table D-14. Indicator 7 (outcome measures) 216
xv
Executive Summary In September 2010, the U.S. Small Business Administration (SBA) launched the
Regional Cluster Initiative, a pilot program to promote and support ten clusters —
geographically concentrated groups of interconnected businesses, suppliers, academic
institutions, service providers, and associated organizations — across a wide variety of industries
and regions throughout the United States. The SBA’s Cluster Initiative provides funding to the
organizing entities of the ten clusters in order to increase opportunities for small business
participation within the clusters, promote innovation in the industries on which the ten clusters
are focused, and enhance regional economic development and growth. This report describes the
preliminary findings and outcomes from the first-year evaluation of the SBA’s Initiative.
The ten clusters in the SBA’s Initiative are involved in a range of industries, from
agriculture and transportation to energy and flexible electronics. They vary in age/length of time
established, stage of development (emerging, developing, mature), and governance structures.
Three of the clusters, termed Advanced Defense Technology clusters, are specifically focused on
meeting the needs of the defense industry, while the remaining seven clusters, termed Regional
Innovation Clusters, focus on innovative and leading technologies in a variety of industry areas.
One feature all of the clusters have in common is their focus on emerging and high technology.
All the clusters in the initiative rely on the region-specific strengths of the private sector, the
skilled labor associated with that sector, and the specializations of the regional and/or national
research community.
This report examines the ten clusters participating in the initiative in detail, including
their various stakeholder participants and the services and activities provided by the clusters,
with a focus on small business participants. The report also evaluates the initial outcomes
observed during the first year of the initiative, including the employment, revenue, and payroll of
the small businesses as well as their ability to spur innovation and obtain financing. Furthermore,
the report analyzes the regional economic impact of the economic activity of the clusters’ small
business participants. Finally, the report presents various “lessons learned” by the clusters during
1
the first year. Some of the key findings, outcomes, and learning opportunities are summarized
below. 1
During year one of the initiative, the ten clusters grew and developed their networks
across a wide spectrum of stakeholders, ranging from universities/research institutions and
foundation/nonprofit organizations to business associations and public sector agencies. The most
marked growth has been in small business participation. As detailed in the sections below, total
small business participation in the ten clusters grew by over 275% during year one. The ten
clusters, which in October 1, 2010 had a total of 179 small business participants, grew to include
672 small businesses as of October 1, 2011. To the extent that these partnerships are strong and
active, their growth is expected to lead to the strengthening of the clusters themselves.
The study also examines the compelling interests that drive stakeholder participation in
clusters. As reported through survey results, the primary reasons for small business participation
in the clusters were to network with other small businesses and to gain access to new markets.
Among the large organizations surveyed, which consisted of large businesses, universities,
research institutions, public sector agencies, foundations, and nonprofit organizations, the
predominant reason reported for joining the cluster was to help spur regional economic
development. The next most-cited reasons for participation were to find potential partners for
technology transfer and to gain access to new technologies with commercial potential.
Given their industry-specific focus and interconnected networks of specialized mentors,
experts, partners, suppliers, and customers, clusters are uniquely positioned to provide high-
value, targeted connections between small and large businesses, private industry and universities,
and suppliers and federal contractors. The services, activities, and events the clusters provided to
small business participants during year one focused on several key areas: (a) facilitating targeted
connections and networking among the small businesses themselves, between the small
businesses and large companies, and between small businesses and the government; (b)
1 This report focuses on the ten clusters participating in the SBA’s September 2010 Regional Cluster Initiative. To date, the SBA has also invested in two additional cluster initiatives. The first was a pilot collaboration program with several other federal agencies, also launched in September, 2010, that awarded funds to three clusters—a cluster in the greater Philadelphia area focused on energy-efficient buildings, a cluster in Florida focused on space shuttle shutdown transition, and a South West Ohio Water Cluster. More recently, in September 2011, the SBA participated in the Jobs and Innovation Accelerator Challenge, a collaborative funding opportunity coordinated with the Department of Commerce’s Economic Development Agency and the Department of Labor’s Employment and Training Administration, which provided funding to 20 clusters engaged in a variety of industries in the U.S.
2
providing targeted market and supply chain analysis; (c) increasing small business access to
funding opportunities through prospecting, providing technical assistance, and
matchmaking/networking activities; (d) creating key linkages between businesses and academic
institutions in the transfer of new technology or concepts into the marketplace; (e) increasing
export opportunities through counseling, workshops, and connections/referrals; and (f) providing
small businesses with showcasing and demonstration opportunities to highlight small business
innovation. Clusters saw the highest small business participation at one-on-one sessions focused
on finance, contracting opportunities, and intellectual property, and training sessions focused on
business development.
This study also found that a majority of the clusters leveraged one or more of the SBA’s
resource partners: Small Business Development Centers, Women’s Business Centers, and
SCORE. The clusters also utilized the expertise of third-party organizations such as university-
based technology centers to provide hands-on product design, prototyping, and manufacturing
assistance, as well as assistance with licensing new technologies, technology validating and
testing services, and fostering partnerships with federally funded labs and other organizations for
joint research and development. Over 85% of the small businesses surveyed reported that the
services and activities provided by the cluster were unique and could not be found elsewhere.
Clusters also spent a portion of their time during year one on cluster management and
strategic planning activities. In evaluating the percentage of time each cluster spent on providing
external services versus internal cluster management, this study suggests that there is a
correlation between the age of the cluster (the date the cluster was originally established) and the
percentage of the funding the cluster allocates to providing services. The three clusters that
devoted the greatest percentage of their SBA funding to providing services were also among the
oldest clusters in the initiative. By contrast, the three clusters that allocated a greater percentage
of funding to cluster management than to service provision, were also among three of the
youngest clusters in the SBA’s Initiative.
Several key outcomes were observed during year one. Among the preliminary outcomes,
there is evidence of new business formation within the clusters and job creation in small
businesses that participated in the clusters. Seven new businesses were started after cluster
participation during the first year of the initiative, three of them in the Monterey, California area
3

focused on the agricultural technology supply chain. The average full-time employment in the
small businesses that participated in the clusters increased by 7.6% during year one. Average
total employment, including both full-time and part-time employees, grew by 11.2%.
The small businesses that participated in the clusters also experienced growth during the
first year of the initiative. During year one, the average revenue of small business participants
increased by 13.7%. Nearly all the clusters involved in the initiative—9 out of 10—experienced
an increase in the average revenue of small business participants. The average payroll (total
compensation paid to employees) of small business participants also increased by 23.4%, with all
ten clusters experiencing an increase in the average payroll of small business participants. The
expectation is that this growth in jobs, revenue, and payroll—one of the longer-term outcomes of
the SBA’s Initiative—may increase over a longer horizon than just the first year.
Preliminary findings based on the small businesses’ self-reporting suggest that the
clusters have played a role in spurring innovation among small business participants.
Approximately 69% of the small businesses that indicated having sought or received cluster
services reported having developed new products or services as a result of their cluster
participation. In addition, 54% of the small businesses that indicated having sought or received
cluster services reported having commercialized new technology as a result of their cluster
participation. While only 22% of the small businesses that indicated having sought or received
cluster services reported having pending patent applications as a result of their participation in
the cluster, the expectation is that over time, as clusters strengthen and build networks, the
number of patents applied for and obtained may increase.
The clusters have also provided services during year one of the initiative to assist small
businesses to obtain contracts and subcontracts, private capital and loans, Small Business
Innovation Research/Small Business Technology Transfer (SBIR/STTR) awards, and other
grants. Cluster administrators exercised their judgment to provide the value of economic activity
related to two categories: first, activity that was tied in a direct way to the assistance the cluster
provided to the small business participants, and second, activity that was indirectly tied to the
cluster by virtue of the small business being an active participant in the cluster. They reported
that small business participants in the ten clusters obtained contracts or subcontracts totaling over
$217 million. As reported, small business participants also obtained nearly $48 million in
4

external funding through private funding sources (venture capital, angel capital); SBIR/STTR
awards, which as reported totaled over $6.5 million, were also an important revenue source for
some of the cluster participants. The value of the grants reported during year one was $1.7
million.
The initial findings and outcomes presented in this report indicate that the clusters have
increased opportunities for small business participation within the ten clusters and made strides
toward promoting innovation in their respective industries, and that the small businesses that
participated in the clusters impacted regional economic development and growth. These
preliminary findings will be further measured during the year-two evaluation of the SBA’s
Initiative. The following are possible additional areas of focus and outcomes of interest of the
year-two evaluation: 1) additional inputs such as the number of cluster outreach sessions, one-
on-one counseling sessions, and matchmaking efforts; 2) additional outcomes focused on
innovation such as the number of patents applied for and obtained and the number of new
technologies licensed; and 3) the possible relationship between the types and degree of cluster
engagement activities and services provided to small business participants and the levels of
economic activity networked by the clusters. The year-two evaluation will also aim to learn more
about the extent to which these regionally based clusters are developing and fostering networks
beyond their regions and accessing global markets, opportunities, and partnerships. Such
expanded networks have already been observed in several of the clusters, and further
development outside the region is anticipated to continue.
5
1. Introduction
1.1. Overview of the Evaluation The Regional Cluster Initiative of the Small Business Administration (SBA) is a pilot
program, launched in September 2010, to promote and support 10 clusters—geographically
concentrated groups of interconnected businesses, suppliers, service providers, and associated
institutions in a particular industry or field—across the United States. The Regional Cluster
Initiative provides funding to the organizing entities of the 10 clusters in order to accomplish the
following goals: (1) to increase opportunities for small business participation within the clusters,
(2) to promote innovation in the industries on which the 10 clusters are focused, and (3) to
enhance regional economic development and growth in the regions in which the 10 selected
clusters operate.
The Regional Cluster Initiative is made up of two programs, each focusing on a subset of
the 10 clusters in the overall initiative: Regional Innovation Clusters (RIC) and Advanced
Defense Technologies (ADT). Of the 10 clusters, seven RIC clusters focus on innovative and
leading technologies in a variety of industry areas. The three ADT clusters are focused on
industries that are of interest to the U.S. Department of Defense. In accordance with one of the
primary goals of the initiative, i.e., strengthening small business participation and growth within
regional clusters, the clusters in SBA’s Initiative were selected to receive funding partially on the
basis of their ability and potential to assist small businesses2 within a specific industry and
geographic scope.
Optimal Solutions Group, LLC (Optimal), the evaluator of the Regional Cluster
Initiative, was tasked with providing background information about clusters based on the
relevant literature, providing context and information about the 10 clusters, and assessing the
progress and outcomes of the Initiative at the end of its first year. This report describes the
framework, methodology, and findings from the first-year evaluation of the SBA’s Regional
Cluster Initiative.
2 Broadly defined here as businesses with fewer than 500 employees. For a more comprehensive definition from the SBA, see http://www.sba.gov/sites/default/files/files/Size_Standards_Table.pdf.
6

1.2. Report Roadmap This report is composed of eight sections. Section 2 provides an overview of clusters and
their features, grounded in the literature on clusters. Section 3 describes specific aspects of the 10
regional clusters for a better understanding of their operations, structures, and approaches.
Section 4 summarizes the major elements of the evaluation design used in assessing the
implementation and outcomes of the Regional Cluster Initiative. Section 5 focuses on the
implementation of the Regional Cluster Initiative and therefore covers the cluster stakeholders,
the participation of small businesses in the clusters, and the services and activities provided by
the clusters. Section 6 describes the outcomes of SBA’s Initiative, which are the measures of
effectiveness related to the implementation of the Initiative as described in Section 5. Section 7
presents lessons learned in cluster operations. Section 8 provides concluding remarks. Finally,
the Appendix contains stand-alone case studies on two of the clusters, a more detailed
description of the evaluation design methodology as summarized in Section 4, and additional
analysis results.
7
2. Overview of Clusters
2.1. What is a Cluster? Before exploring the specifics of the Regional Cluster Initiative, such as cluster profiles,
evaluation methodology, and findings, the term cluster needs to be defined in clear terms. The
concept of a cluster and its use as a tool for regional economic development have gained
tremendous popularity since the early 1990s, yet Vom Hofe and Chen (2006), two industrial
geographers studying clusters, suggest that “there probably has never been more chaos, diffusion
and misinterpretation among Economic Development practitioners and academicians alike on
proper cluster definitions.” This is echoed by Ingstrup, Freytag, and Damgaard (2009), who
summarize the present sitution well: “there is no universal cluster definition, and even though the
overall concept of clustering is very well described and explained, the underlying cluster
definitions and the principals behind are characterized as broad and fuzzy.” This “chaos” and the
conflicting interpretations can be partly attributed to the variety of contexts in which the concept
of cluster is employed since cluster theory sits at the intersection of geography, economics,
business studies, and sociology.
The English economist, Alfred Marshall (1842-1924), is generally credited as the first to
recognize that the economic productivity of businesses depends on their location and proximity
to one another (Ingstrup, Freytag, and Damgaard, 2009). This idea played an important role in
laying the foundation of cluster theory in the late 19th and early 20th centuries. In particular,
Marshall identified three critical factors in fostering spatial cluster formation: (a) knowledge
spillovers among firms, (b) labor market specialization, and (c) the sharing of industry-specific
inputs, which creates cost advantages.
Fifty years later, the economist Edgar M. Hoover expanded on Marshall’s work and
argued that the agglomeration of businesses of the same or different industries plays an important
role in the economic success of individual businesses (Cortright, 2006). Alfred Weber, another
important contributor to the foundations of cluster theory, explained in 1929 that a producer’s
location decision is driven by the goal of minimizing production and delivery costs. Many of
these ideas gained attention in the late 1980s as researchers sought to explain the patterns of
8

economic development observed in Italy in the 1960s and 1970s.3 At the time, the northeast and
central regions of Italy —traditionally less competitive and developed than the Northwest—were
undergoing strong economic growth as a result of a concentration of firms clustered in specific
localities according to industrial sectors of focus. The primary explanation for this economic
growth was that the clusters allowed their regions to establish a strong position in the world
markets for various products and led to improvements in production processes and product
quality.
In recent years, these early agglomeration economic theories have been refined and
expanded upon by various scholars, such as Paul Krugman in Geography and Trade (1992).
However, arguably the most influential champion of the industrial cluster theory of economic
development has been Michael Porter. In his seminal work, The Competitive Advantage of
Nations (1990), Porter defined clusters as “geographic concentrations of inter-connected
companies and institutions in a particular field.” He later expanded on this notion by stating that
“clusters encompass an array of linked industries and other entities important to competition”
and that they “also often extend downstream to channels and customers and laterally to
manufacturers of complementary products and to companies in industries related by skills,
technologies or common inputs,” (Porter M. E., 1998). In addition, Porter noted, “many clusters
...include governmental and other institutions that provide specialized training, education,
information, research, and technical support.”
To conceptualize the cluster, one can follow the multiple strands that are woven in
Porter’s definition, beginning with the notion that economic growth is local and involves the
creation of an ecosystem of businesses, universities, government agencies, and trade
associations, all systematically aligned along a specific focus. Furthermore, clusters are often
vertically integrated in the sense that they can regroup both suppliers of inputs for the industry of
focus and potential buyers of the outputs, facilitating the coordination and interactions among
these actors. Yet Porter acknowledges that clusters can often times be horizontally integrated in
the sense that a cluster can incorporate various businesses in complementary industries that also
rely on similar inputs, skills, and technologies as the core activity of the companies in the cluster.
3 The two seminal papers on this topic are Sforzi, F. (1990) “The Quantitative Importance of Marshallian Industrial Districts in the Italian Economy”, and Becattini, G. (1990) “The Marshallian Industrial District as a Socio-economic Notion”.
9
These two types of integration are often present, even in combination, but are not necessary to
the creation or sustainment of a cluster.
A noted strength of Porter’s cluster definition is that it rises above divergences of opinion
on the breadth and requisites of clusters to concentrate on the specific nature of the
interdependencies of the businesses involved in clusters and the merits of various agglomeration
economic theories. Another strength of Porter’s definition is that he promotes competitiveness
through clusters, an appealing concept to policymakers and politicians alike (Vom Hofe & Chen,
2006). The combination of these two factors likely played a significant role in popularizing
Porter’s definition and the industrial cluster theory of economic development.
2.2. Common Features of Clusters There are six distinctive features that tend to be found in clusters: a certain composition
of participants, a defined geographical scope, a defined industrial scope, a certain competitive
dynamic, a specific lifecycle, and the need for a critical mass. These features should not be
construed as required or identifying features for clusters. In fact, because clusters are inherently
idiosyncratic in nature, not all features discussed here may be present or even desirable for all
clusters. Below is a discussion of the six cluster features. The overview of these features guides
the discussion on the clusters involved in SBA’s Cluster Initiative, their characteristics, and
approaches to cluster development.
2.2.1. Composition of cluster participants
From Porter’s definition of clusters, it is clear that the private sector—small and large
companies that operate or are looking to expand into the core industry of the cluster—plays a
fundamental role in the formation and operation of a cluster. Yet Porter’s definition also
highlights the importance of various non-business entities within clusters. These cluster-
affiliated, non-business entities fall into four broadly defined categories, as illustrated in the
cluster structure diagram shown in Figure 1, where the overarching pale blue circle represents
the geographic scope of the cluster.
10

Figure 1. Visual representation of the structure of a generic cluster, highlighting the major actors involved
Source: Andersson et al, The Cluster Policies Whitebook (2004), IKED, 25.
The first category, the research community, generally includes universities, community
colleges, and other research institutions, such as government research facilities. Entities in this
category play a variety of roles within the cluster, from encouraging and assisting technology
transfer from research institutions to marketable products, to providing innovative solutions for
addressing particular needs in the cluster’s core industry or to providing services and guidance to
businesses involved in the cluster. Institutions for collaboration (IFCs) include actors such as
chambers of commerce, industry trade groups, professional associations, and university alumni
associations. These entities tend to specialize in providing forums through which participants can
interact and collaborate. This is the reason why, in Figure 1, the IFCs stand in the middle of the
cluster and have links to all other groups. It should be noted that IFCs can also play a role in
externally promoting cluster initiatives through their links with various other organizations that
have similar goals. The third category, government, consisting of local, regional, and national
agencies and entities, takes various forms. Often, local government is represented by economic
development corporations, whereas regional and national government tends to be present in
clusters through initiatives implemented by various economic, commerce, and labor development
agencies. Government initiatives that provide research and development (R&D) funding and
11

grants are another aspect of government (mostly regional and national) involvement within
clusters. Furthermore, government entities can also play the role of client or service provider for
some of the businesses involved. Lastly, financial institutions take on various roles to help the
private companies involved in a cluster. Financial institutions provide seed funding by creating
investment funds specialized in the cluster’s core industry, providing angel and venture capital as
well as loans—particularly for startups and small businesses—in order to support their growth
and sustainability.
All these actors play a common and often self-reinforcing role in creating and fostering a
more hospitable environment for the cluster, increasing its sustainability and likelihood of
success. However, it is important to note that although these four categories of entities are
commonly found in clusters, regardless of their core industry focus, none of them constitute a
required component of clusters. Furthermore, the entities within each category commonly exhibit
varying levels of involvement and participation in the cluster; some entities might choose to get
involved in certain aspects of a cluster initiative while foregoing participation in other aspects,
based on preferences, needs, and resources.
2.2.2. Defined geographic scope
The ideas of geographic concentration and agglomeration—and, by extension the need
for clusters to define their geographic scope—underpin the cluster concept. There are various
advantages to doing business associated with agglomeration. These advantages, many of which
were already identified by Marshall as previously noted, include the following:
· Lower overall transaction costs, particularly for knowledge transfer but also for
transportation of inputs and outputs
· Increased economies of scale4 and scope5 among a limited number of businesses
in a given area
· Regional advantage in developing a specialized labor force
· Improved effectiveness of sharing and obtaining market information (e.g. ongoing
shifts in technology and demand)
4 Economies of scale refer to situations where the average cost of producing goods or services declines as the volume of the goods or services produced rises. 5 Economies of scope refer to situations where the average costs of production declines when a range of products or services is produced together, instead of each product or service being produced on its own.
12

· Increased speed of innovation through an increasingly sophisticated demand,
driven by knowledge spillovers and interplay between competitive buyers and
sellers
Geographic agglomeration and concentration imply that companies are well positioned to
make important gains in productivity, efficiency, and innovativeness as a result of enhanced
access to knowledge, skills, and ideas. These ideas remain true today to a large extent, despite
ever faster and more effective means of communication and coordination, as well as
globalization. Capitalizing on a region’s specific natural resources, creating a specialized labor
force, and taking advantage of low transportation costs inherent to close proximity reduce the
costs of interactions, increase the quality and frequency of these interactions, and improve
coordination.
Although traditional barriers to interaction are greatly reduced in the era of the Internet
and globalization, creating social capital still appears to be most efficient at the local level, where
information can be diffused both formally and informally. Social capital, which refers to social
connections and collaborations between social networks and entities, can be viewed as an input
into the production process, such as physical and human capital. Whereas social capital can be
created remotely, face-to-face contact remains vital for creating trust and fostering the exchange
and accumulation of tacit information (Andersson, Serger, Sörvik, & Hansson, 2004). In fact,
social capital tends to be greatly beneficial in promoting any joint efforts. These exchanges are
further facilitated through the various forums and events often provided by certain categories of
cluster participants, such as IFCs and the research community. To the extent that social capital
plays an important role in the broadly defined production process, it provides an additional
motivation for the geographic clustering of companies.
It would be inaccurate, however, to assume that social capital—and by extension,
network effects and other spillover effects associated with shared values and sustained
interactions—are always assets. They can also lead to a certain resistance to change and an
exclusionary impulse. Nevertheless, institutions and cultural influences may help in creating a
gradually expanding pool of self-reinforcing favorable interactions, thus overcoming these
potential pitfalls. This was exemplified by the Italian industrial districts, where “commercial
inter-firm exchanges were found to grow out of membership of artisan and commercial
13

associations, labor associations and various community-based institutions” (Andersson, Serger,
Sörvik, & Hansson, 2004).
It is important to note a potential misconception that clusters should only focus on their
region because of the importance of geographic scope. Most sustainable and high-performing
clusters tend to be regionally located but also tend to have strong global linkages. These linkages
enable companies to access new technologies, to tap into new markets, and to anticipate
upcoming technological shifts (Bathelt, Malmberg, & Maskell, 2004). Linkages are therefore
important in fostering business development and innovation within clusters. In addition, clusters
can form inter-cluster networks, taking advantage of each cluster’s unique specializations and
access to information that benefit their own participants and region of operations. Porter stresses
that individual cluster performance greatly depends on specializing in areas not covered by other
clusters while also overlapping with these other clusters in some respects (Porter M. E., 2001). In
sum, clusters should act and operate locally while being involved in a global network so as to
best serve the interest of their participants, their region, and the global markets.
2.2.3. Defined specialization or industry scope
Porter, in his definition of clusters, refers to “a particular field,” which constitutes the
industry scope of a cluster. The industry scope is the proverbial common denominator of the
participating actors, which are linked together via a core activity (Andersson, Serger, Sörvik, &
Hansson, 2004). This core activity leads to emphasis on the same markets and similar production
processes, as observed in the California wine cluster, for example, where cultivation of high-
quality grapes required improvements in irrigation and frost protection systems, as well as
changes in vine spacing over the traditional "8x12" spacing that was designed for maximum
production through mechanical harvesting (Porter & Bond, 2008).
Clusters can also go beyond relations within a specific sector or along a specific value-
added or supply chain. However, this happens when there are strong complementary linkages
among the spanned sectors, which can lead to the creation of a whole new field. It is also
important to realize that the rigidity of sectorial boundaries in today’s economic environment is
often overstated (Andersson, Serger, Sörvik, & Hansson, 2004). Many industries—especially in
various manufacturing and service industries—require intensive inter-linkages that reach into a
variety of fields. Still, clusters tend to have a defined industry scope, especially in their infancy,
14

when identifying relevant participants, building the right networks, and deciding which services
are particularly needed by participants. These are the main concerns of the cluster administration.
2.2.4. Cluster linkages and competitive dynamic
Competition is a desirable market feature, which creates incentives for companies to
improve their quality and to reduce their cost and achieve production with efficient use of
resources. However, within a cluster, it is common and generally desirable to find cooperative
firm behavior alongside competitive forces (Andersson, Serger, Sörvik, & Hansson, 2004). A
central aspect of this combination of competition and cooperation focuses on the willingness of
participants to get engaged and share information. In such an instance, the social capital that is
accumulated within a cluster plays an important role for establishing trust, which is significant in
collaborations. Clusters can then facilitate collaborative behavior by reducing the pressures and
fears of first contact. Firms within a cluster may also collaborate due to the prospect of mutual
long-term benefits, which may include access to information, services, and technologies or better
outcomes as a result of the strategic interplay among cluster members.
Furthermore, clusters’ mix of competition and cooperation highlights the tightrope that
clusters and those who manage them must walk. The clusters must (1) be impartial providers of
assistance and information among participants, (2) avoid being caught in the middle of a cluster-
sponsored collaborative effort that has gone awry, and (3) maintain the uttermost credibility and
reputation for impartiality. These tasks can be challenging in an environment in which
participants interact frequently and might be pursuing similar or the same opportunities. Yet, it is
desirable for clusters to include the advantages of cooperation in a manner that does not pre-empt
competition, within and outside of the cluster.
2.2.5. The need for critical mass
Clusters are strongly motivated for various reasons to reach a certain critical mass of
participants with diverse capabilities and scale. First, a critical mass is sometimes necessary for
achieving some of the positive spillovers linked to clusters since it increases the reach and
breadth of the network, providing greater opportunities to collaborate and greater access to
information. Second, critical mass is important for generating economies of scale and scope
within a cluster, which lead to lower average costs of production. Third, critical mass can
potentially contribute to the sustainability of the cluster because it creates a cushion against
15

exogenous shocks or the departure of key participants (Andersson, Serger, Sörvik, & Hansson,
2004). By building or possessing critical mass, clusters can also increase the likelihood that their
regions’ industrial stronghold will persist over time through institutionalization while reducing
the amount of collective effort required from cluster participants and leadership. Lastly, critical
mass may also enable a cluster to restructure and evolve in a more flexible way over time.
Nevertheless, it is unclear what concentration of complementary actors is required in
order to meet the threshold of critical mass. Furthermore, different industries are likely to have
different thresholds, and even if these thresholds were clearly definable, they can be extremely
demanding in certain industries and difficult to reach.
2.2.6. The cluster life cycle
Over time, clusters will pass through a number of stages which, while not experienced the
same way by all clusters, are logically ordered and can be identified and classified. Figure 2
offers a visual representation of the five stages that clusters generally undergo.
Figure 2. Visual representation of the five stages in the life cycle of clusters
Source: Andersson et al, The Cluster Policies Whitebook (2004), IKED, 29.
The first stage, agglomeration, is the initial landscape before the emergence of a cluster
when companies and actors are co-located but not coordinated. The second stage, emerging
cluster, occurs when a number of companies and other entities begin to cooperate around a core
activity and see the advantages that could be afforded through further structuring. The third
16

stage, developing cluster, occurs when new entities involved in the same core activity emerge or
move within the geographic scope of the cluster and develop further linkages. At this stage, it is
common to see the emergence of a cluster identity such as a logo, website, etc. The fourth stage,
mature cluster, implies that a cluster has developed connections outside the cluster and fosters
the creation of new companies through startups, spinoffs, and joint ventures. The final stage,
transformation, occurs when markets and technologies change to the point that the cluster has to
innovate and adapt in order to remain sustainable and avoid decay (Cortright, 2006). Although
the image in Figure 2 for this stage shows the cluster breaking up into new clusters, this
transformation can take the form of internal changes in the services, cooperation, and structure of
the cluster that do not lead to the development of new clusters.
Importantly, clusters proceed through these stages at their own pace, driven by their own
environment, the needs of their participants, and the capacity of the cluster management team to
implement the transition. Furthermore, the time between stages is far from consistent. For
example, the transformation from an emerging to a developing cluster is likely to be significantly
faster paced than the transition from a developing to a mature cluster (Andersson, Serger, Sörvik,
& Hansson, 2004).
2.3. The Cluster Environment The primary cluster features described above provide only one of the dimensions by
which clusters can be characterized. A second dimension of cluster characteristics depends on
the cluster’s environment. Clusters do not operate in a vacuum; they are greatly dependent on
specific features present within their geographic scope (Andersson, Serger, Sörvik, & Hansson,
2004). Figure 3 offers a visual representation of a cluster and its environment. The central
circular cell represents the cluster in Figure 3. The four “boxes” beneath the cell that “support”
the cluster represent the underlying regional environment. The top four boxes represent specific
aspects of the business environment, all of which play an important role in cluster development,
performance, and sustainability. The two top boxes on the left side of the cluster are supply-
related aspects of the business environment, while those on the right side are demand-related.
17
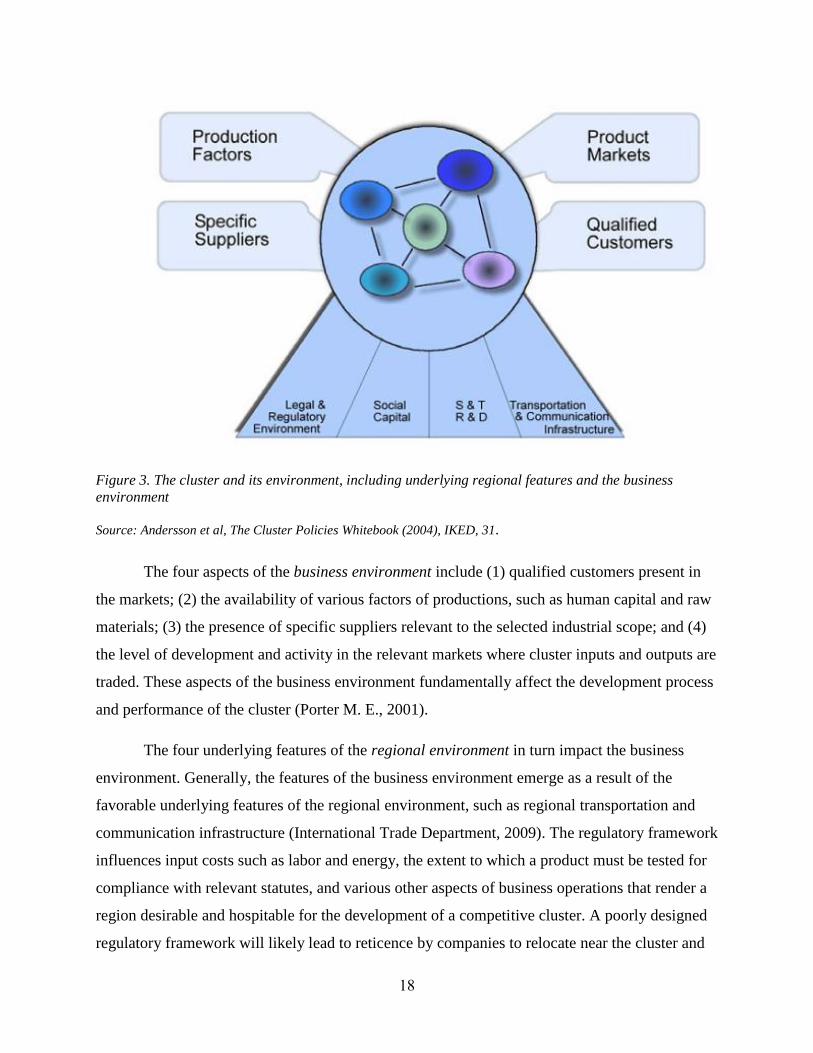
Figure 3. The cluster and its environment, including underlying regional features and the business environment
Source: Andersson et al, The Cluster Policies Whitebook (2004), IKED, 31.
The four aspects of the business environment include (1) qualified customers present in
the markets; (2) the availability of various factors of productions, such as human capital and raw
materials; (3) the presence of specific suppliers relevant to the selected industrial scope; and (4)
the level of development and activity in the relevant markets where cluster inputs and outputs are
traded. These aspects of the business environment fundamentally affect the development process
and performance of the cluster (Porter M. E., 2001).
The four underlying features of the regional environment in turn impact the business
environment. Generally, the features of the business environment emerge as a result of the
favorable underlying features of the regional environment, such as regional transportation and
communication infrastructure (International Trade Department, 2009). The regulatory framework
influences input costs such as labor and energy, the extent to which a product must be tested for
compliance with relevant statutes, and various other aspects of business operations that render a
region desirable and hospitable for the development of a competitive cluster. A poorly designed
regulatory framework will likely lead to reticence by companies to relocate near the cluster and
18

may prevent the agglomeration of actors in the region needed to create a cluster in the first place.
Other underlying features of the regional environment, such as depth and intensity of activities in
R&D and in science and technology, have clear implications with respect to regional innovation,
the long-term performance and efficiency of the production processes within the cluster’s
industrial scope, and the cluster’s ability to attract new participants.
Although the regional environment impacts the business environment, the presence of the
four underlying features of the regional environment is not a sufficient condition to support the
existence of the four aspects of the business environment. In some cases, the necessary aspects of
the business environment may not have had sufficient time to emerge because the alignment of
the underlying features of the regional environment occurred only recently, or the region has
simply been unable to stimulate their emergence. In sum, the cluster environment plays an
important role in cluster emergence and performance and depends greatly on past economic
activity in the region.
2.4. Innovation and Clusters Innovation can have a variety of definitions, depending on the context in which the term
is used. Within the context of clusters, innovation is the process of commercializing new ideas,
including the traditional notion of science- and technology-based breakthroughs, which can lead
to new products, services, and production processes, as well as new ways of organizing
activities, structuring organizations, and finding new supply sources for raw materials.
Clusters can be effective in fostering innovation through various channels (Porter M. E.,
1998; Bathelt, Malmberg, & Maskell, 2004). In particular, they can achieve the following
functions:
· Foster competition, which strongly encourages and pressures companies to
innovate both to stay competitive and to increase profitability.
· Create linkages and networks through which knowledge and innovation can
propagate at exceptional speed. Because cluster entities share an industrial focus,
they tend to be in an excellent position to make use of knowledge and innovation
relevant to an industry.
19

· Provide information, such as market research and supply chain analysis, that
individual companies would lack without access to the cluster’s resources and/or
expertise.
· Create environments that assist small and young firms and encourage the creation
of new ones. These small and young firms are often more open to—and more in
need of—new ideas. These new ideas also tend to have a greater chance of
making their way into practice due to the greater flexibility and more direct
exchange of ideas among the various levels of the managerial hierarchy in smaller
firms.
· Provide alternate forums for the trade of intellectual property and other intangible
assets by relying on their social capital, as opposed to businesses relying on the
market place and its potentially costly and lengthy enforcement of intellectual
property rights.
Clusters can also create a cycle of innovation, which is visually presented in Figure 4.
Three driving forces shape the dynamics of this cycle (Andersson, Serger, Sörvik, & Hansson,
2004). The first is the emergence of new technologies through the creation of new firms
promoted by the clusters. The second driving force is the creation of networks involving various,
heterogeneous actors. The third driving force, continuous improvement of the cluster, is an
important aspect of cluster management, affecting both the performance and sustainability of the
cluster. This driving force refers to the continual identification of the cluster’s weaknesses,
shortcomings, and potential improvements by cluster management. This assessment can be
performed through a formal process, guided by a long-term strategy and vision, or in a more ad
hoc fashion.
20
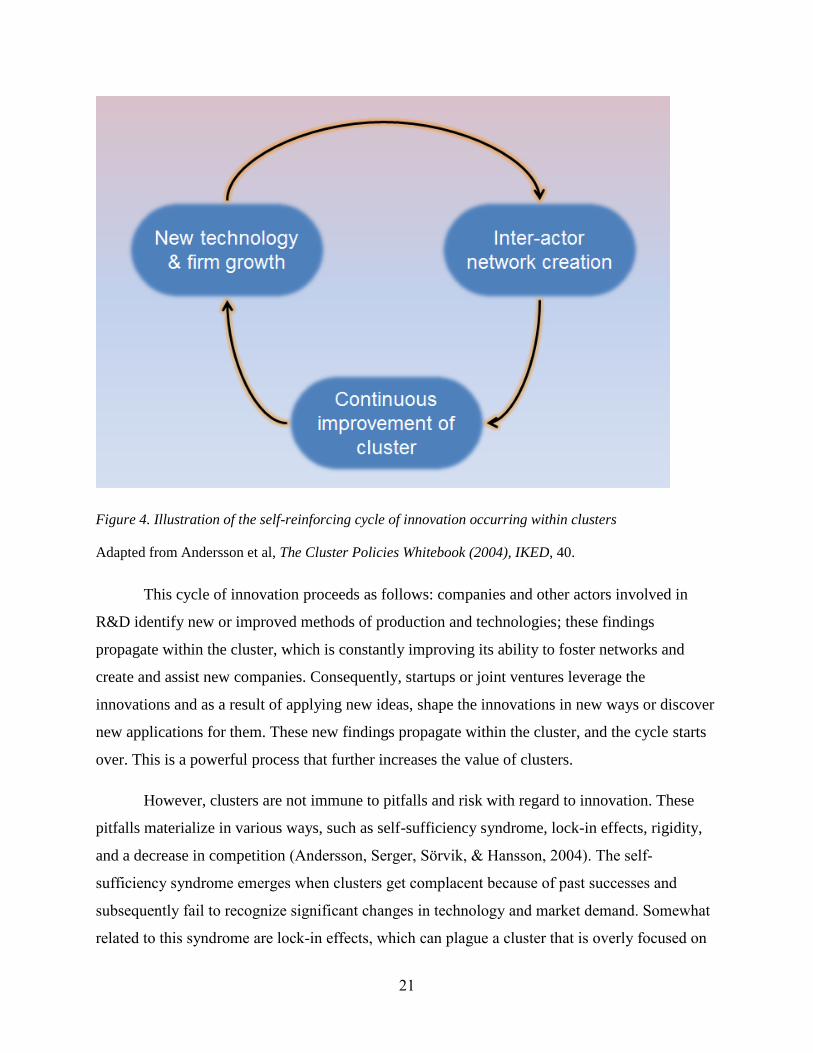
Figure 4. Illustration of the self-reinforcing cycle of innovation occurring within clusters
Adapted from Andersson et al, The Cluster Policies Whitebook (2004), IKED, 40.
This cycle of innovation proceeds as follows: companies and other actors involved in
R&D identify new or improved methods of production and technologies; these findings
propagate within the cluster, which is constantly improving its ability to foster networks and
create and assist new companies. Consequently, startups or joint ventures leverage the
innovations and as a result of applying new ideas, shape the innovations in new ways or discover
new applications for them. These new findings propagate within the cluster, and the cycle starts
over. This is a powerful process that further increases the value of clusters.
However, clusters are not immune to pitfalls and risk with regard to innovation. These
pitfalls materialize in various ways, such as self-sufficiency syndrome, lock-in effects, rigidity,
and a decrease in competition (Andersson, Serger, Sörvik, & Hansson, 2004). The self-
sufficiency syndrome emerges when clusters get complacent because of past successes and
subsequently fail to recognize significant changes in technology and market demand. Somewhat
related to this syndrome are lock-in effects, which can plague a cluster that is overly focused on
21
its geographical scope to the point that most transactions and exchanges of knowledge are local,
and intra-cluster and external linkages are neglected. At this point, the cluster can “lock-in”
established practices. Rigidity manifests itself when the cluster, because of the dense structure
and network it created, is no longer agile and able to adjust structurally to its environment.
Finally, when the balance between competition and cooperation tilts too far towards cooperation,
competition is diminished, reducing the pressure to innovate and improve quality. These pitfalls,
with the exception of rigidity and excessive cooperation, are the results of the cluster ceasing to
be an objective observer of upcoming significant trends, as well as an active aggregator of
relevant, outside information. An alternative explanation is that the cluster did not invest enough
effort to create extra-cluster (outside of the geographic scope and, in certain cases, industry
scope) networks. Even still, concrete and effective steps are available to clusters to avoid these
pitfalls.
2.5. The Policy Rationale for Clusters A growing body of literature points to clusters as economic development tools that can
provide benefits to their individual participants and their broader regional economies (Hincapie
& Wolman, 2010). Through the various roles available for clusters to impact the regional
economy, clusters can achieve the following objectives
· Promote innovation
· Increase efficiency and productivity
· Spur entrepreneurial activity
· Enhance regional economic growth
As indicated earlier, clusters are geographic concentrations of interconnected businesses,
suppliers, service providers, and associated institutions in a particular field (Porter M. E., 1990).
Thus, the definition of clusters is centered on the relationships between its various participants. It
is through leveraging these relationships strategically that clusters aim to promote innovation and
increase productivity in their regional economies.
22
Clusters can enhance innovative activity and productivity in a region through the
following means:
1. encouraging and facilitating collaborations, relationships, and networks between
businesses and other regional stakeholders within the clusters, thus leading to:
· Knowledge spillovers and knowledge sharing in products and processes
among cluster participants
· Innovation diffusion among cluster participants
· Technology transfer and commercialization of new technology (e.g.,
partnerships between universities and businesses)
2. disseminating information to cluster participants through the following:
· Provision of market intelligence and assessment that help businesses identify
gaps in the supply chain
· Propagation of information on funding and contracting opportunities
· Provision of information on regional assets and leveraging regional resources
(public and private) to address the needs of cluster participants
3. providing education, training and mentoring activities to small businesses,
4. providing tailored services to small businesses,
5. enhancing firms’ access to specialized labor, materials, or capital through leveraging
regional resources (also the close proximity of firms would attract specialized labor and
input providers),
6. fostering innovation through various channels:
· Creating an optimal balance between competition and cooperation, which
creates a high pressure to innovate while also nurturing and assisting small
businesses in all stages of development
· Creating and maintaining linkages and networks through which knowledge
and innovation can propagate at high speed
23

· Provision of a trusted forum where participants are encouraged to collaborate
and trade intangible assets
The emergence of clusters does not need to depend on creating and implementing
specific policies that target and support clusters. The private sector, including IFCs if they are
present, can spontaneously organize into a cluster structure, as was the case in Italy and in
various other countries (Ceglie & Dini, 1999). Despite the ability of the private sector to
organize itself into a cluster, certain situations can hinder or slow down a spontaneous
emergence of clusters. In these cases, a public policy to promote clusters may lead the economy
closer to the optimal level of cluster formation and operation.
The following are factors that may limit cluster formation and development:
1. Cluster activities may involve strong positive externalities (spillovers), i.e. benefits
that spill over to those who have not taken part in a particular action. Networking,
matchmaking, and information sharing activities provided by clusters benefit not only
those that organize these activities and events and those that maintain network
infrastructures but also the entire network of participants. In such cases, individual
firms are likely to invest less in cluster organization and administration than the
socially optimal level of investment. The reason is that the individual firms take into
account only the benefits they receive from the cluster when making decisions on
investing in cluster organization and not the positive spillover benefits to other firms.
2. Uncertainty about the partners’ actions after collaboration, coupled with issues of
mistrust, may hinder collaboration among firms. For example, individual companies
may be reluctant to cooperate with others because of the possibility that the partner
might appropriate the gains achieved.
3. Organization of a cluster requires substantial knowledge of regional assets, related
organizations, and standing relationships with them. The costs of obtaining this
information and forming the relationships may be too high for individual companies
or entities to organize and develop the cluster.
24
4. Individual companies may lack information on the actual benefits as well as the
potential risks of cooperation and involvement within the cluster, so they may remain
unengaged.
Once created, clusters can become self-reinforcing. A robust level of cluster activity in an
economy can in turn address the limiting factors (i.e., barriers to cluster formation) listed above
through the clusters’ operations and services. Some examples include the following:
· Clusters can utilize their social capital and standing networks and relationships to
facilitate introductions between potential partners, thus fostering collaboration and
trust among participants.
· Clusters often offer a forum and a framework to negotiate joint efforts by participants
who might not otherwise collaborate because of worries about the appropriation of
gains, due to coordination failure.
· By undertaking some of the activities that have a significant spillover and are
therefore unlikely to be undertaken at the optimal level by individual companies,
clusters can benefit all their participants. 6
· Clusters can improve the information available to their participants. 7
· Clusters can make clear the gains tied to inter-participant collaboration, which leads
to the provision of better information to participants to help them make more
informed decisions.
· Clusters can reduce search costs involved in finding a reliable supplier, qualified
employees, and interested clients. 8
The literature on clusters has amply established that all clusters are unique in a number of
dimensions and that there is no one model for developing and structuring them.9 This
6 For example, clusters can conduct a market analysis and share the findings with all participants. 7 For example, clusters can identify relevant opportunities and post them on their websites or provide counseling and workshops that discuss all possible funding options. 8 For example, clusters can do this by mapping the supply chain or by organizing events at which participants can meet a group of interested clients. 9 For a more detailed discussion, see Cortright, J. (2006). Making sense of clusters: regional competitiveness and economic development. The Brookings Institute. Retrieved from http://www.brookings.edu/reports/2006/03cities_cortright.aspx.
25

tremendous diversity is driven by several factors, including regional assets, the cluster’s
geographic scope, and the existing linkages and structure within the industry in which the cluster
operates. Yet, understanding the features often present in clusters will help identify the similar
characteristics of the clusters in SBA’s Cluster Initiative and their implications on cluster
capabilities. The following section will explain the primary features of the clusters in SBA’s
Initiative, discussing their implications on cluster operations and illustrating their similarities and
differences.
26

3. Features of Clusters in SBA’s Initiative The aim of this section is to provide an in-depth look at the central features across the 10
clusters involved in SBA’s Cluster Initiative. The cluster profiles outlined here provide the
background information that will be used to complement and explain the findings described in
subsequent sections where the services and activities of each cluster are assessed quantitatively
and qualitatively. The discussion in this section will follow some of the primary dimensions of
clusters mentioned in Section 2, including geographic scope, industrial scope, and the level of
maturity of each cluster. Other dimensions that will be discussed in this section include the
governance structure, the strategy employed to deliver services to participating small businesses,
and the business model developed by each cluster in order to leverage effectively the assets
present in their given regions.
3.1. Geographic Scope of the Clusters in SBA’s Initiative Section 2 established that clusters tend to have a defined regional focus, which enables
the emergence of various advantages tied to localization, such as lower transaction costs and
increased economies of scale and scope among cluster participants in the region. The 10 clusters
involved and supported in the Regional Cluster Initiative are located in various regions of the
continental United States. Figure 5 identifies the region in which each cluster operates, based on
their stated geographic scope.
27

Figure 5. Map of the United States, identifying the location of each of the 10 clusters in SBA’s Cluster
Initiative. The three clusters with white text and red background are the ADT clusters of the initiative
while the remaining seven with black text and blue background are the RIC clusters.
As shown in Figure 5 above, two clusters, the San Diego Advanced Defense Technology
Cluster (San Diego Defense Cluster) and the Project 17 Agricultural Technology Cluster (Project
17) are located in California. Three clusters, the Huntsville Advanced Defense Technology
Cluster (Huntsville Defense Cluster), the Enterprise for Innovative Geospatial Solutions
(Geospatial Cluster) Cluster, and the Carolinas’ Nuclear Cluster, are located in the Southeast.
One cluster, the Northeast Electrochemical Energy Storage Cluster (Energy Storage Cluster), is
in the Northeast. The remaining four clusters, the Defense Alliance (Defense Alliance), the
Illinois Smart Grid Regional Innovation Cluster (Smart Grid), the Upper Michigan Green
Aviation Coalition (Green Aviation Cluster), and the FlexMatters Northeast Ohio Technology
Coalition (FlexMatters), are all in the Midwest.
28

Table 1 below, provides a more detailed view of the cluster’s geographic scope as stated
by each cluster as well as the number of states and counties in which the cluster has
participants.10 The data in Table 1 suggests, through a comparison of each cluster’s stated
geographic scope (column 2) with the actual number of states in which participants were
identified (column 4), that the concept of geographical scope does not dictate a rigid demarcation
of the locations of cluster participants. For about half of the clusters (Project 17, FlexMatters,
Smart Grid, and San Diego Defense Cluster), the two columns match, while for the rest, the
number of states in which participants have been identified is greater than the stated geographic
scope. For the latter group, it is more fitting to consider the clusters’ stated geographic scope as
the general region of focus instead of a rigid geographic boundary on the cluster operations.
Table 1 also offers more granular information on the geographical dispersion of cluster
participants through the number of counties in which participants were identified, ranging from
two counties in a single state (San Diego Defense Cluster) to 106 counties in eight states (Energy
Storage Cluster). Two clusters, the Energy Storage Cluster and the Defense Alliance, have
relatively spread-out cluster membership that covers 8 and 17 states, respectively. Although the
Energy Storage Cluster has membership over a smaller number of states than the Defense
Alliance, it has a wider-stated geographic scope compared to the Defense Alliance. The smaller-
stated geographic scope of the Defense Alliance is also evident in the distribution of its
participants’ locations across the 17 states. Most of the Defense Alliance’s participants (39) are
clustered in the four states included in the stated geographic scope; a smaller number of
participants are spread across the remaining 13 states (six are in the neighboring state of
Montana, where the Defense Alliance has two important partners/service providers, and the
remaining 12 states carry a total of 16 participants). Thus, the Defense Alliance has a primary
geographic focus while being open to recruiting members from all over the United States. This
hybrid approach to a geographic scope has been expressed as follows by Chip Laingen, the
Defense Alliance cluster administrator, during an interview:
The idea [of cluster theory] is to grow technology-based economic development in a specific region, but we’ve viewed it in the sense that even with that regional emphasis, you can’t do it without looking at all the resources that are available,
10 The geographic scope information is gathered through the clusters’ proposals, their quarterly and annual reports, and interviews conducted by the evaluation team. The number of states and counties in which cluster participants are based comes from the participants’ zip codes and/or congressional district information provided by the cluster.
29

especially in an age where you can connect very easily through all these other means that we have. So if there’s a small company that needs another piece of their portfolio to advance their technology and they happen to be in Washington, D.C., why wouldn’t we bring them into the mix?
In terms of central tendency, the average number of counties in which clusters have
participants is 23, but decreases to 13 when excluding Energy Storage Cluster’s 106 counties.
The average number of states in which clusters have participants is five states per cluster,
diminishing to three states when excluding Defense Alliance’s 17 states.
Table 1. Geographic scope of clusters, by number of counties and states where participants are located
Cluster Cluster’s stated geographical scope Number of counties where cluster has
participants
Number of states where cluster has
participants
Project 17 Monterey, Santa Cruz, and San Benito
tri-county region 4 1
Carolinas’ Nuclear
North and South Carolina 21 5
Defense Alliance
Minnesota, Wisconsin, South and North Dakota
37 17
Geospatial Cluster
Mississippi 17 4
FlexMatters Northeast Ohio 5 1
Huntsville Defense
North Alabama 13 7
Smart Grid Chicago, Illinois region 5 1
Energy Storage
Seven states in the Northeast, including New York, Connecticut, Massachusetts
106 8
San Diego Defense
San Diego County 2 1
Green Aviation
Six counties in Michigan’s
Upper Peninsula 17 2
30

3.2. Industrial Scope of the Clusters in SBA’s Initiative As described in Section 2, industrial scope is one of the defining characteristics of
clusters. The clusters involved in SBA’s Cluster Initiative are involved in a broad range of
industries, from nuclear energy to agricultural innovation. Table 2 provides the industrial sector
within which each of the 10 clusters is primarily involved, as well as the specific focus each
cluster chose within that industry.
Table 2. Summary of the industry scope and specific focus of each cluster
Cluster Cluster’s industrial sector Cluster’s focus
Project 17 Agriculture Developing innovative agricultural
methods and tools
Carolinas’ Nuclear
Energy Strengthening the nuclear industry
and its supply chain
Defense Alliance
Defense Defense procurement
Geospatial Cluster
Geospatial Developing geospatial technology products
FlexMatters Electronics Developing flexible electronic products
Huntsville Defense
Defense Defense procurement
Smart Grid Energy Developing and promoting smart electrical grid
equipment and technologies
Energy Storage
Energy Strengthening the hydrogen and fuel cell industry
and its supply chain
San Diego Defense
Defense Defense procurement
Green Aviation
Aerospace Creating an aviation ecosystem including
recycling, green manufacturing, and military testing and R&D
As noted in the cluster focus column of Table 2, all 10 of the clusters participating in the
Cluster Initiative focus on high-technology areas of their industrial sector. Also of note, the three
31

clusters focusing on defense procurement (Defense Alliance, Huntsville Defense Cluster, and
San Diego Defense Cluster) are in the Advanced Defense Technology (ADT) component of
SBA’s Cluster Initiative; the other seven clusters are all in the Regional Innovation Clusters
(RIC) component. This split is based on the primary focus of the clusters and does not prevent
RIC clusters from pursuing defense procurement or ADT clusters from pursuing non-defense
procurement. For example, the Enterprise for Innovative Geospatial Solutions Cluster and its
member companies have pursued defense-related grants and procurement opportunities, and the
San Diego Advanced Defense Technology Cluster organized an event focused on emergency
first-responders, including the San Diego Sheriff’s Department, the San Diego Fire Department,
the Public Health Hazardous Incident Response Team, and the Customs and Border Protection.
3.3. Structure of Clusters in SBA’s Initiative The 10 clusters in SBA’s Cluster Initiative each have an executive team in charge of
managing the cluster and its projects, with a designated cluster administrator who is responsible
for day-to-day decisions related to cluster operations and management. These cluster
administrators tend to be experienced project managers with intimate knowledge of the industry
in which the cluster focuses, and its key participants. Their responsibilities include, but are not
limited to: relationship building, moderation of discussions between cluster stakeholders, internal
and external communications, and resource allocation and distribution. Some administrators are
also active in providing services, such as business counseling, to participants. In addition to the
management team and the cluster administrator, the clusters rely on two principal structures to
devise their strategies and provide a variety of services to their participants. The first is a
governance structure that consists of boards of directors or other board-like structures that are
generally tasked with strategic planning, cluster development, and continuous improvement. The
second structure is a network of service providers that are tasked with the delivery of services
and activities to cluster participants.
Table 3 presents a summary of the governance structure of each of the 10 clusters. It
shows that the clusters demonstrate heterogeneity in their governance approach and their
governance structures. Most have some governance structure in place, whether it is formalized or
not, which is good for both cluster sustainability and for continuous improvement. These
structures are largely a function of the way the cluster is organized and run. For example, the
32

Green Aviation Cluster has a relatively complex governance structure because it includes four
regional airports. Only two clusters, Project 17 and the Energy Storage Cluster, do not have a
formalized governance structure. The reason for Northeast Electrochemical Energy Storage
Cluster’s lack of formalized governance at the cluster level is that each of its regional partners
possesses its own structure, as does the Connecticut Center for Advanced Technology (CCAT),
the cluster managing entity.
Another trend found throughout this summary table is that all clusters include various
stakeholders, often involving some small businesses, as part of their board(s) or committees. By
including various stakeholders, clusters ensure that the various actors within the cluster are not
disenfranchised and that their knowledge and ideas are incorporated. Finally, although several
clusters have ties with venture and angel capital entities, only a few of the clusters, including
FlexMatters - Northeast Ohio Technology Coalition, have these actors represented as part of
their governance.
33

Table 3. Summary of the governance structure in place at each of the clusters in SBA’s Cluster Initiative
Cluster Formal
governance Types of board(s) Board(s) composition
Project 17 No - Cluster relies on the board of advisors of the Marina
Technology Cluster, composed of subject-matter experts, small businesses, regional universities, etc.
Carolinas’ Nuclear
Yes
Five Taskforces:
· Economic development
· Workforce development
· Technology development
· Public policy
· Communications
Composed of Carolinas’ Nuclear Cluster members, including large companies, universities, and IFC
representatives
Defense Alliance
Yes Board of advisors Composed of regional partners (e.g., Dakota Defense Alliance), private sector, angel capital, and business
associations
Geospatial Cluster
Yes (not fully staffed)
Board of directors and member committees as needed
Board of directors is composed of Geospatial Cluster and Magnolia Business Alliance (organizing entity)
representatives. Member committee is composed of participating companies
FlexMatters Yes Advisory committee Composed of NorTech (organizing entity), universities, and
private sector representatives
Huntsville Defense
Yes Steering committee Composed mostly of private sector actors and some
university representatives
Smart Grid Yes (not fully formalized)
Steering committee
Composed of several Illinois Institute of Technology representatives and a representative from Clean Energy
Trust, Illinois Science and Technology Coalition, and O-H Community Partners
34
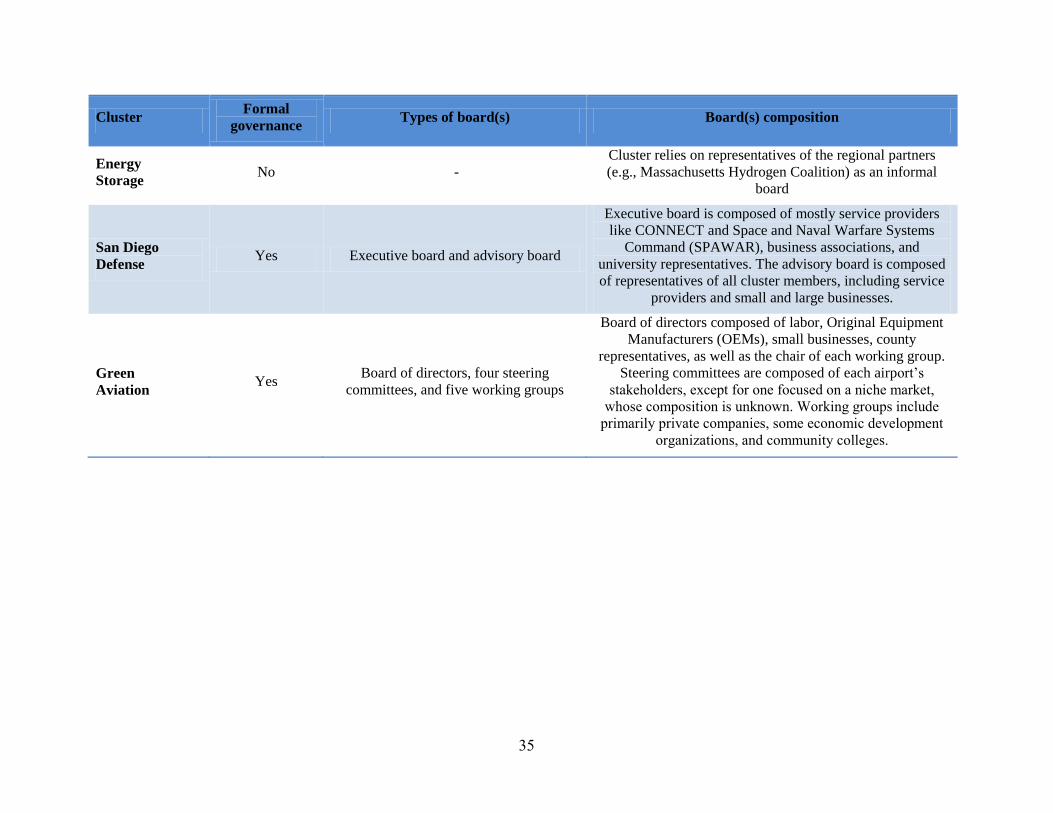
ClusterFormal
governanceTypes of board(s) Board(s) composition
Energy Storage
No - Cluster relies on representatives of the regional partners (e.g., Massachusetts Hydrogen Coalition) as an informal
board
San Diego Defense
Yes Executive board and advisory board
Executive board is composed of mostly service providers like CONNECT and Space and Naval Warfare Systems
Command (SPAWAR), business associations, and university representatives. The advisory board is composed of representatives of all cluster members, including service
providers and small and large businesses.
Green Aviation
Yes Board of directors, four steering
committees, and five working groups
Board of directors composed of labor, Original Equipment Manufacturers (OEMs), small businesses, county
representatives, as well as the chair of each working group. Steering committees are composed of each airport’s
stakeholders, except for one focused on a niche market, whose composition is unknown. Working groups include
primarily private companies, some economic development organizations, and community colleges.
35

36
The various service providers that are tasked with the delivery of services and activities
constitute the second structure in place within clusters. Table 4 below outlines some of the
features of these service providers. Two trends emerge from the summary information in Table
4. First, every cluster provides some level of in-house service directly to its participants, largely
because some services are too specialized for businesses to obtain them outside of the cluster.
For example, even the San Diego Defense Cluster, which relies on one of the widest networks of
specialized service providers among the 10 clusters, has chosen to provide direct services in
specific areas such as export counseling. Only one cluster, the Upper Michigan Green Aviation
Cluster, can be classified as providing limited in-house services, largely because the cluster is
still in the early stages of cluster formation, focusing more on issues related to cluster
organization and less on service provision. Even so, the Green Aviation Cluster provided some
specialized training in the fourth quarter (summer 2011) of the SBA Initiative.
The second trend, which was confirmed through interviews with the 10 cluster
administrators, is that all of the clusters have had at least some level of interaction with SBA’s
resource partners, i.e., Small Business Development Centers (SBDCs), Women’s Business
Centers (WBCs), and SCORE chapters. Many clusters, such as the Huntsville Advanced Defense
Technology Cluster, made extensive use of these regional resources while others mostly refer
participants with certain needs to SBDCs, WBCs and SCORE chapters, or they rely on one or
several of these resources to assist in identifying new small and large companies that could be
targeted for participating in the cluster, as is the case with the Carolinas’ Nuclear Cluster. The
third column of Table 4 describes the extent to which clusters relied on SBDCs for service
provision. The clusters marked as making limited use of SBDCs are those that have had
occasional workshops and/or events but did not rely on SBDCs for service provision on a regular
basis.

37
Table 4. Summary of the service provision structures in place within each of the clusters in SBA’s Cluster Initiative
Cluster Services provided
by cluster administration
Services provided by SBDC
Other primary providers of services
Project 17 Yes Yes
Marina Technology Cluster, Agricultural and Land Based Training Association, Monterey Institute for International Studies, Monterey Bay International Trade Association
Carolinas’ Nuclear
Yes Yes South Carolina Manufacturing Extension Partnership
Defense Alliance
Yes Noa Dakota Defense Alliance, Paradigm Positioning, Wisconsin Entrepreneurs Network, MilTech, and Techlink
Geospatial Cluster
Yes Yes (limited)
Mississippi Technology Alliance, Mississippi Development Authority, and Mississippi Minority Business Enterprise Center, etc.
FlexMatters Yes Yes B&D Consulting
Huntsville Defense
Yes Yesb Procurement Technical Assistance Center, BizTech, and Defense Acquisition University
Smart Grid Yes No
Illinois Institute of Technology's Stuart Business School, Galvin Center for Electricity Innovation, O-H Community Partners, and Clean Energy Trust
Energy Storage
Yes Yes (limited)c New Energy New York, Clean Energy States Alliance, Hydrogen Energy Center, and Massachusetts Hydrogen Coalition
San Diego Defense
Yes Yes
CONNECT, Foundation for Enterprise Development, SPAWAR, San Diego SBA District Office, San Diego State University Research Foundation 11
11 The SDSU Research Foundation’s purpose as stated on its website is to “further the educational, research and community service mission of San Diego State University”. Please see http://www.foundation.sdsu.edu/about/index.html.

38
ClusterServices provided
by cluster administration
Services provided by SBDC
Other primary providers of services
Green Aviation
Yes (limited) Yes
Michigan Aerospace Manufacturers Association, Procurement Technical Assistance Program, Michigan Works!, Telkite, Explorer Solutions, Northern Initiatives
a Cluster used regional SBDCs as part of the process of identifying potential members. b Cluster also relied on WBCs as a service provider to its participants. c Cluster reported some contact with a SCORE chapter but did not rely on the organization as a service provider.
3.4. Maturity Stages of the Clusters in SBA’s Initiative The 10 clusters involved in the Regional Cluster Initiative vary across several measures
of cluster development and maturity as summarized in Table 5. First, the clusters’ year of
establishment varies, with the Enterprise for Innovative Geospatial Solutions being the longest
established cluster, formed in 1998. The most recently established clusters (Project 17, Green
Aviation Cluster, and San Diego Defense Cluster, in certain aspects) were established in 2010.
However, most of the more recently established clusters, including the San Diego Defense
Cluster and Project 17, were spawned from organizing entities or IFCs that were in existence
prior to the formal establishment of the cluster.
The clusters also vary with respect to their life cycle stages (described in Section 2), as
summarized in Column 3 of Table 5. Two of the clusters, Project 17 and the Green Aviation
Cluster, can be described as on the verge of transitioning from the emerging to the developing
stages of the cluster life cycle. The Northeast Electrochemical Energy Storage Cluster, Smart
Grid, and FlexMatters are in the developing stage of their life cycles. The remaining five clusters
(Carolinas’ Nuclear Cluster, Defense Alliance, Huntsville Defense Cluster, Geospatial Cluster,
and San Diego Defense Cluster) can be considered “mature,” based on their life cycle.
Although the categorization of the clusters based on their life cycle is useful in assessing
cluster activities over a long-term horizon, it is only partially useful in differentiating between
clusters that have different organizational capacities within the framework of SBA’s Cluster
Initiative. Since one of the goals of this initiative is to strengthen cluster assistance to small

39
businesses, it is important to classify the 10 clusters involved in SBA’s Initiative based on their
organizational capacity to provide services to their participants. The 10 clusters can also be
divided into three phases of organizational development based on their organizational capacity to
reach out and deliver services to their participants:
· Phase 1: The primary focus of the cluster administration is on planning and
structuring the cluster.
· Phase 2: The primary focus of the cluster administration is on recruiting participants
and building capacity.
· Phase 3: The primary focus of the cluster administration is on providing services and
other forms of assistance to participants and on securing the sustainability of the
cluster.
By the end of the first year of SBA’s Cluster Initiative, eight out of ten clusters had
reached Phase 3, meaning they are providing services, activities, and events to their participants
as a primary focus. The Project 17 Agricultural Technology Cluster is in the process of moving
from Phase 2 to Phase 3 and as such, it has already been providing services and organizing
events while it was still actively identifying and recruiting participants and building internal
capacity by creating a governance structure. Only one cluster, the Upper Michigan Green
Aviation Cluster, has yet to reach Phase 3. It has provided and organized some services and
events, but its primary focus is still identifying new participants and incorporating new resources
such as including an additional regional airport and organizing the resources available in an
effective manner. It is important to note that despite the criteria outlined for each phase of
organizational capacity and development, some level of subjectivity remains in sorting the
clusters into phases of organizational development in part because it can be difficult to
differentiate between those clusters making dynamic adjustments and those still focused on the
various aspects of organizational capacity.
Table 5. Cluster maturity, by year of establishment, focus of activities, and stage of life cycle
Cluster Cluster year of establishment
Cluster’s life cycle stage Phase of organizational
development
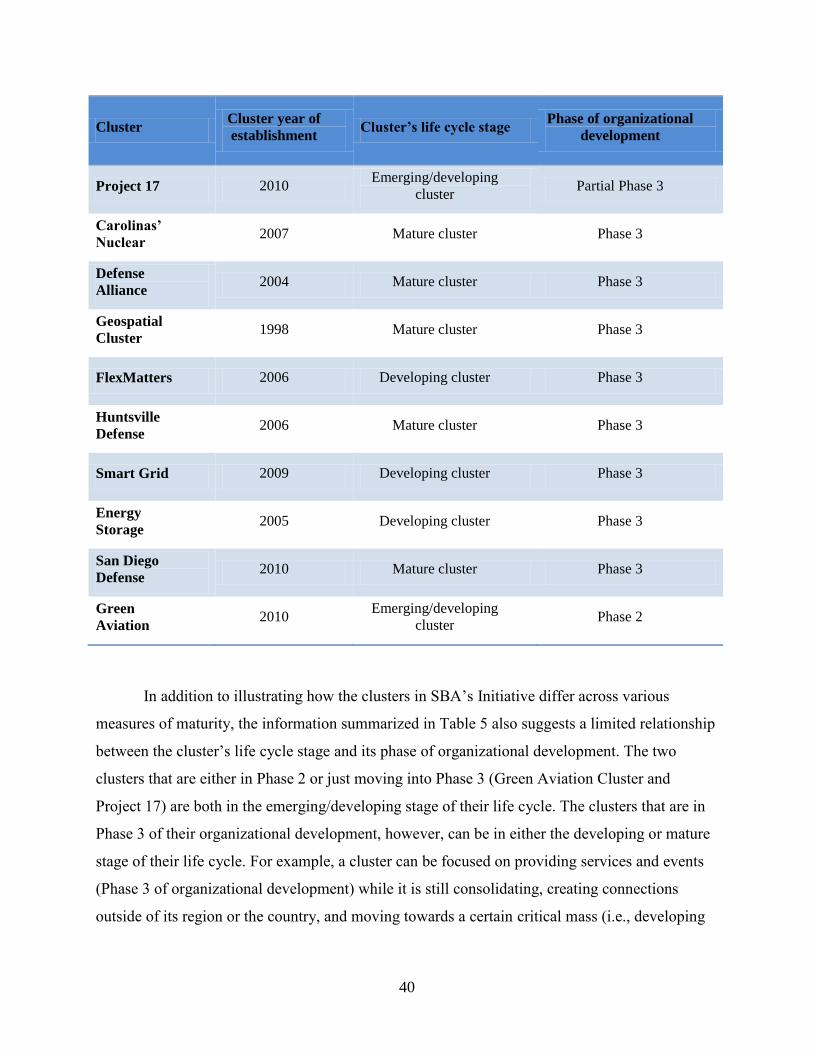
40
ClusterCluster year of establishment
Cluster’s life cycle stage Phase of organizational development
Project 17 2010 Emerging/developing
cluster Partial Phase 3
Carolinas’ Nuclear
2007 Mature cluster Phase 3
Defense Alliance
2004 Mature cluster Phase 3
Geospatial Cluster
1998 Mature cluster Phase 3
FlexMatters 2006 Developing cluster Phase 3
Huntsville Defense
2006 Mature cluster Phase 3
Smart Grid 2009 Developing cluster Phase 3
Energy Storage
2005 Developing cluster Phase 3
San Diego Defense
2010 Mature cluster Phase 3
Green Aviation
2010 Emerging/developing
cluster Phase 2
In addition to illustrating how the clusters in SBA’s Initiative differ across various
measures of maturity, the information summarized in Table 5 also suggests a limited relationship
between the cluster’s life cycle stage and its phase of organizational development. The two
clusters that are either in Phase 2 or just moving into Phase 3 (Green Aviation Cluster and
Project 17) are both in the emerging/developing stage of their life cycle. The clusters that are in
Phase 3 of their organizational development, however, can be in either the developing or mature
stage of their life cycle. For example, a cluster can be focused on providing services and events
(Phase 3 of organizational development) while it is still consolidating, creating connections
outside of its region or the country, and moving towards a certain critical mass (i.e., developing

stage of cluster life cycle). In other words, it can be simultaneously in Phase 3 and in the
developing stage of the cluster life cycle.
3.5. Different Business Models Used by the Clusters in SBA’s Initiative The clusters in SBA’s Cluster Initiative vary in one additional and critical dimension:
their business case. A cluster’s business case is defined as the cluster’s strategy for developing a
regional competitive advantage by effectively leveraging regional assets, such as universities,
supporting industries, and human capital.
Central to the definition of “business case” is the concept of competitive advantage, a
concept closely tied to clusters in Porter’s work. Competitive advantage asserts that countries
aim at producing high-quality goods and services that garner a high price in the markets while
maximizing the productive use of the needed inputs.
41
12 This concept contrasts with comparative
advantage, coined by the renowned political economist David Ricardo, which asserts that
countries specialize in what they are most efficient at producing relative to other nations and
trade the excess with nations specialized in other goods and services. Competitive advantage is
tied to clusters because they are said to play an important role in enhancing the efficient use of
inputs and fostering an environment where companies are encouraged to innovate.
Table 6 below outlines in broad terms the business case of the clusters in the SBA Cluster
Initiative. It reveals diversity in the specific approach selected by clusters to create a competitive
advantage for their region and value for their participants. Despite this heterogeneity, there are a
few common themes among certain groups of clusters. The first is the natural grouping of the
clusters based on the strategy underpinning their business models. Some, like the Carolinas’
Nuclear Cluster, the Northeast Electrochemical Energy Storage Cluster, FlexMatters, and to
some extent Smart Grid, selected a supply chain integration approach, which often involves
industry-specific training, such as nuclear quality and safety, or the provision of unique services
such as the creation of databases of supply chain participants or test-beds to prove and improve
technologies. Others, especially the ADT clusters (San Diego Defense Cluster, Huntsville
Defense Cluster, and Defense Alliance) and to some extent the Geospatial Cluster, are primarily
focused on meeting both the urgent and less-urgent procurement requirements of various federal
12 For more information on competitive advantage, please see Competitive Advantage: Creating and Sustaining Superior Performance by Michael Porter (1998).

42
agencies and, therefore, are most concerned with developing an extensive and robust network
within federal agencies and prime contractors. The remaining two clusters, Project 17 and Green
Aviation Cluster, have foci driven by the unique challenges of their industries. Project 17
operates in a region where the agricultural industry is facing the increasing challenges tied to
water and food security; thus it focuses on issues related to these challenges, including water
contamination by nitrates and water conservation. The Upper Michigan Green Aviation Cluster
is attempting to use its existing infrastructure, i.e., four airports with currently limited use, as the
basis for regional economic development and renewal. Importantly, in addition to the services
and activities specifically dictated by their selected business model, all clusters provided a
common set of small business services, either in-house or through their partners.
The second theme to emerge from Table 6 is the overall similarity in the categories and
types of regional assets leveraged by each cluster as part of their business model. All the clusters
in SBA’s Initiative rely on the region-specific strengths of the private sector, the skilled labor
associated with that sector, and the specializations of the research community in line with the
principles of cluster theory and the importance of geographic and industry scope. A few clusters
are also leveraging more rare types of regional assets, like underused regional airports, a
particularly strong venture capital community, or specialized testing facilities for new
technologies. In the long term, it will be interesting to assess if these clusters benefit from these
rare assets through faster-than-average development or greater sustainability.
Table 6. Summary of the business case selected by each cluster in SBA’s Cluster Initiative
Cluster Business case
Project 17
Seeks to assist and support small businesses involved in the development of advanced agricultural technologies by leveraging the following regional assets:
· An ideal crop-growing climate
· A high concentration of well-established grower-shippers producing over 50% of the fresh produce in North America
· A technology- and information technology (IT)-oriented mindset
· Regional research institutions with R&D and training in agriculture
Carolinas’ Nuclear
Seeks to integrate small businesses into the nuclear energy supply chain to address identified gaps and to ensure that the region remains globally competitive in nuclear energy by leveraging the following regional assets:

43
Cluster Business case
· The nuclear know-how and R&D of universities and national laboratories
· 12 operating nuclear reactors in the region and four at the planning stage
· A high concentration of well-established actors involved in the nuclear industry
Defense Alliance
Seeks to support high-technology small businesses and connect them with U.S. Department of Defense (DoD) and U.S. Department of Energy to fulfill their priority requirements in power and energy by leveraging the following regional assets:
· A high concentration of actors involved in power and energy defense procurement
· The R&D and technology transfer capabilities of universities and research centers
· The intellectual and financial capital for high technology innovation
Geospatial Cluster
Seeks to assist high-technology small businesses to develop and market innovative geospatial technologies by leveraging the following regional assets:
· A high concentration of federal agencies and R&D facilities with a geospatial focus
· A high concentration of prime contractors
· A highly-skilled workforce due to universities with strong geospatial expertise and R&D
FlexMatters
Seeks to accelerate the growth of the emerging flexible electronics industry by assisting small businesses developing innovative and commercializable technologies by leveraging the following regional assets:
· Universities and research institutions largely responsible for the creation of the flexible electronics industry
· A strong manufacturing know-how
· A high concentration of private sector entities involved in the flexible electronics industry
Huntsville Defense
Seeks to assist small businesses with defense procurement capabilities and to connect them to DoD, DoE, and the National Aeronautics and Space Administration (NASA) for the fulfillment of priority needs by leveraging the following regional assets:
· A concentration of defense agencies seeking innovative solutions and defense research institutions
· A high density of private entities involved in defense procurement and R&D
· Several universities that focus on high technology and engineering
Smart Grid
Seeks to assist small businesses through the development of a collaborative ecosystem and the acceleration of smart grid innovation and deployment by leveraging the following regional assets:
· The availability of testing facilities
· Universities and research laboratories focused on power engineering
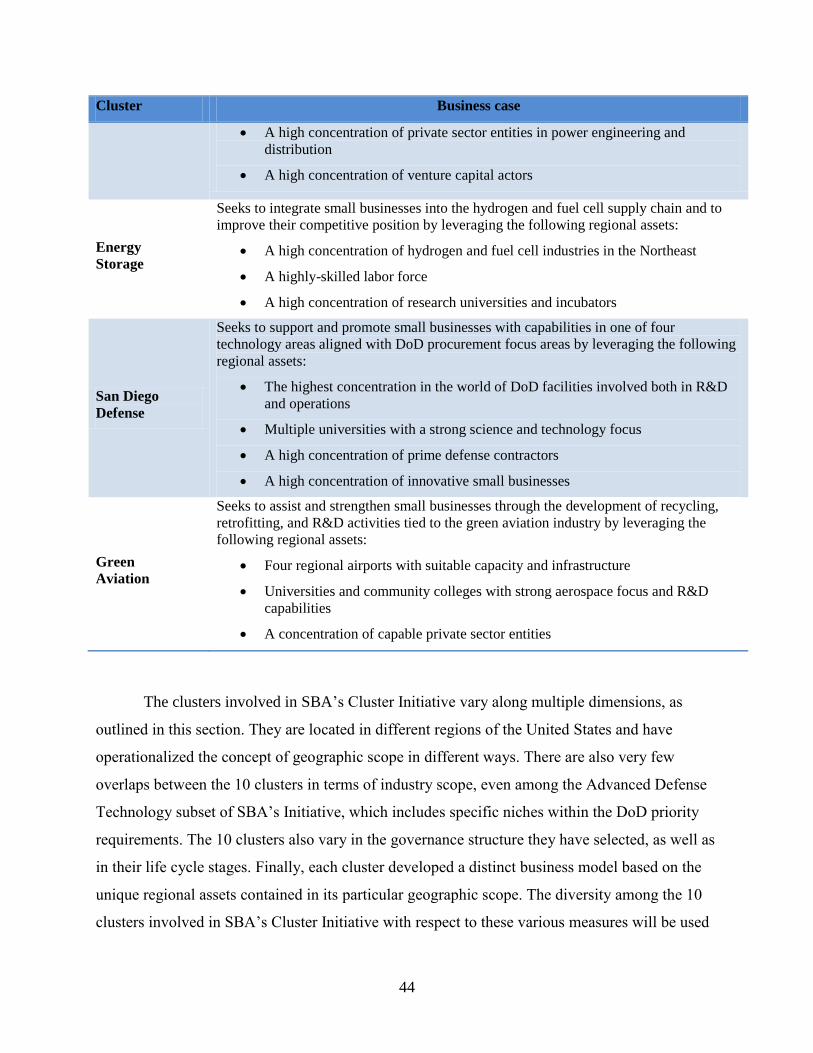
44
Cluster Business case
· A high concentration of private sector entities in power engineering and distribution
· A high concentration of venture capital actors
Energy Storage
Seeks to integrate small businesses into the hydrogen and fuel cell supply chain and to improve their competitive position by leveraging the following regional assets:
· A high concentration of hydrogen and fuel cell industries in the Northeast
· A highly-skilled labor force
· A high concentration of research universities and incubators
San Diego Defense
Seeks to support and promote small businesses with capabilities in one of four technology areas aligned with DoD procurement focus areas by leveraging the following regional assets:
· The highest concentration in the world of DoD facilities involved both in R&D and operations
· Multiple universities with a strong science and technology focus
· A high concentration of prime defense contractors
· A high concentration of innovative small businesses
Green Aviation
Seeks to assist and strengthen small businesses through the development of recycling, retrofitting, and R&D activities tied to the green aviation industry by leveraging the following regional assets:
· Four regional airports with suitable capacity and infrastructure
· Universities and community colleges with strong aerospace focus and R&D capabilities
· A concentration of capable private sector entities
The clusters involved in SBA’s Cluster Initiative vary along multiple dimensions, as
outlined in this section. They are located in different regions of the United States and have
operationalized the concept of geographic scope in different ways. There are also very few
overlaps between the 10 clusters in terms of industry scope, even among the Advanced Defense
Technology subset of SBA’s Initiative, which includes specific niches within the DoD priority
requirements. The 10 clusters also vary in the governance structure they have selected, as well as
in their life cycle stages. Finally, each cluster developed a distinct business model based on the
unique regional assets contained in its particular geographic scope. The diversity among the 10
clusters involved in SBA’s Cluster Initiative with respect to these various measures will be used

45
to inform the evaluation design, described in Section 4, as well as to complement and explain the
findings of the evaluation, described in Sections 5 and 6.

4. Evaluation Design
4.1. Overview The purpose of this evaluation is to provide a comprehensive understanding of how
SBA’s Regional Cluster Initiative was implemented across the 10 clusters during its first year.
This evaluation further aims to assess the services provided by the clusters to their small
businesses as well as the changes in outcomes that the cluster small businesses experienced over
the first year of the initiative. To that end, the evaluation focused on the following questions:
1. What services and activities did clusters provide to their small businesses?
2. How did the key measures of business performance and growth change during the
first year of the initiative among the small businesses participating in the clusters?
3. What has been the influence of small businesses’ participation in the cluster, as
perceived by the small businesses, on their key performance measures?
4. How do the changes in key performance measures of cluster small businesses
compare to the changes in these outcomes as reported in external datasets?
5. What was the estimated economic impact of the clusters’ small business participants
on their regional economies?
The evaluation design of this report is based on a mixed-method approach that uses both
quantitative and qualitative data collected from cluster administrators, large organizations
participating in the cluster, and the small businesses that were targeted and received cluster
services under SBA’s Cluster Initiative. These data are collected through the following means:
· A Cluster Administrator Survey
· A Small Business Survey
· A Large Organization Survey
· Interviews with cluster administrators
· Interviews with selected small businesses
· Clusters’ proposals for SBA’s Cluster Initiative, their quarterly reports, and
annual reports
46

The qualitative data, collected mainly through the interviews and the cluster quarterly and
annual reports, are used primarily to understand the clusters’ configurations, business models,
and goals and strategies for implementing SBA’s Initiative. The quantitative data, collected
mainly through the three survey instruments (Cluster Administrator Survey, Small Business
Survey, and Large Organization Survey) are used primarily to assess the outcomes of the
initiative. Additional details on the data collection methods and the evaluation design are
provided in Appendix D.
4.2. Survey Response The Cluster Administrator Survey was completed by all 10 of the cluster administrators
participating in the SBA Cluster Initiative. The Small Business Survey was sent to those small
businesses that the cluster administrators identified as having been targeted by the cluster and
that received services under SBA’s Initiative from October 1, 2010 through September 30, 2011.
Overall, the Small Business Survey was sent to 320 small businesses identified by the cluster
administrators and was completed by 188 of these businesses, yielding a response rate of 59%.
The Large Organization Survey was sent to the large organizations that were identified
by the clusters as cluster participants. Large organizations include large businesses, universities,
public sector agencies, nonprofit organizations, and business associations. Out of the 152 large
organizations that were sent the Large Organization Survey, 102 of them completed the survey,
generating a response rate of 67%.
Table 7 below shows the number of responses received for the Small Business and Large
Organization Surveys for each cluster.
47

48
Table 7. Survey response rate
Cluster Total Number of Surveys Sent Total Number of Surveys
Received Response Rate
Small Business Survey
Large Organization
Survey
Small Business Survey
Large Organization
Survey
Small Business Survey
Large Organization
Survey
Project 17 31 29 28 25 90% 86%
Carolinas’ Nuclear
35 37 14 23 40% 62%
Defense Alliance
68 7 13 4 19% 57%
Geospatial Cluster
34 15 28 14 82% 93%
FlexMatters 24 11 22 6 92% 55%
Huntsville Defense
29 8 20 4 69% 50%
Smart Grid 11 20 7 8 64% 40%
Energy Storage
40 2 29a 1 73% 50%
San Diego Defense
20 8 14 4 70% 50%
Green Aviation
28 15 13 13 46% 87%
All clusters 320 152 188 102 59% 67% a Although 30 participants from the Energy Storage Cluster returned the Small Business Survey, one survey was dropped from the analysis because the business was not classified as a small business based on SBA’s definition for the associated NAICS industry code. As a result, the number of Energy Storage Cluster small businesses included in the analysis sample is 29.
As in any analysis using survey data, limitations on inferences that are brought about by
how the respondent sample is determined should be considered. In the case of the Small Business
Survey, if the set of businesses that responded to the survey differ systematically from the entire
set of businesses that received cluster services, then the survey results may not be representative
of the whole set of cluster small businesses’ experiences.
49
13 For example, it is plausible that the
small businesses that responded to the survey are more likely to be active and engaged in the
cluster. In that case, caution should be applied in interpreting the survey results as representative
of all small businesses participating in the cluster because the results may be partially driven by
the responding firms’ level of engagement in the cluster, and thus may not represent the
experiences of an average small business participant in the cluster. This potential limitation of
the analysis will be considered in the discussion of the results in Sections 5 and 6.
4.3. Analysis Using Secondary Data Sources The evaluation of SBA’s Cluster Initiative used secondary data sources to compute
average statistics for three key outcomes: revenue, number of employees, and total
compensation. These average measures were then compared with the average outcomes
experienced by the small businesses participating in the clusters. The secondary datasets used in
the evaluation include:
· The Quarterly Census of Employment and Wages (Bureau of Labor Statistics),
which provides data on the number of employees
· State Personal Income Accounts (Bureau of Economic Analysis), which provide
data on compensation
· The Dun and Bradstreet (D&B) Business Database, which provides data on both
revenue and number of employees
The computation of the average outcome measures using these secondary sources is
detailed in Appendix D.
13 The statistical bias that can be generated by the way the survey respondents are selected into the sample is referred to as “the sample selection bias.”

4.4. Regional Impact Analysis One of the three main questions driving the evaluation of SBA’s Cluster Initiative refers
to the impact that each cluster’s small businesses had on their regional economies. In addressing
this question, the evaluation design included a regional impact analysis using the Regional Input-
Output Modeling System II (RIMS II) multipliers provided by the Bureau of Economic Analysis
(BEA).
50
14 The regional impact analysis using RIMS II multipliers enables the estimation of the
overall impact of the cluster on the regional economy by taking into account the direct, indirect,
and induced effects of employment, revenue, and compensation changes reported by its small
businesses. The underlying assumptions of the regional impact analysis as well as its limitations
are discussed in Appendix D.
14 For more information on RIMS II Multipliers, see Regional Multipliers: A User Handbook for the Regional Input-Output Modeling System (RIMS II).

5. Implementing SBA’s Regional Cluster Initiative
5.1. Cluster Stakeholders Clusters, by definition, comprise a broad spectrum of stakeholders with various levels of
involvement but who act in a coherent manner. Cluster stakeholders include small
entrepreneurial companies, large companies, and supporting entities, such as universities and
workforce education institutions, foundations, business associations, service providers, and
public sector agencies, all of which work together synergistically to enhance and to support the
industry in which the firms operate. This section on the implementation of SBA’s Cluster
Initiative starts with a discussion on the interconnected network of each cluster in the Initiative,
focusing on various stakeholder groups. Since small businesses are the targeted stakeholders in
SBA’s Cluster Initiative, they are discussed separately in detail in the next subsection.
Figure 6 represents the number of large companies participating in the 10 clusters in
October 2010 and October 2011, which corresponds to the beginning and end of the first year of
SBA’s Cluster Initiative. It reveals that at the time that SBA’s Initiative was launched in
September 2010, three of the ten clusters, namely, Project 17, the Defense Alliance and
FlexMatters, did not have any large companies as cluster participants. The remaining seven
clusters had large companies, ranging in number from 3 to 13, with an average of about eight
large companies per cluster. By October 2011, all clusters included large companies. Four
clusters, in particular, have increased their large company participation significantly: Smart Grid,
Project 17, the Defense Alliance, and the Geospatial Cluster, which added 28, 16, 12, and 10 new
large companies to their cluster membership, respectively.
51

52
Figure 6. Number of large companies participating in SBA’s Cluster Initiative
Table 8 represents the number of regional stakeholders, such as universities, business
associations, and nonprofit organizations that supported each of the clusters. It shows that in
spite of their differing types of anchoring organizations, the clusters in SBA’s Initiative generally
consisted of an extensive network of organizations besides small businesses. Overall, in October
2011, the clusters had a total of 60 universities/research institutions, 63 business associations, 56
public sector agencies, and 35 nonprofit organizations.
The 10 clusters have also experienced significant growth in the number of stakeholders in
various categories during the first year of SBA’s Initiative. The numbers of universities/research
institutions and foundation/nonprofit organizations have almost doubled while the numbers of
business associations and public sector agencies have increased by 85% and 75%, respectively.
These statistics show that the clusters in SBA’s Initiative have been growing and developing
their networks across a wide spectrum of entities. To the extent that these partnerships are strong
and active, their growth is expected to lead to the strengthening of the clusters themselves.
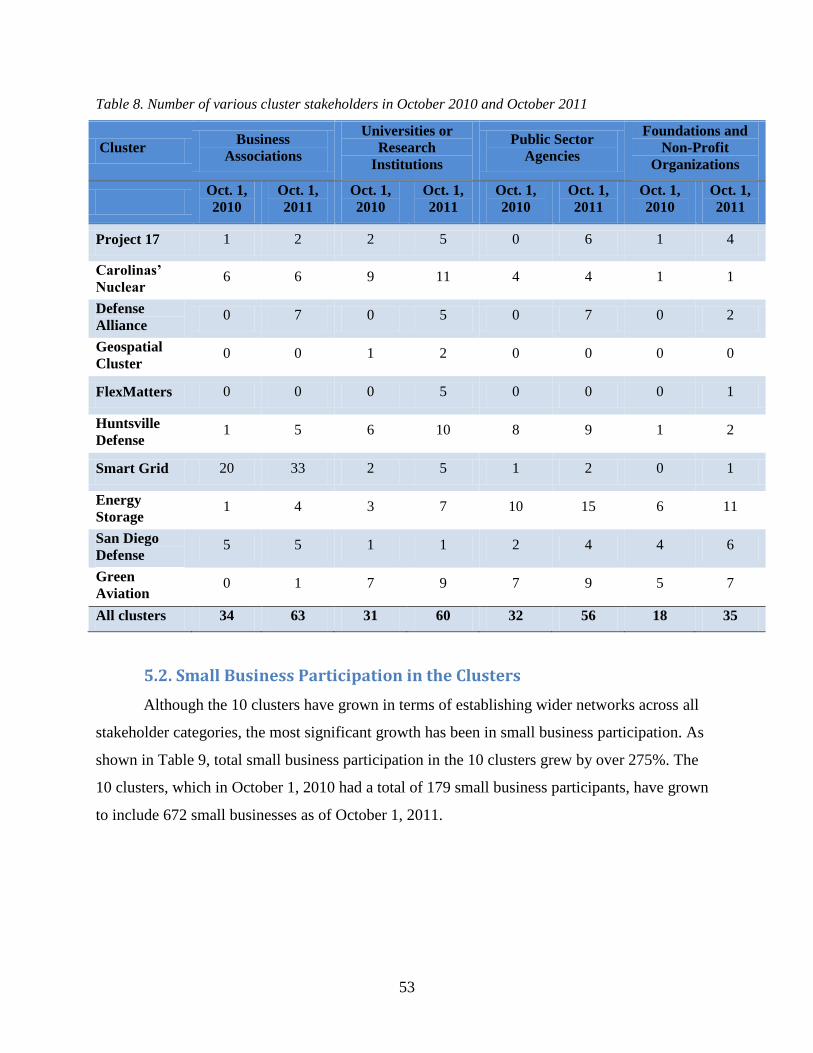
53
Table 8. Number of various cluster stakeholders in October 2010 and October 2011
Cluster Business Associations
Universities or Research
Institutions
Public Sector Agencies
Foundations and Non-Profit
Organizations
Oct. 1, 2010
Oct. 1, 2011
Oct. 1, 2010
Oct. 1, 2011
Oct. 1, 2010
Oct. 1, 2011
Oct. 1, 2010
Oct. 1, 2011
Project 17 1 2 2 5 0 6 1 4
Carolinas’ Nuclear
6 6 9 11 4 4 1 1
Defense Alliance
0 7 0 5 0 7 0 2
Geospatial Cluster
0 0 1 2 0 0 0 0
FlexMatters 0 0 0 5 0 0 0 1
Huntsville Defense
1 5 6 10 8 9 1 2
Smart Grid 20 33 2 5 1 2 0 1
Energy Storage
1 4 3 7 10 15 6 11
San Diego Defense
5 5 1 1 2 4 4 6
Green Aviation
0 1 7 9 7 9 5 7
All clusters 34 63 31 60 32 56 18 35
5.2. Small Business Participation in the Clusters Although the 10 clusters have grown in terms of establishing wider networks across all
stakeholder categories, the most significant growth has been in small business participation. As
shown in Table 9, total small business participation in the 10 clusters grew by over 275%. The
10 clusters, which in October 1, 2010 had a total of 179 small business participants, have grown
to include 672 small businesses as of October 1, 2011.
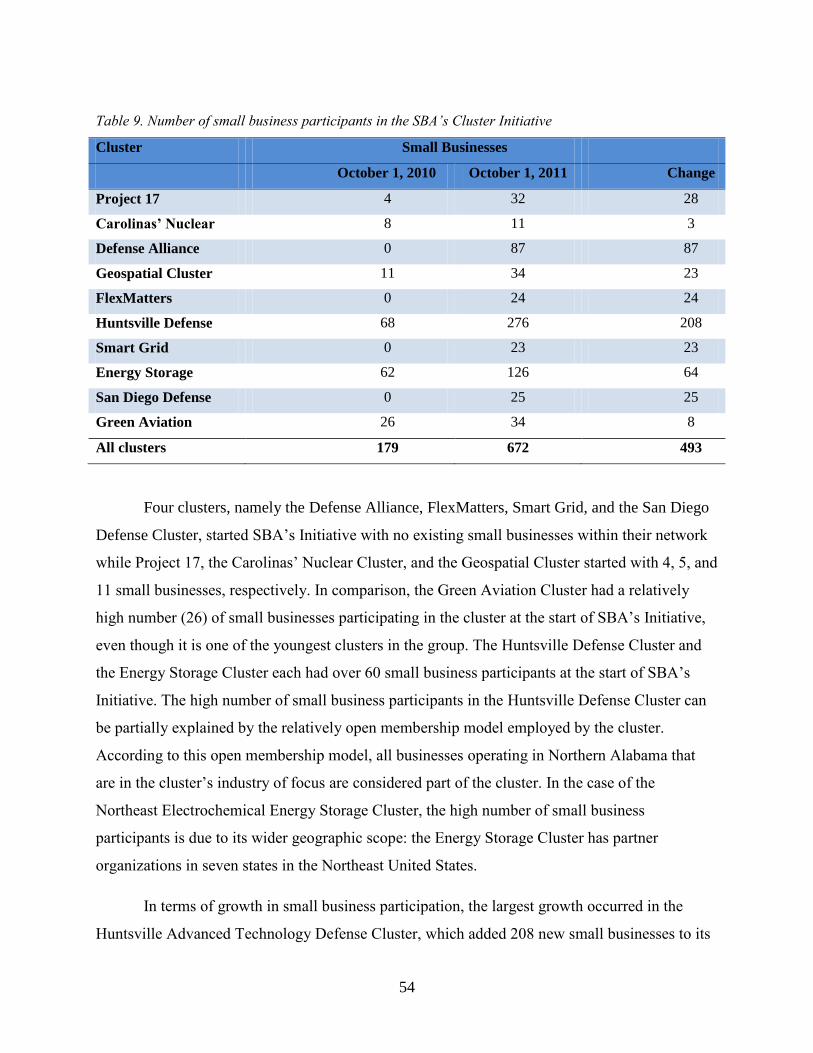
54
Table 9. Number of small business participants in the SBA’s Cluster Initiative
Cluster Small Businesses
October 1, 2010 October 1, 2011 Change
Project 17 4 32 28
Carolinas’ Nuclear 8 11 3
Defense Alliance 0 87 87
Geospatial Cluster 11 34 23
FlexMatters 0 24 24
Huntsville Defense 68 276 208
Smart Grid 0 23 23
Energy Storage 62 126 64
San Diego Defense 0 25 25
Green Aviation 26 34 8
All clusters 179 672 493
Four clusters, namely the Defense Alliance, FlexMatters, Smart Grid, and the San Diego
Defense Cluster, started SBA’s Initiative with no existing small businesses within their network
while Project 17, the Carolinas’ Nuclear Cluster, and the Geospatial Cluster started with 4, 5, and
11 small businesses, respectively. In comparison, the Green Aviation Cluster had a relatively
high number (26) of small businesses participating in the cluster at the start of SBA’s Initiative,
even though it is one of the youngest clusters in the group. The Huntsville Defense Cluster and
the Energy Storage Cluster each had over 60 small business participants at the start of SBA’s
Initiative. The high number of small business participants in the Huntsville Defense Cluster can
be partially explained by the relatively open membership model employed by the cluster.
According to this open membership model, all businesses operating in Northern Alabama that
are in the cluster’s industry of focus are considered part of the cluster. In the case of the
Northeast Electrochemical Energy Storage Cluster, the high number of small business
participants is due to its wider geographic scope: the Energy Storage Cluster has partner
organizations in seven states in the Northeast United States.
In terms of growth in small business participation, the largest growth occurred in the
Huntsville Advanced Technology Defense Cluster, which added 208 new small businesses to its

network. This increase is also largely driven by the cluster’s open membership model described
above. The multi-state geographic scope of the Energy Storage Cluster also led to a large
increase in its small business membership, which grew by 64 firms between October 2010 and
October 2011. The wide geographic scope was also a factor in the growth of small business
participation at the Defense Alliance. The Defense Alliance has no geographic restrictions on
bringing companies into its fold and currently has members in 20 states across the United States.
On the lower end of the spectrum, the Carolinas’ Nuclear Cluster added three new small
businesses to its network, increasing its total number of small business participants to 11
businesses. Among the potential reasons for the lower number of small business participants in
the Carolinas’ Nuclear Cluster, compared to other clusters, are the high barriers that small
businesses face in entering the nuclear industry and the particular criteria and vetting process that
the Carolinas’ Nuclear Cluster employs in bringing small businesses into the cluster.
In general, the number of small business participants in a cluster is reflective of both the
approach that the cluster has taken in providing services to its small businesses and its
geographic scope. Clusters with a smaller number of small businesses, such as the San Diego
Defense Cluster, Smart Grid, and the Carolinas’ Nuclear Cluster, have a smaller geographic
scope and focus on a set of small businesses that satisfy the intake criteria. As a result, only a
relatively limited number of small businesses matching these criteria become participants.
Others, such as the Huntsville Defense Cluster and the Energy Storage Cluster, have more
relaxed inclusion criteria and a greater geographic scope that allow for a broader set of small
businesses to join their clusters.
Table 10 splits the small business participants in the 10 clusters into two categories,
defined by whether or not they have employees. Most of the small businesses (637 of the 672)
have employees. This pattern holds for all clusters, except for Project 17 in which about 40% of
the cluster small businesses do not have employees. Table 10 also shows that between October
2010 and October 2011, the total number of small businesses with no employees increased by 27
businesses, starting at 8 and growing to 35. During the same time period, clusters in SBA’s
Cluster Initiative added 466 small businesses with employees to their membership, increasing the
total number of small businesses with employees from 171 to 637 businesses.
55
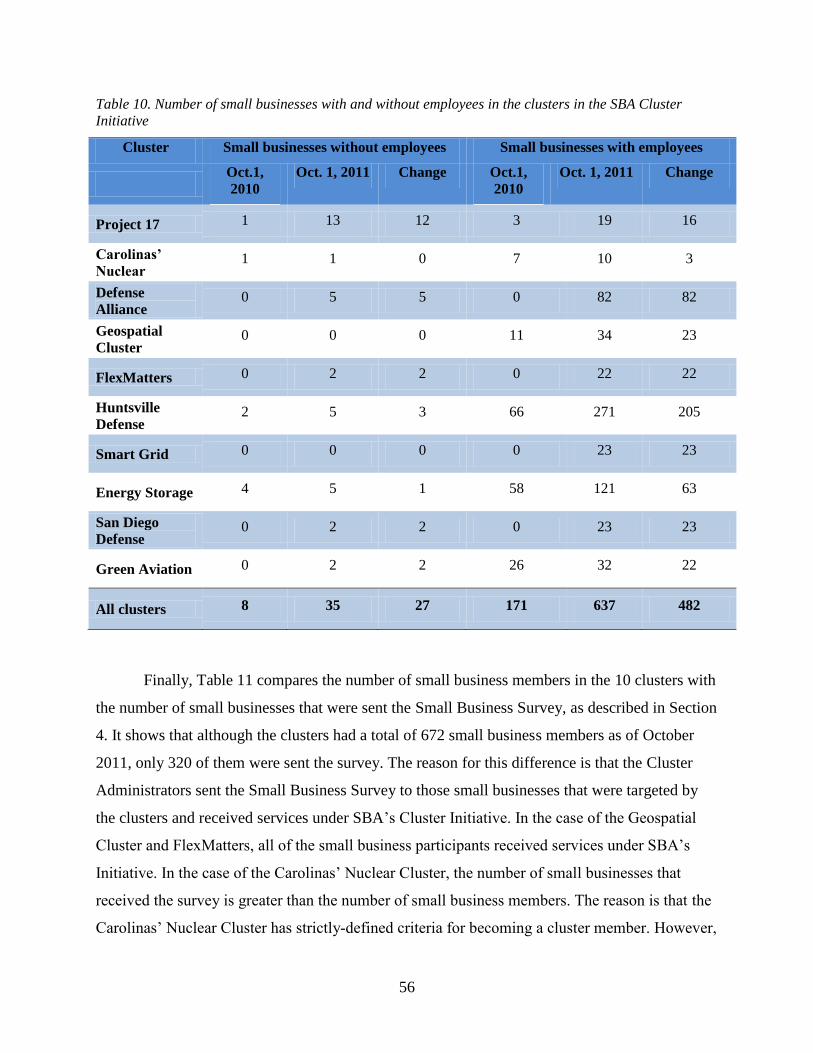
56
Table 10. Number of small businesses with and without employees in the clusters in the SBA Cluster Initiative
Cluster Small businesses without employees Small businesses with employees
Oct.1, 2010
Oct. 1, 2011 Change Oct.1, 2010
Oct. 1, 2011 Change
Project 17 1 13 12 3 19 16
Carolinas’ Nuclear
1 1 0 7 10 3
Defense Alliance
0 5 5 0 82 82
Geospatial Cluster
0 0 0 11 34 23
FlexMatters 0 2 2 0 22 22
Huntsville Defense
2 5 3 66 271 205
Smart Grid 0 0 0 0 23 23
Energy Storage 4 5 1 58 121 63
San Diego Defense
0 2 2 0 23 23
Green Aviation 0 2 2 26 32 22
All clusters 8 35 27 171 637 482
Finally, Table 11 compares the number of small business members in the 10 clusters with
the number of small businesses that were sent the Small Business Survey, as described in Section
4. It shows that although the clusters had a total of 672 small business members as of October
2011, only 320 of them were sent the survey. The reason for this difference is that the Cluster
Administrators sent the Small Business Survey to those small businesses that were targeted by
the clusters and received services under SBA’s Cluster Initiative. In the case of the Geospatial
Cluster and FlexMatters, all of the small business participants received services under SBA’s
Initiative. In the case of the Carolinas’ Nuclear Cluster, the number of small businesses that
received the survey is greater than the number of small business members. The reason is that the
Carolinas’ Nuclear Cluster has strictly-defined criteria for becoming a cluster member. However,
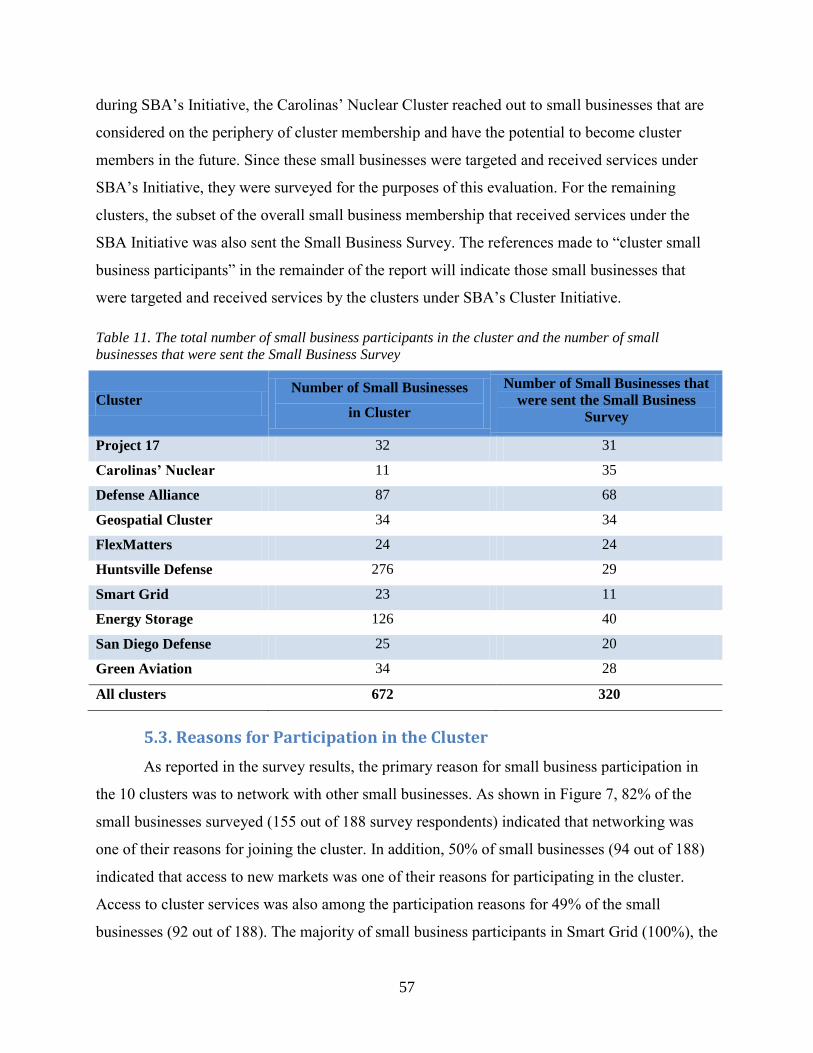
57
during SBA’s Initiative, the Carolinas’ Nuclear Cluster reached out to small businesses that are
considered on the periphery of cluster membership and have the potential to become cluster
members in the future. Since these small businesses were targeted and received services under
SBA’s Initiative, they were surveyed for the purposes of this evaluation. For the remaining
clusters, the subset of the overall small business membership that received services under the
SBA Initiative was also sent the Small Business Survey. The references made to “cluster small
business participants” in the remainder of the report will indicate those small businesses that
were targeted and received services by the clusters under SBA’s Cluster Initiative.
Table 11. The total number of small business participants in the cluster and the number of small businesses that were sent the Small Business Survey
Cluster Number of Small Businesses
in Cluster
Number of Small Businesses that were sent the Small Business
Survey
Project 17 32 31
Carolinas’ Nuclear 11 35
Defense Alliance 87 68
Geospatial Cluster 34 34
FlexMatters 24 24
Huntsville Defense 276 29
Smart Grid 23 11
Energy Storage 126 40
San Diego Defense 25 20
Green Aviation 34 28
All clusters 672 320
5.3. Reasons for Participation in the Cluster As reported in the survey results, the primary reason for small business participation in
the 10 clusters was to network with other small businesses. As shown in Figure 7, 82% of the
small businesses surveyed (155 out of 188 survey respondents) indicated that networking was
one of their reasons for joining the cluster. In addition, 50% of small businesses (94 out of 188)
indicated that access to new markets was one of their reasons for participating in the cluster.
Access to cluster services was also among the participation reasons for 49% of the small
businesses (92 out of 188). The majority of small business participants in Smart Grid (100%), the
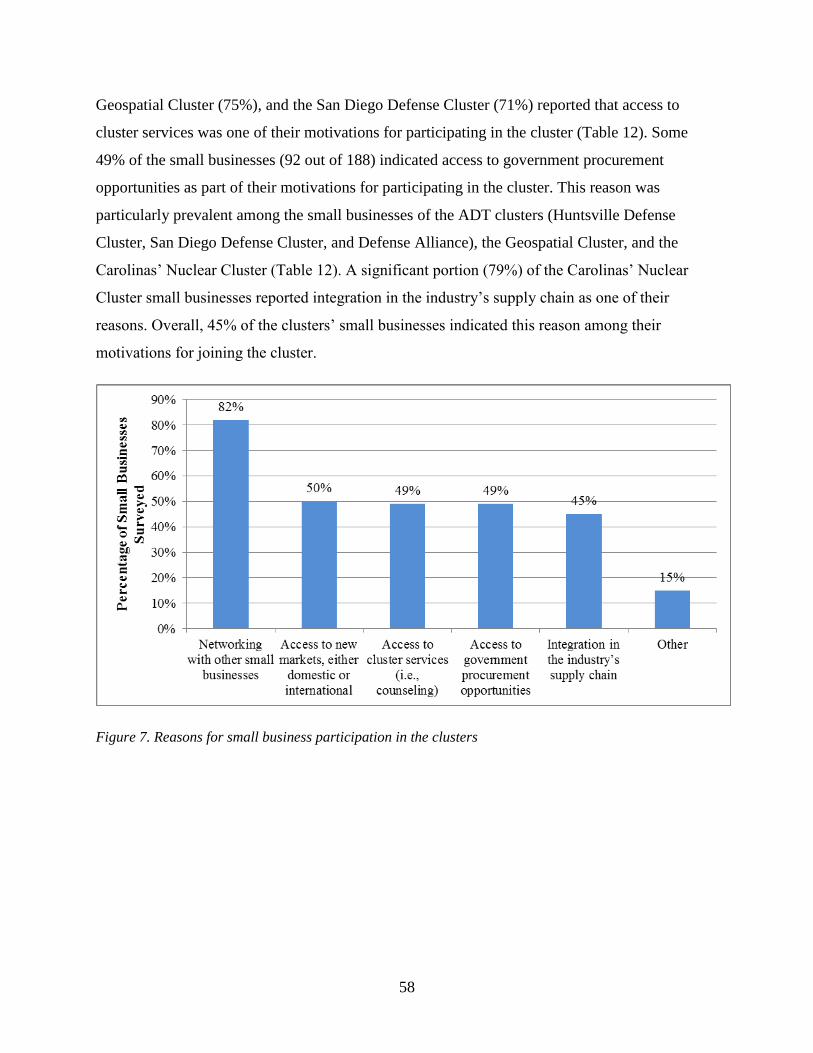
Geospatial Cluster (75%), and the San Diego Defense Cluster (71%) reported that access to
cluster services was one of their motivations for participating in the cluster (Table 12). Some
49% of the small businesses (92 out of 188) indicated access to government procurement
opportunities as part of their motivations for participating in the cluster. This reason was
particularly prevalent among the small businesses of the ADT clusters (Huntsville Defense
Cluster, San Diego Defense Cluster, and Defense Alliance), the Geospatial Cluster, and the
Carolinas’ Nuclear Cluster (Table 12). A significant portion (79%) of the Carolinas’ Nuclear
Cluster small businesses reported integration in the industry’s supply chain as one of their
reasons. Overall, 45% of the clusters’ small businesses indicated this reason among their
motivations for joining the cluster.
58
Figure 7. Reasons for small business participation in the clusters
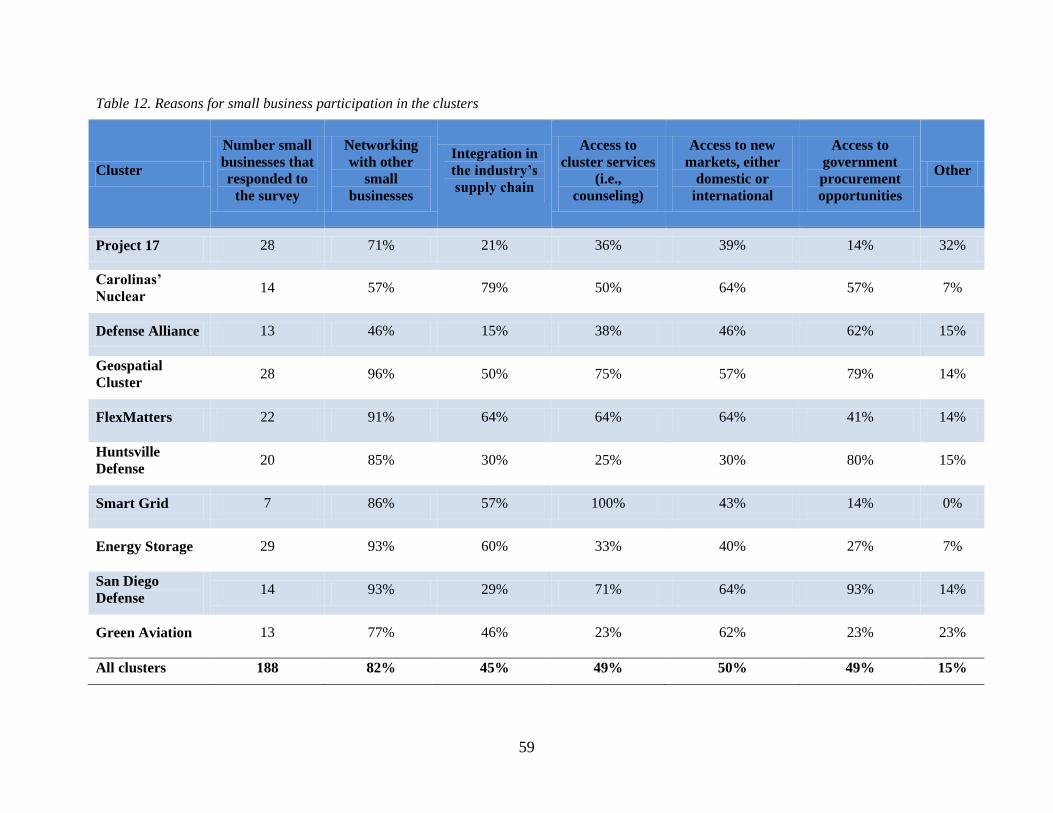
59
Table 12. Reasons for small business participation in the clusters
Cluster
Number small businesses that responded to
the survey
Networking with other
small businesses
Integration in the industry’s supply chain
Access to cluster services
(i.e., counseling)
Access to new markets, either
domestic or international
Access to government procurement opportunities
Other
Project 17 28 71% 21% 36% 39% 14% 32%
Carolinas’ Nuclear
14 57% 79% 50% 64% 57% 7%
Defense Alliance 13 46% 15% 38% 46% 62% 15%
Geospatial Cluster
28 96% 50% 75% 57% 79% 14%
FlexMatters 22 91% 64% 64% 64% 41% 14%
Huntsville Defense
20 85% 30% 25% 30% 80% 15%
Smart Grid 7 86% 57% 100% 43% 14% 0%
Energy Storage 29 93% 60% 33% 40% 27% 7%
San Diego Defense
14 93% 29% 71% 64% 93% 14%
Green Aviation 13 77% 46% 23% 62% 23% 23%
All clusters
188 82% 45% 49% 50% 49% 15%

60
Among the large organizations surveyed, the predominant reason for joining the cluster
was to help spur regional economic development. As shown in Figure 8, over 87% of the large
organizations that completed the survey (89 out of 102 survey respondents) indicated that
regional economic development was one of their reasons for participating in the cluster. The next
most-cited reasons for participation were to find potential partners for technology transfer (51%)
and to gain access to new technologies with commercial potential (50%). Table 13 presents the
large organizations’ reasons for participation in each of the 10 clusters.
Figure 8. Reasons for large organization participation in the clusters
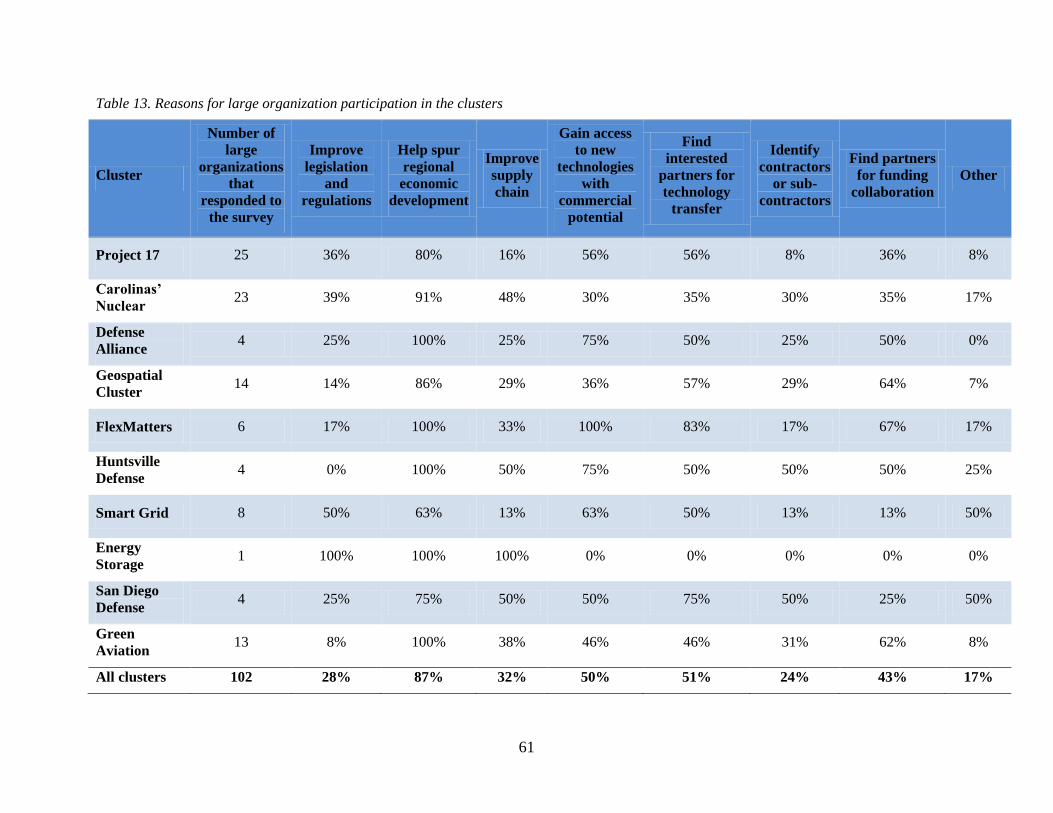
61
Table 13. Reasons for large organization participation in the clusters
Cluster
Number of large
organizations that
responded to the survey
Improve legislation
and regulations
Help spur regional economic
development
Improve supply chain
Gain access to new
technologies with
commercial potential
Find interested
partners for technology
transfer
Identify contractors
or sub-contractors
Find partners for funding
collaboration Other
Project 17 25 36% 80% 16% 56% 56% 8% 36% 8%
Carolinas’ Nuclear
23 39% 91% 48% 30% 35% 30% 35% 17%
Defense Alliance
4 25% 100% 25% 75% 50% 25% 50% 0%
Geospatial Cluster
14 14% 86% 29% 36% 57% 29% 64% 7%
FlexMatters 6 17% 100% 33% 100% 83% 17% 67% 17%
Huntsville Defense
4 0% 100% 50% 75% 50% 50% 50% 25%
Smart Grid 8 50% 63% 13% 63% 50% 13% 13% 50%
Energy Storage
1 100% 100% 100% 0% 0% 0% 0% 0%
San Diego Defense
4 25% 75% 50% 50% 75% 50% 25% 50%
Green Aviation
13 8% 100% 38% 46% 46% 31% 62% 8%
All clusters 102 28% 87% 32% 50% 51% 24% 43% 17%
5.4. Cluster Services and Activities
5.4.1. Overview
The clusters in SBA’s Initiative provided various services that are designed to address the
needs of their small businesses. The aims of these services include:
· Facilitating alliances and collaborations among cluster participants
· Increasing small businesses’ access to capital
· Enhancing small businesses’ development or commercialization of new
technology
· Improving small businesses’ marketing strategies,
· Increasing exports
· Assisting with intellectual property issues and patent applications
Services aimed at facilitating alliances and collaborations among cluster participants
Cluster services designed to promote collaborations between cluster participants may take
the form of targeted networking events where cluster members meet each other or meet
representatives of entities external to the cluster, such as foreign delegations of industry
executives, representatives of various DoD agencies, and university faculty. This is an approach
frequently chosen by the 10 clusters, as exemplified by the Cluster Meeting and Networking
Reception held by FlexMatters – Northeast Ohio Technology Coalition to offer advice on
funding and to allow participants to network. The clusters may also facilitate collaborations
between their small businesses and other entities by referring small businesses to large firms,
organizations, or regional resources. An example of this approach is the Defense Alliance
introducing and referring two of its small business participants to the Idaho National
Laboratory’s Small Business Program Office.
Services aimed at increasing small businesses’ access to capital
Cluster assistance for facilitating access to capital may take the form of (a) information
propagation, (b) technical assistance, and/or (c) matchmaking. Information propagation generally
consists of using the cluster website or newsletter to post funding opportunities that are relevant
to cluster participants. Several clusters used this approach. For example, the San Diego
Advanced Defense Technology Cluster regularly posted on its website funding opportunities
relevant to small businesses engaged in specific technology areas of interest to DoD. This type of
62
assistance allows clusters to take advantage of their position at the intersection of the public,
private, and research spheres to find funding opportunities that would not have been otherwise
discovered by participating firms.
Technical assistance includes mentoring and assistance in writing applications for various
funding opportunities. For example, the Enterprise for Innovative Geospatial Solutions provided
mentoring to a small business regarding Small Business Innovation Research (SBIR)
applications and formed a “Red Team” to review the final proposal before submission.
Clusters also assist small businesses in acquiring external financing through
matchmaking. Matchmaking may take several forms—from the cluster writing a
recommendation letter for a small business to submit as part of an application, to assisting the
small business in finding partners to improve the strength of an application for funding. The
Huntsville Advanced Defense Technology Cluster used this second approach, in collaboration
with Lockheed Martin, when it hosted a Small Business Technology Transfer Research Summit.
At this summit, participants were encouraged to go beyond “card swapping” and to agree to
write joint proposals for specific funding opportunities. Clusters can also actively seek investors,
such as venture capital firms, in order to introduce them to cluster participants.
Services aimed at enhancing small businesses’ development or commercialization of
new technology
Clusters also provide services that aim to enhance small businesses’ development or
commercialization of new technology in various ways. They may provide workshops on
technology transfer and commercialization of new technology, and they may assist with the
various steps involved in developing or commercializing a new product. For example, the Smart
Grid cluster assigned PhD engineering students to work with five small businesses, providing
assistance with bench testing, algorithm development, and other technical support crucial to
moving towards a final product. Clusters also provide one-on-one counseling to small businesses
to help them revise their business strategies in preparation for the potential challenges of
technology transfer. Finally, clusters assist by connecting small businesses with universities or
other research organizations that can help create key linkages in the transfer of new technology
or concepts into the marketplace. During an interview with the evaluation team, the CEO of a
San Diego Defense Cluster small business mentioned that “they [San Diego Defense Cluster]
have provided us with contacts, and we were able to make an association with a university
63

professor that helped us to win a Department of Homeland Security (DHS) SBIR ….. And
without that university connection, I think we may not have been awarded the contract.”
Services aimed at improving small businesses’ marketing strategies
Clusters also assist small businesses in developing or revising their marketing strategies
by providing one-on-one counseling and workshops on marketing strategies, connecting them
with larger organizations that can serve as mentors, or referring them to other regional resources.
For example, the Defense Alliance assisted one of its small businesses by providing marketing
counseling and DoD introductions. These efforts culminated in the small business providing
lightweight armor samples to MilTech, a partnership between TechLink and the Montana
Manufacturing Extension Center that focuses on hands-on product design, prototyping, and
manufacturing assistance, with the aim of a faster transition of technology to the market at lower
cost.
Services aimed at increasing exports
Similar to the services designed to improve marketing strategies, cluster services that aim
to help small businesses to increase their exports may take the form of seminars, workshops,
individual counseling, or referrals to other regional resources that specialize in exporting. For
example, export assistance ranging from advice to setting up a meeting with the International
Trade Administration was provided by the San Diego Defense Cluster to one of its small
businesses, which was interested in collaborating with an Israeli firm to design an unmanned
helicopter system for India.
Services aimed at assisting with intellectual property issues and patent applications
Clusters also assist small businesses with issues related to intellectual property and patent
applications. This assistance may be provided through workshops on intellectual property and
how to incorporate intellectual property considerations into business plans and strategies. The
cluster may also assist small businesses by guiding them through the patent application process,
and/or by connecting them with intellectual property specialists who can assist them with their
patent applications. For example, during the first year of SBA’s Cluster Initiative, the Project 17
Agricultural Technology Cluster worked with an intellectual property lawyer to assist one of its
small businesses with securing two patents and an additional business with securing one patent.
64
5.4.2. Providers of service
The organizing entities of the clusters in SBA’s Initiative had great flexibility in the mix
of resources they used to assist participants. In particular, they could deploy assistance as
follows:
· Provide in-house services
· Utilize services provided by SBA resource partners such as SBDC, WBC, and
SCORE
· Leverage the expertise of other resources or organizations such as business
schools, technological institutes, and the Manufacturing Extension Partnership
Clusters considered their competitive advantage in each of these service provision
methods and selected a mix of in-house, SBA-affiliated, or third-party provisions based on their
local and regional resources, the existence of groups with similar missions, and the needs of their
small businesses.
Table 14, already presented in Section 3.3, shows that all 10 clusters provide some
services directly to their participants and that 6 out of the 10 clusters also rely on one or more
SBA partners (e.g., SBDC, WBC, SCORE) for service provision to small businesses. This
approach allows the six clusters to focus on highly specific services outside the scope of the SBA
partners while leveraging the existing network of assistance tied to SBA. An example of this
approach is the FlexMatters cluster, which focuses on highly specific flexible electronics
assistance by experts in the field, while also relying on the Manufacturing & Technology SBDC
at Kent State University for manufacturing assistance and more generalized services.
All 10 clusters also rely on third-party organizations, many of which provide advanced
and specialized mentoring. An example of these third-party organizations’ mentoring activities is
the service provided by New Energy New York, which prepared two original equipment
manufacturers (OEMs) in the Energy Storage Cluster for a financing symposium. Some of the
third-party organizations also provided highly specialized services. For example, the Defense
Alliance relies on TechLink
65
15 and MilTech, both at Montana State University, to provide access
to labs for research and development, as well as technology licensing.
15 TechLink primarily assists companies with licensing new technologies from the U.S. Department of Defense, but it also evaluates technology and fosters partnerships with DoD labs and other organizations for joint R&D.
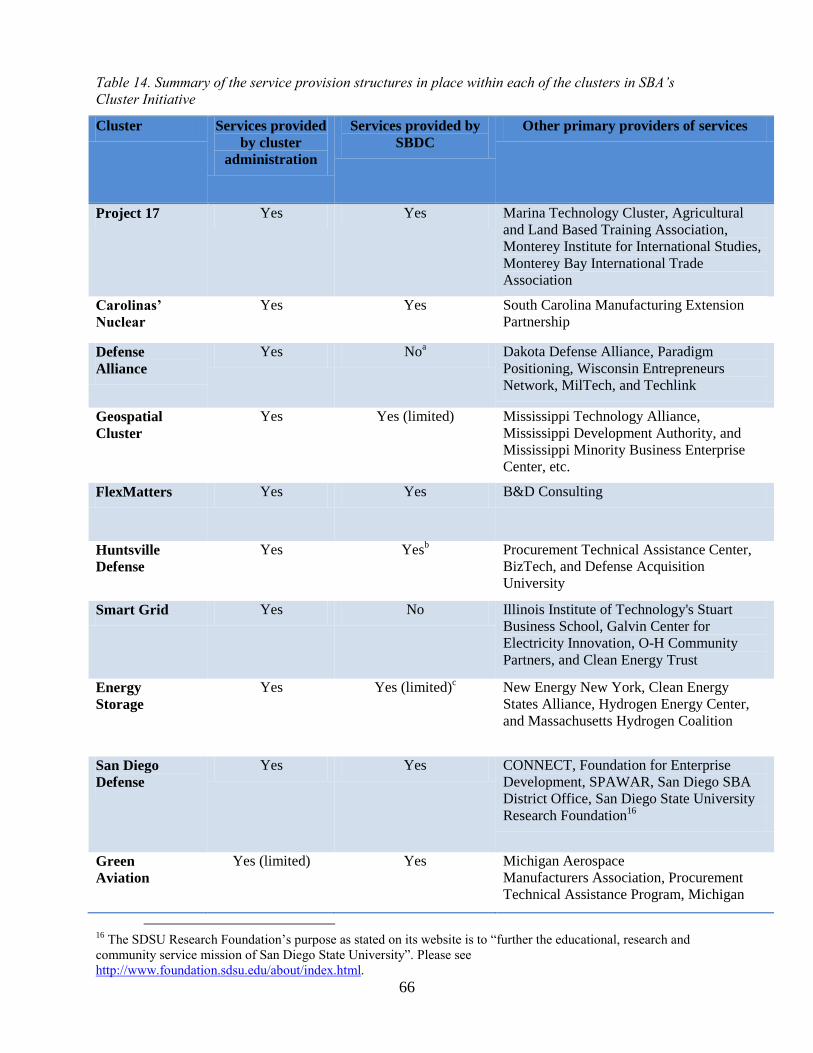
66
Table 14. Summary of the service provision structures in place within each of the clusters in SBA’s Cluster Initiative
Cluster Services provided by cluster
administration
Services provided by SBDC
Other primary providers of services
Project 17 Yes Yes Marina Technology Cluster, Agricultural and Land Based Training Association, Monterey Institute for International Studies, Monterey Bay International Trade Association
Carolinas’ Nuclear
Yes Yes South Carolina Manufacturing Extension Partnership
Defense Alliance
Yes Noa Dakota Defense Alliance, Paradigm Positioning, Wisconsin Entrepreneurs Network, MilTech, and Techlink
Geospatial Cluster
Yes Yes (limited) Mississippi Technology Alliance, Mississippi Development Authority, and Mississippi Minority Business Enterprise Center, etc.
FlexMatters Yes Yes B&D Consulting
Huntsville Defense
Yes Yesb Procurement Technical Assistance Center, BizTech, and Defense Acquisition University
Smart Grid Yes No Illinois Institute of Technology's Stuart Business School, Galvin Center for Electricity Innovation, O-H Community Partners, and Clean Energy Trust
Energy Storage
Yes Yes (limited)c New Energy New York, Clean Energy States Alliance, Hydrogen Energy Center, and Massachusetts Hydrogen Coalition
San Diego Defense
Yes Yes CONNECT, Foundation for Enterprise Development, SPAWAR, San Diego SBA District Office, San Diego State University Research Foundation 16
Green Aviation
Yes (limited) Yes Michigan Aerospace Manufacturers Association, Procurement Technical Assistance Program, Michigan
16 The SDSU Research Foundation’s purpose as stated on its website is to “further the educational, research and community service mission of San Diego State University”. Please see http://www.foundation.sdsu.edu/about/index.html.
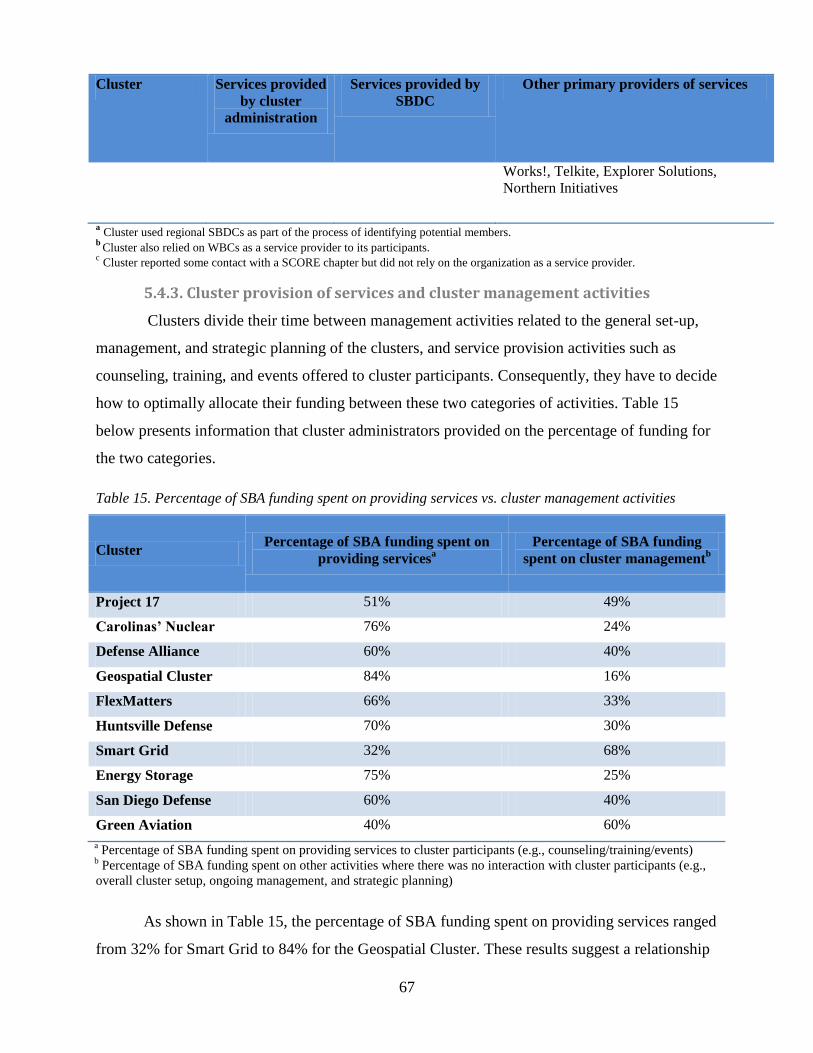
67
Cluster Services provided by cluster
administration
Services provided by SBDC
Other primary providers of services
Works!, Telkite, Explorer Solutions, Northern Initiatives
a Cluster used regional SBDCs as part of the process of identifying potential members. b Cluster also relied on WBCs as a service provider to its participants. c Cluster reported some contact with a SCORE chapter but did not rely on the organization as a service provider.
5.4.3. Cluster provision of services and cluster management activities
Clusters divide their time between management activities related to the general set-up,
management, and strategic planning of the clusters, and service provision activities such as
counseling, training, and events offered to cluster participants. Consequently, they have to decide
how to optimally allocate their funding between these two categories of activities. Table 15
below presents information that cluster administrators provided on the percentage of funding for
the two categories.
Table 15. Percentage of SBA funding spent on providing services vs. cluster management activities
Cluster Percentage of SBA funding spent on
providing servicesa Percentage of SBA funding
spent on cluster managementb
Project 17 51% 49%
Carolinas’ Nuclear 76% 24%
Defense Alliance 60% 40%
Geospatial Cluster 84% 16%
FlexMatters 66% 33%
Huntsville Defense 70% 30%
Smart Grid 32% 68%
Energy Storage 75% 25%
San Diego Defense 60% 40%
Green Aviation 40% 60%
a Percentage of SBA funding spent on providing services to cluster participants (e.g., counseling/training/events) b Percentage of SBA funding spent on other activities where there was no interaction with cluster participants (e.g.,
overall cluster setup, ongoing management, and strategic planning)
As shown in Table 15, the percentage of SBA funding spent on providing services ranged
from 32% for Smart Grid to 84% for the Geospatial Cluster. These results suggest a relationship

between the percentage of the SBA funding allocated to providing services and the age of the
cluster. The three clusters with the lowest percentage of SBA funding allocated to service
provision (Smart Grid, Green Aviation Cluster, and Project 17) are also three of youngest
clusters in SBA’s Initiative.
68
17 On the other hand, the Geospatial Cluster, the Carolinas’ Nuclear
Cluster and the Energy Storage Cluster, which had the highest three percentages of SBA funding
spent on service provision, are among the oldest clusters in the initiative. 18
5.4.4. Highlights of cluster services
Below are highlights from the services that the clusters provided during the first year of
the Regional Cluster Initiative:
1. Propagation of information on industry supply chain
Due to their vantage points, clusters have an inherent advantage in identifying
opportunities for small businesses in their industry supply chains and disseminating
this information. Some of the clusters participating in SBA’s Cluster Initiative have
utilized supply chain mapping and used website portals to disseminate this market
intelligence. Some examples include:
· Supply chain mapping, including gap identification and demand
forecasting for nuclear plants in collaboration with Clemson University
(Carolinas’ Nuclear Cluster).
· Supply chain mapping to identify regional market targets, major regional
OEMs, market barriers, and variations between the seven states of
operation (Energy Storage Cluster).
· A website portal for members to gain access to funding and partnerships
opportunities. Data on funding and partnership opportunities were
obtained from the Market Opportunity Mining study, commissioned by
FlexMatters. This study identified 25 of the most promising applications
and 50 potential customers for flexible electronics in Northeast Ohio
(FlexMatters).
17Smart Grid, the Green Aviation Cluster, and Project 17 were established in 2009, 2010, and 2010, respectively. 18The Geospatial Cluster, the Carolinas’ Nuclear Cluster, and the Energy Storage Cluster were established in 1998, 2007, and 2005, respectively.

2. Propagation of information about opportunities (funding, collaboration,
sourcing)
Propagation of information regarding funding, sourcing, and teaming
opportunities is another primary service provided by clusters to their members. The
majority of clusters in industries where this information is relevant monitor federal
requests for proposals, select those suitable to their participants, and post them to a
website or include them in a newsletter (e.g., San Diego Defense Cluster,
FlexMatters, and Geospatial Cluster).
3. Provision of industry-specific training and certifications
In some industries, certifications and highly specific training can be promoted
and provided by clusters. This service significantly lowers an important barrier to
entry in the industry, promoting both entry of companies in related industries and the
creation of new businesses. Clusters in SBA’s Initiative involved in nuclear
technology and aircraft industries have provided this service in various ways. Some
examples include:
· A vendor 101 quality training program to understand and implement the
nuclear industry’s strict quality requirements (Carolinas’ Nuclear Cluster)
· Program Management Professional (PgMP) bootcamp for small
businesses to prepare and pass the Program Management Professional
Certification Exam, offered at a 50% discount (Geospatial Cluster)
· FAA training to obtain airplane Approved Repair Station Certification
(Green Aviation Cluster)
4. Networking opportunities
The 10 clusters connect small businesses with other businesses and
government agencies through networking events and also through individual referrals.
Some examples are:
· A Small Business Consortium Meeting that brought together federal
agencies, small businesses, and contractors (Geospatial Cluster).
69
· A Supply Chain Exchange event for OEMs and supply chain members to
encourage sourcing and collaboration among cluster members (Energy
Storage Cluster).
· Georgia Tech Federal Market Support where 12 cluster members were
assisted in finding partnership opportunities at federal agencies in the
region (Geospatial Cluster).
· Cluster-sponsored participation of six small businesses in the 2011 Navy
Gold Coast Small Business Opportunity Conference. This conference was
both a training event and a networking event where small businesses met
prime contractors and defense industry leaders (San Diego Defense
Cluster).
5. Provision of assistance with grants (e.g., SBIR/STTR, NSF)
The 10 clusters provided assistance to small businesses with grant applications
in the following ways: a) disseminating relevant funding opportunities to small
businesses, b) providing a forum through which businesses’ grant proposals are
reviewed by experts, and c) connecting small businesses with other firms or
academics that add value to the grant application. Some examples are:
· Use of MBA students to mine Small Business Innovation Research/Small
Business Technology Transfer (SBIR/STTR) opportunities and compile a
searchable database (Huntsville Defense Cluster)
· An SBIR proposal workshop and STTR Summit in collaboration with
Lockheed Martin with the focus of facilitating partnerships to apply for
grants (Huntsville Defense Cluster)
· Creation of a “Red Team,” which consists of a panel of experts to review
grant proposals and to provide critiques and reviews before filing
(Geospatial Cluster)
· A cluster connecting small businesses with university professors and
computing resources for simulations to assist in submission of SBIR and
other grant applications (San Diego Defense Cluster)
70
· Innovation Marketplace, a multi-prong effort to facilitate collaborations
that focused on workshops on applying for SBIR/STTR grants (Smart
Grid)
6. Assistance with identification of financing opportunities
Clusters in SBA’s Cluster Initiative assisted small businesses with financing
opportunities through a) workshops focused on external financing, b) recruiting angel
and venture capitalists to provide feedback on the investor pitches of small
businesses, and c) facilitating introductions between small businesses and angel and
venture capitalists. The following are some examples of cluster assistance to small
businesses on financing opportunities:
· One-on-one new equity business consultations with the majority of cluster
participants. These consultations resulted in a customized report for each
small business, listing the most suitable financing options for the business
given its preferences and needs as well as the recommended steps to
approach each financing option. The cluster then assisted in making the
necessary introductions to suitable funding sources and in preparing a
competitive application (Smart Grid).
· A workshop on attracting angel capital and on alternative financing
options (San Diego Defense Cluster).
· A cluster convening a “Critique Your Investor Pitch” workshop where
venture and angel capitalists gave feedback (Project 17).
7. Showcase events for participants to gain exposure and identify potential clients
Clusters use their networks and social capital in their region and industry, as
well as their expertise in economic and business development, to assist small
businesses to showcase their capabilities to other firms or government agencies. This
service can take the following forms: a) business plan competitions, b) showcase
events open to members to which representatives from various stakeholder agencies
are invited, and c) white papers demonstrating the capabilities of small businesses to
DoD and other federal agencies. Some examples are:
71

· The Coalition Warrior Interoperability Demonstration where cluster
companies demonstrated their technology to DoD and North Atlantic
Treaty Organization allies in a live working environment (San Diego
Defense Cluster)
· The creation of white papers in coordination and on behalf of members to
promote certain technologies in specifically relevant DoD contexts [like
DoD forward operations] (Defense Alliance)
· A business plan competition attended by venture and angel capital groups
and regional entrepreneurs (Project 17)
· An Offense for Defense event attended by 150 people including DoD
officials and the Minnesota governor (Defense Alliance)
· A 3M-DoD invite-only event where participants presented their
innovations (Defense Alliance)
· A Small Business Innovation Showcase where six small businesses
presented their technology and could discuss teaming arrangements (San
Diego Defense Cluster)
8. Workforce development
Identifying the workforce needs of small businesses and assisting in the
alignment of the regional workforce resources with these needs is another important
service provided by the clusters. The clusters have executed this service in the
following ways:
· Identification of suitable candidates for internships and full-time positions
in high-technology industries (FlexMatters)
· Use of MBA students to assist in business planning and marketing;
· Provision of PhD engineering students to assist companies with testing,
product development, and technical support (Smart Grid)
· Placement of students attending regional universities into internship
positions at participating small businesses (Project 17)
· Leadership Energy Carolinas program, a hands-on training program for
mid-career professionals entering the nuclear energy industry (Carolinas’
Nuclear Cluster)
72
73
9. “Think tank” sessions at which participants can discuss problems facing the
industry and small businesses can discuss how to mitigate these issues through
their technology and products
Clusters bring together stakeholders in a region and industry to exchange
ideas in various forums. For example, the Project 17 Agricultural Technology Cluster
organized several “think tank” sessions, which covered a range of topics including
water management and nitrate contamination of the soil.
10. Export assistance
One of the focus areas of cluster services is exporting. Cluster assistance in
this area takes the following forms: a) workshops and b) networking with potential
industry partners abroad. Some examples are:
· Small business counseling on export and international marketing (San
Diego Defense Cluster)
· The development of a partnership with a Korean university and province,
with the goal of developing commercial, scientific, and technical
cooperation (Smart Grid)
· A presentation on building international sales and a trip to Singapore for
exhibition and networking (Geospatial Cluster)
· Three export education sessions (Carolinas’ Nuclear Cluster)
11. Technology transfer
Clusters can assist small businesses on issues of technology transfer. Some
examples of such assistance from the 10 clusters include:
· A technology transfer workshop around the state of Mississippi
(Geospatial Cluster)
· The creation of a network of technology transfer officers at main
universities in North Carolina, South Carolina, and neighboring states,
focusing on nuclear technology (Carolinas’ Nuclear Cluster)

12. Provision of testing and development facilities
Clusters can utilize their wide networks of regional assets and their social
capital built on trust and prior collaborative history to find opportunities for small
businesses to test and prove their new technologies. Some examples are:
· Providing assistance to small businesses in obtaining access to
Commonwealth Edison’s on-grid test bed, which is the next stage after the
cluster-provided Microgrid test bed. This could have the potential to turn
into a sourcing strategy for Commonwealth Edison and others as well
(Smart Grid).
· Negotiating access to Lockheed Martin Technology Collaboration Center
West for interoperability testing and a secure environment (San Diego
Defense Cluster).
· Assisting a Connecticut-based OEM in locating laboratory space (Energy
Storage Cluster).
74
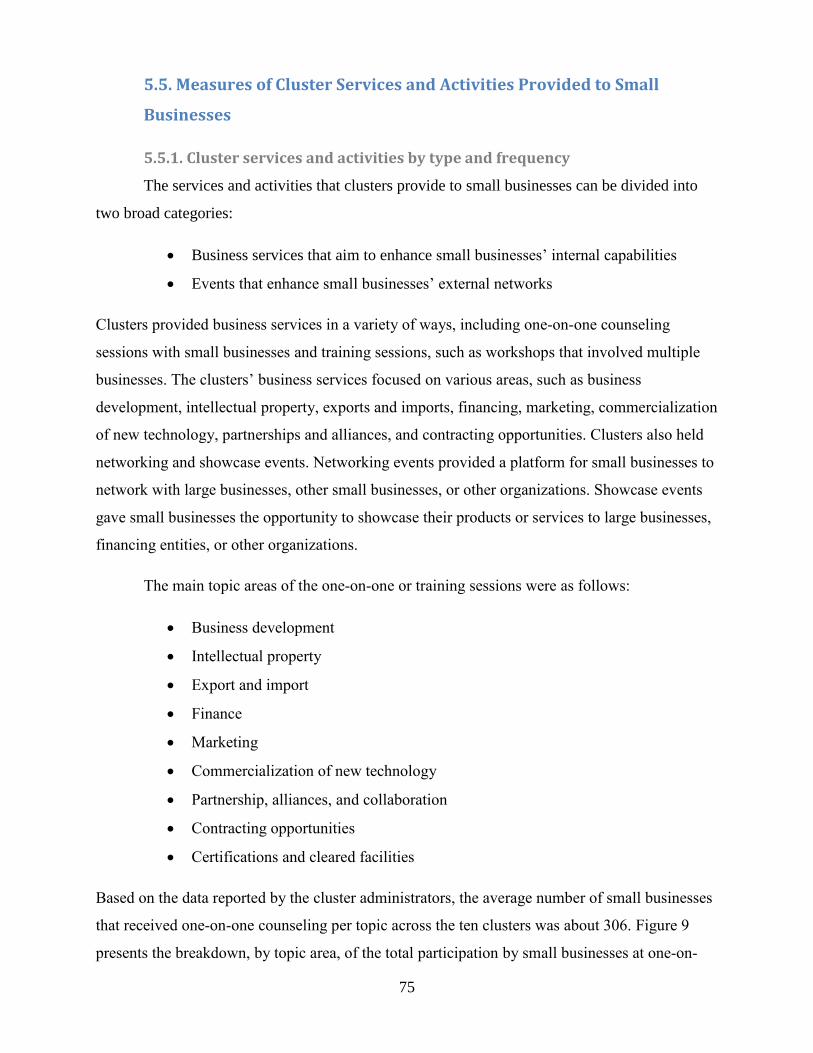
5.5. Measures of Cluster Services and Activities Provided to Small
Businesses
5.5.1. Cluster services and activities by type and frequency
The services and activities that clusters provide to small businesses can be divided into
two broad categories:
· Business services that aim to enhance small businesses’ internal capabilities
· Events that enhance small businesses’ external networks
Clusters provided business services in a variety of ways, including one-on-one counseling
sessions with small businesses and training sessions, such as workshops that involved multiple
businesses. The clusters’ business services focused on various areas, such as business
development, intellectual property, exports and imports, financing, marketing, commercialization
of new technology, partnerships and alliances, and contracting opportunities. Clusters also held
networking and showcase events. Networking events provided a platform for small businesses to
network with large businesses, other small businesses, or other organizations. Showcase events
gave small businesses the opportunity to showcase their products or services to large businesses,
financing entities, or other organizations.
The main topic areas of the one-on-one or training sessions were as follows:
· Business development
· Intellectual property
· Export and import
· Finance
· Marketing
· Commercialization of new technology
· Partnership, alliances, and collaboration
· Contracting opportunities
· Certifications and cleared facilities
Based on the data reported by the cluster administrators, the average number of small businesses
that received one-on-one counseling per topic across the ten clusters was about 306. Figure 9
presents the breakdown, by topic area, of the total participation by small businesses at one-on-
75
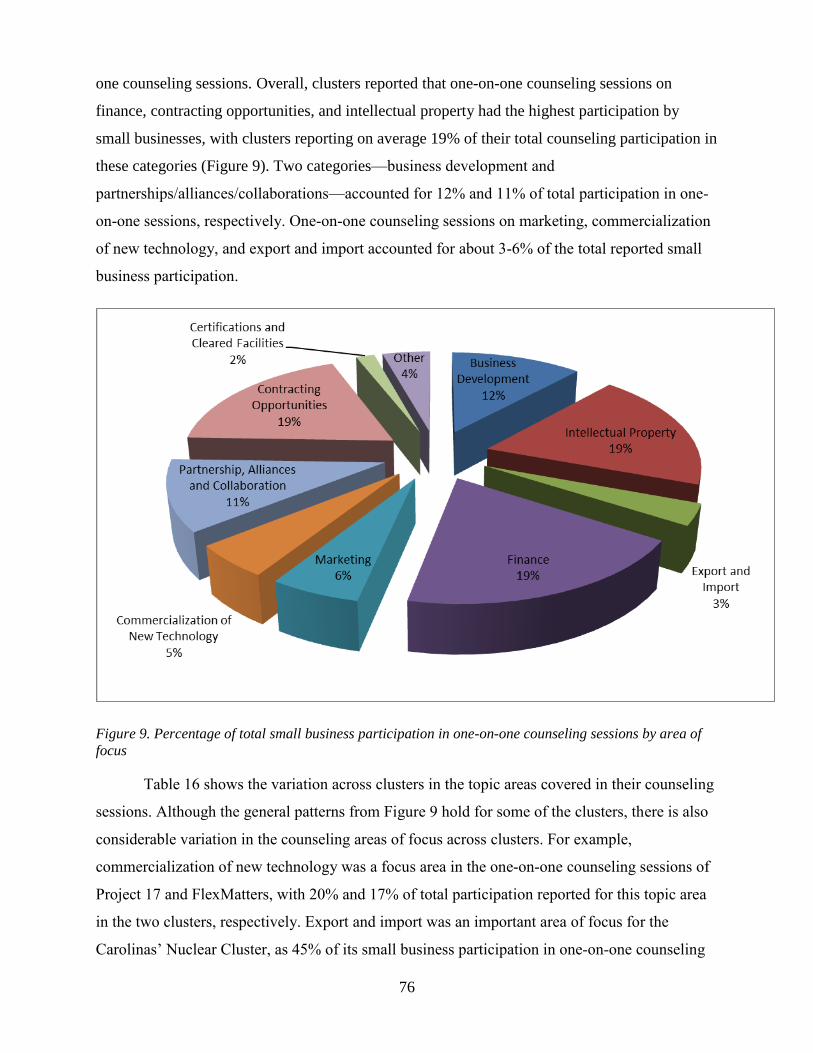
one counseling sessions. Overall, clusters reported that one-on-one counseling sessions on
finance, contracting opportunities, and intellectual property had the highest participation by
small businesses, with clusters reporting on average 19% of their total counseling participation in
these categories (Figure 9). Two categories—business development and
partnerships/alliances/collaborations—accounted for 12% and 11% of total participation in one-
on-one sessions, respectively. One-on-one counseling sessions on marketing, commercialization
of new technology, and export and import accounted for about 3-6% of the total reported small
business participation.
76
Figure 9. Percentage of total small business participation in one-on-one counseling sessions by area of focus
Table 16 shows the variation across clusters in the topic areas covered in their counseling
sessions. Although the general patterns from Figure 9 hold for some of the clusters, there is also
considerable variation in the counseling areas of focus across clusters. For example,
commercialization of new technology was a focus area in the one-on-one counseling sessions of
Project 17 and FlexMatters, with 20% and 17% of total participation reported for this topic area
in the two clusters, respectively. Export and import was an important area of focus for the
Carolinas’ Nuclear Cluster, as 45% of its small business participation in one-on-one counseling

was reported in this area. In the Energy Storage Cluster and the Geospatial Cluster, the highest
percentage of small business participation fell into the counseling sessions related to marketing.
77

78
Table 16. Percentage of total small business participation in one-on-one counseling sessions by area of focus and cluster
Cluster Business development
Intellectual property
Export and
import Finance Marketing Commercialization
of new technology
Partnership, alliances, and collaboration
Contracting opportunities
Certification and cleared
facilities Other
Project 17 18% 5% 2% 4% 18% 20% 33% 0% 0% 0%
Carolinas’ Nuclear 55% 0% 45% 0% 0% 0% 0% 0% 0% 0%
Defense Alliance 10% 10% 10% 10% 10% 10% 10% 10% 10% 10%
Geospatial Cluster 17% 18% 4% 14% 20% 5% 7% 13% 2% 0%
FlexMatters 15% 0% 0% 3% 8% 17% 32% 17% 0% 8%
Huntsville Defense 8% 29% 0% 29% 0% 2% 2% 29% 0% 0%
Smart Grid 25% 0% 0% 25% 23% 13% 10% 5% 0% 0%
Energy Storage 19% 2% 4% 13% 23% 8% 10% 3% 0% 18%
San Diego Defense 10% 9% 0% 9% 9% 9% 47% 8% 0% 0%
Green Aviation 8% 2% 0% 0% 0% 2% 44% 0% 0% 44%
All clusters
12% 19% 3% 19% 6% 5% 11% 19% 2% 4%
In addition to one-on-one counseling, clusters provided training sessions, such as
workshops, to their small business participants. Based on the data reported by the cluster
administrators, the average number of small businesses that participated in training sessions per
topic across the ten clusters was about 248. Figure 10 shows a breakdown of this total by areas of
focus. Overall, the highest percentage of small businesses participation (24%) was reported for
training sessions focused on business development. Training sessions on finance and marketing
accounted for approximately 14% and 12% of the total small business participation in training
sessions, respectively. Although one-on-one sessions on intellectual property accounted for a
large share of total participation in one-on-one counseling (19%), training sessions on
intellectual property accounted for about 7% of the total participation in training sessions. The
remaining categories of training sessions accounted for 5-10% of the total small business
participation in training sessions.
79
Figure 10. Percentage of total small business participation in training sessions by area of focus
Although the patterns that emerge from Figure 10 seem to hold for some of the clusters
individually, there is also variation across clusters in terms of the focus areas of the training
sessions (Table 17). For example, the Energy Storage Cluster focused solely on issues related to
export and import in its training sessions, and 94% of Smart Grid’s small business participation
in training sessions was in sessions focused on finance. The Green Aviation Cluster organized
training sessions related to business development and partnership/alliances/collaboration, and its

small business participation in training sessions was about equally divided between the two areas
of focus.
80

81
Table 17. Percentage of total small business participation in training sessions by area of focus and cluster
Cluster Business development
Intellectual property
Export and
import Finance Marketing Commercialization
of new technology
Partnership, alliances, and collaboration
Contracting opportunities
Certification and cleared
facilities Other
Project 17 28% 0% 29% 14% 28% 0% 0% 0% 0% 0%
Carolinas’ Nuclear 90% 0% 8% 0% 0% 2% 0% 0% 0% 0%
Defense Alliance 10% 10% 10% 10% 10% 10% 10% 10% 10% 10%
Geospatial Cluster 15% 15% 4% 12% 15% 8% 14% 15% 3% 0%
FlexMatters 0% 0% 0% 45% 0% 0% 0% 0% 0% 55%
Huntsville Defense 39% 0% 0% 6% 35% 0% 0% 21% 0% 0%
Smart Grid 0% 0% 0% 94% 0% 0% 0% 6% 0% 0%
Energy Storage 0% 0% 100% 0% 0% 0% 0% 0% 0% 0%
San Diego Defense 17% 9% 0% 17% 8% 8% 9% 17% 8% 9%
Green Aviation 50% 0% 0% 0% 0% 0% 50% 0% 0% 0%
All clusters 24% 7% 7% 14% 12% 6% 9% 10% 5% 6%

In addition to the one-on-one counseling sessions and training sessions focusing on
various topic areas, clusters also organized networking and showcase events. As shown in Table
18, the 10 clusters organized 60 networking events between October 1, 2010 and October 1,
2011, and the total small business participation at these events was 827.
82
19 The majority of the
networking events were organized by the Geospatial Cluster and the Carolina’s Nuclear Cluster,
which organized 25 and 12 networking events, respectively. In terms of total small business
participation at networking events, the majority of total small business participation was reported
by the Defense Alliance and the Carolinas’ Nuclear Cluster. Table 18 also reveals that the
clusters organized 18 showcase events during the first year of the SBA’s Initiative, and the total
small business participation at these events was 706. Out of the 18 total showcase events, six
were organized by the San Diego Defense Cluster. The Geospatial Cluster and the Green
Aviation Cluster each organized three showcase events, while the Defense Alliance organized
two showcase events. In terms of total small business participation, Smart Grid, the Defense
Alliance, and the Huntsville Defense Cluster had the highest small business participation.
Table 18. Networking and showcase events: number of events and total small business participation at
events
Cluster Number of
Networking Events
Total Small Business
Participation at Networking
Events
Number of Showcase
Events
Total Small Business
Participation at Showcase
Events
Project 17 1 41 1 3
Carolinas’ Nuclear 12 201 0 0
Defense Alliance 5 210 2 150
Geospatial Cluster 25 45 3 33
FlexMatters 7 55 1 3
19 The total small business participation in events may exceed the total number of small businesses participating in the cluster in cases where a small business attended multiple events or where events were open to small businesses outside the cluster.

83
Cluster Number of Networking Events
Total Small Business
Participation at Networking
Events
Number of Showcase
Events
Total Small Business
Participation at Showcase
Events
Huntsville Defense 2 119 1 130
Smart Grid 0 0 1 300
Energy Storage 1 77 0 0
San Diego Defense 4 19 6 27
Green Aviation 3 60 3 60
All clusters 60 827 18 706
5.5.2. Frequency of participation in cluster services and activities
Data from the cluster participant surveys revealed that both small businesses and large
organizations generally were active participants in both cluster services/activities and events. As
noted above, cluster services and activities include one-on-one counseling and group trainings
sessions whereas cluster events involve networking or showcase events organized by the cluster.
Among the small businesses that replied, 73% (131 out of 180 small businesses) indicated that
they had participated in cluster events, such as networking and showcase events, at least once
every 6 months (Figure 11). Almost 86% of the small businesses that answered the relevant
question (155 out of 180 small businesses) reported participating in cluster services and
activities, such as counseling or training sessions, at least occasionally (Figure 12). Some 43% of
the small businesses indicated that they participated in cluster services or activities often or
always.
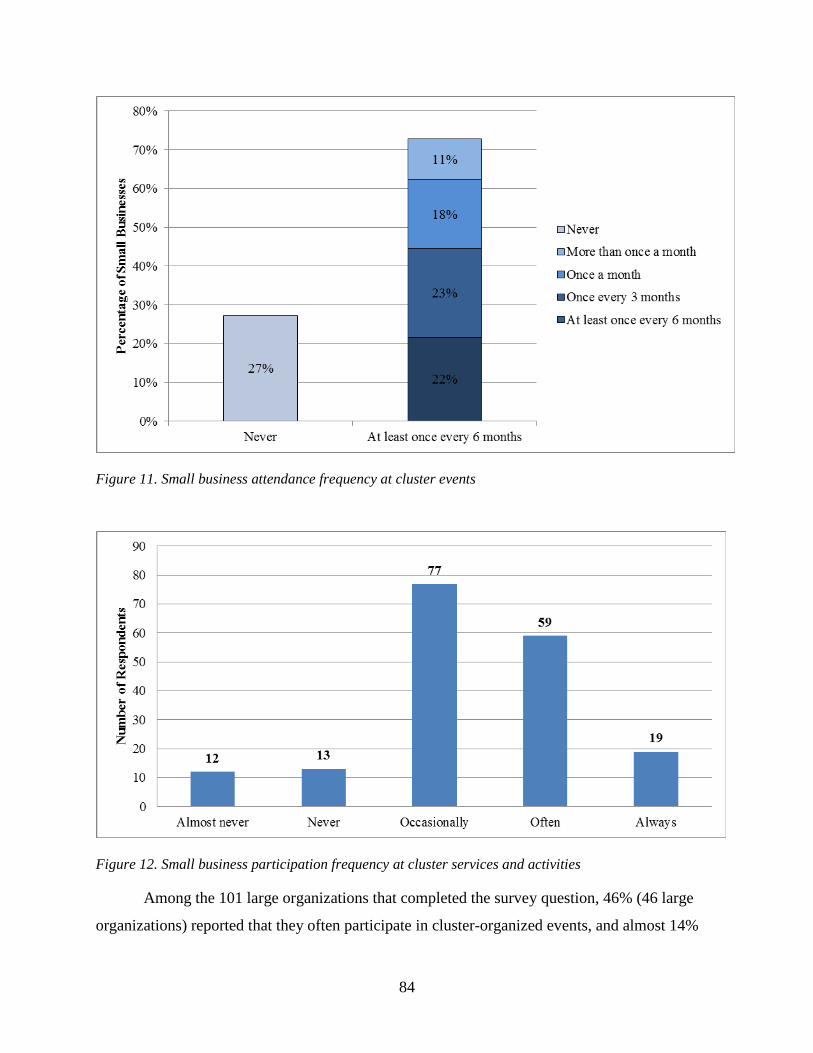
84
Figure 11. Small business attendance frequency at cluster events
Figure 12. Small business participation frequency at cluster services and activities
Among the 101 large organizations that completed the survey question, 46% (46 large
organizations) reported that they often participate in cluster-organized events, and almost 14%

indicated that they always participate in cluster events (Figure 13). Another 31% reported
occasionally attending cluster events. These statistics reveal that both large organizations and
small businesses that responded to the survey were active participants in the cluster. However, as
discussed in Section 4, when reviewing survey results, one should consider the possibility that
the survey respondents may not be representative of the entire group of a cluster’s participants.
In this case, the cluster participants who completed the survey can be expected to be more active
cluster participants than those who did not complete the survey. Therefore, the frequency of
participation is expected to be higher among those that completed the survey compared to the
entire group of small business participants.
85
20
Figure 13. Large organization frequency of participation in cluster events
5.5.3. Participants’ satisfaction with cluster services and activities
The Small Business Survey collected information on the level of satisfaction with cluster
services and activities during the previous 12 months. Figure 14 reveals that the majority of
participants (84% of survey respondents – 151 out of 179) were either satisfied or very satisfied
with cluster services and activities. Some 49% of respondents indicated that they were very
20 When survey respondents are not a random sample of the overall population that is studied, the findings may contain selection bias. This limitation is discussed in more detail in Section 4: Evaluation Design.

satisfied. The high level of satisfaction with cluster services and activities suggests that clusters
are in general successful in delivering services that are in line with small business participants’
needs and expectations.
86
Figure 14. Small businesses’ level of satisfaction with cluster services and activities
A key question that was asked to the clusters’ small businesses was whether they could
have found elsewhere the same services or comparable activities as those provided by the cluster.
This question was designed to discover whether, from the perspective of the small businesses,
the services provided by the clusters were unique and filled a void in service provision. Among
the small businesses that answered this question, over 85% (148 out of 174 small businesses)
indicated that they could not have received the same services elsewhere (Figure 15). As shown in
Table 19, the results for individual clusters were distributed around this average in a relatively
uniform fashion, ranging between 69% (Geospatial Cluster) and 100% (FlexMatters).
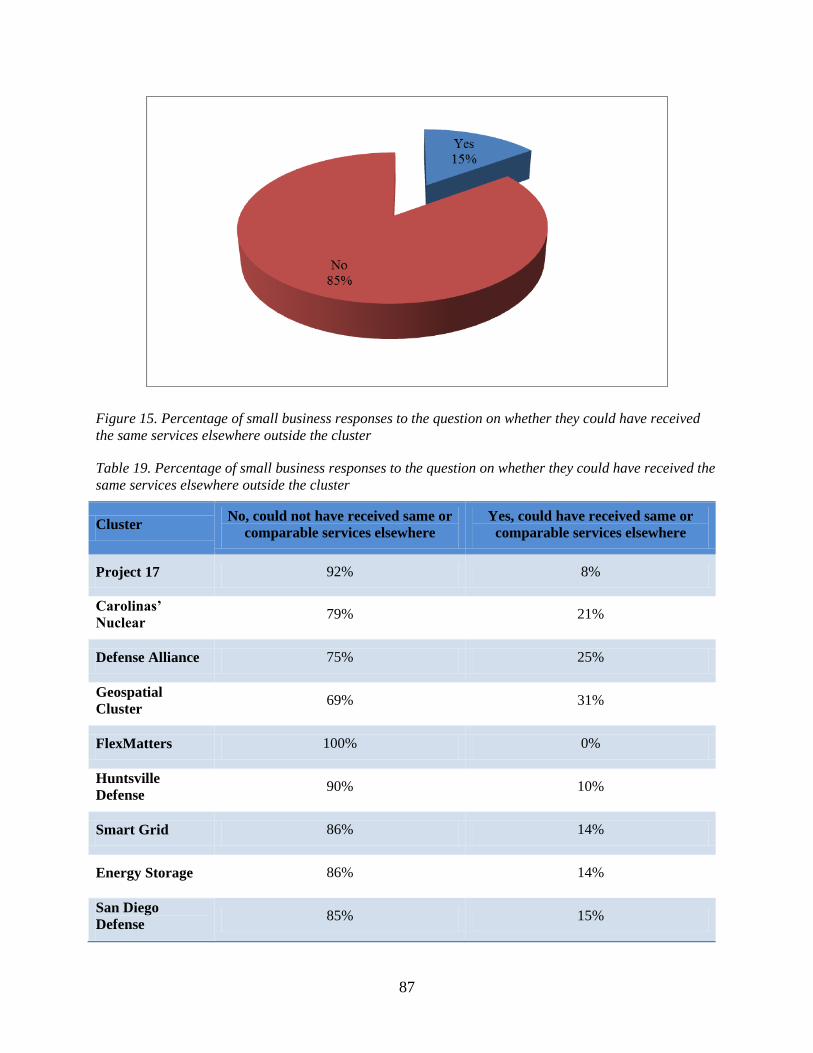
87
Figure 15. Percentage of small business responses to the question on whether they could have received the same services elsewhere outside the cluster
Table 19. Percentage of small business responses to the question on whether they could have received the same services elsewhere outside the cluster
Cluster No, could not have received same or
comparable services elsewhere Yes, could have received same or
comparable services elsewhere
Project 17 92% 8%
Carolinas’ Nuclear
79% 21%
Defense Alliance 75% 25%
Geospatial Cluster
69% 31%
FlexMatters 100% 0%
Huntsville Defense
90% 10%
Smart Grid 86% 14%
Energy Storage 86% 14%
San Diego Defense
85% 15%

88
ClusterNo, could not have received same or
comparable services elsewhereYes, could have received same or
comparable services elsewhere
Green Aviation 83% 17%
All clusters 85% 15%
5.5.4. Quality of services provided: quality indicators
The number of events organized and the number of participants served provide
information on only one aspect of service delivery: the quantitative aspect, which reflects
outreach to small businesses and their level of participation. A second aspect of service delivery
involves the quality of service delivered. In order to provide a standardized approach for this
qualitative dimension of service delivery, Optimal devised a set of guidelines that can be used to
evaluate the cluster’s organizational capacity as it pertains to the service delivery process and
procedures. These guidelines, referred to as “quality indicators,”21 are formulated to rate the
cluster’s organizational capacity and service delivery process based on the following seven
aspects:
1. How robust is each cluster’s business case? Business case is defined as each
cluster’s strategy to develop a regional competitive advantage by effectively
leveraging regional assets, such as universities, supporting industries, and human
capital. This indicator requires that the concept of competitive advantage be
defined in clear terms. This concept is closely tied to clusters in Porter’s work.
Competitive advantage aims at producing goods and services that can be both
produced effectively (by maximizing the productivity of inputs) and garner a high
price in the markets. This concept is distinct from comparative advantage, which
is a term coined by the renowned political economist, David Ricardo, to describe
an economic model in which countries specialize in what they are least ineffective
at producing and trade their excess with nations having different costs of
production and that, therefore, are focused on other goods and services. The
concept of competitive advantage is tied to clusters because they are said to play
21 These guidelines are extrapolated from the healthcare quality improvement literature. See Outcomes Guidelines Report Volume 5, Care Continuum Alliance.

an important role in enhancing the effective use of inputs and fostering an
environment where companies are encouraged to innovate.
2. How robust is each cluster's demonstrated ability to target small businesses and
other participating organizations (e.g., large businesses, universities, and public
sector agencies) most suitable to its business case and strategic approach?
3. How robust is each cluster’s demonstrated ability to contact and interact with the
small businesses it targets, and how robust is the level of small business
attendance of cluster activities, events, and services?
4. How robust is each cluster’s demonstrated ability to deliver high-quality, relevant,
and appropriate services and activities to small business participants?
5. How robust are the performance and quality indicators developed by each cluster
to assess its progress, as well as the data source(s) and the data collection
methodology used for computing these indicators?
6. How robust is each cluster's approach to monitoring the activities, services, and
events provided to small businesses and its approach to enacting any opportunities
for improvement?
7. How robust are each cluster's improvements and progress with respect to the
performance outcomes it has selected?
The quality indicator guidelines, included in the Appendix D, provide principles for how
each of these seven criteria can be scored on a five-point scale as robust, strong, adequate,
inadequate, or poor. The evaluation team used information from the clusters’ proposals, quarterly
and annual reports, and interviews to provide a rating for each aspect based on the guidelines. In
addition, the evaluation team deployed the quality indicators guidelines to cluster administrators
in the form of a web survey and asked the cluster administrators to rate their clusters based on
these guidelines. Each administrator was asked to provide a brief explanation for their self-
ratings, which was assessed for relevance and suitability with regard to the rating chosen. Below
is a description of the ratings by the evaluation team as compared to the self-assessments by the
clusters.
Table 20, below, provides the self-ratings of each respective administrator with regard to
his/her cluster, as well as the rating assigned by Optimal for each of the seven indicators for each
89

of the 10 clusters involved in SBA’s Initiative. For each indicator, the self-rating value is in the
row with a shaded background, whereas the rating given by the evaluation team is in the row
with a white background. The last row of Table 20, also presented in Table 21, shows the sum of
the seven quality indicator ratings (out of a total possible score of 35 points) for each cluster to
summarize the organizational capacity trends by cluster.
90

91
Table 20. Quality indicator ratings, assessed by the evaluation team (in rows with a white background) and each cluster administrator (in rows with a shaded background) for each cluster in SBA’s Cluster Initiative
Project 17
Carolinas’ Nuclear
Defense Alliance
Geospatial Cluster FlexMatters Huntsville
Defense Smart Grid
Energy Storage
San Diego Defense
Green Aviation
Indicator 1 4 5 4 4 5 5* 3 4 4 4*
5 5 4 3 4 4 5 4 5 4
Indicator 2 5 5 5 4 4 4* 4 4 5 4*
5 4 4 4 4 4 5 4 5 4
Indicator 3 5 4 5 3 4 4* 4 3 4 4*
5 5 5 3 3 3 5 5 5 4
Indicator 4 4 5 5* 5 4 5* 5 5 5 4*
4 4 4 5 5 4 5 4 5 4
Indicator 5 3* 5 3 4 5 3* 3 5 5 3*
4 4 5 3 4 1 5 5 5 3
Indicator 6 3 5 4* 5 4 4* 5 5 4 4*
4 3 4 2 3 1 5 4 5 3
Indicator 7 4 4 4* 4 4 4* 4 4 4 4*
5 5 5 5 3 3 4 5 5 4
Total 28 33 30 29 30 29 28 30 31 27
32 30 31 25 26 20 34 31 35 26
Quality indicator ratings in rows with a white background were assessed by the evaluation team. Quality indicator ratings in rows with a shaded background are self-assessments by the cluster administrator. Asterisks (*) mark the self-rating answers that were not accompanied by an explanation.

Based on Table 20, the range of total scores for self-assigned ratings is 27 points (Green
Aviation Cluster) to 33 points (Carolinas’ Nuclear Cluster). There is greater variation of total
scores for the evaluation team ratings, which range from 20 points (Huntsville Defense Cluster)
to 35 points (San Diego Defense Cluster). The mean score for self-assigned ratings is 29.5
points, whereas it is 29 points for the evaluation team ratings. Therefore, the evaluation team
ratings are slightly higher overall, but also have a greater dispersion around the mean.
Cluster administrators were asked to briefly justify their self-rating choice, and did so
appropriately for the most part. Four out of the ten clusters in the SBA’s Cluster Initiative did not
consistently provide justifications for their self-ratings, as indicated in Table 20 by an asterisk
next to the self-ratings left blank. Project 17 and the Defense Alliance did not justify the first and
third indicators out of the seven, respectively, while both the Huntsville Defense Cluster and the
Green Aviation Cluster did not provide any justification for their self-ratings.
Overall, the results suggest that all 10 clusters are generally doing fairly well in the seven
dimensions of organizational capacity that were measured here. As shown in Figure 16, six
clusters have an overall score by the evaluation team of 30 and above, while three of the
remaining four clusters (FlexMatters, Geospatial Cluster, and Green Aviation Cluster) scored
around 25 points. The Huntsville Defense Cluster, with the lowest overall score by the evaluation
team, finished in this position primarily because it obtained a poor rating for both Indicator 5
(performance and quality indicators, data source(s), and data collection methodology developed
by the cluster to assess its progress) and Indicator 6 (monitoring of the activities, services, and
events provided to small businesses and enacting opportunities for improvement). The low score
in these two indicators is due to the evaluation team finding no evidence of the Huntsville
Advanced Defense Technology Cluster conducting a systematic evaluation of the performance of
the cluster or the quality of services provided. The lack of systematic monitoring and evaluation
may be partially due to the difficulty of implementing such activities in a cluster with relatively
broad inclusion criteria for small businesses. Interviews with the cluster administrator suggest
that the cluster is nonetheless finalizing an Internet portal that will enable systematic data
collection in year two of SBA’s Initiative.
92
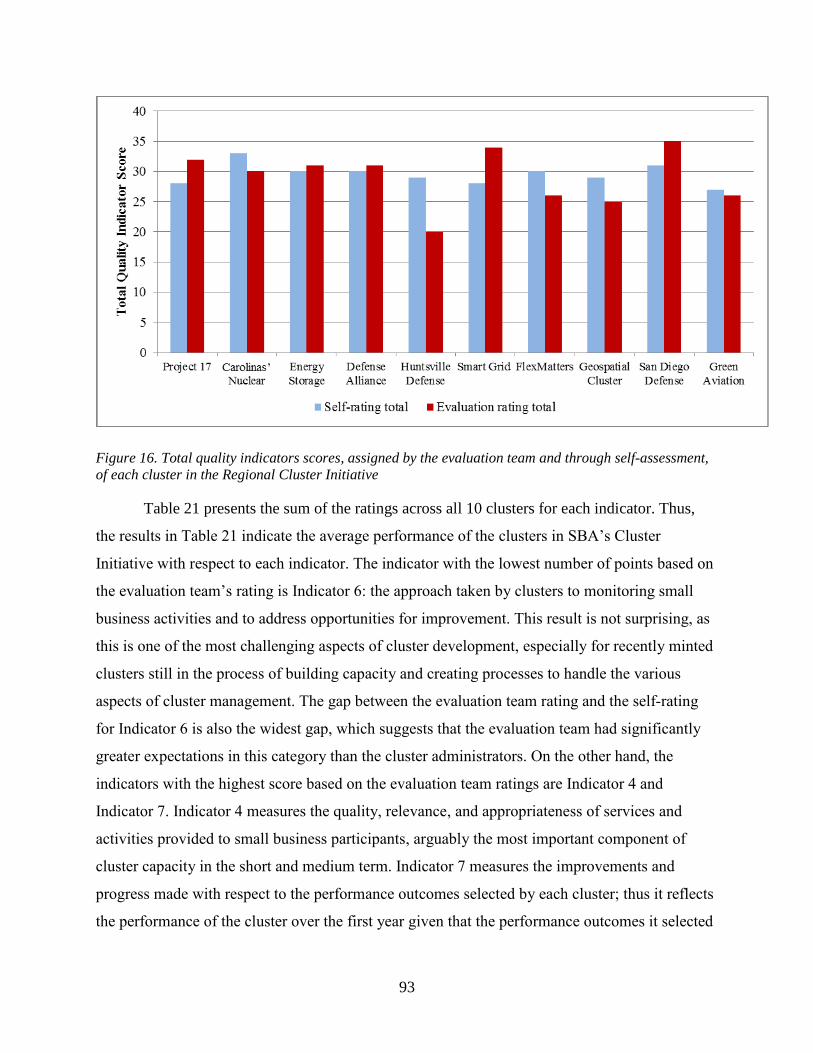
93
Figure 16. Total quality indicators scores, assigned by the evaluation team and through self-assessment, of each cluster in the Regional Cluster Initiative
Table 21 presents the sum of the ratings across all 10 clusters for each indicator. Thus,
the results in Table 21 indicate the average performance of the clusters in SBA’s Cluster
Initiative with respect to each indicator. The indicator with the lowest number of points based on
the evaluation team’s rating is Indicator 6: the approach taken by clusters to monitoring small
business activities and to address opportunities for improvement. This result is not surprising, as
this is one of the most challenging aspects of cluster development, especially for recently minted
clusters still in the process of building capacity and creating processes to handle the various
aspects of cluster management. The gap between the evaluation team rating and the self-rating
for Indicator 6 is also the widest gap, which suggests that the evaluation team had significantly
greater expectations in this category than the cluster administrators. On the other hand, the
indicators with the highest score based on the evaluation team ratings are Indicator 4 and
Indicator 7. Indicator 4 measures the quality, relevance, and appropriateness of services and
activities provided to small business participants, arguably the most important component of
cluster capacity in the short and medium term. Indicator 7 measures the improvements and
progress made with respect to the performance outcomes selected by each cluster; thus it reflects
the performance of the cluster over the first year given that the performance outcomes it selected

94
are relevant to its business model and the goals of the Regional Cluster Initiative as defined by
SBA.
Table 21. Summary of the overall organizational capacity, assessed by the evaluation team and self-assessed for each of the seven quality indicators
Indicator 1 Indicator 2 Indicator 3 Indicator 4 Indicator 5 Indicator
6 Indicator
7
Total 42 44 40 47 39 43 40
43 43 43 44 39 34 44
Quality indicator ratings with a white background were assessed by the evaluation team. Quality indicator ratings with a shaded background are self-assessments by the cluster administrator.
The indicator with the lowest number of points based on the self-ratings is Indicator 5,
(i.e., robustness of performance and quality indicators, data source(s), and data collection
methodology developed by the cluster to assess its progress). For this indicator, there is no gap
between the evaluation team rating and the self-rating, suggesting that this is simply an area
where the 10 clusters are having more difficulties in building capacity or that they have been
unable to focus on this area of capacity over the first year. On the other hand, the indicator with
the highest number of points, based on the self-ratings, is Indicator 4, which also received one of
the highest scores in the evaluation team rating. The next-highest indicator based on the self-
ratings is Indicator 2, which measures the clusters’ demonstrated ability to target small
businesses and other participating organizations (e.g., large businesses, universities, and public
sector agencies) most suitable to its business case and strategic approach. The evaluation team
also gave a high score for Indicator 2, suggesting that the 10 clusters have employed effective
strategies to target, identify, and reach out to relevant small businesses as well as other
participating organizations. This result combined with the significant growth in the number of
small business participants in the clusters, highlighted in Section 5.2, suggests that building a
robust and relevant group of participants was an important focus area of the clusters during the
first year of SBA’s Initiative.
In summary, the quality indicators with the highest score based on both self-ratings and
the evaluation team ratings are tied to service provision (Indicator 4), participant targeting
(Indicator 2), and to the business model selected by each cluster (Indicator 1). The areas covered
by these indicators are those particularly important to embryonic or developing clusters. High

95
scores in these areas reflect the focus, effort, and resources that cluster administrators have
committed to these aspects of cluster capacity. Clusters demonstrated lower scores for quality
indicators in areas such as the implementation of an evaluation process and metrics, the ability
to contact and interact with participants, and participants’ attendance of cluster activities and
events. These areas of capacity are expected to be particularly difficult for clusters to
operationalize in the earlier stages of their development and are expected to receive increased
attention from the 10 clusters in the Regional Cluster Initiative moving forward.

6. Outcomes of the Regional Cluster Initiative
6.1. Overview
The outcomes of the Regional Cluster Initiative can be divided into two categories based
on the time frame of observation: short-term/intermediate outcomes and long-term outcomes.
Short-term/intermediate outcomes are directly and immediately linked to cluster services,
activities, and events, and thus are expected to be observed during the period of SBA’s Initiative
and soon thereafter. They are the outcomes that cluster services directly aim at improving, such
as increased success of small businesses’ obtaining capital and increased exporting by small
businesses. Long-term outcomes, such as increased revenue and total payroll, are expected to be
observed after the short-term/intermediate outcomes.
96
22 Figure 17 below describes the short-
term/intermediate and long-term outcomes evaluated in this study, and shows the linkages
between cluster services and these outcomes as well as the metrics used to assess them. In
particular, it portrays the chain of events that starts with services provided by the cluster to small
businesses. These services are designed to directly influence the short-term/intermediate
outcomes. As the small businesses attain the short-term/intermediate outcomes, long-term
outcomes are expected to begin to materialize at both the business and regional level. Thus, the
achievement of long-term outcomes is partially dependent on the achievement of the short-
term/intermediate outcomes. The subsections below describe in more detail the outcomes of the
Regional Cluster Initiative and the extent to which these outcomes were achieved by the clusters’
small businesses during the first year of their participation in SBA’s Cluster Initiative.
22 The definitions for short-term/intermediate and long-term outcomes correspond, respectively, to the definitions for proximal and distal outcomes that are used in the literature about program evaluation. Proximal and distal outcome definitions refer to the distance in causal chain and time from the program activities (i.e. cluster services and activities). Proximal outcomes are the outcomes that are more immediately and directly linked to program activities and thus are likely to be observed over a shorter time horizon. Proximal outcomes are also expected to lead to distal outcomes, which are the broader and more global outcomes of the program. As such, they are expected to be observed over a longer time horizon. Please see Evaluation: A Systematic Approach (2004) by Rossi, Lipsey and Freeman for more information.

97
Figure 17. The outcomes of the Regional Cluster Initiative
6.2. Short-term/Intermediate Outcomes The short-term/ intermediate outcomes of the Regional Cluster Initiative evaluation are
those that are directly and immediately linked to the services and events offered by the clusters to
their participating small businesses. Therefore, these outcomes are expected to manifest
themselves during the period of SBA’s Initiative or soon thereafter. The short-term/intermediate
outcomes of SBA’s Cluster Initiative pertain to:
· Alliances and collaborations among cluster participants
· Small businesses’ access to capital
· Small businesses’ contract and subcontract awards

· The development of new products and the commercialization of new technologies
· Assistance with small businesses’ marketing strategies
· Assistance with increasing exports
· Assistance regarding intellectual property issues and patent applications
· Two other short-term and intermediate outcomes
6.2.1. Alliances and collaborations among cluster participants
One of the services that clusters provide to small businesses is assistance with forging
alliances and facilitating collaborations among participants. Clusters organize networking events,
promote activities focused on alliance forming, and connect small businesses with large
businesses and/or organizations. The short-term/intermediate outcome associated with these
services and activities is increased alliances among small businesses and other cluster
participants. The Small Business Survey, described in Section 4, collected information on the
following metric to assess this outcome: the number of alliances formed by the cluster
participants.
98
23
The alliances formed between small businesses and other entities can take the form of
project collaboration, joint product development and sales activities, sourcing agreements and
licensing, and joint ventures. Some 70% of the small businesses (124 out of the 177 that replied
to the survey question) indicated having formed at least one alliance as a result of cluster
participation during the first year of the Regional Cluster Initiative (Figure 18). Some 50% of the
businesses (88 out of the 177 that replied to the survey question) reported that the cluster helped
them forge at least two alliances during the previous year.
23 An alliance, within the context of this evaluation, is defined as an ongoing business relationship between two or more independent organizations that strive to achieve common goals. Alliances include a wide spectrum of relationships from information sourcing agreements and licensing to acquisition.

99
Figure 18. Reported number of alliances formed as a result of cluster participation during the first year of SBA’s Initiative
On average, clusters helped small businesses forge 1.7 new strategic alliances during the
first year of SBA’s Initiative. As shown in Figure 19, the average number of new alliances
ranged from 0.4 to 2.6 per cluster. These averages are a conservative estimate of the actual
number of alliances formed because the number of new alliances was top-coded at five (i.e.,
more than five new alliances were included in the same category as five alliances in the survey).
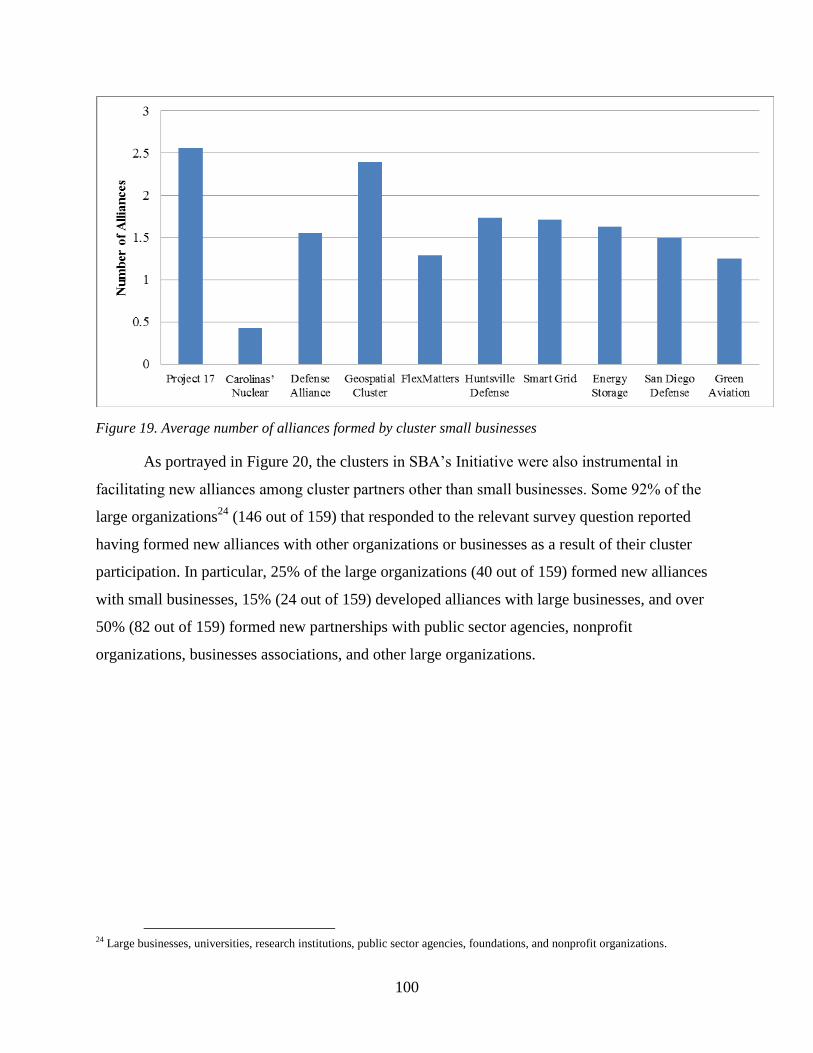
Figure 19. Average number of alliances formed by cluster small businesses
As portrayed in Figure 20, the clusters in SBA’s Initiative were also instrumental in
facilitating new alliances among cluster partners other than small businesses. Some 92% of the
large organizations
100
24 (146 out of 159) that responded to the relevant survey question reported
having formed new alliances with other organizations or businesses as a result of their cluster
participation. In particular, 25% of the large organizations (40 out of 159) formed new alliances
with small businesses, 15% (24 out of 159) developed alliances with large businesses, and over
50% (82 out of 159) formed new partnerships with public sector agencies, nonprofit
organizations, businesses associations, and other large organizations.
24 Large businesses, universities, research institutions, public sector agencies, foundations, and nonprofit organizations.
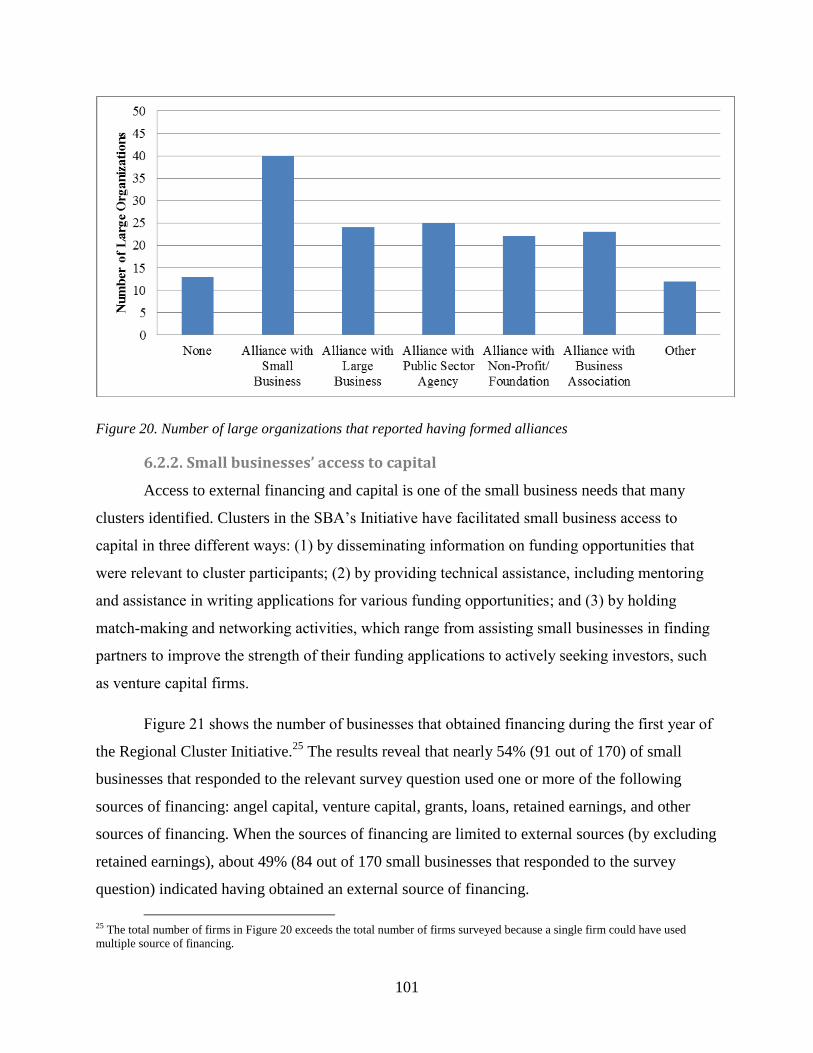
Figure 20. Number of large organizations that reported having formed alliances
6.2.2. Small businesses’ access to capital
Access to external financing and capital is one of the small business needs that many
clusters identified. Clusters in the SBA’s Initiative have facilitated small business access to
capital in three different ways: (1) by disseminating information on funding opportunities that
were relevant to cluster participants; (2) by providing technical assistance, including mentoring
and assistance in writing applications for various funding opportunities; and (3) by holding
match-making and networking activities, which range from assisting small businesses in finding
partners to improve the strength of their funding applications to actively seeking investors, such
as venture capital firms.
Figure 21 shows the number of businesses that obtained financing during the first year of
the Regional Cluster Initiative.
101
25 The results reveal that nearly 54% (91 out of 170) of small
businesses that responded to the relevant survey question used one or more of the following
sources of financing: angel capital, venture capital, grants, loans, retained earnings, and other
sources of financing. When the sources of financing are limited to external sources (by excluding
retained earnings), about 49% (84 out of 170 small businesses that responded to the survey
question) indicated having obtained an external source of financing.
25 The total number of firms in Figure 20 exceeds the total number of firms surveyed because a single firm could have used multiple source of financing.
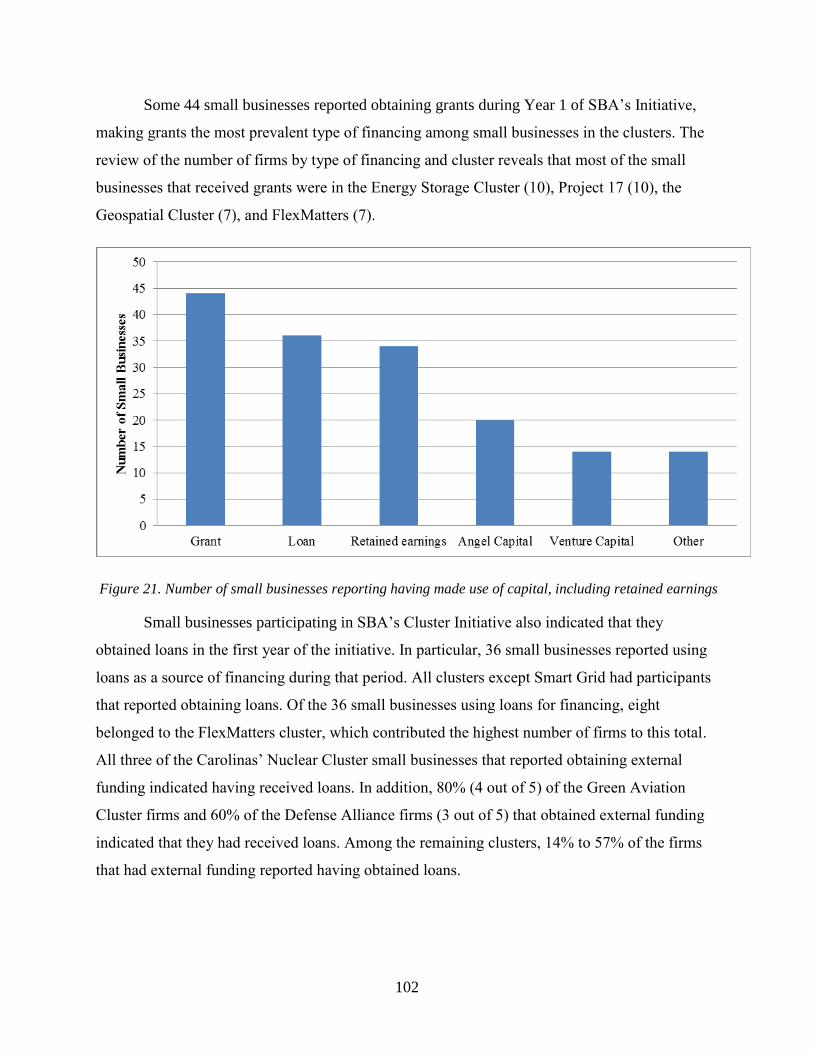
Some 44 small businesses reported obtaining grants during Year 1 of SBA’s Initiative,
making grants the most prevalent type of financing among small businesses in the clusters. The
review of the number of firms by type of financing and cluster reveals that most of the small
businesses that received grants were in the Energy Storage Cluster (10), Project 17 (10), the
Geospatial Cluster (7), and FlexMatters (7).
102
Figure 21. Number of small businesses reporting having made use of capital, including retained earnings
Small businesses participating in SBA’s Cluster Initiative also indicated that they
obtained loans in the first year of the initiative. In particular, 36 small businesses reported using
loans as a source of financing during that period. All clusters except Smart Grid had participants
that reported obtaining loans. Of the 36 small businesses using loans for financing, eight
belonged to the FlexMatters cluster, which contributed the highest number of firms to this total.
All three of the Carolinas’ Nuclear Cluster small businesses that reported obtaining external
funding indicated having received loans. In addition, 80% (4 out of 5) of the Green Aviation
Cluster firms and 60% of the Defense Alliance firms (3 out of 5) that obtained external funding
indicated that they had received loans. Among the remaining clusters, 14% to 57% of the firms
that had external funding reported having obtained loans.

A total of 29 out of 170 small businesses that responded to the survey question made use
of angel or venture capital funds during the first year of the Regional Cluster Initiative.
103
26 These
businesses were dispersed across all clusters, except the Green Aviation Cluster and the
Carolinas’ Nuclear Cluster, which did not have any small businesses that reported having
received angel or venture capital. Of the businesses using angel or venture capital, eight
belonged to Project 17, and seven belonged to FlexMatters. The Energy Storage Cluster
contributed four firms to the total of 29 firms; Smart Grid contributed three firms; the Defense
Alliance, the Geospatial Cluster, and the San Diego Defense Cluster contributed two firms each;
and the Huntsville Defense Cluster contributed one firm. A comparison of these figures to the
total number of firms with external funding reveals the prevalence of angel/venture capital
among small businesses. Three of the four Smart Grid small businesses that obtained external
funding and 8 out of the 13 Project 17 small businesses that obtained external funding indicated
having made use of angel or venture capital. In the remaining clusters, 14% to 44% of the
clusters’ small businesses with external funding reported angel or venture capital as a form of
funding that they used during the first year of SBA’s Initiative.
Figure 22 focuses on the number of small businesses that received external financing
(angel capital, venture capital, loans, grants, and/or other sources) and their distribution across
clusters. The figure reveals that FlexMatters, the Energy Storage Cluster, and Project 17 had the
highest number of small businesses that reported obtaining external financing. The analysis
reveals that 80% of FlexMatters small businesses that responded to the relevant survey question
(16 out of 20) reported having obtained external financing during the first year of the initiative.
Furthermore, 64% of Project 17’s small businesses that responded to the relevant question (14
out of 22) and 61% of Energy Storage Cluster businesses that responded to the relevant question
(14 out of 23) indicated that they received a form of external funding. Smart Grid, the Defense
Alliance, the San Diego Defense Cluster, and the Green Aviation Cluster had 57% (4 out of 7),
38% (5 out of 9), 54% (7 out of 13) and 50% (5 out of 10) of their responding small businesses
obtain external financing, respectively. The corresponding proportions for the Geospatial
26 Figure 20, which presents results disaggregated by the type of funding, reveals that 20 businesses reported having received angel capital and 14 businesses reported having received venture capital. Since five of the businesses received both angel and venture capital, the total number of firms receiving either angel or venture capital is 29.

Cluster, the Huntsville Defense Cluster, and the Carolinas’ Nuclear Cluster are 32% (9 out of 28),
39% (7 out of 18), and 23% (3 out of 13), respectively.
104
Figure 22. Number of small businesses reporting access to external financing (i.e., excluding retained earnings) per cluster
The Small Business Survey also asked small businesses what influence their cluster
participation had on their access to capital during the first year of SBA’s Initiative. Of the 84
small businesses that reported having obtained external financing, nearly 62%, or 52 businesses,
indicated that their participation in the cluster was influential in their access to capital (Figure
23). The levels of influence ranged from slightly influential to extremely influential.
Furthermore, out of the 84 small businesses that reported having obtained external financing, 28
reported that their participation in the cluster was not influential in their access to capital. Four
did not respond to the question on cluster influence. To the extent that applications for financing
may take a long period to be submitted and approved, firms may report a higher influence of
cluster assistance in the coming years, as the firms develop.

105
Figure 23. Reported influence of small business cluster participation on access to capital among businesses that obtained external funding
6.2.3. Small businesses’ contract and subcontract awards
According to the survey results presented in Figure 24, 43% of small businesses that
responded to the question and sought/received services (55 out of 127) reported that they were
awarded a contract or subcontract due to their involvement in the cluster. All clusters had at least
one small business that reported that cluster participation helped it receive a contract or
subcontract during the first year of the initiative. In the Geospatial Cluster, Project 17, and the
Energy Storage Cluster, 61% (14 out of 23), 76% (13 out of 17), and 50% (9 out of 18) of small
businesses that responded to the question and sought/received services, respectively, reported
having received a contract or subcontract as a result of cluster participation. Nearly 38% of small
businesses responding to the survey in the Huntsville Defense Cluster (6 out of 16), 60% in the
Defense Alliance (3 out of 5), 25% in the San Diego Defense Cluster (3 out of 12) and 43% in
the Green Aviation Cluster (3 out of 7) also reported obtaining a contract or subcontract as a
result of their cluster participation. Lastly, some 88 small businesses out of 130 that responded to
the survey question and sought/received services reported having made strides towards obtaining
a contract or subcontract as a result of their cluster participation (Figure C-5, Appendix).
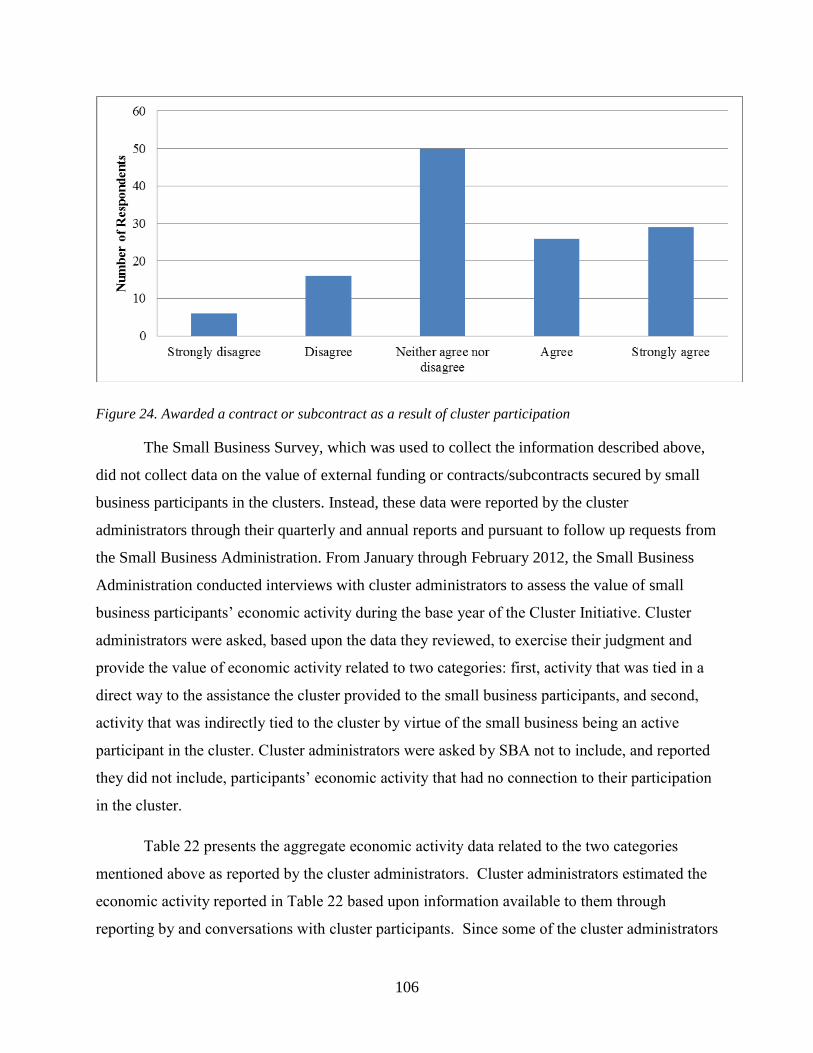
106
Figure 24. Awarded a contract or subcontract as a result of cluster participation
The Small Business Survey, which was used to collect the information described above,
did not collect data on the value of external funding or contracts/subcontracts secured by small
business participants in the clusters. Instead, these data were reported by the cluster
administrators through their quarterly and annual reports and pursuant to follow up requests from
the Small Business Administration. From January through February 2012, the Small Business
Administration conducted interviews with cluster administrators to assess the value of small
business participants’ economic activity during the base year of the Cluster Initiative. Cluster
administrators were asked, based upon the data they reviewed, to exercise their judgment and
provide the value of economic activity related to two categories: first, activity that was tied in a
direct way to the assistance the cluster provided to the small business participants, and second,
activity that was indirectly tied to the cluster by virtue of the small business being an active
participant in the cluster. Cluster administrators were asked by SBA not to include, and reported
they did not include, participants’ economic activity that had no connection to their participation
in the cluster.
Table 22 presents the aggregate economic activity data related to the two categories
mentioned above as reported by the cluster administrators. Cluster administrators estimated the
economic activity reported in Table 22 based upon information available to them through
reporting by and conversations with cluster participants. Since some of the cluster administrators

107
did not provide details or dollar amounts about contract/subcontract values or external sources of
funding, the table is not comprehensive but provides lower-bound estimates. These results show
that while private funding sources and loans accounted for most of the external funding obtained
by the small business participants, SBIR/STTR awards were also an important revenue source
for some of the cluster participants. The results also show that the small business participants
obtained contracts or subcontracts totaling over $217,000,000.
Table 22: Value of external funding and contracts/subcontracts by small business participants
during the first year of the SBA Regional Cluster Initiative, as reported by cluster
administrators.
Contract/ subcontract
Angel capital, venture capital, other private
funding, and loans SBIR/STTR Grants Cluster total
All clusters $217,852,252 $47,966,760 $6,557,966 $1,700,000 $274,076,978
Source: Cluster quarterly and annual reports submitted to the U.S. Small Business Administration (SBA) and
telephone interviews with cluster administrators administered by SBA officials.
6.2.4. Development of new products and commercialization of new technology
The clusters in the SBA’s Initiative have also assisted small businesses with challenges
they may face when developing new products and/or commercializing new technology. The
Small Business Survey collected information on the following two metrics to assess the
influence of cluster participation on the small businesses’ product development and
commercialization activities:
· Number of small businesses that developed new products or services as a result of
their participating in the cluster
· Number of small businesses that achieved commercialization of new technology
as a result of cluster participation
Figure 25 reveals that 69% of small businesses that responded to the question and sought
or received the services (86 out of 125) indicated that they developed new products or services as
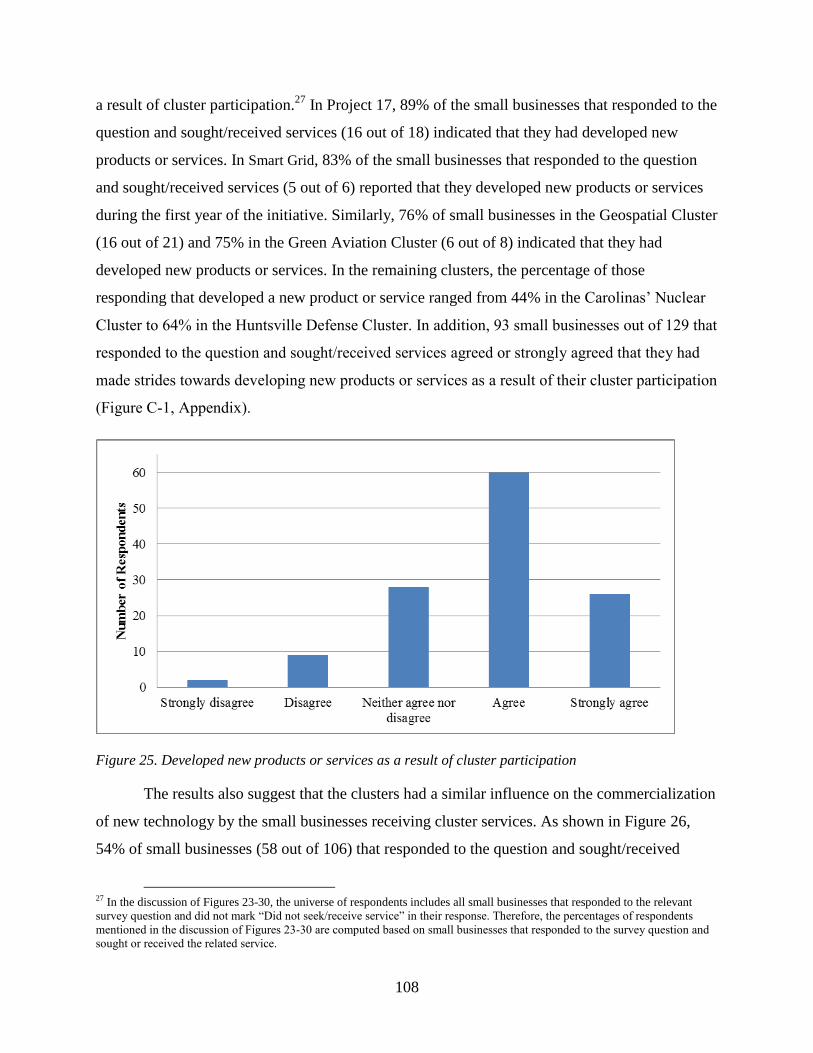
a result of cluster participation.
108
27 In Project 17, 89% of the small businesses that responded to the
question and sought/received services (16 out of 18) indicated that they had developed new
products or services. In Smart Grid, 83% of the small businesses that responded to the question
and sought/received services (5 out of 6) reported that they developed new products or services
during the first year of the initiative. Similarly, 76% of small businesses in the Geospatial Cluster
(16 out of 21) and 75% in the Green Aviation Cluster (6 out of 8) indicated that they had
developed new products or services. In the remaining clusters, the percentage of those
responding that developed a new product or service ranged from 44% in the Carolinas’ Nuclear
Cluster to 64% in the Huntsville Defense Cluster. In addition, 93 small businesses out of 129 that
responded to the question and sought/received services agreed or strongly agreed that they had
made strides towards developing new products or services as a result of their cluster participation
(Figure C-1, Appendix).
Figure 25. Developed new products or services as a result of cluster participation
The results also suggest that the clusters had a similar influence on the commercialization
of new technology by the small businesses receiving cluster services. As shown in Figure 26,
54% of small businesses (58 out of 106) that responded to the question and sought/received
27 In the discussion of Figures 23-30, the universe of respondents includes all small businesses that responded to the relevant survey question and did not mark “Did not seek/receive service” in their response. Therefore, the percentages of respondents mentioned in the discussion of Figures 23-30 are computed based on small businesses that responded to the survey question and sought or received the related service.

services indicated that their cluster participation led them to commercialize new technology
during the first year of the SBA Initiative. Grouping small businesses by cluster, Project 17, the
Geospatial Cluster, FlexMatters, the Energy Storage Cluster, and the San Diego Defense Cluster
have relatively high numbers of small businesses indicating success in commercialization of new
technology. Over 73% of the small businesses in Project 17 that responded to the question (11
out of 15) and sought/received services indicated that they commercialized new technology as a
result of cluster assistance during the first year of the initiative. Similarly, 47% of small
businesses in the Energy Storage Cluster that responded to the question and sought/received
services (7 out of 15), 67% of those in the San Diego Defense Cluster (8 out of 12), 57% (8 out
of 14) in FlexMatters (57 %), and 40% (8 out of 20) in the Geospatial Cluster indicated that they
commercialized new technology as a result of cluster assistance. Some 71% of the Smart Grid
small businesses that responded to the survey and sought/received services (5 out of 7) indicated
that they had commercialized new technology during the first year of SBA’s Cluster Initiative, as
did 60% of Defense Alliance small businesses (3 out of 5), 60% of the Huntsville Defense
Cluster small businesses (6 out of 10), and 50% of Green Aviation Cluster small businesses (2
out of 4). In addition, 72 out of the 110 small businesses that responded to the question and
sought/received services reported having made strides towards commercialization of new
technology as a result of their cluster participation (Figure C-2, Appendix).
109
Figure 26. Commercialized new technology as a result of cluster participation
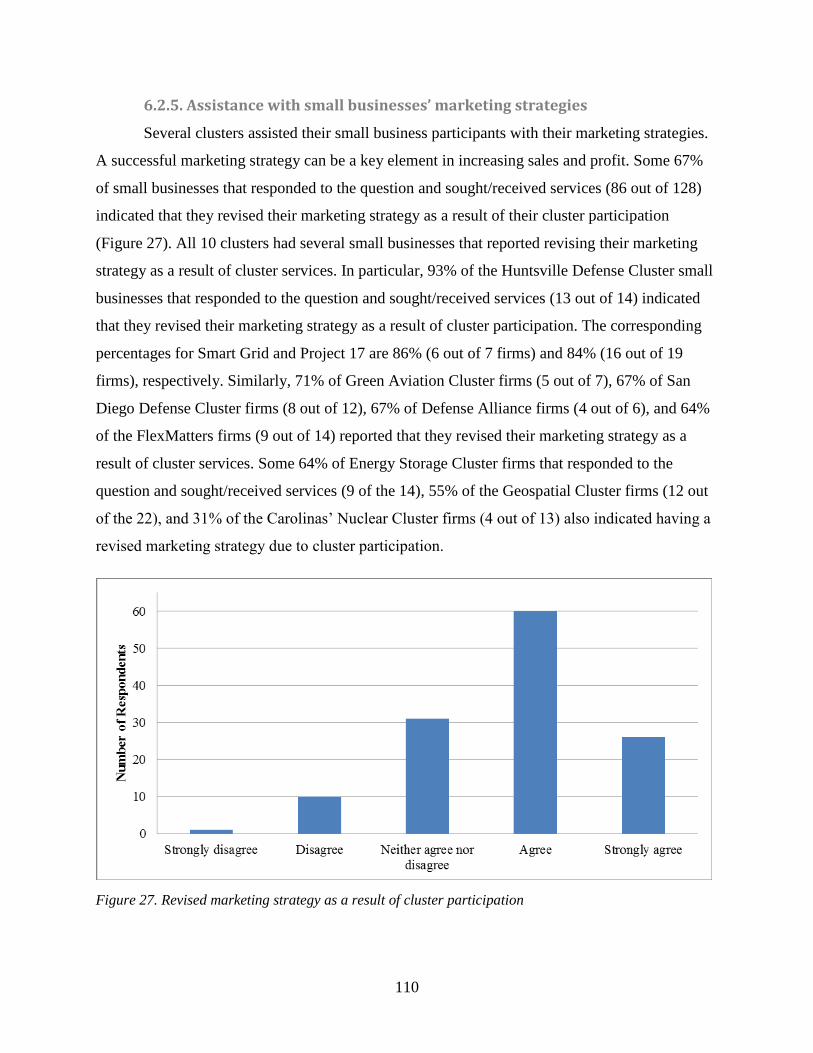
110
6.2.5. Assistance with small businesses’ marketing strategies
Several clusters assisted their small business participants with their marketing strategies.
A successful marketing strategy can be a key element in increasing sales and profit. Some 67%
of small businesses that responded to the question and sought/received services (86 out of 128)
indicated that they revised their marketing strategy as a result of their cluster participation
(Figure 27). All 10 clusters had several small businesses that reported revising their marketing
strategy as a result of cluster services. In particular, 93% of the Huntsville Defense Cluster small
businesses that responded to the question and sought/received services (13 out of 14) indicated
that they revised their marketing strategy as a result of cluster participation. The corresponding
percentages for Smart Grid and Project 17 are 86% (6 out of 7 firms) and 84% (16 out of 19
firms), respectively. Similarly, 71% of Green Aviation Cluster firms (5 out of 7), 67% of San
Diego Defense Cluster firms (8 out of 12), 67% of Defense Alliance firms (4 out of 6), and 64%
of the FlexMatters firms (9 out of 14) reported that they revised their marketing strategy as a
result of cluster services. Some 64% of Energy Storage Cluster firms that responded to the
question and sought/received services (9 of the 14), 55% of the Geospatial Cluster firms (12 out
of the 22), and 31% of the Carolinas’ Nuclear Cluster firms (4 out of 13) also indicated having a
revised marketing strategy due to cluster participation.
Figure 27. Revised marketing strategy as a result of cluster participation
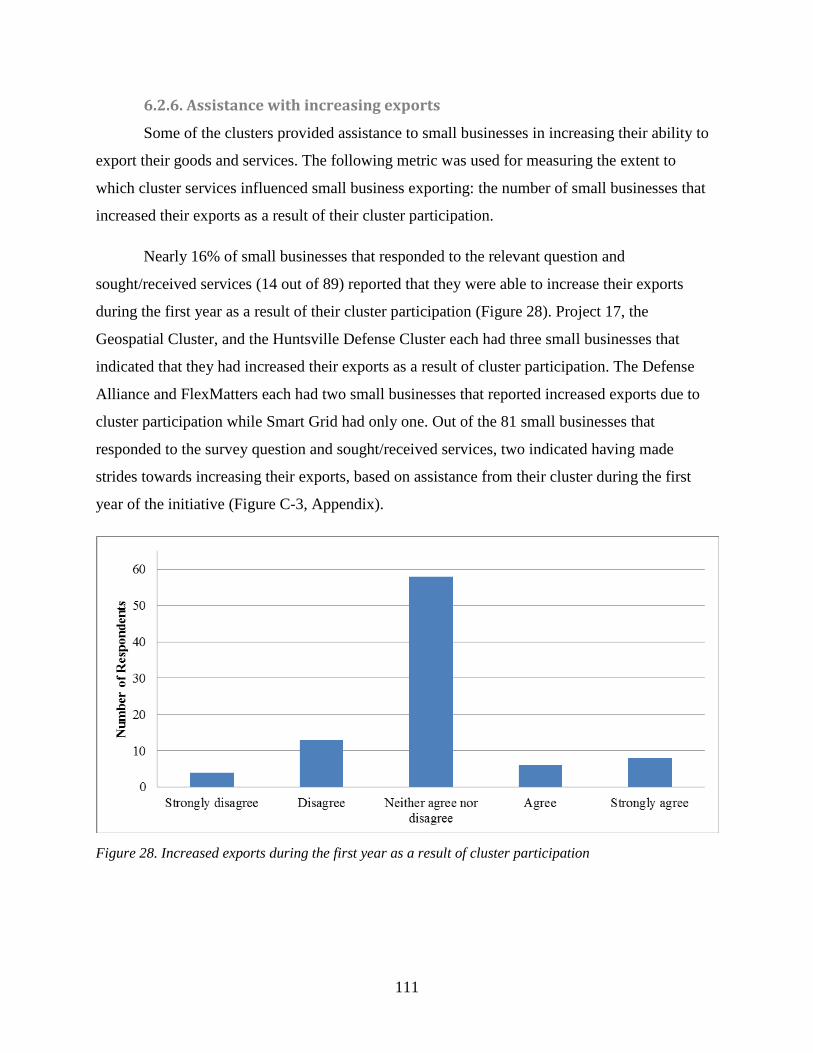
6.2.6. Assistance with increasing exports
Some of the clusters provided assistance to small businesses in increasing their ability to
export their goods and services. The following metric was used for measuring the extent to
which cluster services influenced small business exporting: the number of small businesses that
increased their exports as a result of their cluster participation.
Nearly 16% of small businesses that responded to the relevant question and
sought/received services (14 out of 89) reported that they were able to increase their exports
during the first year as a result of their cluster participation (Figure 28). Project 17, the
Geospatial Cluster, and the Huntsville Defense Cluster each had three small businesses that
indicated that they had increased their exports as a result of cluster participation. The Defense
Alliance and FlexMatters each had two small businesses that reported increased exports due to
cluster participation while Smart Grid had only one. Out of the 81 small businesses that
responded to the survey question and sought/received services, two indicated having made
strides towards increasing their exports, based on assistance from their cluster during the first
year of the initiative (Figure C-3, Appendix).
111
Figure 28. Increased exports during the first year as a result of cluster participation

112
6.2.7. Assistance regarding intellectual property issues and patent
applications
Clusters identified issues regarding intellectual property and patents as an area for
providing services to small businesses. This aspect of business operations can be especially
important for industries involving new and innovative technologies. As shown in Figure 29, 22%
of small businesses that responded to the question and sought/received services (17 out of 76)
indicated that their cluster participation contributed to their application for patents. Among the
10 clusters, Project 17 had the highest number of small businesses, eight firms, which reported
having pending patent applications as a result of assistance from the cluster. The San Diego
Defense Cluster and the Defense Alliance also had three and two small businesses, respectively,
that reported having pending patent applications as a result of their cluster participation. The
Geospatial Cluster, FlexMatters, the Huntsville Defense Cluster, and the Energy Storage Cluster
each had one firm that had a patent application pending during the first year of SBA’s Cluster
Initiative. In addition, 19 small businesses out of the 75 that responded to the question and
sought/received services reported having taken steps to apply for patents during Year 1 of the
Regional Cluster Initiative as a result of having participated in the cluster (Figure C-4,
Appendix).
Figure 29. Applied for patent(s) as a result of cluster participation
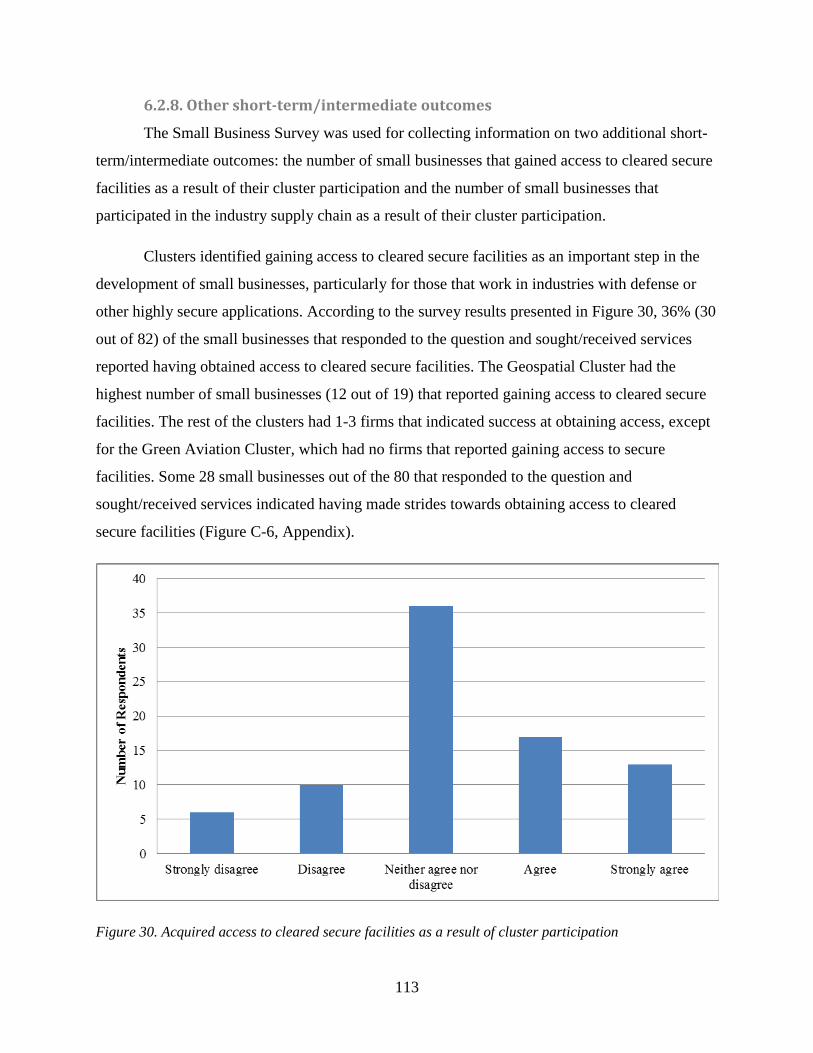
6.2.8. Other short-term/intermediate outcomes
The Small Business Survey was used for collecting information on two additional short-
term/intermediate outcomes: the number of small businesses that gained access to cleared secure
facilities as a result of their cluster participation and the number of small businesses that
participated in the industry supply chain as a result of their cluster participation.
Clusters identified gaining access to cleared secure facilities as an important step in the
development of small businesses, particularly for those that work in industries with defense or
other highly secure applications. According to the survey results presented in Figure 30, 36% (30
out of 82) of the small businesses that responded to the question and sought/received services
reported having obtained access to cleared secure facilities. The Geospatial Cluster had the
highest number of small businesses (12 out of 19) that reported gaining access to cleared secure
facilities. The rest of the clusters had 1-3 firms that indicated success at obtaining access, except
for the Green Aviation Cluster, which had no firms that reported gaining access to secure
facilities. Some 28 small businesses out of the 80 that responded to the question and
sought/received services indicated having made strides towards obtaining access to cleared
secure facilities (Figure C-6, Appendix).
113
Figure 30. Acquired access to cleared secure facilities as a result of cluster participation
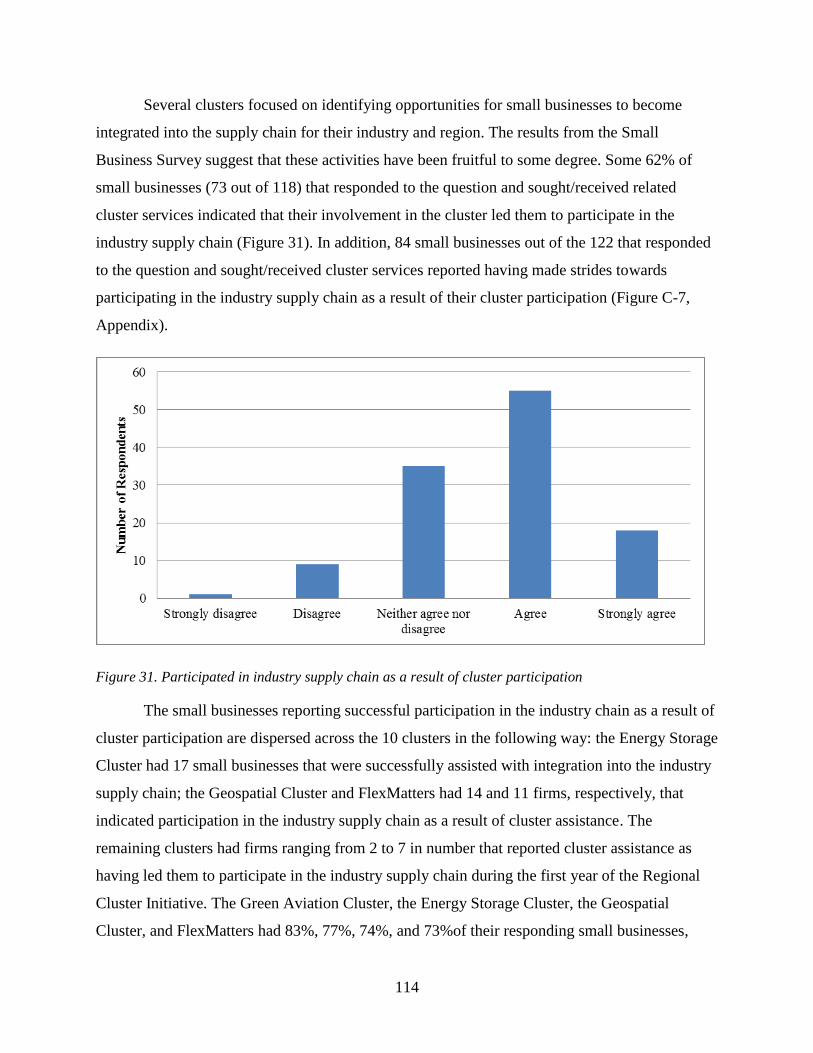
Several clusters focused on identifying opportunities for small businesses to become
integrated into the supply chain for their industry and region. The results from the Small
Business Survey suggest that these activities have been fruitful to some degree. Some 62% of
small businesses (73 out of 118) that responded to the question and sought/received related
cluster services indicated that their involvement in the cluster led them to participate in the
industry supply chain (Figure 31). In addition, 84 small businesses out of the 122 that responded
to the question and sought/received cluster services reported having made strides towards
participating in the industry supply chain as a result of their cluster participation (Figure C-7,
Appendix).
114
Figure 31. Participated in industry supply chain as a result of cluster participation
The small businesses reporting successful participation in the industry chain as a result of
cluster participation are dispersed across the 10 clusters in the following way: the Energy Storage
Cluster had 17 small businesses that were successfully assisted with integration into the industry
supply chain; the Geospatial Cluster and FlexMatters had 14 and 11 firms, respectively, that
indicated participation in the industry supply chain as a result of cluster assistance. The
remaining clusters had firms ranging from 2 to 7 in number that reported cluster assistance as
having led them to participate in the industry supply chain during the first year of the Regional
Cluster Initiative. The Green Aviation Cluster, the Energy Storage Cluster, the Geospatial
Cluster, and FlexMatters had 83%, 77%, 74%, and 73%of their responding small businesses,

respectively, that indicated having participated in the industry supply chain during the first year
of the Regional Cluster Initiative. The remaining clusters ranged from 27% (Carolinas’ Nuclear
Cluster) to 60% (Defense Alliance) in the portion of their responding small businesses that
participated in the industry supply chain as a result of cluster participation.
6.2.9. Summary of short-term/intermediate outcomes
Table 23 below summarizes the data collected on short-term/intermediate outcomes and
the extent to which the small businesses participating in the clusters indicated that outcomes had
been achieved. Column (A) lists the statements that were presented to the respondents in the
Small Business Survey (in paraphrased and shortened form); column (B) contains the number of
small businesses that indicated agreement with the corresponding statements; column (C) shows
the total number of small businesses that did not check the “did not seek/receive services” box
and had a non-missing value for the perceived level of cluster influence on their outcomes.
Column (D) presents the percentage of firms that indicated agreement with the statement based
on the numbers in columns (B) and (C).
The results in Table 23 suggest that clusters were most influential in assisting small
businesses form alliances (e.g., project collaboration, joint development and sales, informal
sourcing agreements, licensing, or joint venture). This result underscores the finding in the
literature about clusters, which refers to networking and alliance building as one of the primary
benefits of clusters to their regional economies. According to the results in Table 23, clusters
were also influential in assisting small businesses with the development or commercialization of
new technology. Some 69% of small businesses that responded to the question and sought/
received services indicated that they developed new products or services as a result of their
participation in the cluster, while 54% of small businesses indicated that they commercialized
new technology. The results also suggest that clusters were influential in assisting firms in
revising their marketing strategies, helping them find opportunities to participate in the industry
supply chain, and assisting them in obtaining external financing.
On the other hand, based on the results in Table 23, clusters were relatively less
influential in assisting firms with increasing their exports and applying for patents over Year 1 of
the SBA’s Cluster Initiative. Of the small businesses that responded to the question and sought/
115

116
received services, 16% indicated that they increased their exports and 22% applied for patents as
a result of their participation in the cluster.
Table 23. Percentage of small businesses that indicated the attainment of short-term/intermediate outcomes as a result of participation in the cluster
Outcome
(A)
Number of small businesses that
reported attainment of
outcome
(B)
Total number of small businesses that reported having sought/received
related services and responded to the
question on outcome
(C)
Percentage of small businesses
that reported outcome
(D)
Formed alliances as a result of participation in the cluster 124 177 70%
Developed new products or services as a result of participation in the cluster
86 125 69%
Revised marketing strategy as a result of participation in the cluster
86 128 67%
Participated in industry supply chain as a result of participation in the cluster
73 118 62%
Obtained external financing 84 170 49%
Cluster was influential in obtaining external financing among those that obtained external financing
52 84 62%
Commercialized new technology as a result of participation in the cluster
58 106 54%
Received contract or subcontract as a result of participation in the cluster
55 127 43%
Obtained access to cleared secure facilities as a result of participation in the cluster
30 82 37%
117
Outcome
(A)
Number of small businesses that
reported attainment of
outcome
(B)
Total number of small businesses that reported having sought/received
related services and responded to the
question on outcome
(C)
Percentage of small businesses
that reported outcome
(D)
Applied for patents as a result of participation in the cluster 17 76 22%
Increased exports as a result of participation in the cluster 14 89 16%
6.3. Long-term Outcomes The long-term outcomes of the Regional Cluster Initiative evaluation are those that are
expected to be observed as the small businesses attain the short-term/intermediate outcomes.
Thus, the achievement of long-term outcomes is partially dependent on the achievement of the
short-term/intermediate outcomes. The long-term outcomes of SBA’s Cluster Initiative pertain
to:
· The number of employees of small businesses
· The revenue of small businesses
· The total payroll of small businesses
· The number of new businesses created
6.3.1. The number of employees of small businesses
One of the primary long-term outcomes of the Regional Cluster Initiative is increased
employment within small businesses. Increases in employment not only signal the growth of
small businesses but also suggests job growth in regional economies. During the first year of
SBA’s Initiative, the average full-time employment in the small businesses that participated in
the clusters increased by 7.6%, while average employment, including both full-time and part-
time employees, increased by 11.2%.
Figure 32 presents the baseline distribution of full-time employment in the 10 clusters’
small businesses in the beginning of the Regional Cluster Initiative. The average small business
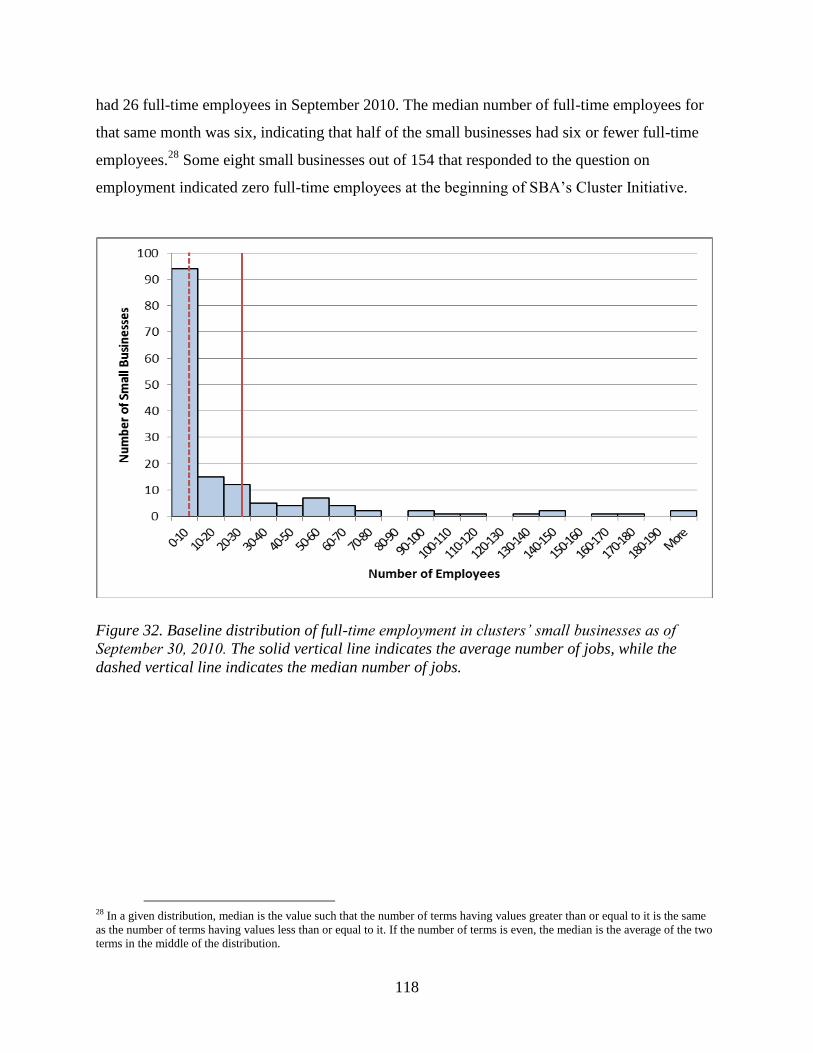
had 26 full-time employees in September 2010. The median number of full-time employees for
that same month was six, indicating that half of the small businesses had six or fewer full-time
employees.
118
28 Some eight small businesses out of 154 that responded to the question on
employment indicated zero full-time employees at the beginning of SBA’s Cluster Initiative.
Figure 32. Baseline distribution of full-time employment in clusters’ small businesses as of September 30, 2010. The solid vertical line indicates the average number of jobs, while the dashed vertical line indicates the median number of jobs.
28 In a given distribution, median is the value such that the number of terms having values greater than or equal to it is the same as the number of terms having values less than or equal to it. If the number of terms is even, the median is the average of the two terms in the middle of the distribution.

119
Figure 33. Baseline distribution of full-time employment in clusters’ small businesses as of September 30, 2010, among businesses with fewer than 10 employees. The dashed vertical line indicates the median number of jobs.
The size of small businesses in the beginning of the Regional Cluster Initiative varied
across the 10 clusters. The average number of full-time employees of the clusters’ small business
participants ranged from 2.5 in the Smart Grid Cluster to 55.4 in the Huntsville Defense Cluster
in the beginning of SBA’s Initiative (Table 24). The median number of full-time employees was
smaller than the average in all clusters, indicating that more than half of the small businesses had
fewer full-time employees than the average.
Table 24 also presents the change in the average and median over the first year of SBA’s
Cluster Initiative. The small businesses reported in the table are those that responded to the
survey question on full-time employees. Overall, the average number of full-time employees
increased by 7.6%, from 26.4 to 28.4, during the first year of SBA’s Initiative. Median full-time
employment also increased from 6 to 7 employees (16.7% increase), providing evidence that the
increase in full-time employees is not only limited to small businesses with high employment but
is experienced across the distribution of full-time employment.
The average number of full-time employees per small business increased in most of the
clusters, except for the Defense Alliance, where a slight decrease was observed. The greatest
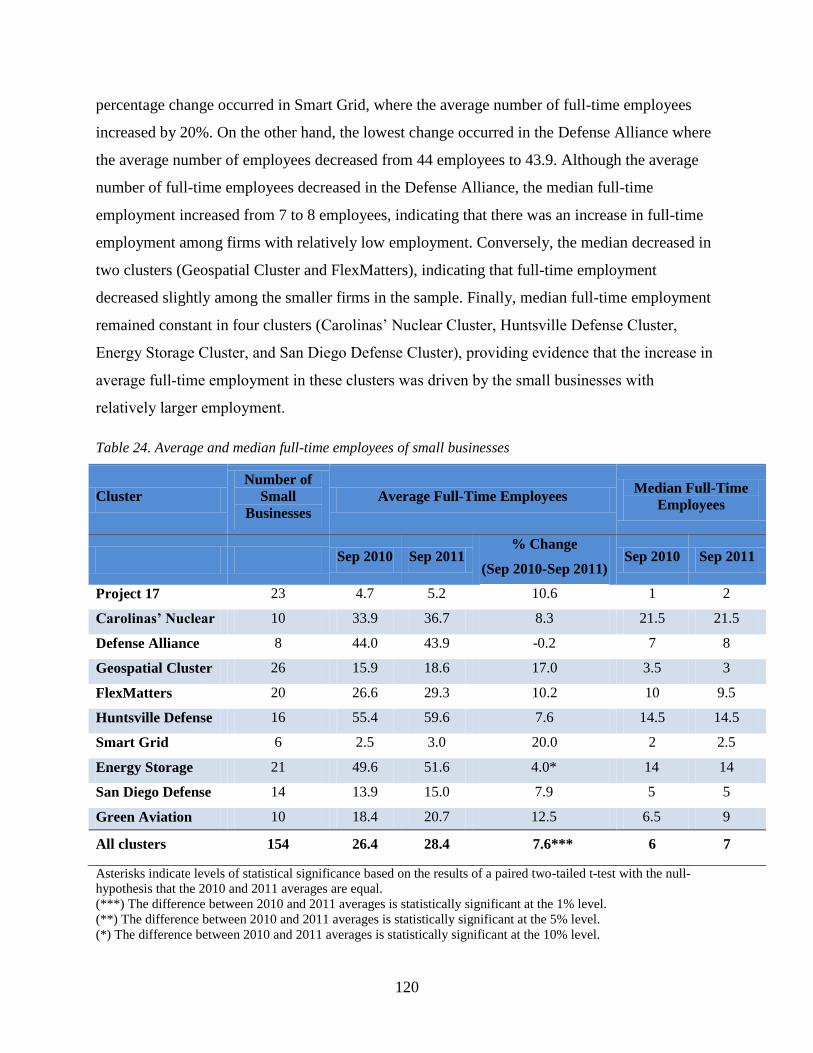
120
percentage change occurred in Smart Grid, where the average number of full-time employees
increased by 20%. On the other hand, the lowest change occurred in the Defense Alliance where
the average number of employees decreased from 44 employees to 43.9. Although the average
number of full-time employees decreased in the Defense Alliance, the median full-time
employment increased from 7 to 8 employees, indicating that there was an increase in full-time
employment among firms with relatively low employment. Conversely, the median decreased in
two clusters (Geospatial Cluster and FlexMatters), indicating that full-time employment
decreased slightly among the smaller firms in the sample. Finally, median full-time employment
remained constant in four clusters (Carolinas’ Nuclear Cluster, Huntsville Defense Cluster,
Energy Storage Cluster, and San Diego Defense Cluster), providing evidence that the increase in
average full-time employment in these clusters was driven by the small businesses with
relatively larger employment.
Table 24. Average and median full-time employees of small businesses
Cluster Number of
Small Businesses
Average Full-Time Employees Median Full-Time Employees
Sep 2010 Sep 2011 % Change
(Sep 2010-Sep 2011) Sep 2010 Sep 2011
Project 17 23 4.7 5.2 10.6 1 2
Carolinas’ Nuclear 10 33.9 36.7 8.3 21.5 21.5
Defense Alliance 8 44.0 43.9 -0.2 7 8
Geospatial Cluster 26 15.9 18.6 17.0 3.5 3
FlexMatters 20 26.6 29.3 10.2 10 9.5
Huntsville Defense 16 55.4 59.6 7.6 14.5 14.5
Smart Grid 6 2.5 3.0 20.0 2 2.5
Energy Storage 21 49.6 51.6 4.0* 14 14
San Diego Defense 14 13.9 15.0 7.9 5 5
Green Aviation 10 18.4 20.7 12.5 6.5 9
All clusters 154 26.4 28.4 ***7.6 6 7
Asterisks indicate levels of statistical significance based on the results of a paired two-tailed t-test with the null-hypothesis that the 2010 and 2011 averages are equal. ***( ) The difference between 2010 and 2011 averages is statistically significant at the 1% level.
(**) The difference between 2010 and 2011 averages is statistically significant at the 5% level. (*) The difference between 2010 and 2011 averages is statistically significant at the 10% level.
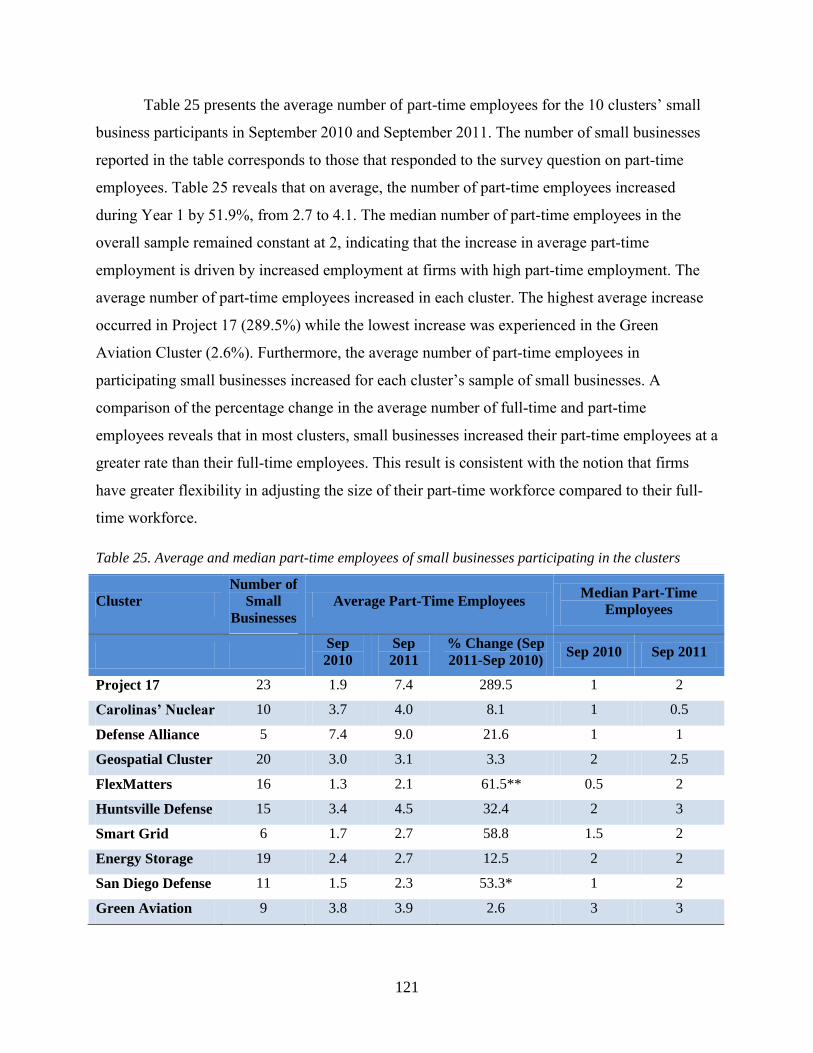
121
Table 25 presents the average number of part-time employees for the 10 clusters’ small
business participants in September 2010 and September 2011. The number of small businesses
reported in the table corresponds to those that responded to the survey question on part-time
employees. Table 25 reveals that on average, the number of part-time employees increased
during Year 1 by 51.9%, from 2.7 to 4.1. The median number of part-time employees in the
overall sample remained constant at 2, indicating that the increase in average part-time
employment is driven by increased employment at firms with high part-time employment. The
average number of part-time employees increased in each cluster. The highest average increase
occurred in Project 17 (289.5%) while the lowest increase was experienced in the Green
Aviation Cluster (2.6%). Furthermore, the average number of part-time employees in
participating small businesses increased for each cluster’s sample of small businesses. A
comparison of the percentage change in the average number of full-time and part-time
employees reveals that in most clusters, small businesses increased their part-time employees at a
greater rate than their full-time employees. This result is consistent with the notion that firms
have greater flexibility in adjusting the size of their part-time workforce compared to their full-
time workforce.
Table 25. Average and median part-time employees of small businesses participating in the clusters
Cluster Number of
Small Businesses
Average Part-Time Employees Median Part-Time Employees
Sep 2010
Sep 2011
% Change (Sep 2011-Sep 2010) Sep 2010 Sep 2011
Project 17 23 1.9 7.4 289.5 1 2
Carolinas’ Nuclear 10 3.7 4.0 8.1 1 0.5
Defense Alliance 5 7.4 9.0 21.6 1 1
Geospatial Cluster 20 3.0 3.1 3.3 2 2.5
FlexMatters 16 1.3 2.1 61.5** 0.5 2
Huntsville Defense 15 3.4 4.5 32.4 2 3
Smart Grid 6 1.7 2.7 58.8 1.5 2
Energy Storage 19 2.4 2.7 12.5 2 2
San Diego Defense 11 1.5 2.3 53.3* 1 2
Green Aviation 9 3.8 3.9 2.6 3 3
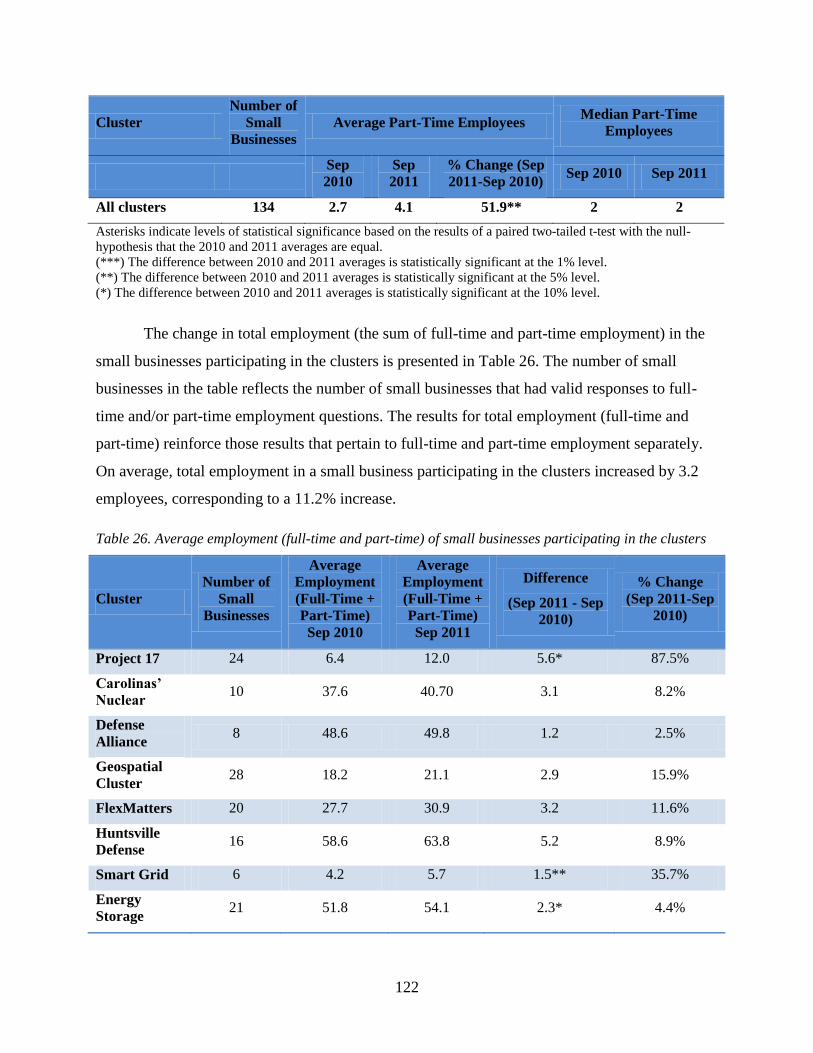
122
ClusterNumber of
Small Businesses
Average Part-Time EmployeesMedian Part-Time
Employees
Sep 2010
Sep 2011
% Change (Sep 2011-Sep 2010)
Sep 2010 Sep 2011
All clusters 134 2.7 4.1 51.9** 2 2
Asterisks indicate levels of statistical significance based on the results of a paired two-tailed t-test with the null-hypothesis that the 2010 and 2011 averages are equal. ***( ) The difference between 2010 and 2011 averages is statistically significant at the 1% level.
(**) The difference between 2010 and 2011 averages is statistically significant at the 5% level. (*) The difference between 2010 and 2011 averages is statistically significant at the 10% level.
The change in total employment (the sum of full-time and part-time employment) in the
small businesses participating in the clusters is presented in Table 26. The number of small
businesses in the table reflects the number of small businesses that had valid responses to full-
time and/or part-time employment questions. The results for total employment (full-time and
part-time) reinforce those results that pertain to full-time and part-time employment separately.
On average, total employment in a small business participating in the clusters increased by 3.2
employees, corresponding to a 11.2% increase.
Table 26. Average employment (full-time and part-time) of small businesses participating in the clusters
Cluster Number of
Small Businesses
Average Employment (Full-Time + Part-Time) Sep 2010
Average Employment (Full-Time + Part-Time) Sep 2011
Difference
(Sep 2011 - Sep 2010)
% Change (Sep 2011-Sep
2010)
Project 17 24 6.4 12.0 5.6* 87.5%
Carolinas’ Nuclear 10 37.6 40.70 3.1 8.2%
Defense Alliance 8 48.6 49.8 1.2 2.5%
Geospatial Cluster 28 18.2 21.1 2.9 15.9%
FlexMatters 20 27.7 30.9 3.2 11.6%
Huntsville Defense 16 58.6 63.8 5.2 8.9%
Smart Grid 6 4.2 5.7 1.5** 35.7%
Energy Storage 21 51.8 54.1 2.3* 4.4%

123
ClusterNumber of
Small Businesses
Average Employment (Full-Time + Part-Time) Sep 2010
Average Employment (Full-Time + Part-Time) Sep 2011
Difference
(Sep 2011 - Sep 2010)
% Change (Sep 2011-Sep
2010)
San Diego Defense 14 15.4 16.8 1.4 9.1%
Green Aviation 10 21.8 24.2 2.4 11.0%
All clusters 155 28.6 31.8 ***3.2 11.2%
Asterisks indicate levels of statistical significance based on the results of a paired two-tailed t-test with the null-hypothesis that the 2010 and 2011 averages are equal. ***( ) The difference between 2010 and 2011 averages is statistically significant at the 1% level.
(**) The difference between 2010 and 2011 averages is statistically significant at the 5% level. (*) The difference between 2010 and 2011 averages is statistically significant at the 10% level.
Review of the results presented above prompts a key question: how does the change in
employment experienced by the clusters’ small business participants compare to the change in
employment observed in firms with similar geographic and industrial scope? Two data sources
were used to compute comparison statistics on employment: the Quarterly Census of
Employment and Wages (QCEW) and the Dun & Bradstreet (D&B) Database. The employment
statistics computed from both data sources correspond to total employment—the sum of full-time
and part-time employees—per firm. Therefore, total employment statistics are compared across
the following three samples: a sample of firms participating in the clusters, a QCEW sample, and
a D&B sample. 29
The QCEW sample includes firms that are located in the same counties and have the
same industry codes as the clusters’ small businesses. The QCEW sample has two limitations.
First, it is not restricted to small businesses but rather consists of a full range of firm sizes.
Second, it includes firms’ total employment over the period of March 2010 to March 2011,
which is prior to the analysis period of September 2010 to September 2011. The D&B sample,
on the other hand, is restricted to include small businesses that are located in similar geographic
and industrial scope. Still, it provides employment data from December 2007 and December
2010, so the annual percentage change in average employment is calculated based on the 3-year
trend in employment growth. The difference between the timeframes of the D&B sample and the
29 Please see Appendix D for a detailed description of how the comparison statistics are computed using QCEW and D&B data.
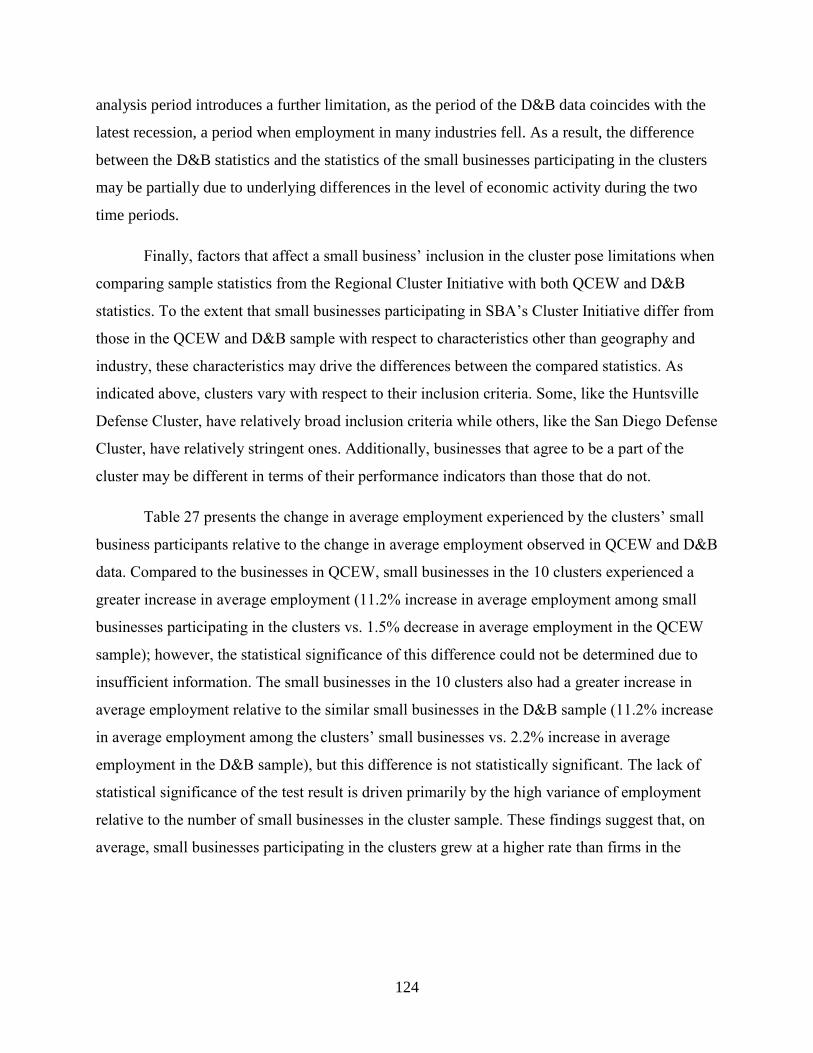
analysis period introduces a further limitation, as the period of the D&B data coincides with the
latest recession, a period when employment in many industries fell. As a result, the difference
between the D&B statistics and the statistics of the small businesses participating in the clusters
may be partially due to underlying differences in the level of economic activity during the two
time periods.
Finally, factors that affect a small business’ inclusion in the cluster pose limitations when
comparing sample statistics from the Regional Cluster Initiative with both QCEW and D&B
statistics. To the extent that small businesses participating in SBA’s Cluster Initiative differ from
those in the QCEW and D&B sample with respect to characteristics other than geography and
industry, these characteristics may drive the differences between the compared statistics. As
indicated above, clusters vary with respect to their inclusion criteria. Some, like the Huntsville
Defense Cluster, have relatively broad inclusion criteria while others, like the San Diego Defense
Cluster, have relatively stringent ones. Additionally, businesses that agree to be a part of the
cluster may be different in terms of their performance indicators than those that do not.
Table 27 presents the change in average employment experienced by the clusters’ small
business participants relative to the change in average employment observed in QCEW and D&B
data. Compared to the businesses in QCEW, small businesses in the 10 clusters experienced a
greater increase in average employment (11.2% increase in average employment among small
businesses participating in the clusters vs. 1.5% decrease in average employment in the QCEW
sample); however, the statistical significance of this difference could not be determined due to
insufficient information. The small businesses in the 10 clusters also had a greater increase in
average employment relative to the similar small businesses in the D&B sample (11.2% increase
in average employment among the clusters’ small businesses vs. 2.2% increase in average
employment in the D&B sample), but this difference is not statistically significant. The lack of
statistical significance of the test result is driven primarily by the high variance of employment
relative to the number of small businesses in the cluster sample. These findings suggest that, on
average, small businesses participating in the clusters grew at a higher rate than firms in the
124
QCEW and D&B data. As discussed in Appendix D, the limitations of these comparisons have to
be considered when interpreting the statistics.
125
30
Table 27. Comparison of percentage change in average change in employment (full-time + part-time) across three samples: a cluster sample, a QCEW sample, and a D&B sample
Cluster
% Change in Average
Employment in the Regional
Cluster Initiative Sample
% Change in Average
Employment in the
QCEW Sample
% Change in Average
Employment in the D&B
Sample
Percentage Point Difference
(Regional Cluster Initiative–QCEW)a
Percentage Point Difference
(Regional Cluster Initiative-D&B)b
Project 17 87.5% -8.2% 1.8% 95.9 85.9
Carolinas’ Nuclear
8.2% 3.3% 0.5% 4.9 7.7
Defense Alliance
2.5% -4.7% 1.0% 7.0 1.3
Geospatial Cluster
15.9% 1.7% 2.3% 14.1 13.5
FlexMatters 11.6% -3.6% 0.4% 15.4 11.4
Huntsville Defense
8.9% 2.4% 4% 6.3 4.7
Smart Grid 35.7% 2.6% 5.2% 33.4 30.8
Energy Storage
4.4% 2.8% 2.1% 1.4 2.1
San Diego Defense
9.1% -4.5% 5.7% 13.8 3.6
Green Aviation
11.0% -5.0% 0.3% 16.0 10.7
30 In particular, the difference between the average statistics of the 10 clusters’ small businesses and the comparison samples may be driven by some of the key differences in sample characteristics. For example, the higher percentage change in average employment among clusters’ small businesses relative to the one observed in the QCEW sample may be due to the QCEW statistics being based on employment at both small and large firms. To the extent that employment growth is higher in small firms, the percentage change in employment in the QCEW sample is expected to be lower. An additional explanation for the difference between the clusters’ small businesses’ and QCEW statistics may be the difference in timeframes for both samples. Similarly, the higher average employment growth among small businesses participating in the clusters relative to the ones in the D&B sample can be partially explained by the difference in time periods for which each statistic is calculated. In particular, average employment growth in the D&B data is derived from employment growth during the time period of December 2007-December 2010, which covers the latest recessionary period. Many industries experienced a decrease in employment during this time. The period of analysis for the clusters’ small businesses, on the other hand, is from September 2010 to September 2011, when employment started to rise in many sectors of the economy.

126
Cluster
% Change in Average
Employment in the Regional
Cluster Initiative Sample
% Change in Average
Employment in the
QCEW Sample
% Change in Average
Employment in the D&B
Sample
Percentage Point Difference
(Regional Cluster Initiative–QCEW)a
Percentage Point Difference
(Regional Cluster Initiative-D&B)b
All clusters 11.2% -1.5% 2.2% 12.7 9.0 a Statistical significance of the differences presented in this column could not be determined due to insufficient information. b The differences presented in this column are not statistically significant at the 10% significance level.
The small businesses participating in the 10 clusters were asked whether their cluster
participation led them to increase their staff during the first year of SBA’s Cluster Initiative. Of
these small businesses, 28% (32 out of 113) that responded to the question and sought/received
services reported that they experienced an increase in staff due to their participation in the cluster
(Figure 34). Some 64 small businesses neither agreed nor disagreed with this statement, and 17
disagreed. This inconclusive result is consistent with the expectation that job growth, as one of
the long-term outcomes of SBA’s Initiative, will materialize over a longer horizon than just the
first year.
Figure 34. Increased staff as a result of cluster participation
The survey administered to the small businesses participating in the clusters also
collected information about the number of employees that were retained over the first year of the

Regional Cluster Initiative.
127
31 The average number of full-time and part-time employees retained
is presented in Figure 35. The average number of full-time employees retained ranged from 1 to
about 45 across the 10 clusters. The average number of part-time employees retained varied to a
lesser extent across the 10 clusters, ranging from 0 to 14.
Figure 35. Average number of full- and part-time employees retained by small businesses participating in the clusters
Small businesses participating in the 10 clusters were also asked to rate the influence of
their cluster participation on hiring or retaining employees during the first year of the initiative.
Some 97 small businesses out of the 161 that responded to the relevant question indicated that
their involvement in the cluster was not influential in their hiring or retaining decisions (Figure
36). The remaining 64 small businesses indicated that the cluster was at least slightly influential
in their hiring additional employees or retaining employees.
31 A retained employee is a current employee whom the business initially considered laying off but then decided to keep under employment.

128
Figure 36. Reported influence of small business cluster participation on hires and employees retained during the first year of SBA’s Initiative
The large businesses participating in the cluster were also asked about the influence of
their cluster participation on their hiring decisions. Figure 37 shows that most of the large
organizations that responded to the relevant question (48 out of 85) neither agreed nor disagreed
with the statement that their participation in the cluster facilitated the hiring of new employees.
Some 11 large organizations agreed or strongly agreed that their cluster participation facilitated
the hiring of new employees, and 26 disagreed or strongly disagreed.
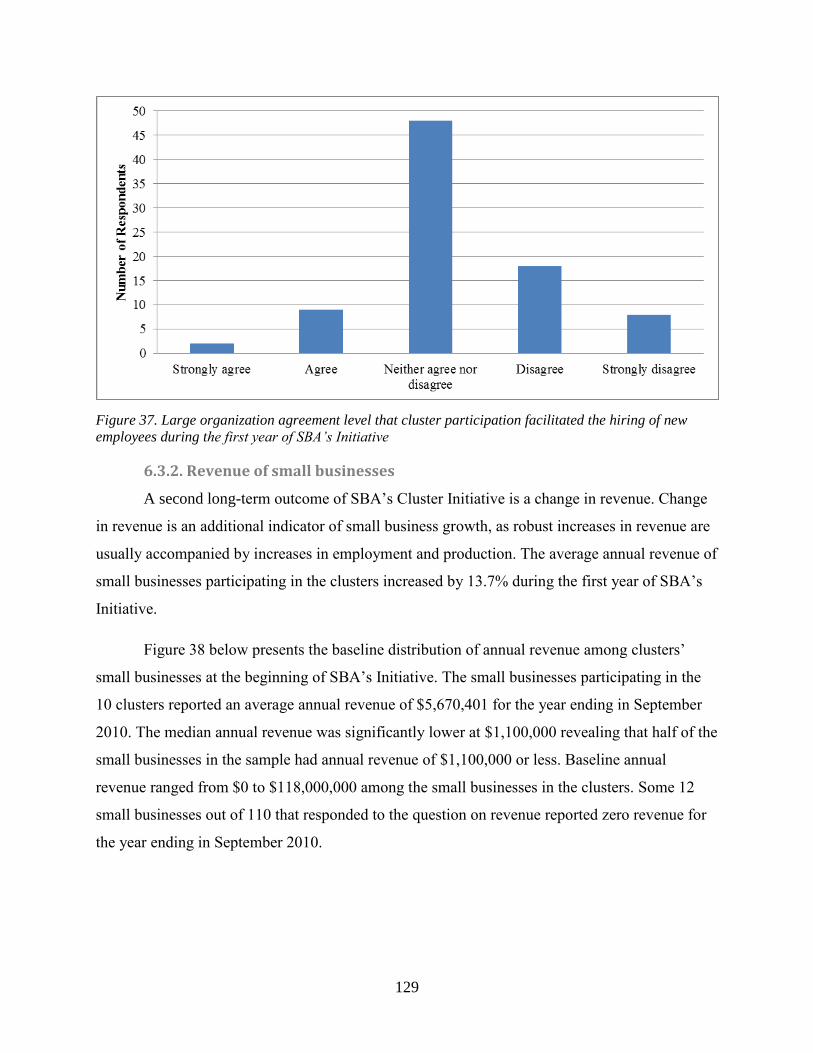
129
Figure 37. Large organization agreement level that cluster participation facilitated the hiring of new employees during the first year of SBA’s Initiative
6.3.2. Revenue of small businesses
A second long-term outcome of SBA’s Cluster Initiative is a change in revenue. Change
in revenue is an additional indicator of small business growth, as robust increases in revenue are
usually accompanied by increases in employment and production. The average annual revenue of
small businesses participating in the clusters increased by 13.7% during the first year of SBA’s
Initiative.
Figure 38 below presents the baseline distribution of annual revenue among clusters’
small businesses at the beginning of SBA’s Initiative. The small businesses participating in the
10 clusters reported an average annual revenue of $5,670,401 for the year ending in September
2010. The median annual revenue was significantly lower at $1,100,000 revealing that half of the
small businesses in the sample had annual revenue of $1,100,000 or less. Baseline annual
revenue ranged from $0 to $118,000,000 among the small businesses in the clusters. Some 12
small businesses out of 110 that responded to the question on revenue reported zero revenue for
the year ending in September 2010.
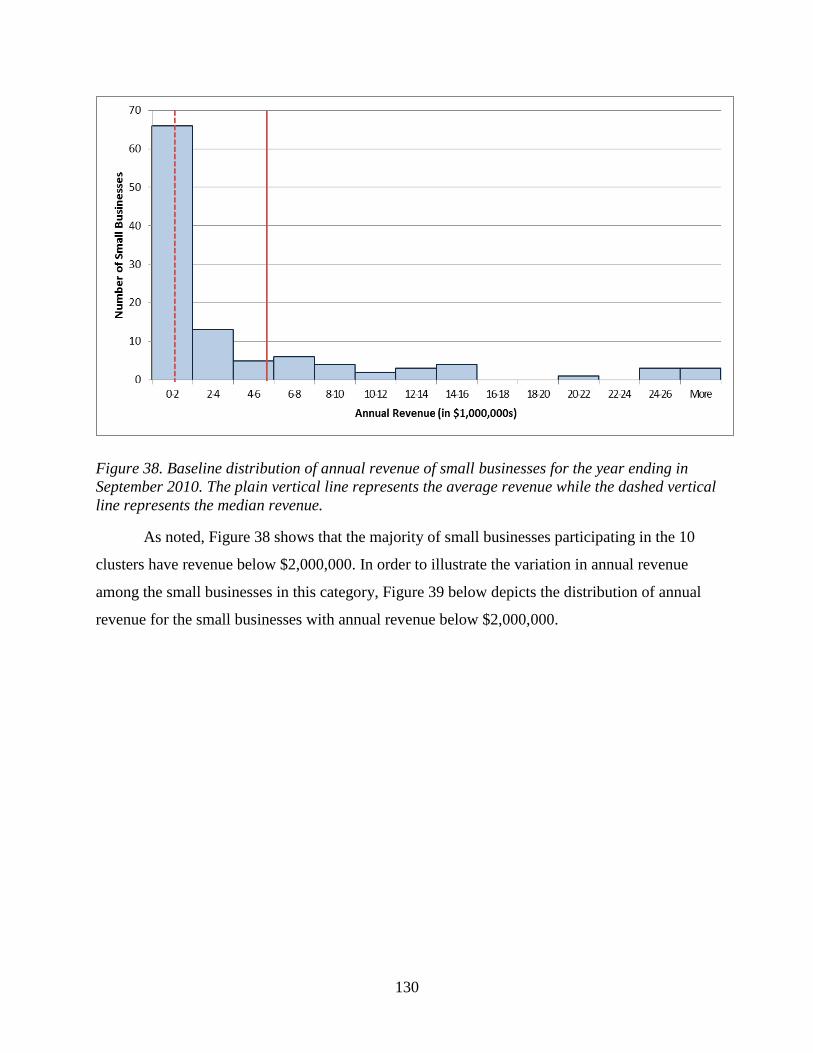
130
Figure 38. Baseline distribution of annual revenue of small businesses for the year ending in September 2010. The plain vertical line represents the average revenue while the dashed vertical line represents the median revenue.
As noted, Figure 38 shows that the majority of small businesses participating in the 10
clusters have revenue below $2,000,000. In order to illustrate the variation in annual revenue
among the small businesses in this category, Figure 39 below depicts the distribution of annual
revenue for the small businesses with annual revenue below $2,000,000.

131
Figure 39. Baseline distribution of annual revenue for the year ending in September 2010 among small businesses with annual revenue below $2 million. The dashed vertical line represents the median revenue.
As shown in Table 28, the average annual revenue per firm varied across the 10 clusters.
For example, the small businesses in Smart Grid reported the lowest baseline average annual
revenue ($180,205), while those participating in the Huntsville Defense Cluster had the highest
baseline average annual revenue ($17,400,000). The median revenue was lower than the average
revenue in all clusters, indicating that more than half of the small businesses had annual revenues
below the average.
Table 28 shows that the average annual revenue among small businesses participating in
the 10 clusters increased by 13.7% during the first year of the Regional Cluster Initiative. The
increase in average annual revenue of small businesses was observed in all clusters, except for
the Defense Alliance, where it decreased by 10.4%. Small businesses in Project 17, FlexMatters,
Smart Grid, the Energy Storage Cluster and the Green Aviation Cluster, on average, had higher
than average increases in annual revenue.
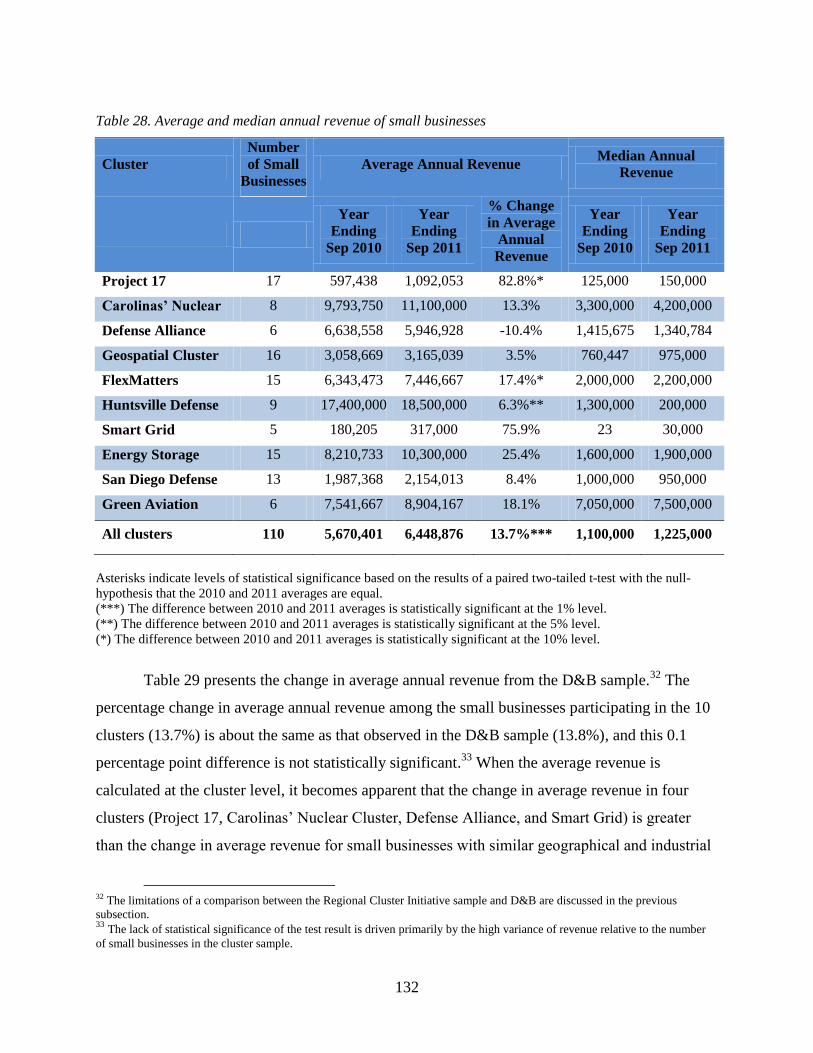
132
Table 28. Average and median annual revenue of small businesses
Cluster Number of Small
Businesses Average Annual Revenue Median Annual
Revenue
Year Ending
Sep 2010
Year Ending
Sep 2011
% Change in Average
Annual Revenue
Year Ending
Sep 2010
Year Ending
Sep 2011
Project 17 17 597,438 1,092,053 82.8%* 125,000 150,000
Carolinas’ Nuclear 8 9,793,750 11,100,000 13.3% 3,300,000 4,200,000
Defense Alliance 6 6,638,558 5,946,928 -10.4% 1,415,675 1,340,784
Geospatial Cluster 16 3,058,669 3,165,039 3.5% 760,447 975,000
FlexMatters 15 6,343,473 7,446,667 17.4%* 2,000,000 2,200,000
Huntsville Defense 9 17,400,000 18,500,000 6.3%** 1,300,000 200,000
Smart Grid 5 180,205 317,000 75.9% 23 30,000
Energy Storage 15 8,210,733 10,300,000 25.4% 1,600,000 1,900,000
San Diego Defense 13 1,987,368 2,154,013 8.4% 1,000,000 950,000
Green Aviation 6 7,541,667 8,904,167 18.1% 7,050,000 7,500,000
All clusters 110 5,670,401 6,448,876 ***13.7% 1,100,000 1,225,000
Asterisks indicate levels of statistical significance based on the results of a paired two-tailed t-test with the null-hypothesis that the 2010 and 2011 averages are equal. ***( ) The difference between 2010 and 2011 averages is statistically significant at the 1% level.
(**) The difference between 2010 and 2011 averages is statistically significant at the 5% level. (*) The difference between 2010 and 2011 averages is statistically significant at the 10% level.
Table 29 presents the change in average annual revenue from the D&B sample.32 The
percentage change in average annual revenue among the small businesses participating in the 10
clusters (13.7%) is about the same as that observed in the D&B sample (13.8%), and this 0.1
percentage point difference is not statistically significant.33 When the average revenue is
calculated at the cluster level, it becomes apparent that the change in average revenue in four
clusters (Project 17, Carolinas’ Nuclear Cluster, Defense Alliance, and Smart Grid) is greater
than the change in average revenue for small businesses with similar geographical and industrial
32 The limitations of a comparison between the Regional Cluster Initiative sample and D&B are discussed in the previous subsection. 33 The lack of statistical significance of the test result is driven primarily by the high variance of revenue relative to the number of small businesses in the cluster sample.
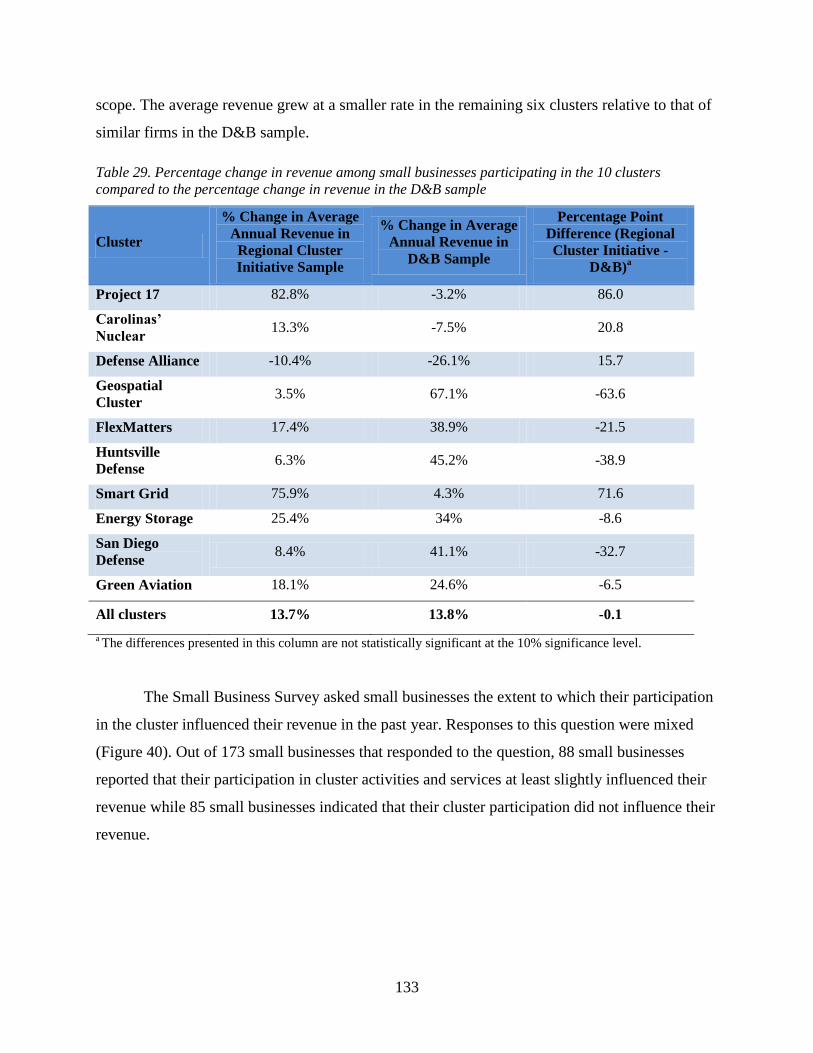
133
scope. The average revenue grew at a smaller rate in the remaining six clusters relative to that of
similar firms in the D&B sample.
Table 29. Percentage change in revenue among small businesses participating in the 10 clusters compared to the percentage change in revenue in the D&B sample
Cluster
% Change in Average Annual Revenue in Regional Cluster Initiative Sample
% Change in Average Annual Revenue in
D&B Sample
Percentage Point Difference (Regional Cluster Initiative -
D&B)a
Project 17 82.8% -3.2% 86.0
Carolinas’ Nuclear 13.3% -7.5% 20.8
Defense Alliance -10.4% -26.1% 15.7
Geospatial Cluster 3.5% 67.1% -63.6
FlexMatters 17.4% 38.9% -21.5
Huntsville Defense 6.3% 45.2% -38.9
Smart Grid 75.9% 4.3% 71.6
Energy Storage 25.4% 34% -8.6
San Diego Defense 8.4% 41.1% -32.7
Green Aviation 18.1% 24.6% -6.5
All clusters 13.7% 13.8% -0.1 a The differences presented in this column are not statistically significant at the 10% significance level.
The Small Business Survey asked small businesses the extent to which their participation
in the cluster influenced their revenue in the past year. Responses to this question were mixed
(Figure 40). Out of 173 small businesses that responded to the question, 88 small businesses
reported that their participation in cluster activities and services at least slightly influenced their
revenue while 85 small businesses indicated that their cluster participation did not influence their
revenue.
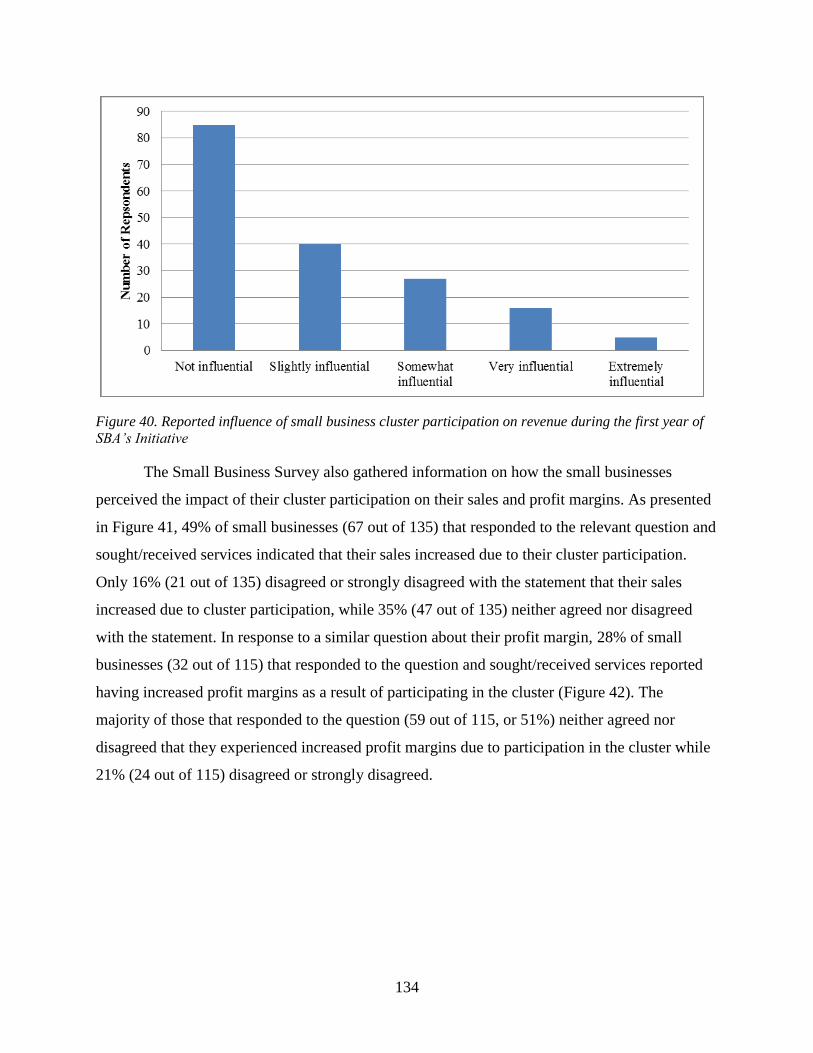
134
Figure 40. Reported influence of small business cluster participation on revenue during the first year of SBA’s Initiative
The Small Business Survey also gathered information on how the small businesses
perceived the impact of their cluster participation on their sales and profit margins. As presented
in Figure 41, 49% of small businesses (67 out of 135) that responded to the relevant question and
sought/received services indicated that their sales increased due to their cluster participation.
Only 16% (21 out of 135) disagreed or strongly disagreed with the statement that their sales
increased due to cluster participation, while 35% (47 out of 135) neither agreed nor disagreed
with the statement. In response to a similar question about their profit margin, 28% of small
businesses (32 out of 115) that responded to the question and sought/received services reported
having increased profit margins as a result of participating in the cluster (Figure 42). The
majority of those that responded to the question (59 out of 115, or 51%) neither agreed nor
disagreed that they experienced increased profit margins due to participation in the cluster while
21% (24 out of 115) disagreed or strongly disagreed.
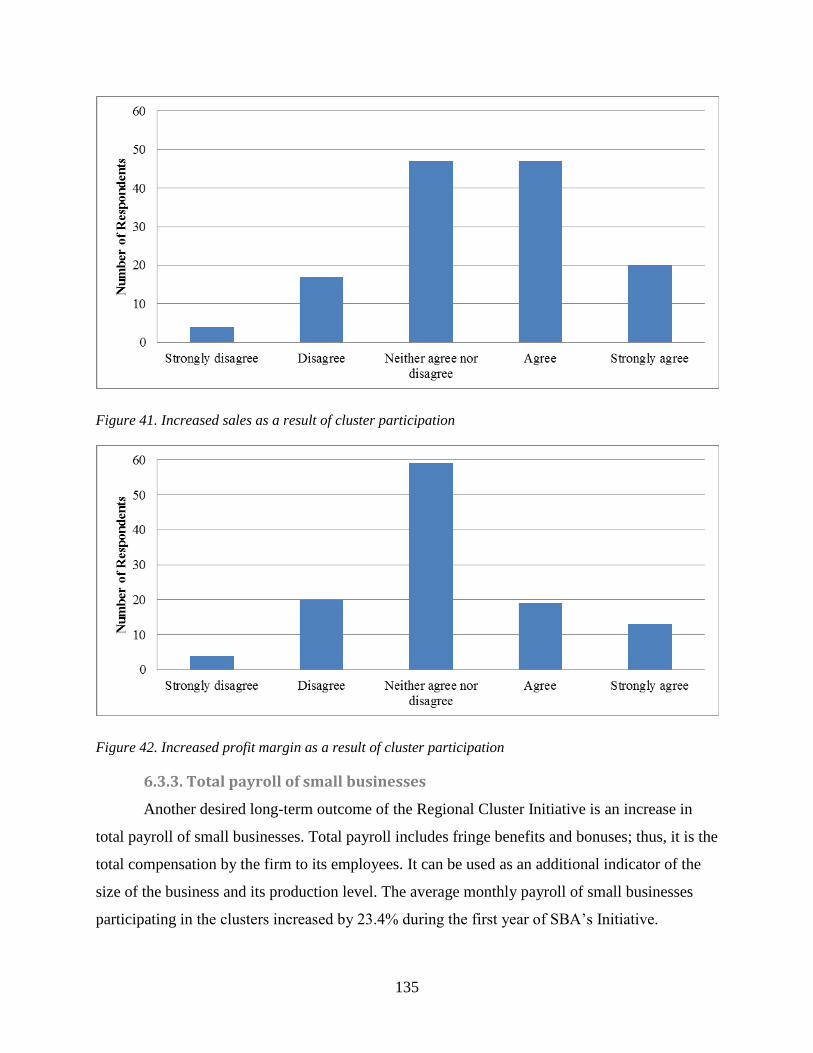
135
Figure 41. Increased sales as a result of cluster participation
Figure 42. Increased profit margin as a result of cluster participation
6.3.3. Total payroll of small businesses
Another desired long-term outcome of the Regional Cluster Initiative is an increase in
total payroll of small businesses. Total payroll includes fringe benefits and bonuses; thus, it is the
total compensation by the firm to its employees. It can be used as an additional indicator of the
size of the business and its production level. The average monthly payroll of small businesses
participating in the clusters increased by 23.4% during the first year of SBA’s Initiative.
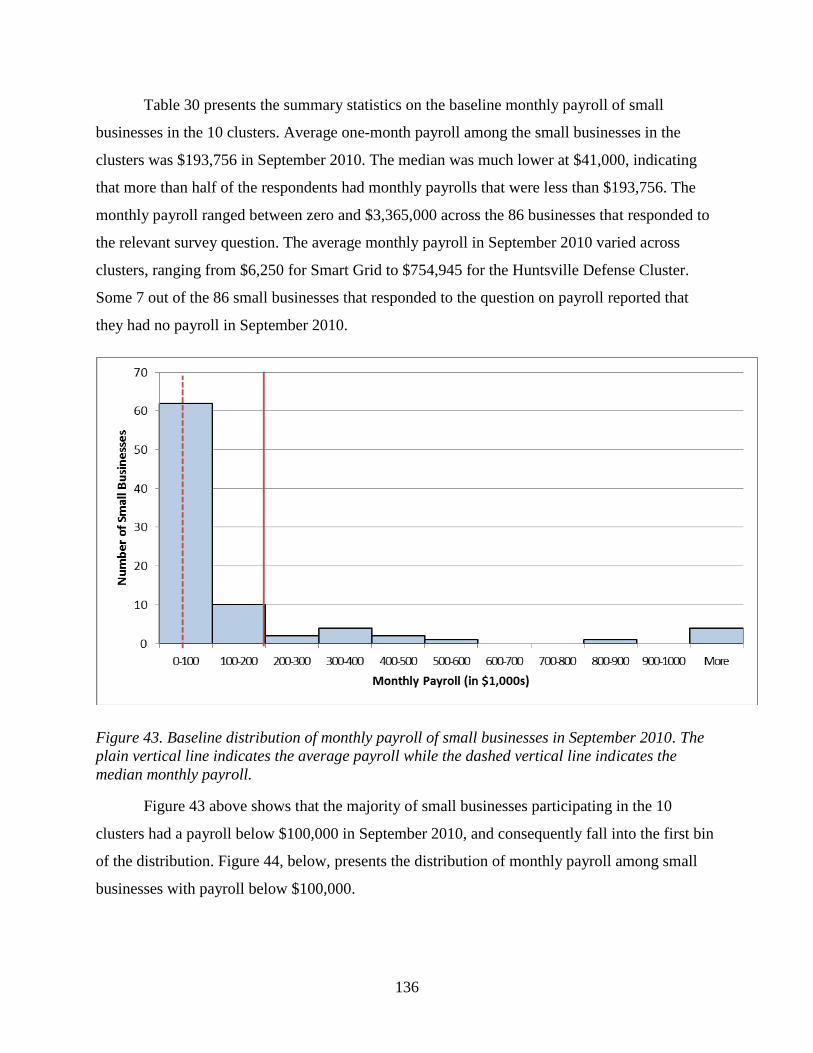
Table 30 presents the summary statistics on the baseline monthly payroll of small
businesses in the 10 clusters. Average one-month payroll among the small businesses in the
clusters was $193,756 in September 2010. The median was much lower at $41,000, indicating
that more than half of the respondents had monthly payrolls that were less than $193,756. The
monthly payroll ranged between zero and $3,365,000 across the 86 businesses that responded to
the relevant survey question. The average monthly payroll in September 2010 varied across
clusters, ranging from $6,250 for Smart Grid to $754,945 for the Huntsville Defense Cluster.
Some 7 out of the 86 small businesses that responded to the question on payroll reported that
they had no payroll in September 2010.
136
Figure 43. Baseline distribution of monthly payroll of small businesses in September 2010. The plain vertical line indicates the average payroll while the dashed vertical line indicates the median monthly payroll.
Figure 43 above shows that the majority of small businesses participating in the 10
clusters had a payroll below $100,000 in September 2010, and consequently fall into the first bin
of the distribution. Figure 44, below, presents the distribution of monthly payroll among small
businesses with payroll below $100,000.

Figure 44. Baseline distribution of monthly payroll in September 2010 in small businesses with monthly payroll less than $100,000. The dashed vertical line indicates the median monthly payroll.
Table 30 presents the change in average and median monthly payroll of small businesses
participating in the 10 clusters during the first year of the Regional Cluster Initiative. Overall, the
average monthly payroll increased by 23.4% between September 2010 and September 2011. The
median monthly payroll also increased by about 25.5%, from $41,000 to $51,475, suggesting
that the increase in payroll was experienced by small businesses across the entire spectrum of
baseline payroll. At the cluster level, the highest increase in payroll was observed in the Smart
Grid Cluster, with a threefold increase during the first year of the Regional Cluster Initiative.
This increase is partially due to the increase in employment, as Smart Grid had the second
highest employment growth of 36% (Table 26).
An increase in total payroll may be driven by an increase in the number of employees
and/or an increase in the compensation per employee. The finding that average employment
among the 10 clusters’ small businesses increased by 11.2% during the same time period (Table
137
26) suggests that the increase in payroll is due to an increase in not only employment but also
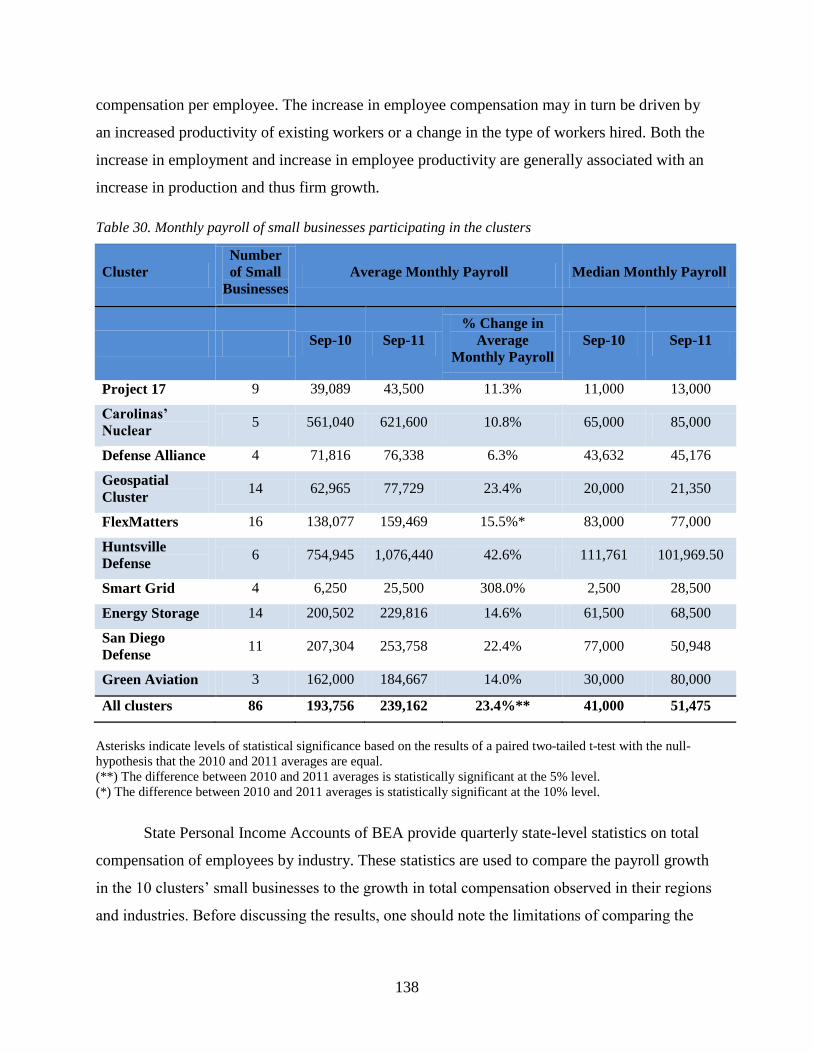
138
compensation per employee. The increase in employee compensation may in turn be driven by
an increased productivity of existing workers or a change in the type of workers hired. Both the
increase in employment and increase in employee productivity are generally associated with an
increase in production and thus firm growth.
Table 30. Monthly payroll of small businesses participating in the clusters
Cluster Number of Small
Businesses Average Monthly Payroll Median Monthly Payroll
Sep-10 Sep-11 % Change in
Average Monthly Payroll
Sep-10 Sep-11
Project 17 9 39,089 43,500 11.3% 11,000 13,000
Carolinas’ Nuclear 5 561,040 621,600 10.8% 65,000 85,000
Defense Alliance 4 71,816 76,338 6.3% 43,632 45,176
Geospatial Cluster 14 62,965 77,729 23.4% 20,000 21,350
FlexMatters 16 138,077 159,469 15.5%* 83,000 77,000
Huntsville Defense 6 754,945 1,076,440 42.6% 111,761 101,969.50
Smart Grid 4 6,250 25,500 308.0% 2,500 28,500
Energy Storage 14 200,502 229,816 14.6% 61,500 68,500
San Diego Defense 11 207,304 253,758 22.4% 77,000 50,948
Green Aviation 3 162,000 184,667 14.0% 30,000 80,000
All clusters 86 193,756 239,162 23.4%** 41,000 51,475
Asterisks indicate levels of statistical significance based on the results of a paired two-tailed t-test with the null-hypothesis that the 2010 and 2011 averages are equal. (**) The difference between 2010 and 2011 averages is statistically significant at the 5% level. (*) The difference between 2010 and 2011 averages is statistically significant at the 10% level.
State Personal Income Accounts of BEA provide quarterly state-level statistics on total
compensation of employees by industry. These statistics are used to compare the payroll growth
in the 10 clusters’ small businesses to the growth in total compensation observed in their regions
and industries. Before discussing the results, one should note the limitations of comparing the

statistics from the Regional Cluster Initiative sample and those from the BEA State Personal
Income Accounts. First, the BEA State Personal Income Accounts statistics are aggregate
statistics computed at the state-level as opposed to the firm-level statistics available in the
Regional Cluster Initiative sample. Second, BEA State Personal Income Accounts statistics are
computed using information on all workers and hence on all establishments and not on only
small businesses. Third, the change in total compensation using BEA statistics is computed using
the 3rd quarter 2010 and 3rd quarter 2011 state-level total compensation. Finally, the selection
issues that are discussed under the previous comparison tables also apply in this case.
Differences other than industry and geographic scope may account for the differences between
the cluster data and the BEA data.
Table 31 lists the percentage changes in payroll reported by the small businesses
participating in the clusters and the average change in payroll computed using the State Personal
Income Accounts data.
139
34 It shows that the percentage change in average payroll among the small
businesses participating in the clusters is 16.2 percentage point higher than the percentage
change in state-level total compensation of employees in the states and industrial categories of
clusters (Table 31); however, the statistical significance of this difference could not be
determined due to insufficient information. The same finding also holds for payroll growth at the
cluster level for each of the 10 clusters.
Table 31. Percentage change in payroll among the small businesses participating in the clusters compared to the percentage change in payroll computed using the BEA State Personal Income Accounts
Cluster % Change in Payroll in the Regional Cluster Initiative
Sample
% Change in Average Payroll computed from BEA Regional Accounts
Percentage Point Difference (Regional Cluster Initiative –
BEA)a
Project 17 11.3% 7.2% 4.1
Carolinas’ Nuclear 10.8% 4.3% 6.5
Defense Alliance 6.3% 6.2% 0.1
Geospatial Cluster 23.4% 5.1% 18.3
FlexMatters 15.5% 7.4% 8.1
34 For clusters that span multiple states, a weighted average across the states is computed based on the number of small businesses that the clusters had in each state.
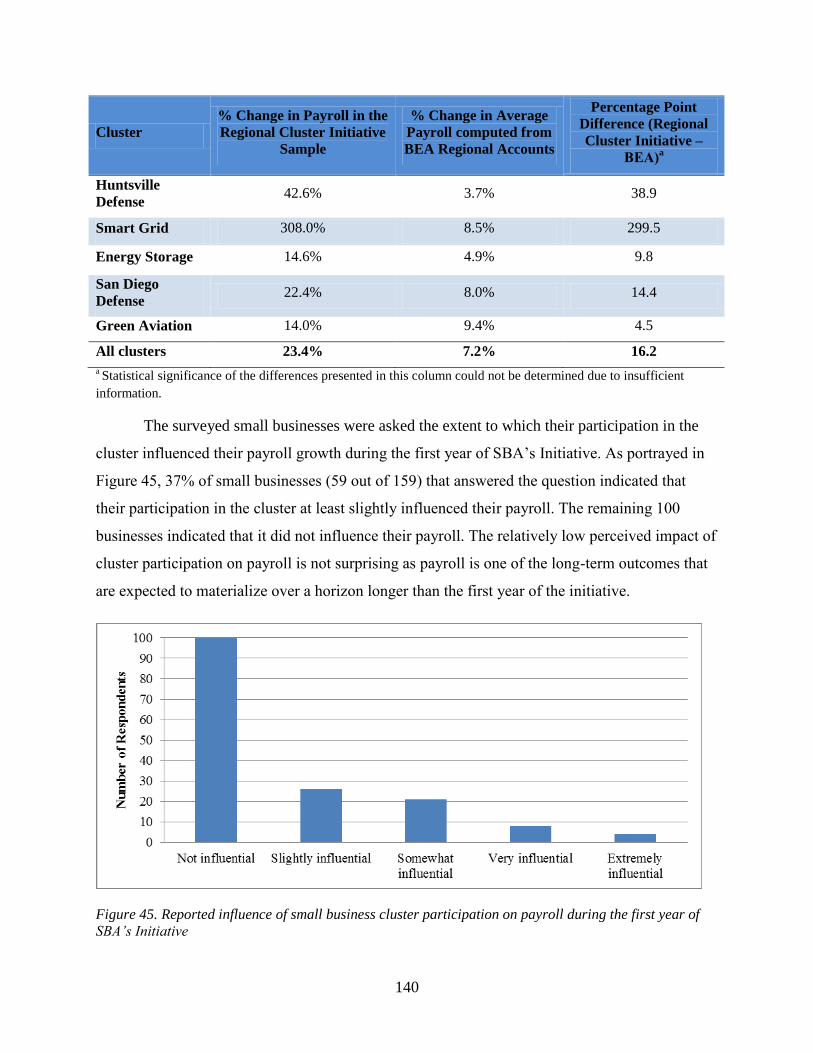
140
Cluster% Change in Payroll in the Regional Cluster Initiative
Sample
% Change in Average Payroll computed from BEA Regional Accounts
Percentage Point Difference (Regional Cluster Initiative –
BEA)a
Huntsville Defense 42.6% 3.7% 38.9
Smart Grid 308.0% 8.5% 299.5
Energy Storage 14.6% 4.9% 9.8
San Diego Defense 22.4% 8.0% 14.4
Green Aviation 14.0% 9.4% 4.5
All clusters 23.4% 7.2% 16.2 a Statistical significance of the differences presented in this column could not be determined due to insufficient information.
The surveyed small businesses were asked the extent to which their participation in the
cluster influenced their payroll growth during the first year of SBA’s Initiative. As portrayed in
Figure 45, 37% of small businesses (59 out of 159) that answered the question indicated that
their participation in the cluster at least slightly influenced their payroll. The remaining 100
businesses indicated that it did not influence their payroll. The relatively low perceived impact of
cluster participation on payroll is not surprising as payroll is one of the long-term outcomes that
are expected to materialize over a horizon longer than the first year of the initiative.
Figure 45. Reported influence of small business cluster participation on payroll during the first year of SBA’s Initiative
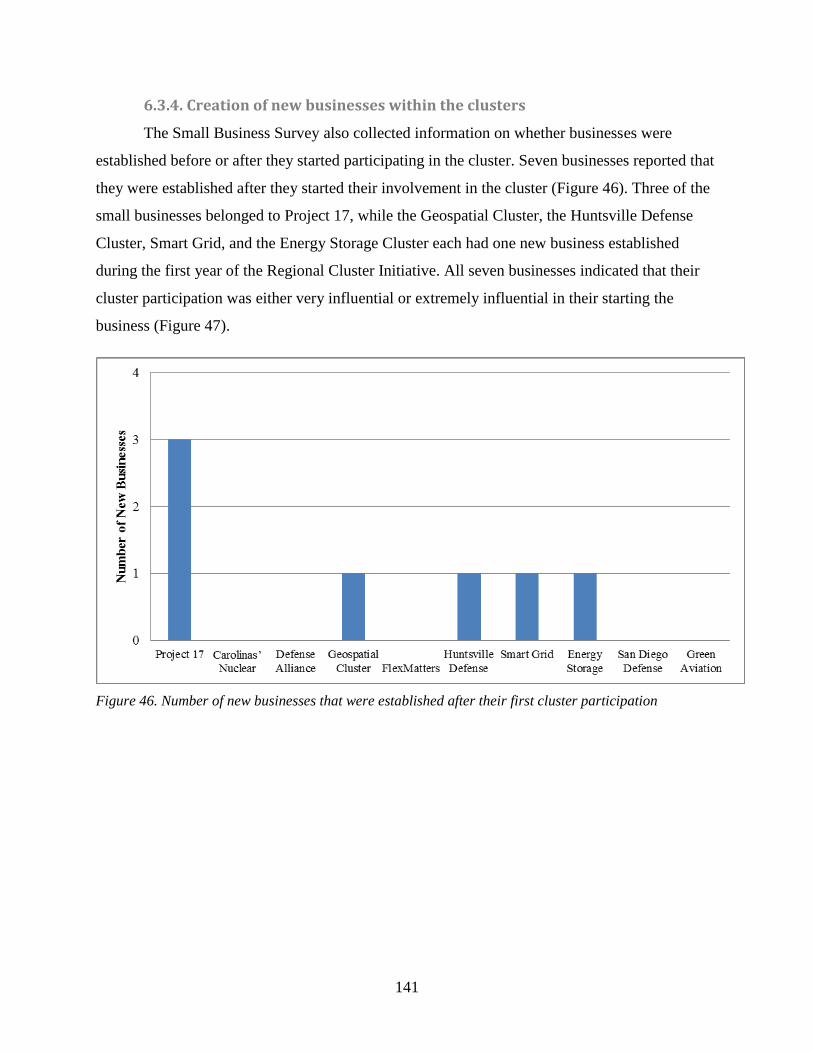
6.3.4. Creation of new businesses within the clusters
The Small Business Survey also collected information on whether businesses were
established before or after they started participating in the cluster. Seven businesses reported that
they were established after they started their involvement in the cluster (Figure 46). Three of the
small businesses belonged to Project 17, while the Geospatial Cluster, the Huntsville Defense
Cluster, Smart Grid, and the Energy Storage Cluster each had one new business established
during the first year of the Regional Cluster Initiative. All seven businesses indicated that their
cluster participation was either very influential or extremely influential in their starting the
business (Figure 47).
141
Figure 46. Number of new businesses that were established after their first cluster participation

142
Figure 47. Reported influence of cluster participation on starting a business
6.4. Regional Impact Analysis Section 6.3 presented the changes in total employment, revenue, and total payroll
experienced by the 10 clusters’ small business participants during the first year of SBA’s
Initiative. These direct changes can lead to broader economic impacts at the regional level
through the interdependencies among different sectors and agents within regional economies.
The broader impacts of direct economic changes on the regional economies are typically
estimated using a regional impact analysis that utilizes input-output models. This section
presents estimates for the regional economic impact due to the change in the small businesses’
employment, revenue, and payroll between September 2010 and September 2011.
The results of the regional economic impact analysis presented in this section are based
on the Regional Input-Output Modeling System II (RIMS II), which is one of the standard input-
output models used in regional impact analysis. At the basic level, RIMS II consists of
multipliers for a wide range of industries and regions. These multipliers, when used in
conjunction with the relevant input data, enable the estimation of the regional economic impact
resulting from a given project or event occurring in the region of interest. The input data used in
this analysis is the total change in revenue, total employment, and payroll experienced by the

clusters’ small businesses over the first year of SBA’s Cluster Initiative. The assumptions
underlying the use of RIMS II are discussed in detail in the Appendix.
The regional economic impact estimates presented in this section are based on state-level
multipliers, thus they represent estimates of economic impact for each cluster’s state(s). In
addition, regional economic impacts were estimated under three scenarios based on the way that
missing values were imputed in the analysis.
· Scenario 1: The regional economic impact is estimated based solely on small businesses
that provided a valid industry code. Since only those small businesses with non-missing
and valid industry codes are used in the estimation, the resulting estimates can be viewed
as a lower bound on regional impact.
· Scenario 2: This scenario takes into account the impact of those small businesses with
valid input data (employment, revenue, or payroll) but missing industry codes. For these
businesses, a composite multiplier is created based on the distribution of industry codes
in a given cluster. The change in employment, revenue, and payroll reported by these
firms are then multiplied by the composite multiplier to estimate the regional impacts.
Assumptions under scenario 1 are also applicable to scenario 2.
· Scenario 3: This scenario takes into account the impact of those small businesses that
provided neither their input data (employment, revenue, and payroll) nor industry codes.
The input data of these businesses are imputed using the average employment, revenue,
and payroll in each cluster. Furthermore, the composite multiplier discussed above is
used in estimating the impact of these businesses on their regional economies. Since this
scenario includes the actual or imputed outcomes of all small businesses in a cluster, its
results provide an upper bound in the regional economic impact estimates for each
cluster.
Table 32 shows the estimated regional economic impact resulting from the change in
total employment of the 10 clusters’ small businesses between September 2010 and September
2011.
143
35 The change in regional economic impact expressed in terms of the change in the total
number of employees in the region and estimated under the three scenarios are presented in the
35 As discussed in the Appendix, RIMS II does not differentiate between full- and part-time employment.
first three columns of the table. Columns IV and V display the number of small businesses for
which data were imputed under scenarios 2 and 3, respectively.
As shown in column I of Table 32, the change in the total number of employees reported
by the 10 clusters’ small businesses led to an increase of 706 in regional employment. When the
small businesses with missing industry codes are included in the analysis, the estimated increase
in the total regional employment rises to 1085 (column II). Finally, the estimated increase in total
regional employment rises to 1332 when the estimated impacts of those small businesses with
missing industry code and employment data are included in the analysis (column III). Columns
IV and V provide some sources that may drive the difference between the estimates presented in
columns I-III. When there are no businesses with a missing NAICS code and valid employment
data, column I and II estimates are identical. As the number of missing responses increases, so
does the difference between the three regional impact estimates. However, when comparing
results across clusters, the cluster with a high number of missing responses may not have big
differences in the three estimates. The principal reason is that the difference among the three
estimates is also related to the size of the multipliers, which varies from cluster to cluster, and to
the inter-cluster variation in the weights assigned to each industry when calculating the
composite multipliers for columns II and III.
There is variation in the estimated regional economic impacts of clusters’ small
businesses across the 10 clusters. This variation is driven by the differences in average change in
the number of employees, the sizes of the multipliers based on the geographic and industrial
characteristics of each cluster, and the number of small businesses with missing data. According
to the column I estimates, Project 17 and Geospatial Cluster small businesses generated the
largest increases in regional employment. FlexMatters’ small businesses generated a slight
decrease in regional employment under scenario 1. This estimate increases to some of the highest
impacts in regional employment (164 and 183) when missing values are imputed. The remaining
clusters’ small businesses are associated with rises in regional employment, ranging from 8 to 69
employees.
144

Table 32. Estimated regional economic impact associated with the change in employment of clusters’ small businesses between September 2010 and September 2011 (total number of employees)
145
Cluster
Total regional impact
associated with change in
employment Scenario 1
(I)
Total regional impact
associated with change in
employment Scenario 2
(II)
Total regional impact
associated with change in
employment Scenario 3
(III)
Number of responses with missing NAICS code and valid
employment data
(IV)
Number of responses where
both NAICS code and employment data are missing
(V)
Project 17 268 265 327 6 5
Carolinas’ Nuclear
42 68 96 2 4
Defense Alliance
8 20 33 3 5
Geospatial Cluster
129 129 140 0 2
FlexMatters -3 164 183 8 2
Huntsville Defense
52 164 206 1 4
Smart Grid 24 28 32 1 1
Energy Storage
62 110 159 3 9
San Diego Defense
55 63 63 1 -
Green Aviation
69 74 94 1 3
All clusters 706 1085 1332 26 35
Table 33 shows the estimated regional economic impact associated with the change in
annual revenue experienced by the 10 clusters’ small business participants between September
2010 and September 2011. The estimated regional impact of the change in annual revenue
reported by the clusters’ small businesses is an increase of $114,515,685 in regional annual
revenue, based on the data from those small businesses with a valid NAICS code. When the
missing data are imputed under scenarios 2 and 3, the estimated regional impact rises to
$169,937,709 and $312,570,230, respectively.
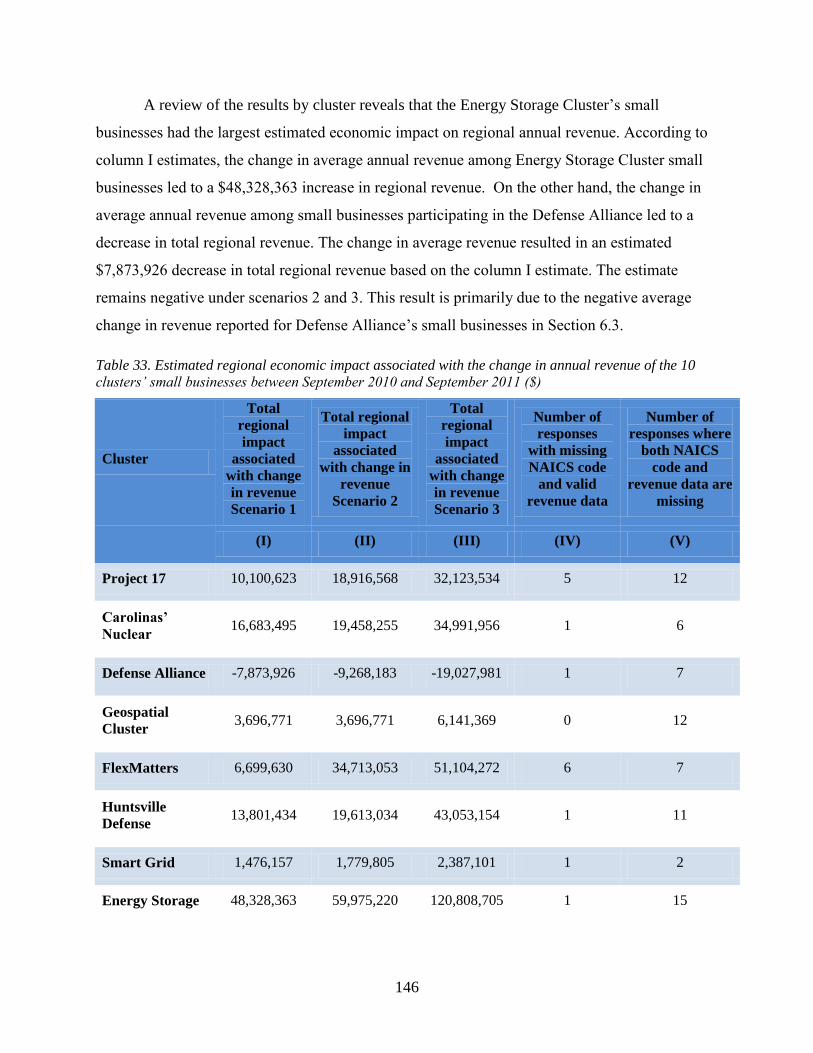
A review of the results by cluster reveals that the Energy Storage Cluster’s small
businesses had the largest estimated economic impact on regional annual revenue. According to
column I estimates, the change in average annual revenue among Energy Storage Cluster small
businesses led to a $48,328,363 increase in regional revenue. On the other hand, the change in
average annual revenue among small businesses participating in the Defense Alliance led to a
decrease in total regional revenue. The change in average revenue resulted in an estimated
$7,873,926 decrease in total regional revenue based on the column I estimate. The estimate
remains negative under scenarios 2 and 3. This result is primarily due to the negative average
change in revenue reported for Defense Alliance’s small businesses in Section 6.3.
Table 33. Estimated regional economic impact associated with the change in annual revenue of the 10 clusters’ small businesses between September 2010 and September 2011 ($)
146
Cluster
Total regional impact
associated with change in revenue Scenario 1
Total regional impact
associated with change in
revenue Scenario 2
Total regional impact
associated with change in revenue Scenario 3
Number of responses
with missing NAICS code
and valid revenue data
Number of responses where
both NAICS code and
revenue data are missing
(I) (II) (III) (IV) (V)
Project 17 10,100,623 18,916,568 32,123,534 5 12
Carolinas’ Nuclear 16,683,495 19,458,255 34,991,956 1 6
Defense Alliance -7,873,926 -9,268,183 -19,027,981 1 7
Geospatial Cluster 3,696,771 3,696,771 6,141,369 0 12
FlexMatters 6,699,630 34,713,053 51,104,272 6 7
Huntsville Defense 13,801,434 19,613,034 43,053,154 1 11
Smart Grid 1,476,157 1,779,805 2,387,101 1 2
Energy Storage 48,328,363 59,975,220 120,808,705 1 15

147
Cluster
Total regional impact
associated with change in revenue Scenario 1
Total regional impact
associated with change in
revenue Scenario 2
Total regional impact
associated with change in revenue Scenario 3
Number of responses
with missing NAICS code
and valid revenue data
Number of responses where
both NAICS code and
revenue data are missing
San Diego Defense 6,070,198 4,494,286 4,859,033 1 1
Green Aviation 15,532,940 16,558,900 36,129,087 1 7
All clusters 114,515,685 169,937,709 312,570,230 18 80
Table 34 shows the estimated regional economic impact associated with the change in
payroll of the small businesses participating in the clusters between September 2010 and
September 2011. The estimated regional impact of the change in monthly payroll experienced by
small business participants in the 10 clusters is an increase of $6,067,534 in total regional
monthly payroll, based on the data from those small businesses with a valid NAICS code. When
the small businesses with a missing NAICS code and input data are included in the analysis, the
total regional impact of the clusters’ small businesses is estimated to be a $7,082,161 increase in
total regional monthly payroll under scenario 2 and a $24,750,412 increase in total regional
monthly payroll under scenario 3. In addition, the highest estimated change in regional monthly
payroll, $3,046,227, under scenario 1, is generated by small businesses in the Huntsville
Advanced Defense Technology Cluster, and the lowest estimated change in regional monthly
payroll is $37,199, under scenario 1, generated by Defense Alliance small businesses.

Table 34. Estimated regional economic impact associated with the change in monthly payroll of clusters’ small businesses between September 2010 and September 2011 ($)
148
Cluster
Total regional impact
associated with change in
payroll Scenario 1
(I)
Total regional impact
associated with payroll Scenario 2
(II)
Total regional impact
associated with payroll Scenario 3
(III)
Number of responses with missing NAICS code and valid revenue data
(IV)
Number of responses where
both NAICS code and revenue data
are missing
(V)
Project 17 72,905 65,972 235,177 3 20
Carolinas’ Nuclear
455,859 483,925 1,503,722 1 9
Defense Alliance
37,199 37,199 124,566 0 9
Geospatial Cluster
294,476 294,476 636,894 0 14
FlexMatters 398,343 740,853 1,026,303 7 6
Huntsville Defense
3,046,227 3,046,227 10,154,089 0 14
Smart Grid 139,918 177,021 288,330 1 3
Energy Storage
214,250 811,775 1,741,047 2 16
San Diego Defense
1,271,162 1,279,662 8,357,336 1 3
Green Aviation
137,195 137,195 662,874 0 10
All clusters 6,067,534 7,082,161 24,750,412 15 104

7. Lessons Learned in Cluster Operations Over the first year of SBA’s Cluster Initiative—a relatively narrow period of
performance—the 10 clusters reported a significant number of “lessons learned.” These lessons
varied across clusters due to the different challenges faced and the expectations and use of
resources reported by the cluster management teams. The different challenges and experiences
that led to these lessons learned can in turn be partially attributed to the different developmental
stages of the clusters and the idiosyncratic differences between the industries in which they
operate.
A compilation of the lessons learned by the 10 clusters during the first year of the
initiative is presented below. The sources for this compilation are the clusters’ quarterly reports
and the interviews of cluster administration teams conducted by the evaluation team in
November 2011. Some of the lessons learned were identified by cluster administration teams as
they faced challenges related to administrative or service-delivery activities. Others resulted from
cluster management observing gaps between the needs of small businesses and the resources
available to them. Regardless of their genesis, all of the lessons highlight the importance of the
cluster administration being aware of the cluster’s performance and the strategic reassessment
and creativity sometimes required to best improve difficult situations.
7.1. Lessons learned regarding service selection and delivery to small
businesses 1. Clusters identified and aimed to address small businesses’ need for technology
validation through peer review or equipment testing in conditions nearly identical to
anticipated use.
· The Project 17 Agricultural Technology Cluster recognized that small businesses
find it difficult to get their technology “peer reviewed.” “Peer review” or third-
party appraisal of technology plays a valuable role when small businesses pitch
their technology to potential clients and investors. Project 17 is looking to address
this need in the near future. This concern regarding “peer review” was echoed by
Chip Laingen, cluster administrator at the Defense Alliance, who suggested that
third-party technology validation was one of the services frequently requested by
149

his cluster’s participants. The Defense Alliance already provides technology
validation and testing services through some of its partner organizations.
· The Illinois Smart Grid Region Innovation Cluster, which also acknowledged
concerns surrounding technology validation, took a different route. Based on an
understanding that smart grid technology needs to be proven on systems
progressively closer to a large-scale electrical grid in order to gain interest from
utilities and other customers, Smart Grid provided its small businesses access to
the Illinois Institute of Technology microgrid. In order to enable testing on larger-
scale and more representative systems, the cluster further secured access to
Commonwealth Edison’s on-grid test bed. This test bed is composed of portions
of nine municipalities in the Chicago area and maintains characteristics similar to
the entire Commonwealth Edison grid with respect to its composition of
residential, commercial, and industrial customers.
2. FlexMatters – Northeast Ohio Technology Coalition found that, despite posting
searchable opportunities on its website, many small businesses did not have the time
to look through them. As a result, FlexMatters hired flexible electronics consultants to
work directly with small businesses to help them select applicable opportunities.
3. FlexMatters also reported that when it offered seminars on grants and government
funding through the Kent State SBDC and the cluster’s Washington DC consultants
during the same cluster meeting, small businesses seemed more interested in working
with the DC consultants than going through the SBDC for grant identification and
assistance. One reason mentioned for this preference was that small businesses had
the perception that working with SBA meant meeting stringent requirements.
4. Several clusters, including the Geospatial Cluster and the Carolinas’ Nuclear Cluster,
reported that they had underestimated the share of the cluster’s time that would be
spent on counseling and mentoring. The extended time needed for counseling and
mentoring activities, though, allowed the cluster management team to develop
stronger ties with their members.
150
7.2. Lessons learned regarding cluster promotion in the region 1. The Geospatial Cluster reported that one of its miscalculations was to underestimate
the importance of cluster promotion and marketing. The cluster reported that this led
to having little to no funds allocated for this activity and contributed to low outreach
and participation. The cluster employed a creative strategy to mitigate this problem:
developing formal relationships with chambers of commerce based on mutual benefit.
The chambers advertised for the cluster, and the cluster provided them with technical
assistance.
2. Smart Grid highlighted the difficulty of creating a cluster identity, both among
participants and outside of the cluster, without having to expend too many resources
that could be used in direct services and assistance. The cluster implemented several
steps to address this challenge, and its efforts are still ongoing. The first step taken by
the cluster was to develop a website and marketing material to improve visibility and
establish an identity. The second step was to increase the interactions between small
and large businesses in the cluster in order to improve cohesion among cluster
participants. Finally, the cluster organized the Great Lakes Symposium that was held
in October 2011, where top policymakers, power companies, and various non-profit
groups, including consumer and environmental protection groups, discussed key
topics in smart grid innovation. Multiple participating small businesses presented
their products and the cluster was showcased.
7.3. Lessons learned regarding the outreach and recruitment of small
businesses 1. Several clusters underscored the importance of devising a clear, compelling, and
easy-to-pitch value proposition for small businesses.
· The San Diego Defense Cluster reported a disappointingly low solicitation of
small businesses in the first quarter of SBA’s Cluster Initiative, especially when
considering the Center for Commercialization of Advanced Technologies’
(CCAT’s) track record and notoriety. The cluster attributed this problem to two
primary sources: the technology focus areas were not sufficiently defined to allow
companies to effectively relate their technology to the stated requirements, and
151

the value proposition was not sufficiently defined to allow companies to
determine the benefits of cluster participation. In particular, the San Diego
Defense Cluster noticed that it approached recruitment in the same way as CCAT
did, but it lacked CCAT’s ability to provide funding to small businesses, thus
removing a critical “carrot” that enhanced the value proposition. To address the
first source of the problem, the cluster in consultation with the Space and Naval
Warfare Systems Command (SPAWAR) and other DoD stakeholders added a
new, broader area of focus: Command, Control, Communications, Computers,
Intelligence, Surveillance, and Reconnaissance (C4ISR). As a result, a much
larger cross-section of technology-focused small businesses in the San Diego area
became eligible for cluster participation. To address the second source, the cluster
reworked its marketing pitch, created an open application on its website, and
explored an expanded number of channels for recruitment. These expanded
channels included greater discussions with prime contractors and leveraging the
SPAWAR’s Systems Center Pacific (SSC) Small Business Office. By the end of
the first year of SBA’s Cluster Initiative, the cluster reported significantly
improved solicitation and, at the moment, there are reportedly new companies
applying for membership nearly every day.
· The Defense Alliance reported that small business owners are often skeptical
when told about the cluster because they have previously dealt with middlemen in
defense procurement and did not get the expected value from their services. The
Defense Alliance experienced, therefore, an initial reticence on the part of small
businesses to get involved in the cluster until the value proposition and the past
track record of success had been outlined.
· The Huntsville Advanced Defense Technology Cluster noted that a virtuous cycle
can be created around the value provided by clusters and the information provided
by participants to the cluster. Offering value to participants enables clusters to
request information, which then provides more value to clusters through
networking and intelligence, enabling clusters to be more effective, increase
participation, and improve recruitment. Therefore, a clear articulation by the
152
cluster of its value proposition leads to stronger engagement of participants in the
cluster and further strengthens its value proposition.
2. There are differing views among the clusters in SBA’s Initiative about the role of
membership fees in outreach and recruitment. The Carolinas’ Nuclear Cluster
reported that a small membership fee significantly helped in securing truly motivated
and committed small businesses to be a part of the cluster. Membership fees can act
as a type of screening process because they require small businesses to commit funds
that would be wasted if the business were not proactive or seriously willing to
become engaged in the cluster. However, FlexMatters mentioned that charging
membership fees can create the perception that the cluster is not being an honest
broker, and that the cluster is offering assistance for money.
7.4. Lessons learned regarding small business funding and sales 1. FlexMatters – Northeast Ohio Technology Coalition implemented workshops on
venture and angel capital after identifying that funding opportunities were in high
demand by its members. Through the organization of these workshops, FlexMatters
found that many small businesses were very hesitant to consider venture and angel
capital because of the perception on the part of some small businesses that working
with venture capitalists could result in loss of control over their companies through
dilution of equity. As a result, the cluster changed its course in two ways: first, it
worked to highlight the advantages of venture and angel capital, such as expert
business guidance and expanded connections. Second, it incorporated other sources of
funding in its workshops. In particular, FlexMatters brought a regional bank on board
to provide loan opportunities and discuss small business loans available from the
SBA.
2. The Huntsville Advanced Defense Technology Cluster indicated that one of the
challenges facing Advanced Defense Technology small businesses is the difficulty of
responding to DoD or government procurement requirements in a timely fashion.
According to this cluster, the problem stems from two sources. First, small businesses
may have difficulty understanding the needs stated in various requests for
procurement by government agencies. Second, in many instances, small businesses
153
have developed technologies with characteristics that are similar to but not exactly
matching the specifications demanded in the procurement request. The Huntsville
Defense Cluster believes that there should be a focus on appraising such businesses
on the basis of the capabilities that enable them to develop the near-match product.
The cluster is working to mitigate these challenges, as stated by Markeeva Morgan,
the cluster administrator, who advises DoD agency personnel to “engage that
company and explain to them what you actually need, so that they can employ the
same capabilities to develop widget B that you actually need. And we’re starting to
have those conversations with federal government persons that hey, these guys don’t
know what you want; if you vector them in the right direction, they probably can give
it to you.”
3. The Carolinas’ Nuclear Cluster reported difficulties regarding the integration of
suppliers into the supply chain and industry procurement networks. Because of the
extremely stringent quality assurance requirements and intense oversight in the
nuclear energy industry, purchasers of goods and services tend to rely on well-known
and frequently used suppliers with whom they have an existing sourcing relationship.
This situation, though more acute in the nuclear industry, is commonplace in various
other industries and remains an important obstacle to overcome. The Carolinas’
Nuclear Cluster is working to reduce this constraint by providing quality assurance
workshops given by experts and encouraging cluster participants to network and
collaborate, to increase their ability to demonstrate their proficiency.
4. The Illinois Smart Grid Regional Innovation Cluster reported that the complete lack
of proof-of-concept funds available to small businesses involved in the smart grid
industry has prevented most of them from obtaining private capital, especially venture
or angel funds. Proof-of-concept funding is the very first funding stage of a small
business. For example, proof-of-concept enables the creation of a prototype in order
to attract subsequent capital. The cluster is working actively on resolving this through
the cluster partner, Clean Energy Trust, which will be launching a multi-million
dollar grant fund with an “evergreen” structure through which funds are re-granted
once returned. O-H Community Partners, another cluster partner and service provider,
154

is also seeking additional funds to provide proof-of-concept grants to cluster
members.
7.5. Lessons learned regarding cluster development 1. A major concern of young clusters is ensuring the buy-in and sustained participation
of various stakeholders. In order to maximize the buy-in of small businesses, the
Carolinas’ Nuclear Cluster involved the cluster small businesses in the strategic
planning stage of the cluster and encouraged them to voice their views on the plan
and their role in it. As a result, the Carolinas’ Nuclear Cluster administrator noted
during his interview that there had been no “clear demarcation of the end of the plan
and the beginning of the cluster.” This suggests that the cluster small business
participants’ involvement in the strategic plan seamlessly led to their involvement in
the cluster activities after the strategic planning phase.
2. The Northeast Electrochemical Energy Storage Cluster reported difficulties regarding
the integration of some of the existing state-based organizations into the clusters
activities. The Energy Storage Cluster is trying to integrate these preexisting state-
based organizations into the cluster in order to create a regional cluster covering the
Northeast of the United States. Although the Energy Storage Cluster reported that it
was particularly difficult to negotiate the integration of the Massachusetts Hydrogen
Coalition into the cluster, difficulties also emerged in the integration of some of the
other organizations. The cluster noted that some of these organizations were reluctant
to give up autonomy and their identity to enter the cluster or that they were reluctant
to accept responsibilities inherent in cluster participation. To resolve the problem, the
cluster took several steps: (1) it highlighted the value offered by the regional cluster
and included representatives of the organizations at speaking engagements and other
events; (2) it continued to use each organization’s identity and name in various
contexts, such as in marketing material; and (3) it made sure the meetings were
spread evenly around the region and that even the states with a lower level of activity
received fair representation.
3. The Carolinas’ Nuclear Cluster recognized that the Fukushima Daiichi earthquake
and subsequent tsunami in Japan have affected the public perception of the nuclear
155
industry around the world and in the United States. The cluster identified this
perception as a short-term concern and is looking at market opportunities that may
have emerged as a result. In particular, the Carolinas’ Nuclear Cluster is considering
potential opportunities resulting from potential nuclear safety upgrades and the need
to “on-shore” the nuclear energy supply chain.
7.6. Lessons learned regarding teaming and collaboration 1. The Huntsville Defense Cluster mentioned that in government procurement, it is
commonly assumed that large companies in partnerships or collaborations should
automatically be the prime contractor. The cluster also noted that this mindset is
somewhat present in small businesses themselves. The cluster pointed out an
alternative approach in which small businesses would partner with each other to
pursue larger government contracting opportunities instead of pursuing only small
business-specific opportunities or accepting a sub-contractor role by default. Such
integration between small businesses would not only allow them to pursue larger
opportunities at DoD but also provide them with valuable experience in dealing with
DoD agencies. Markeeva Morgan, the Huntsville Defense Cluster administrator, has
encouraged these collaborations: “We’ve identified cases where integration between
two or more small businesses enables them to provide a fairly unique, high-quality
solution, and those businesses had never talked to one another before, had never
considered doing business together.”
2. The Defense Alliance noted a greater-than-expected demand for partnerships and
collaborations. As a result, the Defense Alliance sought to connect small businesses
with each other or, in some cases, with large contractors. Chip Laingen, the Defense
Alliance cluster administrator, reported, “We’re hearing that more than what we
thought we would in terms of companies not wanting to necessarily go it alone.
We’re looking for other small companies and even prime defense contractors to take
technology forward with them.” Mr. Laingen also explained that the major
contractors can bridge the gap between small businesses and DoD agencies largely
due to their extensive experience, specialization, and resources in dealing with DoD
agencies. For example, major contractors can utilize their extensive network of DoD
156
contacts as well as their small business liaison staff to identify small businesses that
are the most relevant to the DoD contract needs. The informational advantage of the
large contractors was also noted by Mr. Morgan, who reported that the same large
contractors can be found at all the large DoD conferences, whereas the small
businesses that are present are rarely the same from one conference to the other.
3. FlexMatters changed its approach to fostering collaboration among cluster members
during the first year of the initiative. Initially the cluster had a top-down approach to
teaming and collaboration that involved the cluster sourcing workshops. During these
workshops, small and large businesses would meet and brainstorm on needs and
capabilities. Several of these workshops were held, but the results did not live up to
expectations. In particular, the needs listed by large companies were too broad, and
concerns regarding intellectual property issues arose. Consequently, during the spring
of 2011, the cluster drastically changed its approach and began focusing on smaller-
scale, shorter-term projects, termed “quick hits,” for which intellectual property
concerns were minimized. In addition, the cluster reversed the previous top-down
approach by assigning flexible electronics experts to cluster members. These experts
helped cluster members to realistically assess their capabilities, strengths, and
weaknesses, and to identify large companies whose needs could be effectively
addressed.
157
8. Conclusion In September 2010, the SBA launched the Regional Cluster Initiative, a pilot program to
promote and support ten clusters across the United States. The Regional Cluster Initiative
provides funding to the organizing entities of the ten clusters in order to increase opportunities
for small business participation within the clusters, promote innovation in the industries on
which the ten clusters are focused, and enhance regional economic development and growth.
This report presents the findings and outcomes of the year-one evaluation of the initiative.
The evaluation was comprised of two primary components: an implementation evaluation
and an outcome evaluation. The implementation evaluation focused on how the initiative was
implemented across the ten clusters and the services that each cluster provided to its small
businesses; the outcome evaluation focused on both the short-term/intermediate outcomes that
were linked directly to the cluster services provided to the small businesses and the long-term
outcomes that were partially dependent on the extent to which the short-term/intermediate
outcomes were achieved. The evaluation methodology included the analysis of data from several
primary sources, such as surveys, interviews, quarterly and annual reports, and from secondary
sources, which were primarily used for the comparison of several outcome measures.
A systematic analysis of the ten clusters suggested that there is considerable variation
among the ten clusters across key dimensions. Each cluster has a specific industrial focus,
ranging from flexible electronics to agricultural technology. Each has a unique approach to
delivering value to participating small businesses, dictated in large part by the strengths of the
private sector in the cluster’s region, the skilled labor pool, and the specializations of the
research community. The ten clusters also vary in their age/length of time established, stage of
development, and governance structures. However, one feature all of the clusters have in
common is a focus on emerging and high technology.
The services, activities, and events the clusters provided to small business participants
during year one focused on several key areas, ranging from facilitating targeted connections and
networking between small businesses, large companies and the government, to creating key
linkages between businesses and academic institutions in the transfer of new technology or
concepts into the marketplace. Clusters saw the highest small business participation in one-on-
158

one sessions focused on finance, contracting opportunities, and intellectual property and training
sessions focused on business development. This study also found that a majority of the clusters
leveraged one or more of the SBA’s resource partners. The clusters also utilized the expertise of
third-party organizations such as university-based technology centers. Over 85% of the small
businesses surveyed reported that the services and activities provided by the cluster were unique
and could not be found elsewhere.
The evaluation of the initiative’s first year revealed that the ten clusters grew and
developed their networks across a wide spectrum of stakeholders, ranging from
universities/research institutions and foundation/nonprofit organizations to business associations
and public sector agencies. The most marked growth has been in small business participation,
which grew by over 275% during year one. Survey results suggest that small businesses joined
the cluster primarily to network with other small businesses and to gain access to new markets.
Large organizations, including large businesses, universities, research institutions, and nonprofit
organizations, reported that their primary motivation for participating in the clusters was to help
spur regional economic development.
Among the key outcomes observed during year one of the initiative, seven new
businesses were started after cluster participation. Average full-time employment in the small
businesses that participated in the clusters increased by 7.6%. Average total employment (the
sum of full-time and part-time employees) grew by 11.2%. The small businesses that participated
in the clusters also experienced growth in revenue and payroll. The average revenue of small
business participants increased by 13.7%, with nine out of the ten clusters experiencing an
increase in the average revenue of small business participants. The average payroll of small
business participants also increased by 23.4%, with all ten clusters experiencing an increase in
the average payroll of small business participants.
Preliminary findings based on the small businesses’ self-reporting also suggest that the
clusters have played a role in spurring innovation among small business participants.
Approximately 69% of the small businesses that indicated having sought or received cluster
services reported having developed new products or services as a result of their cluster
participation, while 54% reported having commercialized new technology as a result of cluster
159
participation. Although only 22% of the small businesses that sought or received cluster services
reported having pending patent applications, the expectation is that as clusters strengthen and
build networks, the number of patents applied for and obtained may increase.
Additionally, the clusters have provided services during year one of the initiative to assist
small businesses in obtaining contracts and subcontracts, private capital and loans, Small
Business Innovation Research/Small Business Technology Transfer (SBIR/STTR) awards, and
other grants. Cluster administrators provided the value of economic activity related to two
categories: activity tied in a direct way to cluster assistance to the small business participants,
and activity indirectly tied to the cluster by virtue of the small business being an active
participant in the cluster. They reported that small business participants in the ten clusters
obtained contracts or subcontracts totaling over $217 million, external funding through private
funding sources (venture capital, angel capital) totaling nearly $48 million, SBIR/STTR awards
totaling over $6.5 million, and grants totaling $1.7 million.
The initial findings and outcomes indicate that the clusters have increased opportunities
for small business participation within the ten clusters and made strides toward promoting
innovation in their respective industries, and that the small businesses that participated in the
clusters impacted regional economic development and growth. These preliminary findings will
be further measured during the year-two evaluation of the SBA’s initiative. Possible additional
areas of focus include measuring the quantity of the services offered by the clusters, outcomes
focused on innovation and the extent to which the clusters are developing and fostering networks
and markets beyond their regions.
160
References Andersson, T., Serger, S. S., Sörvik, J., & Hansson, E. W. (2004). The Cluster Policies
Whitebook. International Organization for Knowledge Economy and Enterprise
Development. IKED.
Bathelt, H., Malmberg, A., & Maskell, P. (2004). Clusters and knowledge: local buzz, global
pipelines and the process of knowledge creation. Progress in Human Geography, 28(1),
31-56.
Becattini, G. (1990). The Marshallian Industrial District as a Socio-economic Notion. In F. B.
Pyke, Industrial Districts and Inter-Firm Cooperation in Italy. Geneva: International
Institute for Labour Studies.
Bureau of Economic Analysis. (1997). REGIONAL MULTIPLIERS: A User Handbook for the
Regional Input-Output Modeling System (RIMS II). Washington: U.S. Department of
Commerce.
Ceglie, G., & Dini, M. (1999). SME cluster and network development in developing countries:
the experience of UNIDO. United Nations Industrial Development Organization.
Cortright, J. (2006). Making Sense of Clusters: Regional Competitiveness and Economic
Development. The Brookings Institution, Metropolitan Policy Program, Washington,
D.C.
Hincapie, D., & Wolman, H. (2010). Clusters and Cluster-Based Development: A Literature
Review and Policy Discussion. Working Paper.
Ingstrup, M. B., Freytag, P. V., & Damgaard, T. (2009). Cluster initiation and development: A
critical view from a network perspective! 25th IMP Conference.
International Trade Department. (2009). Clusters for Competitiveness. Washington DC: The
World Bank.
Krugman, P. (1992). Geography and Trade. MIT Press.
161
Porter, M. E. (1990). The competitive advantage of nations. New York: Free Press.
Porter, M. E. (1998). Clusters and the New Economics of Competition. Harvard Business
Review.
Porter, M. E. (2001). Clusters of innovation: regional foundations of U.S. competitiveness.
Council on Competitiveness.
Porter, M. E., & Bond, G. C. (2008). The California Wine Cluster. Cambridge: Harvard Business
School.
Sforzi, F. (1990). The Quantitative Importance of Marshallian Industrial Districts in the Italian
Economy. In F. B. Pyke, Industrial Districts and Inter-Firm Cooperation in Italy.
Geneva: International Institute for Labour Studies.
Vom Hofe, R., & Chen, K. (2006). Whither or not industrial cluster: conclusions or confusions?
The Industrial Geographer, 4(1), 2-28.
162
9. Appendix A. San Diego Advanced Defense Technology Cluster
Case Study The SBA’s Regional Cluster Initiative provides funding to 10 selected clusters—
geographically concentrated groups of interconnected businesses, suppliers, service providers,
and associated institutions in a particular industry or field—across the United States. These
particular clusters were selected to receive funding on the basis of their ability and potential to
assist small businesses
163
36 within a specific industry and geographic scope. The goals of SBA’s
Cluster Initiative are to: (1) increase opportunities for small business participation within the
clusters, (2) promote innovation in the industries on which the 10 clusters are focused, and (3)
enhance regional economic development and growth in the regions in which the 10 selected
clusters operate. The San Diego Advanced Defense Technology Cluster, the subject of this case
study, is one of three clusters in the Cluster Initiative to focus nearly exclusively on innovations
and procurement for the defense marketplace. The aim of this case study is to provide insight
into the structure, operations, and achievements of the San Diego Defense Cluster at the end of
the first year of SBA’s Cluster Initiative.
Created in 2010 with SBA funding, the San Diego Defense Cluster was built upon the
robust, preexisting foundations provided by the Center for Commercialization of Advanced
Technology (CCAT). CCAT—a collaborative partnership in San Diego, California among
academia, industry, and government—was created in 1999 to “identify new technologies critical
to national defense and homeland security and accelerate their commercialization via a national
partnership of universities, industry and government.”37
As a result of this common foundation, the San Diego Advanced Defense Technology
Cluster shares much of its core structure and approach with CCAT. Both are managed by the San
Diego State University (SDSU) Research Foundation; both include most of the same partners,
service providers, and federal clientele; and both focus on Department of Defense (DoD)
requirements and the needs of combat personnel and first responders. Despite this kinship, there
are some important differences between the two organizations. First, the San Diego Defense
36 Broadly defined here as businesses with less than 500 employees. For a more comprehensive definition from the SBA, please see http://www.sba.gov/sites/default/files/files/Size_Standards_Table.pdf. 37 Center for Commercialization of Advanced Technology. Mission statement. CCAT Newsletter, 13, 4. Retrieved from http://www.ccatsocal.org/nwsltrs/Jan08ADA1newsltr.pdf.
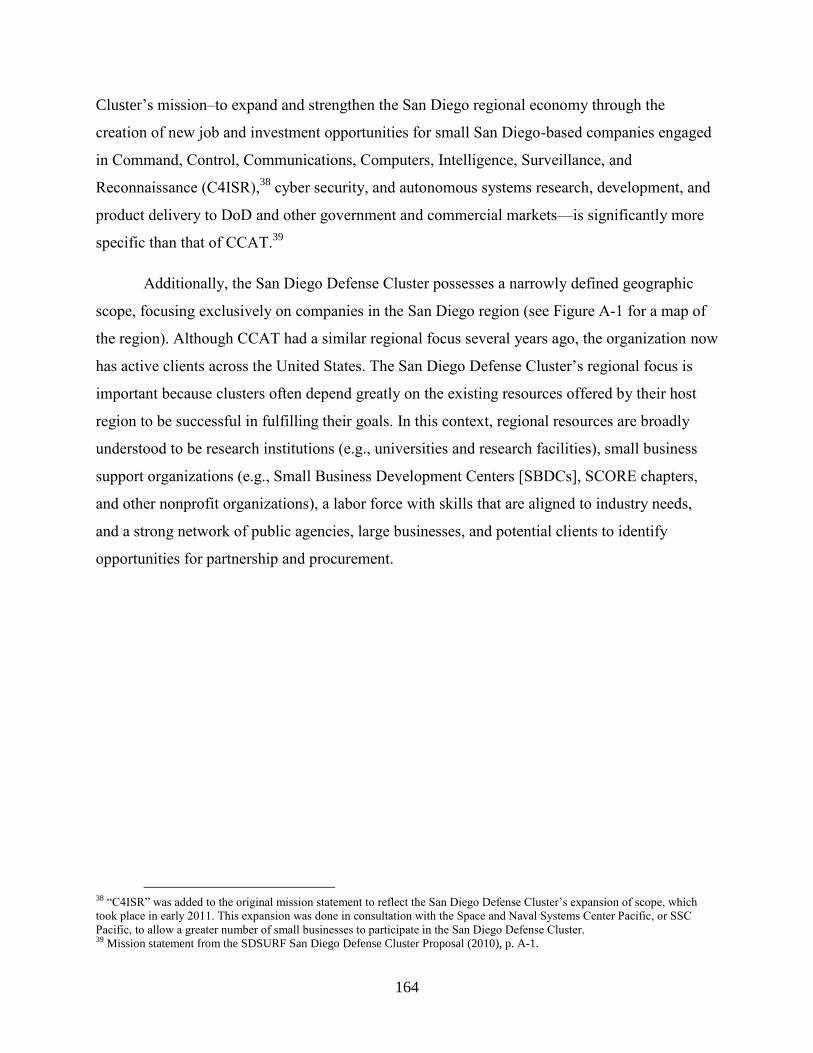
Cluster’s mission–to expand and strengthen the San Diego regional economy through the
creation of new job and investment opportunities for small San Diego-based companies engaged
in Command, Control, Communications, Computers, Intelligence, Surveillance, and
Reconnaissance (C4ISR),
164
38 cyber security, and autonomous systems research, development, and
product delivery to DoD and other government and commercial markets—is significantly more
specific than that of CCAT.39
Additionally, the San Diego Defense Cluster possesses a narrowly defined geographic
scope, focusing exclusively on companies in the San Diego region (see Figure A-1 for a map of
the region). Although CCAT had a similar regional focus several years ago, the organization now
has active clients across the United States. The San Diego Defense Cluster’s regional focus is
important because clusters often depend greatly on the existing resources offered by their host
region to be successful in fulfilling their goals. In this context, regional resources are broadly
understood to be research institutions (e.g., universities and research facilities), small business
support organizations (e.g., Small Business Development Centers [SBDCs], SCORE chapters,
and other nonprofit organizations), a labor force with skills that are aligned to industry needs,
and a strong network of public agencies, large businesses, and potential clients to identify
opportunities for partnership and procurement.
38 “C4ISR” was added to the original mission statement to reflect the San Diego Defense Cluster’s expansion of scope, which took place in early 2011. This expansion was done in consultation with the Space and Naval Systems Center Pacific, or SSC Pacific, to allow a greater number of small businesses to participate in the San Diego Defense Cluster. 39 Mission statement from the SDSURF San Diego Defense Cluster Proposal (2010), p. A-1.
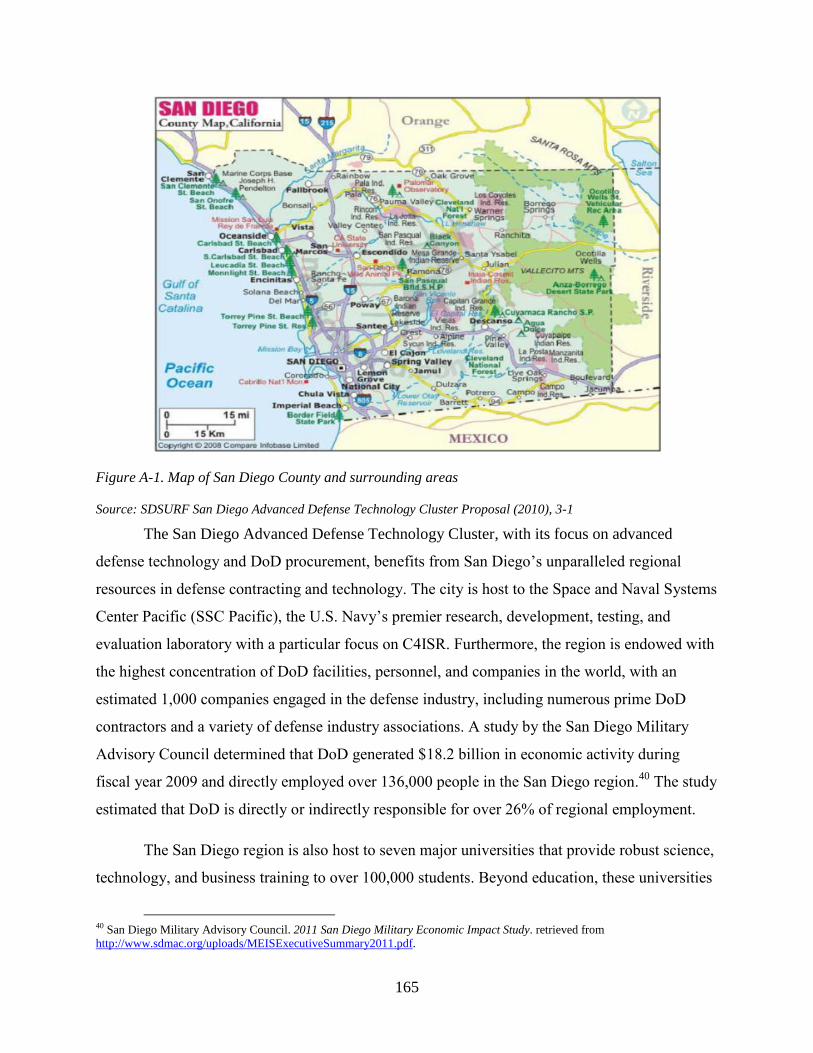
Figure A-1. Map of San Diego County and surrounding areas
Source: SDSURF San Diego Advanced Defense Technology Cluster Proposal (2010), 3-1
The San Diego Advanced Defense Technology Cluster, with its focus on advanced
defense technology and DoD procurement, benefits from San Diego’s unparalleled regional
resources in defense contracting and technology. The city is host to the Space and Naval Systems
Center Pacific (SSC Pacific), the U.S. Navy’s premier research, development, testing, and
evaluation laboratory with a particular focus on C4ISR. Furthermore, the region is endowed with
the highest concentration of DoD facilities, personnel, and companies in the world, with an
estimated 1,000 companies engaged in the defense industry, including numerous prime DoD
contractors and a variety of defense industry associations. A study by the San Diego Military
Advisory Council determined that DoD generated $18.2 billion in economic activity during
fiscal year 2009 and directly employed over 136,000 people in the San Diego region.
165
40 The study
estimated that DoD is directly or indirectly responsible for over 26% of regional employment.
The San Diego region is also host to seven major universities that provide robust science,
technology, and business training to over 100,000 students. Beyond education, these universities
40 San Diego Military Advisory Council. 2011 San Diego Military Economic Impact Study. retrieved from http://www.sdmac.org/uploads/MEISExecutiveSummary2011.pdf.
play an important role in research, innovation, and in supporting entrepreneurship through
technology transfer. The combination of companies, associations, and universities, in addition to
the large number of veterans in the region, implies a highly skilled and experienced workforce
well suited for creating new, highly innovative small businesses. Furthermore, the San Diego
region has a strong entrepreneurial spirit: over 90% of its businesses have 12 or fewer
employees. The high number of small businesses in the region provides an opportunity for the
cluster to address their needs and strengthen their participation in the regional economy.
Finally, a more subtle difference between the San Diego Defense Cluster and CCAT is
the cluster’s focus on addressing requirements and filling gaps for DoD in four specific niches:
autonomous systems, cyber security, renewable energy, and C4ISR. The technology focus of the
San Diego Advanced Defense Technology Cluster is regularly reassessed by SDSU in
consultation with DoD and the Space and Naval Warfare Systems Command (SPAWAR), based
on the current and upcoming needs of combat personnel and first responders. In contrast, CCAT
appears to possess a significantly broader technology focus.
A.1. San Diego Defense Cluster Structure
A cluster is by nature a collaborative partnership among stakeholders involved in various
activities related to the focus industry. The nature of these stakeholders can vary widely from one
cluster to another, but they can generally be categorized into three distinct sectors. The first and
most central is the private sector, which is generally composed of small and large businesses and
industry associations. The second is the public sector, which encompasses various local,
regional, and national government entities. Universities and research institutions make up the
third sector.
A well-known approach to strengthening clusters, referred to as the triple helix, involves
incorporating stakeholders from all three sectors, industry, government, and universities, in the
organization of the cluster as each sector uniquely contributes to a cluster’s success.
166
41 The San
Diego Defense Cluster’s structure is in alignment with this model. Its principal partners and key
stakeholders, listed in Table A-1, include small and large companies, four business associations,
two research universities, several economic development agencies, two other regional clusters
41 For more information on the triple helix model, please see Etzkowitz, Henry; Leydesdorff, Loet (eds.) (1997), Universities and the Global Knowledge Economy: A Triple Helix of University-Industry-Government Relations.

with compatible foci, and various business service providers. These business service providers
each have a unique role to play in assisting small businesses. These roles are broadly outlined in
the last column of Table A-1. Not surprisingly, the San Diego Defense Cluster’s principal
partners, the cluster service providers, have remained the same over the first year of SBA’s
Cluster Initiative, largely because their initial selection was based on their longstanding
relationships with CCAT. Key stakeholder composition has evolved little, aside from the
inclusion of two additional DoD prime contractors: BAE Systems and Northrop Grumman.
In addition, a review of the San Diego Defense Cluster’s structure reveals a heavy
reliance on various service providers and their diversity of expertise to achieve the cluster’s goals
of assisting small businesses and DoD agencies. This reliance is rooted in the fact that the cluster
perceived its role principally as a coordinator of services for its small business members and to a
lesser degree as a provider of services. During an interview with the cluster administration team,
San Diego Advanced Defense Technology Cluster Project Director, Lou Kelly, mentioned, “We
[the cluster management team] are not trying to duplicate things that other people are already
doing. We are trying to use those and then bring it all together with other services that kind of
knit it all together so that the whole region is coming together to help the small businesses.”
Table A-1. Key stakeholders and partners in the San Diego Defense Cluster, by stakeholder category (see Figure A-2), as of November 2011
167
Organization Organization type Role
Armed Forces Communications and Electronic Association
Defense Industry Association
Provides a forum for information exchange on IT, communications, and electronics for defense
Association for Unmanned Vehicle Systems
Promotes and supports the unmanned systems community through forums and activities
National Defense Industrial Association
Advocates for new technologies, provides a forum for interactions, promotes government-industry interactions
San Diego Software Industry Council Industry Association
Provides a forum for exchanging ideas, sharing resources, and promoting industry goals with government and educational institutions
San Diego Regional Economic Development Corporation
Economic Development Organization
Assists with workforce training, business retention, expansion, and relocation
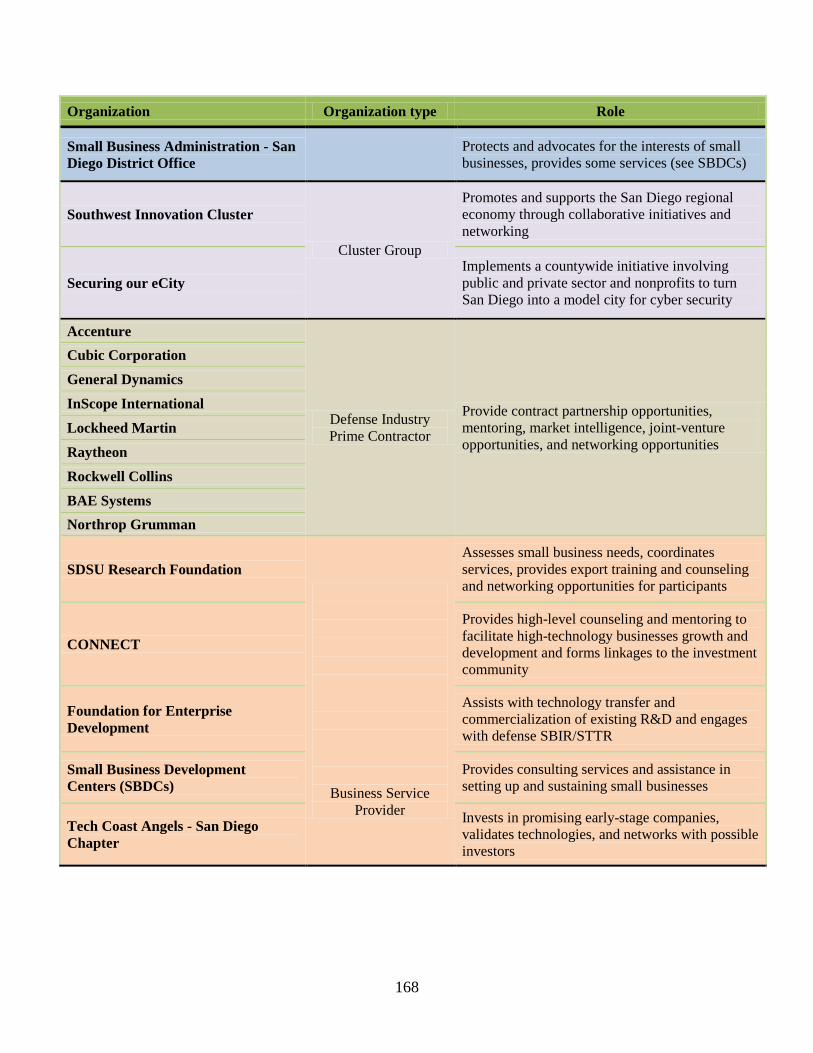
168
Organization Organization type Role
Small Business Administration - San Diego District Office
Protects and advocates for the interests of small businesses, provides some services (see SBDCs)
Southwest Innovation Cluster
Cluster Group
Promotes and supports the San Diego regional economy through collaborative initiatives and networking
Securing our eCity Implements a countywide initiative involving public and private sector and nonprofits to turn San Diego into a model city for cyber security
Accenture
Defense Industry Prime Contractor
Provide contract partnership opportunities, mentoring, market intelligence, joint-venture opportunities, and networking opportunities
Cubic Corporation
General Dynamics
InScope International
Lockheed Martin
Raytheon
Rockwell Collins
BAE Systems
Northrop Grumman
SDSU Research Foundation
Business Service Provider
Assesses small business needs, coordinates services, provides export training and counseling and networking opportunities for participants
CONNECT
Provides high-level counseling and mentoring to facilitate high-technology businesses growth and development and forms linkages to the investment community
Foundation for Enterprise Development
Assists with technology transfer and commercialization of existing R&D and engages with defense SBIR/STTR
Small Business Development Centers (SBDCs)
Provides consulting services and assistance in setting up and sustaining small businesses
Tech Coast Angels - San Diego Chapter
Invests in promising early-stage companies, validates technologies, and networks with possible investors
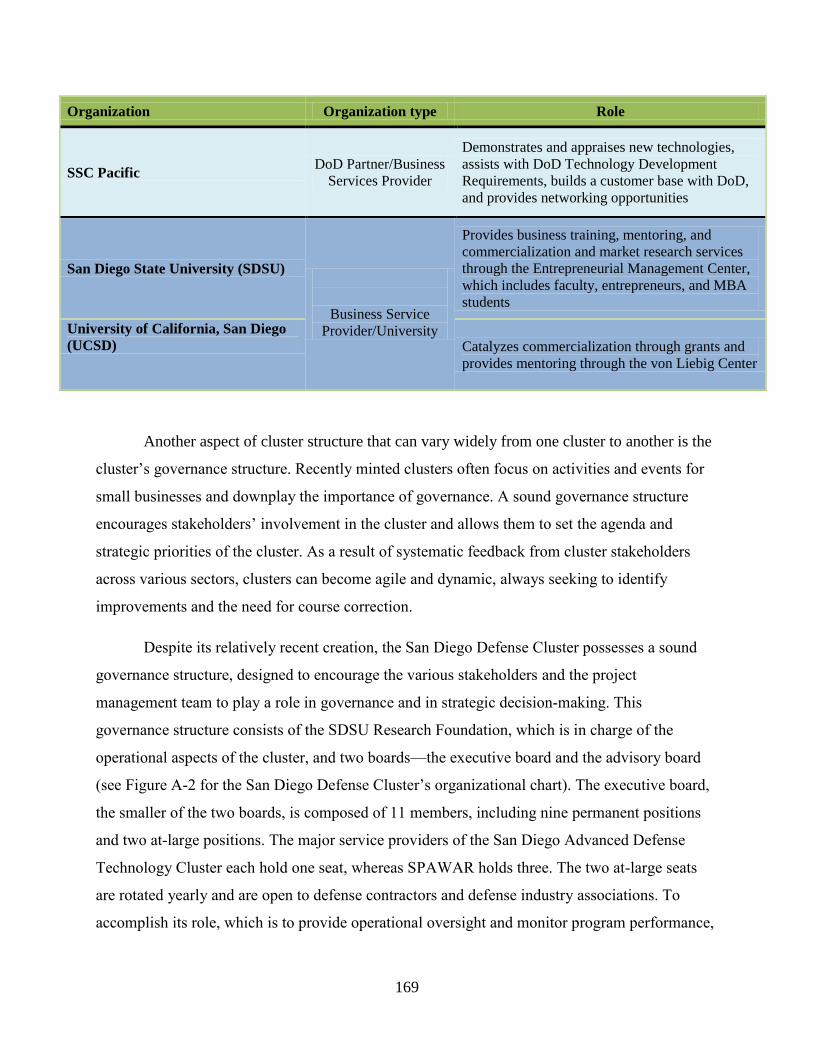
169
Organization Organization type Role
SSC Pacific DoD Partner/Business Services Provider
Demonstrates and appraises new technologies, assists with DoD Technology Development Requirements, builds a customer base with DoD, and provides networking opportunities
San Diego State University (SDSU)
Business Service Provider/University
Provides business training, mentoring, and commercialization and market research services through the Entrepreneurial Management Center, which includes faculty, entrepreneurs, and MBA students
University of California, San Diego (UCSD) Catalyzes commercialization through grants and
provides mentoring through the von Liebig Center
Another aspect of cluster structure that can vary widely from one cluster to another is the
cluster’s governance structure. Recently minted clusters often focus on activities and events for
small businesses and downplay the importance of governance. A sound governance structure
encourages stakeholders’ involvement in the cluster and allows them to set the agenda and
strategic priorities of the cluster. As a result of systematic feedback from cluster stakeholders
across various sectors, clusters can become agile and dynamic, always seeking to identify
improvements and the need for course correction.
Despite its relatively recent creation, the San Diego Defense Cluster possesses a sound
governance structure, designed to encourage the various stakeholders and the project
management team to play a role in governance and in strategic decision-making. This
governance structure consists of the SDSU Research Foundation, which is in charge of the
operational aspects of the cluster, and two boards—the executive board and the advisory board
(see Figure A-2 for the San Diego Defense Cluster’s organizational chart). The executive board,
the smaller of the two boards, is composed of 11 members, including nine permanent positions
and two at-large positions. The major service providers of the San Diego Advanced Defense
Technology Cluster each hold one seat, whereas SPAWAR holds three. The two at-large seats
are rotated yearly and are open to defense contractors and defense industry associations. To
accomplish its role, which is to provide operational oversight and monitor program performance,

the executive board meets monthly to devise action items and assign specific topics to work
groups. In comparison, the advisory board is composed of roughly 50 seats, which are held by at
least one member of each of the San Diego Defense Cluster stakeholders. The advisory board has
a significantly different role from that of the executive board. It focuses on coordinating the
numerous stakeholders and promoting various opportunities and activities in the region that are
relevant to the small businesses participating in the San Diego Defense Cluster.
Figure A-2. Cluster organizational chart, including the key San Diego Defense Cluster stakeholders and partners. Underlined stakeholder groups are outlined in detail in Table A-1
A.2. Small Business Identification and Recruitment
Unlike the number of principal partners and key stakeholders of the San Diego Defense
Cluster, the number of small businesses assisted by the San Diego Defense Cluster has grown
significantly, from zero small businesses at the beginning of SBA’s Cluster Initiative to 25 small
businesses currently reported as receiving cluster services or being in the cluster intake process.
The San Diego Defense Cluster uses various channels for small business recruitment, including
170
using local industry associations’ membership databases to identify possible matches, giving

presentations about the cluster at various events organized by partners, and holding discussions
with the SSC Pacific Small Business Office the local chapter of the SBA, and prime contractors.
Not all of these channels were used initially, and early challenges with the recruitment process
led to a disappointingly low number of applications for cluster services in the first few months of
operations. The causes of these challenges were identified in late 2010 and were corrected by
expanding the technology focus area, based on DoD priorities, which led to recruiting directly
through the SSC Pacific Small Business Office, and to designing a marketing strategy that
included a website with an open application for cluster participation. This course correction
significantly improved recruitment. In a recent interview with the San Diego Advanced Defense
Technology Cluster management team, Lou Kelly stated, “[The San Diego Defense Cluster]
seems to be growing basically every day to the extent that we have to be careful that we don’t
outgrow our bandwidth here at the program.”
The San Diego Defense Cluster has been selective about which small businesses receive
cluster assistance due to resource limitations, the cluster’s specific technology foci, and a limited
time span to achieve the objectives of the SBA funding. As Bernard Janov, the San Diego
Defense Cluster administrator, stated, “We don’t try to meet all the companies but a select few
that have a value of interest to DoD.” Accordingly, the San Diego Defense Cluster devised a
robust intake process to assess both the needs of interested small businesses and whether the
products and technology they offer are suitable to DoD’s needs. The latter part is particularly
important because, as Mr. Janov stated, “The greatest majority of the small companies that we
are working with are not currently in the DoD arena. They have commercial products, [but] they
have worked predominantly in other [markets] than DoD.”
After submitting an online application, small businesses meet with the cluster team,
which then compiles a letter defining action items to be undertaken by each party. The final step
is the creation of quad charts and white papers for each technology, in order to help promote and
disperse the technological innovations of the small businesses to potential clients and within the
San Diego Defense Cluster. This process not only directs what type of assistance should be
provided to each small business but also allows the San Diego Defense Cluster to select the small
businesses that are most likely to benefit from cluster assistance.
171

A.3. Cluster Activities and Events
The San Diego Advanced Defense Technology Cluster devised a wide array of services
and events for participating small businesses because of the different needs that the San Diego
Defense Cluster small businesses exhibit, based on their various stages of development. The
cluster management team is keenly aware of these differing stages of development, as reflected
in this statement by Lou Kelly, “All of these companies are unique from the standpoint that
they’re all going in different directions, they’re at a different place in time, and they need
different things now.” Despite these divergent needs, the defense industry, because of its
structure and procurement methods, engenders a variety of shared hurdles for small businesses.
As a result, small businesses also share many common needs.
For example, in a survey of small businesses participating in the San Diego Defense
Cluster, most reported joining the cluster to gain access to government procurement
opportunities—the single most difficult challenge to overcome for a small business involved in
the defense industry. The CEO of a cluster member company stated that the largest hurdle facing
small businesses in the defense technology industry is “how to take [their] technologies and
deploy them.” Another small business involved in the cluster corroborated this statement:
Being small, you just don’t get the opportunities to market, and you don’t have the resources to go out there and market [to] these agencies to help you grow your business... [small businesses] are held to the same standards as defense contractors where, you know, when we work with Raytheon, they have a whole group, a whole company group who does nothing but interpret Federal Acquisition Regulations and contractual language, and here I am. I’m it.
In order to eliminate hurdles to working with the defense industry, the San Diego
Advanced Defense Technology Cluster takes a multipronged approach. First, it maintains an
extensive network of individuals in the various DoD agencies and at the prime contractors,
affording exposure to DoD opportunities, ranging from funding such as Small Business
Innovation Research/Small Business Technology Transfer (SBIR/STTR) awards to Broad
Agency Announcements, to teaming and partnering opportunities. Funding opportunities are
communicated to cluster members regularly and are listed on the cluster’s website. The CEO of a
cluster member company explained it this way: “[The San Diego Defense Cluster has] got their
172
finger on the pulse, you know, of everything that comes out of the Navy, the Department of
Homeland Security, and the National Oceanic and Atmospheric Administration. All the areas
that we’re particularly interested in, they have very good connections.”
In addition, the cluster and its service partners provide services specifically designed to
support small businesses pursuing these opportunities. Such assistance includes helping with
writing applications, providing mentoring to entrepreneurs in areas such as placement on the
General Services Administration Schedule, and hosting high value networking events at which
prime contractors provide advice about the industry and seek partners in applying for various
projects. For example, the cluster combined these various services when it assisted one small
business member company with submitting a joint proposal with a large prime contractor to the
Department of Commerce. The San Diego Defense Cluster’s assistance to the same small
business also involved offering the use of SDSU faculty and computing resources to create
needed simulation tools. The San Diego Defense Cluster has fostered many other strategic
partnerships, including one with Hewlett Packard and one with Science Applications
International Corporation. Of the cluster’s small businesses that were surveyed, 50% report that
they have established at least one new ongoing business relationship as a result of the San Diego
Defense Cluster’s assistance, and nearly 30% report three or more.
Just as importantly, the San Diego Defense Cluster’s connections to clients and partners
allow small businesses to showcase and demonstrate their technologies through events organized
by the cluster or identified through the cluster network. This has been an area of significant
activity for the San Diego Defense Cluster, which sponsored many cluster small businesses at
various events, including the Small Business Innovation Showcase and the DoD Coalition
Warrior Interoperability Demonstration, which is attended by representatives of various allied
forces, such as Australia, Canada, the United Kingdom, and NATO. Some of these events are
also conducted under the auspices of various cluster stakeholders. Examples include regional
business service provider CONNECT and its Connect With CONNECT technology showcase
event, with over 700 attendees registered for its Most Innovative New Product Awards, for
which two small business participants in the cluster were 2011 finalists in the “Aerospace and
Security Technologies” category. Business associations involved in the cluster also offer
173
networking and showcasing opportunities through symposiums and conferences.
Surveys conducted among the San Diego Defense Cluster’s participants indicate that
cluster services were well received by the small businesses. Most small businesses reported
attending showcase and networking events “often” and 78% reported receiving training,
counseling, or attending workshops at least once every quarter. Given that time is one of the
most precious resources for small business owners and executives, these statistics on small
business participation reflect the high value that small businesses receive from cluster services
and events. All respondent small businesses also reported that the San Diego Defense Cluster’s
combination of services and activities were unique or would have been prohibitively costly if
sought elsewhere. Furthermore, 57% (8 out of 14 responses) of respondents also mentioned that
they were “very satisfied” with the cluster’s services and activities, and 21% (3 out of 14
responses) reported being “satisfied” with the services and activities provided.
One of the other areas in which the San Diego Advanced Defense Technology Cluster
has provided assistance to small businesses is funding opportunities. Gaining access to various
funding opportunities for research and business expansion has been identified as a common
constraint facing small businesses. Several small business owners mentioned this constraint
during the small business interviews. One such business owner indicated that “raising money for
a small company, especially in this climate, is very difficult.” Small businesses in the defense
industry can obtain funding for research through SBIR and STTR awards, which are comprised
of three distinct phases as the technology moves from early stages to commercialization.
Alternatively, they can rely on more traditional financing, such as small business loans and
venture or angel capital. For example, during the first year of SBA’s Initiative, the San Diego
Defense Cluster assisted small businesses with 11 SBIR Phase I proposals, 1 SBIR Phase II
proposal, and 1 U.S. Army technology demonstration funding proposal. In addition, the cluster
assisted with funding opportunities through Tech Coast Angels, a cluster stakeholder and the
leading source of early-stage funding in Southern California.
A.4. San Diego Defense Cluster’s Outcomes during SBA’s Cluster Initiative
Although it is a relatively young cluster founded in 2010, the San Diego Defense Cluster
has effectively utilized the institutional knowledge of the CCAT experience and its extensive
regional assets to launch services and events aimed at assisting small businesses to gain entry
into the defense industry. As a further measure of success, the San Diego Defense Cluster has
174
been selected for an additional funding opportunity with the SBA as part of its Small Business
Teaming Pilot Program,
175
42 with an award of $500,000 per year. It has also been selected as one of
the clusters in the Jobs and Innovation Accelerator Challenge, a collaborative funding
opportunity launched in September 2011 and coordinated by the Department of Commerce’s
Economic Development Agency, the Department of Labor’s Employment and Training
Administration, and the SBA.
The small businesses participating in the San Diego Cluster have also reported increased
performance in several key business indicators as a result of their participation in the cluster. Of
responding small businesses, 67% (8 out of 12 respondents)43 agreed or strongly agreed that they
revised their marketing strategy as a result of cluster participation. Another 58% (7 out of 12
respondents) agreed or strongly agreed that they developed new products and services as a result
of cluster participation, while 67% of responding small businesses surveyed (8 out of 12
respondents) reported agreeing or strongly agreeing that cluster participation enabled them to
achieve commercialization of new technology. In addition, given the focus of the San Diego
Defense Cluster on networking and collaboration, it is not surprising that 71% of responding
small businesses (10 out of 14 respondents) also agreed or strongly agreed that cluster
participation enabled them to achieve collaboration with other businesses in their region. These
results suggest that the small businesses in the San Diego Defense Cluster benefit in tangible
ways from their participation in the cluster. The benefits are observed in particular in areas
related to the commercialization process, from crafting a suitable strategy to developing products
and services aligned with market needs to putting these products on the market.
Moving forward, the San Diego Advanced Defense Technology Cluster is poised to
continue providing highly relevant services and events to small businesses. The cluster’s planned
activities for early 2012, for example, include a workshop for small businesses and large defense
contractors focused on improving teaming and project execution. The San Diego Defense Cluster
also indicated that it would continue its emphasis on placing a significant share of its small
42 The SBA’s Small Business Teaming Pilot Program, made possible by the Small Business Jobs Act, awards grants to organizations for training, counseling, and mentoring to help small businesses enter into teaming relationships and compete for larger federal contracts. 43 The total number of responses varies between survey questions because not all small businesses answered all questions, and those that marked the response, “Did not seek/receive service,” were not counted as part of the total. This approach is taken consistently throughout this case study when discussing survey responses.

businesses on the General Services Administration Schedule and implementing functional
enhancements to the cluster website. Lastly, the cluster is still expanding, as three additional
small businesses are expected to complete the intake process by the end of 2011.
176

10. Appendix B. FlexMatters Cluster Case Study The FlexMatters – Northeast Ohio Technology Coalition, based in Cleveland, Ohio,
focuses on the nascent flexible electronics industry. Flexible electronics, which are electronic
devices printed on flexible plastic materials, are emerging as a newly commercialized technology
and a growing manufacturing opportunity driven by the global demand for electronic products
that are lighter, smaller, and more energy efficient. Flexible electronic devices are lightweight
yet rugged, transparent, and environmentally friendly, as well as less expensive and less complex
to manufacture than traditional electronics, due to their greater fault tolerance and higher
throughput manufacturing. The unique characteristics of these devices mean they can be
integrated into items like clothing, packaging, and portable devices in ways that traditional
electronics cannot be.
An important technological development in flexible electronics today is the creation of
liquid crystal displays (LCDs) that are flexible, unlike their traditional counterparts. Despite this
difference, there are great similarities in terms of the underlying science and production
processes between traditional LCD technology and its flexible evolution. The Northeast Ohio
region played an important role in the development of LCD technology in the 1960s and 1970s,
which served as a foundation for FlexMatters. Events in those years provide lessons learned from
the commercialization of the LCD technology that the cluster bears today.
B.1. From Liquid Crystal Technology to Flexible Electronics
Since its invention in the early 1970s, LCD technology has been widely adopted
throughout the world, first in digital watches and calculators in the early 1980s, then in laptop
computers in the 1990s, and in smart phones and tablets in recent years. Today, when one scans
the electronics market, he or she will find that most of the LCD screens and the electronic
devices that incorporate LCD technology are made in Asia by Asian brands. This anecdotal
evidence of Asia’s lead in LCDs is corroborated by the market share rankings of LCD TV
makers, dominated in 2010 by Samsung, Sony, and LG Electronics.
177
44 However, many of the key
chemistry and physics concepts that underpin LCD technology were pioneered in the late 1960s
44 Tarr, G. (2011, February). Samsung leads in global TV market share: DisplaySearch. TWICE. Retrieved from http://www.twice.com/article/464284-Samsung_Leads_In_Global_TV_Market_Share_DisplaySearch.php.
in the United States in the New Jersey research labs of an American company, Radio
Corporation of America (RCA).
RCA, however, did not effectively capitalize on the discoveries made by its research
team; rather, the company was concerned about undermining its position in the cathode ray tube
television business. As research funding for LCDs was redirected to other projects, researchers
left and the development and manufacturing of LCD technology was pursued elsewhere,
primarily in Japan
178
45 and later in South Korea.46
Around the same time, in another part of the United States, James Fergason, one of the
pioneers of modern liquid crystals technology, was also making critical contributions to liquid
crystals research, first at Westinghouse Research Laboratories and starting in 1966, at the newly
created Liquid Crystal Institute at Kent State University.47 In 1970 in Kent, Ohio, Dr. Fergason
started one of the first companies to focus on commercializing LCD technology. Liquid crystals
and polymers research found fertile grounds in Northeast Ohio partially due to the expertise
collected at the Liquid Crystal Institute at Kent State University and Dr. Fergason’s company.
The regional expertise in liquid crystals gained momentum through the 1980s with the
development of the Center for Advanced Liquid Crystalline Optical Materials (ALCOM). A
consortium of three research universities in Northeast Ohio (Kent State University, Case Western
Reserve University, and the University of Akron), ALCOM was designed to leverage and
integrate the region’s expertise in liquid crystals and polymer research.
Over the years, liquid crystal research conducted at ALCOM led to the development of
technology and intellectual property critical to the emerging industry of flexible electronics. As a
result of the region’s expertise in liquid crystals and its core industrial strength in polymers, as
well as printing and manufacturing machinery, companies in Northeast Ohio like Kent Displays
and AlphaMicron48 have been among the first in the world to commercialize flexible displays
and flexible lenses. Currently, flexible electronics remains a niche market, but estimates by
45 For a more detailed discussion of the history of LCD technology, see Kawamoto, H. (2002, April). The history of liquid-crystal displays. Proceedings of the IEEE, 40 (4). Retrieved from http://ieee.org/portal/cms_docs_iportals/iportals/aboutus/history_center/LCD-History.pdf. 46 LG Electronics is now the largest maker of LCD screens in the world. 47 Fergason’s work was on the twisted nematic effect that allowed displays to operate on low voltages suitable for use with batteries. This breakthrough remains the cornerstone of today’s LCD screens. 48 Both are FlexMatters core small businesses.

IDTechEx, a global research firm, suggest that the flexible electronics market will reach a value
of $300 billion worldwide by 2025.
179
49
To this day, George Heilmeier, the scientist at RCA widely credited for key discoveries
leading to early prototypes of LCDs, states that RCA’s missed opportunity to invest in the long-
term development of what is now the most widespread display technology “was a shame” and
that “our [RCA’s] wounds were self-inflicted.”50 However, Ohio—and by extension the United
States—may now have a second chance to capitalize on its top-tier research in liquid crystals and
polymers to manufacture and commercialize flexible electronic devices, creating high-
technology jobs and, in the process, developing a strong manufacturing base in a region
diminished by automobile industry closings.51
B.2. Emergence of the FlexMatters – Northeast Ohio Technology Coalition
It is in this context that John West, the head of the Liquid Crystal Institute, a technology-
based economic development organization, decided to formalize the activities of the flexible
electronics supply chain in Northeast Ohio. Thus, FlexMatters was formed in 2006 with NorTech
as the organizing entity responsible for developing and administering the cluster.52 NorTech was
created in 1999 but incorporated as a stand-alone nonprofit organization in 2004. NorTech states
that its primary mission is to “develop regional innovation clusters that create jobs, attract
capital, and have a long-term, positive economic impact on Northeast Ohio.”53 Prior to creating
FlexMatters, NorTech had been active in promoting economic development and innovation
throughout Northeast Ohio through its support of clusters in several industries. Figure B-1
provides a current graphical representation of the geographic scope of NorTech, and by
extension, the FlexMatters – Northeast Ohio Technology Coalition.
49 NorTech FlexMatters Regional Innovation Proposal (2010). Binder 1 – Technical Proposal. p.1. 50 Port, O. (2005, February 2). George Heilmeier: flat-panel pioneer. Bloomberg Businessweek. Retrieved from http://www.businessweek.com/magazine/content/05_50/b3963068.htm. 51 According to the NorTech FlexMatters Regional Innovation Proposal, analysis from the Department of Labor indicates that Ohio industries lost nearly 13,000 jobs in motor vehicle manufacturing between 2008 and 2009 (a 53% decline) and lost more than 24,000 jobs in motor vehicle part manufacturing during that same period (a 33% decline). 52 The term “cluster” refers to a geographically concentrated group of interconnected businesses, suppliers, service providers, and associated institutions in a particular industry or field. 53 Found on the front page and the “About Us” page of the NorTech website, http://www.nortech.org.

Figure B-1. Geographic scope of the FlexMatters cluster, comprised of 21 counties in Northeast Ohio
Source: NorTech FlexMatters Regional Innovation Proposal (2010). Binder 1 – Technical Proposal, 23
Through its support for Ohio’s Third Frontier Program, a $2.3 billion initiative to create
high-technology industries and jobs in the state and its pivotal role in creating the Ohio Venture
Capital Authority, NorTech has played an important role in attracting tens of millions of dollars
in public and private funding for research and development (R&D) in the Ohio region over the
past decade. NorTech has also launched and has spun off various initiatives over the years,
including JumpStart, a nonprofit organization dedicated to accelerating the success of
entrepreneurs and strengthening the ecosystem supporting them and TechLift, which provides
regional incubators and access to pre-seed funds for entrepreneurs.
During the first years of its existence, the nascent FlexMatters cluster grew under the
leadership of NorTech, which created marketing materials, promoted the cluster, and helped
attract funding for its members. In December 2009, FlexMatters began a phase of transformation
when its industry and university membership requested that NorTech develop a strategic
180

roadmap to sustain cluster growth. At this stage, FlexMatters redefined its vision as follows: “to
be the global epicenter for innovation and low-cost manufacturing of layered structures on
flexible substrates.”
181
54 NorTech sought to develop the strategic roadmap by linking FlexMatters’
vision to its current position across several strategic dimensions: markets, products, partners,
skills/talents, and assets.
Between June and July 2010, NorTech began developing its strategic roadmap by
collecting data. This was done through online surveys of members, personal interviews, and a
full-day workshop to gather information from members. Next, FlexMatters was benchmarked
against other centers, both domestic and foreign, that are involved in the flexible electronics
industry. Four such centers were identified: the Holst Research Center in the Netherlands; the
Printable Electronics Technology Center in England (PETEC); the Center for Advanced
Microelectronics Manufacturing at Binghamton University, New York (CAMM); and the
Flexible Display Center at Arizona State University (FDC). Figure B-2 shows the results of this
benchmarking process, which assessed the past, present, and expected capacity of each center
across five attributes. The benchmarking step diagnosed a significant weakness in external
visibility and a relative weakness in partnering/collaboration for FlexMatters, both of which can
be partially explained by the relatively young age of FlexMatters. FlexMatters scored well in the
remaining three attributes, (i.e., breadth of technology, commercialization of products/services,
and innovation), all of which are particularly important assets in creating a solid foundation for a
cluster.
54 NorTech FlexMatters Regional Innovation Proposal (2010). Binder 1 – Technical Proposal. p. 34.
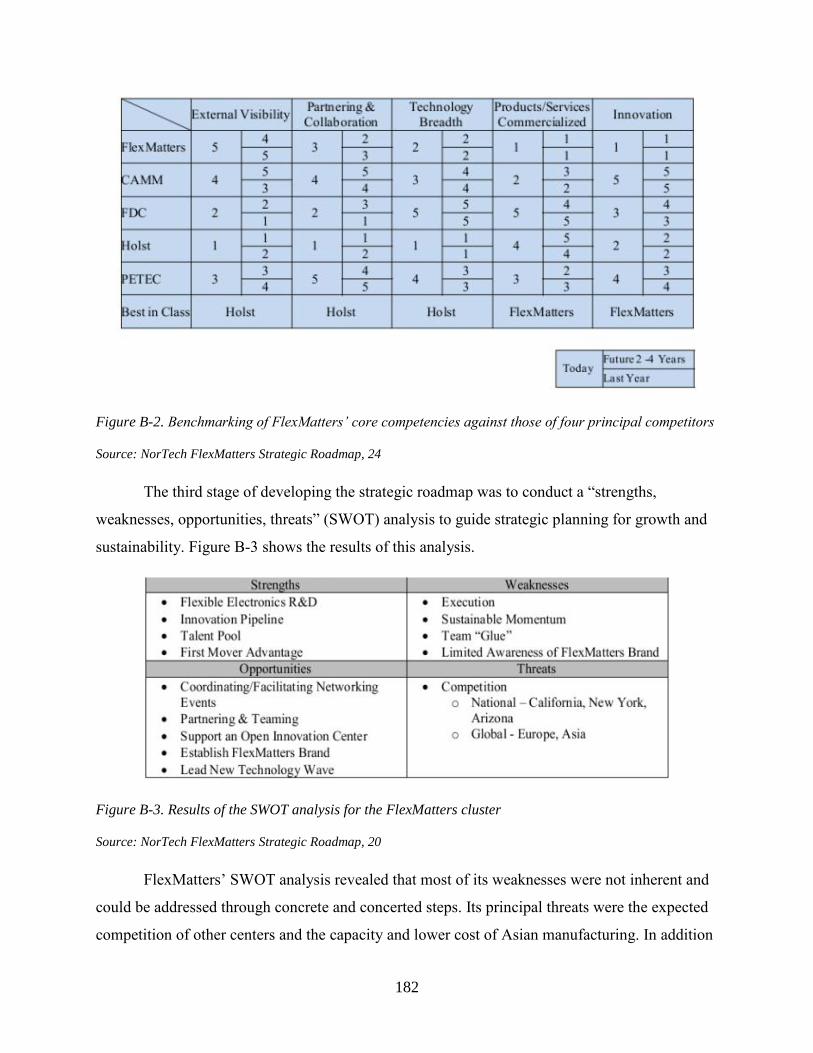
Figure B-2. Benchmarking of FlexMatters’ core competencies against those of four principal competitors
Source: NorTech FlexMatters Strategic Roadmap, 24
The third stage of developing the strategic roadmap was to conduct a “strengths,
weaknesses, opportunities, threats” (SWOT) analysis to guide strategic planning for growth and
sustainability. Figure B-3 shows the results of this analysis.
Figure B-3. Results of the SWOT analysis for the FlexMatters cluster
Source: NorTech FlexMatters Strategic Roadmap, 20
FlexMatters’ SWOT analysis revealed that most of its weaknesses were not inherent and
could be addressed through concrete and concerted steps. Its principal threats were the expected
182
competition of other centers and the capacity and lower cost of Asian manufacturing. In addition
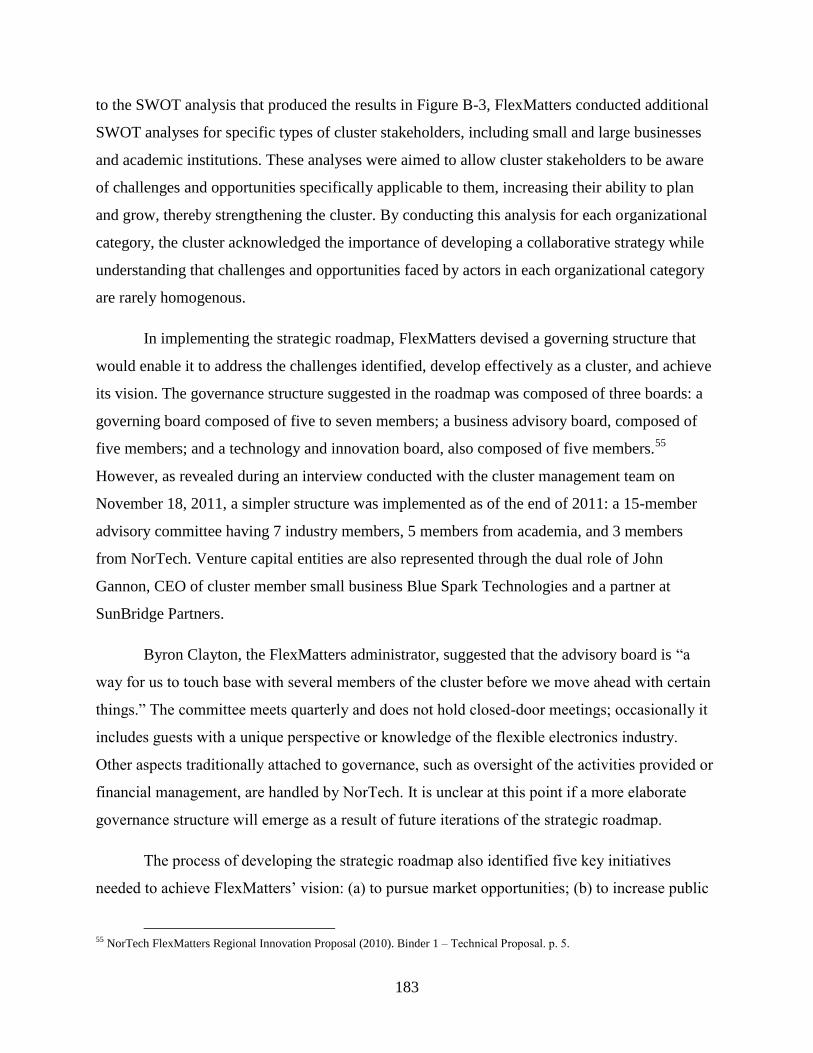
to the SWOT analysis that produced the results in Figure B-3, FlexMatters conducted additional
SWOT analyses for specific types of cluster stakeholders, including small and large businesses
and academic institutions. These analyses were aimed to allow cluster stakeholders to be aware
of challenges and opportunities specifically applicable to them, increasing their ability to plan
and grow, thereby strengthening the cluster. By conducting this analysis for each organizational
category, the cluster acknowledged the importance of developing a collaborative strategy while
understanding that challenges and opportunities faced by actors in each organizational category
are rarely homogenous.
In implementing the strategic roadmap, FlexMatters devised a governing structure that
would enable it to address the challenges identified, develop effectively as a cluster, and achieve
its vision. The governance structure suggested in the roadmap was composed of three boards: a
governing board composed of five to seven members; a business advisory board, composed of
five members; and a technology and innovation board, also composed of five members.
183
55
However, as revealed during an interview conducted with the cluster management team on
November 18, 2011, a simpler structure was implemented as of the end of 2011: a 15-member
advisory committee having 7 industry members, 5 members from academia, and 3 members
from NorTech. Venture capital entities are also represented through the dual role of John
Gannon, CEO of cluster member small business Blue Spark Technologies and a partner at
SunBridge Partners.
Byron Clayton, the FlexMatters administrator, suggested that the advisory board is “a
way for us to touch base with several members of the cluster before we move ahead with certain
things.” The committee meets quarterly and does not hold closed-door meetings; occasionally it
includes guests with a unique perspective or knowledge of the flexible electronics industry.
Other aspects traditionally attached to governance, such as oversight of the activities provided or
financial management, are handled by NorTech. It is unclear at this point if a more elaborate
governance structure will emerge as a result of future iterations of the strategic roadmap.
The process of developing the strategic roadmap also identified five key initiatives
needed to achieve FlexMatters’ vision: (a) to pursue market opportunities; (b) to increase public
55 NorTech FlexMatters Regional Innovation Proposal (2010). Binder 1 – Technical Proposal. p. 5.
funding and private investment; (c) to strengthen cluster alignment, communication, and
partnering; (d) to improve cluster visibility and recognition; and (e) to monitor and report cluster
growth and impact. FlexMatters’ roadmap and its gaps and needs analysis components are
important not only at the cluster planning stage but they should also be conducted subsequently
on a regular basis. FlexMatters made it clear that they adhere to the idea of the roadmap being a
living document. This is important because the process of regularly developing iterative
roadmaps enables clusters to remain aware of changes in their environment and to direct
development accordingly. It also allows clusters to track progress over time compared to the
benchmarking entities.
Beyond directly helping FlexMatters strategize and select its best course, the strategic
roadmap process also helped the cluster to obtain additional funding. In September 2010, the
Small Business Administration (SBA) launched the Regional Cluster Initiative to promote and
support 10 industrial clusters around the United States with the goals of increasing opportunities
for small business participation within the clusters, promoting innovation in the industries on
which the 10 clusters are focused, and enhancing regional economic development and growth.
The SBA Cluster Initiative award is a significant opportunity for NorTech and has helped to
formalize the foundation of a sustainable cluster and provide a range of assistance to participants.
B.3. Cluster Focus and Participant Composition
As a result of the strategic roadmap and based on the core competencies of its cluster
participants, FlexMatters has identified five product segments and the associated target markets
to pursue. . Figure B-4 illustrates the selected markets and product segments: the outer ring
highlights FlexMatters’ major product segments, and the inner circle outlines its identified target
markets.
184

Figure B-4. FlexMatters’ selected product segments (outer ring) and target markets (inner circle). Source: NorTech FlexMatters Strategic Roadmap, 20
Some products, like functional films and inks, are relevant to each of the five target
markets, whereas others, such as organic light-emitting diode (OLED) lighting, are especially
relevant for the consumer, industrial/commercial, and military markets. All five product
segments are applicable to both the consumer and military markets. By covering such a broad
range of markets, the cluster and its participants can ensure diversification as a hedge for shifts in
the industry and can find synergies in terms of technology and products.
Like nearly all clusters, FlexMatters is composed of a variety of participating
organizations, ranging from startups to universities and market leaders, which have greatly
influenced the cluster’s focus of targeted markets and product segments. These participating
organizations can be classified into six broad categories: (a) cluster service providers, (b)
research and technology centers, (c) universities and community colleges, (d)
collaboration/support organizations, (e) large companies, and (f) core small businesses. This last
category is comprised of those small businesses that are actively involved in the cluster’s
advisory committee and the roadmap process and have been longstanding—if not founding—
members in the cluster.
The organizations participating in FlexMatters are listed in Table B-1, along with their
185
respective organization category and their broadly defined role within FlexMatters.

Table B-1. Organizations, their classifications, and roles within the FlexMatters Cluster
186
Organization Organization category Role in FlexMatters
NorTech
Cluster Service Provider
Provides workshops to foster alliances, market intelligence, and needs assessments from flexible electronics experts and assists with communication and public relations
Manufacturing & Technology Small Business Development Center (MTSBDC) - Kent State University
Provides one-on-one counseling and technical advice
B&D Consulting
Provides targeted funding opportunities, connections to federal agencies, and networking opportunities
Institute for Advanced Materials - Case Western Reserve University
Research and Technology Center
Provide intellectual property, R&D, and technological know-how and opportunities for technology transfers
Liquid Crystal Institute - Kent State University
Wright Center for Roll to Roll Processing - University of Akron
National Polymer Innovation Center - University of Akron
Lorain County Community College
University and Community College
Train talented, skilled workers at the graduate and postgraduate level in disciplines related to flexible electronics
Kent State University
University of Akron
Cleveland State University
Case Western Reserve University
JumpStart
Collaboration/Support Organization
Matches private investment funding with early stage companies. Identifies small disadvantaged businesses
Manufacturing Advocacy and Growth Network (MAGNET)
Provides guidance and advocacy with regard to manufacturing in Northeast Ohio
Ohio Third Frontier Provides public/private funding to small businesses for technologies integral to flexible electronics

187
Organization Organization category
Role in FlexMatters
Burton D. Morgan Foundation Provides funding to support the cluster
GAR Foundation Provides funding to support the cluster
Fund for Our Economic Future
Unifies philanthropic organizations and individuals to advance regional competitiveness through grants and research
Team North East Ohio (NEO) Coordinates and promotes economic development in 16 counties of Northeast Ohio
First Place Bank Provides capital to small businesses within the cluster
American Greetings
Large Companies
Provide teaming, partnership, collaboration, and sourcing opportunities (also important in obtaining market information and connections outside of Northeast Ohio)
Cleveland Clinic
GE Lighting
GrafTech International
Lubrizol Advanced Materials
Ferro
Kent Displays
Core Small Business
Provide expertise in various flexible electronics disciplines, R&D, market knowledge, opportunities for sourcing, and partnerships.
HANA Microdisplay Technologies
Akron Polymer Systems
Essential Research
Blue Spark Technologies
Valtronic Technologies
Genvac Aerospace
NanoFilm Corp.
AlphaMicron
The list of cluster organizations in Table B-1 illustrates the extent to which Northeast
Ohio possesses unique characteristics that predispose the region to be an important hub in
flexible electronics. The region’s universities and community colleges have specialized research

centers in various disciplines tied to flexible electronics and actively train talented individuals to
the highest levels of expertise in the field. Collaboration and support organizations are well
aligned with the cluster’s mission, providing various resources such as funding to small
businesses, as is done by JumpStart, and regional promotion and advocacy, as is done by Team
NEO and MAGNET. In addition, organizations like the MTSBDC at Kent State, which is
administered by SBA, provide one-on-one training and counseling services to the cluster.
Various other levels of the government—including state and regional entities—are
indirect supporters of the cluster (as such, they were not included in Table B-1). These
government entities are working to implement a coherent and effective plan for economic
development and occasionally play a role in the funding and guidance of the collaboration and
support organizations. Furthermore, FlexMatters has been actively engaging Ohio Senator
Sherrod Brown for roundtables on flexible electronics and visits to small businesses and their
manufacturing plants. On the whole, however, the core of the FlexMatters cluster is composed
primarily of private sector actors, represented by small and large companies, chambers of
commerce and other business associations, as well as non-profit organizations.
FlexMatters’ large companies are well placed to take advantage of sourcing and
partnering opportunities facilitated by the cluster, and are often market or technology leaders in
their field. For example, American Greetings is the largest publicly traded greeting card
company in the world and, therefore, a market leader; it can leverage products like ultra-thin
batteries in its cards. GrafTech International, a globally recognized leader in electronics thermal
management technology, is selling materials to Apple, Samsung, and other major electronics
manufacturers. Because they operate internationally and have global suppliers and clients, these
companies can facilitate communication and collaboration with regions well beyond the
geographic scope of the cluster.
It is also important to note the diversity of expertise and resources present among the
three principal cluster service providers. NorTech plays a central role in the provision of
services, providing consultants specializing in flexible electronics and connections with various
regional entities. The MTSBDC at Kent State offers, among other services, specialized resources
for manufacturing and flexible electronics technology R&D, due to its connections with Kent
188

State and the Liquid Crystal Institute. The third principal service provider is the Washington
D.C. branch of the B&D Consulting firm, which has broad connections to federal agencies and
the ability to mine for appropriate funding and grant opportunities, while also assisting small
businesses with networking.
B.4. Small Business Recruitment
The cluster recruited small businesses through various means over the first year of SBA’s
Cluster Initiative. In particular, it relied on two principal strategies: (1) engaging relevant
individuals at industry events and (2) leveraging the findings of the Market Opportunity Mining
effort. The cluster commissioned the Market Opportunity Mining study to identify the top 25
applications for flexible electronics and the top 50 businesses in Northeast Ohio with the
potential to become flexible electronics customers. Furthermore, the FlexMatters administration
team used the raw data resulting from the Market Opportunity Mining study to identify and reach
out to relevant small businesses in the region. This outreach effort was done in a very personal
and focused manner by cluster administrator Byron Clayton and his team. As the vice president
of a small business member of FlexMatters stated, “Byron called us; he drove down from his
place to our place which is about a 2-hour drive. He told us all about the cluster and it seemed
like it is a great place. So we got involved in it [FlexMatters] that way. Byron sought us out.”
Furthermore, press releases and news coverage of the cluster, which have attracted the
attention of relevant actors in the region, have served as an additional recruitment channel.
FlexMatters also began targeting small, disadvantaged, and minority businesses through
organizations like JumpStart Inclusion Advisors, the Greater Cleveland Partnership, and Team
NEO. FlexMatters’ outreach to small businesses has materialized in increased membership of
small businesses in the cluster. As SBA’s Cluster Initiative begins its second year, non-core
small business members are at least as numerous as the core small business members, with the
cluster reporting 24 small businesses in total. These figures do not include several small
businesses that are in the process of joining the cluster.
FlexMatters applies relatively few restrictions on the cluster membership eligibility of
small businesses. One major restriction involves the relevance of the small business to the
flexible electronics ecosystem. This criterion can be met either by being actively involved in
189
areas tied to flexible electronics or by seeking entry into these areas. A secondary criterion is the
small business’ location, which should be within 1 of the 21 counties of Northeast Ohio that the
cluster currently serves; however, this criterion has been relaxed somewhat, and there are a few
businesses within the cluster that are located outside of the region’s 21 counties. Nevertheless,
based on the data collected from the cluster administrator, all businesses in the cluster have a
presence within the state of Ohio. Outside of these two membership restrictions, the cluster
accepts companies at all stages of development, from university spinoffs and startups to
established multinationals.
When a company expresses interest in getting involved with FlexMatters, it is invited to
share information about products and technology in the company’s pipeline and is also given
background information on the cluster, its services, and its activities. This communication allows
the cluster administration team to learn about the company’s needs, expectations with regard to
cluster participation, and where the company fits in the cluster. In many cases, it can be difficult
to evaluate the commercial status of a technology, so the cluster relies on consultants with
expertise in flexible electronics to obtain a correct assessment. As the FlexMatters’ administrator
noted, the consultants “are highly skilled and understand the industry and the technology so that
they can differentiate what’s real and what’s not.”
B.5. Cluster Activities and Events
FlexMatters’ activities and events are designed to address the primary hurdles facing its
small businesses. These hurdles and challenges are reflected in the small businesses’ main
motivations for participating in FlexMatters, as well as in the answers they provided during
interviews. The data collected as part of the SBA’s Cluster Initiative evaluation indicate that
91% of small businesses participate in the cluster to network with other businesses and potential
clients in the region, while 64% seek greater integration into the industry’s supply chain. The
president of one of the small business members of FlexMatters stated during his interview that a
major challenge faced by small businesses is:
definitely understanding and aligning all of the development pieces and the supplier chains so that you can get products to market and pilot faster. Currently, with these types of technologies, there’s a lot of tooling that’s involved. And we understand where those costs come from, but the time it takes for having
190
something tooled and put together is a very large time constraint for a small business that’s trying to get to a certain revenue in early years.
On the other hand, the CEO of another small business member of FlexMatters suggested
that his company’s “largest hurdle is, we are a unique power technology and we’re in search of a
market.” These two quotations illustrate two sides of the same hurdle facing businesses at all
stages of development in cutting-edge flexible electronics: finding viable markets and finding
specialized suppliers and partners for collaboration to bring products to markets.
The FlexMatters management team is aware of this hurdle and the various ways in which
it manifests itself. During an interview with the cluster management team, cluster administrator
Byron Clayton stated that “the nature of flexible electronics is that it is so technology intensive,
that it’s very difficult for one company to do everything that they need to do to commercialize a
product, so you really have to focus a lot on collaboration.” To address this specific hurdle,
FlexMatters adopted a variety of strategies. The first was to create the FlexMatters Resource
Site, which provides online access to databases of potential technology and business partners.
The site also provides online access to business intelligence regarding emerging flexible
electronics markets and applications by leveraging data from the Market Opportunity Mining
effort. The second strategy employed by the cluster was to organize various networking and
trade events and to encourage participation by member small businesses. For example,
FlexMatters – Northeast Ohio Technology Coalition sponsored event booths for several
companies at the FlexTech Alliance Conference; it also organized networking meetings for
members.
As a third strategy to help its members find viable markets, specialized suppliers, and
collaborating partners, FlexMatters organized cluster sourcing workshops with established
companies where small businesses could discuss their technologies and products, and larger
companies could identify promising technologies to integrate or leverage. However, the cluster
found that cluster-sourcing workshops were often difficult to organize and did not accomplish
the expected results. The cluster found that it was reaching out to large and established
organizations, asking them about their needs and identifying participants in a position to fulfill
them, but the areas of interest cited by these large companies were often too broad, and making
191
the relevant connections was challenging. This issue was compounded by concerns surrounding
intellectual property, which hindered and slowed the discussions.
As a result, the cluster changed its approach in two critical ways beginning around the
spring of 2011. First, FlexMatters decided to focus on what it termed “quick hits,” (i.e., short-
term projects with little need for intellectual property disclosure). In addition, FlexMatters
implemented a “high-touch” approach known as FlexConnect, a program through which small
businesses identify companies with which they wanted to get involved based on their products
and technology. FlexConnect specifically assigns to each small business a flexible electronics
expert who diagnoses and identifies the needs and strengths of members before setting goals and
tasks for both the small business and the cluster. The expert and the small business meet at least
once per quarter to discuss progress, new opportunities, and new concerns. This adaptation and
redesign of activity illustrates the importance for clusters to be flexible and ever attentive to
ways to improve their services and activities.
Data from the survey of the cluster’s small businesses conducted as part of SBA’s Cluster
Initiative evaluation suggest that the cluster is succeeding in fostering collaborations.
192
56 Some
84% of FlexMatters’ small businesses responding to the relevant survey question stated that they
either agree or strongly agree that they had achieved collaborations with other businesses in their
region as a result of cluster participation.57 Half of the cluster’s small businesses stated that they
had achieved significant participation in the industry’s supply chain as a result of cluster
participation, implying that the cluster is also effective at connecting various stages of the value
chain. In addition, 67% of small businesses having responded to the relevant question reported at
least one new alliance (ranging from project collaboration, informal sourcing agreements,
licensing to joint ventures) as a result of cluster assistance. Finally, 33% reported two or more
alliances.
A second hurdle commonly affecting businesses at various developmental stages and in
various industries is access to funding. Several of the FlexMatters small businesses that were
interviewed identified this hurdle as critical. FlexMatters has implemented various programs to
56 For more details on the survey methodology and evaluation design, please refer to The Evaluation of the Regional Clusters Initiative, prepared for the SBA and dated February 2012. 57 For a more detailed breakdown of the small business survey responses, please refer to The Evaluation of the Regional Clusters Initiative, prepared for the SBA and dated February 2012.
help small businesses gain access to funding. The first approach has been to encourage small
businesses to pursue grants by providing assistance in writing and reviewing them. In 2011,
FlexMatters created a “Red Team,” a panel of experts in flexible electronics with grant-writing
experience focused on evaluating proposals before they are submitted. This support, combined
with the assistance provided in identifying opportunities through NorTech and the D.C.
consultant team hired by the cluster, has helped several companies to apply for grants such as the
DoD’s Rapid Innovation Fund. Moreover, four cluster members applied jointly for the National
Science Foundation’s BioFlex technology funding opportunity.
An additional approach to assist small businesses with funding opportunities was to
promote venture capital as a significant source of funding for small businesses. This approach
has met with several challenges, including the perception on the part of some small businesses
that working with venture capitalists may result in a loss of control over their companies through
dilution. The cluster is considering how to better promote venture capital during the second year
of SBA’s Cluster Initiative, in part by showcasing some of the advantages afforded by this
source of funding, such as the expertise in business development that is often made available as a
condition for venture or angel capital. The cluster has also solicited a local bank and broadened
the capital discussions in its funding workshop to include loans and other funding sources.
Despite this early challenge, the cluster was still able to report that several small
businesses were receiving assistance with funding as a result of the various opportunities offered.
For example, one of the cluster’s small businesses worked with the Kent State MTSBDC to
identify the most appropriate SBA loans for its needs. Another small business member also
received assistance from the Kent State MTSBDC for identifying and pursuing various funding
opportunities to scale up manufacturing, including angel capital via North Coast Angel and state
funding through the Edison Welding Institute. The survey conducted as part of SBA’s Cluster
Initiative evaluation reported that 68% of responding small businesses had gained access to at
least one form of capital,
193
58 and 27% reported gaining access to several types of capital over the
first year of SBA’s Initiative. The response of surveyed small businesses suggests that
FlexMatters has had some influence on access to financing since 50% reported a positive
influence on accessing capital.
58 This percentage includes venture capital, angel capital, grants, and various types of loans.

A third important hurdle facing small businesses in the flexible electronics industry is the
difficulty and costs associated with finding employees and interns with highly specialized
training relevant to flexible electronics. The cluster, through its ties with regional universities, is
uniquely positioned to assist small businesses in this area. The CEO of one of the cluster’s
member companies highlighted the key role of the cluster in addressing this hurdle:
They [FlexMatters] have been helpful in connecting me with the right people at Case Western, and [University of] Akron, and Lorain County Community College, and folks like that to try to start identifying interns who would be good fits, or begin to look at full-time folks, so they have been helpful to me in shortening the process of getting my requests into the hands of the right people at those institutions.
During an interview with the cluster management team, Timothy Fahey, senior consultant
at NorTech, reported that assistance with workforce development had been requested more often
than expected, stating the following:
Some of the companies are looking for specific skill sets and want to hire interns or circuit designers or people of this nature and they come to us and ask for connections at the universities to help them source highly skilled workers like that.
In addition to providing services to help address the three critical hurdles outlined above,
FlexMatters offers another specialized service: media training workshops. NorTech has a
department that specializes in communication and media relations at the regional and national
level. This department assists small businesses with their interactions with the media by offering
a media-training workshop and by offering assistance on a case-by-case basis. For example,
when President Barack Obama visited the region and spoke to the CEO of one of the cluster’s
small businesses about flexible electronics, NorTech’s communication department assisted in
crafting responses to media inquiries. In other cases, NorTech is contacted by media
organizations about flexible electronics in the region, and it directs these inquiries to the best-
matching member of the cluster. In addition to media relations assistance, the cluster is also
working on setting up another specialized service that has been requested periodically by
participants: intellectual property workshops to assist small businesses in filing for patents. Three
194
law firms in the region with expertise in the field have already been contacted to conduct the
training, which should commence in 2012.
FlexMatters’ small business executives frequently communicated how scarce and
valuable their time is due to the multitude of things they must manage and decide. It is, therefore,
a good indication of the relevance of FlexMatters that most are willing to spend their time to get
actively involved in cluster activities and events, as survey results indicate. Over half (54%) of
small businesses responded “often” or “always” to the relevant survey question on whether they
attended cluster networking or showcase events, and all respondents reported attending these
events at least occasionally. When asked about their attendance at training and assistance events
such as business counseling, 77% of those businesses that responded to the relevant survey
question reported attending at least once every 6 months, and 63% reported attending at least
once every 3 months.
B.6. FlexMatters’ Outcomes during SBA’s Cluster Initiative
FlexMatters has made impressive progress since its inception in 2006, and, in particular,
since the beginning of SBA’s Cluster Initiative funding at the end of 2010. The results of the
survey that was sent to small businesses participating in the cluster suggest that the efforts put
forth by the cluster management team are recognized by the cluster’s small business participants.
Survey results show that 95% of cluster participants surveyed are satisfied or very satisfied with
cluster activities and training during the first year of SBA’s Initiative, with 68% reporting being
very satisfied. These data further support that the work of the cluster is deemed useful by its
participants, suggesting that the cluster services are valued by its small businesses.
The small business survey results regarding the achievements facilitated by cluster
participation during the first year of the SBA Cluster Initiative reflect the effective deployment
of services and activities. This is especially true for aspects of assistance tied to
commercialization, the focus of the cluster. Some 63% of small business respondents agree or
strongly agree that cluster participation resulted in the development of new products and
services, while 57% agree or strongly agree that cluster participation led to the
commercialization of new technology. Survey respondents also reported that participation in
FlexMatters was important to revising their marketing plan, a key and often overlooked element
195
of the commercialization process. Some 64% of small businesses agree or strongly agree that
cluster participation led to a revised marketing plan. In terms of integration into the supply chain
for flexible electronics, the cluster is also perceived as very effective, with 73% of small
businesses agreeing or strongly agreeing that cluster participation enabled active participation in
the relevant supply chain.
Outside of the cluster membership, NorTech has also been recognized as high performing
through various awards. First, the cluster has also been accepted into the Jobs and Innovation
Accelerator Challenge, a collaborative funding opportunity coordinated by the Department of
Commerce’s Economic Development Agency, the Department of Labor’s Employment and
Training Administration, and the SBA.
196
59 Second, NorTech won the prestigious State Science and
Technology Institute’s 2011 Technology–Based Economic Development (TBED) award for
Most Promising TBED Initiative.60 Although the evaluation results presented here are limited to
the first year of the SBA Cluster Initiative, in the long run, FlexMatters’ efforts in leveraging the
existing regional assets and expertise has the potential to help the region capture and retain a lead
in the global market for designing and manufacturing flexible electronics. As a result, the
likelihood of missed opportunities, such as that exemplified by RCA’s decision not to capitalize
on earlier discoveries in the field, can be minimized.
59 See http://www.manufacturing.gov/accelerator/docs/2011-jobs-accelerator-overviews.pdf for additional details. 60 See http://www.sstiawards.org/2011.html for a full list of the 2011 winners and the award details.

11. Appendix C. Additional Analysis Results
Figure C-1. Made strides towards developing new products or services as a result of cluster participation
Figure C-2. Made strides towards commercialization of new technology as a result of cluster participation
197
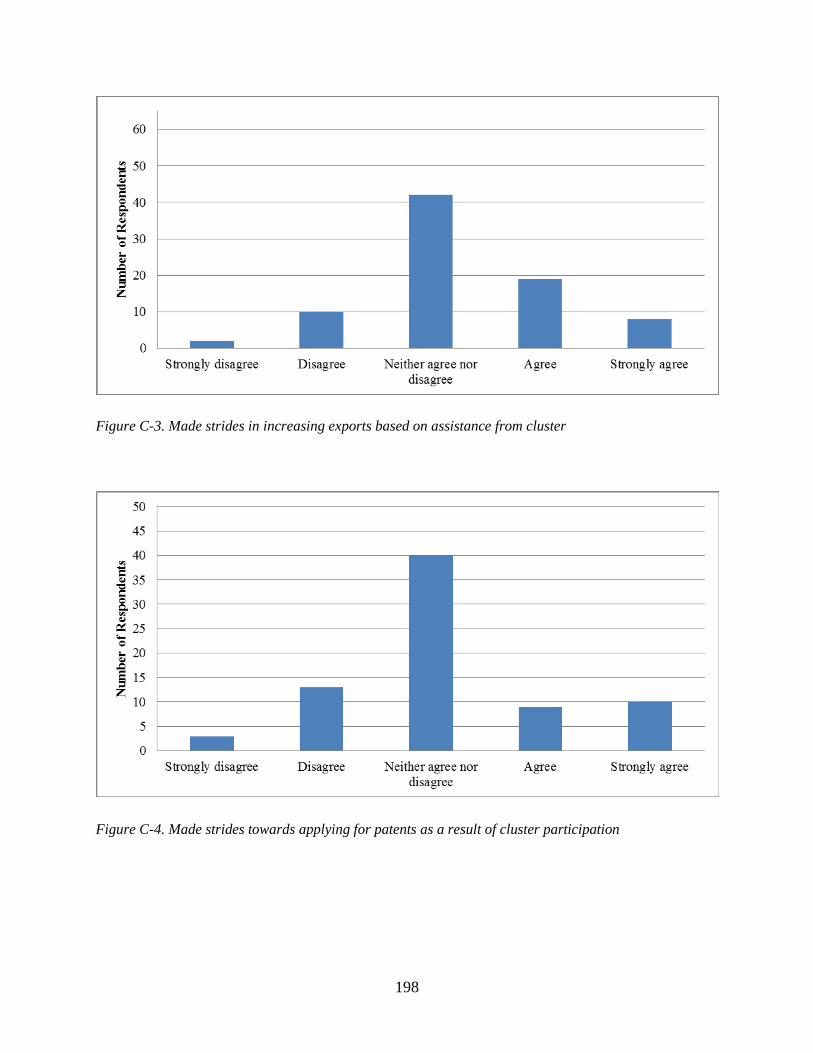
Figure C-3. Made strides in increasing exports based on assistance from cluster
Figure C-4. Made strides towards applying for patents as a result of cluster participation
198
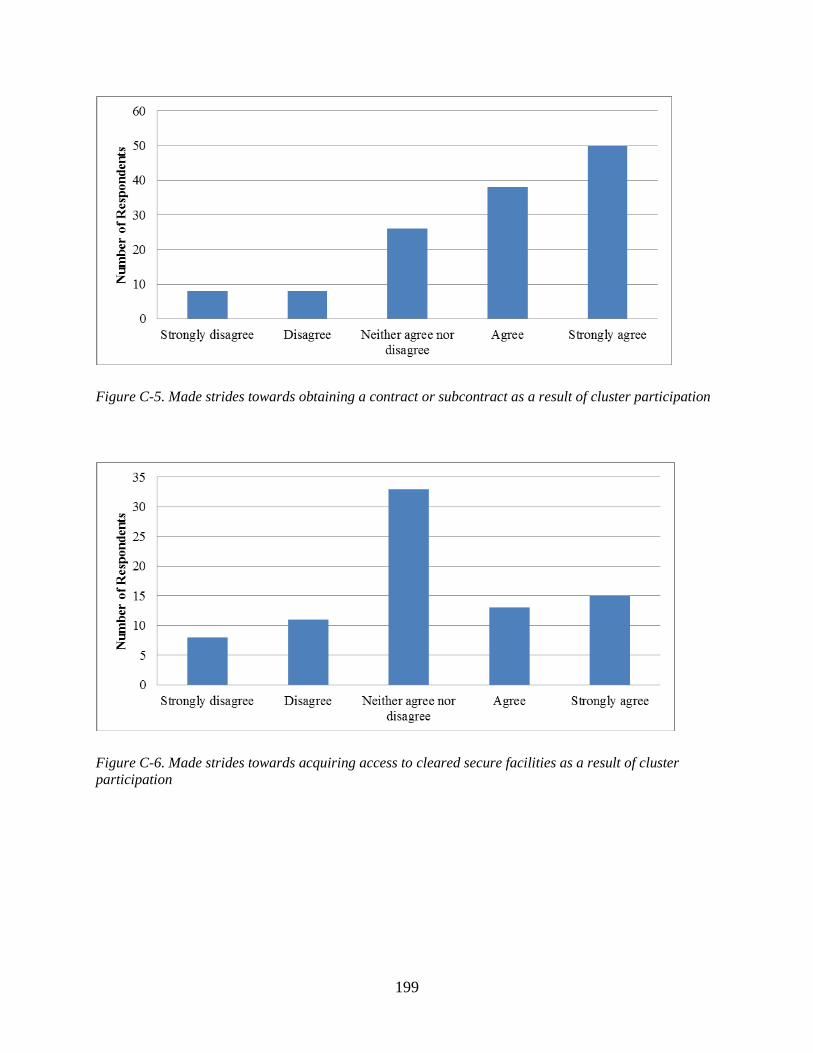
Figure C-5. Made strides towards obtaining a contract or subcontract as a result of cluster participation
Figure C-6. Made strides towards acquiring access to cleared secure facilities as a result of cluster participation
199
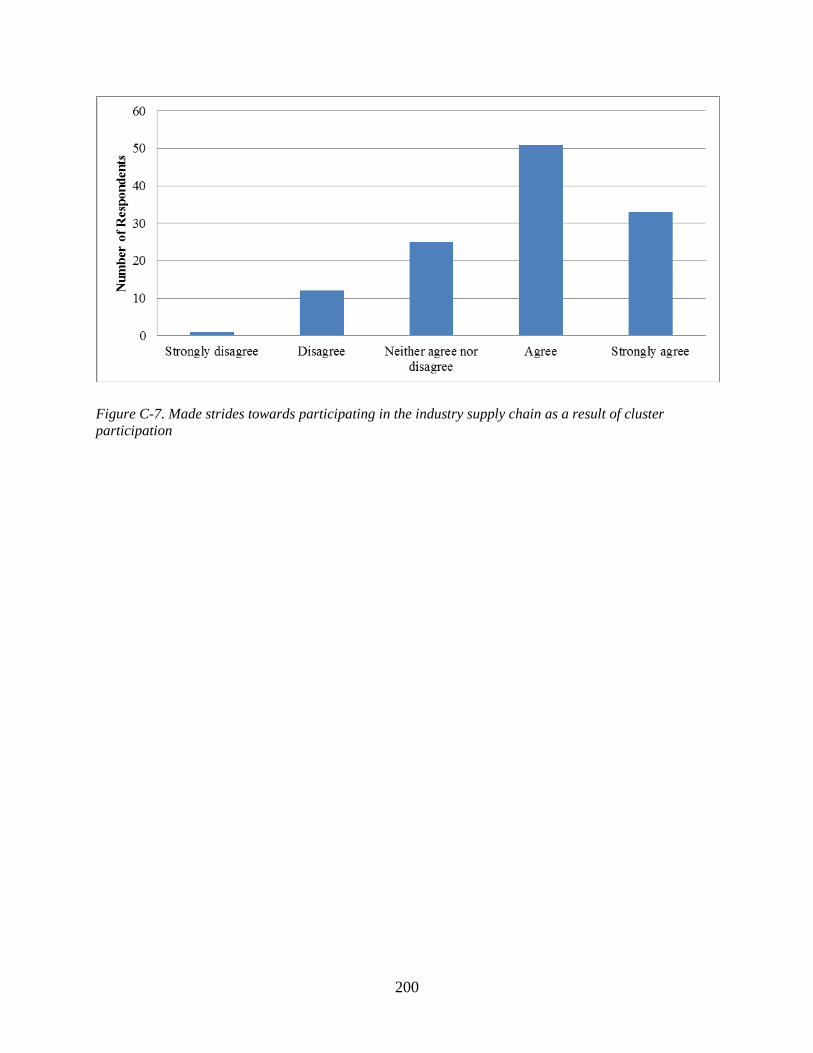
Figure C-7. Made strides towards participating in the industry supply chain as a result of cluster participation
200
12. Appendix D. Methodology As summarized in Section 4 of the report, the evaluation design for this report is based on
a mixed-method approach that uses both quantitative and qualitative data collected from cluster
administrators, large organizations, and the small businesses participating in the cluster. These
data are collected through the following means:
· Cluster Administrator Survey
· Small Business Survey
· Large Organization Survey
· Interviews with cluster administrators
· Interviews with selected small businesses
· Clusters’ proposals for the SBA Cluster Initiative, their quarterly reports, and
annual reports
The use of multiple sources of data allows for a comprehensive assessment of the cluster
services provided under the initiative as well as the performance outcomes of the small
businesses. The use of various quantitative and qualitative data also allows for crosschecking
among different sources of data, increasing the validity of findings and generating a stronger and
more reliable evaluation. Since the qualitative data provide an understanding of each cluster’s
background, they are further used to guide the interpretation of the quantitative findings and to
understand the variation in program outputs and outcomes across clusters. The following
subsection provides a description of the data collection activities.
D.1. Description of Data Sources
D.1.1. Surveys
Most of the quantitative data were collected through the following survey instruments:
· Cluster Administrator Survey: This survey was completed by the administrator of
each cluster. Its purpose is to gather information on the different cluster stakeholders,
various types of activities and events offered by the cluster to small businesses, and
the frequency of these events during the first year of SBA’s Cluster Initiative.
201
· Small Business Survey: The Small Business Survey was sent to those small businesses
that the cluster administrators identified as having been targeted by the cluster and
having received services under SBA’s Initiative from October 1, 2010 through
September 30, 2011. The survey collects information on key outcomes of small
businesses, including revenue, number of employees, and total compensation. It also
gathers information on outcomes that are closely linked to cluster services, such as
achieving access to external capital, forming strategic alliances and collaborations,
obtaining patents, and commercializing new technology. In addition, the survey
includes questions on small businesses’ reasons for cluster participation, their
satisfaction with cluster services and activities, and their assessment of the influence
of their cluster participation on their selected performance outcomes. The Small
Business Survey was sent to the 320 small businesses identified by the cluster
administrators. Of these, 188 businesses completed the survey.
· Large Organization Survey: This survey was designed to collect information from a
broad spectrum of large organizations participating in the clusters, including large
businesses, universities, public sector agencies, nonprofit organizations, and business
associations. The survey gathers information on these organizations’ reasons for
cluster participation, their interactions with small businesses in the cluster, and the
influence of their cluster participation on various outcomes. Due to the multitude of
large organizations that were surveyed, the survey collected information on a wide
spectrum of outcomes, ranging from the organization’s ability to transition new
research technologies into marketable products to the organization’s hiring of new
employees. The Large Organization Survey was sent to 152 large organizations that
were identified by the clusters as cluster participants. Of these, 102 organizations
completed the survey.
The Small Business Survey and the Large Organization Survey were provided to cluster
participants as either a web survey or an interactive PDF form, depending on the cluster
administrators’ preferences. The surveys were administered from October 3, 2011 to November
4, 2011. Responses to the surveys were monitored regularly, and cluster administrators sent
reminders to participants to fill out the surveys. Overall, the response rate for the Small Business
202
Survey was 59%; the response rate was above 60% for 7 of the 10 clusters. The overall response

rate for the Large Organization Survey was 67%. The Cluster Administrator Survey was
completed by all 10 cluster administrators participating in the SBA Cluster Initiative.
D.1.2. Interviews
The evaluation also used qualitative data collected through interviews with the cluster
administrators and selected small businesses. The interviews were designed to gather information
on cluster operations and small businesses’ cluster participation that is difficult to capture
through surveys. All interviews were conducted in November 2011.
Interviews with cluster administrators included questions that concerned the following:
· Cluster governance
· Cluster operations
· Cluster recruitment strategies and membership
· Networking and collaboration activities
· Innovation and technology transfer activities
· Sources of funding
· Lessons learned
The interview questions were designed to fill in the informational gaps that remained
after reviewing cluster proposals and quarterly reports. The questions were provided to the
cluster administrators at least 48 hours before the interviews. Cluster administrators were invited
to include other cluster service providers and partners in the interviews. The interviews were
conducted in a semi-structured fashion, which allowed for follow-up questions to be dynamically
added during the interviews. Although the core themes that were investigated remained the same
across cluster interviews, questions were customized for each cluster to elicit the maximum
amount of information within the limited interview duration. The interviews included questions
on each cluster’s configuration, business model, targets, and strategies. They lasted
approximately an hour for each cluster.
Two of the 10 clusters, the San Diego Defense Cluster and FlexMatters, were selected for
in-depth interviews that involved additional questions to be used in preparing the stand-alone
203
case studies.
204
61 These more in-depth interviews lasted approximately 90 minutes. The following
were the criteria used in selecting the clusters for in-depth interviews:
· Cluster life cycle stage and organizational developmental: The selected clusters
represented different stages of the cluster life cycle, with one cluster at the
emerging stage of its development and the other at a more mature developmental
stage.
· Involvement of diverse stakeholders: Both of the clusters involve various levels of
government, research institutions, and businesses, thus exemplifying the cluster
structure referred to as the “triple helix.”
· Cluster output: Both clusters have begun providing various types of services and
activities to the firms participating in the cluster over the past year.
· Cluster revenue stream: The selected clusters represent varied sources and levels
of funding outside the Regional Cluster Initiative’s funding.
The San Diego Defense Cluster and FlexMatters were chosen based on their
demonstrated ability to satisfy the above criteria. In particular, the San Diego cluster represented
a more mature cluster, whereas FlexMatters represented a more recent cluster.
In addition, brief interviews were conducted with four small businesses belonging to
FlexMatters and five small businesses belonging to the San Diego Defense Cluster. For the
interviews, the administrators of the two clusters selected small businesses that were at different
stages of maturity and performance. The interviews with small businesses lasted approximately
half an hour. The questions guiding these interviews focused on how the businesses learned
about the cluster, reasons for their participation, their involvement in the cluster, and their
satisfaction with services and events.
D.1.3. Cluster Proposals and Quarterly Reports
Cluster proposals for SBA’s Cluster Initiative and the clusters’ quarterly reports provided
another source of qualitative data for the evaluation. They were used as sources of background
information on clusters, including cluster configurations, their business models and strategies,
their goals and challenges in implementing SBA’s Cluster Initiative, and various other aspects of
61 Case studies are presented in Appendix 9 and 10
cluster governance, operations, and organizational capacity. In addition, these sources were used
to gather detailed information on the clusters’ activities, events, and services provided to small
businesses as well as instances of small business collaboration, and small businesses’ grant and
contract awards.
D.2. Secondary Data Sources Used in the Analysis The evaluation of SBA’s Cluster Initiative used secondary data sources to compute
average statistics for three key outcomes: revenue, number of employees, and total
compensation. These average measures were then compared with the average outcomes
experienced by the small businesses participating in the 10 clusters. The secondary datasets used
in the evaluation include:
· Quarterly Census of Employment and Wages (from the Bureau of Labor
Statistics) which provides data on the number of employees
· State Personal Income Accounts (from the Bureau of Economic Analysis) which
provides data on compensation
· Dun and Bradstreet (D&B) Business Database, which provides data on both
revenue and number of employees
These data sources vary with respect to the frequency with which they are updated, the
time period covered, type of respondents, geographic and industrial granularity, and unit of
observation. Table D-1 summarizes the various characteristics of the secondary data sources.
205
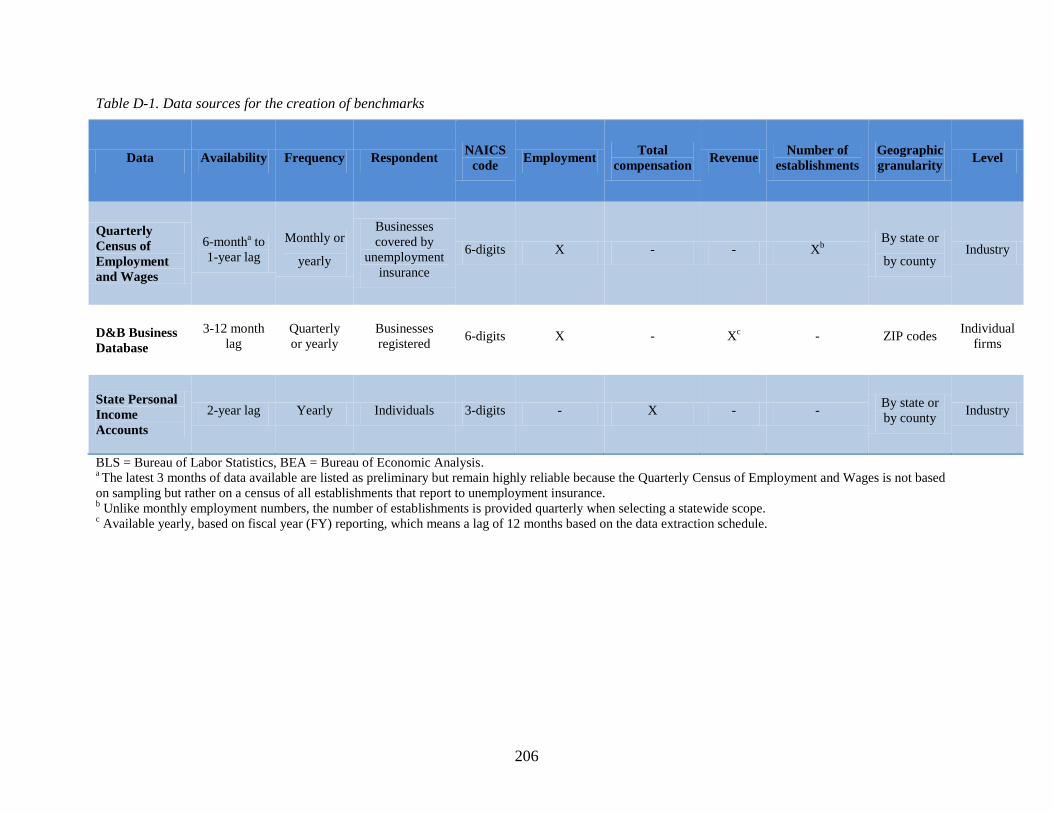
Table D-1. Data sources for the creation of benchmarks
206
Data Availability Frequency Respondent NAICS code Employment Total
compensation Revenue Number of establishments
Geographic granularity Level
Quarterly Census of Employment and Wages
6-montha to 1-year lag
Monthly or
yearly
Businesses covered by
unemployment insurance
6-digits X - - Xb By state or
by county Industry
D&B Business Database
3-12 month lag
Quarterly or yearly
Businesses registered
6-digits X - Xc - ZIP codes Individual
firms
State Personal Income Accounts
2-year lag Yearly Individuals 3-digits - X - - By state or by county
Industry
BLS = Bureau of Labor Statistics, BEA = Bureau of Economic Analysis. a The latest 3 months of data available are listed as preliminary but remain highly reliable because the Quarterly Census of Employment and Wages is not based on sampling but rather on a census of all establishments that report to unemployment insurance. b Unlike monthly employment numbers, the number of establishments is provided quarterly when selecting a statewide scope. c Available yearly, based on fiscal year (FY) reporting, which means a lag of 12 months based on the data extraction schedule.
The Quarterly Census of Employment and Wages and the State Personal Income
Accounts data provide statistics for various industries at the county level, Metropolitan Statistical
Area (MSA) level, or state level. In creating the benchmark from the Quarterly Census of
Employment and Wages, North American Industry Classification System (NAICS) codes and the
counties of small businesses participating in the clusters were used for specifying the industrial
categories and geographic scope of each cluster. The average of the county-level data was used
as the benchmark statistic for the cluster. In creating the benchmark from the State Personal
Income Accounts data, industry classifications and the states of the 10 clusters’ small businesses
were used. For clusters that have small businesses from multiple states, a weighted average of
the state-level statistics were calculated based on the number of firms that the cluster has in each
state.
The D&B database provided firm-level information on revenue and the number of
employees; as such, it allowed for a more robust comparison group. Using the D&B database,
the comparison group for each cluster was created by selecting firms with fewer than 500
employees that were located in the counties of each cluster and that had the same 6-digit NAICS
codes reported by each cluster’s small businesses. Due to cost considerations for each cluster, a
random sample of 1000 firms that corresponded to these sample restrictions was selected from
the D&B database.
There are several limitations that should be considered when samples from these
secondary sources are used as comparison samples for the 10 clusters’ small businesses. First,
the computed benchmarks that were based on the secondary data sources do not correspond to
the period of evaluation. The timeframes for the comparison samples are March 2010 to March
2011 for the Quarterly Census of Employment and Wages, the third quarter of 2010 to the third
quarter of 2011 for the State Personal Income Accounts, and December 2007 to December 2010
for the D&B sample. Second, both the Quarterly Census of Employment and Wages and the
State Personal Income Accounts data provide statistics for all firms in a given industrial and
geographic scope and do not provide statistics by firm size within industrial and geographic
categories. As a result, part of the difference between the benchmark outcomes and outcomes of
the clusters’ small businesses may be due to the difference in firm size across the two groups.
The comparison sample from the D&B data is restricted to those firms with fewer than 500
207

employees; however, the distribution of the firm sizes in the D&B sample may be different than
the distribution of firm sizes among the clusters’ small businesses. Finally, the small businesses
participating in the 10 clusters may not be a representative sample of small businesses operating
in the United States. It is plausible that these firms have certain characteristics that made them
more likely to participate in the cluster. To the extent that these characteristics are correlated
with the business performance outcomes, they may partially drive the differences between the
outcomes of the benchmark samples and those of the clusters’ small businesses.
D.3. Regional Impact Analysis The evaluation design also included a regional impact analysis using the Regional Input-
Output Modeling System II (RIMS II) multipliers provided by the BEA.
208
62 The regional impact
analysis using RIMS II multipliers enables the estimation of the overall impact that the small
businesses participating in the 10 clusters have on their regional economies. The model estimates
the regional economic impact by taking into account the direct, indirect, and induced effects of
employment, revenue, and compensation changes reported by the small businesses.
RIMS II was developed by the BEA based on the accounting framework of the input-
output table. RIMS II provides multipliers for specified industrial and geographical categories,
and the multipliers are then used to estimate the indirect and induced effects associated with the
direct effect of a program or an external event. The direct effect is the initial effect generated by
the program or event itself, such as an increase in the number of people employed by cluster firm
members. The indirect effect takes into account the impact generated by the program or event on
the industries in the region, such as a rise in employment for upstream and downstream firms as
a result of a rise in employment directly generated by a program or an external event. The
induced effect takes into account the change to household income generated by the program or
event, which further stimulates the local economy.
BEA offers two distinct series of multipliers for RIMS II, the annual and the benchmark
series. The annual series is based on the 2008 national input-output and regional data, while the
benchmark series is based on the 2002 national input-output data and the 2008 regional data.
Furthermore, the benchmark series provides an enhanced ability to differentiate between sub-
62 Please refer to Regional Multipliers: A User Handbook for the Regional Input-Output Modeling System (RIMS II) for more information on RIMS II Multipliers.
industries. Consequently, the annual series covers 62 broad categories of industries while the
benchmark series contains those same 62 broad industries, but broken down into a total of 406
sub-industries. In essence, the tradeoff in choosing the annual series is a reduction in the
granularity of the sub-industries in exchange for more recent data.
For the economic impact estimates provided in this report, the annual series of multipliers
were selected. This choice was dictated by the need to have multipliers more apt to reflect the
likely changes in supply, demand, and inputs sourcing that have occurred over the last 10 years.
These changes are expected to result from an increase in global sourcing by businesses, changes
in the size and composition of the manufacturing sector in the United States, and the financial
crisis of 2008.
The assumptions underlying the use of RIMS II fall under the following categories: (1)
assumptions that are inherent to RIMS II, (2) assumptions that are used in imputing missing
209
values for the small businesses participating in the 10 clusters, (3) assumptions that are involved
in selecting the region for each cluster. First, as in any other input-output model, RIMS II is a
static model; the dynamic impacts, such as the general equilibrium effects of increased
employment on wages and prices, are not included in the model. Additional assumptions, as
summarized by BEA63 are as follows:
1. Firms have no supply constraints – input-output based multipliers assume that
industries can increase their demand for inputs and labor as needed to meet
additional demand.
2. Firms have fixed patterns of purchases – input-output based multipliers assume
that an industry must double its inputs to double its output.
3. Firms use local inputs when they are available – the method used by RIMS II to
develop regional multipliers assumes that firms will purchase inputs from firms in
the region before using import.
Another important aspect of RIMS II is that the model does not differentiate between
full-time and part-time employment. This holds both for the input data and output values of the
model. However, survey data from the cluster small businesses suggest that the majority of the
63 For a more comprehensive discussion of the assumptions underpinning the RIMS II multipliers, please refer to RIMS II Assumption from the BEA at https://www.bea.gov/regional/rims/rimsii/illustrativetables.aspx.
jobs in cluster businesses are full-time. Part-time employment only accounted for 6.9% of total
cluster employment in 2010 and 9.6% of total cluster employment in 2011. Nevertheless, total
employment in small businesses, defined as the sum of the number of full-time and part-time
employees, is used as input into the model.
The second set of assumptions relates to the non-responses to the survey questions or to
the entire survey by small business participants. For the purposes of RIMS II, small businesses
that submitted a survey response can be categorized based on the completeness of their answers
to questions tied to revenue, employment and payroll (RIMS II input data) and questions about
their NAICS code. A first category of small businesses provided complete answers regarding
their NAICS code and provided two values (2010 and 2011) for the given indicators (revenue,
employment, or payroll). A second category provided information for a given indicator but did
not provide a NAICS code, which means these small businesses cannot be tied to a specific
multiplier since the multipliers are organized by industry code. A third category of small
businesses provided neither a NAICS code nor any information for a given indicator (i.e.,
revenue, employment, or payroll).
In order to account for these three categories of small businesses, three scenarios were
devised:
· Scenario 1: This scenario relies only on complete responses provided by small businesses
(those including both the relevant industry code and input data) as the measure of the
initial change in revenue, employment, or payroll. As a result, it can be viewed as a lower
bound, since all the small businesses in the second and third categories are left out.
· Scenario 2: This scenario includes all the small businesses in scenario 1, and it
additionally includes firms with missing NAICS codes but not missing revenue,
employment, or payroll in the analysis. In particular, it computes a composite multiplier
based on the actual distribution of industry codes in a given cluster (weights are
computed based on the small businesses in the first category). The composite multiplier is
then multiplied by the mean indicator (employment, revenue, or payroll) for the group of
small businesses with the missing NAICS codes.
210
· Scenario 3: This scenario includes all the small businesses in scenario 2 (and therefore
those in scenario 1), and it additionally includes the firms with missing NAICS codes and
indicators (employment, revenue, or payroll) in the analysis. In particular, it involves
imputing the missing indicator value for those with missing indicators and NAICS codes
by using the average value of a given indicator within a cluster. These cluster averages
are then multiplied by the same composite multiplier as described in scenario 2 to create
an upper bound on the regional economic impact estimates.
The third set of assumptions underlying the analysis is related to the selection of the
region over which economic impacts can be estimated. In principle, the size of the RIMS II
multipliers changes with the size of the region where economic impacts are analyzed. Selecting a
larger region in RIMS II generally means higher multipliers because the larger the region, the
lower the leakages outside of that region. Consequently, estimations of economic impacts over
larger regions may lead to overestimation of the impacts, while estimation over too narrow
regions may lead to underestimation.
As discussed in Section 3, there are wide variations between clusters in their geographic
scope and the location of cluster participants. Some clusters, such as the Energy Storage Cluster
and the Defense Alliance, have participants in multiple states while others, such as Project 17
and the San Diego Defense Cluster, are much more localized and have participants in several
counties. For the RIMS II analysis, a cluster’s region has to consist of contiguous counties or
states. Therefore, the region for the clusters that have participants dispersed across multiple
states has to consist of the entire set of contiguous states for the purposes of the analysis. This
limitation brings even larger variation in the size of each cluster’s region. In order to reduce the
variation in estimated regional impacts that may result from the variation in the size of the cluster
region, all clusters’ RIMS II geographic region were selected to be at least a single state, and at
most, several states contiguous to each other.
211
64 For clusters spanning several states, only those
states contiguous and where at least three cluster participants were present were selected.
In order to compare the implications for selecting a whole state as opposed to the few
counties that some of the clusters span, separate multipliers for the whole state and the group of
64 This is a limitation of the RIMS II system and most other input-output models.

counties were ordered for FlexMatters and Project 17. FlexMatters covers 21 counties in
Northeast Ohio, and Project 17 has a geographic scope of three counties in California. Tables D-
2, D-3, and D-4 below present the total estimated regional economic impact of Project 17’s small
businesses under the three scenarios, using the two sets of multipliers based on different
definitions of the cluster region.
The difference of the total economic impact on regional revenue of the Project 17 small
businesses between September 2010 and September 2011 is roughly 29% higher using the
multipliers for the state of California than using the multipliers for the three counties that make
up Project 17’s geographic scope. This percentage holds true for all three scenarios. This same
difference is roughly 23% for employment and once again remains steady across all three
scenarios. There is more variation, however, for payroll. The difference for scenarios 1 and 2 is
about 18% but it jumps to 23% in scenario 3. As expected, a larger geographic area led to a
higher multiplier, which in turn led to a higher difference in total regional economic impact.
Table D-2. Change in total economic impact of Project 17 small businesses under scenario 1, using state- and county-level multipliers
212
State County Difference
Revenue 10,100,623 7,188,636 28.8%
Employment 268 207 22.7%
Payroll 72,905 59,211 18.8%
Table D-3. Change in total economic impact of Project 17 small businesses under scenario 2, using state- and county-level multipliers
State County Difference Revenue 18,916,568 13,433,739 29.0% Employment 265 205 22.7%
Payroll 65,972 54,015 18.1%
Table D-4. Change in total economic impact of Project 17 small businesses under scenario 3, using state- and county-level multipliers
State County Difference Revenue 32,123,534 22,789,383 29.1% Employment 327 251 23.2% Payroll 235,177 180,820 23.1%

Table D-5, D-6, and D-7 below repeat this exercise for FlexMatters, which spans a
greater share of the state in which it is located than Project 17 did.
Table D-5. Change in total economic impact of FlexMatters small businesses under scenario 1, using state- and county-level multipliers
213
State County Difference Revenue 6,699,630 6,532,660 2.5% Employment -3 2 170.6% Payroll 398,343 394,780 0.9%
Table D-6. Change in total economic impact of FlexMatters small businesses under scenario 2, using state- and county-level multipliers
State County Difference Revenue 34,713,053 33,056,480 4.8% Employment 164 161 2.2% Payroll 740,853 718,372 3.0%
Table D-7. Change in total economic impact of FlexMatters small businesses under scenario 3, using state- and county-level multipliers
State County Difference Revenue 51,104,272 48,576,103 4.9% Employment 183 178 2.6% Payroll 1,026,303 988,055 3.7%
In the case of FlexMatters, delineating the region as the state of Ohio, as opposed to the
21 counties that make up the cluster’s geographic scope, leads to smaller differences in estimated
regional economic impacts as for the Project 17 Agricultural Technology Cluster across all three
indicators. The difference between state and county delineation for the change in total economic
impact in terms of regional revenue is between 2.5% and 5%, respectively, across the scenarios.
The difference is around 2.5% for employment across the scenarios, with the exception of
scenario 1, where the change in employment between September 2010 and September 2011 is
very small for both regions, leading to a very high percentage change. The difference between
regions with regard to impact on regional payroll is also small, going from 0.9% for scenario 1 to
about 3% for the other two scenarios.
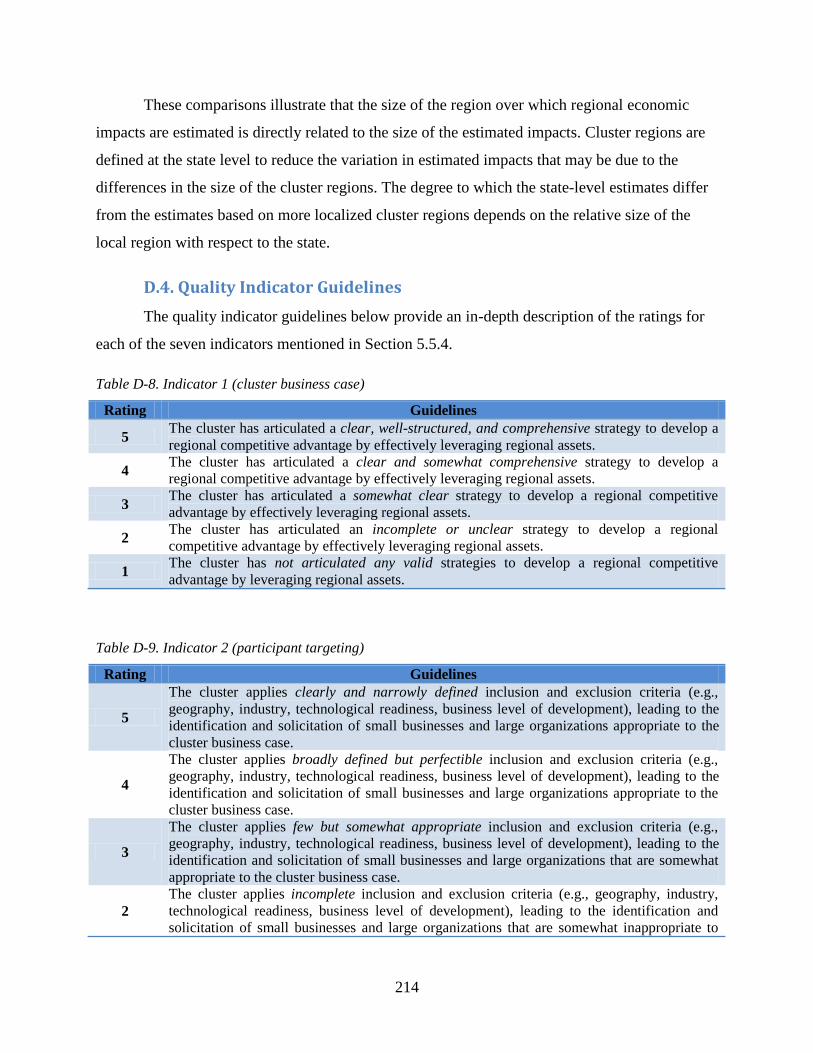
These comparisons illustrate that the size of the region over which regional economic
impacts are estimated is directly related to the size of the estimated impacts. Cluster regions are
defined at the state level to reduce the variation in estimated impacts that may be due to the
differences in the size of the cluster regions. The degree to which the state-level estimates differ
from the estimates based on more localized cluster regions depends on the relative size of the
local region with respect to the state.
D.4. Quality Indicator Guidelines The quality indicator guidelines below provide an in-depth description of the ratings for
each of the seven indicators mentioned in Section 5.5.4.
Table D-8. Indicator 1 (cluster business case)
214
Rating Guidelines
5 The cluster has articulated a clear, well-structured, and comprehensive strategy to develop a regional competitive advantage by effectively leveraging regional assets.
4 The cluster has articulated a clear and somewhat comprehensive strategy to develop a regional competitive advantage by effectively leveraging regional assets.
3 The cluster has articulated a somewhat clear strategy to develop a regional competitive advantage by effectively leveraging regional assets.
2 The cluster has articulated an incomplete or unclear strategy to develop a regional competitive advantage by effectively leveraging regional assets.
1 The cluster has not articulated any valid strategies to develop a regional competitive advantage by leveraging regional assets.
Table D-9. Indicator 2 (participant targeting)
Rating Guidelines
5
The cluster applies clearly and narrowly defined inclusion and exclusion criteria (e.g., geography, industry, technological readiness, business level of development), leading to the identification and solicitation of small businesses and large organizations appropriate to the cluster business case.
4
The cluster applies broadly defined but perfectible inclusion and exclusion criteria (e.g., geography, industry, technological readiness, business level of development), leading to the identification and solicitation of small businesses and large organizations appropriate to the cluster business case.
3
The cluster applies few but somewhat appropriate inclusion and exclusion criteria (e.g., geography, industry, technological readiness, business level of development), leading to the identification and solicitation of small businesses and large organizations that are somewhat appropriate to the cluster business case.
2 The cluster applies incomplete inclusion and exclusion criteria (e.g., geography, industry, technological readiness, business level of development), leading to the identification and solicitation of small businesses and large organizations that are somewhat inappropriate to

215
Rating Guidelinesthe cluster business case.
1
The cluster does not have any clearly defined inclusion and exclusion criteria (e.g., geography, industry, technological readiness, business level of development), leading to the identification and solicitation of small businesses and large organizations that are generally inappropriate to the cluster business case.
Table D-10. Indicator 3 (participation of small businesses in cluster services/activities)
Rating Guidelines
5 Cluster services, events, and activities were clearly communicated and promoted to potential participants leading to attendance by a majority of the targeted small businesses within the designed industry and geographic area.
4 Cluster services, events, and activities were clearly communicated to potential participants leading to attendance by a good portion of the targeted small businesses within the designed industry and geographic area.
3 Cluster services, events, and activities were communicated to potential participants leading to attendance by an adequate portion of the targeted small businesses within the designed industry and geographic area.
2 Cluster services, events, and activities were poorly communicated to potential participants leading to attendance by only a small portion of the targeted small businesses within the designed industry and geographic area.
1 Cluster services, events, and activities were never implemented leading to attendance by a negligible portion of the targeted small businesses within the designed industry and geographic area.
Table D-11. Indicator 4 (focus and relevance to small businesses)
Rating Guidelines
5 The cluster conducts a needs assessment and a root cause analysis for enrolling small businesses and delivers effective, appropriate, and highly tailored services and activities that address multiple aspects of the cluster's business case.
4 The cluster does not conduct a needs assessment for enrolling small businesses but delivers effective and appropriate services and activities that address multiple aspects of the cluster's business case.
3 The cluster delivers adequate services and activities but does not fully address multiple aspects of the cluster's business case.
2 The cluster delivers inadequate services and activities for the cluster's business case.
1 No services, events, or activities are being delivered.
Table D-12. Indicator 5 (performance indicators, data sources and collection methodology)
Rating Guidelines
5 The cluster developed comprehensive, objective, and clearly defined performance and quality indicators, based on industry best practices. The data source(s) and collection methodology are valid and reliable.
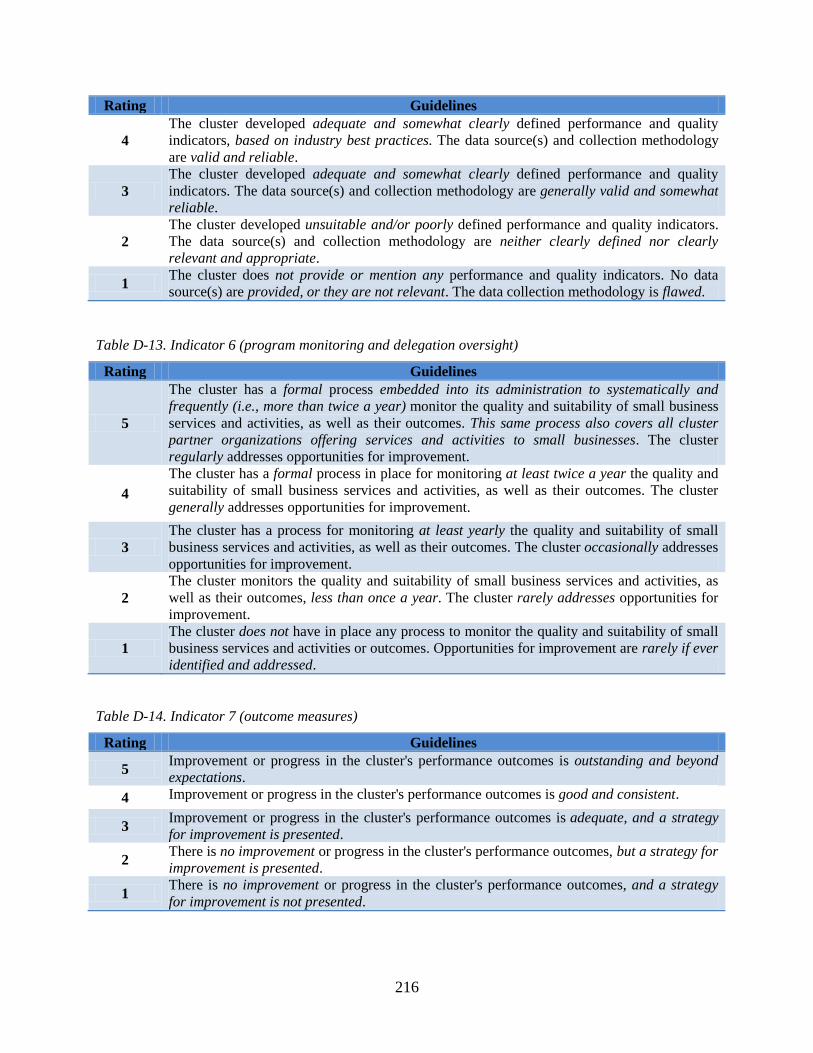
216
Rating Guidelines
4 The cluster developed adequate and somewhat clearly defined performance and quality indicators, based on industry best practices. The data source(s) and collection methodology are valid and reliable.
3 The cluster developed adequate and somewhat clearly defined performance and quality indicators. The data source(s) and collection methodology are generally valid and somewhat reliable.
2 The cluster developed unsuitable and/or poorly defined performance and quality indicators. The data source(s) and collection methodology are neither clearly defined nor clearly relevant and appropriate.
1 The cluster does not provide or mention any performance and quality indicators. No data source(s) are provided, or they are not relevant. The data collection methodology is flawed.
Table D-13. Indicator 6 (program monitoring and delegation oversight)
Rating Guidelines
5
The cluster has a formal process embedded into its administration to systematically and frequently (i.e., more than twice a year) monitor the quality and suitability of small business services and activities, as well as their outcomes. This same process also covers all cluster partner organizations offering services and activities to small businesses. The cluster regularly addresses opportunities for improvement.
4 The cluster has a formal process in place for monitoring at least twice a year the quality and suitability of small business services and activities, as well as their outcomes. The cluster generally addresses opportunities for improvement.
3 The cluster has a process for monitoring at least yearly the quality and suitability of small business services and activities, as well as their outcomes. The cluster occasionally addresses opportunities for improvement.
2 The cluster monitors the quality and suitability of small business services and activities, as well as their outcomes, less than once a year. The cluster rarely addresses opportunities for improvement.
1 The cluster does not have in place any process to monitor the quality and suitability of small business services and activities or outcomes. Opportunities for improvement are rarely if ever identified and addressed.
Table D-14. Indicator 7 (outcome measures)
Rating Guidelines
5 Improvement or progress in the cluster's performance outcomes is outstanding and beyond expectations.
4 Improvement or progress in the cluster's performance outcomes is good and consistent.
3 Improvement or progress in the cluster's performance outcomes is adequate, and a strategy for improvement is presented.
2 There is no improvement or progress in the cluster's performance outcomes, but a strategy for improvement is presented.
1 There is no improvement or progress in the cluster's performance outcomes, and a strategy for improvement is not presented.