the evolution of planning and advising in higher education
TRANSCRIPT

THE EVOLUTION OF PLANNING AND ADVISING IN HIGHER EDUCATION
PART 2: SUPPLIER LANDSCAPE

2DRIVING TOWARD A DEGREE PART 2: SUPPLIER LANDSCAPE
TABLE OF CONTENTS
EXECUTIVE SUMMARY .....................................................................................................3PART 1: INSTITUTIONAL PERSPECTIVE ...........................................................................................................................4
PART 2: SUPPLIER LANDSCAPE .......................................................................................................................................... 5
PART 2: SUPPLIER LANDSCAPE .....................................................................................6MARKET SEGMENTATION .......................................................................................................................................................6
MARKET REACH ........................................................................................................................................................................... 7
PRODUCT ADOPTION ...............................................................................................................................................................8
PRODUCT INTEGRATION ....................................................................................................................................................... 10
WHAT MATTERS MOST ............................................................................................................................................................ 11
CALL TO ACTION ............................................................................................................. 15
ABOUT TYTON PARTNERS ............................................................................................. 16
ACKNOWLEDGMENTS ..................................................................................................... 17
AUTHORS ........................................................................................................................... 18
APPENDIX.......................................................................................................................... 19EXHIBIT A: MARKET SEGMENTATION BY NOTABLE SUPPLIERS ..................................................................... 19
EXHIBIT B: PRODUCT CATEGORIES AND DESCRIPTIONS ................................................................................... 21
EXHIBIT C: MARKET SIZE METHODOLOGY ..................................................................................................................23
3DRIVING TOWARD A DEGREE PART 2: SUPPLIER LANDSCAPE
EXECUTIVE SUMMARYColleges and universities across the United States are grappling with unprecedented and multifaceted pressures. On one side, the postsecondary system is working to serve an increasingly diverse student population. While great strides have been made over the last several decades to increase access to higher education, institutions of all types are having to evolve to ensure that access is paired with degree completion or a career outcome, particularly for the non-traditional student population. These pressures have profound and positive implications for our society and economy. On the other side, another pressure is far less promising: institutions are facing declining funding and revenue streams, while working to keep higher education as affordable as possible. Responding to these pressures presents a series of difficult trade-offs, leaving institutions little room for error. These new pressures and challenges have sparked a number of promising innovations and improvement initiatives. This year, we turn our attention to the growing movement toward integrated and holistic student supports.
The suppliers in the student success ecosystem have been moving toward and facilitating integrated student supports for several years. In January 2016, we predicted in a Campus Technology opinion piece that momentum on the supply side of the student success ecosystem was beginning to break down technical and organizational silos. Since that time, we have seen more corporate consolidation and more meaningful product development and launches in pursuit of this vision. At the same time, emerging players have begun to gain traction by focusing on evolving and new demand-side challenges related to engaging students, establishing degree pathways, and bridging the gap between education and employment.
So is the student success ecosystem a healthy, thriving market? Is there the right balance of established players and new entrants competing to scale effective, high-quality offerings? Are the biggest institutional demand-side challenges being addressed by the supplier ecosystem? And are they being addressed by focused, niche applications or broad, enterprise-wide platforms? These are the essential questions of Part 2, but because this is a dynamic market, the answers are not definitive.
Driving Toward a Degree is a data-driven resource used to measure the extent and impact of various institutional structures, processes, practices, and technologies related to student success. Student success is actualized by institutions through student supports, which are defined as products and services used to promote students’ educational, personal, and professional development by targeting both academic and non-academic barriers to achievement.
These student supports include academic advising, teaching, career services, financial aid & literacy, and student life. Driving Toward a Degree surveys a national sample of key stakeholders in functions related to student supports across a range of institutions. Stakeholders include a mix of administrators, advisors, and faculty from the following functional areas: academic advising, faculty, career services, financial aid, and student affairs.

4DRIVING TOWARD A DEGREE PART 2: SUPPLIER LANDSCAPE
Driving Toward a Degree is part of a research collaborative for increasing student success through the redesign of student supports. It is led by Tyton Partners with the support of the Babson Survey Research Group and in partnership with Achieving the Dream (ATD), NACADA: The Global Community for Academic Advising, and NASPA: Student Affairs Administrators in Higher Education.
Figure 2.1
Similar to our previous three publications between 2015 and 2017,1 Driving Toward a Degree: The Evolution of Student Supports in Higher Education is a two-part series tracking the progress of student supports redesign from institutional and supplier perspectives in support of improved student outcomes. The goal is to offer insights to help institutions make informed decisions toward redesigning their student supports to improve overall student success, retention, and completion.
PART 1: INSTITUTIONAL PERSPECTIVEDrawing from the largest national study on student success, with insights from 3,300 institutional stakeholders across 1,100 unique institutions, Part 1 (available for download at drivetodegree.org) measures the extent and impact of various student success practices, products, and services related to undergraduate student supports. It also introduces contextually relevant benchmarks that enable institutions to gauge their progress and identify which barriers prevent them from equaling or exceeding best in class.
1. Please visit http://drivetodegree.org.
OrganizationalStructure
SURVEY TOPICSSTUDENT SUPPORTS FUNCTIONS / ROLES
Process
Practice
Technology
Advising
Career Services
Financial Aid & Literacy
Student Life
Teaching
AcademicAdvising
Career Services
Financial Aid
Student A�airs
Faculty
STU
DE
NT
SUC
CE
SS

5DRIVING TOWARD A DEGREE PART 2: SUPPLIER LANDSCAPE
PART 2: SUPPLIER LANDSCAPEPart 2 similarly draws from the student success study and interviews with over 30 institutional decision-makers and product and services suppliers. It allows readers to gain insight into the present state of integrated student supports technologies across metrics related to market segmentation, market reach, product adoption, and product integration, and to look forward toward future evolution in the product landscape. Five important findings are featured in Part 2:
1. The student supports technologies and services market for 2019 is estimated to be $560 million. The technologies and services market related to academic advising, as a segment of this larger market, is $360 million, a 7% increase from 2017.
2. Across the 12 product categories related to advising, only Academic Planning & Audit has an institutional adoption rate greater than 50%. The market for student supports technologies is unsaturated.
3. In spite of low technology adoption rates, nearly two-thirds (62%) of administrators and advisors believe in the effectiveness of technology to improve advising.
4. Four core product categories related to advising – Caseload Management; Diagnostics; Alerts, Signals & Notifications; and Performance Management & Measurement – are most positively correlated with an ideal advising situation and should be prioritized for increased institutional adoption.
5. Competitive dynamics for the advising market indicate continued consolidation of institutional spend among a select group of leading suppliers, despite new entrants into the marketplace.
6DRIVING TOWARD A DEGREE PART 2: SUPPLIER LANDSCAPE
PART 2: SUPPLIER LANDSCAPE
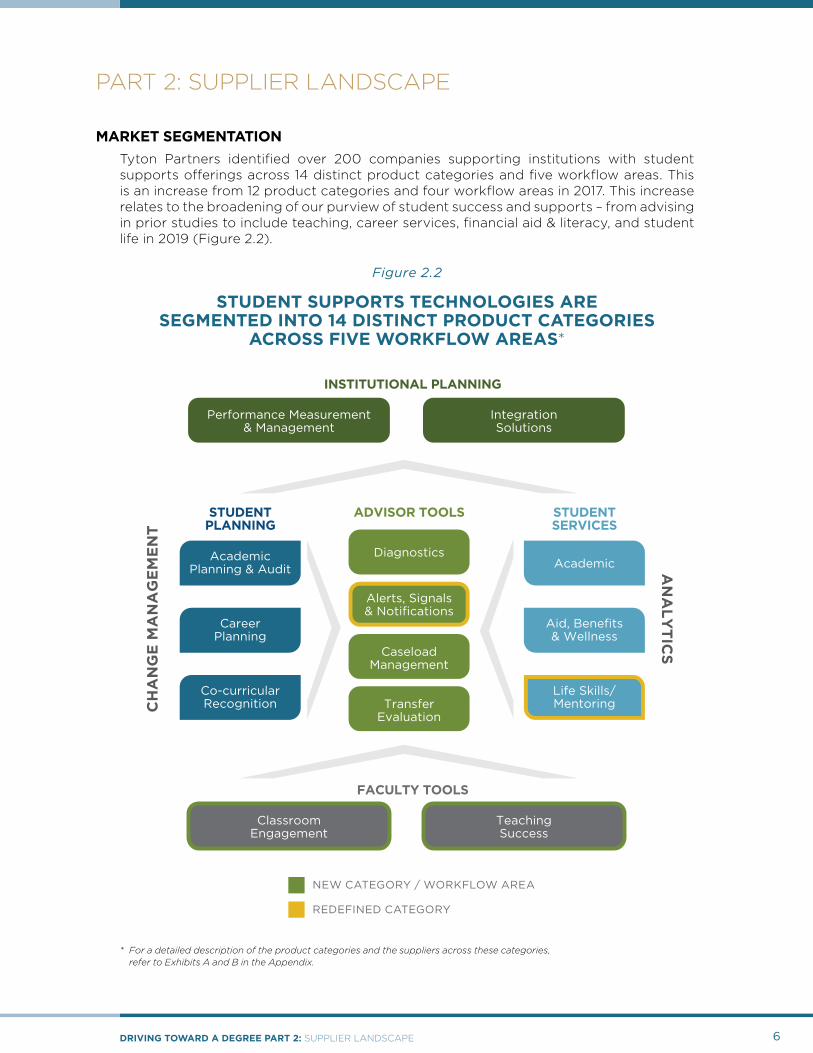
MARKET SEGMENTATIONTyton Partners identified over 200 companies supporting institutions with student supports offerings across 14 distinct product categories and five workflow areas. This is an increase from 12 product categories and four workflow areas in 2017. This increase relates to the broadening of our purview of student success and supports – from advising in prior studies to include teaching, career services, financial aid & literacy, and student life in 2019 (Figure 2.2).
Figure 2.2
STUDENT SUPPORTS TECHNOLOGIES ARE SEGMENTED INTO 14 DISTINCT PRODUCT CATEGORIES
ACROSS FIVE WORKFLOW AREAS*
* For a detailed description of the product categories and the suppliers across these categories, refer to Exhibits A and B in the Appendix.
Performance Measurement& Management
AcademicPlanning & Audit
CareerPlanning
Co-curricularRecognition
IntegrationSolutions
INSTITUTIONAL PLANNING
CH
AN
GE
MA
NA
GE
ME
NT
AN
ALY
TICS
ClassroomEngagement
TeachingSuccess
FACULTY TOOLS
STUDENTPLANNING
Academic
Aid, Benefits& Wellness
Life Skills/Mentoring
STUDENTSERVICES
Diagnostics
Alerts, Signals& Notifications
CaseloadManagement
TransferEvaluation
ADVISOR TOOLS
NEW CATEGORY / WORKFLOW AREA
REDEFINED CATEGORY

7DRIVING TOWARD A DEGREE PART 2: SUPPLIER LANDSCAPE
MARKET REACHTyton Partners estimates the total market for student supports to be $560 million, divided between commercial spend and in-house technology. Commercial spend is the amount institutions spend on third-party student supports technologies, while in-house technology is the estimated amount institutions spend on in-house development of advising technology (Figure 2.3).
Figure 2.3
STUDENT SUPPORTS TECHNOLOGIES AND SERVICES MARKET DIVIDED INTO IN-HOUSE AND COMMERCIAL SPEND*
* Methodology for student supports market sizing is explained in Exhibit D Academic advising and related technology – which accounts for 12 of the 14 product categories outlined above, excluding only classroom engagement and teaching success – is estimated to be nearly 65% of the student supports market. The advising market has grown by 7% since 2017, from roughly $338 million to $360 million. The 2017–2019 growth rate of commercial spend on advising technologies was 3% higher than the overall growth rate for the advising market during the same period (Figure 2.4).
Figure 2.4
ADVISING TECHNOLOGY & SERVICE MARKET (“STUDENT SUCCESS”): COMMERCIAL VS. IN-HOUSE SPEND*
* Unlike in 2015 and 2017, the methodology for sizing the advising market in 2019 does not include Information Technology (IT) personnel spend related to advising
2019 COMMERCIALVS. IN-HOUSE
$560M
560M
$423M
$137M
$560M
COMMERCIALSPEND
IN-HOUSETECHNOLOGY
40%
20%
100%
0%
80%
60%
2015 2017 2019
$322M
$84M
$322M $338M $360M
COMMERCIALSPEND
IN-HOUSETECHNOLOGY
40%
20%
100%
0%
80%
60%
$254M
$80M
$280M
10%
5% 7%

8DRIVING TOWARD A DEGREE PART 2: SUPPLIER LANDSCAPE
The two largest product categories by commercial spend for advising continue to be academic planning & audit and caseload management, which consist of roughly one-third and one-fourth of the commercial spend, respectively. In addition, the advising market is dominated by a handful of suppliers, with Ellucian, EAB, Hobsons, and Blackboard together accounting for roughly 48% of adoption across advising-related product categories. This level of market consolidation is an increase of 3% from 2017.
PRODUCT ADOPTIONAcademic advising exists most often at the crossroads of student supports. Administrators’ and advisors’ belief in the effectiveness of technology to improve advising has increased 9% from 2017 to 2019 (Figure 2.5).
Figure 2.5
TECHNOLOGY USED TO SUPPORT ADVISING INCREASES EFFECTIVENESS
However, Tyton Partners’ measurements of the extent of both widespread and limited adoption across the 12 advising-related product categories demonstrate lower-than-expected rates of technology adoption.
40%
20%
100%
0%
80%
60%
n= 1,381
n= 1,178
Agree
62%Agree
53%
2017 2019
9%

9DRIVING TOWARD A DEGREE PART 2: SUPPLIER LANDSCAPE
Figure 2.6
WHICH OF THE FOLLOWING ADVISING FUNCTIONS DOES YOUR INSTITUTION USE TECHNOLOGY TO SUPPORT?
PRODUCT CATEGORY
WIDESPREAD USE OF TECHNOLOGY
LIMITED USE OF TECHNOLOGY
KEY 2017 2019 Δ 2017 2019 Δ
Academic Planning &
Audit58% 61% 3% 33% 34% 1%
Diagnostics 13% 18% 5% 40% 48% 8%
Performance Measurement &
Management7% 11% 4% 35% 37% 2%
Alerts, Signals & Notifications 29% 27% -2% 47% 48% 1%
Caseload Management 22% 32% 10% 42% 40% -2%
Transfer Evaluation 21% 29% 8% 42% 40% -2%
Career Planning 13% 18% 5% 43% 50% 7%
Integration Solutions 24% 34% 10% 40% 43% 3%
Aid, Benefits & Wellness*
19%
21% 2%
50%
48% -2%
Co-curricular Recognition* 6%
N/A
21%
N/AAcademic* 25% 50%
Life Skills/Mentoring* 14% 39%
≥ 50%26% - 49%≤ 25%
* Final four product categories of 2019 were grouped together in 2017 as Aid, Benefits & Wellness.
Academic planning & audit is the mainstay of advising, but the remaining 11 product categories are poorly penetrated (Figure 2.6). There are several reasons to explain the discrepancy between low rates of technology adoption and technology’s perceived effectiveness. The reasons most often cited in our conversations with institutional decision-makers include deficiencies in strategic planning, funding, execution, and system integration. Less cited is a lack of understanding of the technological needs of stakeholders and the capabilities of technology offerings.

10DRIVING TOWARD A DEGREE PART 2: SUPPLIER LANDSCAPE
PRODUCT INTEGRATIONThat institutions are holistically tackling the problems associated with low rates of student success with the products available to them is supported by increases in “usage overlaps” among the 12 advising product categories. The average rate of usage overlap between product categories increased from 13% in 2017 to 34% in 2019.
Figure 2.7
ADVISING TECHNOLOGY (WIDESPREAD) USAGE OVERLAP BY PRODUCT CATEGORIES
40-100%31%-39%0-30%
The product category used most frequently with other product categories is Academic Planning & Audit. The next product category used most frequently with others is Integration Solutions, which increased by an average of 25% from 2017 (Figure 2.7). These overlaps do not indicate whether these products are integrated technologically into a single platform rather than remaining separate point solutions, but they do suggest how institutions are integrating their products, processes, and practices to achieve holistic student supports.
Life Skills/Mentoring
Aid, Benefits & Wellness Academic Transfer
EvaluationCaseload
ManagementAlerts, Signals & Notifications Diagnostics Co-curricular
RecognitionCareer
PlanningAcademic Planning &
AuditIntegration Solutions
Performance Measurement
& Management22% 28% 27% 25% 30% 29% 26% 14% 25% 33% 29%
Integration Solutions 31% 42% 43% 38% 44% 43% 38% 17% 34% 54%
Academic Planning &
Audit36% 51% 55% 48% 56% 55% 47% 20% 44%
Career Planning 25% 34% 36% 31% 37% 36% 32% 16%
Co-curricular Recognition 15% 18% 17% 15% 17% 18% 16%
Diagnostics 27% 36% 38% 34% 40% 39%
Alerts, Signals & Notifications 32% 43% 46% 39% 47%
Caseload Management 30% 44% 44% 40%
Transfer Evaluation 26% 37% 38%
Academic 32% 42%
Aid, Benefits & Wellness 31%

11DRIVING TOWARD A DEGREE PART 2: SUPPLIER LANDSCAPE
WHAT MATTERS MOSTSeveral student supports technologies ensure that students are on the right track to graduate, and prevent students from slipping off track. But not all technologies are created equal and institutions struggle to realize the full promise of the technology when they have to integrate multiple systems. Which technologies have the most impact regarding achieving an ideal student success environment? Institutions are under increasing pressure to earn greater returns on their investments in products and services. So, which technologies should institutions prioritize?
The answer – technologies in the following four core product categories: Caseload Management; Diagnostics; Alerts, Signals & Notifications; and Performance Measurement & Management.
Tyton Partners separated the 12 distinct advising-related product categories based on their scope of use: core or supplementary. Within each group, we then compared each category’s rate of widespread institutional adoption against administrators’ and advisors’ opinion on the degree of impact that technology adoption has on sentiments related to “ideal” advising.
Figure 2.8
WIDESPREAD ADOPTION OF CORE ADVISING TECHNOLOGY AND SENTIMENTS REGARDING IDEAL ADVISING
* Degree of Impact is the difference between sentiments of ideal advising (Agree-Disagree=Degree of Impact)
Four of the five core product categories demonstrate the greatest differences between agreement and disagreement regarding ideal advising situations across the 12 advising-related product categories. In other words, these four core products are most positively associated with progress toward an ideal advising environment and should be prioritized for increased institutional adoption (Figure 2.8). Several suppliers who provide products in these core categories are highlighted below. We chose these companies because of the strength of their products within these categories, but it is important to note that many of these suppliers are offering products across multiple categories, mirroring the integration of student supports at institutions.
HIGH ADOPTION, HIGH IMPACT
HIGH ADOPTION, LOW IMPACT
+ ADOPTION
+ IMPACT
- IMPACT
- ADOPTION
LOW ADOPTION, LOW IMPACT
LOW ADOPTION, HIGH IMPACT
PERFORMANCEMEASUREMENT &
MANAGEMENT
ALERTS, SIGNALS & NOTIFICATIONS
DIAGNOSTIC
ACADEMICPLANNING
& AUDIT
CASELOADMANAGEMENT

12DRIVING TOWARD A DEGREE PART 2: SUPPLIER LANDSCAPE
1. Caseload Management tools facilitate a collaborative process of communication, coordination, evaluation, and advocacy for supports to better meet students’ needs. Institutions continue to struggle with insufficient advising capacity. Too often, the caseload sizes of these advisors are too large for them to engage with students for sufficient periods of time or in meaningful ways. Conscious adoption and utilization of caseload management solutions are a necessary component in improving advisor capacity. EAB, Ellucian, Blackboard, and Salesforce.org are notable suppliers in this product category.
In 2017, Salesforce.org’s Education Cloud expanded its CRM-based set of solutions designed to enable institutions to drive success across the student life cycle. This included the introduction of Salesforce Advisor Link (SAL), a caseload management solution focused on streamlining advising operations and providing a unified record for every student. In 2018, Salesforce.org launched SAL 2.0, which includes Saleforce’s Einstein, an AI-powered technology that automatically personalizes engagement and proactively provides outreach to students.
2. Diagnostics technologies use various analytical approaches to (1) immediately identify at-risk students who are missed by traditional safety nets, (2) determine risk factors for different types of students and at various points in the student life cycle, and (3) quickly provide a complete risk assessment for an entire group of students, enabling institutions to prioritize and better tailor their efforts. EAB, Hobsons, Blackboard, and Aviso Retention are noteworthy suppliers in this product category.
Aviso Retention’s Predict analyzes millions of data points gathered from an institution’s LMS and SIS, then creates easy-to-use student risk indicators. Predict has played a crucial role in the initial success of Carolina Works. Through a $9.2 million First in the World grant from the US Department of Education, Carolina Works was formed in 2015 as a proactive and individualized success coaching program at 10 colleges in the North Carolina Community College System, reaching approximately 15,000 students. Predict has helped Carolina Works success coaches at these colleges (provisionally) achieve improvements in retention rates ranging from 3% to 12% by not only prioritizing students for outreach but also recommending how best to engage them.

13DRIVING TOWARD A DEGREE PART 2: SUPPLIER LANDSCAPE
3. Alerts, Signals & Notifications tools personalize student communication and, based on nudge theory in behavioral science, deliver targeted online messages to positively influence students’ actions. These nudges are often delivered automatically through messages and chatbots. Motimatic, AdmitHub, Involvio, and Signal Vine are notable suppliers in this product category.
Signal Vine is a noteworthy student engagement platform. It is a two-way texting solution that allows institutions to automate their student messages and responses to save time while quickly identifying responses that require individual attention. This approach, which Signal Vine calls Blended Messaging®, enables personalization at scale. According to University of Texas at Austin’s NACADA presentation in October 2018, the institution used Signal Vine to effectively integrate text messaging into advising, and has produced a near 99% engagement rate with students. It also found that students who have an advising experience with text messaging are far more satisfied than those without. In fact, text messaging was the most common method of student-initiated contact with advisors. Furthermore, texting uncovered issues that were not foreseen and have changed the student-advisor relationship for the better.
4. Performance Measurement & Management technologies maximize the impact of student supports by understanding what is working and for whom. These tools help institutions understand the impact of their programs, initiatives, and interventions with statistical rigor while minimizing selection bias and avoiding the constraints of randomized controlled trials. This allows for more efficient impact measurement aimed at causation and not correlation. Civitas Learning, Campus Labs, eLumen, and Hobsons are noteworthy suppliers in this product category.
Hobsons’ Starfish is recognized as a leading student success platform. Starfish was recently awarded two Technology Trailblazer Awards as part of the 2018 Technology Seal of Approval by Complete College America. To help institutions understand what is working and for whom, Starfish includes Hobsons’ Student Success Matrix (SSMx), a unique and robust intervention library enabling hundreds of institutions within the Starfish community to collaborate and share their high-impact practices and programs.

14DRIVING TOWARD A DEGREE PART 2: SUPPLIER LANDSCAPE
The fifth core product category – Academic Planning & Audit – is not as strongly correlated with ideal advising sentiment and progress. However, this category is the focal point of advising and lays the foundation for interactions between advisors and students. In our 2018 study, 55% of advisors reported regularly dedicating time to degree auditing in a typical advising session. Ellucian’s Degree Works is the leading product in this category. However, several innovators have recently entered the market, including EduNav, Stellic, and Barnes & Noble Education (BNED).
EduNav’s Optimize is noteworthy because it aggregates the degree plans generated by students to forecast demand for courses by term. This provides administrators with a forecast of how many seats are required in each course to meet the expected demand of enrolled students.
Stellic’s value proposition as a student-centric platform is unique because of its background and early successes. Stellic was founded by a group of recent Carnegie Mellon University undergraduates who experienced the frustration of degree planning and auditing with antiquated systems. Through its Degree Planner, Degree Audit, Advisor Interface, and Data Reports solutions, Stellic is integrating academic journey information for students, advisors, and administrators at prominent institutions like the University of Chicago, Johns Hopkins University, and Columbia University.
BNED LoudCloud piloted its Degree Planner in support of Portland State University’s reTHINK, a presidential initiative and campus-wide effort for developing solutions to challenges facing the institution. Through user-centered design, BNED LoudCloud developed an interactive interface that, most notably, crosschecks a student’s financial aid eligibility against their degree plan. BNED LoudCloud’s Degree Planner is scheduled to launch in time for the fall 2019 semester.

15DRIVING TOWARD A DEGREE PART 2: SUPPLIER LANDSCAPE
CALL TO ACTIONDriving Toward a Degree is a resource designed to help institutions pursue integrated student support initiatives and is underwritten by Bill & Melinda Gates Foundation. Contact Tyton Partners ([email protected]) to take advantage of the Driving Toward a Degree initiative as a data-driven resource that delivers a unique understanding of the identification, selection, implementation of, and satisfaction with, student supports technologies. We welcome the opportunity to help institutions and suppliers alike address the gaps in their technological products, assess current capabilities, and identify future needs.
Driving Toward a Degree offers a unique perspective on the viability of the student success ecosystem. This includes data-informed viewpoints on (1) the right balance of established suppliers and new entrants competing to scale effective, high-quality offerings; (2) whether the most significant institutional demand-side challenges are being addressed by the supplier ecosystem; and (3) whether these challenges are being addressed by focused, niche applications or broad, enterprise-wide platforms.

16DRIVING TOWARD A DEGREE PART 2: SUPPLIER LANDSCAPE
ABOUT TYTON PARTNERSTyton Partners is the leading provider of investment banking and strategy consulting services to the education sector and leverages its deep transactional and advisory experience to support a range of clients, including companies, foundations, institutions, and investors.
In higher education, Tyton Partners’ consulting practice offers a unique spectrum of services to support institutions and companies in developing and implementing strategies for revenue diversification and growth, student persistence and success, and innovations in teaching and learning technology.
For more information about Tyton Partners, visit tytonpartners.com or follow us on twitter at @tytonpartners.
Figure 2.9
GROWTH
COMPANIESMARKET
LEADERS
INV
ES
TOR
SN
ON
-PR
OF
ITS
INSTITUTIONS FOUNDATIO
NS
INVESTME
NT B
AN
KINGSTRATEG
Y C
ON
SULT
ING

17DRIVING TOWARD A DEGREE PART 2: SUPPLIER LANDSCAPE
ACKNOWLEDGMENTSThe publications in this series owe much to the support and engagement of a diverse group of individuals and organizations, including Achieving the Dream (ATD), NACADA: The Global Community for Academic Advising, and NASPA: Student Affairs Administrators in Higher Education.
We also would like to thank the more than 30 institutions and suppliers that we interviewed for this two-part publication. We greatly appreciate the input of all our interviewees and the 3,300 survey respondents across 1,300 institutions, as well as their overall contribution to advancing the field’s knowledge of student success in higher education.
The teams at Can of Creative and D+i Creative were notably patient and understanding as we moved from ideas to drafts to professional execution of this publication.
Tyton Partners supports the work of both institutions and suppliers in the student success market. Any mentions of particular institutions or suppliers in this publication serve to illustrate our observations on the evolution of this market. They do not represent an endorsement in any way. Finally, any errors, omissions, or inconsistencies in this publication are the responsibility of Tyton Partners alone.

18DRIVING TOWARD A DEGREE PART 2: SUPPLIER LANDSCAPE
AUTHORSGates Bryant, Partner, Tyton Partners
Gates is a general manager and strategy consultant with a successful 15-year track record of bridging the gap between innovative strategy and practical execution, while serving in various strategy, product management, and operational roles in the education market. He joined Tyton Partners as a partner in 2011.
Dr. Jeff Seaman, Director, Babson Survey Research Group
Jeff has been conducting research on the impact of technology on higher education and K–12 for over a decade. His most recent work includes annual survey reports on the state of online learning across US higher education, reports on open educational resource awareness and adoption in both US K–12 and higher education, and international surveys on online and distance education.
Nicholas Java, Principal, Tyton Partners
Nicholas joined Tyton Partners in 2016 as a principal in the strategy consulting practice. He previously served in roles in the education and impact investing markets, tackling problems in innovation, optimization, and due diligence. Nicholas earned his BA from Johns Hopkins University, his MBA from Columbia Business School, and his MIA from Columbia University’s School of International & Public Affairs.
Michael Chiaro, Associate, Tyton Partners
Michael is an associate in the strategy consulting practice at Tyton Partners. He joined the firm in January 2018. Prior to joining Tyton Partners, Michael served in the Peace Corps as a preventative health educator in Senegal, West Africa. Michael holds a BA in biochemistry from DePauw University.
TO ACCESS OUR OTHER PUBLICATIONS, PLEASE VISIT: tytonpartners.com/library

19DRIVING TOWARD A DEGREE PART 2: SUPPLIER LANDSCAPE
APPENDIX
EXHIBIT A: MARKET SEGMENTATION BY NOTABLE SUPPLIERS
Figure 2.10
WIDESPREAD ADOPTION OF CORE ADVISING TECHNOLOGY AND SENTIMENTS REGARDING IDEAL ADVISING
PRODUCT CATEGORY
WORKFLOW CATEGORY DESCRIPTION
Performance Measurement and Management
Institutional Planning
Integration Solutions
Institutional Planning
Academic Planning & Audit
Student Planning Tools
Career Planning
Student Planning Tools
Co-curricular Recognition
Student Planning Tools
Diagnostics Advisor Tools
Alerts, Signals & Notifications
Advisor Tools
Caseload Management
Advisor Tools

20DRIVING TOWARD A DEGREE PART 2: SUPPLIER LANDSCAPE
PRODUCT CATEGORY
WORKFLOW CATEGORY DESCRIPTION
Transfer Evaluation
Advisor Tools
Academic Student Services
Aid, Benefits & Wellness
Student Services
Life Skills/Mentoring
Student Services
Classroom Engagement
Faculty Tools
Teaching Success
Faculty Tools

21DRIVING TOWARD A DEGREE PART 2: SUPPLIER LANDSCAPE
EXHIBIT B: PRODUCT CATEGORIES AND DESCRIPTIONSFigure 2.11
PRODUCT CATEGORY
WORKFLOW CATEGORY DESCRIPTION
Performance Measurement & Management
Institutional Planning
• Systems that collect student data and provide institutional reporting
• Collected data may include demographic, academic, sentiment, non-cognitive, and other types of data; provided reports may impact and inform resource allocation
Integration Solutions
Institutional Planning
• Solutions to increase compatibility and efficiency across institutions’ information systems
• These solutions allow information to be easily accessed or shared across legacy systems or new technologies and seek to avoid data silos and redundancies
Academic Planning & Audit
Student Planning Tools
• Tools that maintain institutional degree requirements and allow tracking and auditing of progress toward completion
• Primary function is to support course planning and creation of roadmaps to graduation; some tools align these roadmaps to students’ career interests
• Features may include indicators that show when a student veers off course, embedded course registration functions, and course recommendations
Career Planning
Student Planning Tools
• Solutions that recommend career pathways based on student interests and labor market demands; may enable alignment with degree plans to ensure that academic efforts are targeted toward specific career goals
Co-curricular Recognition
Student Planning Tools
• Learning portfolios, profiles, or other solutions that recognize non-academic learning in a rich format via badges or credentials
• Some solutions translate co-curricular learning to specific skills and competencies to facilitate workforce application; a few solutions also map to academic credit, which is ideal
Diagnostics Advisor Tools
• Assessments that measure a student’s risk profile, often by evaluating the student’s non-cognitive skill set or personality traits (e.g., student’s motivation level) in addition to demographic criteria and academic performance
• Diagnostic assessments can take place prior to a student enrolling or during the academic year
Alerts, Signals & Notifications
Advisor Tools
• Platforms that aim to influence student behavior and improve student engagement via (1) alerts that flag at-risk students and notify them to take action; (2) “signals” that provide subtle nudges to influence student behavior change; and/or (3) mobile messages to inform students of institutional services and events
• These alerts, signals, and mobile messages can be automatic or manual and can target broad student populations or specific sub-populations
Caseload Management
Advisor Tools
• Tools that support student intervention processes by facilitating the allocation of advising, tutoring, and career resources
• Products support scheduling, communication between stakeholders, case management, and matching of students to specific advisors, tutors, and career services officers
Transfer Evaluation
Advisor Tools
• Platforms that manage course and degree equivalency between institutions to help students maximize credit transfer and minimize time to degree completion
• Tools give students access to degree requirements, articulation agreements, and transfer planning and support
Academic Student Services
• Products and services that provide students with academic support, including online tutoring services

22DRIVING TOWARD A DEGREE PART 2: SUPPLIER LANDSCAPE
PRODUCT CATEGORY
WORKFLOW CATEGORY DESCRIPTION
Aid, Benefits & Wellness
Student Services
• Platforms, tools, or apps that connect students to non-academic resources, such as financial aid, health and wellness support, and other benefits
Life Skills/Mentoring
Student Services
• Personalized student support services that provide non-academic coaching (e.g., executive functioning assistance, relationship counseling, financial aid, mental health counseling, and work study)
• Facilitation of relationships with professionals or alumni who provide guidance on long-term planning; guidance may be general or specific to a career path of choice
Classroom Engagement
Faculty Tools
• Student response systems designed to engage students before, during, and after class (e.g., classroom attendance, quizzes, polls)
Teaching Success
Faculty Tools
• Faculty information systems that collect faculty data (i.e., faculty teaching, research, and service) to assist administrators and department chairs with accreditation, compliance, and custom institutional reporting
• Personalized professional development for faculty
• Implementation of evidence-based instructional practices to improve student success

23DRIVING TOWARD A DEGREE PART 2: SUPPLIER LANDSCAPE
EXHIBIT C: MARKET SIZE METHODOLOGYFigure 2.12
CATEGORY DESCRIPTION
Commercial Spend
• Commercial spend is the amount institutions spend on third-party student supports technologies. Using publicly available pricing data and data from our survey, we calculated the rates of limited and widespread technology adoption for institutions based on their student enrollment numbers, as well as the dollar values of those adoptions.
In-House Technology
• We estimated the amount institutions spend on in-house development of advising technology (i.e., in-house technology) using data from our survey. Respondents indicated whether they use technology developed in-house, and we multiplied those rates of in-house adoption by average spend on student supports technology per institution.
Resources • Integrated Postsecondary Education Data System (IPEDS)/National Center for Education Statistics (NCES)
• Tyton Partners’ 2018 Driving Toward a Degree Primary Research Survey
• Various publicly available price quotations from institutions and suppliers