the evolutionary ecology of · 2016. 5. 26. · 102 104 106 109 109 109 111 115 115 116 121 123 123...
TRANSCRIPT

THE EVOLUTIONARY ECOLOGY OF
FESTUCA NOVAE-ZELANDIAE
IN MID-CANTERBURY, NEW ZEALAND.
A thesis
submitted in fulfilment of the requirements
for the degree of
Doctor of Philosophy
in
Botany
JANICE M. LORD -;::
University of Canterbury
1992

c'¥ r< 405
. (TIlt
LoG, ! '1 Cj
September, 1857 -
nA few miles from Christchurch ... a great plain of tussock grass
spreads out till it is lost in the south in blue haze, but is bounded,
westwards at a great distance, by the Southern Alps. Ones first
impression is that of strange loneliness, unlike the solitude of the
mountain country. Not a companionable rock or tree, or even a
hummock of earth, to break the monotonous expanse of yellow brown
grass; and a still silence, for there is no sound of insect or bird life, no
rustle of ground game, no trace of any wild animal ... n
H. W. Harper (1914)

Table of Contents
Abstract
1. Introduction
1.1 Evolution and the Ecology of populations
1.2 Festllca novae-zelandiae (Hack.) Cockayne
1.3 Vegetation change in the central South Island
1.3.1 Pre-human New Zealand
1.3.2 Maori settlement: 1200 BP to 1840 AD
1.3.3 European settlement
1.4 Aims
1.5 Dissertation structure
2. Study Area
2.1 Location of study area and study sites
2.2 Geomorphology
2.3 Climate
2.4 Vegetation
3. Regeneration by Seed
3.1 Introduction
3.2 Reproductive output and pre-dispersal seed fate
3.2.1 Introduction
3.2.2 Methods
3.2.3 Results
3.2.4 Discussion
3.3 Seed dispersal
3.3.1 Methods
3.3.2 Results
3.3.3 Discussion
3.4 Seed germination
3.4.1 Methods
3.4.2 Results
3.4.3 Discussion
3.5 Seedling emergence and survival
3.5.1 Methods
3.5.2 Results
3.5.3 Discussion
3.6 Summary and Discussion of Chapter 3.
Page
1
3
3
5
6
6
7
8
9
9
10
10
10
14
15
18
18
19
19
19
24
31
34
34
35
38
40
40
42
57
59
59
60
64
67

Table of Contents (continued)
4. Vegetative Growth and Regeneration
4.1 Introduction
4.2 Tiller dynamics
4.2.1 Methods
4.2.2 Results
4.2.3 Discussion
4.3 The effect of competition
4.3.1 Introduction
4.3.2 Methods
4.3.3 Results
4.3.4 Discussion
4.4 Stage-class analysis of population structure
4.4.1 Introduction
4.4.2 Methods
4.4.3 Results
4.4.4 Discussion
4.5 Clonal fragmentation
4.5.1 Introduction
4.5.2 Methods
4.5.3 Results
4.5.4 Discussion
4.6 Summary and Discussion of Chapter 4.
5. Patterns of Variation
5.1 Introduction
5.1.1 Recent evolution in Festllca llovae-zelalldiae
5.1.2 Variation in New Zealand tussock Festllca
5.2 Vegetation at sites containing tussock Festltca
5.2.1 Methods
5.2.2 Results
5.2.3 Discussion
5.3 Morphological Variation
5.3.1 Methods
5.3.2 Results
5.3.3 Discussion
Page
69
69
71
71
71
75
77
77
78
79
81
83
83
85
87
96
101
101
101
102
104
106
109
109
109
111
115
115
116
121
123
123
128
138

Table of Contents (continued)
5.4 Phenological Variation in Cultivation
5.4.1 Methods
5.4.2 Results
5.4.3 Discussion
5.5 Biochemical Variation
5.5.1 Introduction
5.5.2 Methods
5.5.3 Results
5.5.4 Discussion
5.6 Reciprocal Transplant Experiment
5.6.1 Introduction
5.6.2 Methods
5.6.3 Results
5.6.4 Discussion
5.7 Summary and Discussion of Chapter 5.
6. Synthesis and Conclusions
6.1 The biology of Festllca novae-zelandiae
6.2 Evolution within New Zealand tussock Fest/lca
6.3 The future of Festllca novae-zelandiae
6.4 Generalist and specialist strategies in long-lived,
perennial, polyploid grasses.
Acknowledgements
References
Appendices
1. The taxonomic history of F. matthewsii and F. llovae-zelandiae
2. Locations and CANU accession numbers for study sites
Page
141
141
142
144
145
145
146
151
160
163
163
164
166
171
174
176
176
180
182
183
187
188
203
203
204

List of Figures
2.1 Location of study area and study sites
2.2 Mean monthly minimum and maximum temperatures
at Cass Field Station
2.3 Monthly rainfall at Cass Field Station
3.1 Culm production over 4 years at Sugarloaf Fan
3.2 Frequency distribution of seed rain 10cm-2
3.3 Seed rain cm-2 downwind of 5 reproductive tussocks
3.4 Days to 50% germination versus seed age
3.5 Final % germination versus seed age
3.6 Germination of seeds from Bankside
3.7 Germination of seeds from Cass River
3.8 Germination of seeds from Cass Saddle 'A'
3.9 Germination of seeds from Cass Saddle 'B'
3.10 Germination of seeds from Cass Valley
3.11 Germination of seeds from Hallelujah Flat
3.12 Germination of seeds from Mt Sugarloaf
3.13 Germination of seeds from Porters Pass
3.14 Germination of seeds from Sugarloaf Fan
3.15 Seedling recruitment at Sugarloaf Fan over 30 months
3.16 Seedling survival at Sugarloaf Fan over 30 months
3.17 Seedling longevity at Sugarloaf Fan over 30 months
4.1 Tiller recruitment and mortality at Sugarloaf Fan
4.2 Frequency of tillering intervals at Sugarloaf Fan
4.3 Life-span of tillers at Sugarloaf Fan
4.4 Production of daughter tillers at Sugarloaf Fan
4.5 Stage-class distribution of Bankside tussocks
4.6 Stage-class distribution of Cass River tussocks
4.7 Stage-class distribution of Porters Pass tussocks
4.8 Stage-class distribution of Mt Sugarloaf tussocks
4.9 Stage-class distribution of Sugarloaf Fan, Hallelujah Flat and
Cass Saddle 'B' tussocks
4.10 Stage-class distribution of Cass Valley and Cass Saddle 'A' tussocks
4.11 Genetic identity of tussocks in a mapped plot at Sugarloaf Fan
5.1 Ordination of 42 sites by vegetation composition
5.2 TWINS PAN classification of 42 sites containing tussock Festuca
5.3 Ordination of 42 populations by morphology with morphological
characters superimposed
Page
11
16
16
25
36
36
43
43
44
45
46
47
48
49
50
51
52
62
62
63
73
73
74
74
93
93
94
94
95
95
103
119
120
129

List of Figures (continued)
5.4 Ordination of 42 populations by morphology with environmental variables
and axes of vegetation ordination superimposed
5.5 Frequency of scabrid individuals in popUlations at the boundary of
F. novae-zelandiae and F. matthewsii
5.6 Mean lamina scabridity in populations at the boundary of
F. novae-zelandiae and F. matthewsii
5.7 Mean culm scabridity in populations at the boundary of
F. novae-ze!andiae and F. matthewsii
5.8 Mean lamina length in popUlations at the boundary of
F. novae-zelandiae and F. matthewsii
5.9 Mean culm height in populations at the boundary of
F. novae-zelandiae and F. matthewsii
5.10 Mean lamina length of 18 populations in cultivation
5.11 Lamina scabridity of 18 populations in cultivation
5.12 Flowering phenology of 11 populations in cultivation
5.13 Relationship between true allele frequency and frequencies
estimated using a Hardy-Wienberg analogue
5.14 Ordination of 12 populations by allele frequency estimates with
environmental variables superimposed
5.15 Ordination of 12 populations by phenotype frequencies with
environmental variables superimposed
5.16 Ordination of 12 populations by morphology with phenotype
frequency axes superimposed
5.17 Ordination of 12 populations by vegetation at the sites with
phenotype frequency axes superimposed
5.18 Minimum and maximum temperatures over 12 months at reciprocal
transplant sites
Page
130
133
134
134
135
135
137
137
143
152
156
156
159
159
167

List of Tables
2,1 Details of 42 study sites
3,1 Flowering intensity among 155 tussocks at Sugarloaf Fan over 4 years
3,2 Flowering frequency among 155 tussocks at Sugarloaf Fan over 4 years
3,3 Regression coefficients for culm production in 149 tussocks at
Sugarloaf fan over 4 years
3.4 Population means for measurements of tussocks from 8 sites
3.5 Population means for % frequency of seed fate and components of
total seed predation
3,6 Up and downwind seed rain from 5 reproductive tussocks at Sugarloaf Fan
3,7 % frequency of chlorophyll deficient seedlings in 9 populations
3,8 X2 values for comparisons between probit-transformed germination
curves from 9 populations
3,9 Population and treatment means for days to 50% germination and
final % germination of seeds
3,10 Observed and expected seedling substrate frequencies
4,1 Initial and final measurements of tussocks in control and weeded
plots
4,2 Stage-class classification summary for 392 tussocks
4.3 Stage-class means for measured variables
4.4 Stage-class transition probability matrices for tussocks in
control and weeded plots
4.5 X 2 tests of stage-class frequency distribution among 9 pdpulations
5,1 Vegetation characteristics of 42 sites
5.2 Pearson coefficients for correlations between environmental variables
and an ordination of 42 sites by 146 species abundances,
5.3 Means for morphological characters of F. novae-zelandiae, high altitude
F, novae-zelandiae and F, matthewsii
5.4 Characteristics of 8 sites used to investigate clinal variation
between F, novae-zelandiae and F. l7latthewsii
5.5 Pearson coefficients for correlations between an ordination of 42
populations by morphology and specific characters, environmental variables
and axes from an ordination of 42 sites by species abundances
5,6 Regression coefficients for morphological characters on environmental
variables
5,7 Populations used for isozyme analysis
5,8 Enzymes and buffer systems used and number of loci and alleles resolved
5,9 Isozyme variation within 12 populations
5,10 Nei's diversity statistics from allele frequency estimates
Page
12
25
26
26
28
29
37
53
54
56
61
90
88
88
90
92
117
117
124
125
131
131
147
147
152
154

List of Tables (continued)
5.11 Nei's diversity statistics from phenotype frequencies
5.12 Pearson coefficients for correlations belween an ordination of 12
populations by phenotype frequency and environmental variables and ordinations
by morphology and site vegetation composition
5.13 Results from a mixed-model ANOVA on performance of reciprocally
transplanted tussocks from 4 populations
5.14 Population means for 5 measures of performance of reciprocally
transplanted tussocks from 4 populations
Page
155
157
168
169

List of Plates Page
1. F. novae-zelandiae grassland at Sugarloaf Fan 20
2. Pre-dispersal fate of F. Ilovae-zelandiae seeds and common seed predators 20
3. F. matthewsii in alpine vegetation, Arthurs Pass 113
4. 'High altitude' F. Ilovae-zelandiae, Broken River 113
Terms and Conventions
All values quoted as 000 ± 000 are mean with 95% confidence limit unless otherwise stated.
Nomenclature follows Cheeseman (1925) for indigenous grasses, Fitter et al. (1984) for adventive
grasses, Allan (1961) for indigenous pteridophytes and dicotyledonous angiosperms and Webb et al.
(1988) for adventive dicotyledonous angiosperms, with changes listed in Connor & Edgar (1987).

1
ABSTRACT
Festuca novae-zelandiae (Hack.) Cockayne is a long-lived, caesptiose grass indigneous to New
Zealand. It has expanded dramatically in range in 1000 years of human settlement. This study was
conducted to determine how generalist life-history attributes and 'adaptive' variation have enabled
this species to adjust to environmental change.
A range of aspects of the biolo!:,'Y of F. novae-zelalldiae were investigated. Reproduction in 155
individuals over four seasons was monitored. Only 17.4% of individuals flowered every year and
36.1 % did not flower at all. However, the reproductive output of the population was still relatively
consistent between years.
Reproduction of individuals and the pre-dispersal fate of seeds was compared among eight sites.
Differences existed among sites for most attributes measured. Site factors appeared to mask any
effects of tussock density on culm production. Total seed predation was positively related to density
and negatively to altitude. A flightless fly, Diplotoxa l7loorei (Diptera, Chloropidae) was found to be
the most common identifiable seed predator, accounting for up to 8% of seeds produced in some
populations.
Seed germination was compared for eight populations in laboratory trials and most seeds
germinated easily. Mean final % germination across all popUlations was 86%. Seedlings were
monitored in the field for 30 months. They commonly established on mat-vegetation, were very slow
growing (mean of 0.6 leaves yr-1) and had a half-life of 12 months.
Tillers in 26 tussocks were tagged and monitored for 30 months. Tillering was concentrated in
spring, tillers lived on average 15.2 months and the majority (64%) did not produce daughter tillers.
Tillering rate was not affected by either position within a tussock or size of the tussock.
A stage-based approach was used to investigate population structure. Stages were defined using
discriminant analysis. The discriminant function was then used to assign stages to 255 tussocks which
had been measured at the begining and end of a two year period. Transition probabilities were
calculated between stages. Transitions were distinctly non-linear and tussock size and condition could
vary widely in the space of two years in response to environmental fluctuations.
The genetic identity of mapped tussocks was investigated using isozyme electrophoresis and it was
found that clonal fragmentation did not contribute significantly to the maintenance of popUlation
densities.
Patterns of variation at different taxonomic levels were compared using three taxa: F. novae
zelandiae 5.5., a distinct high altitude form of F. Ilovae-zelandiae and a closely related species, F.
matthewsii. Vegetation composition was investigated using ordination and classification techiques.
Environmental gradients in altitude, temperature and rainfall were important in explaining observed
patterns. The vegetation composition at "high altitude" F. Ilovae-zelalldiae sites was more distinct
from that of F. Ilovae-zelalldiae 5.5. sites than the latter was from F. matthew5ii sites.
Morphological variation in the same taxa was investigated using Principal Components Analysis.
The same environmental factors were important to observed patterns of variation. Populations within

2
F. novae-zelandiae possessed some genetically-determined differentiation that related to habitat. A
narrow zone of intermediacy was found between F. Ilovae-zelalldiae s.s. and F. l7latthewsii.
Plants from populations of the three taxa were grown in cultivation. Culms of F. matthewsii
emerged four weeks prior to F. llovae-zelandiae S.S. "High altitude" F. novae-zelandiae was more
similar to F. mattlzewsii in flowering phenology.
Levels of biochemical variation in populations of all three taxa were investigated using isozyme
electrophoresis. All populations were characterised by high within-population variation and relatively
low between-population variation. The differences between the three taxa were small. Variation
among populations related to environmental factors but not to the proximity of populations.
The adaptiveness of populations to their own environment was tested using reciprocal transplants.
No 'home-site' advantage was found. All populations proved to be highly plastic in growth responses.
The findings of this study are discussed in terms of generalist versus specialist strategies in long
lived, polyploid, perennial grasses. I conclude that in environments characterised by unpredictable,
short-term fluctuations, long-lived species will show adaptation to large-scale, long-term
environmental trends only, and adopt a generalist strategy in the face of short-term fluctuations.

3
CHAPTER 1: INTRODUCTION
1.1 The Ecology of Populations and Evolution in Response to Environmental Change
Evolution occurs within the context of the demography and ecology of populations
(Harper, 1977; Sewall, 1977; Solbrig, 1980; Bradshaw, 1984; Levin, 1988). This is
because natural selection is a demographic process; the demographic characteristics of
survival and reproduction are the fitness components of population genetics (Schaal,
1985). Evolution by natural selection is the product of individual genetically-based
variation in these demographic attributes (Levin & Wilson, 1978; Solbrig, 1980;
Stebbins, 1983).
Ecology in the broad sense is concerned with the interaction between plants and
the biotic and edaphic environment. As plants are sessile organisms the local ecological
environment, that is the environment as it affects an individual's reproductive value or
contribution to population growth (Antonovics et aI., 1988) is a major selective force.
Independent of how organisms experience it, the environment is characterised
by dynamic periodic and aperiodic behaviour at all spatial and temporal scales. The
nature of an organism's response to its ecological environment, or the ability of
selective forces to bring about adaptation to the environment, is governed by a number
of factors. The most important of these are the temporal and spatial scale of
environmental heterogeneity with reference to the generation time and dispersal ability
of the organism (Bradshaw, 1965; Wiens, 1976; Lloyd, 1984; Antonovics et aI., 1988)
and the constraints imposed by genetic and life-history attributes (Grant, 1971; Levin,
1978; Levin & Wilson, 1978; Lloyd, 1980a; Levin, 1988).
The temporal scale of environmental heterogeneity with reference to the
generation time of the organism determines the ability of the organism to track changes
in the environment through genetic adjustment (Bradshaw, 1965; Antonovics et aI.,
1988; Levin, 1988). The rate of response of a population to directional selection is
inversely related to generation time (Levin, 1978).
When the direction of selection changes in a random or cyclic manner,
populations with longer generation times are less able to track the changes. Long-lived
species are more likely to be tuned to long-term environmental trends and retain a
relatively high level of genetic polymorphism among individuals (Levin, 1978). Even if
change is directional and sustained, long-lived species will still experience a lag in
genetic adjustment to the changing selective environment (Levin & Wilson, 1984).
Longevity, as an attribute of 'K'-selected species (MaCArthur, 1962) is
associated with other characteristics such as delayed maturity and low or irregular seed
output (Harper, 1977) that further limit the ability of the spec:ies to genetically track
short-term variation in the environment (Levin & Wilson, 1978). In many cases
phenotypic plasticity is more important in the response of long-lived species to changes
in their ecological environment (Bradshaw, 1965; Harper, 1977; Lloyd, 1984;

Schlichting, 1986). Phenotypic plasticity and generalist strategies rather than genetic
specialisation will also be favoured if spatial variation in the environment is coarse
grained and unpredictable (MacArthur & Levins, 1964; Wiens, 1976; Lloyd, 1984;
Levin, 1988).
4
Genetic constraints on the ability of organisms to adapt to environment change
include the organisation of the genome, the distribution and abundance of genetic
variation and the manner in which genetic variation is passed to the next generation.
Genome duplication through polyploidy can function to store genetic variation.
However it can also act to dilute the affects of gene mutations and increase the
resistance of populations to both random and directional changes. (Lewis, 1980).
A relationship has been shown between extent of geographical distribution and
breadth of ecological amplitude and the amount and organisation of genetic variation
within and between populations. Widespread species tend to have higher total genetic
variation and generalist species tend to have high within-population variation. In
addition levels of genetic variation have often been associated with the ability of a
species to invade new habitats and adapt to both spatial and temporal environmental
variation (Babbel & Selander, 1973; Bradshaw, 1984; Levin, 1986; Karron, 1987).
Change is an on-going and integral component of the ecological environment
experienced by plants however the human-induced environmental changes in the last
thousand years in New Zealand have radically altered the selective environment faced
by plant species.
Human-induced vegetation changes do not simply repeat natural processes but
create new ones. Plants that have increased in abundance after human-induced
disturbance are therefore worthy of special attention (Grubb, 1985). In light of the
short-term adaptive limitations experienced by long-lived species it is of particular
interest when a relatively long-lived, apparently 'K'-selected species has increased as a
result of human activity. This is the case with Festuca novae-zelandiae, a common New
Zealand grass which is widespread particularly in eastern South Island.
Human-induced environmental changes in New Zealand have allowed F. novae
zelandiae to dramatically expand its range. In less than 1000 years F. novae-zelandiae
has expanded from scattered populations in a forested landscape to widespread cover
throughout the drier eastern montane areas of South Island. Short tussock grassland, of
which F. llovae-zelandiae is a physiognomic dominant now occupies approximately 11%
of the New Zealand land area (Newsome, 1986).
In the remainder of this chapter I will outline that which is already known
about the ecology of F. novae-zelandiae and summarise the changes that have occurred
in New Zealand over the last 20,000 years with particular reference to grassland
vegetation.

5
1.2. Festuca novae-zelandiae (Hack.) Cockayne
Festuca novae-zelandiae is a perennial grass with rigid, tightly rolled leaves to 60 cm in height and
culms to 80 cm. It tillers intra-vaginally to produce a tightly-packed erect tussock. The taxonomic
history of F. novae-zelandiae is detailed in Appendix 1. Like many grasses F. novae-zelandiae is wind
pollinated and possesses no obvious seed dispersal mechanisms. Experimental work has shown it to
be out-crossing and virtually self-incompatible (Connor & Cook, 1955). One chromosome count has
been made for a plant from Tara Hills in Otago and it was hexaploid (2n = 6x = 42) (Beuzenberg &
Hair, 1983).
Moore (1976), in a study of the vegetation on a South Island high country station, found that
the same tussocks could be identified in photographs spanning twenty years. She estimated that the
life-span of individual tussocks could exceed 50 years. However as is usually the case with clonal
herbs, genets are potentially immortal and the concept of 'lifespan' and the question of what
constitutes an individual are problematic. These issues will be addressed in Chapter 4.
F. novae-zelandiae appears to produce culms every year (Sewell, 1947; Moore, 1976; Espie,
1987). Seed viability appears to be high and seeds germinate easily (Dunbar, 1970; D. Scott,pers.
comm.). However seedlings have been reported as rare particularly in grazed areas and clonal spread
by fragmentation has been suggested as being more important for popUlation maintenance (Sewell,
1947,1952; Moore, 1976; Espie, 1987).
F. novae-zelandiae is relatively unpalatable to stock and has a low relative growth in
comparison to pasture grasses (Scott, 1970; O'Connor, 1977). F. novae-zelandiae is tolerant of
nutrient-deficient conditions however it shows a rapid growth response with the addition of nutrients,
particularly phosphorus and nitrogen (Morrison, 1958; O'Connor, 1977; Espie, 1987). F. novae
zelandiae would appear to have the ability to respond to periodic disturbance as it occurs on young
terraces formed in braided riverbeds (Calder, 1958, 1961; Espie, 1987).
Aspects of the ecology of F. novae-zelandiae to do with its role as a component of high country
pasture and the effect of range management practices have been the most studied. The two most
detailed studies to date have been those of Sewell (1947, 1952) who investigated the effects of burning
and grazing, and Espie (1987) who investigated the edaphic ecology of F. novae-zelandiae with
glasshouse fertiliser trials and field experiments.
F. novae-zelandiae presents an interesting case history. It appears to possess attributes such as
slow growth rates and low recruitment that tend to limit the ability of species to invade new habitats
and adapt to changing conditions. Its expansion in range as a result of human interference with the
landscape is therefore remarkable.
6
13 Recent vegetation change in the central South Island
13.1 Pre-human New Zealand
Most of the existing information about New Zealand Quaternary vegetation history begins with
events during the latter part of the Otiran Glaciation from 22,000 yrs BP onward (BP = before 1950
AD). In the latter part of the Otiran Glaciation either shrubland or grassland taxa were dominant at
most sites and grasses were ubiquitous (Moar & Suggate, 1979; Moar, 1980; McGlone, 1988). Pollen
diagrams show that inland and eastern South Island in particular had the highest values for grassland
taxa of anywhere in New Zealand, with almost negligible amounts of tree pollen.
The late glacial, 14,000 to 10,000 yrs BP, began with a rapid retreat of ice from the Poulter
advance (Suggate, 1965; Suggate & Moar, 1970). Between 13,000 and 12,000 yrs BP a wave of
reafforestation took place in central areas on the west coast of the South Island. Over the rest of the
South Island, grassland gave way to denser shrubland after about 12,000 yrs BP (Moar, 1971; Moar,
1973; Moar & Suggate, 1979; McGlone & Bathgate, 1983) and a slow increase in temperatures finally
enabled forest to spread.
The late-glacial afforestation of South Island was complete by 9500 yrs BP at the latest and
from then until the arrival of humans in New Zealand most pollen spectra from lowland and montane
sites show only a trace of grass pollen. However there is evidence for the role of natural fire in
creating open areas in the pre-human landscape particularly in drought-prone regions such as
lowland Canterbury (Cox & Mead, 1963; Molloy et al., 1963; Molloy, 1977).
A considerable area of Central Otago and adjacent parts of Canterbury and Southland
experienced repeated fire 2500 to 1600 yrs BP, which progressively reduced the forest cover to shrub
and grassland (Molloy, 1969; McGlone, 1973; McGlone, 1983). On the Canterbury Plains, natural fire
appears to have contributed to the maintenance of a kanuka - podocarp forest mosaic with kanuka
also dominating on shallow, droughty soils (Cox & Mead, 1963; Molloy et al, 1963; Molloy, 1969).
However apart from central Otago, there is no evidence for large areas of lowland grassland prior to
Polynesian settlement (Molloy, 1969).
During this last period of forest domination, grassland species would have been confined to
either alpine areas or scattered habitats within a forested landscape. These latter areas would have
included rocky bluffs, river flood-plains, stream beds and other stony, well-drained sites, valley-floor
frost flats, edges of active avalanche tracks, debris fans and other areas of young soils (Cockayne,
1928; Connor, 1964; Connor & MacCrae, 1969; Molloy, 1969). Some grasses and herbs characteristic
of lowland grassland today may have colonised forest and shrubland clearings brought about by
natural disturbances (Molloy, 1969; Molloy & Ives, 1972) and occurred as understorey plants in areas
of low, open vegetation.

7
1.3.2 Maori settlement: 1200 BP to 1840 AD.
There is no firm date for the settlement of New Zealand by Polynesians, but it is
. generally agreed to have occurred sometime between 1200 and 1000 yrs BP (Davidson,
1981). Between then and the time of extensive European settlement, in the 1840's and
1850's, close to one half of the original forest cover of New Zealand was removed
(McGlone, 1983).
Molloy et a1 (1963) summarized the available charcoal and wood radiocarbon
dates from the eastern South Island and established that extensive forest throughout the
region had been destroyed by fire during the Polynesian era. There is also evidence of
large-scale soil instability (Molloy, 1969; Molloy, 1977; McGlone, 1983) indicating that
the charcoal did not come from the burning of a few trees but that fire affected entire
catchments and coastlines. Pollen spectra covering that period show the dramatic
decline in forest species such as Nothofagus and Dacrydium cupressinum with a
corresponding increase in bracken, shrubland and grassland pollen and spores
(McGlone, 1983).
The main period of deforestation appears to have been around 600 to 500 years
BP; by 400 years BP a balance had been achieved between cleared and forested land
(McGlone, 1983). Repeated burning of podocarp forest and kanuka on the Canterbury
Plains during the Polynesian era (Molloy et aI, 1963; Molloy & Ives, 1972) in
combination with periodic flood events (Cox & Mead, 1963), allowed for the expansion
of grasses on the Plains. By 300 yrs BP the podocarps that had dominated younger,
deeper soils during most of the interglacial were absent or rare. Kanuka was much
reduced and kowhai (Sophora microphylla) was common, indicating perhaps the
existence of an open shrubland-grassland community (Cox & Mead, 1963).
Most of montane and lowland Canterbury remained in grassland and
regenerating shrub land or low forest until the arrival of European settlers (Connor &
MacRae, 1969; Molloy, 1977).
In montane regions of Canterbury, the grassland that formed following forest
fires was most probably dominated by Chionochloa species with smaller light
demanding species such as Dichelachlle crinita. Elymus rectisetus. Festuca novae
zelandiae and Poa colensoi occurring as understorey plants or confined to exposed or
drought-prone situations (Cockayne, 1928; Zotov, 1938; Connor & MacRae, 1969).
Other components of these induced grasslands would have colonised relatively rapidly
from adjacent river-beds and rock outcrops or descended from alpine habitats once the
intervening forest had been removed (Cockayne, 1928; Burrows, 1960; Connor, 1964;
Connor & MacRae, 1969). F. novae-zelandiae was undoubtedly of less importance than
in present-day montane Canterbury grassland (Zotov, 1938). Although in drier parts of
eastern South Island such as the Canterbury Plains and the MacKenzie Basin there may
have been more F. novae-zelalldiae in the pre-European grassland than there is today
(Connor, 1964). However grasslands in pre-European New Zealand may not have borne

8
any great resemblance to present-day short tussock grassland. Even if F. novae
zelandiae had been a relatively dominant species, individual tussocks would have been
less obvious in an un grazed grassland with an abundance of other large clump-forming
grasses, shrubs, inter-tussock herbaceous species and fine, sward-forming grasses
(Zotov, 1938; O'Connor, 1986).
1.3.3 Early European settlement
Once settlement of New Zealand by people of European origin had begun the pastoral
occupation of open country in both islands proceeded rapidly. Organised settlement of
Canterbury began in 1850 with the arrival of the first four ships; however pastoral
farming began as early as the 1830's. By the late 1850's most of the eastern South
Island was taken up as large sheep or cattle runs (Johnson, 1969; O'Connor, 1986).
The arrival of European pastoralists with grazing mammals, exotic plants and
the deliberate policy of burning, marked a dramatic new era in the history of New
Zealand grassland. The initial eruption of domestic stock numbers (10.7 million by
1874) and a plague of rabbits, must have had an enormous impact on grassland species
because these animals were being maintained primarily by the exploitation of
indigenous grassland (O'Connor, 1986). In addition, extensive areas of lowland
Canterbury were ploughed and used for cropping (Johnson, 1969). It is therefore very
likely that by the time the Armstrongs described the vegetation of Canterbury
(J.F.Armstrong, 1870; J.F. & J.B.Armstrong, 1872; J.B.Armstrong, 1880), many
palatable indigenous species had already been severely reduced or banished from many
areas. The density and diversity of shrubs would also have been reduced by fire,
altering the whole physiognomy of lowland vegetation.
Detailed descriptions of grassland and shrubland at the time of European
settlement are scarce. However comments on the vegetation of the Canterbury Plains
and foothills give the impression of a dense tussock grassland / shrubland mosaic. For
example, Torlesse described the Plains in 1851 as being covered mainly with manuka
(this name was apparently applied to both Leptospermum scoparium and Kunzea
ericoides), Cassinia species, Discaria toumatou, fern (Pteridium esculentum), scattered
Cordyline australis, Phormium tenax, Cortadel'ia species and 'tussock' (Maling, 1958).
Charlotte Godley, in a letter dated 5th February 1851, spoke of the grass growing in
"large tufts, perhaps two feet high" and growing densely enough to obscure the ground
between them (Godley, 1957). Judging from the present-day distribution of remnant
tussocks on the Canterbury Plains these tussocks were probably Poa Gita and, to a lesser
extent, F. novae-zelandiae (pel's. obs.).
Although it was noted as early as 1857 that fire was eliminating them from
some areas (Paul, 1857), the tussocks appeared fairly resilient to the initial pastoral
onslaught. This was not the case with the shrubby component of lowland grassland. It
was apparently sufficiently reduced after twenty years of pastoral occupation that in

9
1860, Sam.uel Butler could describe the Plains as being dominated by "brown tussocks
of grass" with occasional individuals of Cordyline australis and Phormium ten ax (Jones
& Bartholomew, 1968). By 1880, pastoralisation on the Canterbury Plains had resulted
in a vegetation "remarkably poor in plants" and "very uniform in character" with
grasses predominant (Armstrong, 1880).
1.4 Aims
F. novae-zelalldiae presents an opportunity to examine the importance of generalist
strategies versus specialisations or 'adaptations' in a species response to environmental
change over both recent and geological time-scales.
The aims of this dissertation are: (1) to investigate in detail a range of aspects
of the biology of F. llovae-zelandiae; (2) examine patterns of variation in different
attributes within F. novae-zelalldiae s.l. with reference to a sibling species and (3)
using F. llovae-zelandiae as an example, combine evolutionary and ecological thinking
to address the issue of adaptation in long-lived, polyploid, perennial grasses occupying
complex, heterogeneous environments.
1.5 Dissertation Structure
The body of the dissertation will be divided into three sections, each of which has a
separate discussion. The first section deals with aspects of the regeneration of F. novae
zelandiae from seed. The second section deals with vegetative growth and regeneration
and the structure of populations and the third section deals with patterns of variation
in a range of characters at different taxonomic scales within New Zealand tussock
forming Festuca. Each section contains chapters dealing with different experiments.
Each chapter is divided into methods and results sections with a discussion of the
relevance of the specific findings of the chapter. A final section summarises and brings
together the themes from the discussions at the end of each section and draws overall
conclusions.

10
CHAPTER 2: STUDY AREA
2.1 Location of Study Area and Study Sites
This study was carried out mainly in the catchment of the Waimakariri River, South
Island, New Zealand, with additional study sites on the lower Canterbury Plains
(Bankside Scientific Reserve) and in the catchment of the Rakaia River. A total of 42
study sites was utilised in the course of the study; experiments were conducted using a
hierarchy of subsamples of these sites.
Manipulative and monitoring work for sections 3.2, 3.3, 3.5, 4.2, 4.3 and 4.5
was carried out on Sugarloaf Fan in the University of Canterbury experimental area at
the Cass Biological Field Station (Fig. 2.1). A core of eight sites in the Cass Basin and
on the Plains was used for comparative work in sections 3.2, 3.4, 4.4 and 5.5 with the
addition of other sites in the Waimakariri catchment relevant to the comparison in
question. All 42 sites were used for the work described in sections 5.2 and 5.3.
In this chapter I will outline the geomorphology, climate and broad vegetation
types that characterise the study areas. In doing so I will draw largely from volumes
edited by Knox (1969) on the natural history of Canterbury and by Burrows (l977a) on
history and science in the Cass district.
2.2 Geomorphology
Interaction and uplift at the margins of the Pacific and Indian-Australian plates has
created the backbone of South Island in the form of the Southern Alps, which run
roughly north-east to south-west down the western side of the Island (Stevens, 1980).
The study areas lie mainly among the ranges east of the Main Divide; some study sites
are on or just west of the Main Divide (Fig. 2.1, Table 2.1). Grid references to all sites
are given in Appendix 2.
The topography of the study area is characterised by ranges extending from the
Main Divide, large inland basins and high foothill ranges separating the montane zone
from the Plains. The landscape was formed mainly from the poorly structured, easily
fractured, hard sandstones and mudstones of the Torlesse terrain (Bradshaw, 1977). A
history of faulting and differential uplift, combined with the ease with which the
Torlesse rocks fracture to produce vast amounts of rock debris, has created the broad
outlines of the landscape in the study area (Soons, 1977). The detailed landforms
originate from the activity of glaciers during the Pleistocene (especially the last, Otiran
glaciation) and from post-glacial fluvial and colluvial processes.
The montane portion of the Waimakariri valley was well filled with ice during
all the early advances of the Otiran glaciation and later advances filled the upper valley
regions. A large part of the gravel apron that forms

KEY
\:.'';';;:;; riverbed lllU.Main Divide ---Highway 73
Figure 2.1: Location map of study area and study sites. See Table 2.1 for site
details.
11

12
Table 2.1: Details of study sites. Type refers to landform: 1 = terrace, 2 = fan, 3 =
debris slope, 4 = hill slope, 5 = stream channel. Tussock density is m-2 . Alt is
altitude from topographic maps. Aspect is degrees from north. Slope was read using
an Abney level. Rain is mean annual rainfall from isohyet map (Greenland, 1977) or
climate station (New Zealand Met. Service, 1982). Min and max temp are mean
annual minimum and maximum temperatures (aC ) estimated using equations in
Norton (1985).
Site Type Tussock Alt Aspect Slope Rain Min Max Density (m) (deg.) (mm) Temp Temp
ANT 2 1.19 680 42.5 1.0 2500 3.88 8.56
APS 5 1.50 880 92.5 3.7 5000 3.27 7.60
BNK 5 5.81 65 0 0 690 6.55 11.4
BRO 5 1.31 1400 110 4.2 2000 0.73 4.87
BRV 1.69 760 65 3.7 4000 3.64 8.19
CAH 4 1.25 870 130 7.7 1000 2.41 7.44
CAR 3.12 800 40 0.5 4500 3.59 7.98
CBC 2.19 830 0 0 1250 2.66 7.69
CFL 1.19 600 0 0 1250 3.71 8.09
CRY 1 0.75 640 0 0 1500 3.57 8.70
CSA 3 2.81 1340 57.5 4.0 2500 1.00 5.18
CSS 5 2.94 1240 22.5 2.5 2500 1.36 5.68
CVS 3 4.31 820 67.5 7.5 2000 2.90 7.79
DEC 9.25 940 55 0.7 6000 3.00 7.31
DIS 4.00 760 0 0 4500 3.43 8.18
GPS 3 0.44 1140 110 20 6000 2.25 6.30
GRE 2.81 740 0 0 3000 3.72 8.26
HLF 4.69 750 0 0 2250 3.27 8.20
KLO 0.62 635 0 0 2000 3.89 8.76
KRV 2.37 635 30 3 1000 3.42 8.60
LBR 0.31 720 0 0 2750 3.64 8.37
LHR 2.37 590 0 0 2500 3.90 8.99
LMR 3.62 720 0 0 2500 3.64 8.37
LYN 2 3.87 865 117 1.5 1000 2.47 7.46
MBV 10.2 880 0 0 3750 3.14 7.59
MTH 4 4.00 1120 60 4.0 1500 1.94 6.32
MTL 4 1.87 1390 10 1.2 1250 0.61 4.84
MTS 4 6.19 920 175 15.7 1250 2.55 7.31

13
Table 2.1: continued.
Site Type Tussock AIt Aspect Slope Rain Min Max Density (m) (deg.) (mm) Temp Temp
OTR 3 3.75 1120 140 12.5 6500 2.44 6.41
PEG 1 1.50 860 90 1.7 6000 3.35 7.71
PPS 4 1.06 1000 170 5.7 1000 2.06 6.78
RED 1 8.62 660 0 0 850 3.24 8.46
RIV 1 0.94 540 0 0 1500 4.01 9.22
SLF 2 8.56 670 129 5.7 1250 3.45 8.55
SVH 3 4.19 1240 80 12 3500 1.73 5.78
SVY 1 5.25 930 0 0 2500 2.77 7.31
TOR 4 7.31 880 157 2.5 1250 2.51 7.39
UBR 1 4.37 1000 25 8.2 6000 2.83 7.00
UHR 1 3.62 690 0 0 4000 3.62 8.52
WRY 3 2.62 1050 105 23 6000 2.71 6.74
WSH 4 8.56 1140 72.5 5.0 2500 1.88 6.25
WSS 4 0.62 1420 12.5 5.7 2500 0.87 4.85

14
the Canterbury Plains is constructed of glacial outwash gravel (Gage, 1969; 1977).
Glaciation has been a great influence on the landscape of the study area, but post
glacial modification of landforms, taking the form of valley-floor fill by alluvium on
the river floodplains, large alluvial fans and deep-cut valleys of tributary streams, has
also strongly influenced the topography of the study area (Soons, 1977).
Streams and rivers in the area are typical of those throughout the Southern
Alps. They are braided in character with many channels winding across extensive
gravel beds. Channels differ in size and 'permanency' and the floodplains are only fully
occupied by water during periods of high flood. They are turbulent and fast-flowing
and prone to marked fluctuations in water levels. During heavy flooding episodes they
can transport and deposit large quantities of gravel and sediment. As the current
channels of most rivers and streams of this type are not greatly separated in height
from vegetated portions of their fans, major changes in course occur periodically
causing catastrophic damage to adjacent vegetation (Calder, 1957, 1961; Burrows,
1977d; Soons, 1977).
On the slopes are deep colluvial deposits that originate from a variety of
processes, beginning with shattering of the bedrock by freeze-thaw cycles. Deposition
of the shattered material occurs after falling, sliding, slow mass movement (sometimes
water mobilized) or rapid mass movement in the form of landslides and debris flows.
Some of these deposits are stable, capped by soils and vegetation; otherwise there are
large amounts of active scree. Some screes date from a period of deforestation 500 -
800 years BP but other screes are ancient. Due to the nature of the rocks in the study
area and existence of a specialised scree flora (Burrows, 1977b), screes must have
always been a feature of these mountains (Soons, 1977). 'Freeze-thaw cycles and the
formation of needle-ice in the soil at higher altitudes also facilitate the erosion and
downslope transportation of material and hinder revegetation at higher altitudes or an
exposed areas (Soons, 1977). Debris flows occur at times during heavy westerly rainfall.
Soils in the study area are derived almost exclusively from Torlesse rocks. The
fine components (silt-sized) are mainly loessic in origin or (sand) alluvial. There is
almost always a prominent stony component and this shows little sign of weathering.
The most common soil types are upland and high-country yellow-brown earths on
hillslopes in eastern parts of the study area with podzolised yellow-brown earths and
podzo1s towards the Main Divide. Recent soils formed from alluvium characterize the
valleys floors and riverbeds (Vucetich, 1969; Cutler, 1977).
Overall, the main mountainous portion of the study area is a highly dynamic
landscape in which constant change and adjustment is a fact of life.
2.3 Climate
The climate of the study area is also characterised by changeability and variety. Due to
their latitudinal location the Southern Alps are under the influence of westerlies in the

15
winter and high pressure zones in the summer. However in reality the climate takes the
form of an almost regular procession of eastward-moving anti-cyclones with low
pressure zones and often cold fronts between them (de Lisle, 1969; Greenland, 1977).
Mountainous regions always display specific climatic characteristics. There is a
large variation in temperature with altitude, wind speeds are usually higher than in
adjacent lowland areas and high altitude areas usually receive higher solar radiation in
the absence of cloud cover. The Southern Alps strongly affect the pattern of rainfall in
the central South Island (de Lisle, 1969). Air movement is dominantly east-wards and
air flowing over the mountains is cooled quickly leading to orographic precipitation on
the western side of the Main Divide. Dry air travelling down the leeward eastern side
is warmed to form the 'nor-westers' typical of the Canterbury Plains (de Lisle, 1969;
Greenland, 1977).
As a result the area is characterised by a steep rainfall gradient from high in
the west to low in the east, which is much modified at the local scale by the effects of
the eastern ranges. The average annual rainfall at Cass is approximately 1300 mm per
year. Arthurs Pass, less than 20 km to the north-west, receives more than three times
this rainfall in a year (Greenland, 1977; New Zealand Meteorological Service, 1982).
Typically snow falls at low levels only on a few days each winter and seldom persists.
However the mountain summits are coated with snow for several months in winter and
periodically in autumn and spring.
The study area is a windy environment with average annual windspeeds at Cass
of approximately 5 m per second (Greenland, 1977). North-west winds are the most
frequent and usually the strongest winds of the Canterbury mountains and upper
Canterbury Plains (de Lisle, 1969).
The study area is characterised by wet springs and dry summers and tends to
have high summer temperatures and relatively mild winter temperatures (Fig. 2.2). This
is because the air moving on to the country from the Tasman Sea to the west is
relatively warm. The absolute maximum temperature recorded at Cass is 40 oC
(although most summers the maxima are around 30 oc) and the minimum on record is
-16 oC (Greenland, 1977).
Monthly rainfall and mean monthly minimum and maximum temperatures over
the period of this study are presented in Figs. 2.2 & 2.3. The data were recorded by
the Department of Geography at the Chilton Valley climate station at Casso
2.4 Vegetation
Prior to human settlement in New Zealand the majority of the study area below
timber-line would have been forested (Molloy et al., 1963; Molloy 1969; Molloy, 1977).
The present-day vegetation of the study area reflects changes wrought by 1000 years of
human disturbance superimposed on pre-existing vegetation patterns. Scrub, dominated
by Leptospermum scoparium and Discaria toumatou, tussock grassland, dominated by

25~----------------------__________________ ~
20
6' CJ)
al 15 rn (j)
Q. (j) 10 :s til CD a. 5 E ~
-5~d'~~~~~~~~~~~T'~~~~~~~ JAN88 JUL88 JAN89 JUL89 JAN90 JUL90 JAN91 JUL91
Month
- mean minimum -+- mean maximum
Figure 2.2: Mean monthly minimum and maximum temperatures at Chilton Valley, Cass
Experimental Area (data from Department of Geography, University of Canterbury).
350~-----------------------------------------------,
300
250
E ..s 200 c o .~
:6_ 150 '5 ~
0..
100
50
O~rrrTTT"""-rrrrr"TTTT"",,,,-rrrrrrrrT~~~~ JAN88 JUL88 JAN89 JUL89 JAN90 JUL90 JAN91 JUL91
Month
16
Figure 2.3: Monthly rainfall at Chilton Valley, Cass Experimental Area (data from Department of
Geography, University of Canterbury).

17
Chionochloa species above timberline and Festuca novae-zelandiae at lower altitudes,
and beech forest dominated by Notho/agus species are the main vegetation types within
the study area.
Western portions of the study area, within Arthurs Pass National Park, are still
relatively unmodified. East of the Main Divide, the forest is dominated by Notho/agus
species and above timberline species of Chionochloa form extensive alpine meadows. In
this part of the study area F. novae-zelandiae and other associated species of short
tussock grassland are restricted to recent or droughty river terraces and valley floor
frost flats and also occur as colonists on the edges of slips and screes (Burrows, 1977a,
1986). Some other parts of the study area such as the upper Cass Valley are also
relatively unmodified (sites CVS, CSS and CSA).
The Plains and the large intermontane basins within the study area have had a
long history of land-clearance and grazing (Burrows, 1960; Johnson, 1969; McLeod &
Burrows, 1977). Indigenous vegetation has been virtually eliminated from highly
modified areas such as the Canterbury Plains and all that remain are remnants of
vegetation in reserves and scattered individual plants along roadsides (Molloy, 1970;
Molloy, 1971; Molloy & Ives, 1972).
In modified inland areas such as the Cass basin, induced grassland composed of
both indigenous and adventive species is the dominant vegetation cover from the valley
floor to 1200 m. F. novae-zelandiae is a characteristic plant of this grassland. Other
common indigenous species include Coprosma petl'iei, Cyathodes /I'asel'i, Elymus
rectisetus, Poa colensoi and Raoulia subsericia. At lower altitudes adventive species such
as Agrostis capillaris, Anthoxanthum odol'atum, Festuca rubra and Hypochoeris radicata
are common and in places a dense turf of adventive grasses dominates the inter-tussock
spaces. The grassland around Cass is used for sheep grazing and hares are common in
the area (Burrows, 1977c).

18
CHAPTER 3: REGENERATION BY SEED
3.1 Introduction
Reproduction is an essential component of plant fitness. However reproductive success
is not determined by parental effort but rather by the number of progeny that survive
to reproductive maturity. An assessment of a species' reproductive biology should
therefore ideally include aspects of the establishment and survival of progeny.
The reproductive biology of a species is defined here as including all aspects of
regeneration by seed from flower production through to seedling establishment and
survival. This corresponds to the 'regeneration niche' of Grubb (1977).
Various types of reproductive strategies have been identified and described in
the past, for example as part of 'r' - versus 'K' -strategies (MacArthur, 1962) or the
stress-tolerator / competitor / ruderal triad of Grime (1979). However in all cases the
reproductive biology of a species represents a compromise between the benefits and
costs of all aspects of its life-history (Harper, 1977). Life-span, mortality with relation
to age, environmental heterogeneity and availability of safe seedling sites, resource
availability and patterns of predation are all factors affecting individual reproductive
success and the reproductive biology of the species.
A large proportion of perennial plants possess several different forms of
reproduction. Regeneration via both sexual and vegetative propagules (Grime, 1979;
Harper, 1977) is common among perennial grasses. The two methods can play
complementary roles; an individual can replicate vegetatively to take advantage of local
conditions and reproduce sexually to ensure that at least some progeny survive in
fluctuating conditions or new habitats (Tripathi & Harper, 1973; Sarukhan & Harper,
1974).
Species which replicate vegetatively are also potentially immortal and in a
relatively constant habitat have little need to regenerate from seed, especially as
somatic mutation can introduce additional genetic variation into a long-lived clone
(Gill, 1986). However in the face of disturbance or environmental change, sexual
reproduction can be more important to long-term population survival than vegetative
proliferation because it provides novel genetic combinations (Williams, 1975).
Sections in this chapter provide detailed information on the reproductive output
of F. novae-zelandiae and variation in effort and output between years and between
populations in different sites. The pre-dispersal fate of seeds and seed rain and
dispersal distances were investigated and quantitative estimates of seedling abundance
and survival were obtained. The reproductive biology of F. novae-zelandiae will be
compared with published information on other common perennial grasses and sedges.

19
3.2 Reproductive output and pre-dispersal seed fate
3.2.1 Introduction
Detailed studies involving F. novae-zelandiae, such as Malcolm (1925), Sewell (1947,
1952), Moore (1977) and Espie (1987) have contributed to the understanding of
reproduction this species. However, no detailed quantitative study has been made of
the reproductive output of individuals over time and in different environments.
Neither has seed production been investigated in the same detail as for the dominant
grasses of tall-tussock grassland, Chionochloa species (e.g. Mark, 1965b; White, 1979;
Kelly et al., 1992). The aim of this section is to provide detailed quantitative data on
(a) variation in the reproductive output of F. novae-zelandiae individuals at one site
between years, (b) variation in reproduction between sites and (c) variation in pre
dispersal fate of seeds between sites.
3.2.1 Methods
a) Reproductive output at Sugarloaf Fan over four years.
F. novae-zelandiae culms first emerge between October and December. Flowering
occurs ftom November to January and fruiting in February and March (Scott, 1960;
Connor, 1963). Previous years culms persist on the plant for at least a year and are
easily distinguished from even older culms by the degree of blackening and damage
that has occurred.
In October 1989, fourteen 1 x 1 m plots were randomly located along a 20 m
transect in short-tussock grassland at Sugarloaf Fan (Plate 1) (see Fig 2.1 in Chapter 2
for location of all study sites mentioned).
All 155 F. novae-zelandiae tussocks within these plots were permanently tagged
and examined to ascertain the proportion of individuals in the population that had
flowered in the 1988/89 season and the relative contribution of individuals to the total
output of culms. This was based on the presence of the previous years culms on the
plants (later observations of nearby plants indicated that few culms were lost during
the course of the first winter and could usually still be identified from the broken
stalks). The same plants were re-examined in March 1990, March 1991 and January
1992 to assess reproductive consistency over four years.
b) Reproductive output in 1989/90 at eight sites
In March 1990, 20 x 0.5 m transects were randomly located at each of eight sites:
Bankside (BNK), Cass River (CRY), Cass Saddle A (CSA), Cass Saddle B (CSS), Cass

20
Pl a tt' I: Festuca no vae - zelandiae grassl3nd ::1t Sugarl oaf F::1n . ---- ---------------------------------------------------------------------~
r---Pla tl 2: t'ed plelia lor alld 'I lsse of seed Ja t ' f ro m le f t to 11 hl. (I) }I enll p t ':lJ
\_1 IIHeln~11\ pJedated, (~) jungu~ mft'deli (..t) health\, (') slul\l'lIed
unde eloped. (8) e ternall predated, (9) Diptera I3I\a. (IO) iJIIJ/(}fO " 11]( O/(

Valley (CVS), Hallelujah Flat (HLF), Mount Sugarloaf (MTS) and Sugarloaf Fan (SLF).
Site details are tabulated in Table 2.1 and locations shown in Figure 2.1 of Chapter 2.
At each site the first twenty reproductive plants encountered along the transect
were selected, with the exception of Cass River, Mt. Sugarloaf and Sugarloaf Fan. At
Cass River and Mt. Sugarloaf there were low numbers of reproductive plants generally
and less than twenty reproductive plants (19 and 18 respectively) occurred within the
transect. At Sugarloaf Fan, 29 reproductive individuals from nine randomly selected
plots previously established to record reproductive consistency were used. This gave a
total of 166 individuals over eight sites.
For each individual, four parameters were measured in the field:
1) maximum extended green leaf length excluding culm leaves,
2) mean basal diameter measured at 1 cm above ground level using a diameter tape,
3) percentage of basal area occupied by dead material estimated by eye within 5%
classes, (hereafter referred to as % dead material)
4) number of current season's culms.
All culms were then collected for each individual and three parameters recorded
for each culm and averaged for each individual:
1) culm height from first internode,
2) number of spikelets in each panicle,
3) number of florets in intact spikelets. Only full-sized florets were counted as the
terminal floret usually had only a rudimentary palea.
Culms were collected by being plucked from the tussock, leaving the culm
leaves behind. It was not discovered until January 1992 that culms plucked in this
manner invariably broke cleanly at the first culm node. As a result measurements of
stalk length do not represent total length as the lowermost internode was lost. However
in F. novae-zelandiae, the lowermost internode tends to be short (2.3 cm on average,
see section 5.3) so the difference between measured stalk length and actual stalk length
would not be large.
c) Pre-dispersal fate of seeds
A grass 'seed' consists of the grain enclosed by two chaffy glumes - the palea and
lemma - and is technically a caryopsis. However the term 'seed' will be used here for
simplicity. Of the original sample of 166 individuals, 112 had produced at least 20
seeds. Randomly selected seeds from these individuals were opened and examined
under a stereo microscope to assess the condition of the seed (Plate 2). All seeds
produced by each individual were examined up to a maximum of 100 seeds.
Scoring categories were:
1) "healthy", meaning that the seed was full-sized, hard and pale orange to gold in
colour,
21

22
2) "shrivelled", which included only partially developed but shrivelled seeds with no
signs of predation, as well as full-length seeds which were brown-orange and wizened,
3) "undeveloped" where the ovary had not developed in size and the stigma and often
indehiscent anthers were still present,
4) "fungus infected" where the seed was infected with either an ergot-type fungus or a
mildew-type fungus,
5) and "predated" - eaten by invertebrates.
This last category was subdivided on the basis of the type of predator present within
the seed. If no predator was present but the seed contained frass or a damaged ovary or
seed, seeds were classified as either internally or externally predated depending on
whether the palea and lemma were damaged or intact.
Analysis
a) Reproduction over four years at Sugarloaf Fan
All raw data were tested for normality used the Wilk-Shapiro rankit procedure of
Statistix 3.5. If the rankit value was less than 0.95, simple transformations were
performed and the transformation giving the highest rankit value above 0.95 was used
for analysis. Variables which did not approach normality even after transformation
were analysed using non-parametric methods.
One-way analysis of variance was performed on the number of culms per
reproductive individual and per square metre at Sugarloaf Fan to test for significant
differences between years.
Individual tussocks were grouped into flowering frequency classes dependent on the
number of years they had flowered over the four years of the study. One-way analysis
of variance was used to test for relationships between flowering frequency, mean
annual culm production and morphological factors.
Linear regression was used to test for a relationship between reproductive output in
a given year, previous reproductive effort and morphological factors.
b) Reproductive output and pre-dispersal seed fate in 1989/90 at eight sites
The data on reproductive output and pre-dispersal seed fate were analysed for
between-population differences using one-way analysis of variance. Prior to analysis,
measures of basal diameter and counts of numbers of culms were log-transformed to
normalise the data. For the remaining variables the raw data approximated a normal
distribution. A least significant difference pairwise comparison of means was
performed for each variable.
The percentage values for pre-dispersal seed fates showed non-normal distributions.

23
Various transformations were tested but none sufficiently normalised the data. All
variables associated with seed fate were therefore analysed using Kruskal-Wallis non
parametric tests.
Explanatory models were developed from morphological parameters and site factors
for both total seed predation and culm production using linear regression.

24
3.2.2 Results:
a) Reproduction over four years at Sugarloaf Fan
Within the Sugarloaf Fan population the percentage of individual tussocks that
flowered in a given year varied from 29% in the 1989/90 season to 50% in the 1991/92
season. In addition culm production varied between years from a minimum of 17.1 m-2
in the 1989/90 season to a maximum of 51.3 m-2 in the 1990/91 season. However the
differences between years in the latter were not significant due to the large variance
between individuals in any given year (Table 3.1).
There was a significant difference between years in culms produced per tussock. A
test of least significance difference showed that culm production in 1990/91 was
significantly higher than in the previous two seasons but not significantly different to
culm production in the 1991/92 season (Table 3.1). Culm production was lowest in the
1989/90 season with not only the lowest mean number of culms per tussock but the
lowest maximum and fewer individuals producing more than one culm (Fig. 3.1).
Bartlett's test for equality of variance showed that variability in culm production
among individuals also differed significantly among years (X2 = 107.46, df = 3, P <
0.001).
Over a third (36%) of individuals surveyed in all four years failed to flower in any
year. Only 17% of individuals flowered in all four years (Table 3.2). One-way analysis
of variance showed that individuals that flowered more frequently also produced more
culms on average per year and were significantly taller and wider (Table 3.2). However
there was no such relationship between flowering frequency and estimated percent
dead volume.
Regression models for culm production indicated that culm production in any year
was usually positively related to production in previous years (Table 3.3). Tussock
height (maximum extended leaf length) did not contribute significantly to any of the
models. However percent dead volume was negatively related and basal diameter
positively related to culm production in 1990/91. In the model for culms produced in
1991/92 there was a negative relationship between reproductive effort in 1989/1990
and 1991/1992.
b) Reproductive output in 1989/90 at eight sites
Mean values for all morphological parameters measured and one-way Analysis of
Variance F and P values are given in Table 3.4. Despite a large amount of overlap in
the groups defined by pairwise comparison of means, the differences between sites
were significant for all parameters except diameter. The greatest range was shown by
number of culms (2.6-fold) and the least by culm height (1.46-fold).

25
Table 3.1: Flowering intensity among 155 F. novae-zelandiae tussocks at Sugarloaf
Fan over four years. Results from analysis of variance are also given. Different
superscripts indicate a significant difference between means according to LSD tests.
Season 1988/89 1989/90 1990/91 1991/92 F p<
% reproductive 37.4 29.0 42.6 50.3
mean culms m- 2 30.1 17.1 51.3 45.8 2.35 NS
mean culms tussock-l 2.72 ab 1.54 a 4.64 e 4.13 be 5.53 0.01
90
80
70
(/) 60 E :5 u 50 '0 Qj 40 .0 E :l
30 z
20
10 L,~ , .. ~
6 11 16 21 26 31 36 41 46 51 56 61 66 71 76 rank order of individuals
- 88/89 --+- 89/90 -;.;.;- 90/91 -a- 91/92
Figure 3.1: Culm production over four years at Sugarloaf Fan. Reproductive
individuals were ranked by number of culms for each of the four years.

26
Table 3.2: Flowering frequency (years flowering out of four) among 155 F. novae-zelandiae
tussocks at Sugarloaf Fan over four years. Results from analysis of variance are also given.
Different superscripts indicate a significant difference between means according to LSD tests.
Flowering frequency 0/4 1/4 2/4 3/4 4/4 F p<
% individuals 36.1 17.4 14.8 14.2 17.4
mean culms yr-l ()a 0.35a 1.9()a 7.13b 10.73c 34.97 0.001
mean height 31.9a 36.5b 41.2c 46.4d 50.7e 38.99 0.001
mean diameter 1.443 2.51a 4.71b 7.85c 10.6d 56.77 0.001
mean % dead 27 28 36 32 30 1.29 NS
Table 3.3: Regression coefficients for models explaining culm production in 149 F. novae-
zelandiae tussocks at Sugarloaf Fan in each of four years. Models were constructed stepwise using
morphological variables and previous years reproduction. E indicates that the variable was not
included in the model. '-' indicates not applicable.
Previous culm I!roduction
Season Constant Diam. % Dead 88/89 89/90 90/91 R2 p<
88/89 -1.63 0.94 E 0.44 0.001
p< 0.001
89/90 0.41 E E 0.41 0.40 0.001
p< 0.001
90/91 1.90 0.92 -0.11 0.32 0.44 0.65 0.001
p< 0.001 0.001 0.01 0.01
91/92 0.51 E E E -0.42 0.93 0.62 0.01
p< 0.01 0.001

27
Individual variation in height (maximum extended leaf length, in cm), log diameter
(cm) and %. dead material (% of basal area) jointly explained 41 % of the variation in
log number of culms (log culms = -0.26 + 0.01 [height] + 0.80 [log diameter] - 0.01 [%
dead material], N = 165, R2 = 0.41, P < 0.001).
The variation between sites in percent reproductive individuals was not significantly
explained by variation in site attributes of altitude, aspect, tussock density, and mean,
minimum and maximum temperature (the latter estimated using the regression
equations of Norton (1985». Neither did these factors significantly account for
variation among sites in mean culms per individual.
c) Pre-dispersal seed fate in 1989/90 at eight sites.
Mean values for the broad classes of seed fate are given in Table 3.5a. Analysis of
variance showed the sites to be significantly different for all variables.
The proportion of florets containing healthy seeds varied from 5% at Bankside to
49% on Mt. Sugarloaf. The most common fate of florets varied between populations. At
Bankside, predation was by far the most common category, affecting 79% of the total
number of florets examined. It was also the most common category at Hallelujah Flat,
affecting 45% of florets. Healthy seeds were the most common category at Cass River,
Cass Valley and Mt. Sugarloaf. Undeveloped seeds were most common in the Cass
Saddle 'B' and Sugarloaf Fan populations and shrivelled seeds at Cass Saddle' A'.
However in most populations no one category dominated.
In a number of predated florets, the predator was still present and in most cases was
an unidentified orange fly larva (Diptera, Chloropidae) 1 to 1.5 mm long. The only
other larvae encountered were two greenish-white Lepidoptera larvae; these were
included in the 'larva' category with the Chloropidae larvae. Unidentified black pupae
or clear pupal cases approximately 1.5 mm long were also encountered. Mature adults
of a black flightless fly, 1.5 to 2 mm long and identified (by P. M. Johns) as Diplotoxa
moorei (Diptera, Chloropidae), were occasionally found and two were discovered within
pupae very similar to those described above. Orange larvae, pupae and flies were
seldom found together and even then usually only one would be abundant (Table 3.5b;
CR V was an exception).
The only other seed predator commonly found inside florets was a shiny black
juvenile Hemipterid less than 1 mm long. Small green grasshoppers were frequently
observed on panicles in the field and may be responsible for at least a portion of the
externally predated seeds found.
Kruskal- Wallis tests were performed on the components of total predation and it
was found that the sites were significantly different in the percentage of seeds
containing Diplotoxamoorei, larvae and pupa and in percent predation by unspecified
external and internal predators.

28
Table 3.4: Means for measurements of F. novae-zelandiae tussocks in 1989/1990
season. Results from one-way ANOYA tests are given. Different superscripts
indicate a significant difference between means using LSD tests. Diameter and no.
culms were log-transformed before analysis but means are for untransformed data.
N = number of plants/culms sampled. Total = 166 plants, 1264 culms.
Pop N Height Diam. %Dead No. Culm Spikelets Florets (em) (em) mat. Culms Hgt (em) eulm- 1 spklt- 1
BNK 20/196 47.2e 6.72 17a 9.80e 29.9a 12.8e 4A9d
CRY 19/199 41.3d lOA 32be 10.5abe 38.5ed 12.1 e 3.10a
CSA 20/83 30.6a 8.80 30be 4.15a 31.3ab 8.61a 3.81be
CSS 20/219 33.3ab 8.82 25ab 10.9be 43.8e 12.4e 3.75be
CYS 20/118 39.8ed 9.22 36e 5.90abe 38.8ed 11.6be 3.93e
HLF 20/169 32Aab 5.80 35e 8.45abe 35.2be 11.5be 3A2ab
MTS 18/87 35.4be 7.13 21a 4.83a 36.1 be 9.67ab 3.61abe
SLF 29/193 46.3e 8.09 31b 6.65ab 41.5de 14.6d 4.59 d
Ratio max/min 1.51 1.79 2.14 2.62 1.46 1.70 1.48
AnovaF 17.2 0.74 4.31 2.23 8.87 7.98 12.5
p< 0.001 NS 0.001 0.05 0.001 0.001 0.001

29
Table 3.5: Population means for percent frequency of (a) broad classes of seed fate and (b)
components of total predation of F. novae-zelandiae seeds. Values are means of results from
individual plants which summed to 100%. Statistics of Kruskal-Wallis tests between populations
are given. N = number of florets sampled.
(a)
Pop N Healthy Shrivelled Undeveloped Infected Predated
BNK 1086 5.49 7.31 7.56 0.89 78.8
CRY 287 33.8 16.7 30.5 1.54 17.5
CSA 853 16.2 28.3 30.1 5.85 19.9
CSS 1608 26.2 20.2 42.7 3.67 7.42
CVS 1416 40.4 31.4 15.5 0.43 11.1
HLF 956 9.82 20.9 21.0 2.91 45.4
MTS 523 49.1 12.7 30.5 1.87 7.75
SLF 1475 17.5 12.3 43.6 1.02 26.5
Total 8204
K-W H 62.3 41.0 72.6 22.0 86.1
p< 0.001 0.001 0.001 0.01 0.001
(b)
POP N D. moorei Larva Pupa Hemipterid Internal External adults Predation Predation
BNK 1086 0 0.08 0 0.34 28.6 49.8
CRY 287 4.48 3.83 0 0 9.19 0
CSA 853 0 0.08 0 0 9.54 10.3
CSS 1608 0 3.78 0 0.38 2.48 0.78
CVS 1416 0 0.44 0 0.33 6.74 3.63
HLF 956 0 0.49 4.06 0 40.7 0.14
MTS 523 0.10 1.59 0.16 0 2.33 3.57
SLF 1475 0 6.81 0.15 0.15 5.18 14.2
Total 8204
K-W H 71.5 50.6 85.8 11.4 80.8 78.6
p< 0.001 0.001 0.001 NS 0.001 0.001

30
However there was no significant difference between sites for the percentage of seeds
containing the Hemipterid seed predator (Table 3.5b).
Variation among individuals for log total percent seeds predated was best eXplained
by variation in individual height (cm), log basal area (cm2) and mean culm length (cm)
(log predation = 1.91 + 0.02 [height] - 0.17 [log basal area] - 0.03 [mean culm height],
N = 84, R2 = 0.49, P < 0.001).
Variation among sites in log mean total percent seeds predated was best explained
by variation in altitude (m) and tussock density (tussocks m-2) (mean log predation =
1.43 - 0.001 [altitude] + 0.025 [density], N = 8, R2 = 0.72, P < 0.05).

31
3.2.3 Discussion
(a) Reproductive consistency over four years at Sugarloaf Fan
Moore (1976) noted that mature plants of F. novae-zelandiae reproduced in most years on
Molesworth Station in Marlborough, North Canterbury and it would appear that there are
reproductive plants within the Sugarloaf Fan population every year. However regular reproducers are
a minority within the population and most plants appear to reproduce either only occasionally or not
at all.
The total reproductive output of the Sugarloaf Fan population varied significantly from year to
year, not only in the proportion of individuals flowering, but also in the number of culms they
produced and the evenness of contribution to total reproductive output. The same few very fecund
individuals dominated the reproductive output of the population every year. The positive correlation
between years in the reproductive effort of individuals distinguishes F. novae-zelandiae from roasting
species such as Chionochloa pallens and C. rigida in which there is a negative relationship between
years in reproductive effort (Mark, 1965b).
Variation between years was also generally low in F. novae-zelandiae compared to other
species. The ratio of maximum to minimum values for mean culms per tussock in F. lIovae-zelandiae
from 1988 - 1991 was 3.01 whereas the ratio over the same four years for Chionochloa pallens in mid
Canterbury was 16.2 (Kelly et aZ., 1992).
The standard deviation of log ([culms tussock-I] + 1) inFo novae-zeZandiae over the four years
of the present study was 0.13, which is low compared with other long-lived monocotyledons. The
same statistic calculated for Phonnium species, ranged from 0.38 to 0.71 depending on site and
species (Brockie, 1986) and was 0.49 for Chionochloa pallens in mid-Canterbury over the same four
years as the present study (Kelly et al., 1992).
Although reproductive output in F. novae-zelandiae is relatively constant, there is still
significant variation among years. The availability of resources exerts a powerful influence on
flowering (Harper, 1977). Factors such as variation in the availability of soil nutrients or temperature
during the previous growing season may be involved in the observed variation in flowering intensity in
F. novae-zelandiae. Fertiliser has been shown to increase flowering in F. novae-zeZandiae (O'Connor,
1977). Temperature has been linked to variation between years in flowering of Chiollochloa species
(O'Connor & Powell, 1963; Mark, 1965b; Rowley, 1970; Payton & Mark, 1979). The relative
constancy in reproductive output between years in F. novae-zelandiae may simply reflect the lack of
marked climatic differences over the period this study was conducted (Figs. 2.2 & 2.3, Chapter 2).

32
(b) Variation in reproductive output between sites
The lack of relationship between both the proportion of a population reproducing and
mean culm production, and tussock density, indicates that the eight populations studied
did not occur at sufficiently high densities for negative density-dependent effects to
come into operation. Alternatively site factors could be of sufficient importance so as
to override or mask density effects (Fowler, 1988). A negative density effect on
fecundity is a well-established phenomenon among populations of annuals and short
lived perennials and has been shown to contribute to the regulation of population size
in both natural and experimentally manipulated populations (Harper, 1977; Watkinson
& Harper, 1978; Symonides, 1979; Silvertown, 1982). However if populations of F.
novae-zelandiae were sufficiently sparse to avoid competition between individual
tussocks, culm production would relate simply to individual attributes.
Variation in culm production among the 165 individuals studied was significantly
related to the size and vigour of the individuals; bigger, healthier plants produced more
culms. However not all large, apparently healthy, plants at the sites studied were
reproductive. This may be a result of single season, small-scale environmental variation
in other aspects such as soil type and nutrient status affecting the reproductive output
of individuals.
Differences between sites in percent reproductive individuals would also be due to
differences in the size and vigour of the tussock populations. However the lack of a
relationship between the fecundity of populations and environmental factors indicates
that variation among sites in the size. vigour and reproductive output of individuals, is
not so much related to large-scale environmental factors such as altitude and average
temperatures, as perhaps to short-term, small-scale variation in climatic conditions and
resource availability among sites.
(c) Pre-dispersal seed fate
Seed set in F. novae-zelandiae was highly variable between populations but overall was
still relatively low. Even in the "best" sites less than half of all florets produced healthy
seed. These values are similar to those obtained for various Chionochloa species (Kelly
et ai, 1992) but higher than values for seed set in Chionochloa rigida (Mark, 1965b).
Reasons for low seed set that are a result of the reproductive biology of the species
include pollination failure, the action of deleterious alleles within the embryo and
resource limitation on the part of the maternal parent (Lloyd, 1980b; Ayre & Whelan,
1989). Alternatively some individuals within the population may be achieving greater
fitness through acting as pollen donors rather than by producing seed (Lloyd, 1979).
Other factors extrinsic to the plant can also result in low seed set. These include
predation by animals and infection by fungi and other micro-organisms. The

33
importance of these and other factors in accounting for ovaries produced varied
between the populations of F. novae-zelandiae studied. In some cases, for example Cass
Saddle 'B' and Sugarloaf Fan, factors to do with the reproductive biology of the species
were most important in reducing the production of seeds. A large proportion of the
florets from both populations failed to develop seeds, possibly due to pollination failure
or even an untimely frost. In other cases (e.g. Bankside and Hallelujah Flat) external
factors such as predation accounted for most of the reduction in seed set.
This does not necessarily mean that pollination failure or resource limitation are not
important factors at Bankside and Hallelujah Flat. These two sites represented the
highest density stands of tussocks studied and while Bankside is the lowest altitude site
at 65 m above sea-level (Table 2.1, Chapter 2), Hallelujah Flat, at 770 m, is close to
the average altitude of the eight sites. These two sites probably suffered more seed
predation because with higher tussock densities they could support larger populations
of seed predators. The harsher environment of higher altitude sites with lower tussock
densities may limit the abundance of seed predators so that other factors appear more
important in reducing seed set.
Predation can often account for a large proportion of the seed crop in a range of
species (Collins & Uno, 1985). Predation by invertebrates may be any important factor
in the low seed set observed in some species of Chionochloa (White, 1975; Kelly et al.,
1992). However in long-lived perennials high losses to seed predators does not
necessarily have an important impact on recruitment (Andersen, 1989). This is because
recruitment is more limited by the number of 'safe' seedling sites (sensu Grubb, 1977)
and is also buffered by the presence of a seed bank in some species.
Diplotoxa moorei appears to be an important predator of F. novae-zelandiae seeds
and this study represents the first record of a food-plant for Diplotoxa moorei (P. M.
Johns, pers. com.). While the identity of the orange larvae was not experimentally
proved, the phenological separation of larvae, pupae and adult flies as well as the
similarities in size strongly suggest that these all represent the same species. Another
species in the genus, D. simi/is. has been found to be an important seed predator of
Chionochloa species (White, 1975; Kelly et al., 1992).

34
3.3 SEED DISPERSAL
3.3.1 Methods
In order to estimate seed rain density and distribution, 10 metal trays, each measuring 30 x 60 cm and
greased with standard mechanical grease were placed using random number tables in dense tussock
grassland on Sugarloaf Fan. These were left in position for four weeks during the peak of seed fall in
February 1990 then retrieved and the number of F. novae-zelandiae seeds 10 cm-2 area of each tray
recorded.
At the same time two greased trays were placed on either side of each of five tussocks along
the axis of the prevailing wind in order to investigate seed rain in the immediate vicinity of fruiting
tussocks. The trays were positioned so that the longest axis of each tray was parallel to the prevailing
wind direction; together the trays covered an area of 30 x 120 cm each side of each plant. The plants
were selected on the basis of having at least 10 flowering shoots and being relatively isolated from
other reproductive tussocks. All culms were removed from any other tussocks within 5 metres of the
five study plants. The trays were retrieved after four weeks and seed densities on the trays ascertained
at 10 cm intervals upwind and downwind from the target tussocks.
To investigate maximum distances a seed could travel, a line of eight greased trays, 4.8 m long
in total, was set up in the direction of the prevailing wind. Loose seeds were released from a height of
70 cm (representing approximate maximum culm height of tussocks at Sugarloaf Fan) at the upwind
end of the trays on a windy day. The distance to the farthest seed was measured. Observations were
also made of aerially borne plant material during periods of very strong winds.
A small study was also conducted to ascertain if F. novae-zelandiae possessed a soil seed bank.
In January 1990, six 50 cm3 soil samples were taken from the area where the trays used to assess seed
rain were later laid out. A point in the inter-tussock vegetation was selected at random and the
surface vegetation removed. The sample was taken from the top 10cm of the profile. The cores were
spread out on trays in a glasshouse and kept moist. All seedlings were removed and identified as they
emerged. The timing of sampling meant that any F. novae-zelandiae seeds found would have to be at
least one year old.

35
3.3.2 Results
Spikelets of F. novae-zelandiae shatter easily when ripe, so seeds fall over a relatively
short period of time. Only very rarely were intact spikelets found on plants in autumn
and winter and usually these florets had failed to set seed. Occasional plants were
found with filled seeds still present out of season and these plants were always growing
in very sheltered micro-habitats, indicating the role of wind in shattering spikelets.
Seed densities on the 10 randomly located trays in short-tussock grassland varied
from 0 to 17 10 cm-2 with a mean of 2.17 ± 0.47. This equates to 217 ± 47.5 seeds m-2
however the highly patchy distribution means that seeds would also occur locally at
much higher densities than this. The frequency distribution of seeds 10 cm-2 showed a
significant departure from random when tested against a Poisson distribution based on
mean seed density 10 cm-2 (X2 = 48.62, P < 0.001) (Fig. 3.2) indicating that seed rain
was spatially patchy.
The distribution and total number of seeds shed by the five individually-studied
tussocks varied greatly (Fig. 3.3) and was related to tussock size and number of culms
(Table 3.6). However seed densities were consistently greater on the downwind side of
all tussocks regardless of size. Seed rain upwind from these individuals varied from
27.8 ± 23.6 to 603 ± 269 seeds m-2 and downwind from 386 ± 266 to 4114 ± 914 seeds
m-2 (Table 3.6).
Apart from plant 3, maximum seed rain occurred immediately adjacent to the
parent plant. However, especially for the larger tussocks, a significant proportion of
seeds appeared to be dispersing further than 120 em from the parent plant.
The maximum distance seeds traveled was 3.69 metres. Mean distance travelled was
not ascertained. The daily average wind speed in Chilton Valley, near Sugarloaf Fan,
on the day maximum dispersal distances were investigated was 4.1 m sec- 1 (data from
Department of Geography, University of Canterbury). During strong north-west winds
at speeds of up to 8 m sec- 1 (pers. obs.), grass leaves and panicles were observed to
travel more than one hundred metres at a height of 10 - 15 metres above the ground.
One F. novae-zelandiae seedling germinated out of the six soil samples taken to
investigate the seed bank. This equates to 3330 seeds per cubic metre of soil or
assuming that seeds are within the top 2 em of the soil profile, 66 F. novae-zelandiae
seeds m-2.

60
50
40 >. 0 c Q)
30 ::l 0-
~ 20
10
0
,
,
"
~
, , "
~ gdL~~"""""" ... " " Ii'!
o 1 2 3 4 5 6 7 8 9 10 11 12 13 14 15 16 17 seeds per 10cm2
~ observed _ Poisson expected
Figure 3.2: Frequency distribution of F. novae-zelandiae seeds 10 cm-2 compared with expected
Poisson frequency distribution around a mean of 2.17.
0.7
0.6 C\J E 0 0.5 ill a. .£ 0.4 en c Q) '0 0.3 en '00 a. 0 0.2 ~ «l
0 0.1
0 -120 -60 40 60 80 100 120
Distance up & downwind from source (cm)
-till- plant 1 -+-- plant 2 ~ plant 3
-El- plant 4 ~ plant 5
Figure 3.3: Seed rain cm-2 downwind of 5 reproductive tussocks.
36

37
Table 3.6: Upwind and downwind seed rain within 120 cm of source and individual
characteristics of five F. novae-zelandiae tussocks at Sugarloaf Fan over a four week
period during maximum seed fall.
Plant 1 2 3 4 5
Max leaf length (cm) 71 60 67 60 54
Max culm height (cm) 88 75 85 79 61
diameter (cm) 32 11.5 7 13 5
no. of culms 90 62 100 25 10
total seeds upwind 176 96 217 13 10
total seeds downwind 1481 160 1169 279 139
seeds m-2 upwind 489 ± 264 267 ± 172 603 ± 269 36.1 ± 21.1 27.8 ± 23.6
seeds m-2 downwind 4114 ± 914 444 ± 127 3247 ± 1117775 ± 201 386 ± 266

38
3.3.3 Discussion
The dispersal phase in the life-cycle of plants is the phase of greatest mobility and
strongly influences the distribution of plants. Dispersal can enable seedlings to escape
competition with the maternal parent and if the parental habitat changes to become
unsuitable for seedling establishment dispersal enables new generations to 'find' suitable
habitats (Harper, 1977; Silvertown, 1979; Howe & Smallwood, 1982). In many cases
however dispersal is not directed and closely reflects adult distribution (Howe &
Smallwood, 1982).
Like many grasses, F. novae-zelandiae has no special adaptations to facilitate seed
dispersal. However the occurrence of F. l1ovae-zelandiae on previously forested sites
several kilometres from the nearest 'natural' grassland indicates that the species has
managed to disperse. As many of these sites have been forested for thousands of years,
regeneration from a persistent seed bank is unlikely even though low numbers of seeds
may survive from year to year in the soil. The colonisation of spatial isolated habitats
such as young river terraces further indicates that dispersal over several kilometres does
occur.
In spite of having no specific mechanisms for wind-dispersal, seeds are regularly
blown several metres in moderate winds and considerably further in very strong winds.
Strong winds have most likely played a important role in the dispersal of F. novae
zelandiae in a situation analogous to Notho/agus (Haase, 1989) where seeds have no
special adaptations to dispersal but isolated young individuals and stands occur
kilometres from the nearest seed source. The colonisation of areas made vacant by
deforestation would therefore not necessarily have occurred centimetre by centimetre
over consecutive generations but could have occurred relatively quickly. Dick (1956),
describing a site near Cass deforested by fire 60 years previously, recorded that in
some areas F. novae-zelandiae contributed 22% of total live vegetation cover and was
the dominant species.
Janzen (1984) suggested that large herbivores may be important in the dispersal of
small-seeded grassland species. During this study it was not unusual to find plants on
which all or some of the culms had been removed immediately below the panicle,
presumably by hares or sheep. However I have seen no F. l1ovae-zelandaie seeds
germinating from sheep or hare pellets. There is no way of knowing if any member of
New Zealand's extinct avifauna played a role in the dispersal of grasses, however if
ripe panicles are favoured by introduced mammals they might also have been browsed
by native animals. Takahe (Notol'1lis mantelli) have been observed to eat seed heads of
F. novae-zelandiae (C. J. Burrows, pel's. comm.) and seeds might also have lodged in
the plumage of ground birds. However, grinding in the gizzard may have destroyed any
seeds consumed by indigenous birds. Even if not, transportation in this manner would
not have played nearly as important a role as periods of strong winds.

39
The estimate of 217 ± 46.5 F. novae-zelandiae seeds m-2 in the seed rain over four
weeks is probably not far below total seed rain for this species, as the spikelets shatter
easily once seeds are mature and dispersal would therefore occur over a relatively short
space of time. This estimate of seed rain is comparable to annual values for other long
lived perennial grasses in perennial grasslands. Rabinowitz & Rapp (1980) obtained
values of 27 - 515 seeds m-2 for perennial grasses in tallgrass prairie. Spence (1990)
obtained similar values for perennial species such as Chiollochloa macra (35 - 2716
seeds m-2) C. pallens (317 - 423 seeds m- 2) and Poa colensoi (353 - 1658 seeds m-2).
Peart (1989) observed higher seed rain values for perennial grasses, e.g. 5100 - 63000
and 5800 - 82300 seeds m-2 for Anthoxanthum odoratum and Holcus lanatus
respectively, but these were from a coastal annual grassland.
F. novae-zelandiae seed rain is very patchy as a result of the patchy distribution of
reproductive tussocks, the large variation in reproductive effort among individuals and
the concentration of seeds near parent plants. Peart (I989) observed significant spatial
heterogeneity in seed rain at all spatial scales examined from centimetres to kilometres.
Likewise Spence (I990) observed significant clumping of dispersing seeds but found for
most species that seed rain was less patchy than vegetation cover. This would probably
be due to environmental heterogeneity acting to create additional patchiness at the
seedling establishment and survival stages.
Rabinowitz & Rapp (1980) found that the spatial heterogeneity of the seed rain was
determined by the spatial distribution of dispersing infructescences. However even if
adults were evenly distributed in space and contributed evenly to reproductive effort,
seed rain could still be patchy due to the leptokurtic pattern of dispersal in relation to
the maternal parent typical of all plants (Harper,. 1977; Silvertown, 1979).
Limited dispersal can strongly influence subsequent seedling interactions
(Rabinowitz & Rapp, 1980) and in the long-term can result in local genetic structuring
within an apparently continuous population. Close neighbours are likely to be related
and are also more likely to exchange pollen than distant neighbours (Levin, 1981,
1988). However this effect is much less pronounced in long-lived wind-pollinated
species and the virtual self-incompatibility of F. nOl'ae-zelandiae would further negate
any deleterious effects of limited dispersal.

40
3.4 SEED GERMINATION
3.4.1 Methods
Healthy seeds from collections from individual tussocks made in 1990 to investigate
reproductive effort among eight populations and pre-dispersal seed fate (Chapter 3.2)
were pooled by population. Seeds produced in 1990 from a population of a "high
altitude" form of F. novae-zelandiae (see section 5.1) at Porters Pass were also included
in the experiment, giving a total of nine populations.
Randomly selected seeds from each population were placed on Whatman No.1 filter
paper in petri dishes and kept moist with distiled water. For all populations the
germination experiments commenced within 10 days of seed collection. Treatments
were three temperature/light combinations - 25 oC light/IS oC dark ("warm"
treatment), 15 oC light/SoC dark ("cool" treatment) and 25 oC dark/IS oC dark ("dark"
treatment) with twelve hour alternations. Petri dishes were enclosed in black polythene
photographic bags for the "dark" treatment. Each dish contained fifty seeds with four
replicates per population for each of "warm" and "cool" and two replicates per
population for the "dark" treatment.
Germination was defined as the emergence of either radicle or plumule. Where
possible dishes were examined daily during the first flush of germination then every
three to four days until the trial was terminated. Dishes in the "dark" treatment were
examined every four to six days in order to minimise the risk of accidental exposure to
light. Due to field work commitments, dishes in the final trial of 12 month old seeds
were examined less frequently once initial germination had occurred. However, once
germination had commenced no dish was left unexamined for more than nine days at
any stage during the trials.
At each examination, germinating seeds were counted and removed from each dish
until all seeds had germinated or the remaining seeds were soft and black, a condition
taken to indicate that the seeds were no longer germinable. Seeds in the "dark"
treatment were examined under a safe light in a darkened room.
Further seeds from the original collections were stored outside in a paper bag in a
Stevensons screen and after six months seeds were randomly selected from each
population and germination tested under all three treatments in the same manner as for
fresh seeds. After twelve months storage, germination was again tested for each
population under the "warm" treatment only.
Throughout all trials a record was also kept of the frequency of chlorophyll
deficient seedlings in each population.

41
Analysis
Within-population comparisons of germination response curves under different
treatments were made using Pro bit and parallel line analysis on MLP (Ross, 1980). Five
between-treatment comparisons were made for each popUlation:
(1) The three temperature/light combinations were compared for fresh seed ("fresh" in
Table 3.9)
(2) The three temperature/light combinations were also compared for 6 month old seed
("6 month");
(3) Germination under the "warm" treatment was compared for fresh, 6 month old and
12 month old seeds;
(4) Germination under the "dark" treatment was compared for fresh and 6 month old
seeds;
(5) Germination under the "cool" treatment was compared for fresh and 6 month old
seeds.
Time taken to 50% germination (50% of initial number of seeds tested) and final
percent germination were separately tested for significant differences between
populations and treatments using two-way analysis of variance. In three cases, 50%
germination was not reached so values were extrapolated from the probit line.
The unbalanced design of the experiment did not permit separation of storage,
temperature and light effects. Instead the various combinations were treated as
categories of a single variable. Replicates were pooled to balance the design. Least
significant difference pairwise comparisons of means were also performed.
One-way analysis of variance was used to test for significant differences in the
percent frequency of chlorophyll-deficient seedlings among different aged batches of
seeds.

42
3.4.2 Results
Seeds germinated readily in all treatments and for all populations. Germination was
generally slower in the "dark" and "cool" treatments than in the "warm" treatment and
in addition fewer seeds germinated in the "dark" treatment. The minimum time
observed from wetting to the first germination of seed was six days and the maximum
was 200 days. Longer delays before germination tended to be a feature of seeds in the
"cool" and "dark" treatments rather than the "warm" treatment.
After six months storage the seeds germinated more rapidly on average in both the
"warm" and the "dark" treatments. There was no further enhancement of mean
germination response after 12 months storage (Fig. 3.4). The mean final percent of
seeds germinating also increased in the "dark" treatment after 6 months storage but
dropped off in the "warm" treatment after 12 months storage (Fig. 3.5).
The final percent of fresh seeds germinating was consistently lower for the "dark"
treatment in all populations than for the other two treatments, with the exception of
Porters Pass and Sugarloaf Fan collections (Figs. 3.13a & 3.l4a). In these two
populations germination in the dark did not differ from germination at the same
temperature with 12 hour days.
Six month old seeds from Bankside and Cass River also showed a similarly lower
final percent germination in the "dark" treatment compared with the other treatments
(Figs. 3.6b & 3.7b). However for the remaining five populations the apparent slower
response rate and lower germination of fresh seed in the dark was lost after six months
storage (e.g., Fig. 3.9b).
The frequency of chlorophyll-deficient seedlings increased across all populations
with increasing age of the seeds. Among fresh seeds an average of 0.13% of seeds were
chlorophyll-deficient. This increased to 0.68% after 6 months storage and to 2.05%
after 12 months. One-way analysis of variance showed these differences to be
significant. However, pair-wise LSD comparisons of means indicated that the
difference lay between 12 month old seeds and seeds that were fresh or 6 months old.
The frequency of chlorophyll-deficient seeds in the latter two batches was not
significantly different (Table 3.7).
No relationship was found between germination response under the "cool" treatment
and the altitude of the seed source. There was also no relationship between estimated
population size and percent viability as might be expected if inbreeding was affecting
seed set and seed vigour.
When pro bit-transformed, all within-population comparisons except Cass River
"cool" and Mt Sugarloaf "dark" showed highly significant differences in both slope and
intercept (Table 3.8). This indicates that both the rate and the timing of germination
response differed among groups of treatments within populations.
Two-way analysis of variance on mean number of days to 50% germination

z 0
~ z ~ a: w CJ <f-. a l!J
0 f0-CI)
~ 0
90
80
70
60
50
40
30
20
10 fresh 6 months old
AGE OF SEEDS
--- warm -E3- dark .......- cool
12 months old
Figure 3.4: Days to 50% germination in three treatments versus seed age for all
populations combined.
92
90
88 z 0 86 ~ z 84 ~ a: 82 w CJ <f-. 80 -' « 78 ~ u..
76
74
72 fresh 6 months old
AGE OF SEEDS
--- warm -E3- dark .......- cool
12 months old
Figure 3.5: Final % germination in three treatments versus seed age for all
populations combined.
43

44
a 100
90
80 <f. w 70 >
~ 60 :::>
50 ~ :::> 0 40 z L5 30 ~
20
10
0 1 11 21 31 41 51 61 71 81 91 101 111 121
DAY
--- warm --s- dark --....- cool
b 100
90
80 <f. w 70 >
~ 60 :::>
50 ~ :::> 0 40 z « 30 w ~
20
10
0 1 11 21 31 41 51 61 71 81 91 101 111 121
DAY
___ 6mths warm --s- 6mths dark --....- 6mths cool --- 12mths warm
Figure 3.6: Bankside germination response curves for (a) fresh seeds and (b) 6 month old and 12
month old seeds.

a 100
90
80 '#. w 70 >
~ 60 :J 50 ~ :J 0 40 z « 30 w ~
20
10
0 1 8 43 50 57 64 71 78 99
DAY
--- warm -E3- dark -lIk- cool
b 100
90
80 '#. w 70 >
~ 60 :J 50 ~ :J 0 40 z « 30 w ~
20
10
0 1 8 15 22 29 36 50 57 64 85 99
DAY
--- 6mths warm -E3- 6mths dark -lIk- 6mths cool --- 12mths warm
Figure 3.7: Cass River germination response curves for (a) fresh seeds and (b) 6
month old and 12 month old seeds.
45

46
a 100
90
80 '#-w 70 >
~ 60 :J 50 ~ :J 0 40 z « 30 w ~
20
10
0 1 16 31 46 61 76 91 106 121 136 151 166 181 196
DAY
-- warm -Er- dark -"k- cool
b 100
90
80 '#-w >
70
~ 60 :J 50 ~ :J 0 40 z « 30 w ~
20
10
0 1 31 46 61 76 91 106 121 136 151 166 181 196
DAY
__ 6mths warm -Er- 6mths dark -"k- 6mths cool -*-" 12mths warm
Figure 3.8: Cass Saddle 'A' germination response curves for (a) fresh seeds and (b) 6
month old and 12 month old seeds.

47
a 100
90
80 ~ ill 70 >
~ 60 ::J 50 ~ ::J 0 40 z « 30 ill ~
20
10
0 1 16 31 46 61 76 91 106 121 136 151 166 181 196
DAY
--- warm -El- dark ...- cool
b 100
90
80 ~ ill 70 >
~ 60 ::J
50 ~ ::J 0 40 z « 30 ill ~
20
10
0 1 16 31 46 61 76 91 106 121 136 151 166 181 196
DAY
--- 6mths warm -El- 6mths dark ...- 6mths cool ~ 12mths warm
Figure 3.9: Cass Saddle 'B' germination response curves for (a) fresh seeds and (b) 6
month old and 12 month old seeds.

a 100
90
80 '#. w >
70
~ 60 ::J
50 ~ ::J 0 40 z <t: 30 w ~
20
10
81 101 121 141 161 181 201 221 DAY
--- warm -EI- dark ....... cool
b 100
90
80 '#. w >
70
~ 60 ::J
50 ~ ::J 0 40 z <t: 30 w ~
20
10
0 1 21 41 61 81 101 121 141 161 181 201 221
DAY
--- 6mths warm -EI- 6mths dark ....... 6mths cool -- 12mths warm
Figure 3.10: Cass Valley germination response curves for (a) fresh seeds and (b) 6
month old and 12 month old seeds.
48

49
a 100
90
80 'eft. w >
70
~ 60 ::>
50 ~ ::> 0 40 z « 30 w ~
20
10
21 41 61 81 101 121 141 161 181 201 DAY
--- warm -El- dark -:>k- cool
b 100
90
80 'eft. w >
70
~ 60 ::>
50 ~ ::> 0 40 z « 30 w ~
20
10
61 81 101 121 141 161 181 201 DAY
--- 6mths warm -El- 6mths dark -:>k- 6mths cool -- 12mths warm
Figure 3.11: Hallelujah Flat germination response curves for (a) fresh seeds and (b)
6 month old and 12 month old seeds.

50
a 100
90
80 <f. w 70 >
~ 60 ::J
50 ~ ::J (J 40 z « 30 w ~
20
10
0 1 21 41 61 81 101 121 141 161 181
DAY
___ warm -E!-- dark ....,.,. cool
b 100
90
80 <f. w 70 >
~ 60 ::J
50 ~ ::J (J 40 z « 30 w ~
20
10
0 1 21 41 61 81 101 121 141 161 181
DAY
--- 6mths warm -E!-- 6mths dark ....,.,. 6mths cool --- 12mths warm
Figure 3.12: Mt Sugarloaf germination response curves for (a) fresh seeds and (b) 6
month old and 12 month old seeds.

a 100
90
80 '#. w 70 >
~ 60 ::J
50 ~ ::J () 40 z <l:: 30 w ~
20
10
81 101 121 141 161 DAY
-III- warm -E!- dark -"k-- cool
b 100
90
80 '#. w >
70
~ 60 ::J
50 ~ ::J () 40 z <l:: 30 w ~
20
10
0 1 21 41 61 81 101 121 141 161
DAY
-III- 6mths warm -E!- 6mths dark -"k-- 6mths cool ~ 12mths warm
Figure 3.13: Porters Pass germination response curves for (a) fresh seeds and (b) 6
month old and 12 month old seeds.
51

52
a 100
90
80 '#. w >
70
~ 60 :J
50 ~ :J 0 40 z <{
30 w ~
20
10
0 1 21 41 61 81 101 121 141 161 181
DAYS
--- warm -a- dark ""AIk- cool
b 100
90
80 '#. w 70 >
~ 60 :J
50 ~ :J 0 40 z <{
30 w ~
20
10
21 81 101 121 141 161 181 DAYS
___ 6mths warm -a- 6mths dark ""AIk- 6mths cool -- 12mths warm
Figure 3.14: Sugarloaf Fan germination response curves for (a) fresh seeds and (b) 6
month old and 12 month old seeds.

53
Table 3.7: Percent frequency of chlorophyll-deficient seedlings of F. novae
zelandiae in nine populations during germination trials. Result of a one-way analysis
of variance test is given. Different superscripts indicate means differed significantly
in an LSD test.
Population Fresh seeds
Bankside 0
Cass River 0
Cass Saddle 'A' 0:20
Cass Saddle 'B' 0.20
Cass Valley 0.40
Hallelujah Flat 0
Mt Sugarloaf 0
Porters Pass 0:20
Sugarloaf Fan 0:20
ANOVA:
Mean % frequency: O.13a
6 months old
1.50
1.20
0.40
0.80
0.60
0.60
0.40
0.40
0.20
0.68a
12 months old
2.00
3.00
0.50
1.50
1.00
1.50
0.50
2.50
6.00
2.05h
F p<
8.54 0.01

54
Table 3.8: Chi-squared values for tests on intercept and slope of probit lines fitted
to germination response curves. Intercept represents response timing and slope the
response rate. * indicates P < 0.05, ** P < 0.001, *** P < 0.001 and NS not
significant. See text for explanation of comparisons.
Comparison: fresh 6 month warm cool dark
Bankside
intercept 676.58*** 216.45*** 523.97*** 76.65*** 30.80***
slope 24.73*** 66.49*** 68.76*** 7.23** 77.07***
Cass River
intercept 98.20*** 872.03*** 381.27*** 327.57*** 75.12***
slope 7.64* 207.11 *** 59.81*** 3.35ns 72.18***
Cass Saddle 'A'
intercept 364.36*** 532.38*** 415.19*** 108.09*** 313.24***
slope 365.57*** 35.95*** 221.61 *** 9.56** 63.04***
Cass Saddle 'B'
intercept 965.95*** 590.86*** 420.16*** 391.14*** 227.52***
slope 112.14*** 7.44* 67.62*** 14.269*** 24.55***
Cass Valley
intercept 763.99*** 296.47*** 740.77*** 29.42*** 157.49***
slope 243.07*** 42.66*** 0.35ns 88.11*** 83.44***
Hallelujah Flat
intercept 565.97*** 529.37*** 235.72*** 435.24*** 229.56***
slope 119.51 *** 10.09** 119.76*** 25.06*** 2.55ns
Mt Sugarloaf
intercept 456.04*** 210.99*** 336.73*** 211.06*** 344.01***
slope 23.52*** 58.00*** 28.21 *** 5.49* 0.14ns
Porters Pass
intercept 166.44*** 340.62*** 966.87*** 11.09*** 335.38***
slope 129.52*** 30.59*** 55.66*** 11.45*** 33.86***
Sugarloaf Fan
intercept 279.19*** 719.63*** 774.61 *** 69.69*** 32.13***
slope 107.38*** 29.93*** 58.23*** 80.66*** 29.73***

55
indicated significant differences between populations and between treatments across
populations as well as a significant interaction between the two (Table 3.9). Differences
in days to 50% germination due to treatment differences made the largest contribution
to overall variation (38.6%).
Pairwise comparison among population means for days to 50% germination resulted
in four groups in which means did not differ significantly (Table 3.9a). The largest
group contained six populations all with mean times to 50% germination of around 20
days. Cass Saddle 'B' had the highest mean time to 50% germination at 56.1 days and
was the only population that differed significantly from all others.
Pairwise comparisons of mean time to 50% germination among treatments resulted in
three groups in which means did not differ significantly from each other (Table 3.9b).
The group of treatments with the fastest germination response consisted of "6 months
old warm", "6 months old dark" and "12 months old warm". The "fresh dark" treatment
was the only treatment to differ significantly from all others.
Analysis of variance on final percent germination likewise indicated significant
population and treatment effects and a significant interaction (Table 3.9). Differences
due to population contributed 23.3% to overall variation with between treatment
differences accounting for 17.8%.
The Porters Pass population had the highest mean percent germination at 94.6% and
Cass Saddle 'B' was the lowest at 66.7%. Pairwise comparison among population means
indicated substantial differentiation with five out of the nine populations differing
significantly from all others (Table 3.9a).
Pairwise comparisons among treatment means resulted in four groups in which
. means did not differ significantly (Table 3.9b). Final percent germination was lowest
for the "fresh dark" treatment and highest in the group containing "fresh warm", "fresh
cool", "6 months old warm" and "6 months old cool".

56
Table 3.9: (a) Population and (b) treatment means for days to 50% germination and
final % germination for F. novae-zelandiae seeds. Treatment categories are
combinations of storage and temperature/light treatments. Results of two-way
analysis of variance tests are also given. Different superscipts indicate a significant
difference between means using LSD tests.
(a)
Population
Bankside
Cass River
Cass Saddle 'A'
Cass Saddle 'B'
Cass Valley
Hallelujah Flat
Mt Sugarloaf
Porters Pass
Sugarloaf Fan
(b)
Treatment
Fresh Warm
Fresh Cool
Fresh Dark
6 months old Warm
6 months old Cool
6 months old Dark
12 months old Warm
ANOV A: source
Population
Treatment
Pop x Treatment
Days to 50% Final %
45.6 cd 74.1 b
35.7 be 82.4 c
27.6 ab 88.6 de
56.1 d 66.7 a
23.9 ab 90.8 def
21.0 a 94.2 ef
21.4 a 92.8 def
17.2 a 94.6 f
18.6 a 88.1 d
Days to 50% Final %
25.4 b 91.8 d
23.9 b 91.5 d
84.9 c 72.3 a
10.6 a 91.0 d
26.6 b 89.1 cd
15.2 ab 85.9 c
21.1 ab 79.0 b
F P < F P <
8.67 0.001 23.3 0.001
38.6 0.001 17.8 0.001
4.72 0.001 2.81 0.001

57
3.4.3 Discussion
Most F. llovae-zelalldiae seeds germinate readily however some seeds exhibited delayed
germination. Delayed germination was more a feature of seeds in the "cool" and "dark"
treatments indicating that F. llovae-zelalldiae was polymorphic for germination
response in less than ideal conditions.
An overall slower germination response of fresh seed at lower temperatures was
observed in four populations: Bankside, Cass Saddle' A', Hallelujah Flat and Sugarloaf
Fan (Figs. 3.6a, 3.8a, 3.11a and 3.14a). This would be a direct result of the effect of
temperature on metabolic rates. However the remaining populations showed little
reduction in the germination rate of fresh seeds with lower temperature.
The slightly faster germination response observed in six month old seed could be
due to fresh seeds not being fully mature when they were collected, as seeds for this
experiment were collected while they were still on the panicle. A similarly enhanced
germination rate with storage has also been observed for Deschampsia caespitosa
(Davy, 1980).
Darkness appeared to have an inhibitory effect on the germination of fresh seeds. In
Deschampsia caespitosa germination was also depressed by darkness and complete
inhibition was produced by a combinations of darkness and constant temperature
(Thompson et al .. 1977; Davy, 1980). Temporary dark inhibition could be advantageous
if the reduction in parental fitness of seeds germinating in an unsuitable site (e.g.
under dense vegetation) was with time outweighed by cost of seeds not germinating at
all. Alternatively dark inhibition which lessened with increasing temperature
fluctuations could provide a mechanism by which seeds in the soil could respond to the
creation of a vegetation gap (Thompson et al.. 1977) although for this mechanism to
operate seeds need to be able to remain viable in the soil.
The high values for percent viability found in this study conform with Dunbar's
(1970) report of 95% germination during laboratory trials. However Dunbar gave no
indication of the conditions under which the germination trial was conducted. Scott
(pel's. comm.) found that 17% and 57% of healthy F. llovae-zelandiae seeds germinated
after 14 and 40 days respectively under an 18/25 oC temperature regime. This is lower
than the result from this study which found an average across the 9 populations of 27.4
± 8.93% germination after 14 days and 73.7 ± 8.94% after 40 days at 15/25 oC.
After 12 months storage in a Stevensons screen, seeds still showed high percent
germination. They can probably then maintain viability for longer periods under
artificial conditions, despite a gradual accumulation of mutations as evidenced by the
increase in chlorophyll-deficient seeds. However this result cannot be taken to indicate
that seeds survive for long periods in the field.
The significant interaction between populations and treatments in the analysis of
variance tests indicates that the populations tested responded differently to germination

58
conditions. However there seem to be no clear trends in response patterns with
reference to site factors such as temperature, altitude or rainfall. It would appear then
that clearly differentiated adaptation to different environments by means of
germination response has not occurred among the populations tested.
However the apparent polymorphism in populations for germination response under
less favourable conditions may represent a bet-hedging strategy. It could be that a cool
autumn triggers dormancy in some seeds which then germinate in spring. In chapter 3.5
a few seedlings were observed to emerge in spring. The majority of seeds which
germinate immediately would presumably have the advantage of a wet season in which
to become established but also risk being damaged or dislodged by early frost and
needle ice.

59
3.5 SEEDLING EMERGENCE AND SURVIVAL
3.5.1 Methods
Two sites on Sugarloaf Fan, differing in altitude and vegetation cover, were selected
for a seedling monitoring experiment. The lower site, 650 m in altitude, was an area of
sparse open vegetation with abundant mats of Coprosma petriei and Raoulia subsericia.
The upper site, 850 m in altitude, was more densely vegetated with abundant Poa
colensoi. Twenty 50 em x 50 em plots were located at random intervals along a transect
laid out at each site. Mean tussock density at each site was obtained by averaging
tussock density in 20 contiguous 1 m x 1 m quadrats laid out along either side of the
transect on which the seedling plots were located.
Each plot was searched thoroughly in May 1989 and all seedlings of F. novae
zelandiae were mapped and tagged with coloured plastic-coated paper-clips, and the
number of leaves on each seedling recorded. Although these first seedlings will
subsequently be referred to as the 1989 cohort they most likely represent several
cohorts and only a minimum age can be assigned to them.
Seedlings were identified by leaf, sheath and ligule characters and confirmed by
caryopsis characters for seedlings where the caryopsis was still attached and visible.
The seedlings were censused for both growth and survival every three months from
May 1989 to November 1991. Census months - February, May, August and November
- were selected to coincide with transitions between seasons. At each census the plots
were again searched and new seedlings tagged and mapped as they were encountered.
The substrate of each seedling was recorded when the seedlings were first tagged.
The frequency of substrates within the vegetation was measured by systematic point
sampling along the transect on which the seedling plots were located. A needle was
lowered into the vegetation at 25 em and 50 cm distances from the transect on each
side at 1 m intervals and the type of substrate encountered was recorded (see Table
3.10 for substrate types).
The frequency of seedling establishment on substrates was compared with the
abundance of those substrates at the two sites using a Chi-squared test. One-way
analysis of variance was used to test for significant differences in tussock density,
seedling density, growth and survival between sites and differences in survival between
substrate types.

60
3.5.2 Results
Mean tussock density was 1.80 ± 0.92 m-2 at the lower site and 8.10 ± 1.16 at the upper
site. This difference between the two sites in tussock density was significant when
tested with one-way analysis of variance (F = 79.0, P < 0.001).
In total of 226 seedlings were located and monitored over the study period. Seedling
density per 50 x 50 cm plot was 4.10 ± 1.84 at the lower site and 7.25 ± 2.72 per plot
at the upper site. Seedling density did not differ significantly between the two sites
when tested with one-way analysis of variance. Average seedling density over both
sites was 22.7 ± 6.58 m-2 •
Most new seedlings were located at the May census of each year meaning that
seedling emergence was predominantly an autumn phenomenon (Fig 3.15). For the 1990
and 1991 cohorts 75.8% and 92.8% of recruits were located at the May census. Further
recruits were tagged at the August and November censuses; however their contribution
to overall recruitment was minor.
The majority of seedlings found occurred on mats of Coprosma petriei, around flat
weeds such as Senecio bellidioides and Hypochoeris radicata or at the base of tussocks.
A chi-squared test revealed that seedling establishment was non-random with reference
to substrate type (Table 3.10). The frequency of establishment on different substrates
also differed significantly between sites (X2 = 31.9, dj ~ 10, P < 0.001). At the lower
site, more seedlings than expected established around flatweeds and tussocks and fewer
than expected established in areas of moss (usually Racomitrium lanuginosum). At the
upper site seedlings established preferentially on Coprosma mats and were far less
frequent than expected in areas of dense grass. No significant difference was found in
seedling survival among the different substrate types when tested with one-way
analysis of variance.
Seedlings were commonly very slow growing with an average net increase of 0.61 ±
0.07 leaves per year. Only three seedlings grew to the two-tiller stage and the largest of
these had 10 leaves and was 7 cm high after at least 33 months growth.
Mortality was high and continued to occur even in the oldest cohort throughout the
study period (Fig. 3.16). Seedlings were most at risk during the first few months of
life; 47.8% of all seedlings died within nine months of first being located (Fig. 3.17).
At the lower site seedlings survived on average 12.3 ± 1.77 months and at the upper
site mean survival was 11.6 ± 1.28 months. There was no significant difference between
survival at the two sites. The half-life of the group of seedlings tagged 1989, averaged
across both sites, was 11 months, however these seedlings probably represented cohorts
from more than one year. The cohort that germinated in 1990 had a half-life of 12
months.
Burrowing or feeding activity by ground invertebrates was the most common
identifiable cause of death, accounting for 11 % of total mortality. Other identified

61
Table 3.10: Observed seedling substrate frequencies (%) and expected frequencies
based on point-sampling. Values from Chi-squared tests for goodness-of -fit are also
given.
Substrate Freq. at lower site Freq. at upper site Observed Expected Observed Expected
Coprosma 23.0 24.4 48.5 8.88
Coprosma/ grass 23.0 17.7 16.1 17.7
Coprosma/moss 3.84 17.7 8.82 0
Coprosma/Raoulia 1.92 4.44 0 2.22
Raoulia 0.96 0 2.94 2.22
Raoulia/ grass 0.96 0 0 0
Raoulia/moss 0 6.66 1.47 0
moss 3.84 0 0 0
grass 4.80 4.44 7.35 33.3
moss/grass 2.88 8.88 2.94 6.66
flatweeds 21.1 6.66 7.35 4.44
tussock base 13.4 0 4.41 24.4
shrub base 0 6.66 0 0
rock base 0 2.22 0 0
X2 54.5 73.6
p< 0.001 0.001

62
100
90
~ 80
(J) 70 .~ iii "5 60 E ::J
50 .s-c
40 (J)
E '5 30 0 ~ 20
10
0 M89 A89 N89 F90 M90 A90 N90 F91 M91 A91 N91
month of census
--- 1989 cohort -El-- 1990 cohort -,k- 1991 cohort
Figure 3.15: Cumulative seedling recruitment at Sugarloaf Fan over 30 months.
100
90
80
70 rn c
60 :~ ~ ::J 50 (/)
<fl. 40
30
20
10 M89 A89 N89 F90 M90 A90 N90 F91 M91 A91 N91
month of census
___ 1989 cohort -El-- 1990 cohort -,k- 1991 cohort
Figure 3.16: Survival of seedling cohorts at Sugarloaf Fan over 30 months.

.c 1ii 1 (])
"0
'0 ~ If) ·c <f.
0-3 3-6 6-9 9-12 12-15 15-18 18-21 21-24 24-27 27-30 age (months)
Figure 3.17: Risk of death compared with seedling age for F. novae-zelandiae
seedlings at Sugarloaf Fan.
63

causes of death were browsing (probably by grasshoppers) (3.2%), failure to root due to the seed
germinating while suspended in moist vegetation (1.1%) and frost heave (0.9%). However for the
vast majority (84%) of deaths, cause of death was not identified.
Mortality due to unknown causes showed no significant seasonal pattern when all seedling
cohorts were considered (Xl = 3.83, df = 3, P > 0.05). However the rate of cumulative percent
increase in deaths was higher over the period August 1990 to February 1991 among seedlings that
emerged in 1990 than among seedlings from the 1989 cohort (Fig. 3.16).
3.5.3 Discussion
64
The seedling densities recorded in this study are in keeping with results from other long-lived grasses
and sedges in relatively unmodified grassland. Erioph01um vaginatum, a caespitose sedge of tundra
vegetation was found to have 55.1 ±. 6.4 (S.E.) seedlings m-2 in 'closed' vegetation (McGraw &
Shaver, 1982). Rose & Platt (1990) found that seedling densities of Chionochloa pallens ranged from
0.6 to 96 m-2 depending on the availability of suitable microsites. In a study of Californian coastal
grassland, Peart (1989) found that seedling densities for three perennial bunchgrasses,Anthoxanthum
odoratum, Deschampsia holciformis and Holcus lanatlls, ranged from 1.8 ±.1.8 (S.E.) to 40.9 .±.19.9
(S.E.) depending on species and patch type.
Williams (1970) found considerably lower seedling densities of 0.19 seedlings m-2 for Chloris
acicularis, a tussock grass in semi-arid Australian grassland. However the community under study was
severely degraded as a result of heavy grazing. However, a short-lived opportunist grass in the same
community, Danthonia caespitosa, had seedling densities of 2.66 - 205 m-2.
Autumn seedling emergence is a common feature of grasses in areas where rainfall occurs
mainly during the cool season (Grime, 1979) as is the case in this study area. Lack of innate
dormancy allows for germination at the beginning of the moistest part of the year. As a result,
seedlings have a greater chance of becoming established before the onset of water limitations the
following summer.
Sewell (1947, 1952) recorded that F. novae-zelandiae seedlings only established in litter around
tussock bases and Scott & Archie (1976) found that seedlings germinating close to a tussock suffered
relatively lower mortality during dry summer months. The present study has shown that F. novae
zelandiae seedlings also commonly establish on mats of Coprosma petrei and around flatweeds. Rose
& Platt (1990) found similar trends in seedling establishment for Chionochloa rigida. In their study
seedlings were three times more frequent on litter or mat vegetation than in rocky areas or taller
vegetation.
The differences between the two sites in seedling substrate affmity can be related to

65
factors affecting seedling establishment at each site. At the lower site the vegetation
was quite open and lack of moisture could be a major factor in germination failure and
early seedling mortality. The apparent affinity of seedlings at the lower site for tussock
bases and flatweeds could be because seeds falling on these substrates had a more
sheltered, slightly moister microclimate and were therefore successful in germinating.
At the upper site seedlings were noticeably more common on mats of Coprosma
petriei than expected and much less common in areas of dense grass. The upper site
was more densely vegetated than the lower site and casual observation suggested that
soil moisture tended to be higher. The observed pattern of substrate affinity at the
upper site could indicate that, rather than moisture stress, other factors such as light
availability were affecting the establishment of seedlings. The close dependence of
seedling establishment and survival on substrate and vegetation type means that
previously published statements about F. novae-zelandiae seedling establishment must
be referred back to the local environment in which the studies were conducted.
Site attributes probably affect recruitment in different ways at different stages from
germination to maturation. Dunbar (1970) found that the emergence and density of F.
novae-zelandiae seedlings was inversely related to vegetation density but the survival of
established seedlings was positively related. In the present study the different mortality
rates of the 1989 and 1990 cohorts during spring and early summer 1990, indicated by
the differing slopes of the two survival curves over that time period (Fig. 3.16) would
certainly suggest this.
Seedlings of F. novae-zelandiae have previously been reported as uncommon or
entirely absent in short-tussock grassland (Boyce, 1939; Sewell, 1947; Moore, 1976;
Espie, 1987). However as F. novae-zelandiae seedlings seldom survive beyond the one
tiller stage they are readily overlooked. The results of this study indicate that F. novae
zelandiae seedlings can be relatively abundant on certain substrate types.
Although the two sites studied differed significantly in tussock density and
therefore probably also in seed rain, there was no difference between them in seedling
density. This would indicate that seedling densities are limited not by lack of seeds but
by lack of suitable substrate. This appears to be a feature of stable populations of
long-lived perennials, where in most years recruitment is limited by the number of
safe sites rather than by seed production or losses to seed predators (Andersen, 1989).
Spatial heterogeneity and the availability of suitable microsites has been shown
repeatedly to be a major factor in seedling survival (Harper et al., 1965; Harper, 1977).
For example, McGraw & Shaver (1982) found that seedling densities of species in
Alaskan tundra varied greatly depending on substrate availability and Reader (1991)
found that emergence of seedlings in an abandoned pasture was greatly influenced by
microtopography and its effect on ground cover.
The low growth rates measured for seedlings in the present study confirm
observations made by Moore (1976) on a South Island high country station. She found

66
that seedlings could remain only a few centimetres tall with one or two tillers for at least seven years.
However she also observed that seedlings in sheltered, moist microsites could reach half the height of
mature plants in three years and form thick tussocks in five years.
Due to the limited time available for this study, the data are inadequate to ascertain the
proportion of seedlings that survive to become juvenile tussocks on Sugarloaf Fan (see chapter 4.4 for
definition of a juvenile). Survival to maturity rather than seedling establishment would appear to be
the crucial stage for the maintenance of F. novae-zelandiae populations by regeneration from seed.
Recruitment rates are only valid when viewed in the context of the adult life-span (McGraw &
Shaver, 1982). In a long-lived plant, even high levels of mortality among seedlings do not necessarily
signify regeneration failure (Mark, 1965b). In fact high seedling mortality is common among long
lived iteroparous herbs (Harper, 1977; Davy, 1980; Symonides, 1985). Even very low levels of seedling
recruitment to the adult population can adequately maintain population density of a very long-lived
species (Mark, 1965b).
The rates of F. novae-zelandiae seedling mortality observed in the present study are higher
than those observed for Chionochloa rigida by Mark (1965b). In the present study 18% of the
seedlings initially tagged in 1989 were still alive after 30 months, whereas in Mark (1965b) seedling
numbers were reduced by approximately half after 36 months. Mortality due to seedlings being
dislodged by frost heave was not as important in this study as in Mark (1965b), presumably due to the
lower altitude and higher vegetation cover at the present study site. Mark's seedling study was
conducted at 1220 m in grassland that had been burnt eight months previously.
With low recruitment and replacement, many adult populations particularly on disturbed sites
could well be dominated by one or two pioneering cohorts. The substrates apparently favoured by F.
novae-zelandiae seedlings in closed grassland, such as mats of vegetation, are a feature of the early
colonisation of river terraces or slips in the montane and alpine zones (Calder, 1958, 1961). In a
situation analogous to Eriophornm vaginatum (McGraw & Shaver, 1982) seedling recruitment in F.
novae-zelandiae may assume special importance in relation to the invasion of new habitats and the
peripheral spread of populations after disturbance rather than being important in population
turnover in "closed" grassland.

67
3.6 SUMMARY AND DISCUSSION OF CHAPTER 3.
F. novae-zelandiae is not a mast-seeder in the sense of Silvertown (1980) which distinguishes it from
the physiognomic dominants of tall-tussock grassland, Chionochloa species (Mark, 1965b; Kelly et al.,
1992). However individuals that flowered every year were in the minority (17.4%) in the population
studied from 1988 to 1992 at Casso The most fecund individuals were generally large tussocks. Over
one third (36.1%) of plants monitored over that time period produced no culms at all and the
remainder reproduced intermittently. Nonreproductive individuals were usually small.
Reproductive output in a given year was usually positively related to output in the previous two
years. Plants were showing short-term consistency in their contribution to total reproduction which
reflected their overall size and vigour. The Sugarloaf Fan population showed a typical L-shaped
distribution of fecundity (Levin & Wilson, 1978) (Fig. 3.1) that results in a few individuals dominating
the reproductive output of a population. Due to the correlation in reproduction between years, these
same individuals would be contributing a proportionally large number of seeds to the seed rain over
several years.
This uneven contribution to the next generation has important genetic implications. If the few
very fecund individuals are successful due to the possession of favoured heritable traits then the
response of the population to selection will be accelerated relative to a situation where reproductive
contribution was more evenly spread among individuals (Levin & Wilson, 1978). However if uneven
reproduction output among individuals was largely due to spatial environmental heterogeneity than
the genetic effects with regard to the population's genepool would be less significant.
When reproduction in several populations of F. novae-zelandiae was compared, a significant
amount of between-population variation in reproductive effort at all levels from the number of culms
per tussock to florets per spikelet and total seed set was found. However, overall the reproductive
output of F. novae-zelandiae is characterised by relatively constancy perhaps due to conservative
responses to yearly changes in resource availability. The lack of a density effect on culm production
does not rule out the importance of density-dependant processes. However it does perhaps indicate
that tussocks usually occur at densities low enough to avoid inter-plant interference and that sites
factors may commonly be more important to reproduction.
Pre-dispersal fates of seeds varied between populations with invertebrate predation affecting
nearly 80% of florets at the lowest altitude site but only 7.4% at one of the higher altitude sites. In
other populations, factors such as failure of seeds to develop or embryo abortion accounted for the
majority of lost ovaries. The most common identifiable predator was a flightless Chloropid fly
Diplotoxa moorei.
Although F. novae-zelandiae has no specialised mechanisms for seed dispersal, seeds were
found to be dispersed over several metres in normal strong winds and

68
considerably further in gale-force winds. However seed rain was significantly patchy with most seeds
falling adjacent to the parent plant. The estimate of 217 ± 46.5 seeds per m2 for F. novae-zelandiae is
comparable to other long-lived perennial grasses.
The majority of F. novae-zelandiae seeds germinated regardless of temperature and light
conditions however some seeds in the "cool" and "dark" treatments exhibited a delay in germination of
up to 200 days. A slight inhibitory effect on the overall germination rate of seeds at the cooler
temperature treatment were observed for most populations. Also a overall lower germination rate
and final percent germination was observed for some populations when seeds were germinated in the
dark. Seeds showed an enhanced germination response in all treatments after six months storage.
There seemed to be no clear trends in the pattern of germination with respect to treatment and the
environment of the sites from which the seeds originated.
Mean seedling density at Cass was found to be 22.7 ± 6.6 per m2 which is comparable with
values from other long-lived grasses and sedges. When compared with the values recorded for seed
rain this represents an 83% to 94% mortality among seeds in the soil.
Seedling emergence was concentrated in autumn and seedling densities were non-randomly
associated with vegetation types; around flatweeds, the bases of large tussocks and mats of Coprosma
petriei being 'preferred' substrates. The observed differences between the two areas studied in
seedling substrate affinity were possibly due to differences between the areas in microclimate.
Seedlings grew by an average of 0.61 ± 0.07 leaves per year and the half-life of the longest studied
single-year cohort was 12 months.
The reproductive strategy of F. novae-zelandiae conforms with that of many of the commonest
perennial grasses of temperate grassland, e.g. Bromus erectus, Dactylis glomerata, Festllca pratensis
andF. rubra, in regions where rainfall is restricted mainly to the cool season (Grime, 1979). Species
of this type are characterised by relatively large seeds with no innate dormancy and the absence of a
sizeable seed bank (Grime, 1979; Thompson & Grime, 1979). Germination and seedling emergence
is concentrated in the autumn when the surrounding vegetation is at its sparsest after the typically dry
summer. In contrast, autumn germination was rare in a moist tall grassland that lacked the same
seasonal fluctuations in moisture availability (Masuda & Washitani, 1990).

CHAPTER 4: STRUCTURE AND DYNAMICS WITHIN INDIVIDUALS AND
POPULATIONS
4.1 INTRODUCTION
69
Tussock-forming grasses are very simple in construction, essentially being composed of
many functionally equivalent tiller modules. Each plant can be regarded as a population
of modules derived, originally from one parent plant (White, 1979), which interact
within the clone in both a positive and a negative manner. Because of this architecture,
the population structure and dynamics of tussocks must be studied at both the within
clone and within-population levels.
A study of within-clone population dynamics is the key to understanding individual
growth and regeneration. This is because in a tillering grass the tiller is the
fundamental ecological unit (White, 1979). For the genet as a whole to grow, the
individual tillers must reproduce vegetatively and for the genet to die, the whole
population of tillers must die.
In the study of structure and dynamics at the level of the population, herbaceous
perennials with a modular architecture present the researcher with two important
problems. One is the definition of an individual; does the genet or the functionally
independent ramet constitute the individual to be studied? The other is the difficulty
involved in aging individuals.
In species of modular construction where the modules are equivalent, potentially
independent units it is largely impossible to count the number of genetic individuals in
a population (Harper, 1978). In F. novae-zelandiae, individual tussocks may be only
portions of a larger fragmented genetic individual (genet) or may be composed of more
than one genet. A more precise approach to the population biology of such plants is to
study modules rather than genets (Harper, 1978; White, 1979). However it is difficult
to extrapolate from this type of data to the dynamics of genets and populations and
ultimately the explanation of evolutionary phenomena must lie in studies at the level of
genets (Harper, 1978).
The approach taken in the definition of individuals throughout the present study is
much less rigid than that taken by Espie (I987). Espie defined elongated groups of
tillers as representing two genetic individuals unless an external factor such as the
proximity of a rock or shrub could have influenced the growth pattern. He regarded
quasi-circular groups of small tillers as individual small tussocks unless connections of
dead material between them indicated that they represented the remnants of a
senescent tussock.
In the present study structurally continuous tussocks, regardless of shape, were
treated as individuals. However groups of small tussocks were treated in a manner
similar to that described above. The margin of error between this method of defining

individuals and the true number of genetic individuals present depends on the
frequency of clonal fragmentation in populations of F. novae-zelandiae. This is
investigated in Chapter 4.5.
70
The other difficulty involved in demographic studies of long-lived clonal herbs is
that of the age of individual plants. Assessing population structure directly by aging
individuals is impossible for clonal plants that are composed of continually replaced
modules as, except in very young plants, the age of the oldest module is unlikely to at
all resemble the age of the genet (Harper, 1977). Many long-lived species display
considerable demographic and morphological plasticity and as a result size, fecundity
and mortality are not necessarily associated with strict chronological age. The inability
to age these types of plants is therefore not necessarily a problem as age would not be
particularly useful in the examination of population structure. An approach based on
the functional stage of individuals, defined by morphological, physiological or
demographic characters would provide more meaningful information on population
structure (Rabotnov, 1965; Harper, 1977; Gatsuk et al., 1980).
The aim of this section is to examine the structure and dynamics of both
populations of tillers within clones and populations of tussocks. Tussock population
structure will be examined using a stage-based approach and at the same time the
validity of this type of approach will be assessed. The effect of competition from
invasive adventive species on within-clone growth and overall population structure will
also be examined and the question of the genetic distinctiveness of spatially separate
tussocks will be addressed.

71
4.2 TILLER DYNAMICS
4.2.1 Methods
Seventy-five tillers on 26 tussocks of varying sizes on Sugarloaf Fan (see Fig. 2.1,
Chapter 2 for location) were tagged in November 1989. The tillers were selected at 2
cm intervals along a transect through the middle of each tussock in order to test for
the effect of position on growth and tillering. Ten tillers in a further five tussocks
were tagged in May 1990 in order to increase representation among tillers from small
tussocks.
The tillers were censused in February, May, August and November of 1990 and
1991 and all new tillers arising from tagged tillers were also marked and monitored.
The condition of each tiller (vegetative, flowering, dead) and the number of leaves per
tiller were recorded at each census.
One-way analysis of variance was used to investigate the effect of tiller position and
tussock size on growth and tillering rates of individual tillers.
4.2.2 Results
F. novae-zelandiae tillers are produced intra-vaginally and emerge between the sheath
of the parent tiller and the prophyll of the new tiller. The prophyll is a modified leaf
that precedes the emergence of the first true leaf. New tillers are first externally visible
when they have elongated beyond the sheath of the parent tiller. At this stage they
usually consist of one or two green leaves. Flowering is determinate so once flowering
and fruiting has finished the tiller dies.
By the end of the study period, a total of 225 tillers had been tagged and monitored.
Of these, 128 were still alive at the end of the study and 24 of these tillers were
members of the original sample. This represented an increase of 150.6% in two years.
During this time 134 new tillers were produced, 85 tillers died without flowering and 6
flowered and died.
Tillering showed very marked seasonal trends with a spring flush of new tillers
becoming visible between November and February of each year (Fig. 4.1). This
seasonal production of tillers is also reflected in the rate of tillering among established
tillers. Parent tillers produced one daughter tiller every 15.2 ± 1.63 months on average;
0.07 ± 0.01 tillers month-l. However tillers were most commonly produced at
approximately yearly or two-yearly intervals (Fig. 4.2).
Mortality also showed seasonal trends, being concentrated mainly in late winter and
spring (Fig. 4.1). Mortality was substantially higher between August and November
1991 than in the previous two years possibly due to the relatively cold winter (Fig. 2.2,
Chapter 2). The life-span of single tillers averaged 15.2 ± 1.05 months, however life-

spans of three months, one year or two years were most common (Fig. 4.3).
Daughter tillers were produced by 36.2% of all tillers tagged. Of these, over half
produced only one daughter tiller. However one tiller produced five daughter tillers
during its lifetime (Fig. 4.4). The number of daughter tillers produced per tiller and
72
the rate at which they were produced did not differ significantly between tillers
occupying different positions in a tussock or between individual tussocks or diameter
size classes. The location of a tiller in relation to the tussock edge had no significant
effect on tiller longevity when tested with one-way analysis of variance (F 4,219 = 0.53,
NS). There was also no significant difference among individual tussocks or diameter
size classes in tiller longevity (F 30 193 = 0.76, NS). , Tillers produced an average of 0.16 ± 0.01 leaves per month, which is approximately
one leaf every 6 months. There was no significant difference in growth rate between
tillers occupying different positions within a tussock (F 4,219 = 0.26, NS). However
there was a significant difference in tiller growth rates between individual tussocks
(F 30 193 = 1.54, P < 0.05). This difference was not, however, related to differences in , tussock diameter.

60
50
40 ~ ~ '';:; 30 -0
<f.
20
10
01--N'89--~F·9~0---M~9~0--~A;90~~N'9-0~~F~9~1--~M~91==~A·9~1~=N~9~1~ census months
-- tillering -E!-- deaths -.6c- flowering
Figure 4.1: Tiller recruitment and mortality of 225 tillers in 25 F. novae-zelandiae
tussocks on Sugarloaf Fan monitored over 30 months.
16
14
6
4
2
12 tillering interval (months)
Figure 4.2: Frequency of tillering interval for 225 tillers in 25 F. novae-zelandiae
tussocks on Sugarloaf Fan monitored over 30 months.
73

t>' c Q) ::J rr ~
'+-
"<f. 8
6
4
2
0 3 6 9 12 15 18 21 24 27
tiller life-span (months)
Figure 4.3: Life-span of 97 F. novae-zelandiae tillers dying during the 30 month
study period at Sugarloaf Fan.
4 5 no. daughter tillers
Figure 4.4: Daughter tiller production among 225 tillers in 25 F. novae-zelandiae
tussocks on Sugarloaf Fan monitored over 30 months.
74

75
4.2.3 Discussion
As tillers were not recorded until they were externally visible, tillering would have
been initiated some time before new tillers were observed. New F. novae-zelandiae
tillers recorded as early as November were already about 15 cm in height, so tiller
induction most probably occurred in autumn with some growth taking place before
winter. Tiller elongation is most probably triggered by increased temperatures in
spring. F. novae-zelandiae tillers appear to be able to survive for more than two years.
However most tillers in this study were replaced within two years.
Connections between tillers appear to remain intact for at least two years. However
observations of tussock structure made while transplanting and dividing tussocks
indicate that connections between tiller clumps eventually break down so that the
tussock comes to be comprised of one to many independent families of tillers.
Fetcher & Shaver (1982) found that the ratio of daughter tillers to adult tillers
decreased with increasing tussock diameter in the long-lived caespitose sedge
Eriophorum vaginatum. In Bellis perennis, a dicotyledonous herb with a tightly-packed,
'phalanx' clonal structure, Schmid & Harper (1985) found that module density within
clones was under precise control due mainly to the regulation of the birth rate of
modules. A similar regulation of tiller density has been found in Carex bigelowii, a
rhizomatous sedge (Carlsson & Callaghan, 1990). In Schizachyrium scoparium, a
perennial bunchgrass, both intra- and inter-clonal density-dependent interference
controlled ramet densities (Briske & Butler, 1989).
However other studies among phalanx clonal species have indicated that density
dependent ramet mortality is uncommon when inter-ramet connections are maintained
for a season or more (Hutchings, 1979; Hutchings & Slade, 1988). An efficiently
foraging phalanx species, that is making maximum use of available area and resources,
should be maintaining ramet size and density at just below the level where density
dependent mortality occurs (Hutchings & Slade, 1988).
No reduction in tillering rate with increasing clone size was found in F. novae
zelandiae indicating that crowding within a large tussock was not reaching sufficient
levels to bring density-dependent effects into operation. Tillering rate in F. novae
zelandiae was probably more a product of the genotype and immediate environment of
each plant.
Brisk & Butler (1989) found much higher rates of tiller recruitment on the
periphery of tussocks of Schizachyrium scoparium as opposed to the interior of the
tussocks. Surprisingly no effect of position on tillering vigour or survival was found
within F. Ilovae-zelalldiae tussock. Numerous authors (e.g., Zotov, 1938; Moore, 1976;
Gatsuk et aI, 1980; Espie, 1987) have commented on the tendency of F. novae
zelandiae and other tussock-forming grasses to decay in the centre and fragment into a
peripheral ring of tillers. This does not appear to be due to innate differences in tiller

76
vigour with position and may be more a result of fungal or insect attack encouraged by
the damp, sheltered environment in the tussock interior (Kelsey, 1957).

77
4.3 THE EFFECT OF COMPETITION
4.3.1 Introduction
Over the last century short-tussock grassland has been undergoing a process of radical change from a
community dominated by indigenous grasses, forbs and shrubs to one dominated by adventive
species. Early accounts of short tussock grassland (e.g. Wall, 1922; Cockayne, 1928; Zotov, 1938) list
species that are now rare or absent in many areas and much of the present-day short tussock
grassland has been fragmented into patches of indigenous species in an alien matrix (Lord & Norton,
1990).
Some of the common adventive species in short tussock grassland such as Agrostis capillaris L.,
Anthoxanthum odoratum L. and Festuca ntbra L. were deliberately introduced in order to improve
the value of the vegetation for grazing (O'Connor, 1982, 1986). However many others such as
Hypochoeris radicata L., Hieracium species, Linum catharticum and Rumex acetosella have spread by
accidental introductions.
In the Cass area, where the present study was conducted, the main influx of adventive
presumably occurred in the early 1860's with the advent of pastoral farming (Dobson, 1977). In 1915
a number of species includingAnthoxanthum odoratum, Holcus lanatus, Rumex acetosella and
Trifolium repens, which are common in the area today, were already present (Cockayne & Foweraker,
1916). Interestingly Agrostis capillaris, which is one of the most dominant inter-tussock species on
Sugarloaf Fan today, was not recorded from Cass even as late as the 1920's (Malcolm, 1925).
However by 1944 it was common on the valley flats (Cumberland, 1944) and possibly was deliberately
sown (Dobson, 1977).
It is difficult to empirically determine the impact of biological invasion on the resident
community as effects are often subtle and slow to be manifest. However recent long-term studies
have linked the decline in indigenous species diversity in New Zealand grassland to the increasing
dominance of adventive species (Scott et al., 1988; Lord, 1990; White, 1991; Treskonova, 1991).
Invasive species often affect the resident community directly by interference competition. The
simplest way to test for a competitive effect is, as Tansley (1914) stated 'by clearing a patch of ground
of some or all of the species present and seeing what happens.' It was the aim of this experiment to
investigate the influence of adventive species on the growth and reproduction of F. novae-zelalldiae by
removing adventive species from areas containingF. novae-zelandiae.

78
4.3.2 Methods
A 20 m transect was randomly located in short tussock grassland at Sugarloaf Fan and
14 pairs of 1 m x 1 m plots randomly located along the transect. All adventive species
were removed by hand from one randomly selected plot in each pair in January 1990.
Rhizomes of Agrostis capillaris and Hieracium species were carefully dug out with a
knife. All tussocks in the control plots were tagged and all plants in the weeded plots
were mapped.
Every tussock was measured for maximum extended leaf length and mean basal
diameter (using a diameter tape). In addition the percentage of tussock basal area
occupied by dead material (% dead) was estimated and the number of culms counted
for each plant. The plots were weeded again in May and November 1990 and finally in
February 1991. In January 1992 the same plants were reassessed for maximum extended
leaf length, mean basal diameter, % dead and number of culms.
The initial measurements made in 1990 for each variable were subject to one-way
analysis of variance to test that plants in weeded and control plots were statistically
comparable samples; i.e., that there was no initial bias between the treatments that
could effect the final analysis.
As the data consisted of identical measurements on the same individuals over a
period a time, a repeated measures analysis of variance model was used for analysis.
Each of the four variables measured was tested for differences between plants in
different treatments, differences within plants between years and for an interaction
between the two terms. Relative reproductive effort,calculated as the number of culms
cm-2 of live basal area, was also tested for significant differences due to treatment and
time.

4.3.2 Results
A total of 255 tussocks were measured in January 1990 and 246 of these were still alive in January
1992. All nine deaths occurred in weeded plots.
79
One-way analysis of variance found no significant difference between control versus weeded
plots for initial values of any of the four measured variables indicating that the tussocks within the
two different kinds of plots were initially comparable prior to experimental manipulation.
Repeated measures analysis of variance using initial and final measurements showed that in all
treatments, plants decreased significantly in height through time (Table 4.1). There was also a
significant interaction between treatment and time indicating that the change in height over time was
affected by whether they occurred in weeded or control plots. However between-plant differences in
height corresponding to the effect of weeding alone were not significant.
Plants in all treatments also increased significantly in diameter over the two years. Between
plant differences in diameter due to treatment alone were significant, as was the interaction between
time and treatment (Table 4.1).
There was no treatment effect on the percentage of tussock area occupied by dead material.
However % dead decreased significantly in all plants over the two years of the study. The magnitude
of change within individual plants over time did not vary significantly between weeded and control
plots (Table 4.1).
The number of culms per tussock increased significantly over all tussocks between 1990 and
1992 and the effort put into culm production in relationship to tussock size also increased significantly
(Table 4.1). Weeding alone had a significant positive effect on culm production, however there was
no similarly positive effect on relative reproductive effort. The significant increase in culm production
among plants in weeded plots is therefore undoubtedly due to the overall larger diameter of these
plants. Neither of these variables showed a significant interaction between treatment and time.
The most common adventive species removed from the weeded plots wereAgrostis capillaris
andAnthoxanthum odoratum. Both of these grasses formed dense to open patches that interdigitated
with other patch-forming species such as Poa colensoi, Coprosma petriei and Cyathodes fraseri. The
act of removing the adventives unavoidably disturbed these and other patch-forming species and
therefore no results could be obtained on the effect of the experiment on species other than F. novae
zelandiae. However shrubs of Cassinia leptophylla sensu lato growing within the weeded plots
responded to the removal of adventive species by sprouting vigorously from the base. Also two
seedlings ofAciphylla subflabellata were observed to establish in weeded plots. None were observed
in control plots.

80
Table 4.1: Mean values for 1990 and 1992 measurements of F. novae-zelandiae
tussocks in weeded and control plots at Casso Height and Diameter are in cm. 'ReI.
eff.' is relative effort calculated as culms m-2 of live basal area. Results from
repeated measures analysis of variance tests are also given. NS = not significant.
Dead plants were excluded from the analysis.
Height Diam. % Dead No. culms ReI. eff.
1990: Control 39.4 4.64 29.6 1.54 5.33
Weeded 41.2 5.60 32.9 2.60 5.36
1992: Control 38.2 5.44 16.6 4.13 11.0
Weeded 36.0 8.09 15.5 7.05 8.68
Source of Variation
Treatment: F 0.11 10.3 0.01 5.87 0.47
p< NS 0.01 NS 0.05 NS
Time: F 72.0 103 50.8 34.9 10.05
p< 0.001 0.001 0.001 0.001 0.01
Trmt x Time: F 32.3 19.5 1.57 1.95 0.66
p< 0.001 0.001 NS NS NS

81
4.3.3 Discussion
The increased growth among plants in weeded plots indicates that adventive species are
affecting F. novae-zelandiae tussocks. The lack of difference between weeded and
control groups in percent dead tillers indicates that the greater increase in the size of
plants in weeded plots was a result of an increase in tiller births rather than a decrease
in the death and decay of tillers. The difference in culm production between plants in
weeded and control plots was simply a function of the higher tillering rate among
plants in weeded plots; reproduction relative to size was not significantly different
between the treatments.
The removal of adventive species also had a negative effect. Whole plant mortality,
particularly among smaller plants, increased in weeded plots presumably due to the
increased exposure of plants and risk of wind damage and desiccation. Also
unavoidable disturbance of the soH and root zone of tussocks during weeding may have
increased the likelihood of death.
In a species removal experiment in a mown field in North Carolina, Fowler (1981)
found that species generally increased in abundance on the removal of other species
but that competitive interactions were diffuse rather than specific. It is possible that
the findings of my study relate to competition generally rather than the specific effect
of adventive species. F. novae-zelandiae might have shown a similarly positive response
had I removed all other indigenous species instead of the adventives. However no other
indigenous species was as abundant in the grassland I studied as the most abundant
adventive species. The adventive species therefore represent the primary source of
competition with F. novae-zelandiae tussocks at the study site.
The tillering response shown by plants in the weeded plots could have been due to
higher light levels or temperatures at the tussock base. Kays & Harper (1974) found
that mutual shading among populations of Lolium perenne affected tillering rates. Gold
& Caldwell (1989) found that removing dead foliage from the base of Agropyron
desertorum tussocks stimulated greater regrowth than removing upper portions. The
effect of adventive grasses on adult F. novae-zelandiae tussocks may be to depress
tillering rates and hence flowering by competing for light.
The trend among all plants regardless of treatment of increasing diameter and culm
production and decreasing height and percent dead tillers could be a response to the
climatic fluctuations of the last five years. The drought of 1987 - 1988 was observed to
affect F. novae-zelandiae tussocks (C. J. Burrows pel's. com.) as well as adventive
grasses. Rainfall has been higher in recent years and the observed growth of tussocks
could represent an ongoing recovery from the effects of the drought. If this were the
case then the effect of competition from adventives is to slow the rate of population
recovery rather than reverse it.
The sward of adventive grasses on Sugarloaf Fan may not be dense enough to have

82
the direct negative impact on tussock growth and survival observed in more fertile
grassland (Lord, 1990). However adventive grasses such as Agrostis capillaris are still
increasing in the area (White, 1991) and have formed a dense sward on some areas of
Sugarloaf Fan.
If the abundance of adventive species remained at present-day levels, they would
probably have little direct impact on the adult F. novae-zelandiae population. However
observations during the course of this study indicate that the spread of adventive
grasses may be negatively affecting species such as Coprosma petriei that are important
substrates for the regeneration of F. Ilovae-zelalldiae by seed (see chapter 3.5). Even in
the absence of a negative effect on adult plants this would ultimately reduce the
abundance of F. novae-zelandiae at the site.

83
4.4 STAGE-CLASS ANALYSIS OF POPULATION STRUCTURE
4.4.1 Introduction
The demographic literature contains two broad types of stage-based population studies.
One follows the Russian "age-state" style of analysis which aims to describe the life
history of species of different growth forms by the construction of a detailed
classification of recognisable biological stages. Each stage is defined by the appearance
of new characteristics or structures and the absence of others (Gatsuk et al., 1980).
Stage-classes are taken to represent successive stages in the ontogeny of genetic
individuals and are usually presented as a linear developmental sequence from seedling
to senescent individual (e.g. Gatsuk et al., 1980; Kurchenko, 1985; Vorontzova &
Zaugolnova, 1985; Zhukova & Ermakova, 1985). Population structure is represented by
the complement of stage-classes present within the population (Rabotnov, 1969).
However the strength of this approach is in its summation of the life-history of the
species.
Two major problems arise with the use of this age-state approach. One is how to
construct a classification that reflects real groupings within the data. The other is that
as soon as a sequence of classes has been constructed the implicit or explicit assumption
is made that normal individuals will progress in a linear manner through the classes.
Because of their modular structure through tillering, individuals of perennial grass
species are capable of both expansion and contraction and therefore do not necessarily
progress in a linear sequence through ontogenic stages.
The other commonly published type of stage-based study involves the use of stage
or size-classes as a data-base with which to construct a model of population dynamics
(e.g. Werner & Caswell, 1977; Bierzychudek, 1982; Moloney, 1988; Babcock, 1991).
These models are usually matrix-orientated and based on the methods of Leslie (1945),
Leftovitch (1965), Vandermeer (1975) and Caswell (1986) (see Manly (1989) for a
discussion of theory and application). Transition probabilities between stages are used
to accurately describe and predict population dynamics.
These two approaches to stage-based population studies differ both in emphasis and
in information content of classes. The Russian approach aims to produce classes of
sufficient information content so that by simply examining the stages an uninformed
reader will gain insight into the biology and ecology of the species being studied.
The information content of classes in the matrix approach is essentially irrelevant as
the approach is concerned with movement between classes. The emphasis in this
approach is on population dynamics rather than individual ontogeny or population
structure.
The aim of this section is to firstly evaluate the naturalness of stage-classes and the
linearity of stage-class transitions using data from F. novae-zelandiae and secondly to

examine population structure in nine different populations of F. novae-zelandiae as
defined by stage-class frequency distributions.
84

85
4.4.2 Methods
(a) The naturalness of stage-classes
Four 2 m x 2 m plots were randomly located at each of the nine populations used in
Section 3.4. All adult tussocks in the plots were measured for maximum extended leaf
length, basal diameter (measured for two perpendicular axes so as to give a mean value
and a measure of shape) and the percentage of dead tillers within the tussock was
estimated. In addition the numbers of 1989 and 1990 culms were counted. Seedlings,
consisting of a primary shoot only and retaining their connection with the caryopsis,
were excluded from the data-base.
Individual tussocks were subjectively allocated to six stage-classes based on the
methods and classification used in Russian studies of long-lived caespitose grasses
(Gatsuk et ai, 1980). The six classes were defined as follows:
(1) Juvenile: non-reproductive plants < 1 cm diameter, with no or few dead tillers
(usually 0 - 5%). In these plants the connection with the caryopsis had been lost,
tillering had begun, adventitious roots were few and the plants were still shorter than
adult tussocks.
All reproductive plants were assigned to one of the following three classes
depending on size and vigour.
(2) Young Reproductive: a few culms had been produced, tillering and adventitious
rooting was well underway but dead tillers were still few (usually 0 - 15%) and
scattered throughout the tussock. Plants were usually 1 < x < 5 cm diameter with a
firm round tussock habit and produced one or a few culms in intermittent years.
(3) Mature Reproductive: plants produced several to many culms in most years, were
large and had moderate numbers of dead tillers (10 - 30%) scattered throughout the
tussock with some small areas consisting only of dead tillers.
(4) Old Reproductive: culm production low and often irregular and plants had moderate
to high numbers of dead tillers ( > 30%) with areas within the tussock consisting
entirely of dead tillers. Tussocks tended to be irregular in shape and some were
becoming fragmented into two or more parts.
The final two classes consisted of non-reproductive plants in various states of decay.
(5) Senescent: tussock diameter and the amount of dead material within the tussock
reached a maximum and the genet had became fragmented.

86
(6) Remnant: the clone had become reduced to a remnant similar in size to juvenile
tussocks but containing or adjacent to old dead material and growing on a mound built
up by the original genet.
Non-reproductive plants that were too big to qualify as "juvenile" or "remnant" but
insufficiently decrepit to qualify as "senescent" were allocated to one of the three
reproductive classes according to size and vigour. This was justified in light of the
results of section 3.2 which indicated that not all plants reproduced every year. The
"immature" or "virginal" stage of Gatsuk et al. (1980) was not used as the sometimes
irregular flowering of individuals meant that mature virginal plants could not be
distinguished from plants that had reproduced in previous years but were not
reproductive in the year of the study.
The data from all nine populations was combined and subject to canonical
discriminant analysis, as implemented by SAS, using stage-class as the classification
variable. The aim of the analysis was to test whether the six stage-classes could be
distinguished in multivariate space using the data obtained from measurements of size,
vigour and reproductive effort of the individual tussocks. In addition, differences
among the stage-classes for single characters were tested using one-way analysis of
variance.
(b) Linearity of stage-class transitions
Data from 255 individuals used in the competition experiment of section 4.3 was
classified into stage-classes using the discriminant function developed in (a) above. As
initial measurements and final measurements were separated by a space of two years
(January 1990 - January 1992) in this dataset, estimates could be made of the change
in the stage-class of an individual over time. The probability of individual plants
moving between classes was calculated for both weeded and unweeded plants in the
form of a transition matrix (Leftovich, 1965). The probability of death for individuals
in each class was also calculated.
(c) Stage-class comparisons among nine populations
For each of the nine populations used in (a), the frequency of stage-classes as assigned
by the discriminant function was tabulated. Pairwise Chi-squared tests of independence
were used to test for significant heterogeneity among the populations for stage-class
frequency distribution.

87
4.4.3 Results
(a) The naturalness of stage-classes
A total of 392 live tussocks was measured and allocated to the six stage-classes. The
"young reproductive" and "mature reproductive" classes contained the most individuals;
108 and 114 respectively. A total of 78 individuals across the nine populations were
allocated to the "juvenile" class and 58 to the "old reproductive" class. The "senescent"
and "remnant" classes emerged as the smallest with 17 and 23 individuals respectively.
The first four axes of the canonical discriminant analysis showed significant
discrimination (P < 0.001) between the six stage-classes, using measurements of
maximum extended leaf length, mean basal diameter, percent dead tillers, degree of
fragmentation, mean number of culms over two years and flowering consistency over
two years. When classification to stage-class was re-evaluated using the discriminant
function developed, 66.3% of individuals were found to have been classified to the
same stage-class in the original subjective allocation.
The number of individuals reclassified by the discriminant function varied
considerably between stage-classes. The subjective "juvenile" class was the most
consistent with 79.2% of individuals being objectively classified as "juvenile" and the
remainder assigned to the "young reproductive" or "remnant" classes by the discriminant
function (Table 4.2). The "mature reproductive", "senescent" and "remnant" classes were
also well-defined with over 70% of individuals classified identically in the original
subjective classification. The "young reproductive" and "old reproductive" stage-classes
were the least consistent with 52.8% and 58.6% of individuals being classified as such
. by the objective classification.
Of the 132 reclassifications made by the discriminant function, 106 involved a move
out of one of the three reproductive classes into either a non-reproductive class or
another reproductive class. Only 26 reclassifications involved a move out of a non
reproductive class. However the three reproductive classes jointly contained over twice
as many individuals as the non-reproductive class (278 as compared with 114). When
the frequency of the four types of reclassification (R - N (reproductive to non
reproductive), R - R, N - R, N - N) was tested for heterogeneity with a chi-squared
test there was no significant departure from expected frequency (X2 = 4.84, dj = 3, P
> 0.05).
However there was significant heterogeneity among stage-classes in the percentage
of individuals originally within the class being reclassified to other classes by the
discriminant function (X2 = 17.4, dj = 5, P < 0.01). There were more misclassified
individuals in the "young reproductive" class than expected and less in the "juvenile"
class.
These two classes were involved in the single most common type of reclassification,

88
Table 4.2: Stage-class classification summary of 392 F. novae-zelandiae individuals
based on measured morphological variables. Values represent percent reclassified by
a linear discriminant function into each stage-class from each stage-class.
Percent reclassified by discriminant function into objective class
Juvenile Young Mature Old SenescentRemnant Plants in
From subjective class
subjective class No. %
Juvenile 79.2 16.7 0 0 0 4.17 72 18.9
Young 32.4 52.8 13.9 0 0 0.93 108 27.0
Mature 0 19.3 72.8 7.89 0 0 114 29.1
Old 0 8.62 6.90 58.6 12.1 13.8 58 14.8
Senescent 0 0 0 5.88 70.6 23.5 17 4.34
Remnant 8.70 13.0 0 0 4.35 73.9 23 5.87
Plants in objective class: Total Total
No. 94 99 102 44 20 33 392
% 24.0 25.3 26.0 11.2 5.10 8.42 100%
Table 4.3: Objective stage-class means for measured morphological variables.
Results from one-way ANOV A tests among classes are given. Different superscripts
indicate a significant difference between means using LSD tests. For number of
culms, standard errors and critical values of differences varied due to unequal
sample sizes so LSD test could not be applied.
Stage-Class N Height (cm) Diam. (cm) % Dead No. culms
Juvenile 94 20.4a 1.38a 7.23a 0.01
Young 99 29.4c 2.85b 13.1b 0.23
Mature 102 36.8e 6.83c 16.1 c 3.40
Old 44 34.1d 8.42d 35.ld 1.81
Senescent 20 33.3d 10.5e 49.0e 0.07
Remnant 33 24.6a 1.97ab 48.3e 0.07
ANOVA: F 83.6 105 259 37.7
p< 0.001 0.001 0.001 0.001

89
from "young reproductive" to "juvenile" which involved 31.5% of individuals originally
classified as "young reproductive" and accounted for 25.7% of total reclassifications. All
except two of the individuals reclassified in this manner were non-reproductive
individuals greater than 1 cm in diameter that had been originally allocated to the
"young reproductive" class on the basis of size in spite of their lack of culms. The other
two individuals reclassified from "young reproductive" to "juvenile" were juvenile in
size but had both produced a single culm in the two years encompassed by the study.
The most common reclassification types after "young" to "juvenile" were "senescent"
to "remnant" involving 23.5% of "senescent" individuals and "mature" to "young"
involving 19.3% of "mature" individuals.
There was also significant heterogeneity among the nine populations in the number
of individuals reclassified (X2 = 21.59, dj = 8, P < 0.01). The Cass Saddle 'B'
population had the most individuals reclassified (44.1 %) while only l7 .6% of
individuals in the Porters Pass population were reclassified.
In case this heterogeneity was due to differences in mean tussock size between
populations the discriminant analysis was repeated on data standardised by population.
This resulted in the proportion of observations reclassified by the discriminant function
increasing from 33.7% to 34.9% and heterogeneity among populations also increased
rather than decreased (X2 = 51.84, dj = 8, P < 0.001).
In addition to being distinct in multi-variate space, the six objectively defined
stage-classes also differed significantly in their univariate distributions for each of the
variables measured (Table 4.3). Each variable also showed a distinct trend of a low
mean value in the "juvenile" class increasing to a peak in the "mature reproductive" to
"senescent" classes then decreasing again to the "remnant" class. Mean height and culm
production reach their maximum in the "mature reproductive" class. Mean diameter and
percent dead tillers reach a maximum among "senescent" individuals.
(b) Linearity of stage-class transitions
If the developmental sequence of stages in a species was linear, such that movement
between stages consisted of growth into the next stage-class, a matrix of transition
probabilities would be comprised of a non-zero leading diagonal representing static
individuals and a non-zero sub-diagonal representing movement into the next stage
class. This was not the case for the two transition matrices compiled for the 155 control
and 100 weeded individuals used in the competition experiment at Sugarloaf Fan (Table
4.4).
Among these plants there was considerable movement between stage-classes within
the space of two years. However little of this movement represented a shift into the
next largest or "older" stage-class. Transitions occurred in 27 of the possible 36
combinations and transitions to "younger" classes above the diagonal were more

90
Table 4.4: Stage-class transition probability matrices for (a) unweeded and (b)
weeded groups of F. novae-zelandiae at Sugarloaf Fan. Individuals were allocated to
stage-classes using a discriminant function developed using 392 classified F. novae-
zelandiae individuals from nine populations.
(a) Unweeded Plots N = 155
Ob jective stage-class in Jan 1990
Juvenile Young Mature Old Senescent Remnant
Jan 1992
Juvenile 0.50 0.09 0 0 0 0.33
Young 0.50 0.71 0.07 0.27 0.33 0.55
Mature 0 0.l1 0.78 0.38 0.33 0.05
Old 0 0.02 0.15 0.27 0 0
Senescent 0 0 0 0.01t- 0 0
Remnant 0 0.07 0 0.04 0.33 0.05
Dead 0 0 0 0 0 0
(b) Weeded Plots N = 100
Ob jective stage-class in Jan 1990
Juvenile Young Mature Old Senescent Remnant
Jan 1992
Juvenile 1.00 0.20 0 0 0 0.08
Young 0 0.56 0.l3 0.09 0 0.25
Mature 0 0.12 0.76 0.68 0 0
Old 0 0 0.08 0.14 0.50 0
Senescent 0 0 0 0 0 0
Remnant 0 0 0.03 0.04 0 0.33
Dead 0 0.12 0 0.04 0.50 0.33

91
common (29.8% of individuals) than transitions to "older" classes below the diagonal
(16.5%). However the majority of plants (53.7%) remained in the same stage-class over
the two year period. Transitions between adjacent classes were more common,
involving 30.2% of individuals, than transitions between non-adjacent classes (16.1%).
When a chi-squared test was applied, no significant difference was found between
weeded and unweeded plants in the frequency of no change and transitions above and
below the diagonal (X2 = 0.515, dj = 2, NS).
(c) Among-population comparisons of stage-class frequency
Pair-wise chi-squared tests for 392 plants in nine populations using the objective
classes from (a) above found significant differences between pairs of populations for
32 of the 36 comparisons of stage-class frequency distributions (Table 4.5). Four
populations, Bankside, Cass River, Mt Sugarloaf and Porters Pass differed significantly
from all other populations in their stage-class frequency distribution.
Bankside was characterised by a predominance of plants in the "older" classes and a
lack of small healthy reproductive individuals (Fig. 4.5). The stage-class frequency
distribution of Cass River was dominated by "mature reproductive" plants with fewer
small plants and no "senescent" or "remnant" plants (Fig. 4.6). At Porters Pass the
population was dominated by small plants with few large reproductive or senescent
individuals (Fig. 4.7). The stage-class profile of Mt Sugarloaf was similar to that of
Cass River except individuals of the "young reproductive" class dominated (Fig. 4.8).
Sugarloaf Fan, Hallelujah Flat and Cass Saddle 'B' formed a group in which stage
class frequency distribution did not differ significantly. Their stage-class frequency
distributions were characterised by higher frequencies of reproductive plants (Fig. 4.9).
Cass Saddle 'A' and Cass Valley also did not differ significantly in stage-class
frequency distribution. These populations were both characterised by high numbers of
"juveniles" but few small reproductive plants (Fig. 4.10).

92
Table 4.5: Pair-wise X2 tests of stage-class frequency distribution among nine
populations using objective classes defined by a discriminant function. * indicates P
< 0.05, ** P < 0.01, *** P < 0.001 and NS indicates not significant.
BNK CRY CSA
CRY 92.9
***
CSA 83.8 31.4
*** ***
CSS 68.6 11.3 23.8
*** * ***
CVS 58.1 27.8 8.13
*** *** NS
HLF 42.3 23.1 36.9
*** *** ***
MTS 93.2 34.1 36.7
*** *** ***
PPS 83.2 43.0 21.0
*** *** ***
SLF 49.7 17.3 29.2
*** *** ***
CSS
16.9
**
9.91
NS
20.6
**
20.9
***
5.23
NS
CVS
16.6
**
32.5
***
23.1
***
13.4
*
HLF
27.2
***
34.0
***
1.96
NS
MTS PPS
16.9
**
22.8 24.8
*** ***

Juvenile Young Mature Old Senescent Remnant Stage-class
Figure 4.5: Stage-class frequency distribution of F.novae-zelandiae tussocks at
Bankside.
Senescent Remnant
93
Figure 4.6: Stage-class frequency distribution of F.novae-zelandiae tussocks at Cass
River.

Juvenile Young Mature Old Senescent Remnant Stage-class
Figure 4.7: Stage-class frequency distribution of F.novae-zelandiae tussocks at Porters Pass.
Juvenile Young Mature Stage-class
Senescent Remnant
Figure 4.8: Stage-class frequency distribution of F.novae-zelandiae tussocks at Mt Sugarloaf.
94

Juvenile Young Mature Old Senescent Remnant Stage-class
~ Sugarloaf Fan _ Hallelujah Flat ~ Cass Saddle B
Figure 4.9: Stage-class frequency distribution of F. novae-zelandiae tussocks at
Sugarloaf Fan, Hallelujah Flat and Cass Saddle 'B'.
Juvenile Young Mature Old Remnant Stage-class
Ii\\1 Cass Valley _ Cass Saddle A
Figure 4.10: Stage-class frequency distribution of F. novae-zelandiae tussocks at
Cass Valley and Cass Saddle 'A'.
95

96
4.4.4 Discussion
(a) The validity of a stage-class approach
The discriminant analysis and analysis of variance tests indicate that the stage-class
classification reflects real groupings within the data. An examination of the
reclassifications made by the discriminant function provides much information on the
manner in which the subjective classification was performed and on the life-history of
F. novae-zelandiae individuals.
The main factor influencing reclassifications appeared to be the differential
weighting of characters in the subjective definition of classes. For example, all
reproductive individuals were allocated to one of the three reproductive classes
regardless of size, in effect weighting culm production ahead of other variables. Basal
diameter was much more important in distinguishing "senescent" from "remnant"
individuals than other characters whereas percent dead tillers was important in
distinguishing "remnant" from "juvenile" individuals. Differing importances among
characters in defining different groups is implicit in Russian-type stage-based studies
(e.g. Gatsuk et al .. 1980) but is never commented on by the respective authors.
The varying importance of different characters in the definition of different groups
cannot be replicated by a multivariate technique such as discriminant analysis in which
any character weightings must be applied consistently across all groups. Therefore
subjective and multivariate classifications would automatically differ regardless of any
other complicating factors.
It was initially thought that the emphasis placed on reproduction would prove to be
a complicating factor in classification. However, in spite of the differential treatment
of reproductive versus nonreproductive individuals the allocation of individuals to
reproductive versus nonreproductive classes was not a source of misclassification any
more than would have been expected. This was probably due to the "young", "mature"
and "old reproductive" classes also containing nonreproductive individuals. It is
generally recognised in the age-state literature, although not always specifically stated,
that individuals in the "reproductive" phase can be generative or vegetative during that
period of their ontogeny (Rabotnov, 1969, 1978, 1985; Vorontzova & Zaugolnova,
1985). This was also found for F. Ilovae-zelandiae at Sugarloaf Fan in the present study
(section 3.2).
If classes were defined strictly according to reproductive status intermittent
reproduction would create problems for stage-class frequency comparisons either
between populations or between years.
One approach would be to ignore reproductive status and classify individuals on the
basis of size and vigour alone as was done for Chiollochloa pallens by Rose & Platt
(1990). However this approach results, essentially, in size classes rather than ontogenic

97
stages and the classes themselves have very low information content.
However by assigning currently nonreproductive individuals that appear large
enough and healthy enough to be reproductive to reproductive classes, the problem of
intermittent reproduction is circumvented. The method of allocating these
nonreproductive individuals is therefore more a multi-variate approach based on
overall similarity.
Variation among individuals in size at first reproduction and intermittent
reproduction among small individuals would result in a lack of close correlation
between reproduction and size in the "juvenile" and "young reproductive" classes. This
would explain why so many reclassifications involved individuals from the "young
reproductive" class and why this class was generally poorly defined. Intermittent
reproduction also tends to be a feature of "old reproductive" individuals (Rabotnov,
1985) and this class was also poorly defined with a large proportion of "old
reproductive" individuals being reclassified.
The low incidence of misclassification among juveniles was to be expected as this is
the only class that can be associated at all accurately with age. However little can be
said either about the age at which juveniles become reproductive or the age of plants
in other classes. As is the case with most long-lived species, suppressed individuals can
persist as small non-reproductive members of the population for considerable lengths
of time as observed in North Canterbury short tussock grassland by Moore (1977) and
in the present study (section 3.5). These plants can function as a store of recruits for
when conditions become favourable (Silvertown, 1982; Chesson, 1984).
Death of adult tussocks was infrequent in the F. novae-zelandiae population studied;
however the deaths that were observed were concentrated in the 'older' stage-classes.
Canfield (1957) monitored individuals of perennial grass species in Arizona over 17
years. Four of the species he studied showed survivorship patterns of low death risk in
middle age followed by a high risk of death as plants aged. This pattern of increasing
mortality with age was also found in Corynephros canescens, a tussock-forming
perennial grass of northern European sand -dunes (Symonides, 1979). In this species
tillers often failed to form roots in old plants. Harper suggested that this lack of
rooting was a result of the tussock habit (Harper, 1977, p591). Increasing tiller density
and litter accumulation within an old large tussock may hinder the rooting of new
tillers and significantly increase the death risk of the whole plant.
The sequence of stage-classes from "juvenile" through "mature" to "remnant" can be
interpreted as representing a series of ontogenic stages in the development of an
individual tussock from a seedling through reproductive maturity to senescence. During
this development tussock height increases rapidly from the juvenile stage to the mature
stage and reaches its maximum among individuals in the mature stage-class (Fig. 4.5).
Diameter increases more slowly and is parallelled by the accumulation of dead tillers
within the circumference of the tussock.

98
However the presentation of a sequence of stage-classes as an ontogenic series belies the
diversity of developmental pathways that individual plants can follow. The series of stage-classes
represents an idealised life-history that is probably followed in full by few individuals. Under
unfavourable conditions individual plants may stay in the "juvenile" class for long periods of time
without increasing appreciably in size or reproducing. These individuals may appear to pass directly
into the "remnant" class due to the gradual accumulation of dead tillers. Similarly plants that begin
reproducing and enter the "young reproductive" class may never reach the size or fecundity levels that
characterise "mature reproductive" individuals and instead pass directly into the "old reproductive" or
"senescent" classes. Studies of Deschampsia caespitosa, a long-lived perennial tussock, have shown
that remnants of larger clones can regenerate and take on the characteristics of a juvenile (Gatsuk et
al., 1980). Given favourable conditions this no doubt occurs within populations ofF. novae-zelandiae.
Transitions of this type as well as many others occurred within two years in the Sugarloaf Fan
population. It is quite clear from the transition matrices constructed that developmental pathways
among F. novae-zelandiae individuals are not only non-linear but also change dramatically over
relatively short spaces of time. This contrast with previous descriptions of F. novae-zelandiae as slow
growing (Sewell, 1947, 1952).
As F. novae-zelandiae is modular in structure it is able to respond rapidly to changes in
environmental conditions. Given the differences in transition probabilities between weeded and
unweeded groups of plants it is obvious that year-to-year variation in environmental factors such as
rainfall and biotic factors such as competition can have a dramatic impact on the size, vigour and
reproductive status of individual plants.
(b) Among-population comparisons of stage-class frequency
In light of the above conclusions concerning the complexity of stage-class structure, between
population differences can only be discussed with reference to short-term conditions that may have
influenced stage-class frequencies. The stage-class profile of a population cannot be assumed to bear
any relationship to the older establishment and disturbance history of that population except with
reference to the numbers of individuals present. Furthermore, differences between sites in factors
such as soil fertility would result in differences in the mean size of plants and in plant vigour so that
the age and establishment history of the population would be of even less importance.
Sugarloaf Fan, Hallelujah Flat and Cass Saddle 'B' all have stage-class frequency distributions
typical of a normal population in which all stages are present and frequencies are distributed evenly
around the mature stage (Rabotnov, 1969). These three populations also all occur within relatively
dense montane to subalpine shrub land

99
/ grassland under moderate to high rainfall. The distribution of frequencies around the
mature stage may therefore not be a product of the age of the population but rather of
resource availability. The "young" and "mature" stages are the most expensive in terms
of resources because in addition to relatively vigorous tillering, energy is also being
allocated to culm production. The distribution of stages in these three populations may
therefore reflect recent favourable conditions combined with recruitment to the
juvenile stage.
The pattern of stage-class distribution in the Cass Valley and Cass Saddle' A'
populations can also be interpreted as reflecting environmental conditions and resource
allocation strategies. Both sites are open, stony, exposed with poorly developed soils.
Although rainfall is relatively high, a moisture deficiency probably occurs during
summer. The predominance of "juveniles" may be due to an accumulation of plants
with insufficient resources to enter larger classes by growing or producing culms. Large
healthy "mature" plants are the most common among the three reproductive classes
indicating that smaller or less vigorous plants lack sufficient resources to produce
culms.
Similar factors may have shaped the stage-class distribution of the Porters Pass
population where rainfall is lower (1000 mm yr-1 versus 2500 mm yr-1 on Cass Saddle
(Greenland, 1977». Here "juveniles" and smaller vigorous plants with few culms are
more common than large plants with many culms. The difference in reproductive
classes between Porters Pass and Cass Saddle 'A' may be due to differences in relative
allocation to tillering versus culm production. Plants at Cass Saddle 'A' and Cass Valley
may put more effort into culm production when they do reproduce whereas Porters
Pass may only allocate a small portion of reserves to reproduction in anyone year
thereby being able to reproduce while still relatively small. Such a difference in
allocation of resources to culm production between these two populations is also
indicated in Section 5.6.
The stage-class frequency distributions of Bankside and Mt Sugarloaf are also
interpretable in terms of environmental conditions combined with the presence or
absence of recruitment. The Bankside site is the driest of the nine sites (average annual
rainfall of 690 mm) and has the most decrepit population. The Mt Sugarloaf population
occurs on an exposed face in subalpine grassland / shrubland and appears to be lacking
in recruits and large plants.
The Cass River population, on a sparsely vegetated low river terrace, may be the
only population more affected by its establishment history than by its immediate
environment. The stage-class profile of this population resembles a wave of
establishment and growth with a subsequent reduction in recruitment with changing
conditions. This scenario is perfectly reasonable in the context of riverbed successional
dynamics and past studies have indicated that riverbed populations of F. novae
zelandiae may each represent only a single establishment episode (Calder, 1958, 1961).
THE LIBRARY UNIVERSITY OF cANTERBURY
CHRISTCHURCH, N.Z.

100
In summary, natural stage-based divisions do exist within populations of F. novae
zelandiae tussocks. However life-histories are complex and individuals can change
rapidly either "backwards" or "forwards" between classes in response to annual changes
in biotic and climatic conditions. As a result the stage-class structure of a population is
a product of its history and environment and recent environmental conditions in
particular.

101
4.5 CLONAL FRAGMENTATION
4.5.1 Introduction
In the literature concerning F. l1ovae-zelandiae references have been made to the
possible role of clonal spread and fragmentation in maintaining individual tussock
numbers. The hypothesis is that as tussocks age and increase in diameter, central
portions die and the vigorous growth around the circumference gradually breaks up
into independent plants (Zotov, 1938; Moore, 1976; Espie, 1987). Fragmentation of this
nature can also be facilitated by factors such as burning and grazing (Sewell, 1947) or
insect attack (Kelsey, 1957).
This process has already been recognised as an integral part of the life history of
some Northern Hemisphere caespitose grasses (Chadwick, 1960; Davy, 1980; Gatsuk et
ai, 1980; Kurchenko, 1985; Vorontzova & Zaugolnova, 1985; Zhukova & Ermakova,
1985) and the age of some fragmented clones has been estimated as more than 1000
years (Harberd, 1961, 1962, 1967).
The aim of this experiment was to determine if clonal fragmentation was a factor in
maintaining population density in F. novae-zelandiae.
4.5.2. Methods
A 3 m x 3 m plot was located in dense Festuca tussock grassland on the upper portion
of Sugarloaf Fan and the position of all F. novae-zelandiae tussocks was mapped.
Tiller clumps were collected from every individual and grown on under uniform
condition in the University glasshouse. Isozyme electrophoresis was used to obtain a
genetic profile of each individual based on allele presence and absence at seven reliable
loci: PGI 1 and 2, APH 1 and 2, 6PG, MR and PGM. A full description of isozyme
methodology and enzyme names is contained in Chapter 5.5. Isozyme analysis has
previously been used to determine genotype identity in sward-forming grasses
(McNeilly & Roose, 1984) and bunchgrasses (Belsky, 1986).
The frequency of phenotypes at each locus was used to calculate the probability of
two unrelated plants having identical isozyme profiles, because plants possessing all of
the most common phenotypes would be more likely to appear identical even if they
were unrelated. P < 0.01 was used as the criterion for accepting pairs or groups.

102
4.5.3. Results
The 3 m x 3 m plot contained 121 individual tussocks of F. Ilovae-zelandiae possessing
a total of 69 allelic combinations. Of these 69 combinations, 21 were possessed by two
or more individuals and 14 such groups satisfied the P < 0.01 criterion.
Four groups represented close pairs of plants ('g', 'j', 'k', 'n', Fig. 4.11). All four
groups consisted of one large tussock and one smaller tussock and all occurred in the
lower right-hand corner of the plot where tussock density was higher and litter more
prevalent. In one case ('g') the plants were connected by an area of accumulated
tussock litter. However, groups of tussocks connected by litter generally had different
isozyme profiles and there were no rings or close groups of identical plants as would be
expected if a clone had spread at the periphery and fragmented into separate tussocks.
Some identical pairs and groups were relatively distant; the maximum distance observed
between apparently identical plants was 2.9 metres.

tit C. Ii
~ ,,-• • •• d • • ed •
• • ..1 . ' -- c .~. b '. •
" . ' • • . . ,- .. : h ·' • • •
•
•
• • "t--1 metre ) KEY:/// tussock litter
. Je
• b··
- • ~
• •
•
103
• m • •
Figure 4.11: Genetic identity, assessed using isozyme electrophoresis, of 121 mapped F. novae
zelandiae tussocks in a 3 x 3 m plot on Sugarloaf Fan. Letters indicate pairs or groups of tussocks
possessing identical isozyme phenotypes with a probability P < 0.01 that the similarity is due to
the chance sharing of common alleles.

104
4.5.4 Discussion
Given that forest has been absent from this site for 500 years (Molloy, 1977) and
assuming that Festuca has been present on the site ever since, an annual spread of 6
mm consistently in a single direction is required to account for the observed maximum
separation of apparently identical plants. Over two years at Sugarloaf Fan tussocks in
control plots used for a competition experiment (section 4.3) increased, on average, 8
mm in diameter. This is clearly not a sufficient rate of expansion. However plants in
the weeded plots increased, on average, 34.9 mm in diameter in two years, which
equates to an average annual radial spread of 8.7 mm. This rate of expansion may be
much more typical of the behaviour of F. novae-zelandiae when it first invaded the
area subsequent to the removal of forest. However it is unlikely that sufficient rates of
expansion have been maintained since the establishment of F. Ilovae-zelandiae on the
site to account for the more distant pairs of apparently identical plants.
Chadwick (1960) investigated clonal spread in Nardus stricta subsequent to changes
in pasture management and found that an annual spread of 2 cm was consistent with
the growth rate of the species and could account for the observed sizes of patches.
However he was dealing with spread over just 40 years and the original genets were
still intact. Given the longer time frame under consideration for the spread of F.
novae-zelandiae at Sugarloaf Fan, a much faster rate of spread than 6 mm per year
would have to be envisaged due to the probability that, once the original genet had
fragmented, the individual ramets would spread and themselves fragment in random
directions.
It is more likely that most groups of apparently identical plants represent family
groups resulting from crosses between similar parents and the isozyme information used
was not sufficiently detailed to distinguish between the individuals.
Some of the closer pairs of plants, particularly the pair connected by tussock litter
('g'), probably represent recently separated parts of a single clone, so clonal
fragmentation may still be occurring. However overall it would appear that clonal
fragmentation does not contribute significantly to the maintenance of tussock density.
While tussocks do appear to die in the centre and possibly fragment, the inequality of
size observed among close pair of isozymically identical tussocks suggests that there are
large differences in the vigour of fragments. On most occasions probably only one part
of the original plant persists in the long term.
Belsky (1986) suggested that the clonal spread of Andropogon greenwayi, a non
stoloniferous, non-rhizomatous grass was facilitated by grazing and trampling by large
herbivores. During the course of the present study spreading, fragmented patches of F.
novae-zelandiae and Poa Gila were observed in areas subject to grazing and trampling.
While mammalian grazing and trampling would not have occurred in pre-human New
Zealand, extinct indigenous ground birds may have pulled tussock tillers in a manner

105
similar to taka he (Notornis malltelli) (Mills et al.. 1989) which can do major damage to
tussocks (c. J. Burrows, pers. comm.). This may have facilitated the fragmentation of
tussocks in pre-human grassland. However proliferation by clonal fragmentation is
unlikely to have been important in the maintenance of populations of F. llovae
zelalldiae.

106
4.6 SUMMARY AND DISCUSSION OF CHAPTER 4.
Most of the tillers within an individual tussock of F. novae-zelandiae are replaced within two years,
with a distinct spring / summer flush in tiller births and a spring peak in deaths. Births exceeded
deaths among the tillers being monitored and total tillers tagged had increased 150.6% over the two
years of the study. While the majority (63.8%) of tillers failed to produce daughter tillers some tillers
produced as many as five daughter tillers within two years.
As a result of vegetative regeneration, a single genet can be virtually immortal and yet consist
of modules each only a few years old. The phalanx clonal structure of species such as F. novae
zelandiae allows for an optimal use of resources in the immediate environment while keeping the risk
of being supplanted by another species very low (Hutchings, 1979).
However the competitive ability of F. novae-zelandiae, like that of Deschampsia caespitosa, is
restricted by its growth form (Davy, 1980). The compact habit of both species restricts their area of
interference and the density of established tussocks results in self-shading and litter accumulation that
could affect tiller growth and survival. The competitive ability of long-lived tussock grasses is more a
product of their ability to persist at a site and resist invasion.
Although aggressive stoloniferous species such as Hieracium pilosella appear able to establish
within mature tussocks, the structure of F. novae-zelandiae tussocks makes them moderately resistant
to invasion by most adventive species. However adventive species such asAgrostis capillaris still
appear to have a negative effect on tussock growth. Tussocks in areas where adventive species had
been removed showed increased tillering resulting in larger size and more culms relative to plants in
control plots. This is possibly due to increased light levels at the tussock base. If tillering is a response
to light then the dense growth of adventive grasses around the plants being monitored could have
acted to lessen the differences in light levels reaching tillers in small tussocks and large tussocks.
However, no effect of self-shading in large tussocks on tillering rate was found in the tiller monitoring
experiment.
There was a general increase in diameter and culm production and decrease in height and
percent dead tillers in all plants monitored from 1990 to 1992 regardless of treatment, indicating that
the size and vigour of populations changes continually in response to the climatic and biotic
environment. The ability of F. novae-zelandiae to change in size, vigour and reproductive status from
year to year has important implications for the use of a stage-based approach to analysing population
structure. While natural stage-classes differing in morphological attributes and reproductive status
can be defined within a population of tussocks, transitions among classes are non-linear and can
occur over relatively short periods of time in response to changes in growing conditions.
Recruitment to the smaller stage-classes by means of clonal fragmentation and the subsequent
survival of several parts of the original clone appears to occur within populations of F. novae
zelandiae. However, in the grassland studied, this form of vegetative reproduction does not appear to
be sufficiently common to constitute an important alternative to seedling recruitment as a mechanism
of population growth.

107
The modular, high-turnover architecture of tussocks is an ideal vehicle for the expression of
phenotypic plasticity. This is particularly the case with dense intra-vaginally tillering grasses such as F.
novae-zelandiae which expand vegetatively in a tightly-packed phalanx form. Studies with
dicotyledonous herbs (Schmid, 1985) have shown that phalanx species where the genet remains in a
ftxed position rely much more on phenotypic plasticity than do guerrilla species. In the later, genetic
specialization is not disadvantageous because the genet can 'travel' by clonal growth to ftnd
favourable patches.
Plastic responses, although most important at the level of the genet in terms of population
processes, are a product of the individual responses of the independent modules (tillers or groups of
tillers) that comprise the clone. At the level of the individual plant, genets would appear to be varying
the number of vegetative and floral tillers in response to their environment, however this is a product
of between-tiller variation in the initiation of vegetative and floral apices. A population of tussocks is
essentially a meta-population of clonal populations (White, 1979) and while genetic variation is stored
among clones, the short-term response to environment fluctuations occurs at the level of independent
modules within clones.
The modules that comprise a tussock clone are of course not completely independent even if
connections between them have broken down. For example, tillers can negatively affect each other
through intra-clonal competition (Briske & Butler, 1989) and the death of large groups of tillers can
affect the remaining live tillers by smothering them or encouraging fungal growth. However, there are
also positive effects associated with a closely packed arrangement and one of the most important is
site occupancy. A ftrm, large tussock is unlikely to be invaded by other species. By assuming a tight
phalanx habit the plant preempts biological space and is resistant to invasion unless damage or
module death creates an opening within the clone.
In a healthy population of tussocks in a spatially heterogeneous environment, not all plants will
have the resources in a given year to contribute to total reproduction and many will exist as small
suppressed individuals. The modular architecture and high plasticity in growth of F. novae-zelandiae
means that such individuals could still contribute to the reproductive output of the population at a
later date, under more favourable conditions. In the meantime, these individuals act as a store of
genetic variation and source of adult recruits that can be accessed more readily than a store of seeds
(Chesson, 1984).
The modular architecture of perennial tussocks such as F. novae-zelandiae and the short life
span of modules means that these plants theoretically live in a state of perpetual somatic youth
(Harper, 1977). As a result of this the overall size, condition and reproductive output of a

108
plant is more a product of its environment over the previous few years than a result of
its age or establishment history. Examining the stage-class profile of populations of
modular plants such as F. novae-zelandiae is useful for predicting the future of the
population and giving some insight into recent environmental conditions but is of
limited use in tracing the past. One still needs to know the real age of plants before
any study of selection, genetic change or micro-evolution can be conducted (Harper,
1977).

CHAPTER 5: PATTERNS OF VARIATION
5.1 INTRODUCTION
5.1.1 Recent evolution in F. novae-zelandiae
Although the history of New Zealand vegetation over geological time has been
characterised by sometimes quite rapid change, the changes that have occurred in the
New Zealand landscape probably rival or surpass any previous event in terms of both
magnitude and speed. There is ample evidence for the reduction and elimination of
palatable species from certain areas during the explosive phase of pastoral development
in the South Island (O'Connor, 1986). Even where species were not severely reduced, a
shift in genetic constitution and range of morphologies could have occurred in any
species of reasonable abundance in the most actively settled areas due to selection
pressures operating on populations.
It has been suggested by O'Connor (1986) that the tussock form of F. novae
zelandiae is a recent phenomenon resulting from the intense selection pressure of
mammalian herbivory and frequent fire. His arguments are based on the early
taxonomy of Festllca species, including the usage of the term 'tussock' in species
description and on pre-1880 assessments of indigenous grass palatability. He
hypothesized that in the space of 50 to 60 years of European settlement the lowland
and montane species of Festllca had gone from being a fine, highly palatable
subdominant species with a slender, densely tufted habit to the coarse, unpalatable
dominant tussock known today as Festuca novae-zelandiae. Tussocks are clearly visible
in photographs of montane Canterbury dating from 1868 and 1880 (by D. L. Mundy
and Burton Bros respectively, reproduced in Burrows, 1977a) and are also visible in
photographs of Christchurch taken by A. C. Barker in 1860 and 1864 (held in the
Canterbury Museum).
O'Connor's hypothesis has important implications for this study as any
discussion of patterns of variation within a taxon, with reference to its perceived
history, would be invalid if that taxon in its present form was of very recent origin.
As described in Appendix 1, early Festllca taxonomy was confused and
characterised by 'lumping' of taxa. Therefore early assessments of grass palatability
cannot be taken as necessarily referring to particular present-day species. Arguments
that recent evolution has occurred within Festllca based on taxonomy and palatability
alone are therefore invalid.
However as pointed out by O'Connor, the term 'tussock' was never applied to
New Zealand species of Festllca initially grouped under F. dllrillsclila. This does not
mean that there were no tussock Festllca species in New Zealand prior to 1880. It
simply may not have been used in formal taxonomic description. The EuropeanF.
109

duriuscula on which the New Zealand taxon was based would never have been
described as a 'tussock' as this was a term peculiar to New Zealand. Secondly as New
Zealand F. dllriuscula contained a range of entities (see Appendix 1) the tussock
growth-form would not have been a diagnostic character of the whole group.
Poa cita (known then as Poa caespitosa or Poa australis var laevis) was the
grass most often referred to as 'tussock' (e.g. Buchanan, 1868; J. F. & J. B. Armstrong,
1872; J. B. Armstrong 1880; Buchanan, 1880), however Festllca species occurred with
Poa Gita on the Canterbury Plains and Banks Peninsula (J. F. Armstrong, 1870; J. B.
Armstrong, 1880). That the two species were of similar abundance is indicated by J. B.
Armstrong's (1880) description of the vegetation of the Canterbury Plains and foothills
to 2000 feet: "Grasses form here the principal part of the vegetation ... The most
abundant grasses are the tussockgrass, Poa caespitosa etc., an undescribed species of
fescue usually referred to Festllca durillscllia Linn., by most New Zealand collectors ..
. The vegetation of the downs does not differ materially from that of the plain."
In the species list appended to his report, Armstrong lists both P. caespitosa
and F. sp (F. duriuscula Hook. f. non Linn.) as abundant in the lowland and montane
zones. A later report by Laing in 1918 identifies the abundant species of Festllca on
Banks Peninsula, referred to F. dwillscliia by the Armstrongs, as F. novae-zelandiae.
Despite the lack of specific reference to a tussock Festllca in the early botanical
literature, there is no reason why F. novae-zelandiae as it is today was not already
present in the flora prior to European settlement. Petrie noted in 1895 that the common
Festllca, then still referred to F. dlllillscllla, was being confounded by some botanical
workers and most settlers with Poa Gita. This would suggest that the common Festllca
was also a tussock. In a situation analogous to manuka and kanuka, Festuca novae
zelandiae appears to have been regularly lumped with P. cita during the early decades
of New Zealand botany.
110

5.1.2 Variation in present-day New Zealand tussock Festuca.
Over half of New Zealand's grass genera, including Festuca, are cosmopolitan or
tropical, however the majority of species are endemic. This pattern of generic
relationship to world floras and specific endemism is apparent in many other New
Zealand genera (e.g. Epilobiu11l and Ramlllcllllls) and is usually taken to indicate recent,
rapid evolution (Raven, 1973).
Some New Zealand grass genera also show a high degree of interspecific
fertility and there are uniform chromosome numbers in some large genera such as
Chionochloa (Connor, 1991) and Poa (Edgar, 1986). This may indicate not only recent
radiation but also the potential importance of interspecific recombination of genetic
material (Raven, 1973).
The frequent changes in habitat conditions and consequent vegetation migration
that has characterised the recent geological history of New Zealand may have been a
factor in the evolution of only partly genetically isolated ecologically-differentiated
biotypes within certain genera. Limited gene-flow between such entities may have been
important in the adjustment to glacial cycles, as recombinants might be able to respond
to altered conditions more rapidly than genetically isolated taxa (Anderson & Stebbins,
1954). Ogden (1989) has suggested that limited gene-flow between ecologically distinct
taxa contributed to the survival of certain tree species during Pleistocene oscillations.
Such groups of taxa where the number and characteristics of differentiated entities
have varied through time are often best regarded as 'coenospecies' sensu Clausen et al.,
(1939, 1940) and Fisher (1965) .
. Festuca is a large genus; world-wide it contains about 500 species. However the
genus is represented in New Zealand by relatively few species; Cheeseman (1925)
described seven and Druce (1989) listed five formally described species and four
informal ta.'{a. Despite being a cosmopolitan genus, Festllca holds to the pattern
described above, of endemism at the species level. All of the New Zealand species of
Fesmca, except F. contracta which has a southern circumpolar distribution, are endemic
to the New Zealand Botanical Region.
In northern hemisphere Festllca, specific delineation is often indistinct and
considerable subspecific variation has been described in some taxa (Stace, 1989;
Wilkinson & Stace, 1991). Likewise New Zealand Festzlca appears to contain variable
species with indistinct boundaries. F. novae-zelandiae is the most widespread
indigenous Festllca and exhibits both of these features.
F. novae-zelandiae is closely related to and often difficult to distinguish from
Festzlca matthewsii Chees.; as detailed in Appendix 1 these two species were initially
both described as varieties of F. ovina. F. Ilovae-zelandiae and F. matthewsii
undoubtedly arose from a common genetic stock during the climatic fluctuations of the
111

Pleistocene. Due to ecological specialisation it is likely that they evolved allopatrically (Connor,
1968).
112
In present-day New Zealand F. matthewsii is a tussock of higher rainfall areas of South Island,
occurring in the sUbalpine to alpine zone east of the Southern Alps (Plate 3) (Connor, 1961,1964,
1965).
Both F. novae-zelandiae and F. matthewsii are hexaploid (2n = 6x = 42) and represent the
lowest ploidy level found so far in the New Zealand species of Festuca (Beuzenberg & Hair, 1983).
The two species can be easily crossed to produce fertile hybrids (Connor, 1968) and are
morphologically very similar in habit and leaf anatomy (Connor, 1960). Both species are out-crossing
andF. novae-zelandiae has been shown to be virtually self-incompatible (Connor & Cook, 1955;
Connor, 1960). The distributional boundary between F. novae-zelandiae and F. matthewsii is often
indistinct, particularly in the mountains of central South Island.
It has often been suggested that the ecological amplitude of widespread species is, at least in
part, due to their variability and ability to form races adapted to local conditions (Van Valen, 1965;
McMillan, 1967). F. novae-zelandiae is widespread today and Cockayne and Allan (1934) made the
comment that the name F. novae-zelandiae was applied to a "very complex group of jordanons
(variants) and hybrids that had not been satisfactorily analyzed".
The contraction and expansion in range of F. novae-zelandiae over the last 100,000 years - i.e. a
glacial-interglacial cycle - is not dissimilar to range changes that must have occurred with the climatic
fluctuations that have characterised the last 2 million years. This type of process, occurring with
repeated climatic changes and over thousands of years, is fertile ground for rapid evolutionary change
and speciation (Grant, 1971). Similarly the range expansion and invasion of newly-formed sites by
previously small populations, as has happened with F. novae-zelandiae in the last 1000 years, is also an
evolutionary opportunity.
There is evidence that differentiation within F. Ilovae-zelandiae has occurred both in pre
human and recent time-frames. A distinct high altitude form of F. novae-zelandiae has been
recognised that is most probably of pre-human origin and occurs above timberline on the drier
eastern mountains (Plate 4). It is fully compatible with 10wlandF. novae-zelandiae but differs
morphologically (Connor, 1960, 1968; Connor & Edgar, 1986) and physiologically (Scott, 1970).
Espie (1987) found differences in nutrient uptake among populations of F. novae-zelandiae in
a controlled fertilizer experiment. The populations originated from induced grasslands in the Cass
area on soils of different ages. The differences that Espie found could represent adaptation to local
nutrient availability that has evolved within the 500 years those sites have been without forest.

Plat e 3 : Fn{l/((/ Illllifi/('\\ \11 IU""l)l' k " "1.,ltlcl ~'d til "u h.tipil1 l' \\.:~I'I. lt\()(l ,II thl' ,\rtllllr"
p,,\\ '> tuLl\ "ill.' t \ 1'\) <Ill {ill \1.1111 1> 1\ ,II.'
Plat e -t : III\..!.h tlllilldl' .', I, ;, I, i(
R i \ I.' r "t U d \ "i ll' ( I ~ 1 ( () )
113
_ _ J

The aim of this section is to investigate the degree of differentiation that has
occurred within F. llovae-zelalldiae with reference to its pre-human and recent
distribution and examine the relationship between F. Ilovae-zelalldiae and F. matthewsii
.to see what it reveals about the evolutionary history of this group.
In the following section I will be comparing the vegetation association,
morphology, biochemistry and phenology of three taxa, treating "high altitude" F.
llovae-zelandiae as a separate taxon alongside F. novae-zelandiae s.s. and F. matthewsii.
This does not imply that I consider it to be a distinct species or subspecies but rather
that it represents variation on a lower taxonomic scale than that between F. novae
zelalldiae and F. matthewsii.
114

5.2 VEGETATION COMPOSITION AT SITES CONTAINING TUSSOCK FESTUCA.
5.2.1 Methods
Forty-two sites containing tussock Festllca were selected in mid-Canterbury to cover a
range of environments from the Main Divide of the Southern Alps to the Canterbury
Plains (see Fig. 2.1, Chapter 2 for site locations). All sites were at least two kilometres
apart.
Slope (measured with an Abney level), aspect (compass reading), altitude (read
from a topographic map) and tussock density were recorded at each site. At each site
four 2 m x 2 m plots were randomly located. Within each plot the abundance of all
vascular species present was recorded in the following cover classes: 1 = < 1 % total
cover within a plot; 2 = 1 - 5% cover; 3 = 6 - 10% cover; 4 = 11 - 25% cover; 5 = 26-
50% cover; 6 = 51- 75% cover and 7 = 76 - 100% cover. For analysis, species were
assigned the median value of the cover class (i.e. 1 = 0.5%, 2 = 3%, 3 = 8%, 4 = 18%, 5
= 38%, 6 = 63%, and 7 = 88%) and values from the four plots averaged for each site.
The total percent cover of vascular vegetation, cryptogams, litter and rocks or stones
was estimated to the nearest 5%.
The mean annual rainfall of each site was obtained either from a nearby
climate station (New Zealand Meteorological Service, 1982) or estimated from a rainfall
isohyet map of the area (Greenland, 1977). Mean annual minimum, maximum and
mean temperatures were estimated for each site using the regression equations of
Norton (1985).
One-way analysis of variance was used to test for significant differences
between sites containing F. Ilovae-zelandiae s.s., "high altitude" F. novae-zelandiae and
F. matthewsii in environmental factors and attributes of the vegetation.
Detrended Correspondance Analysis as implemented by CANOCO (Ter Braak,
1990) was used to investigate trends in the vegetation of the 42 sites. Measured
environmental factors were correlated with the first two axes from the ordination of
sites by species.
Simultaneous classification of the 42 sites was performed using TWINS PAN
(two-way indicator species analysis), a polythetic divisive technique (Hill, 1979) that
classifies sites into broadly similar vegetation types based on the presence and
abundance of species. Default options were used in both analyses.
115

5.2.2 Results
Relatively unmodified sites containing tussock Festllca were typically stream and river
terraces, fans, open exposed areas and stabilised margins of debris slopes regardless of
rainfall, altitude or taxon. Tussock Festllca, usually F. llovae-zelalldiae S.S. also
occurred on hill slopes and older surfaces where the forest cover had been removed.
The 42 selected sites ranged in altitude from 65 m asl to 1420 m and in rainfall
from 690 mm to 6000 mm per annum. Sixteen sites contained popUlations of F.
matthewsii, six contained plants referable to "high altitude" F. llovae-zelalldiae and the
remaining 20 sites contained F. llovae-zelalldiae S.S. Seven populations (DIS, GRE,
HLF, LMR, SVY, UHR and WSH), while being assigned to either F. llovae-zelalldiae
S.S. or F. matthewsii, possessed morphological attributes of both species.
Sites at which the three taxa occurred differed significantly in altitude, annual
rainfall and temperature (Table 5.1). Sites containing F. llovae-zelalldiae S.S. had the
lowest mean altitude and rainfall. Sites containing "high altitude" F. llovae-zelalldiae
had the highest mean altitude but were also dry and sites containing F. matthewsii were
intermediate in altitude but had the highest mean rainfall.
Mean vegetation cover per site ranged from 42% to 96.5% and was significantly
lower at sites containing F. matthewsii and the "high altitude" form of F. novae
zelalldiae than for sites containing F. llovae-zelalldiae s.s. (Table 5.1).
Total cover abundance of adventive species per site ranged from 0 to 112%
(values in excess of 100% are due to multiple layers within the vegetation) and differed
significantly between taxonomic groups with F. novae-zelandiae sites having the
highest mean adventive cover abundance and sites containing the "high altitude" form
of F. Ilovae-zelandiae the lowest.
Mean tussock density varied from 0.31 to 10.2 m-1 and did not differ
significantly between the three taxonomic groups. There was also no significant
difference between the three taxa in the site attributes of slope, aspect, and percent of
ground covered by cryptogams or litter.
A total of 214 species was recorded from the 42 sites; however, 66 of these
represented single plot occurrences or were of very low cover value (typically < 1 % in
two or three plots) at single sites. Ordination was performed on the remaining 148
species with the exclusion of F. matthewsii and F. novae-zelalldiae s.l. so as not to
force differentiation between sites.
There was a wide range of vegetation types between the 42 sites and as a result
the first two axes of the DCA ordination accounted for only 16% of the variation in
the species data. However, the spread of sites against axes 1 and 2 (Fig. 5.1)
corresponded reasonably well to taxonomic groups. The first axis separated sites
containing popUlations of "high altitude" F. llovae-zelalldiae were separated from sites
containing F. novae-zelandiae s.s. The second axis separated F. novae-zelandiae
116

117
Table 5.1: Attribute means of 42 sites containing populations of F. novae-zelandiae S.s., "high
altitude" F. novae-zelandiae and F. matthewsii and results from one-way analyses of variances.
Different superscripts indicate a significant difference between means in a row. NS = not
significant.
Attribute F.novae-zel. high alt. F. matthewsii F P<
No. of sites sampled 20 6 16
% Adventive cover 38.7b 1.23a 15.9a 6.26 0.01
Altitude (m) 738a 1278e 907b 16.1 0.001
Annual Rainfall (mm) 163Qa 1790a 4750b 42.0 0.001
Aspect (degs. from N) 47.2 70.0 50.2 0.38 NS
% Bare Ground 1.6ab 3.5b 0.2a 4.08 0.05
% Cryptogamic cover 9.3 4.6 9.2 0.66 NS
% Litter ground cover 3.0 3.2 3.8 0.22 NS
Mean maximum temp. 13. Ie 9.71a 11.8b 18.5 0.001
Mean temperature 8.18e 5.47a 7.45b 16.5 0.001
Mean minimum temp. 3.26b 1.20a 3.07b 13.9 0.001
Slope (degrees) 2.61 4.17 5.39 1.13 NS
% Stony/rocky ground 4.9a 24b 21b 7.77 0.01
Vegetation cover (%) 81b 65a 66a 6.99 0.01
Tussock density (m-2) 3.87 1.95 3.67 1.27 NS
Table 5.2: Pearson coefficients for correlations between site attributes and the first two ordination
axes from a Detrended Correspondance Analysis of 42 sites containing tussock Festuca using the
cover abundances of 146 species.
Variable AXIS 1 p< AXIS 2 p<
% Adventive cover -0.80 0.001 0.22 NS
Altitude 0.79 0.001 -0.06 NS
Annual rainfall 0.24 NS -0.71 0.001
Aspect 0.30 NS 0.10 NS
Mean max. temperature -0.80 0.001 0.11 NS
Mean min. temperature -0.72 0.001 -0.12 NS
Mean temperature -0.79 0.001 0.02 NS
Slope 0.43 0.01 -0.13 NS
Total vegetation cover -0.44 0.01 0.37 0.05

s.l. sites from F. matthewsii sites. Populations of tussocks referred to one of the two
species but possessing some morphological characters of the other, occurred in the area
of overlap in vegetation type between the two species.
The spread of sites along the first ordination axis was most highly correlated
with variation in mean maximum temperature and the cover abundance of adventive
species at each site (Table 5.2, Fig. 5.1). Variation in the altitude of sites was also
highly correlated with this axis as were mean and minimum temperatures. The second
ordination axis was most highly correlated with variation in annual rainfall.
TWINSP AN was performed using all 210 species in the dataset. After inspection
of the results the first three levels of divisions were accepted giving a total of eight
groups (Fig. 5.2). The first division appeared to be primarily related to the abundance
of adventive species; Trifolium l'epens and high values for Anthoxanthul7l odoratul1l
characterised one side of the division and two indigenous species (Celmisia spectabilis
and Lycopodium fastigatlllll) characterised the other.
All of the 6 sites containing "high altitude" F. novae-zelandiae occurred on the
side of the primary division associated with indigenous species (Fig. 5.2). Sixteen of the
20 F. novae-zelandiae s.s. sites occurred on the side of the primary division associated
with adventive species. The 16 F. matthewsii sites were distributed on either side of the
primary division.
Groups 1 and 2 were distinguished from groups 3 and 4 by the presence of
Muehlenbechia axillmis, a common species of drier, stony sites such as river terraces
and floodplains. High values ofAgrostis capillal'is, an abundant adventive grass, were
associated with groups 3 and 4.
The seven sites in group 1 (Fig. 5.2) were all F. novae-zelandiae sites on river
terraces, fans and hill slopes and five of the seven were sites that had probably
supported forest prior to the arrival of humans in New Zealand. Group 2 sites occurred
mainly on fans and river terraces. All of the sites in group 1 and group 2 were
characterised by abundant adventive grasses and included the lowest rainfall sites in the
dataset. The F. novae-zelandiae sites in these groups represented typical short tussock
grassland in montane mid-Canterbury.
Sites classified into group 3 were typically stony river terraces in mainly higher
rainfall environments which contained relatively high amounts of adventive species.
Group 4 consisted entirely of F. matthewsii sites at medium altitudes that possessed
some adventive species.
Groups 5 and 6 were distinguished from groups 7 and 8 by the presence of
Deyelcda avenoides, an indigenous grass of eastern, montane, short-tussock grassland
and stony sites, and the absence of Chionochloa pal/ens, an indigenous alpine grass
more common in higher rainfall portions of the study area.
Groups 5 and 6 contained the four remaining F. novae-zelandiae sites and all
of the "high altitude" F. Ilovae-zelalldiae sites. The F. Ilovae-zelandiae sites on this side
118

0 0 <0
~* Q..
(/) (/) 0
0 0 to
~* I
...J
~* ~
(/) Q.. (9
0 0 ffi* a:
b 0 0 > "<t
~* O~ a: ~ :;: (/) (f5* w m 0 I-
:;: o c fa I ::::> :;: .....-.. u. I- ..J 0 '#. ...J
~ ..J o:::t I I « ~ (/) 0)
~ « u. 0 ---z 0 ~a:
~ frl[ C'),-
<t: h « 0 a: ~ 0 0 a: 0 ~~ 0 III 0 I'! 0 0 I- [] Iu. 0 1 (!l
w ...J W 0- a: Q..(/) (/) a: :;: Do I I :2: a: ...J t1 0 w 5 ~> ~ 0
a: I- (\J z ~ (!la: ~ :s ~ ~~o I I o fi: :2:
~ 0
::.::: ...J Z <t: u. II I 0 I g 0
fi: 0 ::.::: a: ::.::: I I CD
...J
~ 0 a:
I <t: ~ ,- -- 0
0 0 0 0 0 0 0 0 0 0 to 0 to 0 to 0 to 0 to "<t "<t C') C') (\J (\J
(%8'9) G \f00
Figure 5,1: Axes 1 and 2 from an ordination of 42 sites containing tussock Festllca
using cover abundance values for 146 species,
119
en ~ Q) .c 15 E U.
0
N c u. .....: CO .c 0> .c
* Q) co
"0 c co Q) N
I Q) co > 0 C
u.:
I

Anthoxanthum odoratum 3
Trifolium repens 1
Muehlenbe axillaris
ckia 2
Oreomyrrh is
l~~ 1 2
LYN ~BR
KRV ANT
SLF CAH
CBC KLO
LHR RIV
TOR CFL
RED BNK
Agrostis capillaris 3
Coprosma rugosa 1
I I 3 4
~CAR ~EC
..gRV "'PEG ~GRE ~APS
~IS
LMR ~UHR
CRY
CVS ~SVY
120
Celmisia spectabilis 1
Lycopodium fasigatum 1
Deyeuxia avenoides 1 Chionochloa pall ens 1
Chionochloa Aciphylla macra 1 aurea
I I 5 6
MTS CSS
HLF OMTL
WSH °PPS oMTH °wss
oBRO
OCSA
1
I 7
~GPS
~OTR
~UBR
~WRV
~VH
~ntho xanthum ratum 1 odo
I 8
~MBV
~ F. maHhewsii, 0 "high altitude" F. n-z., rest F.novae-zelandiae s.s.
Figure 5.2 : TWINSPAN classification of sites containing tussock F estuca.
Numbers after indicator species are abundance: 1=<27., 2=2-<57., 3=5-<107..

of the primary division represent the highest altitude F. Ilovae-zelalldiae sites in the
dataset. Group 6 contained the highest altitude sites of all sites surveyed.
Groups 7 and 8 consisted of the remainder of the F. l7latthewsii sites. These
sites represent open alpine grassland / shrub land communities on stony slopes in a high
rainfall environment on or close to the Main Divide.
121

5.2.3 Discussion
Trends in the vegetation composition of the sites sampled reflected environmental
gradients in altitude, rainfall and temperature associated with the large-scale
topography of the study area. However the effect of human-induced modification and
the invasion of adventive species was also important in determining the vegetation of
sites.
The recent changes that have occurred in grassland communities, particularly at
lower altitudes, limit the amount of information that can be extracted from an analysis
of the vegetation. The invasion of adventive species has decreased vegetation diversity
among sites at lower altitudes and in settled parts of the study area. The longevity of
genetic individuals of F. novae-zelalldiae and their ability to adjust plastically to
environmental change through time (section 4.4) means that the present vegetation
composition of a site does not necessarily indicate the conditions that favoured F.
novae-zelandiae establishment. When the plants at a site established, the vegetation of
that site may have been different and their subsequent survival may be due to
plasticity in growth responses rather than adaptation to that particular vegetation type.
However despite the strong influence of adventive species on the separation of
sites by ordination, the observed ecological separation of F. l1latthewsii and F. novae
zelandiae is supported by differences in the environment and the vegetation in which
they occur. The association between apparently intermediate populations and shared
vegetation types strongly suggests that the boundary between F. l1latthewsii and F.
novae-zelandiae is not clear cut but is affected by environmental factors.
Populations referred to "high altitude" F. novae-zelalldiae were also relatively
distinct in terms of vegetation from the remaining F. novae-zelalldiae populations
sampled. There appears to be more overlap in vegetation composition between F.
l1latthewsii and F. novae-zelandiae sites than there is between sites containing "high
altitude" F. novae-zelandiae and F. Ilovae-zelalldiae S.S. This would support the
hypothesis that this "high altitude" form represents an ecologically distinct entity within
F. llovae-zelandiae.
122

123
5.3 MORPHOLOGICAL VARIATION
5.3.1 Methods
(a) Variation among 42 populations in 40 characters.
In the summer of 1990/91 tussock populations at each of the 42 sites in section 5.2 were sampled. At
each site, ten reproductive tussocks were randomly selected and a clump of at least five tillers with at
least one culm was collected from each individual. The sites covered all three of the taxonomic
groups discussed in section 5.1. Sixteen contained populations of F. mattlzewsii, six contained plants
resembling the "high altitude" form of F. novae-zelandiae and the remaining 20 sites were F. novae
zelandiae sensu stricto. Seven populations (DIS, GRE, HLF, LMR, SVY, UHR and WSH), while
being assigned to either F. novae-zelandiae s.s. or F. matthewsii, possessed morphological attributes
of both species. Representative material of all populations was deposited in the University of
Canterbury herbarium. Accession numbers are tabulated in Appendix 2.
The material from each of the 420 individuals was examined for 40 quantitative
morphological characters covering both vegetative and floral characters (Table 5.3). Individual values
for each character were then averaged to give a mean value for the population. The material was
initially examined fresh, then pressed and dried for detailed morphological examination.
Characters of the sheath and lamina were measured on the oldest intact green leaf on a
randomly selected tiller. Lamina adaxial hair length was measured immediately above the ligule. The
structures referred to as 'hairs' ranged from stiffly strigose hairs and acute 'prickle teeth' to rounded
'dewy' structures. Lamina width and abaxial hair length and density were measured at the mid-point
between ligule and lamina apex.
All remaining characters were measured on the longest culm present. Width, hair length and
hair density on the upper (3rd) culm internode were measured 1 cm below the first inflorescence
node. Hair length and density on the inflorescence rachis, branch and pedicel were measured on the
faces as opposed to the edges (these structure are variously biplanar, plano-convex or trigonous).
Characters of the pedicel and spikelet were measured on the penultimate spikelet of the second
inflorescence branch, the first branch being the basal branch. All floret characters were measured on
the second floret on this spikelet.
All measures of hair density were 0.06 mm-2. Hair length and density were measured under
40x magnification using a gradicule. Lamina, culm and rachis width and the length of glumes, palea,
lemma and awn were measured under lOx magnification using a gradicule.
One-way analysis of variance was used to test each character for significant differences
between the three taxa. Principal Components Analysis as implemented by CANOCO and using
default options, was used to investigate the relationships between populations and between
morphology and environmental gradients. In addition, the 40 morphological characters were used as
pseudo-environmental variables in order to discern which characters were most strongly correlated
with the ordination axes. Likewise the first two ordination axes of a Detrended Correspondance
Analysis of the same 42 sites by vegetation composition (section 5.2) were included in the principal

124
Table 5.3: Character means for F. novae-zelandiae s.s., "high altitude" F. novae-zelandiae and F.
matthewsii with results from one-way ANOVA tests. Superscripts indicate significant differences
using LSD tests. NS = not significant.
CHARACTER F. novae-zel. "high altitude" F. matthewsii F p<
Pops./plants sampled 20/200 6/60 16/160
Sheath length (cm) 8.95 7.90 7.90 2.67 NS
Lamina:
length (cm) 21.8b 17.9a 19.4a 5.79 0.01
width (mm) 0.54a 0.58ab 0.62b 12.6 0.001
adaxial hair length (mm) 0.09 0.09 0.09 0.14 NS
abaxial hair length (mm) 0.04b 0.04b O.OOa 81.5 0.001
" hair density (0.06mm-2) 2.27b 1.37b 0.14a 29.4 0.001
Auricle length (mm) 0.57 0.65 0.67 2.29 NS
Ligule length (mm) 0.39a 0.50b 0.54b 10.3 0.001
Culm:
lower sheath length (cm) 9.22b 8.09a 8.24a 4.75 0.05
upper sheath length (cm) 12.1c 9.54a 11.3b 7.31 0.01
1st internode length (cm) 2.18a 1.79a 3.30b 11.7 0.001
2nd internode length (cm) 5.11a 4.25a 6.71b 6.32 0.01
3rd internode length (cm) 30.5b 21.5a 27.2ab 4.92 0.05
3rd internode width (mm) 0.69 0.65 0.68 0.28 NS
3rd int. hair length (mm) 0.04b 0.04b O.OOa 63.8 0.001
" hair density (0.06mm-2) 5.67b 4.58b 0.53a 46.2 0.001
Inflorescence:
length (cm) 12.8b 8.98a 12.6b 12.7 0.001
number of nodes 7.36b 6.48a 6.89a 6.47 0.01
number of spikelets 14.3b 10.1a 13.1b 6.25 0.01
1st internode length (cm) 4.37b 2.98a 4.04b 14.8 0.001
Rachis:
width (mm) 0.58 0.58 0.62 1.33 NS
hair length (mm) 0.04b 0.05b O.01a 38.4 0.001
hair density 6.58b 5.33b 1.09a 42.4 0.001
1st inflorescence branch:
length (cm) 5.46b 3.60a 6.52c 22.0 0.001
angle (degrees) 15.5a 10.3a 50.6b 21.2 0.001
hair length (mm) 0.05b 0.05b 0.02a 34.2 0.001
hair density (0.06mm-2) 5.70b 4.94b 1.79a 28.1 0.001
number of spike lets 3.93b 2.71a 4.10b 8.82 0.001
dist. 1st spikelet (cm) 2.09b 1.35a 3.07c 29.4 0.001

125
Table 5.3: continued.
CHARACTER F. novae-zel. "high altitude" F. matthewsii F p<
Pedicel :
length (mm) 2.10a 2.14a 3.37b 22.6 0.001
hair length (mm) 0.04b 0.04b 0.02a 18.3 0.001
hair density (0.06mm-2) 4.42b 3.97b 1.16a 13.3 0.001
Spikelet:
length (mm) 10.la 10.7ab 1l.lb 8.58 0.001
number of florets 4.77 4.62 4.71 0.19 NS
1st glume length (mm) 5.06a 5.14a 5.40b 11.1 0.001
2nd glume length (mm) 3.65a 3.79a 4.06b 13.3 0.001
Floret:
awn length (mm) 0.85a 0.96ab 1.23b 5.04 0.05
palea length (mm) 5.54a 5.88b 6.12b 15.4 0.001
lemma length (mm) 5.55a 5.75a 6.12b 18.3 0.001
lodicule length (mm) 0.84a 0.95b 0.95b 7.71 0.01
Table 5.4: Attributes of eight sites in the upper Waimakariri River. Map references are for NZMS
260 series. Rain = annual rainfall estimated from isohyets.
Site Dist up Location Alt. Rain Other important species valley. (m) (mm)
Riversdale Okm K34076100 540 1500 Discaria toumatou. Coprosma
petriei, adventive grasses
Klondike 2km K34947985 635 2000 Discaria toumatou. Hieracium
pilosella adventive grasses
Anticrow 4km K34900991 680 2500 adventive grasses, Trifolium spp
Muehlenbeckia axillaris
Greenlaw 5km K33852007 740 3750 Raoulia spp, Pernettya
macrostigma, adventive grasses
Waimakariri 6km K33841028 770 4000 adventive grasses, Poa colensoi,
Muehlenbeckia axillaris
Carrington 7km K33835042 800 4500 Raoulia spp, Pernettya
macrostigma, Coriaria plumosa
Kilmarnock 8km K33818042 880 5000 Raoulia spp, adventive grasses,
Muehlenbeckia axillaris
White River 9km K33810030 1050 5500 Poa colensoi, Blechnum penna-
marina, Muehlenbeckia axillaris

126
components analysis as pseudo-environmental variables in order to test the degree of concurrence
between the two ordinations.
The role of environmental gradients in altitude, rainfall and temperature in the observed
patterns for particular characters was examined using stepwise linear regression. The methods used
to obtain rainfall and temperature data are detailed in section 5.2.
(b) Variation at the boundary between F. novae-zelandiae and F. matthewsii.
The nature of the boundary between F. matthewsii and F. novae-zelandiae in the upper Waimakariri
catchment was examined. The Waimakariri River is a braided river system and changes in the course
of channels leave isolated river terraces which are colonised by a range of species including Festllca
species. At lower altitudes, roughly below 700 m, plants clearly belong to F. llovae-zelalldiae s.s .. In
the head waters of the Waimakariri above about 900 m, and in a tributary, White River, plants were
clearly referable to F. matthewsii. However populations at intermediate altitudes in the river valley
display varying degrees of affinity to each of the two species.
Six populations from the sample of 42 populations used in (a) occurred in a sequence from
540 m to 1050 m altitude in the Waimakariri and White Rivers. The morphological data described in
(a) was used to investigate the nature of the boundary between F. novae-zelandiae and F. matthewsii
along this sequence. Two additional populations in the Waimakariri and White River valleys,
Waimakariri at 770 m and Kilmarnock at 880 m were sampled in the same manner in order to
increase the representation of populations in the transition zone. Distances between populations
decreased with increasing altitude, however all populations were at least 1 kilometre apart.
The sequence examined therefore consisted of eight populations in sites ranging in altitude
from 540 m to 1050 m in comparable habitats but under increasing annual rainfalls at higher altitudes
(Table 5.4). Representative material of all populations was deposited in the University of Canterbury
herbarium. Accession numbers are tabulated in Appendix 2.
Mean values for lamina length, lamina abaxial hair density, culm height and upper culm
internode hair density were calculated for each site. In addition the proportion of individuals at each
site with glabrous leaves and culms was determined.
(c) Attributes of 18 populations in cultivation.
Plants from 18 of the 42 populations were grown on under uniform conditions in the University
shadehouse for a year. The plants were in pots filled with standard potting mix. They were watered
regularly and were exposed to full sunlight.
Twelve of these populations had already been selected for cultivation to provide material for
isozyme analysis (section 5.5) and material consisted of at least 10 individuals per population.
Logistical constraints prevented the cultivation of a similar amount of material from all 42
populations so a subsample of six additional populations was selected and at least two plants brought
into cultivation from each population. The additional material consisted of two populations of "high
altitude" F. novae-zelalldiae, two F. matthewsii populations and two populations situated along the

127
sequence of sites in the upper Waimakariri. After a year in cultivation 128 healthy individuals were
remeasured for a subset of vegetative characters. No floral characters were remeasured as not all of
the material flowered in cultivation.
Paired T-tests were used to compare initial measurements with measurements taken after a
year in cultivation.

128
53.2 Results
(a) Variation among 42 populations for 40 characters.
The 40 characters measured differed in the amount of variation present. Some characters such as
lamina adaxial hair length remained virtually static for all populations while others showed substantial
among-population variation. One-way analysis of variance found significant differences between the
three taxa for 34 of the 40 characters (Table 5.3).
F. matthewsii and F. novae-zelandiae s.s. differed significantly in 28 characters. F. matthewsii
and "high altitude" F. Ilovae-zelandiae differed significantly in 24 characters. "High altitude" F. novae
zelandiae differed significantly from F. novae-zelandiae s.s. in 15 characters, most of which were
associated with the size or numbers of vegetative or reproductive parts.
Principal components analysis using the 40 morphological characters produced a good
separation of the 42 sites. The first ordination axis accounted for 87% of the total variation present
within the data and was strongly associated with inflorescence branching angle and overall scabridity
(hair densities) (Fig. 5.3, Table 5.5). F. novae-zelandiae s.l. and F. matthewsii were most distinct with
reference to this axis. One population of F. novae-zelandiae s.s. (HLF) occurred on the far right of
the ordination with the F. matthewsii populations. This was due to the very wide branching angles
among individuals in this population. The mean branching angle for the population was 95.7 ± 37.00
which was the highest mean value recorded.
The second principal components axis accounted for a further 8% of the variation in the
data and was related to factors of overall size which included length of leaf blade and height of culm.
F. novae-zelandiae s.s. and "high altitude" F. novae-zelandiae were separated mainly with reference to
this second axis (Fig. 5.3, Table 5.5).
Altitude, temperature and rainfall were strongly correlated with overall morphological
trends (Fig. 5.4, Table 5.5). Rainfall was associated most strongly with the first axis and therefore with
the separation of F. novae-zelandiae and F. l11atthewsii. Altitude and maximum annual temperature
were most strongly associated with the second axis and therefore with the separation of F. novae
zelandiae s.s. and "high altitude" F. novae-zelandiae.
The first two axes from an ordination of the 42 sites by vegetation composition (section 5.2)
were significantly related to the ordination of the same sites by morphology (Fig. 5.4). The first
morphological axis was significantly correlated with the second vegetation axis and the second
morphological axis was significantly correlated with the first vegetation axis (Table 5.5).
Stepwise regression was used to develop explanatory models for 5 characters; lamina length,
lamina abaxial hair density (used as a measure of lamina scabridity), branch angle, 3rd culm
internode length and 3rd culm internode hair density (used as a measure of culm scabridity). These
characters were selected to represent the general trends in size and scabridity identified by principal
components analysis.
Variation among the sites in maximum annual temperature explained 42% and 35%
respectively of the variation in lamina length and 3rd culm internode length among all 42 populations
(Table 5.6a). When populations of F. matthewsii were omitted from the analysis the amount of

o ~-------------------------'-----------------rg
o g
I
a: co ...J o
<3 ~ I z
u.CO ~I I
en a.. o fa ::2: o
fir§l 3 1
I «! al
o w o o
a: <3 o
en en
~
en a.. <.9 o
8 C\J
o
() 0..
.~ Q) .c ~ E u..
o
N c u.. Q) "0 ::J +-' :.j:j
CO .c 0)
.c
* Q) CO "0 C CO Q) N
I Q) CO > o c
u..
I
129
Figure 5.3: Axes 1 and 2 from a Principal Components Ordination of 42 populations of tussock
Festuca by 40 morphological characters. The direction and magnitude of trends in selected
characters are superimposed. LHD = lamina abaxial hair density, LL = lamina length, CIL = 3rd
culm internode length, BA = 1st inflorescence branch angle.
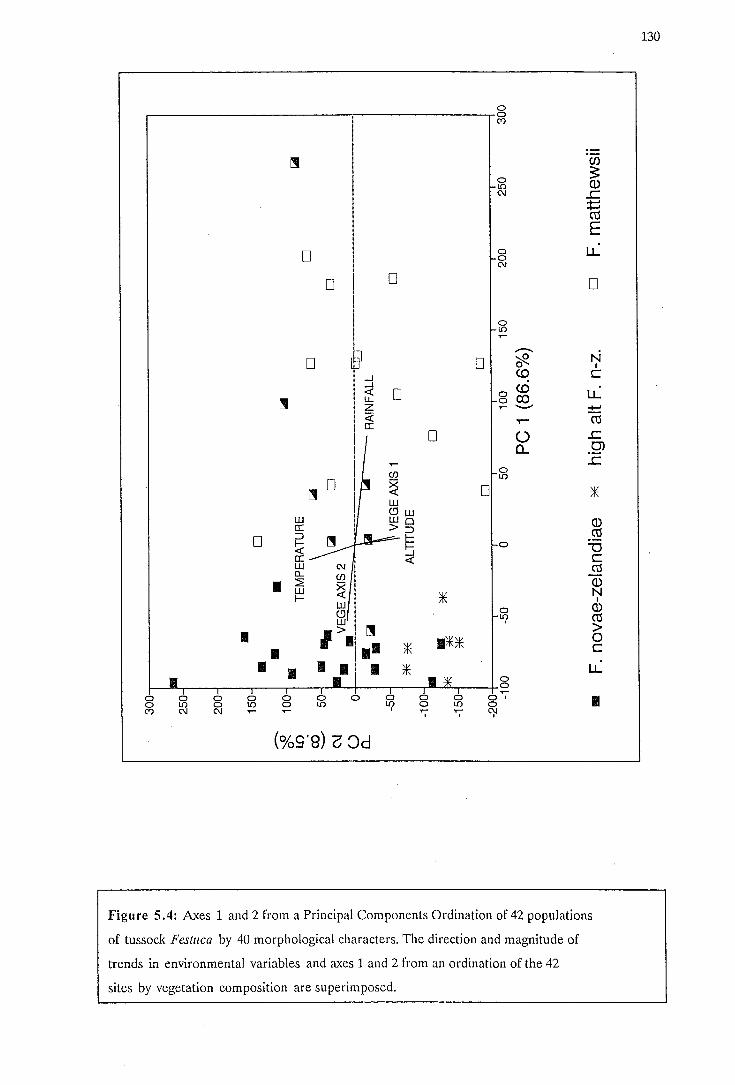
0 0
I C') I
I C/)
I 0 ~
I La ill C\J ..c
=E
I
E
0 0 LL 0 C\J
0 0 0 , I I
I 0 La
....--. 0 ~ 0 ?f2- N
I , <0 C ! ...J ...J <0
I -< 0 0 LL ~
u.. 0 CO z "-" +-'
I ~ ~ CU
I 0 () ..c
0... 0')
..c
I CJ) 0 La
~ 0 ~ 0 * ,
I W (!)w
W Wo ill 0:: >::J CU 0 ::J I'!I l-
t;: ~ 0 U 0::
I -< c
W C\J CU a... CJ) ill I ~
~ W N l- i * I
W 0 ill (!)! La CU wi I
I ,>ll'!l > I, I 1** 0
I II * c I I Ii I * LL
I 0 0 .....
0 0 0 0 0 0 0 0 0 0 o· I 0 La 0 La 0 La La 0 La 0 C') C\J C\J I ..... '7 C\J
I I
(%9'8) C 8d
Figure 5,4: Axes 1 and 2 from a Principal Components Ordination of 42 populations
of tussock Festzlca by 40 morphological characters, The direction and magnitude of
trends in environmental variables and a'{es 1 and 2 from an ordination of the 42
sites by vegetation composition are superimposed.
130

131
Table 5.5: Pearsons coefficients from correlations of Axes 1 and 2 of a PCA ordination of 42
tussock Festuca populations by morphology with (a) morphological characters, (b) environmental
variables and (c) Axes 1 and 2 from a DCA ordination of the 42 sites by species composition.
VARIABLE AXIS 1 p< AXIS 2 p<
(a)
Lamina length -0.29 NS 0.73 0.001
Lamina abaxial hair density -0.56 0.001 0.43 0.01
3rd culm internode length -0.10 NS 0.95 0.001
3rd culm int. hair density -0.75 0.001 0.26 NS
upper culm sheath length -0.68 0.001 0.76 0.001
Spikelets per inflorescence 0.30 NS 0.76 0.001
1st inflor. branch angle 1.00 0.001 0.02 NS
(b)
Altitude 0.05 NS -0.64 0.001
Annual rainfall 0.76 0.001 -0.19 NS
Mean max. temperature -0.10 NS 0.66 0.001
( c)
Vegetation DCA Axis 1 0.06 NS -0.58 0.001
Vegetation DCA Axis 2 -0.53 0.001 0.11 NS
Table 5.6: Coefficients from step-wise regression of morphological characters on environmental
variables for (a) 42 populations of F. novae-zelandiae s.s., "high altitude" F. novae-zelandiae and
F. matthewsii and (b) as for (a) but excluding the 16 populations of F. matthewsii.
Dependant Variable Constant MaxTmp PPT R2 p<
(a)
Lamina length 5.61 1.22 0.42 0.001
Lamina abax. hair density 2.76 -5x10⁻⁴ 0.53 0.001
1st inflor. branch angle -0.58 0.01 0.56 0.001
3rd culm internode length -1.83 2.46 0.35 0.001
hair density 7.09 -lx10-3 0.62 0.001
(b)
Lamina length 7.14 1.12 0.56 0.001
Lamina abax. hair density 3.51 -9x10⁻⁴ 0.25 0.01
1st inflor. branch angle NS
3rd culm internode length 3.69 2.01 0.29 0.01
hair density NS

132
variance explained increased to 56% for lamina length and decreased to 29% for culm length (Table
5.6b).
Variation in annual rainfall among sites constituted the best correlative for variation in
inflorescence branching angle, lamina and culm scabridity among all 42 populations (Table 5.6a).
Variation in annual rainfall was also an important factor in variation in lamina scabridity when only
populations of F. novae-zelandiae were considered. However no environmental variable was
significantly related to branch angle or culm scabridity (Table 5.6b).
The branching angle of the lowest inflorescence branch appeared to be associated with the
growth of a brown callus between the branch base and the rachis. Smaller calluses were also observed
at the base of upper inflorescence branches. F. matthewsii typically possessed at least a callus at the
lowest inflorescence branch, as did some F. novae-zelandiae individuals with wide branching angles,
for example from the Hallelujah Flat (HLF) population. Cheeseman (1925) mentioned this "curious
brown pulvinate callus" at the junction of the lamina and sheath and the inflorescence branches and
the rachis as a feature of F. matthewsii but it appears to be associated with branching angle regardless
of taxon.
(b) Variation at the boundary between F. llovae-zelandiae and F. matthewsii.
Plants within the eight popUlations studied displayed a range of combinations of characters from F.
matthewsii and F. llovae-zelalldiae. For example plants with long glabrous leaves and short scabrid
culms would occur adjacent to plants with short scabrid leaves and long glabrous culms.
The eight populations formed a cline in lamina and culm scabridity, with increasing numbers
of glabrous individuals in higher altitude populations. This result was not due to these populations
being composed of individuals of both species as culm and leaf scabridity varied independently (Fig.
5.5). Similarly mean values for both lamina and culm internode hair density declined sharply with
increasing altitude (Figs. 5.6 & 5.7).
Mean values for lamina length and culm height formed a more complex pattern. The lower
altitude F. novae-zelandiae populations had the highest values for mean lamina length (Fig. 5.8).
Plants become progressive shorter on average with increasing altitude up to 800 m after which lamina
length appeared to increase slightly.
Lower altitude populations also had the longest culms on average and culm height decreased
with increasing altitude up to 800 m (Fig. 5.9). However the two highest altitude F. matthewsii
populations, Kilmarnock and White River, had culms comparable in length to the lower F. novae
zelandiae populations.
( c) Attributes of 18 populations in cultivation
After one year in cultivation five characters (lamina length, lamina width, lamina abaxial hair length,
lamina abaxial hair density and sheath length) were remeasured for each of 128 plants from 18
popUlations. These characters were selected on the basis that they were associated with the
morphological trends identified in the ordination of all 42 sites and were also easy to remeasure on

@ proportion
1000 @ proportion
600
RIV
with scabrid culms
with scabrid leaves
KLO ANT
133
8 8
GRE WAI CAR Kil WRV
Sequence of sites up Waimakariri Valley
Figure 5.5 : Frequency of scabrid plants in populations at the
distributional boundary of F. novae-zelandiae (left) and F. matthewsii

7·~-----------------------------------------------------.
6
.?:- 5 '00 C Q)
-0 4 .~ .s::. ]i 3
~ ..0 «I «I 2 c 'E
RIV
3 1 tKLO tWAI o .·---"-------·.--·---------GRE'---6AfI----KH::--------.......>.NRV-·
.15-iOO-----sroO-----7..,0-0-----srOO-----9::!OO-=------:-::100'="0~----j1100
Altitude (m)
Figure 5.6: Mean lamina scabridity (abaxial hair density) in populations at the
distributional boundary of F. novae-zelandiae and F. matthewsii. Hair density is 0.06
mm·2 .
101,--------------------------------,
9
S
7
.?:-'00 s
t~ t,m c Q)
-0 5
4
: t,l· o -.-.... -.--.--.---.-----~.[t.cAa-__KH::------___wRV--.
. 15 -l0-0-----s'OO------.700,.------STOO------.900-----10:r0-:-0 ----1:-:1
100
Altitude (m)
Figu re 5.7: Mean culm scabridity (3rd internode hair density) in populations at the
distributional boundary of F. Ilovae-zelandiae and F. matthewsii. Hair density is 0.06
mm-2 .
134

32
30
28
RIV
26
E ~ 24 ..c
t r rn c 22 KLO ~ cO C
20 'E cO
t WRY
-1 18
16
14
12 500 600 700 800 900 1000
Altitude (m)
Figure 5.8: Mean lamina length in populations at the distributional boundary of F.
novae-zelandiae and F. matthewsii.
70
65
RIV 60 ANT
E ~ - 55 KLO ..c OJ
tJ· KIL 'Qj
..c E 50
:i 0
45 ;CAR
40
35 500 600 700 800 900 1000
Altitude (m)
Figure 5.9: Mean culm height in populations at the distributional boundary of F.
novae-zelandiae and F. matthewsii.
WRY
135
1100
1100

136
non-reproductive material.
When field and glasshouse measurements for all populations were compared using a paired
T-test, lamina length was found to have increased significantly under cultivation (T = 2.27, P < 0.05).
In five populations mean lamina length in cultivation was shorter than in the field however the
differences were slight (Fig. 5.10).
Overall lamina abaxial hair density also decreased significantly in cultivation (T = -2.68, P
<0.05). Three populations showed an increase in lamina abaxial hair density in cultivation but once
again the differences were slight (Fig. 5.11). No significant overall change was found in sheath length,
lamina width or lamina abaxial hair length under cultivation.

28
MTS_
26
e PEGD 0 WSIQ SLF_ .~ 24 BNK-.~ WRVD CRVIII
-3 MTH* 0
22 .£ CSA* ~
OJ CSS_ e 20
~ til
BRVD e 'E 18 PPS* til
....I
16
14 14 16 18 20 22 24 26 28
Lamina length in the field (cm)
- F. novae-zelandiae * high altitude F.nz. 0 F. matthewsii
Figure 5.10: Mean lamina length of 18 populations of tussock Festllca in cultivation compared
with lamina length in the field.
e 0 .~
.~ =: ~ 0
.£ .;::.. '00 e Q)
"0 ... 'iii ~
til e 'E til
....I
4
3.5
3
2.5
2
1.5
*GSA
*BRO ECSS
RANT
c;oIWSH
*PPS
ECRV
1~ 2 ~5
Lamina hair density in the field 3
_ F. novae-zelandiae * high altitude F.nz. 0 F. matthewsii
-BNK
RSLF
3.5 4
137
Figure 5.11: Mean lamina scabridity (abaxial hair density) of 18 populations of tussock Festllca in
cultivation compared with lamina scabridity in the field. Hair density is 0.06 mm-2•

138
533. Discussion
(a) Variation among 42 populations belonging to three taxa
The strong environmental gradients that affect central South Island appear to be of major importance
to patterns of morphological variation among tussock-forming Festllca. The combination of a
prevailing westerly air flow and the Southern Alps produces a pronounced west-east rainfall gradient
superimposed on gradients of altitude and temperature.
The differences between F. llovae-zelalldiae S.S. and F. matthewsii are mainly quantitative
rather than qualitative, however studies of plants in cultivation both here and by Connor (1968) have
shown that distinguishing characters of glabrousness and inflorescence structure are genetically fIxed
in F. matthewsii.
Degree of scabridity also varies within F. novae-zelandiae s.s. apparently in relation to
rainfall. Some higher altitude / rainfall populations contain glabrous individuals. Therefore the
pattern of genetically determined differences between F. novae-zelandiae s.s. and F. matthewsii is
echoed by smaller genetic and phenotypic differences among populations within F. novae-zelandiae
s.s. which experience similar conditions.
"High altitude" F. llovae-zelandiae was generally less scabrid than F. llovae-zelalldiae S.S. and
mean values for other characters of "high altitude" F. llovae-zelalldiae were intermediate betweenF.
llovae-zelalldiae S.S. and F. matthewsii. However it is unlikely that hybridization with F. matthewsii was
a factor in the evolution of the "high altitude" form of F. llovae-zelandiae (H. E. Connor pers. comm.)
despite the tendency for "high altitude" populations to display features more usually associated with F.
mattlzewsii, as "high altitude" F. novae-zelalldiae has a predominantly eastern distribution. Instead
the genetically-fIxed shared character-states are most likely due to the selective influence of similar
environmental conditions.
The similarity between the ordinations of these 42 sites by morphology and by vegetation
composition could be a result of the importance of the same environmental gradients to both patterns
of variation. The relationship between the two sets of axes was not sufficiently strong to indicate that
differences in the vegetation per se were driving patterns of morphological variation.
(b) The nature of the boundary between F. novae-zelalldiae S.S. and F. matthewsii.
Clinal variation at the boundary between F. Ilovae-zelandiae S.S. and F. mattlzewsii could be due to any
one or a combination of three factors. The intermediate populations could be a result of
hybridization, as the two species are in contact and freely interfertile (Connor, 1968). Alternatively
environment influences could have brought about the parallel evolution of F. matthewsii-type
characters in populations of F. Ilovae-zelandiae S.S. in higher altitude and rainfall areas, as may have
happened with "high altitude" Festllca Ilovae-zelalldiae. Alternatively populations of F. novae
zelalldiae S.S. at higher altitudes and rainfalls may mimic aspects of F. mattlzewsii via phenotypic
plasticity.

139
Examination of the plants in cultivation has shown that differences between popUlations are
at least partly genetic. Therefore the elinal variation observed at the boundary of F. novae-zelandiae
s.s. and F. 11latthewsii is not entirely due to the plasticity of either species in response to an
environmental gradient. Connor (1968) expressed doubts about the natural occurrence of hybrids
between F. novae-zelandiae s.s. and F. 11latthewsii due to their being ecologically separated. He
considered that the two species evolved allopatrically with little opportunity in pre-human New
Zealand to hybridize. However large river valleys such as the one studied would have been natural
contact zones between the two species thereby facilitating limited gene-flow via hybridization.
The pattern of elinal variation observed among tussock-forming Festllca in the upper
Waimakariri River could be a result of the genetic specialisation of each popUlation to its position
along an environmental gradient, augmented by phenotypic plasticity. However it is more
parsimonious to hypothesize that the eline represents a zone of limited hybridization. Hybrid
offspring may be adaptive within a limited portion of the prevailing environmental gradient but, as
the zone of intermediacy appears to be limited, hybrids may not competitive enough in the habitats of
either parent to facilitate complete merging of the two species.
Selective forces generated by the differential adaptiveness of two hybridizing taxa are
thought to be sufficient to maintain a stable, narrow hybrid zone (Moran, 1981) and the more intense
the selection the narrower the zone (Levin, 1988; Freeman et al., 1991). The zone of intermediacy
between F. matthewsii and F. novae-zelandiae s.s. in the upper Waimakariri is approximately six
kilometres long up the river valley and spans approximately 100 vertical metres. This zone is relatively
narrow considering the ranges of the parent species. This would suggest that F. matthewsii and F.
novae-zelandiae s.s. are differentially adapted to their positions along the dominant environmental
gradients of the South Island mountains and differential selective forces maintain their separation.
Experimental crosses between F. matthewsii and F. novae-zelandiae s.s. conducted by
Connor (1968) indicated that F. 11latthewsii characters were dominant among F1 progeny. However
the F2 generation involved a range of recombinations of F. novae-zelandiae s.s. and F. matthewsii
characters and an overall reduction in panicle size.
Plants in the populations suggested here as representing a hybrid zone also showed a range
of recombinations of F. 11latthewsii and F. novae-zelandiae s.s. characters. There also appeared to be a
reduction in culm length and lamina length in these intermediate popUlations compared with values
for the parent species. These patterns further reinforce the hypothesis that a naturally occurring zone
of hybridization does exist between F. matthewsii and F. novae-zelandiae s.s ..
( c) Attributes of 18 populations under cultivation.
Although the 18 populations studied varied in the magnitude of morphological changes observed
under cultivation no direct between-population comparisons in levels of plasticity can be made using
these data. This is because the change in environment from site of origin to the University
shadehouse is not of equal magnitude for all 18 populations.
However if the differences observed among popUlations in the field were solely a result of
phenotypic plasticity, all plants should become more similar when grown in the same environment.

140
Convergence was not observed in any character measured and the range of values among populations
in cultivation is comparable to that among the populations in the field. This would suggest that
differences observed in the field are in part due to genetically determined traits.
Changes in lamina length in cultivation differed among the four F. mattlzewsii populations
and as a result the range of lamina length among these populations actually increased under
cultivation. The conditions experienced by these populations in the field would therefore appear to be
acting in a stabilizing manner. Phenotypic plasticity enables them to appear more similar in the field
than under uniformly favourable conditions (Bradshaw, 1965).
The four "high altitude" F. llovae-zelalldiae populations also appeared to respond differently
to conditions in cultivation. Porters Pass (PPS) and Broken River (BRO) showed little change in
lamina length whereas the lamina length of plants from Mt. Horrible (MTH) and Cass Saddle
'A'(CSA) increased markedly. This would suggest that the first two populations are genetically fixed
for small size and therefore correspond closely to the "high altitude" form of F. llovae-zelandiae
described by Connor & Edgar (1986) and Connor (pets. comm.). However the other two populations
may well be F. novae-zelandiae s.s. but resemble "high altitude" F. llovae-zelandiae phenotypically due
to a plastic response to local site conditions.

141
5.4 PHENOLOGICAL VARIATION IN CULTIVATION
5.4.1 Methods
Of the 18 populations in cultivation that were used in section 5.3( c), 44 plants from 11 different
populations flowered in the season of 1991/92. The number of plants flowering per population varied
from 1 to 9. Six of the 11 populations were of F. novae-zelandiae s.s. originating from a variety of sites
ranging in altitude from 65 m to 1240 m. Four of the populations were of F. matthewsii and one
populations was of "high altitude" F. llovae-zelalldiae from Porters Pass. A record was made of the
date culms were first observed on each plant and the timing of anthesis.
Linear regression was used to investigate the importance of altitudinal variation among the
sites from which the populations originated in explaining the observed variation in flowering
phenology.

5.4.2 Results
Plants of F. matthewsii were the first to produce culms in cultivation in late October (Fig. 5.13).
Plants of F. llovae-zelalldiae S.S. first produced culms in early December. All four F. matthewsii
populations produced culms earlier than any of the sLv: F. novae-zelandiae s.s. There was limited
overlap between F. matthewsii plants and F. llovae-zelandiae S.S. plants in the timing of anthesis.
142
Three plants from the "high altitude" F. novae-zelalldiae population at Porters Pass flowered.
However timing of initial culm emergence and anthesis was in synchrony with F. matthewsii plants
rather than F. llovae-zelandiae s.s.
Altitudinal variation among the sites from which the 11 populations originated was not
significant in explaining variation in date of culm emergence (R2 = 0.01, df = 9, NS). Even when
regressions were performed within each species rather than between species, variation in altitude did
not significantly explain variation in flowering phenology (F. matthewsii : R2 = 0.28, df = 3, NS; F.
llovae-zelalldiae s.s : R2 = 0.01, df = 5, NS). However, when tested with One-way Analysis of
Variance, the date of culm emergence was found to differ significantly between the three taxa (F2,8 =
42.2, P < 0.001).

£ Figure 5.12 : Flowering phenology in cultivation of 11 populations of tussock F estuca in 1991/92. E=culm emergence. A=anthesis.
WRY I E A ••••••••.••. ·iii
APS I~IE A ••••••••• __ . £: ...... ......
PEG IE E A ___________ .
BRV u.. E A ___________ .
PPS high alt. F .nz E A ___________ .
CSS lui E A __________________ ..
I./)
WSH I~I E A :0 c
MTS I ~ I E A N I
CVS I~ I E A > 0
SLF ~I E A
u.. BNK E
A ___________________
I I I I I I I I I 25 8 15 22 29 6 13 20 27 4
OCT NOV DEC JAN

144
5.43 Discussion
Differences in flowering phenology can serve as an effective barrier to hybridization between species
and can lead to the evolution of genetic reproductive isolation (Stam, 1983). F. matthewsii and F.
novae-zelandiae s.s. are phenologically distinct in cultivation with regard to timing of culm
emergence, with F. matthewsii producing culms six to ten weeks earlier than F. llovae-zelandiae s.s ..
The earlier timing of emergence of F. matthewsii is probably a result of its adaptation to cooler spring
temperatures; culm elongation being able to commence at lower temperatures than in
zelandiae s.s .. Alternatively culm elongation in spring may be cued by different daylengths in the two
species.
However because plants appear to overlap in the timing of anthesis, the flowering phenology
of these species presents only a minor barrier to hybridization where the species co-occur.
Differences in culm emergence but an overlap in anthesis have previously been observed between
these two species in cultivation (Connor, 1964). Reported timing of flowering of the two species in
the field (Scott, 1960; Connor, 1968) indicates that they also could overlap at anthesis where they co
occur (Connor, 1968). Observations made during the course of this study on the flowering stage of
populations encountered over the summer indicate that populations of F. matthewsii at the heads of
river valleys overlap in timing of anthesis with popUlations of F. llovae-zelandiae S.S. further down the
valley. As stated in section 5.3, the boundary between F. matthewsii and F. novae-zelandiae s.s.
appears to be characterised by a zone of intermediacy. The flowering phenology of populations
within, and either side of, this zone would not provide a significant barrier to gene-flow and
hybridization.
The early flowering and anthesis of the Porters Pass plants indicates that this taxon, in a
similar manner to F. matthewsii, has adapted to cooler spring conditions and culm elongation
commences at lower temperatures than in F. novae-zelandiae s.s.
Although adaptation to cooler temperatures is suggested by the differences in flowering
phenology of F. matthewsii and "high altitude" F. novae-zelandiae, when com pared with F. novae
zelalldiae S.s., no similar genetically fixed differences appear to occur within either F. matthewsii or F.
novae-zelandiae s.s. with relation to altitude. This result could be due to small sample sizes and
insufficiently frequent monitoring obscuring subtle differences between populations. However a lack
of finer scale specialisation would be in keeping with what has already been discovered about the
biology of F. novae-zelandiae s.s .. Due to long generation times, low popUlation turnover and
infrequent episodes of disturbance and recolonisation, populations of both species may not have the
opportunity to become specialised to a particular environment. Instead populations within each
species appear to share a fL'{ed flowering phenology that reflects the mean environment encountered
by the species as a whole.

145
5.5 BIOCHEMICAL VARIATION
5.5.1 Introduction
Allozyme electrophoresis was used to investigate the amount of genetic variation and the degree of
population differentiation present within F. novae-zelandiae and the manner in which this species was
related genetically to F. matthewsii.
Allozyme electrophoresis is ideal for investigating genetic variation at the species and
population level as large numbers of individuals can be screened quickly and cheaply. The technique
relies on the existence of electrophoretically distinguishable forms of enzymes (= allozymes). In any
one individual these can be coded for by genes from more than one locus and anyone locus can be
multi-allelic with allele frequencies behaving according to the laws of Mendelian segregation.

146
5.5.2 Methods
(a) Electrophoretic Procedure
Nine F. novae-zelandiae populations used for previous experiments (sections 3.4 & 4.3), an additional
F. novae-zelandiae population with characteristics intermediate between F. novae-zelandiae and F.
matthewsii and two F. matthewsii popUlations were selected for analysis (Table 5.7). Tillers were
collected from at least 20 randomly selected plants at each site and grown in a heated glasshouse for
a minimum of eight weeks to allow for the production of new tillers under standard conditions.
For the analysis a young vigorous tiller was selected from each plant and 15 mm of
unpigmented tissue from the tiller base was homogenised in 2 drops of extraction buffer using a
mechanical grinder. The extraction buffer consisted of 50 mls 0.1 M
tris(hydroxymethyl)aminomethane, 6 mM ascorbic acid, 6 mM cysteine, 0.5 M sucrose, 1 mM
dithiothreitol, 0.05 mM EDTA, 4% wlv polyvinyl pyrolidione and 3 drops B-mercaptoethanol
brought to pH 7.5 with HeI.
The homogenate was absorbed onto 3 mm wide wicks made of What man No.1 filter paper.
The samples were prepared directly from growing material the same day the gels were to be run, as
either freezing or refrigeration resulted in loss of enzyme activity.
The prepared wicks were inserted in a chilled 12.5% (w/v) starch gel 70 mm wide, 230 mm
long and 10 mm thick. Two buffer systems were used:
(1) Electrode buffer: 0.06 M lithium hydroxide I 0.3 M boric acid pH 8.1. Gel buffer: 1/100 dilution
of electrode buffer
(2) Electrode buffer: 0.125 M Tris adjusted to pH 7.0 with citric acid. Gel buffer: 0.014 M L-histidine
0.002 M EDTA adjusted to pH 7.0 with Tris.
The gels were run under a constant current of 50 rnA per gel for 4 hours, during which time
they were kept cool by trays of ice.
The gels were then sliced horizontally and separate slices stained for specific enzyme
systems. Banding patterns were interpreted in terms of putative allelic and hybrid bands and the
frequency of different allelic phenotypes recorded for each population. The procedure was repeated
for all populations using material from the same plants in order to confirm results.

147
Table 5.7: Populations of tussock Festuca used for~lozyme electrophoresis. Map references are
NZMS 260 series except HLF which is NZMS 1. ALT = altitude (m), PPT = annual rainfall
(mm).
Species Population Abbr. Map Ref. Alt PPT
F. novae-zeI. Bankside BNK M36423193 65 690
F. novae-zeI. Cass River CRY K34071942 640 1500
F. novae-zeI. Cass Saddle 'B' CSS K34031888 1240 2500
F. novae-zel. Cass Valley CVS K34053915 820 2000
F. novae-zel. Hallelujah Flat HLF S59286284 620 2250
F. novae-zeI. Mt. Sugarloaf MTS K34 1060 1250
F. novae-zeI. Sugarloaf Fan SLF K34098959 670 1250
F. novae-zel. W oolshed Hill WSH K33093028 1140 2500
high alL F. n-z. Cass Saddle 'A' CSA K34027883 1340 2500
high aIL F. n-z. Porters Pass PPS K35080673 1000 1000
F. matthewsii Arthurs Pass APS K33923095 880 6000
F. matthewsii Bealey River BRV K33925075 760 5000
Table 5.8: Enzyme system standard abbreviations and codes, buffer systems used, number of loci
consistently scorable and total number of alleles observed per locus.
Enzyme Standard Code Buffer used No. of Loci No. of Alleles
6PG EC 1.1.1.44 2 1 4
ACP EC 3.1.3.2 2 2 2,2
G6P EC 1.1.1.49 2 2 5,4
IDH EC 1.1.1.42 2 1 3
LAP EC 3.4.11/13 1 1 1
MDH EC 1.1.1.37 2 1 5
MR EC 1.1.1.40 2 1 5
PGI EC 5.3.1.9 1 2 2,5
PGM EC 2.7.5.1 2 1 3
SOD EC 1.15.1.1 1 2 2,1

148
(b) Analysis
Polyploidy creates difficulties in the interpretation of 6lbzyme banding patterns and the species being
investigated in this experiment are hexaploid. The analysis of progeny arrays or haploid tissue can
reveal the parent's genome or comparisons can be made with related diploid taxa (e.g. Brown et ai,
1974; Werth, 1978; Barrett & Shore, 1989).
If observed banding patterns are simple, the relative intensity of bands can be interpreted as
'gene dosage' and thus provide allele frequency data (Kephart, 1990; A. H. D. Brownpers. comm.).
However these techniques cannot be easily applied to high-polyploid out-crossing species such as F.
novae-zelandiae and F. matthewsii which lack close diploid relatives. Instead I have utilised two
alternative methods involving allele frequency estimates and phenotype frequencies.
i) Estimated allele frequency
For a diploid species, allele frequencies can be calculated directly from genotype frequencies,
p = freq. homozygote 'aa' + 1/2 freq. heterozygote 'ab'
where p is the frequency of allele a.
In this study only banding phenotype frequencies were known and each phenotype could
represent more than one genotype. However by using an extended version of the equation above, an
estimate of allele frequency can be obtained from phenotype frequencies i.e.
p = freq. homozygote + 1/2 freq. of biallelic heterozygote + 1/3 freq. of triallelic heterozygote + ... + l/n freq. of n-allelic heterozygote.
Of course this equation does not represent expected genotype frequencies under Hardy
Wienberg equilibrium as the influences of genomic structure and modes of segregation are totally
ignored, but it does at least provide an index of allele frequency. However this method does have the
drawback that a population exhibiting uniform fixed heterozygosity at a locus will be recorded as
being polymorphic at that locus with frequency estimates identical for all alleles. It would therefore
be indistinguishable from a population in which the alleles actually occurred at equal frequencies, but
segregating into homozygotes and heterozygotes according to Hardy-Wienberg expectations. This
would result in an over-estimate of the proportion of loci exhibiting polymorphisms, an over-estimate
of within-population variation and possibly an under-estimate of between-population variation.
I tested the accuracy of the method by comparing calculated allele frequencies with known
frequencies from an artificial population that corresponded to a diploidised autoploid with identical
allele frequencies across parental loci: a highly unlikely situation but an easy model to deal with.

149
Vickery (1990) dealt with polyploid~lIozyme data by using the percent presence of each allele
at each locus as the gene frequency. However his method lacked the degree of resolution possible in
the method described above and resulted in ambiguity when frequencies were compared between
ploidy levels.
ii) Phenotype frequency:
A\lozyme phenotypes have previously been used to obtain basic qualitative information on population
variation in the absence of a formal genetic interpretation (e.g., Grant et ai, 1984). However
phenotype frequencies are also amenable to statistical analysis in a similar manner to allele
frequencies.
For example the measure of genetic identity, '1', put forward by Nei (1972) can in its simplest
form be applied to phenotype frequencies without any change to the equation itself. This is because
the equation concerns probabilities of identity. In a similar manner Nei's (1973) genetic diversity
statistics can also be applied to phenotype frequencies as measures of phenotypic diversity. This
method makes no assumptions about the underlying genetic structure and mode of inheritance in the
species studied and is therefore relatively robust. The only assumption required is that a\lozyme
phenotypes reflect underlying genetic structure.
(iii) Further analyses
One-way analysis of variance was used to test for significant differences between the two species for
each of percent loci polymorphic, mean alleles per locus, mean percent heterozygosity and the
frequency of higher level multi-allelic phenotypes.
Pearson correlation was used to investigate the relationship between the geographical
distance between pairs of populations and their phenotypic and genetic similarity as measured by
Nei's genetic identity, I (Nei, 1972). Correlations were calculated for all pairs of populations including
both species and for pairs of F. novae-zelandiae populations only.
The partitioning of genetic diversity within populations, between populations and between
species was calculated for all populations from allele frequency estimates using Nei's (1973) diversity
statistics. Allele frequency estimates were also used to calculate the partitioning of genetic diversity
within populations and between populations for F. novae-zelandiae populations only.
Total phenotypic diversity and the partitioning of phenotypic diversity were likewise
calculated from phenotype frequencies using Nei's diversity statistics for all populations of both
species and for F. novae-zelandiae populations only.
The above measures of variability, similarity and partitioning of diversity were calculated
using BIOSYS-1 (Swofford & Selander, 1981), a program designed specifically for electrophoretic
data.

150
Principal Components Analysis of both allele frequency estimates and phenotype
frequencies, as implemented by CANOCO using default options, was used to summarise the
relationships between the populations and examine the importance of altitude, annual rainfall and
temperature in the observed patterns of variation. Annual rainfall was based on recorded values from
nearby stations (New Zealand Meteorological Service, 1982) and a rainfall isohyet map of the
Waimakariri catchment (Greenland, 1977). Mean annual temperature was estimated using the
regression equations of Norton (1985).
Principal Components Analysis was also performed on the 12 populations using
morphological data collected earlier (section 5.3) and Detrended Correspondence Analysis was
performed using vegetation data from section 5.2 for the same 12 populations. The axes from the
ordination of phenotype frequencies were included in the above analyses as pseudo-environmental
variables in order to investigate the concurrence between patterns of genetic, morphological and
ecological variation.

151
5.5.3 Results
Of 17 enzyme systems examined for activity, 10 were consistently interpretable in all populations.
These gave a total of 14 reliable loci exhibiting 43 alleles (Table 5.8). Two loci, LAP and SOD-2, were
monomorphic for the same allele in all populations. The number of alleles observed at the remaining
loci ranged from two to five (Table 5.8). The number of alleles per locus averaged across all loci for
each population ranged from 2.2 to 2.9 (Table 5.9). F. matthewsii had significantly more alleles per
locus on average than F. novae-zelandiae (F = 6.32, P < 0.05) although individual F. novae-zelandiae
populations had values approaching those of F. matthewsii.
The number of allelic bands for anyone individual ranged from one to four with multi-allelic
phenotypes the rule. The two F. matthewsii populations had significantly more individuals with 3-
allele and 4-allele phenotypes than the F. novae-zelandiae populations (F = 32.85, P < 0.001 and F =
26.18, P < 0.001 respectively).
The percentage of loci that displayed allelic polymorphism and percent heterozygous
individuals per locus ranged from 71.4 to 85.7 and 45.5 to 72.2 respectively (Table 5.9) but neither
showed a significant difference between species. Percent phenotypically polymorphic loci was lower,
ranging from 57.1 to 85.7. The mean difference due to apparently 'fixed' heterozygosity was 7.2%
(Table 5.9).
Three populations, Bealey River, Arthurs Pass (bothF. matthewsii) and Sugarloaf Fan
possessed unique alleles. Pooling the populations by species resulted inFo novae-zelandiae having
four and F. matthewsii having three species-specific alleles. In all cases these alleles were rare.
When allele frequency estimates calculated by method 1 for an artificial population were
compared with true values, in the simplest case of two alleles at a locus they were found to deviate in
a systematic manner (Fig 5.13). The estimate coincided with the true value when the alleles were
equal in frequency (i.e. p = 0.5 = q) or when one allele was fixed (e.g. p = 1 and q = 0). However
the method over-estimated p when it was less than 0.5 and under-estimated it when it was greater
than 0.5. This method would therefore tend to minimise frequency differences between alleles at a
locus and between populations that differed only in which allele was most common.
Nei's genetic identity coefficients (Nei, 1972) based on allele frequency estimates resulted in
the two F. matthewsii populations being on average as similar to F. novae-zelandiae (0.94 ± 0.08) as
F. novae-zelandiae was within itself (0.94 ± 0.08). However the same comparison using phenotype
frequencies produced smaller values. The phenotypic identity of F. matthewsii and F. novae-zelandiae
populations was 0.75 ± 0.03 while within F. novae-zelandiae phenotypic identity was 0.83 ± 0.02.
The similarity between pairs of popUlations based on allele frequency estimates was
significantly correlated with similarity based on phenotype frequencies when tested with Pearson
correlations (R2 = 0.841, P < 0.001).

152.
Table 5.9: Allozyme variation within 12 populations of tussock Festuca. S = mean sample size per
locus; P a = % loci with > 1 allele; P p = % loci with > 1 phenotype; A = mean alleles per locus;
Ho = mean % heterozygosity (includes fIxed).
Population S Pa Pp A Ho
Bankside 24 78.6 78.6 2.5 53.87
Cass River 15 71.4 71.4 2.2 64.13
Cass Saddle 'A' 16 78.6 64.3 2.2 69.58
Cass Saddle 'B' 17.6 78.6 78.6 2.6 67.16
Cass Valley 17.8 78.6 71.4 2.7 68.20
Hallelujah Flat 12.6 78.6 71.4 2.5 64.73
Mt Sugarloaf 16.3 78.6 78.6 2.5 56.04
Sugarloaf Fan 66.9 85.7 71.4 2.6 45.47
W oolshed Hill 16 85.7 78.6 2.8 71.84
Porters Pass 30 85.7 78.6 2.7 62.14
Arthurs Pass 18 85.7 78.6 2.9 72.17
Bealey River 18 85.7 85.7 2.9 71.71
0.9
0.8
b 0.7 z w
::> a 0.6 w a: u.. 0.5 0 w !;( 0.4 ~ F= 0.3 (f) w
0.2
0.1
0.3 0.4 0.5 0.6 0.7 0.8 0.9 TRUE FREQUENCY OF 'A'
Figure 5.13: Relationship between true allele frequency and frequencies estimated using a Hardy
Wienberg analogue.

153
The geographical distance between pairs of populations was not significantly correlated with
between-population similarity based on either allele frequency estimates or phenotype frequencies
when tested with Pearson correlations (R2 = -0.018, P > 0.05 and R2 = -0.052, NS). When the
correlations were repeated for pairwise comparisons within F. novae-zelandiae only, there was still no
significant relationship between similarity based on either allele frequency estimates or phenotype
frequencies and geographical separation between populations (R2 = 0.132, NS and R2 = 0.164, NS
respectively) .
Nei's diversity statistics using allele frequency estimates resulted in a mean total genetic
diversity for polymorphic loci of 0.52 ± 0.08 for all populations (Table 5.10a). SOD-1 exhibited the
lowest diversity (0.33) and G6P-2 the highest (0.67). On average the vast majority of this diversity
(95.3 ± 3.04%) was due to within-population diversity, as opposed to between-population diversity
which contributed 4.18 ± 3.08%. Between-species diversity contributed only 0.50 ± 0.43% on average
to total genetic diversity as estimated by allele frequency calculations.
When the analysis was repeated with F. novae-zelandiae populations only, mean total genetic
diversity decreased slightly to 0.51 ± 0.08. Between-population diversity accounted for on average
5.69 ± 4.27% of total diversity, however at two loci (SOD-1 and PGI-1) over 20% of the observed
diversity was due to between-population differences (Table 5.10b).
The same statistics calculated using phenotype frequencies resulted in similar values for total
phenotypic diversity for all populations (0.50 ± 0.09) but higher values for mean between-population
and between-species diversity (22.0 ± 10.3% and 3.98 ± 3.63 respectively) (Table 5.11a). When the
apportionment of phenotypic diversity was calculated for F. novae-zelandiae alone, 24.2 ± 11.5% of
total phenotypic diversity was due to between-population differences (Table 5.11b). At the SOD-1
and PGI-11oci the proportion of total phenotypic diversity due to between-population differences
exceeded 60%.
PCA ordinations of the 12 populations using allele frequency estimates and phenotype
frequencies were very similar. In the ordination of allele frequency estimates, the first two principal
components axes jointly summarised 57% of the variation among populations (Fig. 5.14). In the
ordination using phenotype frequencies, the first two axes jointly summarised 62% of the variation
among populations (Fig. 5.15). Altitude, annual rainfall and maximum, mean and minimum annual
temperatures were all significantly correlated with the observed trends in both ordinations (Table
5.12).
Both ordinations showed a similar pattern of relationships among the 12 populations. The
two F. matthewsii populations occurred in close proximity to each other and the closest F. novae
zelandiae population to them in both cases was Woolshed Hill (WSH). The three F. novae-ze/{mdiae
populations from the upper Cass Valley, Cass Saddle 'A' (CSA), Cass Saddle 'B' (CSS) and Cass
Valley (CVS) occurred together in both ordinations. The lower altitude F. novae-zelandiae
populations Sugarloaf Fan (SLF), Hallelujah Flat (HLF) and Bankside (BNK) also occurred together
in both ordinations. Mt. Sugarloaf (MTS) although geographically closest to Sugarloaf Fan shows as
much similarity with the other high altitude populations.

154
Table 5.10: Total diversity (Nei, 1972) calculated from allele frequency estimates and percentage
due to variation within and between populations and species, (a) for all 12 populations of both F.
matthewsii and F. novae-zelandiae, and (b) for 10 populations of F. novae-zelandiae only.
(a) Total % Within % Between % Between Diversity Populations Populations Species
6PG 0.58 96.6 2.91 0.51
APH-1 0.18 94.5 2.75 2.75
APH-2 0.47 97.9 2.13 0
G6P-1 0.61 96.7 2.63 0.66
G6P-2 0.67 99.8 0 0.15
IDH 0.51 100 0 0
MDH 0.65 97.4 2.62 0
MR 0.63 94.7 4.31 0.96
PGI-1 0.47 86.9 13.0 0
PGI-2 0.63 99.0 0.95 0
PGM 0.54 98.7 0.37 0.93
SOD-1 0.33 81.4 18.5 0
mean 0.52 95.3 4.18 0.50
95% C.L ±0.08 ±3.04 ±3.08 ±0.43
(b)
6PG 0.56 96.9 3.04
APH-1 0.16 93.6 6.37
APH-2 0.46 97.8 2.17
G6P-l 0.58 97.2 2.76
G6P-2 0.67 100 0
IDH 0.51 99.4 0.59
MDH 0.65 96.9 3.06
MR 0.60 95.3 4.70
PGI-l 0.46 86.2 21.6
PGI-2 0.63 99.0 0.96
PGM 0.54 99.4 0.56
SOD-1 0.33 77.4 22.6
mean 0.51 94.9 5.70
95% C.L ±0.08 ±3.61 ±4.27

155
Table 5.11: Total phenotypic diversity and percentage due to variation within and between
populations and species calculated using Nei's diversity formulae (Nei, 1972), for (a) all 12
populations of both F. matthewsii and F. novae-zelandiae, and (b) 10 populations of F. novae-
zelandiae only.
(a) Total % Within % Between % Between Diversity Populations Populations Species
6PG 0.65 73.1 11.2 15.5
APH-1 0.32 86.1 12.6 0.95
APH-2 0.43 74.2 25.6 0.23
G6P-1 0.53 61.4 19.1 19.5
G6P-2 0.24 89.5 3.78 6.30
IDH 0.36 84.8 15.1 0
MDH 0.70 73.1 26.8 0
MR 0.75 76.7 18.1 5.03
PGI-1 0.41 37.3 62.6 0
PGI-2 0.56 91.5 8.49 0
PGM 0.61 95.4 4.26 0.33
SOD-1 0.48 43.9 56.1 0
mean 0.50 73.9 22.0 3.98
95% C.I. .±. 0.09 .±. 9.92 .±. 10.3 .±. 3.63
(b)
6PG 0.57 87.2 12.8
APH-1 0.27 85.8 14.2
APH-2 0.47 77.0 23.0
G6P-1 0.40 74.4 25.6
G6P-2 0.16 94.4 5.55
IDH 0.40 84.6 15.4
MDH 0.71 72.0 28.0
MR 0.71 80.8 19.1
PGI-1 0.43 33.3 66.7
PGI-2 0.53 91.7 8.29
PGM 0.59 95.6 4.37
SOD-1 0.49 32.8 67.1
mean 0.48 75.8 24.2
95% C.1. .±. 0.09 .±. 11.5 .±.11.5

~ o
250~---------------------------------------------------------------'
200
150
100 CVS ..
MTS ..
cO 50
*GSA CSS ..
SLF BNK .. CRY .. HLF .. .. _------o . ________ ~LTITUDE C:iA""PS7
MAX. TEMPERATURE
-50 W:H ~ ,*,PPS RAINFALL
-100
-150 DBRV
-200+--------,r--------.--------.--------.--------.--------,r-------~ -150 ·100 ·50 0 50 100 150 200
PCA 1 (38.7%)
.. F. novae-zelandiae '*' high alt. F.nz. of. matthewsii
15b
Figure 5.14: Axes 1 and 2 from an ordination of 12 populations of tussock Festuca usingllflozyme
allele frequency estimates.
200~--------------------------------------------------------------_,
150
100
50
OAPS DBRV
RAINFALL
WSH
MAX. TEMPERATURE HLF ..
o ------------.. -··-------=:-",··......,:::::...---rRV------·---
·50 ALTITUDE
CSS III
MTS ·100 ..
CVS .. *GSA
·150 ·150 ·100 ·50 0
PCA 1 (38.5%)
III F. novae-zelandiae '*' high alt. F.nz.
III
50 100
o F. matthewsii
SLF III
150
Figure 5.15: Axes 1 and 2 from an ordination of 12 populations of tussock Festllca using~lozyme
phenotype frequencies.

157
Table 5.12: Pearson coefficients and levels of significance for correlations between environmental
variables and the first two principal components axes from ordinations of 12 tussock Festuca
populations using, (a) ll110zyme allele frequency estimates, and (b) ililozyme phenotype frequencies.
VARIABLE AXIS 1 p< AXIS 2 p<
(a)
Altitude -0.692 0.05 0.126 NS
Annual rainfall -0.602 0.05 -0.633 0.05
Maximum temperature 0.724 0.01 -0.087 NS
Mean temperature 0.682 0.05 -0.144 NS
Minimum temperature 0.610 0.05 -0.213 NS
(b)
Altitude -0.60 0.05 -0.36 NS
Annual rainfall -0.78 0.01 0.49 NS
Maximum temperature 0.64 0.05 0.32 NS
Mean temperature 0.58 0.05 0.38 NS
Minimum temperature 0.49 NS 0.45 NS
Morphology Axis 1 0.83 0.001 -0.23 NS
Morphology Axis 2 0.06 NS -0.73 0.01
Vegetation Axis 1 0.12 NS -0.36 NS
Vegetation Axis 2 -0.62 0.05 -0.13 NS
158
While the western "high altitude" F. novae-zelandiae population Cass Saddle 'A' (CSA), was
placed with other F. novae-zelandiae populations that occurred at higher altitudes, the other, Porters
Pass (PPS), was not. Surprisingly the eastern "high altitude" F. novae-zelandiae population at Porters
Pass was placed in both ordinations with the lower altitude populations and particularly with
Bankside (BNK), the most eastern population of the twelve.
Some differences existed between the two ordinations; the two F. matthewsii populations
emerged as more distinct when phenotype frequencies were used (Fig. 5.15) than when the ordination
was performed using allele frequency estimates (Fig. 5.14). In addition Mt. Sugarloaf (MTS) becomes
less distinct from the other populations generally and Sugarloaf Fan (SLF) more so when phenotype
frequencies rather than allele frequency estimates were used.
When the 12 populations were ordinated by 40 quantitative morphological characters (Fig.
5.16), the spread of sites was similar to both ordinations using DJI ozyme data. The two F. matthewsii
populations were most similar to each other and WSH was the closest F. novae-zelandiae populations
to them. The lower altitude F. novae-zelandiae populations, (BNK, CRY, HLF and SLF) occurred
together as did the higher altitude F. novae-zelandiae populations (CSS, CVS, MTS and WSH). The
two populations referred to 'high altitude' F. novae-zelandiae, CSA and PPS were much more similar
morphologically than biochemically. The first axis of the ordination of populations by morphology
was significantly correlated with the first ordination axis of populations by phenotype frequency and
the second axes from both ordinations were also significantly correlated (Table 5.12).
The first two axes from an ordination of the vegetation composition of 12 sites from which
the populations originated summarised only 23.1% of the variation in the data, indicating that the
vegetation among these 12 sites was very diverse. The spread of sites on the ordination diagram (Fig.
5.17) differed from that of the ordinations byallozyme data and morphology and appeared to be more
influenced by landform. For example, the two sites on young river terraces, BRV and CRY emerged
as most similar to each other despite the fact that they contain different species of Festuca. The first
axis of the ordination by vegetation composition was not significantly correlated with each of the two
ordination axes using ullozyme data (Table 5.12). The second vegetation axis was significantly
correlated with the first allozyme axis; however this second vegetation axis summarised very little of
the variation among sites.

200
*eSA 150
MTS *PPS 100 -CSS -
50 evs -WSH e:.v
o .-.... ---------.----------\ ;-"'~.,-
-50
ALI.'OZVMEAXIS 2 S~ -100
DBRV
-150 DAPS
BNK --2oo+-----.------T------r------.------r-----.------.------.----~
-200 -150 -100 -50 o 50 100 150 200 250
PCA 1 (36.0%)
- F. novae-zelandiae * high alt. F.nz. o F. matthewsii
Figure 5.16: Axes 1 and 2 of an ordination of 12 populations containing tussock Festuca using 40
morphological characters. Axes 1 and 2 from an ordination of the same popUlations by allozyme
phenotype frequencies are superimposed.
~ l"-
rS
300~------------------------------------------------------------1
250
200
-WSH
*CSA _MTS
C\I 150 -eSS
(§ o
100
o BRV
_eRV
-eVS
AU.OZV~E AXIS 2 k APS
*PPS
t,OZVME AXIS 1
040----------1oo.---------2'0-0--~~--~300~--~-'U~IC~~~IO~------~50=0--------~500
DCA 1 (15.4%)
II1II F. novae-zelandiae * high alt. F.nz. of. matthewsii
Figure 5.17: Axes 1 and 2 of an ordination of 12 populations containing tussock Festuca using
vegetation composition of sites of origin. Axes 1 and 2 from an ordination of the same populations
byallozyme phenotype frequencies are superimposed.

160
5.5.4 Discussion
The frequency of polymorphic loci and heterozygous individuals in F. novae-zelandiae and F.
matthewsii are high compared with values reported for other grass species (Hamrick, 1983) and mean
values for monocotyledones and widespread herbaceous taxa generally (Karron, 1987; Hamrick &
Godt, 1989) but they are not outside reported ranges. Relatively high amounts of variation could be
expected, given the out-crossing, wind-pollinated life history of these species and their potentially
long-lived perennial habit (Hamrick, 1989). The difference between allelic and phenotypic
polymorphism highlights the impact of the 'ftxed' heterozygosity of polyploids on observed genetic
variation; mean values in the literature are derived largely from studies of diploid taxa.
The number of alleles per locus observed was also higher than mean values for similar
organisms, but presumably the high level of ploidy in F. novae-zelandiae and F. matthewsii was
directly involved in this difference. The predominance of multi-allelic phenotypes indicates that both
species are allopolyploid, but more interestingly, the complete absence of ftve- and six-allele
phenotypes could suggest that one of the three parental genomes may be a duplicate.
The low amount of diversity due to differences between species is hardly surprising considering
that only two F. matthewsii populations were sampled but the results are ambiguous concerning the
amount of between-population differentiation in F. novae-zelandiae. Low values for between
population diversity are a feature of out-crossing and wind-pollinated species (Hamrick, 1989) and in
this case these factors could have been further depressed by the effect of polyploidy and the local
nature of the study. However, it also seems that the method used to estimate allele frequencies
tended to minimise differences between popUlations. Population differentiation was much higher
when phenotype frequencies were considered.
Assigning a single frequency to an allele at a particular locus as was done in method 1, is
technically incorrect for an allopolyploid such as F. novae-zelandiae, as there are, in fact, as many
duplicate loci as there are parental genomes and allele frequencies and allelic compliments will
almost certainly differ between these duplicate loci (Werth, 1978; Gottlieb, 1981). The measure of
between-population differentiation based on phenotypic variation may in fact be more representative
of true genetic divergence than that based on allele frequency estimates.
The lack of correlation between the genetic similarity of populations and their proximity does
not rule out gene-flow as an influencing factor. However the distances between populations may be
generally too great for much gene-flow to occur. While gene-flow can counteract the tendency of
small populations to randomly diverge, its influence will be over-ridden if selection disadvantages
plants possessing 'foreign' genes (Levin, 1981). Strong selective forces have been shown to maintain
genetic differences within a number of grass species over distances of a few metres (Gregory &
Bradshaw, 1965; Antonovics & Bradshaw, 1970; Snaydon & Davies, 1982; McCain & Davies, 1983;
Wilson & Bell, 1985).

161
The four populations in the Cass Valley were all connected by a sequence of small, scattered
F. novae-zelandiae populations. The similarity of the three uppermost populations may be a function
of gene-flow; Cass Saddle 'A' and Cass Saddle 'B' are particularly close. However the selective
influence of the different type of environment experienced by the lowermost population, Cass River,
may have over-ridden any effects of gene-flow from higher altitude populations.
The correlation between allozyme profile and environmental factors in the principal
components analyses does not prove the 'adaptiveness' of allozyme substitutions. However it is
apparent that populations within F. novae-zelandiae in broadly similar environments have similar
allozyme profiles. Lower altitude populations experiencing lower annual rainfalls and warmer
temperatures appear to be similar genetically as do higher altitude populations experiencing higher
annual rainfalls and cooler temperatures.
The concurrence between ordinations by allozyme data and by morphology suggest that both
are responding to the same broad environmental gradients and that morphological variation has a
genetic basis. The lack of concurrence between ordination by vegetation and by allozyme data is
somewhat surprising considering that the environmental variables that were most important to
variation in vegetation composition generally (chapter 5.2) were also most important for allozyme
variation. The lack of concurrence between variation in vegetation composition and in allozyme
profile appears to be due, in part, to the diversity of vegetation types among the 12 sites sampled and
also to the overriding influence of human disturbance. Sites such as BRV and CRV, with totally
different climates, are relatively similar in vegetation because they both contain a large adventive
element. Because of this, patterns of similarity among these populations based on allozyme data and
morphology would be a more accurate representation of true between-population relationships.
The major disjunction between the western and eastern "high altitude" populations in allozyme
profile could be due to the importance of the east-west gradient in rainfall that affects the study area.
However it could be that this apparently distinct form has had multiple origins and represents the
typical response of F. novae-zelandiae when it encounters a certain type of environment. Also it could
be that the populations classified in this study as "high altitude" in fact consist of both true "high
altitude" F. novae-zelandiae with an eastern distribution and other populations that morphologically
resemble "high altitude" F. novae-zelandiae due to shared environmental conditions.
In summary, both F. novae-zelandiae and F. matthewsii appear to be allopolyploid with
perhaps a genomic constitution of ABE. F. novae-zelandiae contains a large amount of genetic
variation, augmented by 'fixed' heterozygosity and popUlation differentiation has taken place at
different rates for different loci. Phenotypic differentiation, which is probably more representative of
the true genetic situation, indicates overall between-population diversity to be in the order of 20% of
total phenotypic diversity.
There appears to have been only limited genetic divergence between F. novae-zelandiae and F.
matthewsii. However it is quite likely that if the electrophoretic profiles of a wider range of F.
matthewsii populations were investigated then more between-species differences would emerge.

Divergence among populations of F. novae-zelandiae is low but significant. The selective
influence of the environment in which the plants occur appears to be a major factor in between
population differences.
162

163
5.6. RECIPROCAL TRANSPLANT EXPERIMENT
5.6.1. Introduction
The overall adaptiveness of observed patterns of variation among populations can be assessed by
comparing the general performance of plants of different origins in their own versus other
environments in a reciprocal transplant experiment. This type of experiment has been the classic
method to test for adaptive variation and was a major part of the work of J ens Clausen, David Keck
and William Hiesey in experimental taxonomy (Clausen et. al., 1939, 1940).
Reciprocal transplants are most adept at detecting discontinuous variation that relates to
edaphic and climatic factors. If variation is, in fact, continuous, a reciprocal transplant will still only
allow the recognition of distinct types. The distinctiveness of types recognised using a reciprocal
transplant is therefore very much affected by the scale at which patterns of variation are sampled.
McMillan (1959, 1969) cited the ability of perennial grasses to form ecotypes in response to
habitat gradients as a major factor in the dominance of grassland over very large areas. He found
ample evidence for ecotypic differentiation among five grass taxa that related to latitude and
photoperiod (McMillan, 1956, 1957).
Ecotypic differentation in the ability of plants to extract nutrients from the soil has already
been demostrated for F. novae-zelandiae by Espie (1987). Espie conducted nutrient trials using
populations from different soil types and found differences in uptake that appeared to reflect nutrient
availability at the site of origin.
The aim of this experiment is to test for the existence of adaptively differentiated forms
among populations of F. novae-zelandiae in terms of demographic factors such as survival, growth
and reproduction.

164
5.6.2. Methods
Four populations, Cass Saddle 'A', Sugarloaf Fan, Porters Pass and Waimakiriri Gorge were selected
to cover the range of environments occupied by F. llovae-zelandiae within the study area (See Fig. 2.1
for locations). Plants from Porters Pass represented a distinct high altitude form of F. llovae
zelandiae. The Cass Saddle 'A', Sugarloaf Fan and Porters Pass populations all occurred in short
tussock grassland / shrubland with a high indigenous component. The Waimakiriri Gorge material
was collected from roadside remnants in the Waddington - Oxford area of the upper Canterbury
Plains. This material was used in preference to material from Bankside, the lowland population used
in previous experiments, because it was the closest in origin and altitude to the preselected low
altitude planting site in an experimental plot in a garden at Waddington.
In April 1990 three tussocks from each population were randomly selected, divided into four
and grown on in sterilised potting-mix in a glasshouse for 4 months. These 48 plants were then
divided again into four parts of approximately 1 to 2 cm in diameter each. These 192 plants were
grown on for a further 6 weeks in sterilised potting-mix. The experimental material therefore
consisted of 16 cloned plants of each of three genotypes from each of four populations.
Prior to planting all plants were measured for height and basal diameter. The number of live
tillers (showing green leaves) were also counted and all dead tillers removed. It was decided not to
use biomass as a measure of performance because of the difficulties in controlling for root-weight
and soil water content.
In October 1990 the plants were planted back into each of the sites of the three populations
from predominantly indigenous vegetation and also into the fourth site at Waddington. Each
population was represented at each site by four replicates of each of the three original plants
collected from that population, giving a total of 48 plants per site. The Sugarloaf Fan plot was
situated in short tussock grassland with a dense growth of adventive species; The Cass Saddle plot
was located on a slope just below the top of the Saddle and the Porters Pass plot was situated in a
small south-west facing gully. The Waddington experimental plot was in an area of cleared ground
surrounded by lawn. It was not watered during the study period but was weeded in autumn and spring
of 1991.
The plants were planted into a 2 m x 2 m plot at each site. Random number tables were used
to assign plants to positions on the intersection points of a 20 cm grid laid across the plot. Each plant
was identified with a coded metal tag and X,Y co-ordinates were also recorded. All sites were planted
within a 7 day period.
The plants were all watered with approximately 500 mls of water per plant at the time of
planting. Heavy rainfall in the study area during the fortnight after planting negated the need for
further watering. Minimum-maximum thermometers were placed at each site, face-down at ground
level under adjacent vegetation, in November 1990 and read and reset every month.
In January 1992,14 months after planting, all plants were removed intact. Plants from the
three areas of predominantly indigenous vegetation were removed before anthesis so as to avoid
genetic contamination of adjacent natural populations of F. llovae-zelandiae. Each plant was
measured for height and basal diameter and the number of live tillers, dead tillers and culms were

165
counted. No plants had flowered in the 1990/1991 season so all culms present had been produced in
the 1991/1992 season.
A mixed-model analysis of variance was performed on five measures of performance. These
were:
(1) increase in height as a percentage of initial height,
(2) increase in basal diameter as a percentage of initial basal diameter,
(3) final number of live and dead tillers as a percentage of initial tillers,
(4) dead tillers as a percentage of the final number of tillers,
(5) number of culms per final number of live tillers.
Least significant difference (LSD) pairwise comparisons of means were performed on
population grand means across all sites and site grand means across all populations for each of the
five measures of performance.

166
5.6.2 Results
Climate differed between the four sites (Fig. 5.18, a & b). Thermometer readings were not taken for
June at Porters Pass or from July to October at Cass Saddle due to heavy snow falls burying the sites.
The Waddington site was the most moderate with higher minimum temperatures and intermediate
maximum temperatures. The Cass Saddle site was the most extreme, recording the lowest minimum
temperature and the highest maximum temperature of the four sites. The other high altitude site,
Porters Pass was less extreme possibly due to greater vegetation cover and topography; the plot at
Porters Pass was situated in a gully, whereas the Cass Saddle plot was situated on the exposed slope
of the saddle.
Deaths occurred only at the Waddington site where 11 plants out of 48 died. At the
remaining three sites all plants had at least some green leaves at the conclusion of the experiment.
Plants had initiated culms at every site but differences in timing of flowering meant that plants from
different sites were not at the same stage of culm development when the experiment was terminated.
As a result no comparison was made of culm height between sites. The timing of culm elongation was
also not recorded at each site because it was not anticipated that the plants would flower after just
one season in situ.
Dead plants at Waddington disintegrated rapidly so that at the end of the experiment the
plants were not sufficiently intact for tillers to be counted. In order to retain a balanced design for
analysis, dead plants were assigned values of -100% for increase in height and diameter, 100% for
dead tillers and zero values for tillers per initial tiller and culms per tiller.
Most plants at most sites decreased in height from the initial height measured in the
glasshouse. However plants that survived at Waddington increased enormously in diameter and tiller
number. The deaths at this site could well have been exacerbated by competition between adjacent.
tussocks. The largest observed increase in tillers was by a plant from Porters Pass growing at
Waddington that had 9 tillers when planted and 130 dead and 958 live tillers after 14 months at the
site, an increase of 12088%.
Results from a mixed-model analysis of variance indicated significant differences between
sites for all measures of performance (Table 5.13). The Waddington site was the most productive
with virtually all populations performing better there for all variables than at any other site. When site
grand means across all populations were compared using LSD tests, for all measures of performance
except culm production the difference between sites was due to the difference in performance
between Waddington and the others (Table 5.14).
There were also significant differences between the populations in mean performance across
all sites. The Porters Pass population out-performed other popUlations in all variables except culm
production, for which it was the least productive. Sugarloaf Fan was consistently third or fourth in
performance at all sites and for all variables except culm production (Table 5.14). The difference
among popUlations for percent dead tillers was due entirely to the difference between Sugarloaf Fan
and the other

8
(j) 6
::l ·00 4 (j) 0 III 2 (IJ
~ OJ 0 (IJ
~ 0.. -2 E .l!!
-4 E ::l E -6 ·c ·E
-8
-10
35
(j) 30 ::l ·00 (j) 0 25 III (IJ
~ OJ 20 (IJ
~
~ 15 .l!! E
10 ::l E .~
E 5
0
a
JAN FEB MAR APR MAY JUN JUL AUG SEP OCT NOV DEC month
___ Porters Pass -+- Sugarloaf Fan --- Cass Saddle -B- Waddington
JAN
b
FEB MAR APR MAY JUN JUL AUG SEP OCT NOV DEC month
___ Porters Pass -+- Sugarloaf Fan --- Cass Saddle -B- Waddington
Figure 5.18: Monthly (a) minimum and (b) m<L'(imum temperatures (oq read at ground level
over 12 months at each of four reciprocal transplant sites.
167

168
Table 5.13: Results of a mixed model analysis of variance for five variables associated with
performance of cloned F. novae-zelandiae tussocks in a reciprocal transplant experiment. NS
indicates value is not significant.
Source of % Diameter % Height Tillering % Dead Flowering Variation Increase Increase Rate Tillers Intensity
Site F 16.8 39.6 29.6 19.9 31.5
p< 0.001 0.001 0.001 0.001 0.001
Population F 5.97 3.40 12.5 3.19 2.85
p< 0.01 0.05 0.001 0.05 0.05
Site x Pop F 1.25 3.28 2.06 1.68 1.26
p< NS 0.01 0.05 NS NS .
Site x Clone F 3.31 3.73 1.73 4.50 3.49
within Pop p< 0.001 0.001 0.05 0.001 0.001

169
Table 5.14: Population means for (a) percent increase in diameter (b) percent increase in height
(c) percent increase in tiller number (d) percent dead tillers (e) culms per tiller of cloned F.
novae-zelandiae tussocks at each of four sites in a reciprocal transplant. Different superscripts
indicate a significant difference between population and site grand means using LSD tests.
Site: CSA PPS SLF Waddington Population Altitude (m): 1340 1000 670 350 Grand Mean
(a) Diameter
Cass Saddle 205.8 1665 141.9 457.6 243.0 c
Porters Pass 205.8 147.8 105.0 326.8 196.4 bc
Sugarloaf Fan 75.0 62.6 75.5 138.3 87.8 a
Waimak Gorge 35.6 55.1 51.8 307.9 112.6 ab
Site Grand Mean 130.6 a 108.0 a 93.6 a 307.7 b
(b) Height
Cass Saddle -43.0 -40.6 -35.2 -12.4 -32.8 ab
Porters Pass -47.5 -38.2 -30.3 23.6 -23.1 b
Sugarloaf fan -54.4 -47.4 -38.4 -33.5 -43.4 a
Waimak Gorge -62.5 -51.3 -46.2 4.82 -38.8 a
Site Grand Mean -51.9 a -44.4 a -37.5 a -4.35 b
(c) tiller number
Cass Saddle 481.7 353.6 329.7 1660 706.2 ab
Porters Pass 928.5 565.3 342.2 2543 1095 b
Sugarloaf Fan 240.0 185.4 193.6 676.1 323.8 a
Waimak Gorge 234.4 287.4 272.6 2300 773.7 ab
Site Grand Mean 471.1 a 347.9 a 284.5 a 1795 a
(d) % dead tillers
Cass Saddle 15.0 10.1 21.9 48.7 23.9 a
Porters Pass 6.39 9.40 16.5 41.1 18.3 a
Sugarloaf Fan 47.7 35.5 39.7 72.8 48.9 b
Waimak Gorge 18.6 24.8 36.7 33.9 28.5 a
Site Grand Mean 21.9 a 20.0 a 28.7 a 49.1 b
(e) culms tiller-1
Cass Saddle 0.03 0.22 0.11 0.12 0.12 b
Porters Pass 0.002 0.10 0.02 0.05 0.04 a
Sugarloaf Fan 0.02 0.13 0.10 0.07 0.08 ab
Waimak Gorge 0.01 0.19 0.08 0.10 0.10 b
Site Grand Mean 0.02 a 0.16 c 0.08 b 0.09 b

populations. The two high altitude sites differed significantly from each other in culm production
only. The two lower altitude sites differed significantly only in percent dead tillers.
170
Despite significant site and population effects only two variables, percent height increase and
percent increase in tiller numbers, showed a significant site x population interaction (Table 5.13). For
the remaining three measures of performance, populations showed no significant tendency to grow
best at their site of origin. However there was a significant difference among genotypes within
populations in performance at different sites (Table 5.13).

171
5.6.3. Discussion
The large differences in overall performance between the four sites emphasises the ability of this
species to respond plastically to changes in environmental conditions. Plants from all populations
responded with an impressive burst of tillering activity in the favourable growing conditions at the
lowest altitude site. Genetically identical plants showed very conservative rates of growth under the
harsher conditions of the highest altitude site.
The consistent differences between populations across all sites indicates that some
populations are innately more vigorous than others or have a better ability to respond plastically to
different environments. The ecological amplitude or adaptability of a population has often been
associated with its levels of genetic variation (Van Val en, 1965; Babbel & Selander, 1974; Allard et.
al., 1978; Nevo et. al., 1984; Antonovics et. al., 1988). The Sugarloaf Fan population which did so
poorly at all sites in the reciprocal transplant also contained fewer heterozygotes than Cass Saddle 'A'
or Porters Pass when analysed using isozyme electrophoresis (section 5.5). However this may simply
be a coincidence and as genetic variation was not examined in the Waimakiriri Gorge population the
relationship between ecological amplitude and heterozygosity cannot be tested here.
Lambrechtsen (1968) in a study of the perennial grass Allthoxallthul1l OdOl'at1ll1l found that
high altitude plants were more 'adaptable' when exposed to different experimental regimes than
lowland plants. In this study the two populations from high altitudes tended to perform best at all
sites. Plants in alpine environments have to cope with extremes in temperature, exposure and
physiological drought and yet m<L--amise growth during the shorter growing season. Species that are
restricted to an alpine environment are often genetically specialised to cope with the conditions and
often don't thrive when transplanted to a lowland environment (e.g. Dahl, 1951).
However bothA. odoratzllll and F. novae-zelandiae are widespread species. In alpine
populations of a widespread species the degree of genetic specialisation possible may be restricted by
the pre-existing genetic composition of the species. An alpine environment could instead selectively
advantage genotypes with well developed phenotypic plasticity (Bradshaw, 1965; Schlichting, 1986)
resulting in higher levels of adaptability among high altitude populations of widespread species. The
nature of a plastic response is under genetic control like any other character (Bradshaw, 1965;
Schlichting, 1986) and the plasticity of a character can evolve independently of the character it
controls (Scheiner & Lyman, 1991). This could be a possible explanation of the superior performance
of the two high altitude populations of F. novae-zelandiae in this study.
There also appears to be a difference between the two high altitude populations in allocation
of resources to vegetative growth versus reproduction. Both populations responded equally in terms
of increase in size and tiller number but while plants from Cass Saddle produced the most culms on
average, plants from Porters Pass produced the least. A difference in resource allocation between
these two populations has already been suggested as a partial explanation of differences in stage-class
distribution (Section 4.4).
The Porters Pass population represents a high altitude form of F. llovae-zelandiae that is not
genetically distinct (Section 5.5). Nor does it appear to be specifically adapted to an alpine
environment versus a lowland one. None-the-Iess, it would appear that this population differs in the

nature and timing of resource allocation to reproduction compared with the other high altitude
population examined.
172
Espie (1987) found evidence for ecotypic differentiation between populations of F. novae
zelalldiae in terms of their response to added nutrients during a glasshouse pot trial. However when
he conducted a reciprocal transplant he found that differences between the populations in growth and
flowering were not due to local genetic specialisation but were more a function of site conditions. The
present study, using four different popUlations from a wider range of sites than those of Espie (1987).
However the lack of a significant interaction between populations and sites for most variables
measured indicates that only limited ecotypic differentiation has occurred among these populations in
terms of the demographic attributes of growth and survival. This finding is in agreement with the
results from the isozyme analysis (Section 5.5) which indicated that between-population genetic
differentiation was not high.
The significant interaction between sites and genotypes indicates that considerable
differences exist within populations in terms of ability to respond to different environments. This
result exactly parallels the findings of Rapson & Wilson (1988; 1992a) who tested between-population
differentiation inAgrostis capillaris. They found little evidence of adaptation to different
environments among populations in terms of growth, floral phenology and tiller population dynamics.
The majority of variation they observed was due to differences between genotypes rather than
populations and the effect of phenotypic plasticity. However they did find differentiation among
popUlations in response to site differences in soil-water availability and soil nitrogen and phosphorus
levels (Rapson & Wilson, 1992b).
Lack of ecotypic differentiation, with respect to growth and reproduction, has been reported
on several occasions among popUlations of widespread perennial grasses. Mark (1965c) conducted
reciprocal transplant experiments with Chionochloa ligida, a long-lived New Zealand tussock grass,
using characters of morphology, phenology and growth as measures of performance. He recognised
one distinctive high-altitude ecotype but found little difference between the remaining lower altitude
popUlations. His distinctive ecotypewas later described as a separate species (c. macra) and
therefore his experiments showed that there was little ecotypic differentiation between populations of
C. rigida sensu stlicto.
Similarly Platenkamp (1990) found little evidence of ecotypic differentiation for survival and
reproductive output in a reciprocal transplant experiment with Anlhoxanthlllll odoratlllll. In his study,
phenotypic plasticity accounted for almost all of the observed variation in mortality and reproductive
output. However Lambrechtsen (1968) found marked differences between populations of
Allthoxanthlllll odoratlllll in their ability to extract soil nutrients that related to nutrient availability at
the sites. Also Lee et al. (1983) found evidence for ecotypic differentiation with respect to ultramafic
tolerance in bothAllthoxanthum odoratlllll andAgrostis tenuis (= capillads).
Roy (1985) compared demographic and phenological attributes of populations in contrasting
environments for two grass species, BrOl1lliS erectlls and Dactylis glomerata. As in this study and that
of Rapson & Wilson (1988, 1992a) she found high within-population variation but little evidence for
ecotypic differentiation in overall performance. She suggested that this lack of differentiation is due
to the buffering capacity of polyploidy and the long life-span of these species.

173
The above findings, and the results of the present study when considered in light of Espie
(1987), would indicate that ecotypic differentiation with reference to the physiology of nutrient uptake
evolves more readily, or is more readily detected, than differentiation in the demographic characters
of growth and reproduction. Studies involving only a limited set of attributes, that claim to have found
or not have found ecotypic differentiation should therefore be careful to state that their findings are
relevant to those attributes only and don't necessarily represent the overall evolutionary condition of
the species.

174
5.6 SUMMARY AND DISCUSSION OF CHAPTER 5.
The pattern of variation among tussock Festllca in mid-Canterbury is dominated by the patterns of
variation in rainfall, altitude and temperature in the study area. These environmental factors
influence not only the vegetation in which populations of tussock Festllca occur but also patterns of
morphological and biochemical variation among them.
The ecological differentiation of F. matthewsii and F. novae-zelandiae s.s. is paralleled by
morphological and phenological differences; however biochemical differences are less marked. For
most characteristics investigated the differences between the two species were quantitative (for
example, significantly different species means for continuously distributed variables), rather than
clear-cut dichotomous distinctions. A similar lack of clear-cut distinctions in the leaf anatomy of F.
novae-zelandiae and F. matthewsii was found by Connor (1960). The plants he examined showed
considerable variation in anatomical characters but none of it related to taxonomic, ecological or
geographic groupings.
The results of the present study indicate that F. Ilovae-zelalldiae s.s. and F. matthewsii intergrade
ecologically and morphologically. Populations possessing intermediate characteristics occur in higher
rainfall areas just east of the Main Divide. This intergradation may be due to hybridization between
the two species, although Connor (1968) was doubtful as to the occurrence of hybrids in the field. If
the observed zone of intermediacy is a hybrid zone, the differential adaptiveness of the parent species
probably acts as an genetic isolation mechanism and restricts hybridization to a relatively small
contact area. A similar situation has been found for hybridizing subspecies of sagebrush; the hybrid
offspring are not competitive in the habitats of either parent and are restricted in a narrow zone of
intermediate conditions (Freeman et al., 1991). Whether due to hybridization or selection, both the
morphological and isozyme data indicate that F. novae-zelmidiae s.s. in higher altitude environments
becomes more similar to F. matthewsii. The observed morphological similarities between F. novae
zelandiae s.s. from higher rainfall sites and F. matthewsii appear to be both phenotypic and genetic.
The results of the present study indicate that "high altitude" F. Ilovae-zelandiae possesses
genetically-fixed morphological and phenological differences that distinguish it from F. novae
zelandiae s.s. Scott (1970) also found genetically determined differences between two taxa in relative
growth rates at low temperatures; "high altitude" F. llovae-zelandiae grew optimally at 12 °C whereas
F. llovae-zelandiae S.S. grew optimally at 18 °C. The ordination analysis of vegetation composition at
sites containing these teem indicated that "high altitude" F. novae-zelandiae and F. novae-zelandiae s.s.
are ecologically distinct; the vegetation at sites containing "high altitude" F. novae-zelandiae appeared
to differ more from sites containing F. novae-zelandiae s.s. than the latter did from sites containing F.
matthewsii.
However, some of the morphological differences found between these two taxa in the field
appeared to be the result of phenotypic plasticity. Moreover, the popUlations regarded as "high
altitude" F. novae-zelandiae based on morphology and ecology showed no isozymic differentiation
from F. novae-zelandiae s.s. but, rather, most resembled adjacent F. Ilovae-zelandiae S.S. populations
in similar environments. This could suggest that these two taxa are not sufficiently differentially
adapted to their different environments to prevent gene-flow from maintaining relative levels of

175
similarity between their gene-pools. Also selection or random drift may not have had much impact on
the respective gene-pools. Alternatively these two taxa could have diverged only recently.
Unfortunately the genetic data are insufficient to determine whether "high altitude" F. novae
zelandiae originated only once or has had mUltiple origins. However it is apparent that "high altitude"
F. novae-zelalldiae is a distinct ecotype within F. llovae-zelalldiae.

176
CHAPTER 6: SYNTHESIS AND CONCLUSIONS.
Among the grasses of New Zealand, large tussock grasses in the endemic genus Chionochloa have
received the most attention from researchers. This attention has been justified considering the
dominant role of members of this genus in New Zealand montane and alpine grasslands. F. novae
zelandiae is an ecologically important, widespread indigenous grass of lowland and montane grassland
and is therefore also worthy of intensive study. The present study contributes to the understanding of
the biology of Festllca novae-zelalldiae. Few other indigenous herbs have been studied in as much
detail and from such a broad range of aspects.
In this final chapter I will summarise the principal findings of the present study and examine
how these findings challenge previously published hypotheses concerning F. novae-zelandiae. I will
also comment on the likely future of F. novae-zelandiae in the face of land degradation and biological
invasion. Finally I will examine how the findings of my studies apply to evolutionary and ecological
theories concerning 'life-history strategies' and 'adaptation' in long-lived, perennial grasses.
6.1 The Biology of' Festllca novae-ze!andiae
The reproductive biology of F. novae-zelandiae is characterised by many, annual reproductive
episodes, the intensity of which varies in response to annual fluctuations in climatic conditions and
resource availability. While reproduction between years varies significantly, the differences from year
to year are smaller than differences displayed by 'masting' species (Silvertown, 1980) such as
Chionochloa species (Kelly et al., 1992).
There are significant differences in reproductive expenditure among individuals. Many of the
individuals studied did not flower at all in four years, and the majority of individuals did not flower
every year. Plants that did flower every year also produced the most culms and set the most seed.
Since F. novae-zelandiae flowers are hermaphroditic, pollen production and therefore the total
contribution of individuals to seeds will follow this pattern of seed production. As a result, the total
reproductive output of a population would tend to be dominated in successive years by just a few
individuals.
Seeds of F. novae-zelandiae tend to fall adjacent to the parent plant and seed rain
patchiness is a consequence of the patchy distribution of reproductive tussocks. However dispersal
over longer distances occurs in strong winds and has undoubtedly been important in the colonisation
of new habitats by F. novae-zelandiae.
Seed viability was found to be high and in artificial storage, seeds remained viable for at least
a year. The majority of seeds germinated readily, confirming the findings of Dunbar (1970). Seedling
emergence in the field occurred mainly in the autumn, so under natural conditions seeds probably
germinate within a few weeks of falling.
The present study found that seedlings of F. novae-zelandiae were relatively common in
natural stands, particularly on mat-vegetation and had a half-life of 12 months. While none of the
seedlings monitored grew to more than the two-tiller stage, the presence of "juvenile" tussocks « 1
cm diameter, 5 - 10 tillers) in the population indicated that some seedlings are becoming established.

177
This contrasts with previously published observations that seedlings were uncommon in short-tussock
grassland and establishment rare (Boyce, 1939; Sewell, 1947; Moore, 1976; Espie, 1987). It also
contrasts with statements that seedlings established exclusively in litter at the base of large tussocks
(Sewell, 1947, 1952). The difference in findings between those studies and the present study could
reflect differences between the various study areas in microclimatic factors effecting seedling survival
but may also reflect differences in the intensity of search. In the present study, seedling substrate
preference differed between two study plots, presumably due to differences in factors causing
mortality.
Seedling density was more affected by the availability of 'safe-sites' than by variation in seed
rain. This appears to be a feature of stable populations of long-lived perennials (Andersen, 1989).
Seedling mortality was higher than has been recorded for Chiollochloa rigida (Mark, 1965b) and
seedlings grew slowly. Those seedlings that did survive more than a year did not increase appreciably
in size, as had been observed elsewhere for F. llovae-zelalldiae seedlings by Moore (1976). Seedling
survival to the juvenile stage appears to be the critical phase in the regeneration of F. Ilovae-zelandiae
by seed.
The inequality of reproductive output belween F. novae-zelandiae individuals results in an
L-shaped fecundity distribution (Fig. 3.1) typical of many plant popUlations (Harper, 1977; Levin &
Wilson, 1978). Such a fecundity distribution can accelerate the response of a population to selection,
irrespective of generation time, if the most fecund individuals possess favourable genotypes (Levin &
Wilson, 1978). For long-lived species, the environment encountered by successive cohorts of offspring
may change during the course of the parents reproductive life (Levin, 1978). The attributes possessed
by the parent that have enabled it to be reproductively successful may not necessarily confer seedling
success. In addition, the attributes possessed by the parent that enabled it to survive as a seedling may
no longer be adaptive if environmental conditions have changed. This means that the fitness of
individuals, in terms of the number of offspring that reach reproductive maturity, is not necessarily
correlated with fecundity. The result obtained by the model of Levin & Wilson (1978), that an L
shaped fecundity distribution can increase the response rate to selection, therefore does not apply to
species where the generation time is equal to or greater than the periodicity of environmental
fluctuations.
In a closed grassland such as that at Cass, the chances of a seed landing in a suitable site and
surviving to germinate and become established are low. Recruitment of young plants to the adult
population therefore probably occurs only at low levels in closed grassland. However, it may be more
common on more open sites such as young river terraces colonised by mat-vegetation (Calder, 1958,
1961). Due to the longevity of individuals and the changes that have occurred in montane grassland in
the last 50 years (Rose, 1983; Scott et al., 1988; Treskonova, 1991; White, 1991), the observations
made in the present study on seedling emergence and survival may be atypical of the conditions under
which the adults in the Sugarloaf Fan popUlation became established.
The reproductive strategy of a species is intimately associated with its life-span and the
nature of the environment in which it occurs (Giesel, 1976; Harper, 1977, Lloyd, 1980a). FestZlca
novae-zelandiae is a long-lived species and an individual can reproduce many times during its life
span. Flowering, seedling establishment or recruitment failure in one year, or even many successive

years, does not necessarily have the same consequences for a long-lived species as it would for a
short-lived species (Mark, 1965b; Harper, 1977).
178
Longevity and iteroparity are often, but not always, found together in plant species. When
the probability of reproductive success varies through time, long-lived individuals which reproduce in
many, approximately equal episodes during their life-time may have a higher fitness than shorter
lived individuals reproducing in fewer, larger episodes (Giesel, 1976). This can also be the case when
mortality is high among offspring but low among adults (Giesel, 1976). By spreading reproductive
expenditure among many years, there is more chance of seed being available in those years which are
more favourable for seedling establishment and survival.
The reproductive expenditure of F. novae-zelandiae from culm production to seedling
recruitment is conservative but sustained. As a result this species is relatively unaffected by short
term fluctuations in the favourability of conditions for regeneration from seed. Longevity and
iteroparity mean that, should conditions change to favour seedling survival, seed will always be
available. The reproductive strategy of F. novae-zelandiae could be seen as a response to an
unpredictable, temporally heterogeneous environment that affects seedling more than adult survival.
A number of authors (e.g. Zotov, 1938; Sewell. 1952; Moore, 1977; Espie, 1987) have
suggested that fragmentation of F. novae-zelandiae tussocks into several independent plants provides
a mechanism for the maintenance of tussock numbers in what they perceived to be the absence of
seedling recruitment. The present study found, with the aid of isozyme electrophoresis, that clonal
fragmentation involving short distances had possibly occurred. However, the levels of fragmentation
found discount this process as an important mechanism for the maintenance of popUlation density in
the grassland studied.
The population dynamics of F. Ilovae-zelalldiae, at both the level of tillers within tussocks
and tussocks within populations, are characterised by flexibility in the face of environmental
heterogeneity. The dynamic nature of the tiiler population that comprises an individual tussock of F.
novae-zelandiae provides a means by which risk can be spread among many functionally equal units
and expenditure can be adjusted seasonally to accommodate environmental change (White, 1979).
The findings of this study with regard to the dynamic nature of the tiller popUlation within a tussock
discount previously published statements by Sewell (1947, 1952) about slow growth and lack of
change in F. novae-zelandiae individuals.
The modular structure of tussock grasses means that genets are potentially immortal, but are
composed of modules each of which is only a few years old. The continual replacement of modules
allows the genet as a whole to increase or decrease in size in response to environmental fluctuations
(Harper, 1977; White, 1979). As a result, chronological age and tussock size and vigour are quite
unrelated and adult mortality is low. For plants like F. novae-zelandiae where genets are potentially
immortal and adult mortality low, genetic differentiation through random drift or selection will be
low, because of low levels of turnover in established populations, i.e. long generation times (Levin &
Wilson, 1978).
The present study examined in detail the use of a stage-based approach (reviewed in Gatsuk
et al., 1980) to the investigation of popUlation structure and dynamics in F. novae-zelandiae. It was
found that 'natural' stage-classes could be defined relatively objectively using discriminant analysis,

179
and that the resulting classes were useful in terms of elucidating developmental pathways in the
species studied. It was also found that individuals did not proceed in a linear sequence from small,
healthy plants, through large, reproductive classes, to become decrepit and then die. This linear
progression through classes is often implied by descriptive stage-class studies (e.g. Gatsuk et al., 1980;
Vorontzova & Zaugolnova, 1985; Zhukova & Ermakova, 1985). The present study found that the size
and 'vigour' of particular F. Ilovae-zelandiae individuals changed dramatically (both increasing and
decreasing) within the space of only two years, in response to short-term environmental fluctuations.
This has important implications for stage-based studies of population structure in similar species. The
study conducted by Rose & Platt (1990), for example, used stage-classes to reconstruct the
establishment history of Chionochloa pallens populations. If this species is as plastic in its growth
response to environmental fluctuations as F. llovae-zelandiae, then Rose & Platt's results relate more
to differences in environmental conditions between sites, than the chronological age of individuals
and populations.

180
6.2 Evolution within New Zealand Tussock Festl.lca.
Species can respond to new or changed environmental circumstances in two ways; individuals can
adjust phenotypically and populations can shift in genetic constitution (Lewontin, 1957). Of course
these two types of responses are not mutually exclusive and species can and do respond in both ways.
Tussock Festl.lca in New Zealand displays both types of patterns in response to recent and earlier
environmental changes.
The amount of differentiation that has occurred within F. novae-zelandiae s.s. varies,
depending on the attribute being considered. Morphologically there are apparently genetically-fIxed
differences between popUlations that reflect different environmental conditions. There also appears
to be biochemical differentiation among popUlations and Espie (1987) found differentiation among
popUlations with respect to nutrient uptake.
Phenologically there is no discernible differentiation among populations of F. novae
zelandiae s.s., even though the populations came from quite different environments. Neither was any
'home-site advantage' evident, in terms of survival, growth and flowering, in a reciprocal transplant
experiment involving four popUlations from markedly different habitats.
Variation within F. llovae-zelalldiae S.S. is therefore a complex problem. It would appear that
different attributes have evolved at different rates and that selection has not equally affected all
aspects of the biology of the species.
The three entities studied, F. llovae-zelandiae S.s., 'high altitude' F. novae-zelandiae and F.
matthewsii, appeared to be characterised by ecological and genetic differentiation at the level of
taxonomic units within a coenospecies, and plasticity or generalisation with limited differentiation, at
the level of populations.
The findings of this study support the conclusions of Connor (1960, 1968) that F. llovae
zelandiae s.l. and F. matthewsii are a closely related pair of ecologically and morphologically
differentiated, but somewhat intergrading, species. Despite being differentiated in some aspects they
can be easily crossed to produce fully fertile hybrids (Connor, 1968) and the present study found little
biochemical differentiation between them. Lack of reproductive isolation between otherwise
differentiated species is often associated with generalist species occupying a range of habitats (Grant,
1971; Stebbins, 1989). As well as being a feature of generalists, morphological and ecological rather
than genetic differentiation appears to be a feature of recently evolved species complexes (Grant,
1971; Fisher, 1973; Coates & Hnatiuk, 1990; Vickery, 1990). However, measures of differentiation
obtained from isozyme frequencies and analysis of morphological traits are not necessarily
comparable. Lewontin (1984) established that it was much harder to detect significant differences in
gene frequencies than in morphological traits when the loci influencing the traits were equally
differentiated.
Connor (1968) expressed scepticism concerning hybridization between F. novae-zelandiae
and F. matthewsii in the fIeld. The present study'S finding of clinal variation in morphological
characters in populations at the distributional boundary between the two species, while not providing
conclusive evidence of a natural hybrid zone, strongly suggest that one could well exist.

181
The findings of this study concerning 'high altitude' F. llovae-zelandiae support the
suggestions of Connor (1960, 1968) and Connor & Edgar (1986) that this represents a partially
differentiated, but none-the-Iess distinctive, entity within F. llovae-zelalldiae. It probably arose from
populations isolated above timberline during a mild, forested period in the history of South Island,
but has evolved features more usually associated with F. matthewsii, possibly due to the selective
pressure of a similar environment.

182
6.3 The Future of F. llovae-zelandiae
O'Connor (1991) used a life-history approach to postulate the occurrence of an 'extinction-prone
perennial grass' as an element in many perennial grasslands. He suggests that such a grass would
typically be palatable, obligate seed reproducer with a poorly developed seed-bank, producing low
numbers of large seeds that are poorly dispersed. Such a grass could easily become locally extinct
under the combined influences of drought and heavy grazing.
O'Connor's model, while developed for C 4 grasses in semi-arid grassland, also may account,
in part, for the replacement of Chiollochloa species by F. llovae-zelalldiae following the advent of
pastoral farming in montane Canterbury (Connor & MacRae, 1969). Compared with Chionochloa
species, F. llovae-zelalldiae is less palatable, more tolerant of burning (O'Connor, 1982, 1986) and,
as the present study reveals, it flowers and produces seed every year.
In present-day montane short-tussock grassland, F. llovae-zelalldiae has, to some extent,
assumed the role of the 'extinction-prone perennial'. In comparison with invasive adventive grasses
such as Agrostis capillaris, Allthoxallth1ll1l odorat1l11l, Daclylis glomerata and Festllca ntbra, F. llovae
zelandiae is slow-growing and somewhat uncompetitive (e.g. Scott, 1970). However, a major factor
that limits the 'extinction-proneness' of F. llovae-zelalldiae is its unpalatability and low feed value
(Dryden & Archie, 1980). Grazing by sheep may become an important tool in some localities for the
maintenance of tussock populations in modified grassland (Meurk et al., 1989; Lord, 1990).
However, in other situations (e.g. in dry climates with light soils such as in the MacKenzie Basin and
Central Otago) F. Ilovae-zelalldiae is succumbing under combined pressure from periodic drought,
rabbit grazing, declining soil fertility and competition from invasive plants such as Hieracillln pilosella.
The environmental conditions that provided the window of opportunity for F. Ilovae
zelandiae to expand its range, no longer exist. Competition from adventive species, land degradation
and pastoralisation are bringing about range contraction in F. Ilovae-ze!andiae, particularly in the
lowland and montane zones (Scott, 1979; O'Connor, 1982; Scott et al., 1988). The invasion of
montane grassland by adventive species, such asAgrostis capillaris, Anthoxanthlll71 odoratllJ71, Festllca
ntbra and Hieracillnt species (Rose, 1983; Scott et al., 1988; White, 1991; Treskonova, 1991), means
that in many areas the majority of adult tussocks in existence today will not be replaced. This is not
unusual for the species. In pre-human New Zealand analogous situations would have occurred where
F. novae-zelalldiae occupied sites for only one or two generations before being competitively excluded
by other species, particularly woody species such as Discaria tOlll7latoll (Calder, 1957, 1961).
The long-term result of such a selective elimination of lowland populations and the survival
of higher-altitude populations may be to force the means of some character traits in F. novae~
zelandiae towards those of F. matthewsii. Range contraction could therefore potentially have more of
an influence on evolution within F. llovae-zelandiae than range expansion has.

183
6.4 Generalist and Specialist 'Strategies' in Long-lived, Perennial, Polyploid Grasses.
The ability of an organism to adapt to its environment is determined by genetic constraints and the
temporal and spatial scale of environmental heterogeneity with reference to the organism's life
history.
The life-history and genetic background of F. llovae-zelalldiae limits the degree to which this
species can genetically track environmental changes. Adults are long-lived and seedling establishment
rates are low. Populations are most probably dominated by pioneer cohorts and the reproductive
output of a population is dominated by a few individuals. All these factors contribute to genetic
inertia in the face of selective forces and resistance to differentiation among populations in different
environments by random processes.
Polyploidy further increases the resistance of F. llovae-zelalldiae to genetic change. As
polyploidy acts as a store of variation, populations would be buffered against founder effects and
random drift. Mutation in anyone gene would have less effect on the genotype as a whole than would
be the case in a diploid species (Lewis, 1980).
However the modular structure and perpetual somatic renewal of the tussock habit is a
perfect vehicle for tracking short-term environmental changes through phenotypic plasticity (White,
1979). Individuals are able to endure periods of unfavourable conditions and then respond rapidly to
an improvement in the environment. As a result the structure of populations of tussock species such
as F. llovae-zelalldiae is more a product of its recent past than of its age structure or establishment
history.
All these features of F. llovae-zelalldiae argue for the greater importance of phenotypic
plasticity rather than genetic differentiation as a means of coping with environmental change.
However it is the scale of environmental heterogeneity that is important. F. llovae-zelalldiae would
appear to utilise phenotypic plasticity and an all-purpose genotype to track short-term environmental
change. Nevertheless, the present study indicates that genetic differentiation has occurred within F.
llovae-zelalldiae in response to selection pressures that have been operating over long time-scales (i.e.
thousands of years).
Patterns of variation in morphological and biochemical characters between populations
indicate that F. llovae-zelandiae appears to be genetically attuned to long-term environmental trends
and large-scale environmental gradients. This conforms with the findings of McMillan (1956, 1957,
1959) that genetically-fL,<ed differences in the phenology of long-lived North American grasses reflect
large-scale climatic differences and day length variation among their sites of origin. Of necessity and
as a function of the species' biology, F. llovae-zelandiae adopts a generalist strategy in the face of
short-term or small-scale heterogeneity.
The expansion of F. Ilovae-zelalldiae into the new habitats created by human deforestation
and disturbance was undoubtedly facilitated by pre-existing genetic adaptation to broad climatic
regimes. Opportunistic generalist behaviour in combination with a capacity for plastic response were
probably more important in bringing about such a dramatic range expansion.
The genetic, phenotypic and life-history attributes displayed by F. Ilovae-zelalldiae typify a
hitherto poorly recognised common suite of attributes characteristic of long-lived, polyploid, out-

184
crossing grasses. These species are characterised by high within-population genetic variation, low
between-population genetic differentiation and generally high phenotypic plasticity. Typically there is
little differentiation among populations in morphology, or the demographic characters of growth and
reproduction when tested with reciprocal transplant experiments. However physiological differences
between populations are more common. Some or all of these attributes have been found inAgrostis
capillaris, Anthoxanthlll11 odoratlll71, Brol1l11S erectlls, Calamagrostis canadensis, Chionochloa rigida,
Dactylis glomerata and HolcllS lanatus.
Agrostis capillaris exhibits the same pattern of high within-population and low between
population variation in isozymes as F. novae-zelandiae (G. Rapson, pel:\'. COI1lI1l.). Reciprocal
transplant experiments found little differentiation among popUlations in attributes of growth,
phenology and reproduction (Rapson & Wilson, 1988, 1992a). However standard garden and pot
trials have revealed differences in response to fertiliser and soil water as well as ecotypic
differentiation in heavy metal tolerance in this species (Gregory & Bradshaw, 1965; Snaydon &
Davies, 1982; Lee et al., 1983; Rapson & Wilson, 1992b).
Platenkamp (1990) tested for adaptive differentiation among populations ofAnthoxanth1l11l
odoratllm using a reciprocal transplant experiment and found no evidence of significant divergence
in characters of survival, reproductive output and growth. Yet Antho;'canthu11l odoratlU11, likeAgrostis
capillaris, has been shown to form specialised races under strong selective pressures involving mineral
nutrition, such as ultramafic and heavy metal contaminated soils or in manipulated experimental plots
(Lambrechtsen, 1968; Antonovics & Bradshaw, 1970; Lee et al., 1983; McCain & Davies, 1983).
Roy (1985) found high within-population variation in above-ground biomass in hexaploid
and octaploid Brol1llls erectlls and tetraploid and hexaploid Dactylis glomerata but no significant
difference between populations. She also found no significant differences between popUlations for
germination, root and shoot growth, phenology or seed weights despite the populations coming from
quite different environments. Lumerat (1984) investigated the isozyme profile of D. glomcrata and
also found high within-population diversity.
MacDonald et al. (1991) found that populations of tetraploid Calamagrostis canadensis had
failed to differentiate isozymically to any great extent despite occurring in different vegetation types.
The findings of Mark (1965c) indicated little ecotypic differentiation in Chionoch/oa rigida in terms of
morphology, growth and reproduction, yet this species contains distinct triterpene methyl ether
synthesising and -nonsynthesising chemodemes within the vicinity of Mark's sludy area (Connor &
Purdie, 1976).
Billington et af. (1990) transplanted HolcliS lanatus individuals between habitats and found
that the amount of morphological variation due to genetically-fixed population attributes was low
compared to the influence of phenotypic plasticity. Other studies of long-lived herbaceous species,
e.g. RanllllculllS repens (Lovett Doust, 1981) and Plantago lanceolata (Antonovics and Primack, 1982),
have revealed a similar predominance of environmental effects and phenotypic plasticity over genetic
popUlation differentiation.
Several suggestions have been made concerning the lack of differentiation in certain
attributes among long-lived, polyploid grasses. The populations in some studies may have had
insufficient time in new environments for selection to produce differences between popUlations in the

185
attributes investigated, e.g. introductions to New Zealand like Agl'Ostis capillmis (Rapson & Wilson,
1988) or pasture species such asAnthoxanth1l11l odoratzll1l on recently abandoned farmland
(Platenkamp, 1990). Also the selection differential between the sites studied may not have been large
enough to produce adaptive variation in demographic attributes and the lack of strong directional
selection may have precluded the development of specialised races (Platenkamp, 1990).
The attributes listed above, of high levels of variation but low levels of differentiation, are
particularly a feature of polyploid species. Polyploids are thought to be generally more tolerant of
stress and extreme conditions (Levin, 1983). They can function as generalists and occupy a wider
ecological niche than comparatively 'specialist' diploid relatives (Roose & Gottlieb, 1975; Lumerat,
1985). This would appear to be due to their higher stores of fixed and / or segregating genetic
variation promoting biochemical diversity at the level of individuals (Adams & Allard, 1977; Gottlieb,
1981
The apparently contradictory findings outlined above indicate that adaptation to
environment does not necessarily take the form of morphological or demographic differentiation.
Perhaps the physiology of perennial, long-lived polyploid species is more amenable to evolution via
natural selection than its overall morphology or behaviour. Grime (1979) lists physiological
adaptation without morphogenetic change as a feature of stress-tolerant species. However, the
species listed above do not all resemble Grime's concept of a stress-tolerator. Rather they display
attributes associated with each of his three primary strategies - competitive stress-tolerant and
ruderal; their ability to compete or tolerate is more dependent on the specific edaphic and biotic
circumstances of the habitat.
In the above studies, those in which differences were found between populations from
different environments largely involved pot or garden trials, experimental manipulation or very strong
environmental gradients. Those studies that have failed to find evidence for ecotypic differentiation in
long-lived perennial grasses have typically involved reciprocal transplants in 'natural' habitats.
'Natural' habitats are usually characterised by small scale spatial patchiness and temporal variation.
Fitness differences between popUlations in characters of growth and reproduction may only become
apparent when compared over a sufficient number of 'normal' and 'extreme' years (Thoday, 1953).
As a result, laboratory experiments on adaptation can be misleading. Harper (1977, p769) explained
it thus - "Organisms in nature live in environments that contain rhythms and unpredictabilities,
patterns and noise. The environment varies both in space and time and although it is apparently
rather easy for many out-breeding organisms to adapt to a stable or reliably rhythmic environment,
nature sets an infinitely more difficult problem of adaptation to environments that are unstable."
Different attributes evolve at different rates (Stebbins, 1983) and selection for differentiation
in response to environmental differences will not necessarily act equally on all aspects of the biology
of a species. This does not mean that I advocate the trait-by-trait approach to adaptation criticised by
Gould & Lewontin (1979). Nonetheless, the degree of differentiation between populations is bound
to differ between different types of traits because when variation in a single trait confers fitness,
selection will act on that trait alone. Even when selection acts jointly on a range of traits expressed in
the phenotype, the effect of selection will differ between traits because of differences in heritability,

selective advantage and developmental correlation (Gould & Lewontin, 1979; Stebbins, 1983;
Bradshaw, 1984).
186
In long-lived perennial species of modular construction such as F. llovae-zelandiae, the
challenges posed by environmental variation and novel habitats can often be met by phenotypic
plasticity (White, 1979). In the case of environmental variation at a scale less than the generation
time of the organism, its response to environmental heterogeneity can only be plastic (Bradshaw,
1965; Lloyd, 1984; Schlichting, 1986). However this does not necessarily represent a limitation. If a
species possesses an all-purpose genotype (e.g. Baker, 1965) and can adjust plastically it can
potentially perform as well as genetically specialised species which closely track the environment,
provided environmental fluctuations remain within its tolerance range.
The wide ecological amplitude of F. llovae-zelandiae, facilitated by biochemical diversity, a
generalist life-history strategy and phenotypic plasticity as well as differentiation in some attributes,
has enabled this species to adjust to environmental change at a range of spatial and temporal scales.
In addition it has been able to take advantage of opportunities created by human disturbance. These.
characteristics are possibly widespread among New Zealand's indigenous long-lived herbs. Just as the
generalist strategies prevalent in the floral biology of New Zealand plants are probably adaptations to
an unpredictable assemblage of generalist pollinators (Lloyd, 1985), so could generalised life-histories
and conservative levels of, at least demographic and morphological, adaptation, be a response to
unpredictable or 'untrackable' environmental variation.

187
Acknowledgements
I am very grateful to my supervisors Drs Dave Kelly and Colin Burrows for their time, effort and
encouragement. Thanks also to Dr David Norton for patient advice and help with field work, and Dr
Richard Woollens for help with statistical problems. Input from many people influenced this study; I
particularly thank Dr Henry Connor, Prof. David Lloyd, Prof. John Lovis, Dr Colin Meurk and Dr
Josephine Ward.
I am particularly grateful to the Miss E. L. Hellaby Indigenous Grassland Research Trust
and the University Grants Committee for financial support during this study. I thank Prof. Geoff
Sweet for allowing use of the School of Forestry Isozyme Laboratory and Dr Helen Billington for
assistance with the technique. I also thank Dr Andy Struman for making available Department of
Geography climate data. I acknowledge technical support from David Condor, Dougal Holmes,
Manfred Ingerfeld, Karl Schasching and Graeme Young. I thank the Department of Conservation for
permission to work in and collect material from conservation land.

188
REFERENCES
Adams, W. T.; Allard, R. W. 1977: Effect of polyploidy on phosphoglucose isomerase diversity in Festuca microstachys. Proceedings of the National Academy of Science, USA 74 1652 - 1656.
Allan, H. H. 1961: Flora of New Zealand, Volume I. Government Printer, Wellington.
Allard, R. W.; Miller, R. D.; Kahler, A. L. 1978. The relationship between degree of environmental heterogeneity and genetic polymorphism. pp 49 - 74 ill Freyson, A. H. J.; Woldendorp, J. W. (editors), Stmcture and FUllctioning in Plant Populations. North Holland Publishing Co., Amsterdam.
Andersen, A. N. 1989: How important is seed predation to recruitment in stable populations of longlived perennials? Oecologia 81 : 310 - 315.
Anderson, E.; Stebbins, G. L. 1954: Hybridization as an evolutionary stimulus. Evolution 8: 378 - 388.
Antonovics, J.; Bradshaw, A. D. 1970: Evolution in closely adjacent plant populations. VIII. Clinal patterns at a mine boundary. Heredity 25: 349 - 362.
Antonovics, J.; Primack, R. B. 1982: Experimental ecology and genetics in Plantago. VI. The demography of seedling transplants of P. lanceolata. Journal of Ecology 70 : 55 - 75.
Antonovics, J.; Ellstrand, N. C.; Brandon, R. N. 1988: Genetic variation and environmental variation: expectations and experiments. pp 275 - 303 ill Gottlieb, L. D.; Jain S. K. (editors), Plant EvolutionalY Biology. Chapman and Hall, London.
Armstrong, J. B. 1880: A short sketch of the flora of the province of Canterbury, with catalogue of species. Transactions of the New Zealand Institute 12: 325 - 353.
Armstrong, J. F. 1870: On the vegetation of the neighbourhood of Canterbury, including Riccarton, Dry Bush, etc. with introductory remarks on the distribution of plants in the province of Canterbury, by J. Haast. Transactions of the New Zealand Institute 2: 118 - 128.
Armstrong, J. F.; Armstrong, J. B. 1872: Notes on grasses indigenous to the province of Canterbury. Transactions of the New Zealand Institute 4 : 301 - 304.
Ayre, D. J.; Whelan, R. J. 1989: Factors controlling fruit set in hermaphroditic plants: studies with the Australian Proteaceae. Trends in Ecology and Evolution 4 : 267 - 272.
Babbel, G. R.; Selander, R. K. 1974: Genetic variability in edaphically restricted and widespread plant species. Evolution 28 : 619 - 630.
Babcock, R. C. 1991: Comparative demography of three species of scleractinian corals using age- and size-dependant classifications. Ecological Monographs 61 : 225 - 244.
Baker, H. G. 1965: Characteristics and modes of origin of weeds. pp 147 - 172 in Baker, H. G.; Stebbins, G. L. (editors), The Genetics of Colon ising Species. Academic Press, New York.
Barrett, S. C. H.; Shore, J. S. 1989: Isozyme variation in colonizing plants. pp 106 - 126 in Soltis, D. E.; Soltis P. S. (eds.) Isozymes in Plant Biology. Dioscorides Press, Portland, Oregon.
Belsky, A. J. 1986: Population and community processess in a mosaic grassland in the Serengeti, Tanzania. Joumal of Ecology 74 : 841 - 856.
Beuzenberg, E. J.; Hair, J. B. 1983: Contributions to a chromosome atlas of the New Zealand flora -25 miscellaneous species. New Zealand JOlllnal of Botany 21 : 13 - 20.
Bierzychudek, P. 1982: The demography of Jack-in-the-pulpit, a forest perennial that changes sex. Ecological Monographs 52 : 335 - 351.

189
Billington, H. L.; Mortimer, A. M.; McNeilly, T. M. 1990: Survival and reproduction in adjacent grass populations: effects of clone, time and environment. lOlll71al of Ecology 78 : 1 - 14.
Boyce, W. R. 1939: All ecological account of tussock grassland and other plant communities of the Cashmere Valley and adjacent areas 011 the Port Hills, CallterblllY. Unpublished M.Sc. thesis in Botany, University of Canterbury, Christchurch.
Bradshaw, A. D. 1965: Evolutionary significance of phenotypic plasticity in plants. Advances in Genetics 13 : 115 - 155.
Bradshaw, A. D. 1984: The importance of evolutionary ideas in ecology - and vice versa. pp 1 - 25 in Shorrocks, B. (editor), EvolutionalY Ecology, Blackwell Scientific Publications, London.
Bradshaw, J. D. 1977: The geology of the pre-quaternary rocks around Casso pp 53 - 66 in Burrows, C. J. (editor), Casso HistOlY and Science in the Cass District, CanferblllY, New Zealand. Department of Botany, University of Canterbury, Christchurch.
Briske, D. D.; Butler, J. L. 1989. Density-dependent regulation of ramet populations within the bunchgrass Schizachyrium scoparium: interclonal versus intraclonal interference. loumal of Ecology 77: 963 - 974.
Brockie, R. E. 1986: Periodic heavy flowering of New Zealand flax (Phormium, Agavaceae). New Zealand lOILl7lal of Botany 24 : 381 - 386.
Brown, A. H. D.; Marshall, D. R.; Albrecht, L. 1974: The maintenance of alchohol dehydrogenase polymorphism in Bromus mollis L.AILstralian lOlllnal of Biological Science 27: 545 - 559.
Buchanan, J. 1868: Sketch of the botany of Otago. TrallSactions of the New Zealand Institute 1 (Part III) : 22 - 53.
Buchanan, J. 1880: ManILal of the indigenolls grasses of New Zealand. Colonial Museum amd Geological Survey Department, Wellington.
Burrows, C. J. 1960: Recent changes in vegetation of the Cass area, Canterbury. New Zealand Geographer 16: 57 - 70.
Burrows, C. J. (editor) 1977a: Casso HistOlY alld Science in the Cass District, Canterbury, New Zealand. Department of Botany, University of Canterbury, Christchurch.
Burrows, C. J. 1977b: Alpine-subalpine rock, rock debris and scree vegetation. pp 173 - 184 in Burrows, C. J. (editor), Casso HistolY and Science ill the Cass District, Callterbll1Y, New Zealand. Department of Botany, University of Canterbury, Christchurch.
Burrows, C. J. 1977c: Grassland vegetation. pp 185 - 214 ill Burrows, C. J. (editor), Casso History and Science in the Cass District, Canterbll1Y, New Zealand. Department of Botany, University of Canterbury, Christchurch.
Burrows, C. J. 1977d: Riverbed vegetation. pp 215 - 226 in Burrows, C. J. (editor), Casso HistOlY and Science in the Cass Disttict, Call terb llIY, New Zealalld. Department of Botany, University of Canterbury, Christchurch.
Burrows, C. J. 1986: Botany of Arthur's Pass National Park, South Island, New Zealand. 1. History of botanical studies and checklist of the vascular flora. New Zealand l0ll171al of Botany 24 : 9 - 68.
Calder, D. M. 1958: Some aspects of the biology of Po a lindsayi. Unpublished M.Sc. Thesis, University of Canterbury, Christchurch.
Calder, D. M. 1961: Plant ecology of subalpine shingle riverbeds in Canterbury, New Zealand. loul7lal of Ecology 49 : 581 - 594.

Canfield, R. H. 1957: Reproduction and life-span of some perennial grasses of southern Arizona. lOlll7lal of Range Management 10 : 199 - 203.
Carlsson, B. A; Callaghan, T. V. 1990: Programmed tiller differentiation, intra clonal density regulation and nutrient dynamics in Carex bigelowii. Oikos 58 : 219 - 230.
190
Caswell H. 1986: Life cycle models for plants. Lectures on Mathematics in the Life Sciences 18: 171 -233.
Chadwick, M. J. 1960: Nardus stricta, a weed of hill grazings. pp 246 - 256 in Harper, J. L. (editor), The Biology of Weeds. British Ecological Society Symposium No.1, Blackwell Scientific Publications, Oxford.
Cheeseman, T. F. 1906: Manllal of the New Zealand Flora. Government Printer, Wellington.
Cheeseman, T.F. 1925: Manual of the New Zealand Flora, 2nd edition. New Zealand Board of Science and Art, Wellington.
Chesson P. 1984: The storage effect in stochastic population models. pp 76 - 89 in Levin, S. F.; Hallam, T. G. (editors), Mathematical Ecology. Lecture Notes in Biomathematics 54, SpringerVerlag, Berlin.
Clausen, J.; Keck, D. D.; Hiesey, W. M. 1939: The concept of species based on experimenLAmerican loumal of Botany 26 : 103 - 106.
Clausen, J.; Keck, D. D.; Hiesey, W. M. 1940: Experimental studies on the nature of species. 1. Effect of varied environments on Western North American plants. Cal7legie Institute of Washington Publication 520.
Coates, D.J.; Hnatiuk, RJ. 1990: Systematic and evolutionary inferences from isozyme studies in the genus Eremaea (Myrtaceae). Australian Systematic Botany 3 : 59 - 74.
Cockayne, L. 1928: The vegetation of New Zealand, (2nd edition). Verlag von Wilhelm Engelmann, Leipzig.
Cockayne, L.; Allan, H. H. 1934: An annotated list of wild hybrids in the New Zealand flora. Annuals of Botany 48 : 1 - 55.
Cockayne, L.; Foweraker C. E.; 1916: Notes from the Canterbury College Mountain Biological Station: No.4 - The principal plant associations in the immediate vicinity of the Station. Transactions of the New Zealand Institute 48 : 166 - 186.
Collins, S. L.; Uno, G. E. 1985: Seed predatipn, seed dispersal, and disturbance in grasslands: a comment. The American Naturalist 125 : 866 - 872.
Connor, H. E. 1960: Variation in leaf anatomy in Festuca novae-zelandiae (Hack.) Cockayne, and F. matthewsii (Hack.) Cheeseman. New Zealand lO1ll7lai of Science 3 : 468 - 509.
Connor, H. E. 1961: A tall-tussock grassland community in New Zealand. New Zealand lOllmal of Science 4 : 825 - 835.
Connor, H. E. 1963: Growth of flowering stems in five New Zealand tussock grasses. New Zealand lOlll7lal of Botany 1 : 149 - 165.
Connor, H. E. 1964: Tussock grassland communities in the MacKenzie Country, South Canterbury, New Zealand. New Zealand loul7lal of Botany 2 " 325 - 351.
Connor, H. E. 1965: Tussock grasslands in the middle Rakaia Valley, Canterbury, New Zealand. New Zealand lOll/7lal of Botany 3 : 261 - 276.

191
Connor, H. E. 1968: Interspecific hybrids in hexaploid New Zealand Festuca. New Zealand Joul7lal of Botany 6 : 295 - 308.
Connor, H. E.; Cook, A. B. 1955: The breeding system of New Zealand fescue tussock Festuca novae-zelandiae (Hack.) Cockayne. New Zealand JOlll7lal of Science and Technology 37A : 103 -105.
Connor, H. E; Edgar, E. 1986: Australasian alpine grasses: diversification and specialization. pp 413 - 436 in Barlow, B. A. (ed.), Flora and Fauna in Alpine Australasia: ages and origins. CSIRO, Melbourne.
Connor, H. E; Edgar, E. 1987: Name changes in the indigenous New Zealand flora, 1960 - 1986, and Nomina Nova IV, 1983 - 1986. New Zealand Journal of Botany 25: 115 - 170.
Connor, H. E.; MacRae, A. H. 1969: Montane and subalpine tussock grasslands in Canterbury. pp 167 - 204 in G. A. Knox (ed.) The Natural HistOl)' of CanterblllY. A. H. & A. W. Reed, Wellington.
Connor, H. E.; Purdie, A. W. 1976: Triterpene methyl ether differentiation in Chionochloa (Gramineae). New Zealand Journal of Botany 14: 315 - 326.
Cox, J. E.; Mead, C. B. 1965: Soil evidence relating to post-glacial climate on the Canterbury Plains. Proceedillgs of the New Zealand Ecological Society 10: 28 - 38.
Cumberland, K. B. 1944: High-country "Run". The geography of extensive pastoralism in New Zealand. Ecollomic Geographer 20 : 204 - 220.
Cutler, E J. B. 1977: Soils of the Cass district. pp 117 - 136 in Burrows, C. J. (editor), Casso HistOlY and Science in the Cass District, CanterblllY, New Zealand. Department of Botany, University of Canterbury, Christchurch.
Dahl, E. 1951: On the relation between summer temperature and the distribution of alpine vascular plants in the lowlands of Fennoscandia. Oikos 3 : 22 - 52.
Davy, A. J. 1980: Biological flora of the British Isles No. 149, Deschampsia caespitosa (L.) Beauv. Journal of Ecology 68 : 1075 - 1096.
de Lisle, J. F. 1969: The climate and weather. pp 68 -76 in Knox, G. A. (editor), The Natural History of Canterbw),. A. H. & A. W. Reed, Wellington.
Dick, R. D. 1956: 60 years after a mountain beech forest fire. New Zealand Jou17lal of Forest!)' 7: 104 - 108.
Dobson, A. T. 1977: Adventive plants. pp 271 - 278 in Burrows, C. J. (editor), Casso HistOlY and Science in the Cass District, CanterblllY, New Zealand. Department of Botany, University of Canterbury, Christchurch.
Druce, A. P. 1989: Indigenous higherplants of New Zealand. Unpublished report, Department of Scientific and Industrial Research, Land Resources Division, Wellington.
Dryden, G. M.; Archie, W. J. 1980: Response of penned sheep fed fescue tussock (Festuca novaezelandiae) to sulphur, nitrogen and mineral supplements. New Zealand Journal of Agricultural Research 23 : 299 - 304.
Dunbar, G. A. 1970: Sowing native tussock species in high altitude revegetation trials. Proceedings of the New Zealand Ecological Society 17 : 25 - 32.
Edgar, E 1986: Poa L. in New Zealand. New Zealand Joltl7lal of Botany 24 : 425 - 503.

192
Espie, P. R 1987: Edaphic ecology of Festuca novae-zealandiae, Lotus pedunculatus and Trifolium repens on Craigeblll7t High COllntlY Yellow-brown earths and related soils. Unpublished Ph.D. thesis, Lincoln College, University of Canterbury.
Fisher, F. J. F. 1965: The alpine Ranunculi of New Zealand. Bulletin No. 165, New Zealand Department of Scientific and Industrial Research, Wellington.
Fitter, R; Fitter, A; Farrer, A 1984: Collins guide to the grasses, sedges, lUshes and fems of Britain and NOithem Ellrope. William Collins Sons Co. Ltd., London.
Fowler, N. L. 1981: Competition and coexistence in a North Carolina grassland. II. The effect of the experimental removal of species. Joul7lal of Ecology 69 :825 - 841.
Fowler, N. L. 1988: The effects of environmental heterogeneity in space and time on the regulation of populations and communities. pp 249 - 269 in Davy, A J.; Hutchings, M. J.; Watkinson, A R (editors), Plant Population Biology. Blackwell Scientific Publications, Oxford.
Freeman, D. c.; Turner, W. A; McArthur, E. D.; Graham, J. H. 1991. Characterisation of a narrow hybrid zone between two subspecies of big sagebrush (Artemisia tridentata: Asteraceae). American J0ll171al of Botany 78 : 805 - 815.
Gage, M. 1969: Rocks and landscape. pp 25 - 43 in Knox, G. A (editor), The Natural HistOlY of CanterblllY. A H. & A W. Reed, Wellington. .
Gage, M. 1977: Glacial geology. pp 67 - 78 in Burrows, C. J. (editor) Casso HistOlY and Science in the Cass Distlict, CanterblllY, New Zealand. Department of Botany, University of Canterbury, Christchurch.
Gatsuk, L. E.; Smirnova, O. Y.; Vorontzova, L. L; Zaugolnova, L. B.; Zhukova, L. A 1980: Age states of plants of various growth forms: a review. Joul7lal of Ecology 68 : 675 - 696.
Giesel, J. T. 1976: Reproductive strategies as adaptations to life in temporally heterogeneous environments. Annual Review of Ecology and Systematics 7: 57 - 79.
Gill, D. E. 1986: Individual plants as genetic mosaics: ecological organisms versus evolutionary individuals. pp 321- 343 in Crawley, M. J. (editor), Plant Ecology. Blackwell Scientific Publications, Oxford.
Godley, E. J. 1967: A century of botany in Canterbury. Transactions of the Royal Society of New Zealand 22 : 243 - 266.
Gold, W. G.; Caldwell, M. M. 1989: The effect of the spatial pattern of defoliation on regrowth of a tussock grass. 1. Growth responses. Oecologia 80 : 289 - 296.
Gottlieb, L. D. 1981: Electrophoretic evidence and plant popUlations. Progress ill Phytochemistry 7 : 1 - 46.
Grant, J. E.; Brown A H. D.; Grace, J. P. 1984: Cytological and isozyme diversity in Glycine tomentella Hayata (Leguminosae).Australian Joumal of Botany 32: 665 - 677.
Grant, V. 1971: Plant Speciation. Columbia University Press, New York.
Green, D. M. 1991: Chaos, fractals and nonlinear dynamics in evolution and phylogeny. Trends ill Ecology alld Evolutioll 6 : 333 - 337.
Greenland, D. E. 1977: Weather and climate at Casso pp 93 - 116 ill Burrows, C. J. (editor) Casso HistOlY alld Science ill the Cass District, CallterblllY, New Zealalld. Department of Botany, University of Canterbury, Christchurch.

Gregory, R. P. G.; Bradshaw, A. D. 1965: Heavy metal tolerance in populations of Agrostis tenuis Sibth. and other grasses. New Phytologist 64 : 131 - 143.
193
Grubb, P. J. 1977: The maintenance of species-richness in plant communities: the importance of the regeneration niche. Biological Review 52 : 107 - 145.
Grubb, P. J. 1985: Plant populations and vegetation in relation to habitat, disturbance and competition: problems of generalisation. pp 595 - 621 in White, J. (editor), The Population Stn/cture of Vegetation. Dr W. Junk Publishers, Dordrecht.
Grubb, P. 1986: Problems posed by sparse and patchily distributed species in species-rich plant communities. pp 207 - 225 in Diamond, J.; Case, T. J. (editors), Community Ecology. Harper & Row, New York.
Haase, P. 1989: Ecology and distribution of Nothofagus in Deception Valley, Arthur's Pass National Park, New Zealand. New Zealand Journal of Botany 27: 59 - 70.
Hackel, E. 1903: On new species of grasses from New Zealand. Transactions of the New Zealand Institute 35 : 377 - 385.
Hamrick, J. L. 1989: Isozymes and the analysis of genetic structure in plant populations. pp 87 - 105 in Soltis, D. E.; Soltis, P. S. (editors), Isozymes ill Plallt Biology. Advances in Plant Sciences Series, Volume 4. Dioscorides Press, Portland, Oregon.
Hamrick, J. L. 1983: The distribution of genetic variation within and among natural plant populations. pp 335 - 348 in Schonewald-Cox, C.; Chambers, S.; MacBryde, B.; Thomas, W. (eds.), Genetics and COllselvation: a reference for managing wild animal and plant populations. Benjamin/Cummings, London.
Hamrick, J. L.; Godt M. J. W. 1989: Allozyme diversity in plant species. pp 43 - 63 in Brown, A. H. D.; Clegg, M.T.; Kahler, A.L.; Weir, B.S. (eds.), Plallt Population Genetics, breeding and genetic resources. Sinauer Associates Inc., Sunderland, MA.
Harberd, D. J. 1961: Observations on popUlation structure and longevity of Festuca rubra L. New Phytologist 60 : 184 - 206.
Harberd, D. J. 1962: Some observations on natural clones in Festuca ovina. New Phytologist 61 : 85 -100.
Harberd, D. J. 1967: Observations on natural clones in Holcus mollis L. New Phytologist 66: 401-408.
Harper, H. W. 1914: Letters from New Zealand, 1857 - 1911. Hugh Rees Limited, London.
Harper, J. L. 1977: Population Biology of Plants. Academic Press, London.
Harper, J. L. 1978: The demography of plants with clonal growth. pp 27 - 48 ill Freysen, A. H. J.; Woldendorp, J. W. (editors), Stl1lcture and FZlllctionillg of Plant Populations. North Holland Publishing Company, Amsterdam.
Harper, J. L.; Williams, J. T.; Sagar, G. R. 1965: The behaviour of seeds in soil. Part 1. The heterogeneity of soil surfaces and its role in determining the establishment of plants from seed. Journal of Ecology 53 : 273 - 286.
Hill, M. 0.1979: TWINSPAN - a FORTRAN program for aJ7'allging multivariate data ill an ordered two-way table by classification of the individuals and attributes. Cornell University, Ithaca, New York.
Hooker, J. D. 1867: Handbook of the New Zealand Flora. London.

194
Hutchings, M. J. 1979: Weight-density relationships in ramet populations of clonal perennial herbs, with special reference to the -3/2 power law. JOllmal of Ecology 67 : 21 - 33.
Hutchings, M. J.; Slade, A J. 1988: Aspects of the structure of clonal perennial herbs. pp 121- 133 in Werger, M. J. A; Van der Aart, P. J. M.; During, H. J.; Verhoeven, J. T. A (editors), Plant f01711 and Vegetation Stntcll/re. SPB Academic Publishing, The Hague, Netherlands.
Janzen, D. H. 1984; Dispersal of small seeds by big herbivores: foliage is the fruit. AmeJicall NatliJist 123 : 338 - 353.
Johnson, W. B. 1969: Modification of the natural environment by man. pp 77 - 94 ill Knox, G. A (editor), The Natural HistOl)' of Canterbw),. Reed, Wellington.
Jones, H. F.; Bartholomew, A T. (editors) 1968: The Shrewsbll/)' edition of the works of Samuel Buttel; Volume 1: A first year in Canterbwy settlement and other earZy essays. AMS Press, New York.
Karron, J. D. 1987: A comparison of levels of genetic polymorphism and self-compatibility in geographically restricted and widespread plant congeners. EvollltionGl), Ecology 1 : 47 - 58.
Kays, S.; Harper, J. L. 1974: The regulation of plant and tiller density in a grass sward. J0ll171al of Ecology 62 : 97 - 105.
Kelly, D.; McKone, M. J.; Batchelor, K. J. 1992: Mast seeding of Chionochloa (Poaceae) and predispersal seed predation by a specialist fly (Diptera, Chloropidae). New Zealand JOllmal of Botany, in press.
Kelsey, J. M. 1957: Insects attacking tussocks. New Zealand Journal of Science and Technology 38A : 638 - 643.
Kephart, S. R. 1990: Starch gel electrophoresis of plant isozymes: a comparative analysis of techniques. American J01l17lal of Botany 77: 693 - 712.
Kurchenko, E. 1. 1985: Coenopopulation structure of Agrostis species. pp 207 - 224 ill White, J. (ed.) The Population Stntcture of Vegetation, Dr W. Junk Publishers, Dordrecht.
Laing, R. M. 1918: The vegetation of Banks Peninsula, with a list of species (flowering plants and ferns). Transactions of the New Zealand Institute 51 : 355 - 408.
Lambrechtsen, N. C. 1968: Some aspects of the biology of Anthoxanthum odoratum L. Unpublished Ph.D. thesis, University of Canterbury, New Zealand.
Lee, W. G.; Mark, A F.; Wilson, J. B. 1983: Ecotypic differentiation in the ultramafic flora of the South Island, New Zealand. New Zealand JOll/nal of Botany 21 : 141- 156.
Leftovitch, L. P. 1965: The study of population growth in organisms grouped by stage. BiometJics 21 : 1- 18.
Leslie, P. H. 1945: On the use of matrices in population mathematics. Biometrika 33 : 182 - 212.
Levin, D. A 1978: Some genetic consequences of being a plant. pp 189 - 212 in Brussard, P. F. (editor), Ecological Genetics: The InteTface. Springer-Verlag, New York.
Levin, D. A 1981: Dispersal versus gene flow in plants. Annals of the Missoll1i Botanical Gardens 68 : 233 - 253.
Levin, D. A 1983: Polyploidy and novelty in flowering plants. American Naturalist 122 : 1 - 25.
Levin, D. A 1986: Breeding structure and genetic variation. pp 217 - 251 in Crawley, M. J. (editor), Plant Ecology. Blackwell Scientific Publications, Oxford.

195
Levin, D. A 1988: Local differentiation and the breeding structure of plant populations. pp 305 - 329 in Gottleib, L. D.; Jain, S. K. (eds.) Plant EvolllliollaJY Biology. Chapman & HaIl, London.
Levin, D. A; Wilson, J. B. 1978: The genetic implications of ecological adaptations in plants. pp 75 -98 in Freysen, A H. J.; Woldendorp, J. W. (editors), Stl1lctllre and FlInctioning of Plant Populations, North Holland Publishing Company, Amsterdam.
Lewis, W. H. (editor) 1980: Polyploidy - Biological Relevance. Plenum Press, New York.
Lewontin, R. C. 1957: The adaptation of populations to varying environments. Cold Spring Harbour Symposium Oil Quantiative Genetics 22 : 395 - 408.
Lewontin, R. C. 1984: Detecting population differences in quantitative characters as opposed to gene frequencies. The American Naturalist 123 : 115 - 124.
Lloyd, D. G. 1979: Paternal strategies of angiosperms. New Zealand lOlllnal of Botany 17 : 595 - 606.
Lloyd, D. G. 1980a: Demographic factors and mating patterns in angiosperms. In Solbrig, O. T. (editor), Demography and Evolution in Plant Populations, BotanicallvIonographs 15. Blackwell Scientific Publications, Oxford.
Lloyd, D. G. 1980b: Sexual strategies in plants. 1. An hypothesis of serial adjustment of maternal investment during one reproductive session. New Phytologist 86 : 69 - 79.
Lloyd, D. G. 1984: Variation strategies of plants in heterogeneous environments. Biological lOlllllal of the Linnean Society 21 : 357 - 385.
Lloyd, D. G. 1986. Progress in understanding the natural history of New Zealand plants. New Zealand lOlllnal of Botany 23 : 707 - 722.
Lord, J. M. 1990: Maintenance of Poa cita grassland by grazing. New Zealand lOlllnal of Ecology 13 : 43 - 50.
Lord, J. M.; Norton, D. A 1990: Scale and spatial concept of fragmentation. Conservation Biology 4 : 197 - 202.
Lovett Doust, L. 1981: Population dynamics and local specialisation in a clonal perennial (Ranunculus repens). II. The dynamics of leaves, and a reciprocal transplant-replant experiment. lournal of Ecology 69 : 757 - 768.
Lumerat, R. 1984: The role of polyploidy in the adaptive significance of polymorphism at GOT-l locus in the Dactylis glomerata complex. Heredity 52: 153 - 169.
Lumerat, R. 1985: Phenotypic and genotypic variation within and between populations of the polyploid complex, Dactylis glomerata L. pp 343 - 354 ill Haeck, J.; Woldendorp, J. W. ( editors), Stl1lctllre and Fllllctioning of Plalll Populations, Volume 2 : Phenotypic and genotypic variation ill plant popUlations. North Holland Publishing Company, Amsterdam.
MacArthur, R. H. 1962: Some generalised theorems of natural selection. Proceedings of the National Academy of Sciences, USA 48 : 1893 - 1897.
MacArthur, R. H.; Levins, R. 1965: Competition, habitat selection, and character displacement in a patchy environment. Proceedings of the National Academy of Sciences 51 : 1207 - 1210.
McCain, S.; Davies, M. S. 1983: Effects of pre-treatment with phosphate in natural populations of Agrostis capiIIaris L. 1. Influences on the subsequent long term yield of, and accumulation of phosphorus in, plants grown from tillers. New Phytologist 94 : 367 - 379.

MacDonald, S. E.; Lieffers, V. J. 1991: Population variation, outcrossing and colonisation of disturbed areas by Calamagrostis canadensis: evidence from allozyme analysis. American Joumal of Botany 78: 1123 - 1129.
196
McGlone, M. S. 1973: Pollen analysis. in Leslie D. M. (ed.), Relict periglacial landforms at Clark's Junction, Otago. New Zealand Joul'llal of Geology and Geophysics 16: 575 - 585.
McGlone, M. S. 1983: Polynesian deforestation of New Zealand: A preliminary sythesis.Arehaeology in Oceania 18 : 11 - 25.
McGlone, M. S. 1988: New Zealand. pp 557 - 599 in Huntly, B.; Webb III, T. (eds.), Vegetation HistOlY. Kluwer Academic Publishers.
McGlone M. S.; Bathgate, J. L. 1983: Vegetation and climate history of the Longwood Range, South Island, New Zealand, 12,000 B.P. to the present. New Zealand Joltl'llal of Botany 21: 293 - 315.
McGraw, J. B.; Shaver, G. R. 1982: Seedling density and survival in Alaskan cotton grass tussock tundra. Holm·tic Ecology 5: 212 - 217.
McKone, M. J. 1990: Characteristics of pollen production in a population of New Zealand snowtussock grass (Chionochloa pall ens Zotov). New Phytologist 116 : 555 - 562.
McLeod, D.; Burrows, C. J. 1977: History of the Cass district. pp 23 - 34 in Burrows, C. J. (editor), Casso HistOlY and Science in the Cass District, Canterbwy, New Zealand. Department of Botany, University of Canterbury, Christchurch.
McMillan, C. 1956: Nature of the plant community. 1. Uniform garden and light period studies of five grass taxa in Nebraska. Ecology 37: 330 - 340.
McMillan, C. 1957: Nature of the plant community. III. Flowering behaviour within two grassland communities under reciprocal transplanting. Al1wican Joltl7lal of Botany 44: 144 - 153.
McMillan, C. 1959: The role of ecotypic variation in the distribution of the central grassland of North America. Ecological Monographs 29 : 285 - 308.
McMillan, C. 1969: Ecotypes and ecosystem function. Bioscience 19 : 131 - 134.
McNeilly, T.; Roose, M. L. 1984: The distribution of perennial ryegrass genotypes in swards. New Phytologist 98 : 503 - 513.
Malcolm, N. A. 1925: Montane tltssock grassland, with special reference to the effect of spelling. Unpublished M.Sc. Thesis in Botany, University of Canterbury, Christchurch.
Maling, P. B. (editor) 1958: The Torlesse Papers. The Pegasus Press, Christchurch.
Manly, B. F. J. 1989: Stage-stntetltred popltlations. Sampling, analysis and simulation. Chapman and Hall, London.
Mark, A. F. 1965a: The environment and growth rate of narrow-leaved snow tussock Chionochloa rigida, in Otago. New Zealand JOlll'/lal of Botany 3 : 73 - 103.
Mark, A. F. 1965b: Flowering, seeding and seedling establishment of narrow-leaved snow tussock, Chionochloa rigida. New Zealand J0ll171al of Botany 3: 180 - 193.
Mark, A. F. 1965c: Ecotypic differentiation in Otago populations of narrow-leaved snow tussock, Chionochloa rigida. New Zealand JOll/'llal of Botany 3 : 277 - 299.
Masuda, M.; Washitani, 1. 1990: A comparative ecology of the seasonal schedules for 'reproduction by seeds' in a moist tall grassland community. Functional Ecology 4: 169 - 182.

197
Meurk, C. D.; Norton, D. A.; Lord, J. M. 1989: The effect of grazing and its removal from grassland reserves in Canterbury. pp 72 - 75 in Norton, D. A. (editor), Management of New Zealand's Natural Estate. Occasional Publications No.1, New Zealand Ecological Society, Christchurch.
Mildenhall, D. C. 1980: New Zealand late Cretaceous and Cenozoic plant biogeography: a contribution. Palaeogeography, Palaeoclimatology, Palaeoecology 31: 197 - 233.
Mills, J. A.; Lee, W. G.; Lavers, R. B. 1989: Experimental investigations of the effects of takahe and deer grazing on Chionochloa pallens grassland, Fiordland, New Zealand. Jownal of Applied Ecology 26: 397 - 417.
Moar, N. T. 1971: Contributions to the Quaternary history of the New Zealand flora. 6. Aranuian pollen diagrams from Canterbury, Nelson and North Westland, South Island. New Zealand Journal of Botany 9: 80 - 145.
Moar, N. T. 1973: Contributions to the Quaternary history of the New Zealand flora. 7. Two Aranuian pollen diagrams from central South Island. New Zealand Journal of Botany 11 : 291 -304.
Moar, N. T. 1980: Late Otiran and early Aranuian grassland in central South Island. New Zealand Joumal of Ecology 3 : 4 - 12.
Moar, N. T.; Suggate, R. P. 1979: Contributions to the Quaternary history of the New Zealand flora. 8. Interglacial and glacial vegetation in the Westport District, South Island. New Zealand Joumal of Botany 17: 361 - 387.
Molloy, B. P. J. 1969: Recent history of the vegetation. pp 340 - 360 in Knox, G. A. (ed.), The Natural HistOlY of Canterbwy. A. H. & A. W. Reed, Wellington.
Molloy, B. P. J. 1970: Bankside: a new scientific reserve on the Canterbury Plains. Proceedings of the New Zealand Ecological Society 17 : 47 - 51.
Molloy, B. P. J. 1971: Possibilities and problems for nature conservation in a closely settled area. Proceedings of the New Zealand Ecological Society 18 : 25 - 37.
Molloy, B. P. J. 1977: The fire history. pp 157 - 170 in Burrows, C. J. (ed.), Casso HistOlY and Science in the Cass disl1ict, CanterblllY, New Zealand. Department of Botany, University of Canterbury, Christchurch.
Molloy, B. P. J.; Ives, D. W. 1972: Biological Reserves of New Zealand. 1. Eyrewell Scientific Reserve, Canterbury. New Zealand JOlll71al of Botany 10: 673 - 700.
Molloy, B. P. J.; Burrows, C. J.; Cox, J. E.; Johnston, J.A.; Wardle, P. 1963: Distribution of subfossil forest remains, eastern South Island, New Zealand. New Zealand J0ll171al of Botany 1 : 68 - 77.
Moloney, K. A. 1988: Fine-scale spatial and temporal variation in the demography of a perennial bunchgrass. Ecology 69 : 1588 - 1598.
Moore, L. B. 1976: The changing vegetation of Molesw0l1h Station, New Zealand, 1944 to 1971. Bulletin 217, Department of Scientific and Industrial Research, Wellington.
Moran, C. 1981. Genetic demarcation of geographical distribution by hybrid zones. Proceedings of the Ecological Society of Australia 11 : 67 - 73.
Morrison, T. M. 1958: Biological studies of some tussock grassland soils. XI. The response of a tussock plant, Festuca novae-zelandiae, to fertilizers. New Zealand JOlll7lal of Agdcultural Research 1 : 1003 - 1005.
Nei, M. 1972: Genetic distance between popUlations. The AI11e1icCliI Naturalist 106 : 283 - 292.

Nei, M. 1973: Analysis of gene diversity in subdivided populations. Proceedings of the National Academy, USA 70 : 3321 - 3323.
Nevo, E.; BeiIes, A; Ben-Shlomo, R. 1984: The evolutionary significance of genetic diversity: ecological, demographic and life-history correlates. In Mani, G. S. (editor), Evolutionary Dynamics of Genetic Diversity, Lecture Notes in Mathematical Biology 53, Springer Verlag, Berlin.
New Zealand Meteorological Service, 1982: Rainfall Normals for New Zealand 1951 to 1980. New Zealand Meteorological Service Miscellaneous Publications 185, Wellington.
Norton, D. A 1985: A multivariate technique for estimating New Zealand temperature normals. Weather and Climate 5 : 64 - 74.
O'Connor, K. F. 1977: Why manage the grazing animals? fOll/nal of the Tussock Grasslands and Moulltainlands Institute 35 : 6 - 11.
198
O'Connor, K. F. 1982: The implications of past exploitation and current developments to the conservation of South Island tussock grasslands. New Zealand fOll/nal of Ecology 5 : 97 - 107.
O'Connor, K. F. 1986: The influence of science on the use of tussock grassland. fOll/nal of the Tussock grassland and Mountain Land Institute 43 : 15 - 78.
O'Connor, T. G. 1991: Local extinction in perennial grasslands: a life-history approach. TIle American Naturalist 137 : 753 - 773.
Ogden, J. 1989: On the coenospecies concept and tree migrations during the oscillations of the Pleistocene climate. fou1'llal of the Royal Society of New Zealand 19: 249 - 262.
Paul, R. B. 1857: Letters from CanterblllY, New Zealand. Rivingtons, London.
Peart, D. R. 1989: Species interactions in a successional grassland. I. Seed rain and seedling recruitment. fOll/nal of Ecology 77 : 236 - 251.
Petrie, D. 1895: List of the flowering plants indigenous to Otago, with indications of their distribution and range in altitude. Transactions of the New Zealand Institute 28 : 540 - 591.
Platenkamp G. A J. 1990. Phenotypic plasticity and genetic differentiation in the demography of the grassAnthoxanthlll71 odoratllm. fou1'Ilai of Ecology 78 : 772 - 788.
Rabinowitz, D.; Rapp, J. K. 1980: Seed rain in a North American tall grass prairie. fOllmal of Applied Ecology 17 : 793 - 802.
Rabotnov, T. A 1969: On coenopopulations of perennial herbaceous plants in natural coenoses. Vegetatio 19 : 87 - 95.
Rabotnov, T. A 1978: On coenopopulations of plants reproducing by seeds. pp 1 - 26 in Freysen, A H. J.; Woldendorp, J. W. ( editors), Stl1lctllre and Functioning of Plant Populations. North Holland Publishing Company, Amsterdam.
Rabotnov, T. A 1985: Dynamics of plant coenotic populations. pp 121- 142 in White, J. (editor), The Population Stl1lctllre of Vegetation. Dr. W. Junk Publishers, Dordrecht.
Rapson, G. L.; Wilson, J. B. 1988: Non-adaptation in Agrostis capillaris L. (Poaceae). Functional Ecology 2 : 479 - 490.
Rapson, G. L.; Wilson, J. B. 1992a: Genecology ofAgrostis capillaris L. (Poaceae) - an invader into New Zealand. 1. Floral phenology. New Zealand fOlll7lal of Ecology 30 : 1 - 11.

199
Rapson, G. L.; Wilson, J. B. 1992b: Genecology ofAgrostis capillmis C (Poaceae) - an invader into New Zealand. 2. Responses to light, soil fertility, and water availability. New Zealand loumal of Ecology 30 : 13 - 24.
Raven, P. H. 1973: Evolution of subalpine and alpine plant groups in New Zealand. New Zealand Joumal of Botany 11 : 177 - 200.
Raup, H. M. 1981: Physical disturbance in the life of plants. pp 39 - 52 in Nitecki, M. H. (editor), Biotic Crises in Ecological and Evolution my Time. Academic Press, London.
Reader, R. J. 1991: Relationship between seedling emergence and species frequency on a gradient of ground cover density in an abandoned pasture. Canadian lOlmzal of Botany 69 : 1397 - 1401.
Roose, M. L.; Gottlieb, L. D. 1975: Genetic and biochemical consequences of polyploidy in Tragopogon. Evolution 30 : 818 - 830.
Rose, A. B. 1983: Succession in fescue (Festuca novae-zelandiae) grasslands of the Harper-Avoca catchment, CanterblllY, New Zealand. Bulletin No. 16, Forest Research Institute, New Zealand Forest Service, Christchurch.
Rose, A. B.; Platt, K. H. 1990: Age-states, population structure, and seedling regeneration of Chionochloa pall ens in Canterbury alpine grassland, New Zealand. lOlllnal of Vegetation Science 1 : 89 - 96.
Ross, G. J. S. 1980: MLP. Maximum Likelihood Program. The Statistics Department, Rothamsted Experimental Station, Hertfordshire, England.
Roy, J. 1985: Comparison of Dactylis glomerata and Bromus erectus populations from contrasting successional stages. pp 51- 64 in Haeck, J.; Woldendorp, J. W. (editors), Stmcture and Functioning of Plant populations, Volume 2 : Phenotypic and genotypic variation in plant populations. North Holland Publishing Company, Amsterdam.
Sarukhan, J.; Harper, J. L. 1973: Studies in plant demography: Ranunculus repens L., R. bulbosus L. and R. acris. 1. Population flux and survivorship. lOlllnal of Ecology 61 : 675 - 716.
Schaal, B. A. 1985: Genetic variation in plant popUlations: from demography to DNA. pp 321 - 342 in Haeck, J.; Woldendorp, J. W. (editors), Stmclztre alld Functioning of Plant Populations, Volume 2: Phenotypic and Genotypic Vmiation in Plant Populations. North-Hall Publishing Company, Amsterdam.
Scheiner, S. M.; Lyman, R. F. 1991: The genetics of phenotypic plasticity. II. Response to selection. loul7lal of Evolutionmy Biology 4 : 23 - 50.
Schlichting, C. D. 1986: The evolution of phenotypic plasticity in plants. Annual Review of Ecology and Systematics 17 : 667 - 693.
Schmid, B. 1985: Clonal growth in grassland perennials. III. Genetic variation and plasticity between and within popUlations of Bellis perennis and Prunella vulgaris. loul7lal of Ecology 73 : 819 -830.
Schmid, B.; Harper, J. L. 1985: Clonal growth in grassland perennials. 1. Density and patterndependant competition between plants with different growth forms. loul7lal of Ecology 73: 793 - 808.
Scott, D. 1960: Seasonal behaviour of some montane plant species. New Zealand lOlllnal of Science 3 : 694 - 699.
Scott, D. 1970: Relative growth rates under controlled temperatures of some New Zealand indigenous and introduced grasses. New Zealand lOlllnal of Botany 8 : 76 - 81.

200
Scott, D. 1979: Use and conservation of New Zealand native grasslands in 2079. New Zealand foumal of Ecology 2 : 71 - 75.
Scott, D.; Archie, W. J. 1976: Seasonal variation in establishment of oversown seed in relation to tussock proximity. New Zealand fOlllnal of Experimental Agriculture 4 : 311 - 315.
Scott, D.; Dick, R. D.; Hunter, G. G. 1988: Changes in the tussock grasslands in the central Waimakariri River basin, Canterbury, New Zealand, 1947 - 1981. New Zealand foumal of Botany 26 : 197 - 222.
Sewall, W. 1977: Evolution and the Genetics of Populations, Volume 4,' Variability within and among Populations. The University of Chicago Press, Chicago.
Sewell, T. G. 1947: A study of montane tussock grassland with special reference to the growth, seedling and behaviour of the principal tussocks and grasses. M.Agr.Sc. thesis, Lincoln College, University of Canterbury.
Sewell, T. G. 1952: Tussock grassland investigations. Proceedings of the New Zealand Grasslands Association 130 : 123 - 132.
Silver town, J. W. 1980: The evolutionary ecology of mast seeding in trees. Biological jOlllnal of the Linnean Society 14 : 235 - 250.
Silvertown, J. W. 1982: Introduction to plant population ecology. Longman, London.
Snaydon, R. W.; Davies, M. S. 1972: Rapid population differentiation in a mosaic environment. II. Morphological variation in Anthoxanthum odoratum. Evolution 26 : 390 - 405.
Solbrig, O. T. 1980: Demography alld Evolution in Plant Populations, Botanical Monographs 15, Blackwell Scientific Publications, Oxford.
Soons, J. M. 1977: The geomorphology of the Cass district. pp 79 - 92 in Burrows, C. J. (editor), Casso HistOlY and Science in the Cass District, Can terb wy, New Zealand. Department of Botany, University of Canterbury, Christchurch.
Spence, J. R. 1990: Seed rain in grassland, herbfield, snowbank, and fellfield in the alpine zone, Craigieburn Range, South Island, New Zealand. New Zealand f01l17lal of Botany 28: 439 - 450.
Stace, C. A. 1989: Plant Ta:wnomy and Biosyste11latics. Edward Arnold, London.
Starn, P. 1983: The evolution of reproductive isolation in closely adjacent plant populations through differential flowering time. Heredity 50 : 105 - 118.
Stebbins, G. L. 1983: Mosaic evolution: an integrating principle for the modern sythesis. Experientia 39 : 823 - 833.
Stebbins, G. L. 1989: Plant speciation and the founder principle. pp 113 - 125 in Giddings. L. V.; Kaneshiro, K. Y.; Anderson, W. W. (editors), Genetics, Speciation and the Founder Pn'nciple. Oxford University press, Oxford.
Stevens, G. 1980: New Zealand Adrift. Reed, Wellington.
Suggate, R. P. 1965: Late Pleistocene geology of the northern part of the South Island, New Zealand. New Zealand Geological Survey Bulletin, n.s. 77.
Suggate, R. P.; Moar, N. T. 1970: Revision of the chronology of the late Otiran Glacial. New Zealand foumal of Geology and Geophysics 13 " 743 - 746.

201
Swofford, D. L.; Selander R. B. 1981: Biosys-1: a fortran program for the comprehensive analysis of electrophoretic data in population genetics and systematics. The loul7lal of Heredity 72 : 281 -283.
Symonides, E. 1979: The structure and population dynamics of psammophytes on inland dunes.!. Populations of initial stages. Ekologiska Poliski 27 : 3 - 37.
Tansley, A. G. 1914: Presidential Address. lO1ll7lai of Ecology 2 : 194 - 202.
Ter Braak, C. J. F. 1990: CANOCO - a FORTRAN program for canol/ical community ordination by [partial] [detrended] [canonical] cOJTespondence analysis, principal components analysis and redundancy analysis (version 3.10). Agricultural Mathematics Group, Wageningen, The Netherlands.
Thoday, J. M. 1953: Components of fitness. In Brown, R.; DanielIi, J. F. (editors), Evolution. Symposium of the Society jor E'CpeJimelltal Biology 7: 96 - 113.
Thompson, K; Grime, J. P. 1979: Seasonal variation in seed banks of herbaceous species in ten contrasting habitats. lOlllnal of Ecology 67: 893 - 921.
Thompson, K; Grime, J. P.; Mason, G. 1977: Seed germination in response to diurnal fluctuations of temperature. Nature, London 267: 147 - 149.
Treskonova, M. 1991: Changes in the structure of tall-tussock grasslands and infestation by species of Hieracium in the MacKenzie Country, New Zealand. New Zealand loul7lal of Ecology 15 : 65 -78.
Van Valen, L. 1965: Morphological variation and width of ecological niche. American Naturalist 99: 377 - 390.
Vandermeer, J. 1975: On the construction of the population projection matrix for a population grouped in unequal stages. Biometrics 31 : 239 - 242.
Vickery, Jr., R. K 1990: Close correspondence of allozyme groups to geographic races in the Mimulus glabratus complex (Scrophulariaceae). Systematic Botany 15 : 481- 496.
Vorontzova, L. 1.; Zaugolnova, L. B. 1985: Population biology of steppe plants. pp 143 - 178 ill White, J. (ed.) The Population Stl1lcture oj Vegetation, Dr W. Junk Publishers, Dordrecht.
Vucetich, C. G. 1969: Soils of Canterbury. pp 44 - 67 in Knox, G. A. (editor), The Natural History of Canterbwy. A. H. & A. W. Reed, Wellington.
Wall, A. 1922: TIle Botany of Christchurch. Lyttelton Times Co. Ltd., Christchurch.
Watkinson, A. R.; Harper, J. L. 1978: The demography of a sand dune annual Vulpia fasiculata 1. The natural regulation of populations. loul7lal of Ecology 66 : 15 - 33.
Webb, C. J.; Sykes, W. R.; Garnock-Jones, P. J. 1988: Flora of New Zealand, Volume W. Botany Division, Department of Scientific and Industrial Research, Christchurch.
Werner, P. A.; Caswell, H. 1977: Population growth rates and age versus stage-distribution models for teasel (Dipsacus sylvestris Huds.). Ecology 58 : 1103 - 1111.
Werth, C. R. 1978: The use of isozyme data for inferring ancestry of polyploid pteridophytes. Biochemical Systematics and Ecology 17 : 117 - 130.
White, E. G. 1975: An investigation and survey of insect damage affecting Chiolloch/oa seed production in some alpine tussock grasslands. New Zealand lOlllnal of Agn'cllltural Research 18 : 163 - 178.

202
White, E. G. 1991: The changing abundance of moths in a tussock grassland, 1962 - 1989, and 50- to 70-year trends. New Zealand JOlll7lal of Ecology 15 : 5 - 22.
White, J. 1979: The plant as a metapopulation.Anl1ual Review of Ecology_and Systematics 10: 109-145..-
Wiens, J. A 1976: Population responses to patchy environments. Annual Review of Ecology and Systematics 7 : 81 - 120.
Wilkinson, M. J.; Stace, C. A 1991: A new taxonomic treatment of the Festuca ovina L. aggregate (Poaceae) in the British Isles. Botanical Journal of the Lillllean Society 106 : 347 - 397.
Williams, G. C. 1975: Set and Evolution. Princeton University Press, Princeton.
Williams, 0. B. 1970: Population dynamics of two perennial grasses in Australian semi-arid grassland. Journal of Ecology 58: 869 - 875.
Wilson, G. B; Bell, J. N. B. 1985: Studies on the tolerance of S02 of grass populations in polluted areas. III. Investigations on the rate of development of tolerance. New Phytologist 100 : 63 - 77.
Zhukova, L. A; Ermakova, 1. M. 1985: Structure and dynamics of coenopopulations of some temperate grasses. pp 179 - 205 in White, J. (ed.) The Population StI1lcture ofVegetatioll, Dr W. Junk Publishers, Dordrecht.
Zotov, V. D. 1938: Survey of the tussock grasslands of the South Island, New Zealand. 17le New Zealand JOlllnal of Science and Technology 20 A : 212 - 244.

203
APPENDIX 1: The taxonomic history of F. novae-zelandiae.
Species of fescue encountered by early botanists were initially all referred to a common European
pasture grass, Festllca dll1illSclila. J. D. Hooker, in his 'Handbook of the New Zealand Flora' (1867),
describedF. dwillscula in New Zealand as: "very slender, densely tufted, glabrous. Culms 1-3 feet
high ... Leaves slender, involute, filiform or short and setaceous. Panicle 1-6 inches long, effuse or
contracted ... Spikelets few, 4-8 flowered, 1/4 to 1/3 inch long."
The name F. dll1illSClila appears to have been applied to a range of New Zealand Festuca
species. Two specimens of F. dwilisclIla are illustrated in Buchanan's (1880) Manual of the
Indigenous Grasses of New Zealand. One is small and slender, with short setaceous leaves and is
most probably what Buchanan refers to as the sub-alpine form that resembles F. ovina. The other is
more than twice the height, with a densely tufted habit and is more like the present-day F. matthewsii.
Buchanan comments that New Zealand plants grouped under F. dllrillsclila showed a tendency to
vary.
Further evidence of the polyphyletic nature of New Zealand F. dll1illSCllla comes from
records of its habitat and distribution. Hooker (1867) records it as abundant on the Alps, from
Nelson to Otago, ascending to 4000 feet. Buchanan (1880) likewise describes it as "common in both
Islands, from 1 - 4000 feet altitude." However previously, Buchanan (1868) recorded F. dlllillscliia in
Otago as alpine, found above 4000 feet. In 1870, J. F. Armstrong recorded F. dll1illSCula as occurring
on the Port Hills and at Sumner, on the North side of the range as well as "swamps". However, the
Armstrongs' list of Canterbury indigenous grasses (1872) recorded F. dll1illSClila as "found all over the
world in alpine pastures". J. B. Armstrong in 1880 recorded F. dllrillsclila as abundant in both the
lowland and alpine zones.
The polyphyletic nature of New Zealand F. dlilillsclila was confirmed when Professor
Edouard Hackel of Austria, described by Cheeseman as in the first rank of European agrostologists,
examined New Zealand specimens of the genus Festzlca. His conclusions formed the basis for
Cheeseman's (1906) treatment of the genus. Those specimens that had previously been referred to F.
dllrillscliia were now divided between F. ovina (two varieties) and F. ntbra, with the comment that the
true F. dlirillscliia probably did not exist in an indigenous state in New Zealand. To F. mbra was
allocated the greater part of F. dlirillsCllla, these plants undoubtedly being the smaller types described
by Hooker (1867) and Buchanan (1880). Two new entities were described under F. avina, F. ovina
var llovae-zelandiae and F. ovina var l11atthewsii (Hackel, 1903).
In 1915, in a paper concerning plants in the vicinity of the Cass Biological Station (Cockayne
& Foweraker, 1916), Festzlca novae-zealandiae [sic} (Hack.) Cockayne was included in the list of
species with the note' = F. ovina L. var novae-zealandiae [sic} Hack.'. When Cheeseman updated his
Manual he cited this reference by Leonard Cockayne as the authority for the elevation of the taxon to
specific rank (Cheeseman, 1925). In his revised Manual Cheeseman (1925) also elevated F. ovina var.
matthewsii to specific rank as F. matthewsii, with the comment: "This appears to me to be a perfectly
distinct species, easily recognized by the large spikelets and curious pulvinate callus at the base of the
leaf-blades."

204
APPENDIX 2:
Locations and accession numbers for representative specimens of all populations studied.
Material is deposited in the University of Canterbury herbarium, Christchurch (CANU). Map
references are for NZMS 260 series except RLF which is for NZMS 1.
Abbr. Population Map Ref. Taxon CANU
ANT Anticrow K34900991 F. novae-zelandiae 35677
APS Arthurs Pass K33923095 F. matthewsii 33928
BNK Bankside M36423193 F. novae-zelandiae 35686
BRO Broken River K34034863 'high alt' F. n-z. 35671
BRV Bealey River K33925075 F. matthewsii 33927
CAR Castle Hill K34055752 F. novae-zelandiae 35678
CAR Carrington K33835042 F. matthewsii 35669
CBC Craigieburn Cutting K34076841 F. novae-zelandiae 35660
CFL Cass River Flats K34076955 F. novae-zelandiae 35681
CRY Cass River K34071942 F. novae-zelandiae 35685
CSA Cass Saddle 'A' K34027883 'high alt' F. n-z. 33921
CSS Cass Saddle 'B' K34031888 F. novae-zelandiae 33920
CVS Cass Valley K34053915 F. novae-zelandiae 33923
DEC Deception River K33976113 F. matthewsii 35659
DIS Discovery Stream K33066098 F. matthewsii 35667
GPS Goat Pass K33980107 F. matthewsii 35658
GRE Greenlaw K33852007 F. matthewsii 35674
HLF Hallelujah Flat S59286284 F. novae-zelandiae 35662
KIL Kilmarnock K33818042 F. matthewsii 35663
KLO Klondike corner K34947985 F. novae-zelandiae 35664
KRV Kowai River L35104660 F. novae-zelandiae 35687
LBR lower Bealey River K33934051 F. matthewsii 35665
LHR lower Hawdon River K33078032 F. novae-zelandiae 35682
LMR lower Mingha River K33967045 F. novae-zelandiae 35668
LYN Lake Lyndon K35048682 F. novae-zelandiae 35666
MBV upper Mingha River K33982085 F. matthewsii 35673
MTH Mt Horrible K34046968 'high alt' F. n-z. 33929
MTL Mt Lyndon K35036676 'high alt' F. n-z. 35684
MTS Mt Sugarloaf K34104965 F. novae-zelandiae 33922
OTR Otira River K33904114 F. matthewsii 35657

205
APPENDIX 2 continued:
Locations and accession numbers for representative specimens of all populations studied.
Material is deposited in the University of Canterbury herbarium, Christchurch (CANU). Map
references are for NZMS 260 series except HLF which is for NZMS 1.
PEG Pegleg Creek K33925115 F. matthewsii 33918
PPS Porters Pass K35080673 'high alt' F. n-z. 33926
RED Red Lakes K35978632 F. novae-zelandiae 33925
RIV Riversdale K34076100 F. novae-zelandiae 35679
SLF Sugarloaf Fan K34098959 F. novae-zelandiae 35688
SVH Sudden Valley head K33034075 F. matthewsii 35676
SVY Sudden Valley K33044049 F. matthewsii 35670
TOR Mt Torlesse L35134697 F. novae-zelandiae 35680
UBR upper Bealey River K33908094 F. matthewsii 35672
UHR upper Hawdon River K33073075 F. matthewsii 35683
WAI Waimakariri River K33841028 F. matthewsii 35675
WRY White River K33810030 F. matthewsii 35689
WSH W oolshed Hill K33093028 F. novae-zelandiae 33930
WSS Woolshed Hill summit K33103038 'high alt' F. n-z. 35661