the executive remuneration reporter - livewire · the executive remuneration reporter . high flyers...
TRANSCRIPT

THE EXECUTIVE REMUNERATION REPORTER
HIGH FLYERS AND UNDERPERFORMERS: CEO PAY IN THE ASX 100 FY2011-FY2015
PREPARED BY DR KYM SHEEHAN, AUGUST 2016
2
INTRODUCTION This report presents information on 10 ASX 100 companies for the five year period 2011 to 2015. The ten companies were identified by Livewire Markets as ‘high flyers’ and ‘underachievers’.1 As requested, remuneration data has been collated for the CEOs at five high flyers and five underperformers over the period FY2011-FY2015.
For each of the companies this report includes
• A summary of the features of the remuneration scheme outlined in the 2015 remuneration report • Details of the TOTAL REMUNERATION OPPORTUNITY (TRO), which is the maximum potential award being given in a year, and consists
of fixed remuneration, maximum STI opportunity and LTI grant value
• Details of the total amount received TOTAL ACTUAL REMUNERATION (TAR), which is the actual remuneration received and consists of fixed remuneration, cash STI awarded for the year, deferred STI from previous years that paid out in the year reported and the value of LTI grants vesting in the year. TAR does not include the value of any sign-on awards that vested during the year.
All amounts are shown in AUD. The individual data elements are there for you to work with (eg you might want to work with TAR, but then take a look at the trend in cash STI as it is trying to capture one year of performance).
Some factors to note with the data
• This data has been compiled from publicly available information and I have not verified the accuracy or otherwise of the data that is reported in this manner. No warranty is provided as to the accuracy of the data
• There are three different financial year end dates: 30 June, 30 September and 31 December, and the information refers to the financial year (as this is the year covered by the remuneration report) which is not always the calendar year
• Disclosure continues to evolve and the range of data companies now routinely disclose wasn't matched by earlier remuneration reports. There is also noticeable variation between companies as to what is disclosed
• Be aware of changes to the CEO: this occurred at seven of the ten companies selected. For these seven companies there is a 'break' in the data when the new CEO is appointed and this will impact upon any five year trends you are seeking to capture...although the fact that 70% of this small sample changed CEO in this period might indeed itself form a trend!
Remuneration schemes have changed over time and I have endeavoured to capture this in any data calculations I needed to perform (for example changes to the rate of maximum STI opportunity).
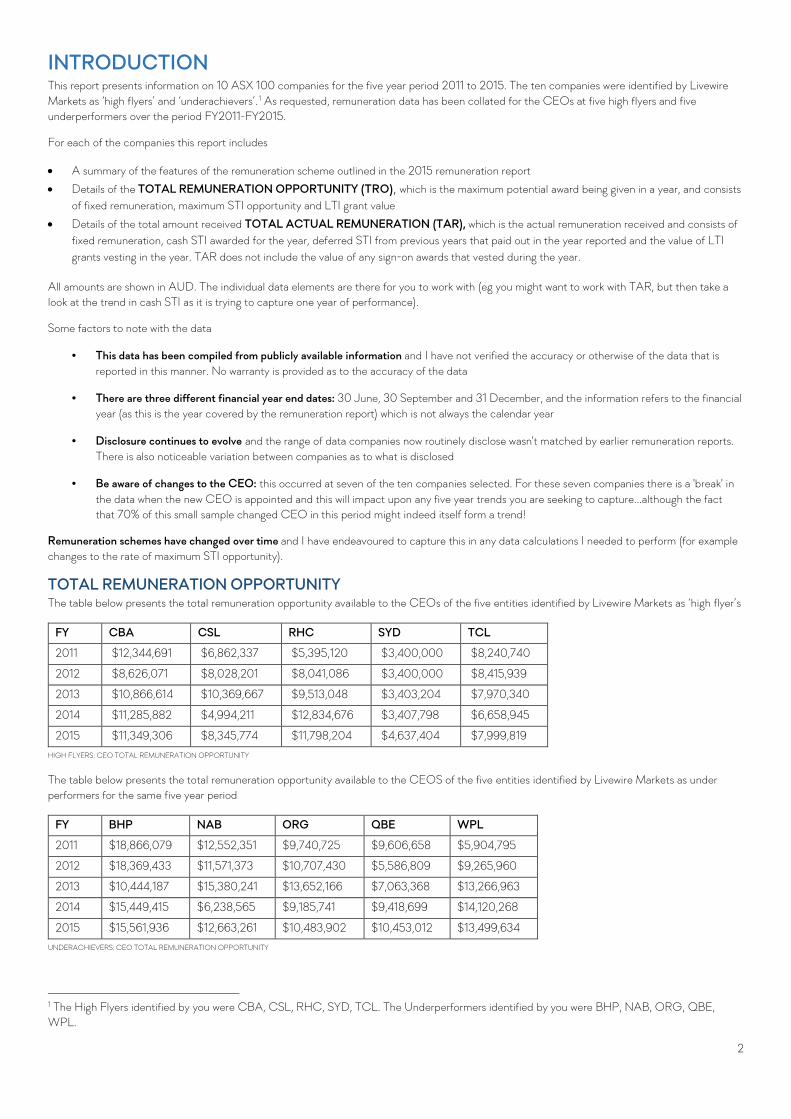
TOTAL REMUNERATION OPPORTUNITY The table below presents the total remuneration opportunity available to the CEOs of the five entities identified by Livewire Markets as ‘high flyer’s
FY CBA CSL RHC SYD TCL
2011 $12,344,691 $6,862,337 $5,395,120 $3,400,000 $8,240,740
2012 $8,626,071 $8,028,201 $8,041,086 $3,400,000 $8,415,939
2013 $10,866,614 $10,369,667 $9,513,048 $3,403,204 $7,970,340
2014 $11,285,882 $4,994,211 $12,834,676 $3,407,798 $6,658,945
2015 $11,349,306 $8,345,774 $11,798,204 $4,637,404 $7,999,819 HIGH FLYERS: CEO TOTAL REMUNERATION OPPORTUNITY
The table below presents the total remuneration opportunity available to the CEOS of the five entities identified by Livewire Markets as under performers for the same five year period
FY BHP NAB ORG QBE WPL
2011 $18,866,079 $12,552,351 $9,740,725 $9,606,658 $5,904,795
2012 $18,369,433 $11,571,373 $10,707,430 $5,586,809 $9,265,960
2013 $10,444,187 $15,380,241 $13,652,166 $7,063,368 $13,266,963
2014 $15,449,415 $6,238,565 $9,185,741 $9,418,699 $14,120,268
2015 $15,561,936 $12,663,261 $10,483,902 $10,453,012 $13,499,634 UNDERACHIEVERS: CEO TOTAL REMUNERATION OPPORTUNITY
1 The High Flyers identified by you were CBA, CSL, RHC, SYD, TCL. The Underperformers identified by you were BHP, NAB, ORG, QBE, WPL.

3
If you look at the FY2015 data alone, three of the high flyers provided a lower total remuneration opportunity than the lowest TRO available to the CEO of the lowest paid identified underachieving company.
TOTAL ACTUAL REMUNERATION The table below presents the total remuneration opportunity available to the CEOs of the five entities identified by Livewire Markets as underachievers
FY CBA CSL RHC2 SYD TCL
2011 $12,872,487 $6,645,424 $3,197,327 $2,850,000 $4,542,540
2012 $3,725,036 $5,743,464 $4,645,678 $3,465,000 $9,469,749
2013 $7,999,802 $7,818,846 $5,497,794 $3,614,721 $2,543,248
2014 $10,274,212 $6,296,500 $9,604,703 $3,617,098 $2,922,559
2015 $8,548,786 $6,980,252 $15,402,869 $3,790,000 $3,230,682 HIGH FLYERS: CEO TOTAL ACTUAL REMUNERATION
The table below presents the total remuneration opportunity available to the CEOS of the five entities identified by Livewire Markets as under performers for the same five year period
FY BHP NAB ORG QBE WPL
2011 $16,030,299 $5,305,457 $7,972,857 $5,795,530 $2,325,948
2012 $17,414,693 $8,320,924 $6,557,803 $2,666,160 $4,575,676
2013 $6,119,105 $8,925,426 $3,100,000 $2,487,600 $4,037,883
2014 $7,797,277 $3,193,895 $3,900,000 $3,089,405 $5,862,161
2015 $4,792,682 $4,233,131 $3,833,333 $2,746,242 $7,792,003 UNDERACHIEVERS: CEO TOTAL ACTUAL REMUNERATION
Taking FY2015 data again, the picture is more mixed for total actual remuneration: while the top two of the highest paid CEOs in this sample of 10 companies came from the high flyers, the third highest paid CEO was from one of the underachievers (WPL). The fourth highest paid CEO was from one of the identified high flyers (CSL) while the next three TAR amounts were from three entities identified as under achievers (BHP, NAB and ORG).
VARIABLE REMUNERATION VERSUS FIXED REMUNERATION Looking at the total remuneration opportunity, there is a some variation between the amounts of fixed versus variable remuneration at the opportunity stage between the high flyers and the underachievers, with fixed remuneration tending to be a higher percentage of total remuneration opportunity amongst the high flying companies than for the identified underachieving companies. There are some exceptional years but mostly this tends to be true across this small group of companies.
There is more variation in fixed remuneration as a percentage of total actual reward. In theory, if a company has performed poorly, then no variable remuneration should be vesting and fixed remuneration as a percentage of total actual reward should be high. However, three of the five underachieving companies made short term incentive (STI) awards across each of the five years examined (NAB, ORG, WPL), while one other company in this group of five companies (BHP) paid in four of the five years (with then CEO requesting no STI award be paid to him for FY2012).
For the high flying companies, STI schemes vested in each of the five years and the LTI scheme (where one exists and the CEO was eligible to have a LTI grant vest in that year) also vested in each of the five years.
However in the identified underachieving companies, only NAB had its LTI scheme vest in each of these years (it vested in four of the five years for BHP, reflecting the promotion of an internal hire with existing LTI grants from prior years). Two of the three companies whose STI schemes vested in each of these five years did not have the LTI scheme vest in each year. Note that changes to the CEO are relevant here: a CEO may not have had any award due to vest in the particular year reported.
IMPLICATIONS FOR THE CURRENT FULL YEAR REPORTING SEASON As this is only a small sample of companies studied, it is not possible to make general observations across the ASX 100 based on these results, with one notable exception: the high proportion of underachieving companies making short term incentive awards for the year of performance. In terms of examining remuneration outcomes for the year, focus on STI awards made as a percentage of the maximum STI opportunity available can give you some insight into the Board’s view of how good the year’s performance from the executives was. Comparing that percentage across years and noting the variation in financial performance can flag those companies where short term rewards do not vary with performance as you might expect. The ‘culprit’ in this instance is likely to be the level of performance set for threshold vesting (the minimum performance required for any STI award). 2 CHRISTOPHER REX'S DEFERRED STI IN ON-MARKET SHARE PURCHASES. I HAVE USED CURRENT YEAR'S TOTAL STI AND DIVDED IN HALF AS IT IS NOT EASY TO TRACE THESE SHARES THROUGH TO THE 3 YEARS AFTER THEY BECOME UNRESTRICTED. THESE AMOUNTS ARE LIKELY TO BE UNDERSTATED.

4
THE FIVE HIGH FLYERS Remuneration for the five high flyers – Commonwealth Bank of Australia, CSL, Ramsay Health Care, Sydney Airport and Transurban – as requested is presented below
COMMONWEALTH BANK OF AUSTRALIA (ASX:CBA) Over the period FY2011 to FY2015 two CEOs have served: Ian Narev from 1 December 2011 and Ralph Norris prior to this. This change in occupant is relevant because Ian Narev, being an internal hire, was appointed on a lower salary than his predecessor.
How CBA remunerates its CEO Fixed remuneration (base salary and superannuation) plus a short term incentive (award based on one year of performance) and a long term incentive (award based on four years of performance).
Short term incentives CBA operates a cash STI scheme, with 50% of any award payable at the end of the financial year and 50% deferred for one year.
For FY2015, CBA used a balanced scorecard approach with financial measures account for 40% of CEO' STI award, 45% for BU managers and 25% for support function manager, with non-financial performance measures account for the balance.
• CUSTOMER FOCUS - CONTINUE TO BUILD A VIBRANT CUSTOMER FOCUSED CULTURE - customer satisfaction across retail banking, business banking, institutional banking and wealth management platforms
• STRENGTH - MAINTAIN A STRONG, FLEXIBLE BALANCE SHEET - capital ratios; customer deposits, short term wholesale funding; liquid asset portfolio, NIM, NPAT, net interest income, levels of lending losses
• PRODUCTIVITY - CONTINUALLY IMPROVE AND STREAMLINE PROCESSES WITH FOCUS ON SIMPLICITY AND ENHANCED CUSTOMER AND EMPLOYEE EXPERIENCE
• TECHNOLOGY - PROGRAMS DESIGNED TO ENHANCE CUSTOMER EXPERIENCE VIA INNOVATIE SYSTEMS AND PROCESSES AND IMPROVED EFFICIENCY LEVELS
• PEOPLE - CONTINUE TO BUILD AN EFFECTIVE WORKFORCE, ALIGNED TO BUSINESS NEED AND PERFORMING AT ITS BEST - includes diversity targets, leadership development, employee engagement score
There are many measures being assessed here, so trying to piece together the overall performance picture, even just on the strength (financial and capital) performance measures is an interesting task because it appears easy to tip the award into vesting by being ‘at target’ across a number of things across a number of measures. It also shows that being ‘at target’ on the financial and capital strength measures is good enough performance to be near the maximum STI award when three of the other five categories are achieved ‘above target’.
SIZE OF ANNUAL GRANTS STI FOR EXECUTIVES = 100% OF FIXED REMUNERATION AT TARGET WITH A MAX OF 150% OF TARGET STI, so that the maximum STI opportunity is 150% of fixed remuneration.
DEFERRED COMPONENT Fifty per cent of any STI award is deferred into cash for one year, with interest at the Bank's one year term deposit rate.
MALUS AND/OR CLAWBACK Board discretion to adjust deferred remuneration, including complete forfeiture.
Long term incentives CBA's LTI scheme, the Group Leadership Rewards Plan (GLRP), is a reward right scheme with pays out in shares or cash equivalent at the end the four year performance period based on two performance measures
• TSR relative to a peer group of 21 (including CBA) largest companies on ASX by market capitalisation at beginning of performance period, excluding resources companies (per graph on page 79 of AR 12) = 75% of award. TSR: 50% vests at 50th percentile; 100% vests at 75th percentile, straight line in-between - a standard approach
• CUSTOMER SATISFACTION = 25% of award. This is measured against a separate peer group 'including' ANZ, NAB, Westpac and 'other key competitors for our Wealth business'. Three independent surveys used: Roy Morgan Research (Retail banking); DBM Business Financial Services Monitor (Business banking) and Wealth Insights Service Level Report Platforms (Wealth Management). Customer satisfaction: 50% vests if Group's weighted average ranking is 2nd; 100% vests if CBA ranked 1st; with vesting on a straight line basis in between.
SIZE OF LTI OPPORTUNITY MD/CEO and Group executives receive 100% fixed remuneration 'at target' 'based on expected values at the end of the performance period in today's dollars'. CBA uses a fair valuation methodology to price the rights with the MD/CEO’s grant for FY2015 of 58,131 having a value of $2.65

5
million on fair value with a discount of 56% applied to the face value of $4,713,843 calculated by multiplying the grant of 58,131 reward rights by the 5-day VWAP up to and including 1 July 2014 of $81.09.
Clawback applies to unvested LTI awards.
Share holdings CEO and Group Executives must build up and retain a holding to value of 300% fixed remuneration (CEO) and 200% fixed remuneration (other executive KMP).
EXECUTIVE 2015 VALUE AT FYE CSP
IAN NAREV 93,271 $7,940,160
DATA SOURCES AR15, P. 63 CSP $85.13
Total remuneration opportunity and total actual remuneration The first table below presents the total remuneration opportunity over the financial years 2011 to 2015
ASX:CBA YEAR FIXED REM STI MAX OPPORTUNITY LTI GRANT VALUE TRO FIXED REM AS % OF TRO
RN FY2011 $3,120,000 $4,680,000 $4,544,691 $12,344,691 25% IAN NAREV – PART YEAR FY2012 $1,845,779 $2,768,669 $4,011,623 $8,626,071 21%
IN FY2013 $2,500,000 $3,750,000 $4,616,614 $10,866,614 23% IN FY2014 $2,575,000 $3,862,500 $4,848,382 $11,285,882 23% IN FY2015 $2,650,000 $3,975,000 $4,724,306 $11,349,306 23%
TOTAL REMUNERATION OPPORTUNITY, CBA’S CEO, FY2011-FY2015
The second table below presents total actual remuneration over the same five financial years.
ASX:CBA YEAR FIXED REM CASH STI DEFERRED STI FROM PRIOR YEAR
LTI VESTING VALUED AT DATE OF VESTING
TAR FIXED REM AS % OF TAR
RN FY2011 $3,120,000 $1,638,000 $1,944,465 $6,170,022 $12,872,487 24% IAN NAREV – PART YEAR FY2012 $1,845,779 $999,544 $512,939 $366,774 $3,725,036 50%
IN FY2013 $2,500,000 $1,562,500 $2,723,838 $1,213,464 $7,999,802 31% IN FY2014 $2,575,000 $1,480,625 $4,048,420 $2,170,167 $10,274,212 25% IN FY2015 $2,650,000 $1,590,000 $2,353,070 $1,955,716 $8,548,786 31%
TOTAL ACTUAL REMUNERATION, CBA’S CEO, FY2011-FY2015
CSL (ASX:CSL) Over the period FY2011 to FY2015 two CEOs have served: Brian McNamee to 30 June 2013 (ie FY2011-FY2013) and Paul Perrault from 1 July 2013 (ie FY2014 and FY2015).
Fixed remuneration Fixed remuneration at CSL takes the form of cash salaries, superannuation and non-monetary benefits. Annual reviews of fixed remuneration include market benchmarking but not necessarily automatic increases.
Short term incentives3 CSL's STI is an annual cash (67%) plus deferred STI (33%) scheme.
Performance is based on a mix of financial and non-financial work plan targets. For the MD/CEO, 60% is based on financial and business performance metrics, 40% for individual work plan objectives. For other executive KMP, the split between financial/business and work plan objectives is 50:50.
Group financial and business performance metrics include
• financial performance • research and development investment, achieving key milestones as agreed to drive both short term and long term growth opportunities • key operational metrics to assess the efficiency and quality of operations
Individual performance has four categories
3 FINANCIAL REPORT 2015, PP. 14-15, 19-20.

6
• quantified performance outcomes • achievement of specific strategic objectives aligned to longer term growth • delivery of improvements and change initiatives in operations, risk management, compliance and health and safety. This also includes quality,
safety of medicines, health, operational safety and environment, maintaining high personal and organisation levels of compliance and quality
• leadership performance
CSL sets threshold, target and above target levels of performance, with above target performance resulting in greater than 100% contribution for that component up to a maximum of 150%.
SIZE OF ANNUAL GRANTS Increases were made during FY2015 to the STI potential: CEO/MD: 100% of fixed remuneration as target; 150% at maximum. Other executive KMP: range of 60-85% of fixed remuneration as target and
DEFERRED COMPONENT One-third deferred into a notional allocation of CSL shares for three years with a cash amount paid at the end of that period of the number of notional shares by the 5 day VWAP immediately preceding the grant date. The three year period may be shortened at the Board's discretion.
MALUS/CLAWBACK
Clawback applies to the deferred component with the trigger being a misstatement of financials, or the executive KMP breaches his or her obligations.
Long term incentives4 The review of the LTI scheme during FY2014 has resulted in a higher LTI award, with the following features the grant is in the form of performance options and performance rights. The performance options only have a 'must meet their performance expectations as defined in their work plans', while the performance rights vest after a four year performance period with no retesting of the three performance conditions (one condition attached to each tranche) as follows
Tranche 1 – relative TSR against an international comparator group of global Pharmaceutical and Biotechnology companies with (i) manufacturing operations, (ii) R&D pipeline and (iii) comparable market capitalisation with the ‘standard’ vesting schedule of 50 per cent vests for 50th percentile (median of group), with 100 per cent vesting for upper quartile performance
Tranche 2 – EPS growth at target of 8 per cent results in 35 per cent vesting, with 100 per cent vesting for EPS growth at 13 per cent (target EPSg performance hurdles)
Tranche 3 – EPS growth achieved at ‘upside’, with 100 per cent vesting for EPS growth of 15 per cent, and vesting beginning somewhere above 13 per cent (upside EPSg performance hurdles)
SIZE OF ANNUAL GRANTS MD/CEO: 60% of fixed remuneration as performance options; 100% of fixed remuneration as performance rights. Other executive KMP: 40% of fixed remuneration as performance options (KMP outside Australia); 65% of fixed remuneration as performance rights
A fair valuation methodology, Black Scholes, is used to price the options with Monte Carlo Simulation for the market condition tranches of the performance rights
Clawback applies to the unvested LTI awards and these may be forfeited for a misstatement of financials or where an executive KMP breaches his or her obligations.
EXECUTIVE DEFERRED INCENTIVE PLAN (EDIP) This is a separate and discretionary plan, with LTI awards of notional shares to select executive KMP (depending on retention risk or market indicators for that particular individual or role). It has a three year vesting period and only a 'must not fail to meet their performance expectations as defined in their work plan' performance requirement. The notional shares are cash settled by multiplying the number of notional shares by the 5-day VWAP immediately preceding the vesting date. Awards were made in FY2015 to all the executive KMP in October 2014, with awards ranking between 10% of fixed remuneration to 40% of fixed remuneration for the MD/CEO. This lends support for the view that this is really about market indicators rather than retention per se. Clawback applies to the unvested EDIP notional shares.
Share holdings While CSL does not set a minimum shareholding guideline for its executive KMP, it encourages these executives to build up and maintain a shareholding in CSL.
SHAREHOLDINGS AT FYE 2015 VALUED AT CSP OF $86.47 PAUL PERREAULT 36,071 $3,119,059
DATA SOURCES FR15, P. 30 CALCULATION
4 FINANCIAL REPORT 2015, P. 16.

7
Total remuneration opportunity and total actual remuneration The first table below presents the total remuneration opportunity over the financial years 2011 to 2015
ASX:CSL YEAR FIXED REM STI MAX OPPORTUNITY LTI GRANT VALUE TRO FIXED REM AS % OF TRO
BM 2011 $2,553,862 $2,298,476 $2,009,999 $6,862,337 37% BM 2012 $2,683,096 $3,219,715 $2,125,390 $8,028,201 33% BM 2013 $3,346,925 $4,016,310 $3,006,432 $10,369,667 32% PP 2014 $1,852,660 $1,852,660 $1,291,891 $4,997,211 37% PP 2015 $2,208,681 $3,313,022 $2,824,071 $8,345,774 26%
TOTAL REMUNERATION OPPORTUNITY, CSL’S CEO, FY2011-FY2015
The second table below presents total actual remuneration over the same five financial years.
ASX:CSL YEAR FIXED REM CASH STI DEFERRED STI FROM PRIOR YEAR
LTI VESTING VALUED AT DATE OF VESTING
TAR FIXED REM AS % OF TAR
BM 2011 $2,553,862 $1,359,666 $583,822 $2,148,074 $6,645,424 38% BM 2012 $2,683,096 $2,047,556 $506,259 $506,553 $5,743,464 47% BM 2013 $3,346,925 $2,316,844 $705,341 $1,449,736 $7,818,846 43% PP 2014 $1,852,660 $1,139,000 $121,995 $3,182,845 $6,296,500 29% PP 2015 $2,208,681 $1,370,103 $237,677 $3,163,791 $6,980,252 32%
TOTAL ACTUAL REMUNERATION, CSL’S CEO, FY2011-FY2015
RAMSAY HEALTH CARE (ASX:RHC) Christopher Rex has been MD/CEO over the entire five-year period.
Fixed remuneration Fixed remuneration is cash salary plus superannuation plus other in the form of non-monetary benefits such as health insurance and motor vehicles. As with NED fees, Ramsay Healthcare routinely increases fixed remuneration, but it can be seen how the cumulative effect can mean sizeable gains over time.
Short term incentives The STI scheme is a cash scheme for the executives with the exception of the MD whose STI is 50 per cent cash/ 50 per cent on-market purchased ordinary shares, With target performance worth 60 per cent of the STI opportunity for financial performance to budget, with a further 40 per cent available for ‘stretch’ performance on Core NPAT, the company sets internal targets for both levels of performance.
Financial KPIs for the MD for FY2015 were based on financial performance of global business as a whole (24% as target KPI) and core NPAT above budget (20% as the stretch KPI)
The non-financial target KPIs for the MD for FY2015 were across three areas:
• strategy, leadership and culture (18 per cent); • international strategy (12 per cent); and
• Discretionary criteria (6 per cent).
The non-financial ‘stretch’ KPIs for the MD for FY2015 were discretionary criteria (20%) including execution of the Générale de Santé acquisition and subsequent integration into the Ramsay global business.
SIZE OF ANNUAL GRANTS MD/CEO: 100% of fixed remuneration is maximum STI opportunity. Other executive KMP: 50% of fixed remuneration is maximum STI opportunity
DEFERRED COMPONENT Applying to the MD/CEO only, fifty per cent of the STI award (after tax) is used to purchase shares on market which are subject to a dealing restriction for three years.
Long term incentives The long term incentive (LTI) scheme consists of annual grants of performance rights which vest after three years depending on group performance on two equally weighted and independently assessed performance measures:
8
• Aggregate growth in Core EPS, with 50 per cent vesting for achieving the unpublished5 threshold EPS target and 100 per cent vesting for achieving an aggregate EPS greater than the maximum target, with vesting on a straight line basis between these two points. There is only one test of this measure at the end of the three year performance period
• TSR relative to the S&P/ASX 200 (excluding resources, real estate/AREITs and financial services), with 50 per cent vesting for median performance and 100 per cent vesting for upper quartile performance, with vesting on a straight line basis between these two points. This hurdle is retested 6 months and 12 months after the initial test date and whatever performance rights did not vest at the first test date are eligible to vest at either of these subsequent dates.
SIZE OF ANNUAL GRANTS MD/CEO: LTI grant is 300% of fixed remuneration; FD/CFO: LTI grant is 200% of fixed remuneration; Sims and McNally: LTI grant is around 235% of fixed remuneration. From the disclosures on page 11 of the Notice of 2014 AGM and Explanatory Notes, the company uses a Black Scholes and a Monte Carlo simulation to price in the risk components of the performance rights to determine that value. While the value can only be fully determined once the rights have been granted, the figures given in point (b) on page 11 indicate that while the share price at that date was $51.89, the indicative value was $42.865.
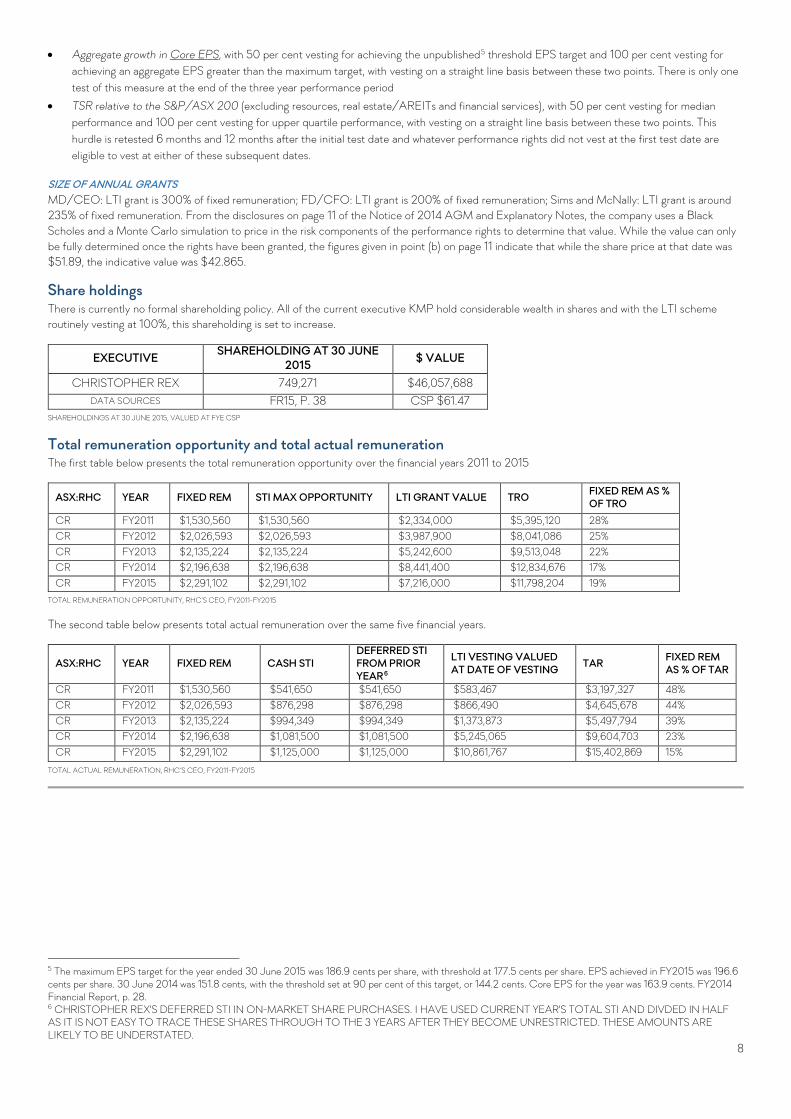
Share holdings There is currently no formal shareholding policy. All of the current executive KMP hold considerable wealth in shares and with the LTI scheme routinely vesting at 100%, this shareholding is set to increase.
EXECUTIVE SHAREHOLDING AT 30 JUNE 2015 $ VALUE
CHRISTOPHER REX 749,271 $46,057,688 DATA SOURCES FR15, P. 38 CSP $61.47
SHAREHOLDINGS AT 30 JUNE 2015, VALUED AT FYE CSP
Total remuneration opportunity and total actual remuneration The first table below presents the total remuneration opportunity over the financial years 2011 to 2015
ASX:RHC YEAR FIXED REM STI MAX OPPORTUNITY LTI GRANT VALUE TRO FIXED REM AS % OF TRO
CR FY2011 $1,530,560 $1,530,560 $2,334,000 $5,395,120 28% CR FY2012 $2,026,593 $2,026,593 $3,987,900 $8,041,086 25% CR FY2013 $2,135,224 $2,135,224 $5,242,600 $9,513,048 22% CR FY2014 $2,196,638 $2,196,638 $8,441,400 $12,834,676 17% CR FY2015 $2,291,102 $2,291,102 $7,216,000 $11,798,204 19%
TOTAL REMUNERATION OPPORTUNITY, RHC’S CEO, FY2011-FY2015
The second table below presents total actual remuneration over the same five financial years.
ASX:RHC YEAR FIXED REM CASH STI DEFERRED STI FROM PRIOR YEAR6
LTI VESTING VALUED AT DATE OF VESTING TAR FIXED REM
AS % OF TAR
CR FY2011 $1,530,560 $541,650 $541,650 $583,467 $3,197,327 48% CR FY2012 $2,026,593 $876,298 $876,298 $866,490 $4,645,678 44% CR FY2013 $2,135,224 $994,349 $994,349 $1,373,873 $5,497,794 39% CR FY2014 $2,196,638 $1,081,500 $1,081,500 $5,245,065 $9,604,703 23% CR FY2015 $2,291,102 $1,125,000 $1,125,000 $10,861,767 $15,402,869 15%
TOTAL ACTUAL REMUNERATION, RHC’S CEO, FY2011-FY2015
5 The maximum EPS target for the year ended 30 June 2015 was 186.9 cents per share, with threshold at 177.5 cents per share. EPS achieved in FY2015 was 196.6 cents per share. 30 June 2014 was 151.8 cents, with the threshold set at 90 per cent of this target, or 144.2 cents. Core EPS for the year was 163.9 cents. FY2014 Financial Report, p. 28. 6 CHRISTOPHER REX'S DEFERRED STI IN ON-MARKET SHARE PURCHASES. I HAVE USED CURRENT YEAR'S TOTAL STI AND DIVDED IN HALF AS IT IS NOT EASY TO TRACE THESE SHARES THROUGH TO THE 3 YEARS AFTER THEY BECOME UNRESTRICTED. THESE AMOUNTS ARE LIKELY TO BE UNDERSTATED.

9
SYDNEY AIRPORT (ASX:SYD) Kerrie Mather has been MD/CEO for the full five-year period.
Executive remuneration Executives receive remuneration in the form of fixed and variable remuneration.
Fixed remuneration Fixed annual remuneration consists of base salary and benefits including minimum SGC contributions.
Short term incentives Sydney Airport’s STI scheme takes the form of cash and deferred cash with vesting based 50% on Group objectives, and 50% on individual targets.
Group objectives for FY2015 were across five areas: Financial performance; Business/operational performance; Strategic projects; Customer and stakeholder engagement and People and culture. The commentary below includes outcomes because it gives you an indication of the range of measures used in the scheme.
Financial performance: A strong set of momentum results in revenue growth, EBITDA growth and security holder distribution growth, plus the five year TSR of 37% per annum and the successful issue of US$500 million in US144A/RegS bonds are identified in the remuneration report as relevant to this outcome. The funds raised were used to refinance two domestic bonds maturing the 2015: $175 million in July 2015, and $300 million in November 2015. The remaining funds were sued to repay committed drawn bank debt facilities.
Business/operational performance: Growth momentum across traffic, with International passenger growth of 4.3%; total passenger numbers up 3% to 39.7 million and segment revenue as noted above
Strategic projects: Seven new airlines introduced services;7 completion of the T3 transaction;8 successfully renegotiating five-year international aeronautical agreements with a 3.8% average aeronautical price increase over the next four years; implementing the new duty free operator (with 400 new brands brought to T1 and the presentation slides describing the agreement as being on superior terms for Sydney Airport); and activities related to the Western Sydney Airport consultation process
Customer and stakeholder engagement: Aside from engagement with airlines, key outcomes from engagement with airport stakeholder groups on service delivery are noted as
• Investment of $339 million on facilities and infrastructure resulting in significant capacity expansions an passenger experience improvements • Technology innovations including automated bag drops, self-service check in, and Smart Gates (both inbound and outbound) • Independent certification from the Customer Service Institution of Australia obtained • Achieved Airport Council International Level Two Carbon Accreditation in 2015 and committed to 25% carbon reduction target per
passenger by 2020
• Consultation with community, councils and the state and Federal government in relation to developments and ground transport works, with the Federal Government approving the T2/T3 Ground Transport Access Solutions and Hotel Major Development Plan
People and culture: A number of achievements are noted
• Culture survey: positive results with 10 out of 15 categories rates in the high zone, with non in the low zone
• Diversity: an expanded Diversity Policy introduced by the Board with a public commitment to the AICD 30% Club for both Board and Management roles is interesting to include here as it is a Board level activity, although implementation of the strategy does fall to the executive management team. Total female employment increased from 30.8% to 33.5%, with female managers increasing from 29% to 32.2%, Age diversity (Gen Y 21.9%; Baby Boomer 19.6%, no details for the others) and cultural diversity (28 nationalities and 20 languages) are noted.
• Safety: LTIFR improved from 5.5 to 2.4. Safety training programs for employees are also noted. • Organisation development: Staff training on conflict resolution and customer service (frontline staff), communications, presentation with
confidence and management training.
The links with Group strategy are on some levels clear. Yet with five separate categories of measures, together with some obvious overlap between financial performance and business/operational performance (the former category captures EBITDA and revenue growth; the latter category revenue growth), there is a risk of rewarding essentially the same performance twice. These two categories could be combined and further thought given as to the best metrics to capture financial performance. For example security holder distribution growth is not something that should be rewarded directly as a performance measure:
7 American Airlines, ANA, Xiamen, Indonesia AirAsiaX, Qatar Airlines, Solomon Airlines and Hainan Airlines. 8 Sydney Airport reached agreement with Qantas Airways Limited ASX:QAN to take control of T3 for $535 million, four years ahead of the previous lease expiry. This provides Sydney Airport with flexibility for the future. It replaces a fixed property revenue stream with incremental revenues across aeronautical, retail and property…plus the associated opex.

10
SIZE OF ANNUAL GRANTS CEO: Maximum potential STI is 100% of fixed remuneration. OTHER EXECUTIVE KMP: 72% of fixed remuneration.
DEFERRED COMPONENT9 For the CEO: 20% deferral up to 100% FAR and one-third deferral for an STI award in excess of 100% FAR. For the other executives the deferred portion is much lower, with the table on page 26 of the 2015 Annual Report suggesting it is around 16.67% for Shelley Roberts, Executive Director of Aviation Services; and 17.47% for the CFO, Hugh Wehby. Deferral lasts for two years from the date of the award, with market-rate interest earned over this period and paid at the end of the deferral period, subject to continuous service.
Long term incentives A new LTI scheme was introduced in FY2015. Annual grants of rights will vest after three years based on performance against three equally weighted, but separately assessed measures, with no retests:
• Relative TSR against the S&P/ASX 100, with 50% vesting at the 50th percentile and 100% vesting for upper quartile performance. No amount will be paid unless Sydney Airport's absolute TSR for the three year period is positive.
• CAGR in cash flow per stapled security: growth rate in cash flow per security (calculated for each year as Net Operating Revenue adjusted for any extraordinary items divided by weighted average number of stapled securities for the financial year), with 50% vesting for CAGR CPS of 8% and 10% vesting for CAGR CPS of 12%
• Non-financial performance condition, which the Board can have regard to organisation (operational aspects of Sydney Airport Performance), people and leadership, customers and the delivery of financial outcomes
This last category overlaps with a number of categories within the Group performance objectives in the STI scheme and probably the individual performance objectives as well (although these are not currently disclosed). Again there is the risk of the same performance being rewarded initially in the STI scheme and again in the LTI scheme.
With grants made for the first time in 2015, there is no LTI scheme eligible to vest in FY2015.
SIZE OF ANNUAL GRANTS These aren’t clearly disclosed in the Remuneration Report. The CEO appears to receive a grant at around 58% of fixed remuneration, while the other executive KMP receive a grant to value of 32% of fixed remuneration.
Security holdings policy Sydney Airport does not yet have a formal security holding policy as part of its executive remuneration strategy. Given 2015 was the first year in which any part of the remuneration was awarded by way of securities this outcome is unsurprising. That said, the current MD/CEO has sizeable wealth in SYD securities and is listed as one of the Top 20 holders of stapled securities.
SECURITY HOLDINGS 2015 VALUE AT FYE CSP KERRIE MATHER 3,800,508 $24,133,227 DATA SOURCE AR15, P. 26 CSP $6.35
Total remuneration opportunity and total actual remuneration The first table below presents the total remuneration opportunity over the financial years 2011 to 2015
ASX:SYD YEAR FIXED REM STI MAX OPPORTUNITY LTI GRANT VALUE TRO FIXED REM AS % OF TRO
KM FY2011 $1,700,000 $1,700,000 - $3,400,000 50% KM FY2012 $1,700,000 $1,700,000 - $3,400,000 50% KM FY2013 $1,701,602 $1,701,602 - $3,403,204 50% KM FY2014 $1,703,899 $1,703,899 - $3,407,798 50% KM FY2015 $1,800,000 $1,800,000 $1,037,404 $4,637,404 39%
TOTAL REMUNERATION OPPORTUNITY, SYD’S CEO, FY2011-FY2015
The second table below presents total actual remuneration over the same five financial years.
ASX:SYD YEAR FIXED REM CASH STI DEFERRED STI FROM PRIOR YEAR
LTI VESTING VALUED AT DATE OF VESTING
TAR FIXED REM AS % OF TAR
KM FY2011 $1,700,000 $1,150,000 - $2,850,000 60% KM FY2012 $1,700,000 $1,150,000 $615,000 $3,465,000 49% KM FY2013 $1,701,602 $1,363,119 $550,000 $3,614,721 47% KM FY2014 $1,703,899 $1,363,199 $550,000 $3,617,098 47% KM FY2015 $1,800,000 $1,440,000 $550,000 $3,790,000 47%
TOTAL ACTUAL REMUNERATION, SYD’S CEO, FY2011-FY2015
9 FR 2015, p. 23.
11
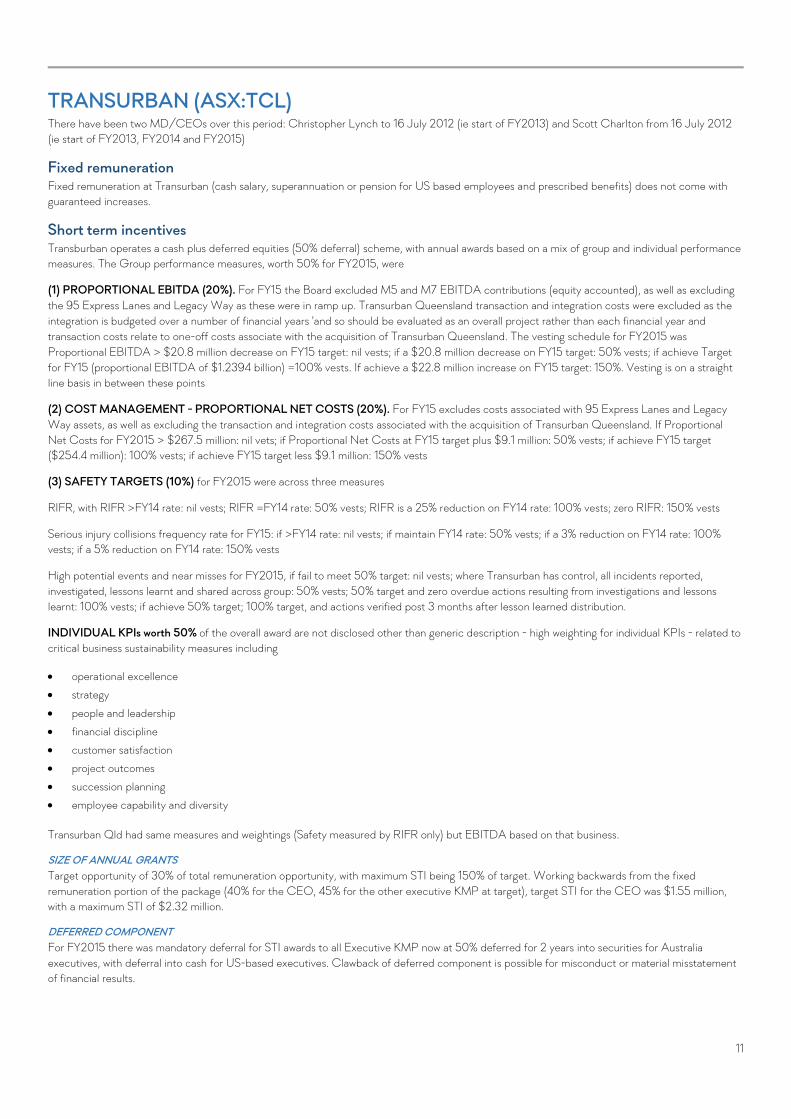
TRANSURBAN (ASX:TCL) There have been two MD/CEOs over this period: Christopher Lynch to 16 July 2012 (ie start of FY2013) and Scott Charlton from 16 July 2012 (ie start of FY2013, FY2014 and FY2015)
Fixed remuneration Fixed remuneration at Transurban (cash salary, superannuation or pension for US based employees and prescribed benefits) does not come with guaranteed increases.
Short term incentives Transburban operates a cash plus deferred equities (50% deferral) scheme, with annual awards based on a mix of group and individual performance measures. The Group performance measures, worth 50% for FY2015, were
(1) PROPORTIONAL EBITDA (20%). For FY15 the Board excluded M5 and M7 EBITDA contributions (equity accounted), as well as excluding the 95 Express Lanes and Legacy Way as these were in ramp up. Transurban Queensland transaction and integration costs were excluded as the integration is budgeted over a number of financial years 'and so should be evaluated as an overall project rather than each financial year and transaction costs relate to one-off costs associate with the acquisition of Transurban Queensland. The vesting schedule for FY2015 was Proportional EBITDA > $20.8 million decrease on FY15 target: nil vests; if a $20.8 million decrease on FY15 target: 50% vests; if achieve Target for FY15 (proportional EBITDA of $1.2394 billion) =100% vests. If achieve a $22.8 million increase on FY15 target: 150%. Vesting is on a straight line basis in between these points
(2) COST MANAGEMENT - PROPORTIONAL NET COSTS (20%). For FY15 excludes costs associated with 95 Express Lanes and Legacy Way assets, as well as excluding the transaction and integration costs associated with the acquisition of Transurban Queensland. If Proportional Net Costs for FY2015 > $267.5 million: nil vets; if Proportional Net Costs at FY15 target plus $9.1 million: 50% vests; if achieve FY15 target ($254.4 million): 100% vests; if achieve FY15 target less $9.1 million: 150% vests
(3) SAFETY TARGETS (10%) for FY2015 were across three measures
RIFR, with RIFR >FY14 rate: nil vests; RIFR =FY14 rate: 50% vests; RIFR is a 25% reduction on FY14 rate: 100% vests; zero RIFR: 150% vests
Serious injury collisions frequency rate for FY15: if >FY14 rate: nil vests; if maintain FY14 rate: 50% vests; if a 3% reduction on FY14 rate: 100% vests; if a 5% reduction on FY14 rate: 150% vests
High potential events and near misses for FY2015, if fail to meet 50% target: nil vests; where Transurban has control, all incidents reported, investigated, lessons learnt and shared across group: 50% vests; 50% target and zero overdue actions resulting from investigations and lessons learnt: 100% vests; if achieve 50% target; 100% target, and actions verified post 3 months after lesson learned distribution.
INDIVIDUAL KPIs worth 50% of the overall award are not disclosed other than generic description - high weighting for individual KPIs - related to critical business sustainability measures including
• operational excellence • strategy
• people and leadership • financial discipline • customer satisfaction • project outcomes • succession planning • employee capability and diversity
Transurban Qld had same measures and weightings (Safety measured by RIFR only) but EBITDA based on that business.
SIZE OF ANNUAL GRANTS Target opportunity of 30% of total remuneration opportunity, with maximum STI being 150% of target. Working backwards from the fixed remuneration portion of the package (40% for the CEO, 45% for the other executive KMP at target), target STI for the CEO was $1.55 million, with a maximum STI of $2.32 million.
DEFERRED COMPONENT For FY2015 there was mandatory deferral for STI awards to all Executive KMP now at 50% deferred for 2 years into securities for Australia executives, with deferral into cash for US-based executives. Clawback of deferred component is possible for misconduct or material misstatement of financial results.

12
Long term incentives Transurban's LTI scheme is a performance awards plan (ZEPO) which is either cash or equity settled, with annual awards vesting after three years based on performance against two equally weighted performance measures
(1) Relative TSR against a bespoke comparator group of 37 companies (ASX 150 - transport, utilities, real estate, construction and infrastructure GICS), with relative TSR >50TH PERCENTILE: 50% VESTS; and relative TSR ≥ 75TH PERCENTILE: 100% VESTS. Vesting is on a straight line basis between these points.
(2) CAGR FREE CASH FLOW PER SECURITY, with CAGR of <10% FCF/Security: nil vests; 10% FCF/SECURTY = 50% vests; ≥13% FCF/SECURITY = 100% vests. Vesting is on a straight line basis in between these points. Note this range is lower than the FCF/Security set for FY2014.10
SIZE OF ANNUAL GRANTS The annual grant at target is the same value as the STI grant for the CEO, and slightly less than this for the other executive KMP. This dollar value is converted into a number of performance awards using a fair value approach, with two different values calculated: one for relative TSR and a separate calculation for FCF/Security.
SIGN-ON GRANT TO CEO Scott Charlton received a one-off sign-on grant of 236,256 performance awards, with vesting in three equal tranches of 78,752 awards on each of first three yearly anniversaries of his appointment. The second trances vested on 176 July 2014 and the third tranche vested on 16 July 2015.
Security holdings Transurban does not currently have a formal security holding requirement for its Executive KMP and while US-based executives do not hold securities, a number of executives are based in Australia and could readily build up and maintain a security holding in light of the use of share-based payments in the deferred STI and LTI schemes for these executives.
EXECUTIVE 2015 VALUE AT FYE CSP
SCOTT CHARLTON 213,374 $1,984,378 DATA SOURCES FR15, P. 42 CSP of $9.30
Total remuneration opportunity and total actual remuneration The first table below presents the total remuneration opportunity over the financial years 2011 to 2015
ASX:TCL YEAR FIXED REM STI MAX OPPORTUNITY LTI GRANT VALUE TRO FIXED REM AS % OF TRO
CL FY2011 $2,080,860 $2,332,502 $3,827,378 $8,240,740 25% CL FY2012 $2,171,150 $2,433,711 $3,811,078 $8,415,939 26% SC FY2013 $1,804,948 $2,023,223 $4,142,169 $7,970,340 23% SC FY2014 $1,883,309 $2,111,061 $2,664,575 $6,658,945 28% SC FY2015 $2,069,707 $2,320,000 $3,610,112 $7,999,819 26%
TOTAL REMUNERATION OPPORTUNITY, TCL’S CEO, FY2011-FY2015
The second table below presents total actual remuneration over the same five financial years.
ASX:TCL YEAR FIXED REM CASH STI DEFERRED STI FROM PRIOR YEAR
LTI VESTING VALUED AT DATE OF VESTING TAR
FIXED REM AS % OF TAR
CL FY2011 $2,080,860 $2,461,680 $- $- $4,542,540 46% CL FY2012 $2,171,150 $4,764,963 $- $2,533,636 $9,469,749 23% SC FY2013 $1,804,948 $738,300 $- $- $2,543,248 71% SC FY2014 $1,883,309 $1,039,250 $- $- $2,922,559 64% SC FY2015 $2,069,707 $1,160,975 $- $- $3,230,682 64%
TOTAL ACTUAL REMUNERATION, TCL’S CEO, FY2011-FY2015
10 FINANCIAL REPORT 2015, P. 35: COMPLETION OF M2 JUSTIFIED A HIGHER RATE FOR FY14 GRANTS OF FCF/SECURITY RANGING FROM 12%-15%.

13
THE FIVE UNDERPERFORMERS Five ASX 100 constituents were nominated by Livewire Markets as underachieving companies on the basis of 5 year underperformance – BHP Billiton Limited, National Australian Bank, Origin Energy, QBE Insurance and Woodside Petroleum.
BHP BILLITON (ASX:BHP) There have been two CEOs over this period: Marius Kloppers to February 2013 (ie FY2011, FY2012 and part of FY2013) and Andrew Mackenzie from 10 February 2013 (ie part of FY2013, FY2014 and FY2015)
Fixed remuneration Fixed remuneration in the form of base salary, non-cash benefits and pension/superannuation.
RELOCATION ALLOWANCES Sizeable relocation allowances are noted: for example relocation allowances were paid in FY2015 to two executives relocating internationally: the new President HR Athalie Williams (US$580,000) and to Peter Bevan (US$700,000). Two executives relocating domestically received US$58,000 in relocation allowances (Mike Henry and Dean Dalla Valle).
Short term incentives BHP Billiton operates a cash plus deferred rights scheme (50% deferral) for its STIP. Performance over one year is assessed against a balanced scorecard of financial and non-financial measures (with the weightings below for the MD/CEO’s scorecard)
• Health, Safety, Environment and Community (20%)
• Attributable Profit (40%) • Capital project management (20%) • Individual measures (20%)
SIZE OF ANNUAL GRANTS MD/CEO: target grant of 160% of base salary, with maximum STI opportunity of 240% of base salary.
DEFERRED COMPONENT The deferred component is deliver in the form of rights to BHP Billiton shares which vest after two years based on continued service (with the contractual terms indicating the grant may be retained on ceasing employment in most circumstances). Malus and clawback apply to the deferred STIP. Dividend equivalents accrue over the vesting period and are paid at the end of the period in the form of additional shares (if equity settled) or cash (if deferred component is cash settled).
Long term incentives BHP Billiton’s LTIP is a performance rights based scheme. LTIP rights vest after five years based on relative TSR performance against two comparator groups (a) a bespoke peer comparator group for 67% of the award and (b) MSCI World Index for the remaining 33%. For each measure, 25% vests for median performance, with full vesting if the median is exceeded by 5.5% per annum or by 30.7% at the end of the five-year performance period. The weight of any one company in the bespoke peer group is capped at 15%.
Dividend equivalent payments accrue over the performance period and are paid on the number of rights vesting.
SIZE OF ANNUAL GRANTS The MD/CEO’s annual grant has a face value of 400% of his base salary of US$1.7 million or US$6.8 million. The number of rights to be awarded is based on face value converted from USD to AUD using the 12 month average exchange rate, divided by the 12 months VWAP of shares traded on the ASX
Share holdings The MD/CEO is required to build up and maintain a shareholding equivalent to five times his gross annual base salary of US$1.7 million. Other GMC members must build up and main a shareholding equivalent to three times annual gross base salary.
EXECUTIVE LTD SHARES 2015 AUD VALUE AT CSP PLC SHARES 2015 £ VALUE AT CSP ANDREW MACKENZIE NIL NA 266,246 £3,325,413
DATA SOURCES AR15, P. 195 CSP AUD $27.04 AR15, P. 195 CSP £12.49

14
Total remuneration opportunity and total actual remuneration The first table below presents the total remuneration opportunity over the financial years 2011 to 2015
ASX:BHP YEAR FIXED REM STI MAX OPPORTUNITY LTI GRANT VALUE TRO FIXED REM AS % OF TRO
MK FY2011 $3,091,840 $6,868,239 $8,906,000 $18,866,079 16% MK FY2012 $3,093,426 $6,828,382 $8,447,624 $18,369,433 17% AMCK FY2013 $1,668,515 $3,963,893 $4,811,779 $10,444,187 16% AMCK FY2014 $2,416,087 $5,928,512 $7,104,816 $15,449,415 16% AMCK FY2015 $2,964,847 $6,543,776 $6,053,313 $15,561,936 19%
TOTAL REMUNERATION OPPORTUNITY, BHP’S CEO, FY2011-FY2015
The second table below presents total actual remuneration over the same five financial years.
ASX:BHP YEAR FIXED REM CASH STI DEFERRED STI FROM PRIOR YEAR
LTI VESTING VALUED AT DATE OF VESTING
TAR FIXED REM AS % OF TAR
MK FY2011 $3,091,840 $2,386,485 $3,684,360 $6,867,615 $16,030,299 19% MK FY2012 $3,093,426 $- $1,812,778 $12,508,489 $17,414,693 18% AMCK FY2013 $1,668,515 $876,165 $1,006,354 $2,568,071 $6,119,105 27% AMCK FY2014 $2,416,087 $1,708,806 $800,761 $2,871,623 $7,797,277 31% AMCK FY2015 $2,964,847 $1,390,552 $437,283 $- $4,792,682 62%
TOTAL ACTUAL REMUNERATION, BHP’S CEO, FY2011-FY2015
NATIONAL AUSTRALIA BANK (ASX:NAB) National Australia Bank has had two CEOs over this period: Cameron Clyne to August 2014 (ie FY2011, FY2012, FY2013 and most of FY2014); Andrew Thornburn from August 2014 (ie small part of FY2014 and FY2015).
FIXED REMUNERATION Fixed remuneration in the form of cash salaries, non-cash benefits and superannuation.
Short term incentives NAB’s STI scheme is a cash and deferred performance rights scheme (50:50, with the deferred component released over two years). The first step is the formation of an STI pool based on three key measures: Cash earnings (40%), Case ROE (30%) and Return on Allocated Total Equity (ROTAE) (30%).11 Note this scorecard simplifies the prior scorecard (discussed in this 2014 AGM preview note). Actual awards to individual executives are based on their personal performance rating, with no details in the FY2015 report of how the multipliers work.
SIZE OF ANNUAL GRANTS Maximum opportunities were reduced as a result of the review during FY2014, with maximum STI being 175% of target, and target set at 100% fixed remuneration for the MD/CEO.
DEFERRED COMPONENT The deferred STI component is delivered in the form of performance rights vesting in two equal tranches after 12 and 24 months from date of issue or 14 and 26 months after end of FY2015. While the 2015 AGM Notice of Meeting indicates a VWAP method is used to price the performance rights, disclosure of the issues to the MD/CEO following the FY2014 AGM suggest a fair valuation method was used.
Long term incentives NAB’s LTI scheme is a performance rights based scheme with annual grants of performance rights vesting after four years based on relative TSR performance against two separately assessed groups (a) S&P/ASX 50 and (b) a financial services comparator group drawn from the S&P/ASX 200. For both groups, median performance (50th percentile) results in 50% vesting, with full vesting for upper quartile performance (75th percentile or higher). Vesting is on a straight-line basis in between. An overriding condition is for absolute TSR for the period to be positive.
SIZE OF ANNUAL GRANTS NAB uses fair valuation methodologies to price the performance rights so the disclosed policy position on value is lower than the face value of the award.
Share holdings NAB has a minimum shareholding requirement for its executive KMPs of 100% of fixed remuneration (200% for MD/CEO) and this must be achieved within five years of appointment to a KMP position.
11 ANNUAL FINANCIAL REPORT 2015, P. 39.
15
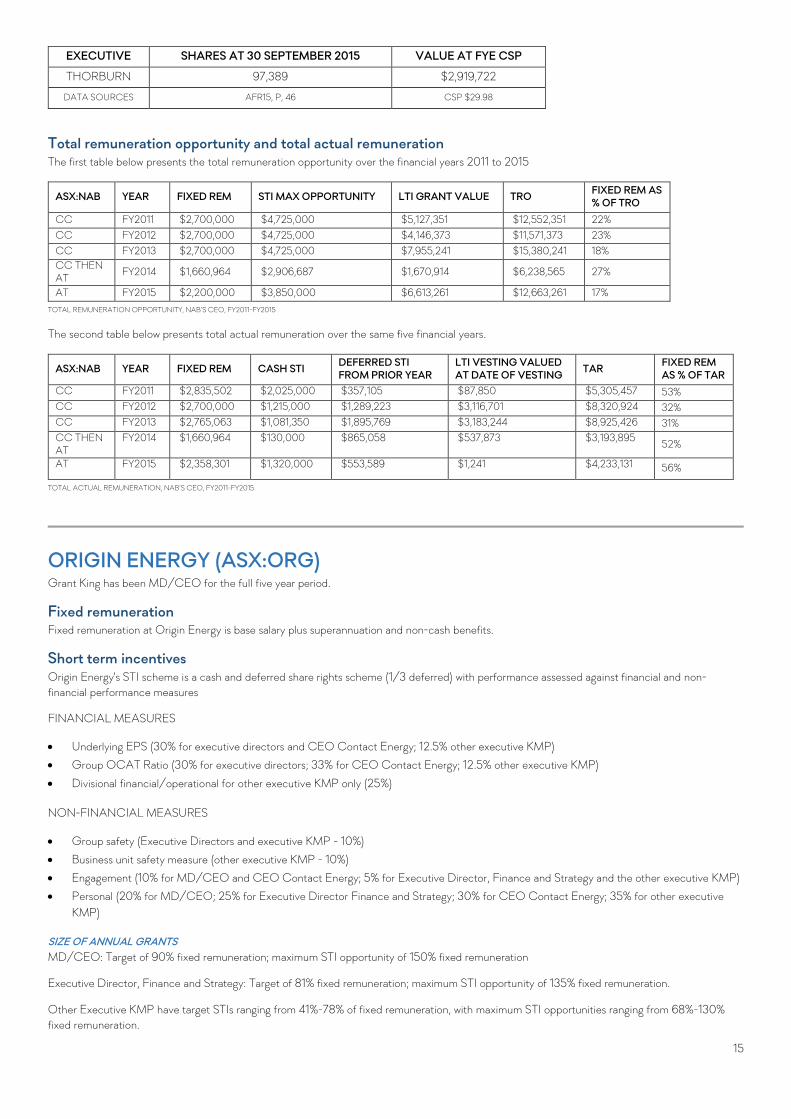
EXECUTIVE SHARES AT 30 SEPTEMBER 2015 VALUE AT FYE CSP
THORBURN 97,389 $2,919,722
DATA SOURCES AFR15, P, 46 CSP $29.98
Total remuneration opportunity and total actual remuneration The first table below presents the total remuneration opportunity over the financial years 2011 to 2015
ASX:NAB YEAR FIXED REM STI MAX OPPORTUNITY LTI GRANT VALUE TRO FIXED REM AS % OF TRO
CC FY2011 $2,700,000 $4,725,000 $5,127,351 $12,552,351 22% CC FY2012 $2,700,000 $4,725,000 $4,146,373 $11,571,373 23% CC FY2013 $2,700,000 $4,725,000 $7,955,241 $15,380,241 18% CC THEN AT FY2014 $1,660,964 $2,906,687 $1,670,914 $6,238,565 27%
AT FY2015 $2,200,000 $3,850,000 $6,613,261 $12,663,261 17% TOTAL REMUNERATION OPPORTUNITY, NAB’S CEO, FY2011-FY2015
The second table below presents total actual remuneration over the same five financial years.
ASX:NAB YEAR FIXED REM CASH STI DEFERRED STI FROM PRIOR YEAR
LTI VESTING VALUED AT DATE OF VESTING TAR FIXED REM
AS % OF TAR CC FY2011 $2,835,502 $2,025,000 $357,105 $87,850 $5,305,457 53% CC FY2012 $2,700,000 $1,215,000 $1,289,223 $3,116,701 $8,320,924 32% CC FY2013 $2,765,063 $1,081,350 $1,895,769 $3,183,244 $8,925,426 31% CC THEN AT
FY2014 $1,660,964 $130,000 $865,058 $537,873 $3,193,895 52%
AT FY2015 $2,358,301 $1,320,000 $553,589 $1,241 $4,233,131 56%
TOTAL ACTUAL REMUNERATION, NAB’S CEO, FY2011-FY2015
ORIGIN ENERGY (ASX:ORG) Grant King has been MD/CEO for the full five year period.
Fixed remuneration Fixed remuneration at Origin Energy is base salary plus superannuation and non-cash benefits.
Short term incentives Origin Energy's STI scheme is a cash and deferred share rights scheme (1/3 deferred) with performance assessed against financial and non-financial performance measures
FINANCIAL MEASURES
• Underlying EPS (30% for executive directors and CEO Contact Energy; 12.5% other executive KMP) • Group OCAT Ratio (30% for executive directors; 33% for CEO Contact Energy; 12.5% other executive KMP)
• Divisional financial/operational for other executive KMP only (25%)
NON-FINANCIAL MEASURES
• Group safety (Executive Directors and executive KMP - 10%) • Business unit safety measure (other executive KMP - 10%) • Engagement (10% for MD/CEO and CEO Contact Energy; 5% for Executive Director, Finance and Strategy and the other executive KMP) • Personal (20% for MD/CEO; 25% for Executive Director Finance and Strategy; 30% for CEO Contact Energy; 35% for other executive
KMP)
SIZE OF ANNUAL GRANTS MD/CEO: Target of 90% fixed remuneration; maximum STI opportunity of 150% fixed remuneration
Executive Director, Finance and Strategy: Target of 81% fixed remuneration; maximum STI opportunity of 135% fixed remuneration.
Other Executive KMP have target STIs ranging from 41%-78% of fixed remuneration, with maximum STI opportunities ranging from 68%-130% fixed remuneration.

16
DEFERRED COMPONENT One-third of any STI award is deferred into Deferred Share Rights or DSRs which vest in three equal tranches after 1, 2 and 3 years. The cash value of the award is converted into a number of DSRs using a discounted face value method which uses a current share price but then discounts that price for the dividends foregone over the period of vesting. The grant is divided into three equal tranches so this method would produce a different price for each tranche and this is evident from the ‘fair value’ disclosures on page 97 of the 2015 Financial Report.
Malus and clawback provisions apply to the deferred STI award but can also extend to return of share or repayment of realised cash value on shares for vested awards. FY2015 was the first year DSRs were granted
Long term incentives Origin Energy's LTI scheme makes annual grants of options and performance share rights (in the ratio of 75:25) with vesting after 4 years based on relative TSR performance against the S&P/ASX 100 comparator group (no exclusions) with 50% vesting for median performance ('above the 50th percentile') and 100% vesting for upper quartile performance (75th percentile or higher). Vesting occurs on a straight line basis in between these points.
SIZE OF ANNUAL GRANTS MD/CEO: 120% fixed remuneration as a 'target allocation'. The target allocation or Target Value is based on the fair values calculated for the options using a Black Scholes and Monte Carlo Simulation and performance rights using a Monte Carlo simulation. The actual value at grant date is notably higher. Malus and clawback apply to unvested LTI awards but can also extend to return of share or repayment of realised cash value on shares for vested awards.
Share holdings Origin Energy does not currently have a minimum shareholding policy for its executive KMP. As a result the value of the shareholdings varies considerably amongst the KMP and does not bear any resemblance to fixed remuneration noted above.
SHAREHOLDINGS AT FYE 2015 VALUE AT CSP OF $11.97
GRANT KING 1,099,059 $13,155,736 DATA SOURCES FR15, P. 101 CALCULATION
Total remuneration opportunity and total actual remuneration The first table below presents the total remuneration opportunity over the financial years 2011 to 2015
ASX:ORG YEAR FIXED REM STI MAX OPPORTUNITY LTI GRANT VALUE12 TRO FIXED REM AS
% OF TRO GK FY2011 $2,334,857 $2,801,828 $4,604,040 $9,740,725 24% GK FY2012 $2,500,000 $3,000,000 $5,207,430 $10,707,430 23% GK FY2013 $2,500,000 $3,000,000 $8,152,166 $13,652,166 18% GK FY2014 $2,500,000 $3,750,000 $2,935,741 $9,185,741 27% GK FY2015 $2,500,000 $3,750,000 $4,233,902 $10,483,902 24%
TOTAL REMUNERATION OPPORTUNITY, ORG’S CEO, FY2011-FY2015
The second table below presents total actual remuneration over the same five financial years.
ASX:ORG YEAR FIXED REM CASH STI
DEFERRAL INTRODUCED FOR FY14 - FIRST VESTS IN OCT 2015 (FY16)
LTI VESTING VALUED AT DATE OF VESTING
TAR FIXED REM AS % OF TAR
GK FY2011 $2,334,857 $2,100,000 $- $3,538,000 $7,972,857 29% GK FY2012 $2,500,000 $2,350,000 $- $1,707,803 $6,557,803 38% GK FY2013 $2,500,000 $600,000 $- $- $3,100,000 81% GK FY2014 $2,500,000 $1,400,000 $- $- $3,900,000 64%
GK FY2015 $2,500,000 $1,333,333 $- $- $3,833,333 65%
TOTAL ACTUAL REMUNERATION, ORG’S CEO, FY2011-FY2015
12 ORG LTI grant value: FY2011-FY2013 - LTI grants are 50:50 options and PSRs. Thus calculating PSR value and multiplying by two gives total LTI grant value. FY2014-FY2015: LTI grants are 75:25 options and PSRs. Thus calculating PSR value and multiplying by four gives total LTI grant value

17
QBE INSURANCE (ASX:QBE) There were two CEOs over this period: Frank O’Halloran to August 2012 (ie FY2011 and part of FY2012) and John Neal from August 2012 (ie part of FY2012, FY2013 – FY2015).
Fixed remuneration13 Fixed remuneration at QBE Insurance consists of cash salary, superannuation/pension and packaged benefits, additional annual benefits (such as health insurance, life assurance, personal accident insurance, car allowances, expatriate benefits plus applicable taxes) are benchmarked against two peer groups:
• Australian executive roles: ASX 30 plus global companies (more than 25% of revenue from overseas and operating in more than two geographic locations), and companies in the financial services industry
• Overseas-based executives or roles with a global reach: global insurance companies in the Dow Jones Insurance Titans Index excluding life and health insurance, reinsurance and insurance brokers. RSA and Hartford are included in this peer group.
Short term incentives14 A cash plus deferred equity scheme, with Group performance captured by Group ROE (Weighted 80% for the Group CEO, Group CFO and Group Head office executives; 50% for the Group Chief Strategy Officer and the Group Chief Risk Officer – to be reweighted to 80% for FY16; and 30% for the divisional CEOS. AR 15, p. 70.) and/or Divisional ROAC as appropriate, with the remaining portion based on an individual performance scorecard.
Group ROE performance is measured by Group Statutory ROE. QBE Insurance presents two ‘takes’ on its statutory results this year. For STI purposes, Group ROE targets were set at 6% (threshold), and two adjustments were made to the these targets: one decreasing the ROE outcome by 0.2 percentage points (Reversal of 50% to reflect actual discount rate movement against budget assumptions) and the other increasing the ROE outcome by 1.6 percentage points. While budgeted acquisitions or disposals are included in the STI ROE target, the non-budgeted disposals of the Argentine workers’ compensation business and the US lender placed insurer were not included. The August 2015 results announcement indicated these two businesses were not included in the Group targets for the underwriting result and the insurance margin. Thus the adjustment is consistent with that approach.
Individual performance balanced scorecard with its six value creation components for the Group CEO is set out below
• STRATEGIC MANAGEMENT (on target) • PROFITABLE GROWTH AND DIVERSIFICATION (below target) • LEADERSHIP IN OUR CORE BUSINESS (on target) • OPERATIONAL EXCELLENCE - GLOBAL REACH AND SCALE (on target) • FINANCIAL STRENGTH AND FLEXIBILITY (above target) • WORLD CLASS TALENT AND LEADERSHIP (above target)
SIZE OF STI OPPORTUNITY Maximum STI opportunity is expressed as a percentage of fixed remuneration
• Group CEO: 200% • Group CFO: 180% • Group head office executives: 150% • Group Chief strategy officer: 150% • Divisional CEOs: 150%
• CEO, North American Operations: 150%
DEFERRED COMPONENT The deferred component of the STI scheme (50% for the CEO, 33% for the other executive KMP) is delivered in the form of conditional rights to shares. The rights vest in two equal tranches on the 1st and 2 anniversaries of the award. Vesting is subject to continuous service requirements. Notional dividends accrue over the vesting period. STI deferral is subject to malus provisions.
As noted above, the Group CEO and CFO agreed to defer a higher portion of their 2015 STI awards into conditional rights. This extra component will be subject to a minimum share price hurdle of AUD$13.00 for a consecutive three-month period during the three year vesting period. The continuous service requirement also applies. HOWEVER THIS MEANS THE STI AWARDS FOR FY2015 WERE HIGHER THAN IN FY2014 AS NEALS’ CASH STI IS ONLY 20% OF HIS AWARD (FY14’S CASH STI IS 50%), WHILE REGANS’ CASH STI (REMEMBERING HE STARTED MID-WAY THROUGH 2014) IS 34% OF HIS TOTAL AWARD (FY14’S CASH STI IS 67%).
Note there is a lag between the STI year of performance and the deferred grant: the 2015 grants shown below are for 2014 STI awards.
13 ANNUAL REPORT 2015, PP. 61, 62, 69 AND STATUTORY TABLE ON P. 76. 14 ANNUAL REPORT 2015, PP. 61, 62-63, 68, 69-71, 72, 85.

18
Long term incentives15 Annual grants of conditional rights to QBE Insurance shares are made, with the number of rights based on performance after three years as assessed on two equally weighted performance measures
(1) average Group statutory ROE over three years, with 20% vesting for average ROE of 7.7%' and full vesting for average ROE of at least 11.6%, with vesting on a straight line basis in between these points
(2) Relative TSR against a bespoke comparator group (disclosed on page 71) of 15 including QBE, with 50% vesting for 50th percentile ranking and 100% vesting for upper quartile performance (75th percentile or higher), with vesting on a straight-line basis in between.
Following assessment of performance, vesting occurs over three years - end of three year performance period (33%); first anniversary of performance period (33%) and second anniversary of performance period (34%). Notional dividends accrue during vesting period. LTI is subject to malus adjustment
SIZE OF LTI GRANT Maximum LTI opportunities are set out on page68 as a percentage of fixed remuneration:
• Group CEO: 120% • Group CFO: 150% • Group head office executives: 75% • Group Chief Strategy Officer: 125% • Divisional CEOs: 100% • CEO, North American Operations: 150%
Award value divided by VWAP over 5 trading days prior to grant date.
Share holdings16 QBE Insurance introduced a minimum shareholding policy to apply from 31 March 2008 of at least 1 year's fixed remuneration by 31 March each year (for Group CEO this was increased to 1.5 times fixed remuneration during 2013). For these purposes, shareholding includes all issued shares and unvested conditional rights without a performance condition (using the greater of 'cost at grant' price and the closing share price at 1 April 2015).
Current shareholdings for executive KMP as at 31 December 2015 (no conditional rights included in the totals) are set out in the table below with the shareholding valued at the FYE CSP of AUD$12.59. Based on this view of shareholdings (actual shares held, not including rights to shares) only John Neal the Group CEO meets the minimum shareholding requirement.
EXECUTIVE HOLDINGS AT 31 DECEMBER 2015 VALUE AT FYE CSP OF AUD$12.59
JOHN NEAL 234,998 $2,958,625
DATA SOURCES AR15, P. 87 CSP AR15, P. 55.
Total remuneration opportunity and total actual remuneration The first table below presents the total remuneration opportunity over the financial years 2011 to 2015
ASX:QBE YEAR FIXED REM STI MAX OPPORTUNITY LTI GRANT VALUE TRO FIXED REM AS % OF TRO
FO'H FY2011 $2,268,195 $5,330,258 $2,008,205 $9,606,658 24% FO'H THEN JN FY2012 $1,622,880 $3,245,760 $718,169 $5,586,809 29% JN FY2013 $2,088,548 $4,177,095 $797,725 $7,063,368 30% JN FY2014 $2,089,565 $4,179,130 $3,150,004 $9,418,699 22% JN FY2015 $1,961,930 $3,923,860 $4,567,222 $10,453,012 19%
TOTAL REMUNERATION OPPORTUNITY, QBE’S CEO, FY2011-FY2015
15 ANNUAL REPORT 2015, PP. 61, 62-63, 68, 71-72, 85. 16 ANNUAL REPORT 2015, PP. 72, 87.

19
The second table below presents total actual remuneration over the same five financial years.
ASX:QBE YEAR FIXED REM CASH STI DEFERRED STI LTI VESTING VALUED AT DATE OF VESTING TAR FIXED REM
AS % OF TAR FO'H FY2011 $2,268,195 $- $2,741,018 $786,317 $5,795,530 39% FO'H THEN JN
FY2012 $1,622,880 $- $1,043,280 $- $2,666,160 61%
JN FY2013 $2,088,548 $- $399,053 $- $2,487,600 84% JN FY2014 $2,089,565 $650,284 $349,556 $- $3,089,405 68% JN FY2015 $1,961,930 $439,428 $344,884 $- $2,746,242 71%
TOTAL ACTUAL REMUNERATION, QBE’S CEO, FY2011-FY2015
WOODSIDE PETROLEUM (ASX:WPL) Woodside Petroleum had two CEOs over this period: Dan Voelte to May 2011 (ie part of FY2011); Peter Coleman from 30 May 2011 (ie part of FY2011, FY2012-FY2015)
Fixed remuneration Fixed remuneration (cash salary, benefits and allowances, and company contributions to super, taken from the statutory tables).
Short term incentives17 Woodside Petroleum operates a bonus pool scheme for its short term award (STA): company performance dictates the size of the bonus pool, while individual performance dictates the size of the individual’s bonus for the year. Two-thirds of any bonus awarded is paid in cash, with one third paid by way of restricted shares (restricted for three years, with dividends paid on the shares while restricted).
Company performance is measured by a scorecard of measures with four equally weighted measures for FY2015:
1. Safety and environmental factors (improved on FY2014 performance with TRIR of 1.71; two x Tier 2 process safety events, no TIer 1 events) 2. Production (92.2 mmobe, second highest result - record production in FY2014) 3. Delivery against business plan commitments (production, asset utilisation opex, flaring, portfolio balance, cost reduction and efficiency
improvement programs all ahead of target, and achieved with 10% fewer employees). 4. Relative TSR as an indicator of overall company performance: Woodside’s one year return to shareholders ranked against a bespoke
international peer group of 17 oil and gas peers companies excluding WPL (list disclosed on page 63) and the ASX 50 (WPL ranked 8 out of 17 and 40th position against the ASX 50)
In determining the individual’s performance, the performance of other executives is relevant: hence the individual performance is relative and the pay scheme is competitive. For this component, the KPIs include some of the same factors used in the group, but most likely tailored to reflect divisional responsibilities:
• Health and safety (TRCF, high potential incident frequency) • Environment (for example, greenhouse gas emissions, flared gas)
• Human resources (for example, talent management, capability development and diversity) • Financial (for example, revenue, operating costs, EBIT, ROACE, production costs, drilling costs) • Operational (for example, production volumes, project progress).
The CEO’s individual performance targets for FY15 are the same general categories as used in FY2014:
• Setting and pursuing the growth agenda • Achieving effective execution • Building enterprise and organisational capacity
• Enhancing culture and reputation • Ensuring shareholder focus.
DEFERRED COMPONENT One-third of the STI award is converted into restricted shares using a Pricing Day VWAP (pricing day was 31 December 2014), with shares restricted for three years and subject to continuous employment for vesting. Accelerated vesting may apply in the case of a change of control, on termination of employment due to death, TPD and 'may generally' vest for termination due to redundancy or retirement. Woodside Petroleum does not appear to have a clawback policy.
17 ANNUAL REPORT 2015, PP. 57-59.

20
Long term incentives18 Woodside Petroleum's Long Term Award (LTA) is a variable pay rights scheme (a pay right is a right to obtain, for nil cost, one ordinary share in the company). Performance is initially measured over a four year period, with one retest after 5 years. Any unvested awards lapse after this latter test. When a company makes annual grants, the rationale for retesting is uncompelling.
The performance measure is relative TSR measured against two separate comparator groups
1. The ASX 50 (33 per cent) 2. A bespoke comparator group of 17 international oil and gas companies excluding WPL (67 per cent)
For both measures, 50% vests for median performance (50th percentile), with full vesting for upper quartile performance (75th percentile or higher)
LTA OPPORTUNITY The number of rights initially granted is based on a fair valuation methodology using a binomial or Black Scholes option pricing technique. For FY2015 this meant pricing each VPR at US$17.39 rather than the share price on the date of grant of US$31.15, resulting in 38% more VPRs being granted than if a simple share price was used.
Share holdings Woodside Petroleum does not have a formal shareholding policy for its executive KMP, although all of the executive KMP have sizeable holdings as noted in the table below.
EXECUTIVE 2015 VALUE AT FYE CSP (AUD)
Peter Coleman 209,153 $6,006,874 DATA SOURCES AR15, P. 69 CSP AUD $28.72
Total remuneration opportunity and total actual remuneration The first table below presents the total remuneration opportunity over the financial years 2011 to 2015
ASX:WPL YEAR FIXED REM STI MAX OPPORTUNITY19 LTI GRANT VALUE TRO FIXED REM AS % OF TRO
DV THEN PC FY2011 $1,378,379 $2,817,295 $1,709,120 $5,904,795 23% PC FY2012 $2,276,359 $5,404,434 $1,585,167 $9,265,960 25% PC FY2013 $2,527,802 $5,634,631 $5,104,530 $13,266,963 19% PC FY2014 $2,591,772 $5,423,530 $6,104,966 $14,120,268 18% PC FY2015 $2,657,669 $4,865,437 $5,976,528 $13,499,634 20%
TOTAL REMUNERATION OPPORTUNITY, WPL’S CEO, FY2011-FY2015
The second table below presents total actual remuneration over the same five financial years.
ASX:WPL YEAR FIXED REM CASH STI DEFERRED STI
LTI VESTING VALUED AT DATE OF VESTING
TAR FIXED REM AS % OF TAR
DV THEN PC FY2011 $1,378,379 $947,569 $- $2,325,948 59% PC FY2012 $2,276,359 $2,299,317 $- $- $4,575,676 50% PC FY2013 $2,527,802 $1,510,081 $- $- $4,037,883 63% PC FY2014 $2,591,772 $3,270,389 $- $- $5,862,161 44% PC FY2015 $2,657,669 $2,673,071 $520,347 $1,940,916 $7,792,003 34%
TOTAL ACTUAL REMUNERATION, WPL’S CEO, FY2011-FY2015
18 ANNUAL REPORT 2015, PP. 58-60, 64, 66. 19 WPL: STI scheme is profit pool and there is no maximum STI award opportunity disclosed. To work out what STI maximum is, I take the cash STI award (67% of total STI), gross up to the total STI award and then divide this by the disclosed level of vesting for the group scorecard (FY2011-FY2014) and the individual level of vesting for FY2015 (FY2015's STI award to PC was 82% of maximum).

21
CERTIFICATION: The views expressed in this research accurately reflect the personal views of the analyst(s) about the subject resolutions and issuers. No part of the remuneration of the analyst(s) was, is, or will be directly or indirectly related to the inclusion of specific recommendations or views in this research. The analyst responsible receives remuneration from THE EXECUTIVE REMUNERATION REPORTER. Its principal income derives from the sale of subscriptions to its proxy advisory services. THE EXECUTIVE REMUNERATION REPORTER does not charge issuers any fees to be included within our subscription coverage. THE EXECUTIVE REMUNERATION REPORTER does not accept research commissions from issuers nor does it sell reports to issuers.
GENERAL DISCLAIMERS: The proxy voting guidance and advice issued by THE EXECUTIVE REMUNERATION REPORTER is pursuant to regulation 7.1.30 of the Corporations Regulations 2001 (Cth) in that it is advice on the manner in which voting rights attached to securities or voting rights attached to interests in managed investment schemes may or should be exercised. As such it does not constitute financial advice and should not be construed as such. The material in this report provides general information only. It is not intended as financial advice and must not be relied upon as such.
As per the Terms and Conditions on THE EXECUTIVE REMUNERATION REPORTER website, this report has been prepared by THE EXECUTIVE REMUNERATION REPORTER, ABN 16 603 504 043, for LIVEWIRE MARKETS on request and for no charge. It must not be copied in whole or in part, or distributed to any other person without the express written permission of THE EXECUTIVE REMUNERATION REPORTER.
In preparing this report THE EXECUTIVE REMUNERATION REPORTER has drawn upon information provided to the public by the companies included in the remuneration benchmarking or commentary. We have not independently verified this information. We do not assume any responsibility for updating any information contained in this report. We also do not assume any responsibility for altering any recommendation made in this report, to correct any errors or omissions in the report which may become apparent after the report has been issued.
THE EXECUTIVE REMUNERATION REPORTER does not provide any warranty as to the accuracy, reliability or completeness of any information contained in this report.
Except to the extent that liability under any statute cannot be excluded, THE EXECUTIVE REMUNERATION REPORTER does not accept any liability for any error or omission in this report or for any resulting loss or damage whether that loss is direct, indirect, consequential or otherwise, suffered by the recipient of this document or any other person.
THE EXECUTIVE REMUNERATION REPORTER
ABN: 16 603 504 043 LEVEL 1 1 PACIFIC HIGHWAY NORTH SYDNEY, NSW, 2060 EMAIL: [email protected] WEBSITE: https://subscriber.theexecutiveremunerationreporter.com.au