the executive's guide to the 2016 global threat intelligence report
TRANSCRIPT

Insights to protect your organisation against cybercrime in the digital era
The Executive’s Guide to the 2016 Global Threat Intelligence Report

2
Contents
14Page
20Page
24Page
26Page
02PageIntroduction
04Page2015
attack analysis
End-point security remains a key weakness
Incident response – many still on the back foot
Cybercriminals continue to up their game
About NTT Group Security

3
The Executive’s Guide to the 2016 Global Threat Intelligence Report provides insights on the latest security threats and offers recommendations for protecting organisations from cybersecurity incidents as they accelerate to become digital businesses.
This year’s analysis is based on validated log, attack, incident,
and vulnerability data gathered from across Dimension Data
and NTT’s Managed Security Services platforms, as well as
from NTT’s research sources, including its global honeypots
and sandboxes which are located in over 100 countries.
The Report aggregates threat data from:
• over 3.5 trillion logs
• 6.2 billion attacks
• 8,000 clients worldwide
In addition, the inclusion of data from the 24 Security
Operations Centres and 7 research and development centres
of the NTT Group security companies enables us to provide a
highly accurate representation of the global threat landscape.
Introduction
4
In this section, we analyse global attack data gathered by NTT Group security companies during 2015.
2015 attack analysis
5
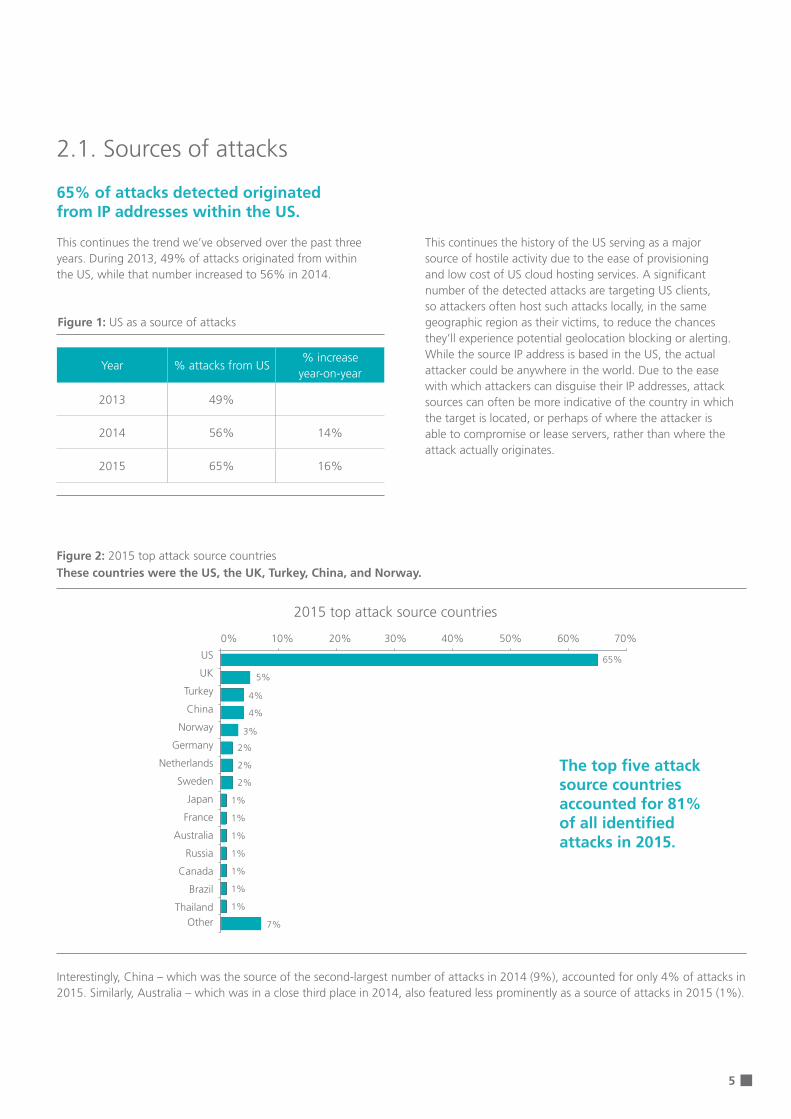
This continues the trend we’ve observed over the past three years. During 2013, 49% of attacks originated from within the US, while that number increased to 56% in 2014.
2.1. Sources of attacks
65% of attacks detected originated from IP addresses within the US.
Year % attacks from US% increase
year-on-year
2013 49%
2014 56% 14%
2015 65% 16%
Figure 1: US as a source of attacks
Figure 2: 2015 top attack source countries
Interestingly, China – which was the source of the second-largest number of attacks in 2014 (9%), accounted for only 4% of attacks in 2015. Similarly, Australia – which was in a close third place in 2014, also featured less prominently as a source of attacks in 2015 (1%).
This continues the history of the US serving as a major source of hostile activity due to the ease of provisioning and low cost of US cloud hosting services. A significant number of the detected attacks are targeting US clients, so attackers often host such attacks locally, in the same geographic region as their victims, to reduce the chances they’ll experience potential geolocation blocking or alerting. While the source IP address is based in the US, the actual attacker could be anywhere in the world. Due to the ease with which attackers can disguise their IP addresses, attack sources can often be more indicative of the country in which the target is located, or perhaps of where the attacker is able to compromise or lease servers, rather than where the attack actually originates.
2015 top attack source countries
0% 10% 20% 30% 40% 50% 60% 70%
US
UK of Great Britain
Turkey
China
Norway
Germany
Netherlands
Sweden
Japan
France
Australia
Russian Federation
Canada
Brazil
Thailand
Other
US
UK
Turkey
China
Norway
Germany
Netherlands
Sweden
Japan
France
Australia
Russia
Canada
Brazil
ThailandOther
0% 10% 20% 50%30% 60%40% 70%
65%
5%
4%
4%
3%
2%
2%
2%
1%
1%
1%
1%
1%
1%
1%
7%
The top five attack source countries accounted for 81% of all identified attacks in 2015.
These countries were the US, the UK, Turkey, China, and Norway.

6
In 2015, attacks from addresses based in the UK rose slightly from 3% to 5% – making this country the primary source of non US-based attacks.
Turkey emerged as a primary source of attacks; this was based on a wide variety of attacks and malware delivered to clients throughout the US and Europe, spread across the year. Activity from Turkey included several campaigns directed against government agencies in Europe.
The UK became the number one source of non-US based attacks.
Other observations:
• We detected attacks from a total of 217 different countries during 2015.
• 38% of the attacks that originated outside the US showed IP addresses from the top three source countries.
• Beyond the top 10 source countries, the distribution of source IP addresses was flat.
Figure 3: 2015 non-US attack source countries
2015 non-US attack source countries
UK
Turkey
China
Norway
Germany
Netherlands
Sweden
Japan
France
Australia
Russia
Canada
Brazil
Thailand
Malaysia
India
Republic of Korea
Ukraine
Italy
Other
0% 2% 4% 10%6% 12%8% 14% 16%0% 2% 4% 6% 8% 10% 12% 14% 16%
United Kingdom of Great Britain and Northern Ireland
Turkey
China
Norway
Germany
Netherlands
Sweden
Japan
France
Australia
Russian Federation
Canada
Brazil
Thailand
Malaysia
India
Republic of Korea
Ukraine
Italy
Other

7
Figure 4: 2015 attacks by sector
2.2. Attacks by sector
The retail sector showed the highest number of attacks, at just under 11% … knocking the finance sector out of first place.
Clients in the retail sector experienced nearly three times as many attacks as those in the finance sector – which was the target of just 4% of all attacks in 2015, compared to 18% in 2014.
2015 attacks by sector
Reta
il
Hos
pita
lity,
leis
ure,
and
ent
erta
inm
ent
Insu
ranc
e
Gov
ernm
ent
Man
ufac
turin
g
Tele
com
mun
icat
ions
Hea
lthca
re
Phar
mac
eutic
als
Publ
ic
Busi
ness
and
pro
fess
iona
l
Tech
nolo
gy
Tran
spor
t an
d di
strib
utio
n
Non
-pro
fit
Fina
nce
Med
ia
Gam
ing
Lega
l
Educ
atio
n
12%
10%
8%
6%
4%
2%
0%0%
2%
4%
6%
8%
10%
12%
Retail
Hospit
ality,
leisu
re
Insura
nce
Govern
ment
Manufa
cturin
g
Telec
ommun
icatio
ns
Health
care
Pharm
aceu
ticals
Public
Busine
ss an
d Prof
essio
nal
Tech
nolog
y
Transp
ort an
d dist
ributi
on
Non-P
rofit
Financ
e
Media
Gaming
Le
gal
Educa
tion
11%
10% 9%
8%
7%
7%
6%
6%
5%
5%
3%
2%
2%
2%
4% 4%
4% 4%
The fact that cybercriminals are turning their attention away from the finance sector – possibly in search of easier or more lucrative targets – is an interesting development. Retail companies are becoming increasingly popular targets as they often process large volumes of personal information, including credit card data, in highly distributed environments with many endpoints and point of service devices. Such diverse environments can be difficult to protect.

8
Attacks related to the hospitality, leisure, and entertainment sector increased in 2015.
The hospitality, leisure, and entertainment sector faces many of the same challenges as the retail sector, as they also process high volumes of sensitive information including credit card data. Transactions in the hospitality sector, which includes hotels and resorts, tend to be sizable, which can make compromise of those card numbers more attractive to attackers. The hospitality sector also participates in a significant number of loyalty plans which include even more personal information.
This sector fell victim to several high profile breaches during 2015, including properties from Starwood Hotels & Resorts, the Trump Hotel Collection, Hilton Worldwide, Mandarin Oriental, and White Lodging Services Corporation. Not all of these were attacked directly; many of the breaches involved point-of-sale malware directed against providers and retail companies which offered service on hospitality properties. The end result targets the same clients, without directly targeting the property’s information security programme.
2.3. Types of attack
Anomalous activity represented the most common type of attack and jumped from 20% of all attacks in 2014 to 36% during 2015.
Figure 5: 2015 attacks by type
Other
Evasion attempts
Client botnet activity
Service specific attack
DoS/DDoS
Network manipulation
Malware
Known bad source
Brute forcing
Application specific attack
Reconnaissance
Web application attack
Anomalous activity
0% 5% 15%10% 30%20% 35%25% 40%0% 5% 10% 15% 20% 25% 30% 35% 40%
Anomalous activity Web application attack
Reconnaissance Application specific attack
Brute forcing Known bad source
Malware Network manipulation
DoS/DDoS Service specific attack
Client botnet activity Evasion attempts
Other 2%
2%
3%
3%
3%
4%
5%
5%
7%
8%
9%
15%
36%
2015 attacks by type
What is?
Anomalous activity: includes privileged access attempts, exploitation software, and other unusual activity
Web application attacks represented the second highest volume of attacks, accounting for 15% of attacks, the same percentage as last year.
Other observations:
• The insurance and government sectors both ranked in the top five ‘most attacked’ sectors in 2015.
• The manufacturing sector continued to be the target of significant attacks, consistent with levels experienced in previous years.
• Overall, clients in the top five sectors experienced over 44% of attacks.

9
Malware jumped from less than 2% of attacks in 2014 to 5% during 2015.
The volume of denial of service (DoS) and distributed denial of service (DDoS) attacks dropped by 39%.
Brute force attacks jumped 135% from 2014 levels.
Malware detection rose gradually throughout 2015, including a 6% jump during the fourth quarter alone. This increase in malware was not due to a specific campaign, malware, or source but resulted from increases in most malware categories across the entire year.
Brute force attacks jumped from less than 2% in 2014 to almost 7% in 2015. Throughout the year, we detected SSH brute-force attacks across our entire client base, from 75 different source countries. Threat actors are always on the lookout for ‘low hanging fruit’, the weakest link in the chain. Weak passwords remain an easy target for hackers to break into systems. It’s far simpler than creating custom malware, or building exploits for new vulnerabilities.
It appears this drop was due to a combination of events. First, attackers simply conducted fewer DoS/DDoS attacks during 2015 than they had in previous years. Second, 2015 saw the improved adoption of more effective DoS/DDoS mitigation techniques and services. However, extortion based on victims paying to avoid or stop DDoS attacks became more prevalent.
We also experienced a reduction in the number of DoS/DDoS incident response engagements, as shown in the section titled Incident response – many still on the back foot.
2.4. Vulnerabilities analysis
We compiled vulnerability data for 2015 from clients in every industry sector and geographic location serviced. Vulnerability results included information from a wide range of scanning data, and from multiple vendor products, including Qualys, Nessus, Saint, McAfee, Rapid7, Foundstone, and Retina. The findings are based on analysis of any vulnerability with an assigned common vulnerability scoring system (CVSS) score of 4.0 or higher.
What is?
Denial of service (DoS) and distributed denial of service (DDoS): attacks which make a machine or network resource unavailable to intended users; a DDoS attack originates from many devices at once
What is?
Brute force attack: a trial-and-error method used to obtain information such as a user password or personal identification number (PIN)
10
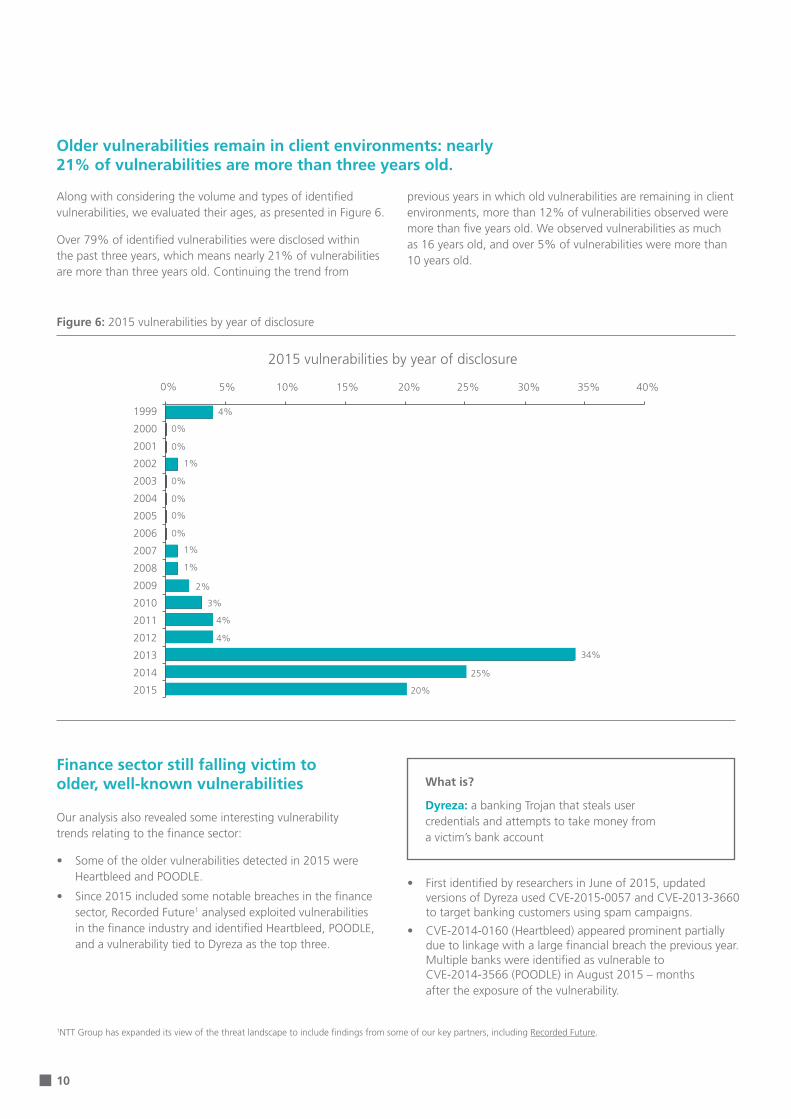
Figure 6: 2015 vulnerabilities by year of disclosure
Our analysis also revealed some interesting vulnerability trends relating to the finance sector:
• Some of the older vulnerabilities detected in 2015 were Heartbleed and POODLE.
• Since 2015 included some notable breaches in the finance sector, Recorded Future1 analysed exploited vulnerabilities in the finance industry and identified Heartbleed, POODLE, and a vulnerability tied to Dyreza as the top three.
Finance sector still falling victim to older, well-known vulnerabilities
• First identified by researchers in June of 2015, updated versions of Dyreza used CVE-2015-0057 and CVE-2013-3660 to target banking customers using spam campaigns.
• CVE-2014-0160 (Heartbleed) appeared prominent partially due to linkage with a large financial breach the previous year. Multiple banks were identified as vulnerable to CVE-2014-3566 (POODLE) in August 2015 – months after the exposure of the vulnerability.
Older vulnerabilities remain in client environments: nearly 21% of vulnerabilities are more than three years old.
Along with considering the volume and types of identified vulnerabilities, we evaluated their ages, as presented in Figure 6.
Over 79% of identified vulnerabilities were disclosed within the past three years, which means nearly 21% of vulnerabilities are more than three years old. Continuing the trend from
2015 vulnerabilities by year of disclosure
0% 5% 10% 15% 20% 25% 30% 35% 40%
1999
2000
2001
2002
2003
2004
2005
2006
2007
2008
2009
2010
2011
2012
2013
2014
2015
1999
2000
2001
2002
2003
2004
2005
2006
2007
2008
2009
2010
2011
2012
2013
2014
2015
0%
4%
4%
4%
34%
25%
20%
0%
0%
1%
1%
1%
2%
3%
0%
0%
0%
0%
5% 10% 25%15% 30%20% 35% 40%
1NTT Group has expanded its view of the threat landscape to include findings from some of our key partners, including Recorded Future.
What is?
Dyreza: a banking Trojan that steals user credentials and attempts to take money from a victim’s bank account
previous years in which old vulnerabilities are remaining in client environments, more than 12% of vulnerabilities observed were more than five years old. We observed vulnerabilities as much as 16 years old, and over 5% of vulnerabilities were more than 10 years old.

11
Figure 7: 2015 ‘popular’ vulnerabilities in the finance sector
2.5. Malware observations
We analysed malware samples from a wide range of sources, including:
• security platforms
• incident response investigations
• malware repositories and feeds
• interaction with clients
• privately maintained honeypot networks
The analyses enable us to develop proprietary detection and prevention signatures.
Source country % of malware
China 32%
Netherlands 18%
Germany 16%
Turkey 8%
Norway 4%
Figure 8: Top five non-US countries as sources of malware
2015 reference counts for the top three vulnerabilities targeting the finance sector
CVE-2014-0160 (Heartbleed)
CVE-2014-3566 (POODLE)
CVE-2015-0057 (via Dyreza)
Vuln
erab
ility
Reference counts
0 75 150 225 300
What is?
Malware: a general term for malicious software including viruses, worms, Trojans, and spyware
Key findings relating to malware:
• We detected malware from 191 different countries during 2015.
• The US was the source of over 62% of malware detected.
• Almost 79% of all non-US malware originated from the top five non-US sources.

12
2015 showed a decrease in total malware volume compared to 2014, largely due to changes within a single industry – education.
Malware detection for all other industries shows an 18% increase for the year.
The volume of malware detections within the education industry showed a 94% decrease from 2014 to 2015. This was after a drop from 2013 to 2014. This most recent drop does not necessarily represent a decrease in malware as much as it indicates a shift in the way the education industry managed their environments. During 2015, educational institution clients tended to reduce their focus on managing student and guest environments, and increased their focus on internal, institutional environments. Less focus on student and guest networks dramatically decreased the emphasis on the portions of their networks which have historically been the most vulnerable, so resulted in drastically fewer logs and events for the entire education sector.
The majority of this malware increase was a combination of sustained, elevated activity across several industries throughout the year:
• Rising from 8% of malware detected in 2014, the government sector climbed to the top of the list of sectors affected by malware, as seen in Figure 9.
• This was primarily due to a sustained increase in a large variety of malware targeting multiple government clients throughout the year, and included campaigns against several government agencies in Europe.
Figure 9: 2015 malware by sector
2015 malware by sector
0% 2% 4% 6% 8% 10% 12% 14% 16% 18% 20%
Non-Profit
Gaming
Transport and Distribution
Insurance
Education
Business and Professional Services
Technology
Telecommunications
Public
Pharmaceuticals
Healthcare
Retail
Finance
Hospitality, Leisure and Entertainment
Manufacturing
Government
0% 2% 4% 6% 8% 10% 12% 14% 16% 18% 20%
Government
Manufacturing
Hospitality, leisure and entertainment
Finance
Retail
Healthcare
Pharmaceuticals
Public
Telecommunications
Technology
Business and professional Services
Education
Insurance
Transport and distribution
Gaming
Non-profit
18%
16%
9%
9%
8%
7%
5%
5%
4%
4%
4%
3%
3%
2%
2%
1%
13
The volume of malware detected in the finance sector rose sharply.
The retail; government; hospitality, leisure and entertainment; and manufacturing industry sectors are most highly victimised across the board.
The total volume of malware detected in the finance sector increased dramatically, up by over 140% from 2014. Detections in the finance industry included both long-term sustained activity and targeted attack campaigns such as the Dyreza malware.
• Malware detected within the manufacturing sector, along with the hospitality, leisure and entertainment sector, both rose over 30% during 2015. These sectors ranked second and third, respectively, for malware per client.
• The retail sector also showed a modest increase over 2014 numbers. Retail clients experienced 8% of detected malware, making retail the fifth most affected industry.
These results show the retail; government; hospitality, leisure and entertainment; and manufacturing industry sectors appear in both the top five sectors targeted by malware and the top five sectors targeted by attacks, making them the most highly victimised of any sectors.
Malware is only one of many attack vectors used, and can be a key component of modern exploit kits.
We’ll explore our key findings relating to exploit kits in the next section, where we consider the importance of end-point security.
Malware is only one of many attack vectors used, and can be a key component of modern exploit kits.

14
End-point security remains a key weakness
End-users are the weakest link … and the target of most attacks; user education and training and disciplined patch management are critical to raising organisations’ defences.

15
Our analysis of 2015 data points to a lack of focus on bolstering end-point security and a lack of user awareness within most organisations … the continuation of a trend that we’ve observed over the last several years.
This is even more concerning when you consider that attackers are increasingly targeting end users.
In 2015, spear phishing attacks accounted for approximately 17% of incident response activities supported in 2015, up from 2% the previous year. These types of attacks are typically targeted at individual users within organisations. The objective is to acquire information such as user names, passwords, and credit card details (and indirectly, money) by masquerading as a trustworthy entity in an electronic communication such as email. In 2015, many of the attacks were related to financial fraud and targeted executives and finance department personnel in retail clients. Attackers often gained detailed knowledge of the organisational structure and performed well-crafted social engineering and spear phishing attacks.
We’ve also noted an increase in attacks related to internal threats, often involving employees and contractors. In 2015, internal threats jumped to 19% of overall investigations compared to the previous year’s 2%.
Vulnerability exposure and remediation time remain an organisational challenge. Organisations are slow to patch and inadequately safeguard their assets. As businesses increasingly adopt and transform their operations using a digital strategy, this challenge is set to remain and become even more complex. While new attacks are constantly emerging, exploitation of old vulnerabilities and misconfigurations afford attackers the most success. This is directly attributable to the reality that attackers exploiting out-of-date software and misconfigurations continues to outpace organisations’ ability to repair or replace the same.
Client-side vulnerabilities still remain high and expose organisations to inherent risk. Again, it seems that the message that effective patch management involves remediating both internal and external vulnerabilities, isn’t getting through. The vulnerabilities that we’ve detected in Adobe Flash and Internet Explorer represent a case in point. Securing the endpoint against next-generation threats is an essential element in a security programme aimed at reducing and mitigating risk.
The evolving nature of exploit kits also supports the notion that cybercriminals are keeping end users firmly in their sights.
All this points to the growing need for organisations to put end-user and end-point security firmly on their agenda.
In the rest of this section, we review the technologies targeted by exploit kits in 2015, and provide some recommendations on how organisations can improve their end-point security and raise their defences against end-user related attacks.
What is?
Spear phishing: attempting to acquire individuals’ information such as user names, passwords, and credit card details (and indirectly, money) by masquerading as a trustworthy entity in an electronic communication such as email
Exploit kit: a malicious toolkit often used in cybercrime to exploit vulnerabilities in software applications
Patch management: a systematic process for installing vendor-supplied software patches

16
Technologies targeted by exploit kits in 2015:
We’ve tracked unique exploits targeted by popular exploit kits released in the years 2012-2015. This information, organised by the technology targeted, is presented in Figure 10.2 There are three clear trends in this data:
• Adobe Flash was the most dominant software targeted in exploit kits in 2015.
• New Java exploits virtually disappeared from exploit kits during 2015.
• Internet Explorer exploitation remained consistent.
0%
10%
20%
30%
40%
50%
60%
70%
Java Adobe Acrobat
Internet Explorer
Adobe Flash
Firefox MicrosoftWindows
Silverlight
2012
2013
2014
2015
Other
Figure 10: Technology targeted in exploit kits
Unique vulnerabilities targeted in exploit kits by technology 2012-2015
Exploits are increasingly targeting end-user technologies.
Exploits can allow attackers to install malicious software on vulnerable devices. Software exploits take advantage of unpatched flaws in operating systems and applications. Exploit kits are software packages commonly sold in hacking forums and IRC channels, and capitalise on software exploits for known vulnerabilities across a range of end-user technologies (Internet Explorer, Adobe Flash, etc.). Exploit kits are most often delivered via social engineering and phishing attacks. As a result, they enable attackers to execute large-scale attacks against vulnerable systems and individuals without needing a great deal of expertise.
2This chart includes data from http://contagiodump.blogspot.com, an excellent resource for historical and current exploit kit data. It also includes data from http://malware.dontneedcoffee.com/, an indispensable source for exploit kit analysis and exploit kit tracking.

17
Figure 11: Adobe Flash vulnerabilities by year
Adobe Flash vulnerabilities discovered by year adapted from cvedetails.com
The trends observed in this graph are discussed below:
• Increase in Adobe Flash targeting – There was a steady increase in Adobe Flash exploit usage in exploit kits from 2012 to 2014, followed by a dramatic increase in 2015. Exploit researchers have increasingly focused on Flash after significant improvements were made to Java security in 2014. The total number of Flash vulnerabilities identified in 2015 was the highest ever, with an almost 312% increase from 2014, as shown in Figure 11.
- 50 100 150 200 250 300 350
2005
2006
2007
2008
2009
2010
2011
2012
2013
2014
2015
2005
2006
2007
2008
2009
2010
2011
2012
2013
2014
2015
0 50 100 250150 300200 350
Flash is in widespread use on the Internet, and is supported across all modern operating systems. These facts, coupled with a stream of significant security flaws that have not always been patched in a timely manner, explain the dramatic shift toward Flash in exploit kits since 2014.

18
Figure 13: Internet Explorer vulnerabilities by year
2015
2014
2013
2012
2011
2010
2009
2008
2007
2006
2004
2003
2002
2001
2000
1999
0 50 150100 300200 2500 50 100 150 200 250 300
1999
2000
2001
2002
2003
2004
2005
2006
2007
2008
2009
2010
2011
2012
2013
2014
2015
Internet Explorer vulnerabilities published by year adapted from cvedetails.com
Figure 12: Java vulnerabilities by year
Oracle Java JRE vulnerabilities published by year adapted from cvedetails.com
2010
2011
2012
2013
2014
2015
- 50 100 150 200
2010
2011
2012
2013
2014
2015
0 50 100 150 200
• Decrease in Java targeting – The number of Java vulnerabilities targeted in exploit kits has decreased steadily from 2013 to 2015, due at least in part to security improvements introduced in Java (including blocking of unsigned applets by default). These security improvements are reflected in the decrease of Java vulnerabilities identified over the last two years, as displayed in Figure 12.
• Consistent targeting of Internet Explorer – Internet Explorer is still the default browser on Windows operating systems and is common on end-user systems in the corporate environment. Internet Explorer continues to be a target of choice, not only because it’s common, but because vulnerabilities continue to be discovered in Internet Explorer at a consistent rate, as shown in Figure 13.
19
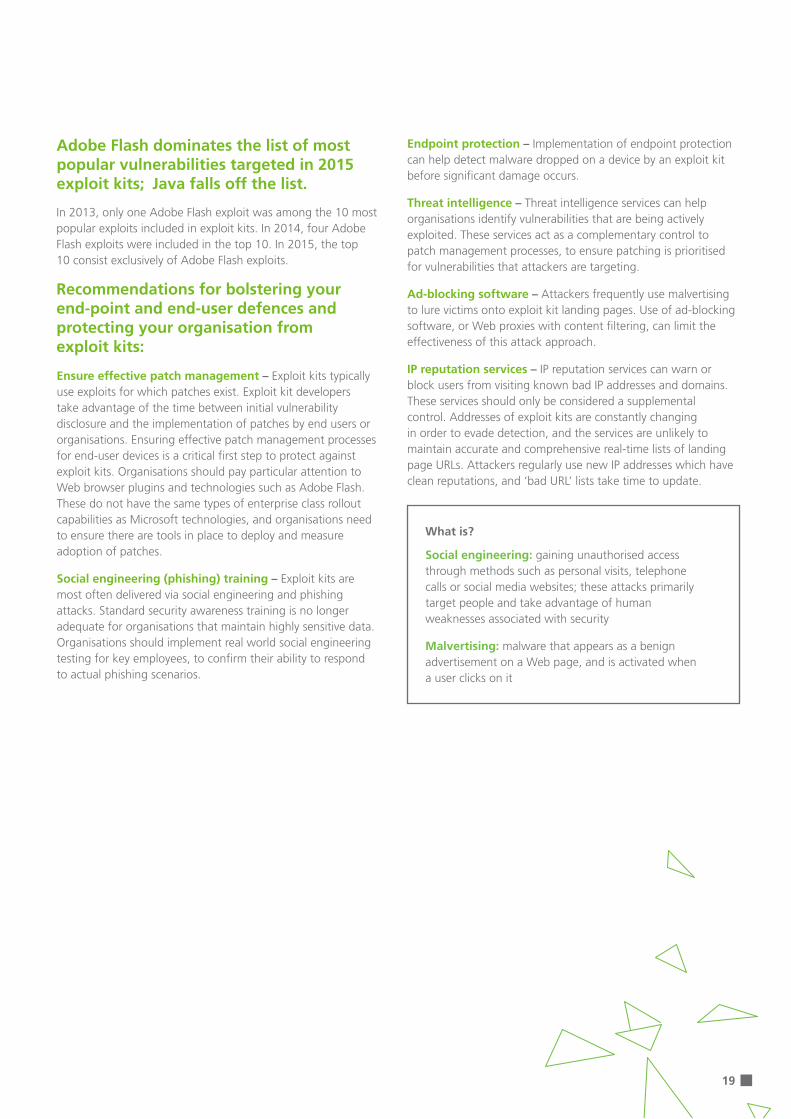
In 2013, only one Adobe Flash exploit was among the 10 most popular exploits included in exploit kits. In 2014, four Adobe Flash exploits were included in the top 10. In 2015, the top 10 consist exclusively of Adobe Flash exploits.
Recommendations for bolstering your end-point and end-user defences and protecting your organisation from exploit kits:
Adobe Flash dominates the list of most popular vulnerabilities targeted in 2015 exploit kits; Java falls off the list.
Ensure effective patch management – Exploit kits typically use exploits for which patches exist. Exploit kit developers take advantage of the time between initial vulnerability disclosure and the implementation of patches by end users or organisations. Ensuring effective patch management processes for end-user devices is a critical first step to protect against exploit kits. Organisations should pay particular attention to Web browser plugins and technologies such as Adobe Flash. These do not have the same types of enterprise class rollout capabilities as Microsoft technologies, and organisations need to ensure there are tools in place to deploy and measure adoption of patches.
Social engineering (phishing) training – Exploit kits are most often delivered via social engineering and phishing attacks. Standard security awareness training is no longer adequate for organisations that maintain highly sensitive data. Organisations should implement real world social engineering testing for key employees, to confirm their ability to respond to actual phishing scenarios.
Endpoint protection – Implementation of endpoint protection can help detect malware dropped on a device by an exploit kit before significant damage occurs.
Threat intelligence – Threat intelligence services can help organisations identify vulnerabilities that are being actively exploited. These services act as a complementary control to patch management processes, to ensure patching is prioritised for vulnerabilities that attackers are targeting.
Ad-blocking software – Attackers frequently use malvertising to lure victims onto exploit kit landing pages. Use of ad-blocking software, or Web proxies with content filtering, can limit the effectiveness of this attack approach.
IP reputation services – IP reputation services can warn or block users from visiting known bad IP addresses and domains. These services should only be considered a supplemental control. Addresses of exploit kits are constantly changing in order to evade detection, and the services are unlikely to maintain accurate and comprehensive real-time lists of landing page URLs. Attackers regularly use new IP addresses which have clean reputations, and ‘bad URL’ lists take time to update.
What is?
Social engineering: gaining unauthorised access through methods such as personal visits, telephone calls or social media websites; these attacks primarily target people and take advantage of human weaknesses associated with security
Malvertising: malware that appears as a benign advertisement on a Web page, and is activated when a user clicks on it

20
Incident response – many still on the back foot

21
Incidents do happen … and when they do, you need to be prepared to respond. Throughout the year there were many media headlines due to confidential information being stolen, denial of service attacks, and insider threats, but the data we collected in 2015 indicates organisations are not making focused efforts to prepare for such attacks.
Organisations need to invest not only in detective and defensive controls, but also in the ability to take action when an attack is occurring.
In this section we discuss how prepared organisations are, the types of incidents we’ve observed, and basic steps that should be considered for an effective incident response.
Lack of investment in preparedness continues to prevail.
During incident response engagements, we track metrics related not only to the impact of the incident, but also to how well organisations are prepared to respond. Unfortunately, many that engage us for incident support do so because they have little investment in their own incident response capabilities, do not have the technical knowledge to respond, or the ability to attribute the attack back to its source.
2013 2014 2015
No plan Actively Maturing
2013
2014
2015
7774
79
No formal plan Actively maturing
212326
Figure 14: Percentage of organisations that are preparing response cababilities
Incident preparedness
Organisations need to invest not only in detective and defensive controls, but also in the ability to take action when an attack is occurring.

22
Similar circumstances resulted in the creation of a separate category for spear phishing attacks. Spear phishing attacks accounted for approximately 17% of incident response engagements, up from 2% the previous year. Many of the attacks were related to financial fraud targeting executives and finance department personnel in retail clients. Attackers often gained detailed knowledge of the organisational structure and performed well-crafted social engineering and spear phishing attacks. Several of these attacks were focused on duping organisations into paying phony invoices.
Although 2015 saw the rise of DDoS hacking groups like DD4BC and the Armada Collective, we again noticed a drop in DDoS related support compared to the previous two years. This drop is likely related to a continuing investment in defence against these types of threats. Adoption of the proper tools and services for DDoS mitigation is vital to surviving a well-coordinated attack. There has also been a decline in successful DDoS attacks, resulting in less support required during 2015.
0%
10%
20%
30%
40%
50%
60%
Malware DDoS Breach Internalthreat
Spear phishing
43
52
19
31
18
6
17 16
28
2 2
19
2 2
17
5
10 11
Other
2013
2014
2015
Figure 15: Percentage of incidents across three years of data
Percentage by year and incident category
Types of incident response:
Observing the trend of incidents supported since 2013, there has been little improvement in preparedness. In 2015 there was a slight increase in organisations that were unprepared and had no formal plan to respond to incidents. Over the last three years, an average 77% of organisations fall into this category, leaving only 23% having some capability to effectively respond.
In 2015, we continued to provide client support focused on several core incident categories (malware, DDoS and breach investigations, spear phishing, and internal threats). Within these areas there were some notable changes from previous years, including a rise in breach investigations, internal threats and spear phishing, and a drop in malware and DDoS mitigation support. In cases where incidents spanned types, they were categorised according to their most significant threat vector.
Figure 15 presents our incident response engagements from 2013 through 2015.
We measured an increase in breach investigations, with 28% this year compared to 16% last year, and many of the activities focused on theft of data and intellectual property. Analysis indicated these were targeted and not opportunistic attacks.
Due to an increase in attacks related to internal threats, often involving employees and contractors, we created a new category for these types of attacks. In 2015, internal threats jumped to 19% of overall investigations compared to the previous year’s 2%. Many of these investigations were the result of internal employees and contractors abusing information and computing assets, and were initiated by Human Resource departments.

23
Incidents by vertical market
Incident response recommendations
Although finance was the leading sector for incident response in our previous annual reports, the retail sector took the lead this year with 22% of all response engagements, up from 12%. This matches data that shows retail clients experienced the highest number of attacks per client, as shown in the ‘Attacks by sector’ section. The financial sector declined approximately 10% from last year’s observations. Most of the spear phishing attacks previously discussed focused on the retail sector and help account for the increase in incident response in this area.
During 2015, we supported many different types of incident response activities affecting clients in diverse vertical markets. There are several places where organisations consistently fell short in their capabilities to respond effectively. The following recommendations represent only a fraction of what needs to go into a comprehensive programme and is intended to highlight some of the common issues observed.
Figure 16: Percentage of incident response engagements by vetical smarket
Incident response engagements by vertical market
0 5 10 15 20 25
ENERGY & UTILITIES
GAMING & ENTERTAINMENT
GOVERNMENT
TECHNOLOGY
MANUFACTURING
EDUCATION
BUSINESS SERVICES
FINANCE
RETAIL Retail
Finance
Business services
Education
Manufacturing
Technology
Government
Gaming and entertainment
Energy and utilities
0 5 10
22
18
17
15
13
5
4
3
3
15 20 25
• Prepare incident management processes and run books – Many organisations have limited guidelines describing how to declare and classify incidents. These are critical to ensuring a response can be initiated. Depending on the type of attack, potential impact, and other factors, response activities will be very different for each. Common practices for incident response also suggest organisations should develop ‘run books’ to address how common incidents should be handled in their environment. For instance, if DDoS activities are often used against your organisation, it’s a good investment to create a run book describing the procedures your response team can follow based on the tools and capabilities available.
• Evaluate your response effectiveness – We don’t see a significant number of organisations testing the effectiveness of their plans. When incidents occur, the last thing you want is to lack an understanding of standard incident response operating procedures. Evaluation of preparedness should include regular test scenarios. Consider post-mortem reviews to document and build upon response activities that worked well, as well as areas needing improvement.
• Update your escalation rosters – As organisations grow and roles change, it’s important to update documentation related to who is involved in incident response activities. Time is critical to incident response, and not being able to quickly involve the correct people can hamper your effectiveness. Updating contact information for vendors such as your ISP, external incident response support, and other providers is just as important.
• Prepare technical documentation – To make accurate decisions and identify impacted systems you must have comprehensive and accurate details about your network. This should include:
• IP ranges and host names
• DNS information
• software and operating system names, versions, and patch levels
• user and computer roles
• ingress and egress points between networks
Only when you’re prepared to respond to incidents can you hope to effectively mitigate their impact.

24
Cybercriminals continue to up their game
The data we gathered and analysed in 2015 indicates that cybercriminals’ intentions and capabilities are increasingly mirroring the goals of a robust security programme: survivability and resilience.
25
Cybercriminals are increasingly leveraging malware to breach perimeter defences: In 2015 we detected an 18% increase in malware across all industries, with the exclusion of education.
The frequency and complexity of malware is becoming more stealthy and sophisticated: While organisations are developing sandboxes to better understand cybercriminals’ tactics and protect themselves from attacks, malware developers are just as aggressively developing anti-sandbox techniques. (Read more about sandboxes later in this section).
Cybercriminals have identified the value in breaching organisational defences: Rather than engaging in distributed denial of service activities, hackers are starting to recognise the intrinsic value in breaching organisational defences and conducting data and intellectual property exfiltration. This causes legitimate business to become competitively disadvantaged and often times financially unviable over the long term. In 2015, breaches and social engineering activities increased. Often, this involved the use of malware that enabled attackers to gain a foothold into the organisation, laterally move, and maintain persistence once compromised. The longer an attacker’s ‘dwell time’ in a compromised network, the larger the opportunity to exfiltratel, commercially and personally sensitive data.
Sandboxes have become essential analysis systems for detecting malware and acquiring deep visibility into the behaviour of that malware. Sandboxes execute suspicious code in a controlled environment, where they observe malware behaviours such as network-related activities, file changes, and registry operations. Although malware developers can easily evade signature-based and static analysis-based detection methods by using encryption or polymorphism, sandboxes are able to detect malware by observing known malicious activities.
5.1. Anti-sandbox techniques
Cybercriminals have shifted attack targeting toward the retail vertical away from traditional financial markets: Retail and financial verticals process large volumes of personal information, and credit card data. This supports the notion that cybercriminals are targeting less mature verticals involved in high volume financial transactions. Gaining access to these organisations enables cybercriminals to monetise sensitive data in the black market. This points to the fact that cybercriminals are increasingly motivated by financial crime and its rewards. Retailers largely rely on dated security technologies and have not kept pace by investing in the maturity of their security programmes in line with the evolving threat landscape. This disparity exposes retailers to financial and reputation losses, and incentivises cybercriminals to accelerate their campaigns targeting businesses in this space.
Cybercriminals are increasingly adopting low-cost, highly available, and geographically strategic infrastructure to perpetrate malicious activities: This can be seen by the increase in US-sourced attacks leveraging cloud infrastructure and highlights the importance of cloud security as business migrate towards more flexible, scalable, and efficient environments.
Knowing that sandboxes are widely used for analysis, attackers have developed anti-sandbox techniques to evade detection. Some of these techniques detect the presence of a sandbox by inspecting specific artifacts related to the sandbox. These techniques then thwart malware analysis by terminating malware processes or showing fake behaviour. Another common anti-sandbox technique uses the act of stalling execution or waiting for an event such as a reboot.
To ensure researchers can continue effectively using sandboxes for analysis, it is imperative to gain an understanding of anti-sandbox techniques attackers are currently using.
What is?
Sandboxes: analysis systems for detecting malware and acquiring deep visibility into the behaviour of that malware
26
About NTT Group Security
NTT Group Security is a portfolio of operating companies within the NTT Group – Dimension Data’s security business, NTT Com Security, and Solutionary. We function in a complementary and collaborative manner while preserving the services and regional strengths of each organisation.

27
NTT Group Security develops and delivers a full lifecycle of security services that draws on our global threat intelligence capabilities, technology, and security expertise to:
• help businesses keep pace with the constantly changing threat landscape
• enhance business and government efforts to protect social and economic activities globally
Our services:
• security assessment and planning
• risk and compliance management
• security services integration
• security consulting
• managed security services
• cloud security services
• incident response 24/7
• global threat intelligence
nttgroupsecurity.com

www.dimensiondata.com/globalthreatreport