the exposure to chemical compounds in the japanese … · the exposure to chemical compounds in the...
TRANSCRIPT

2016 Environmental Risk Assessment Office,Environmental Health Department,Ministry of the Environment, Japan
Environmental Risk Assessment Office,Environmental Health Department,Ministry of the Environment, Japan
Please address opinions and inquiries to:
1-2-2 Kasumigaseki, Chiyoda-ku, Tokyo 100-8975 JAPANTel (main) : +81-3-3581-3351 (extension 6343)Tel (direct): +81-3-5521-8262Fax: +81-3-3581-3578http://www.env.go.jp/en
The Exposure tochemical compounds in the Japanese People
The Exposure to chemical compounds in the Japanese People
2016 Environmental Risk Assessment Office,
- Survey of the Exposure to chemical compounds
in Human (2011~) -
2016 Environmental Risk Assessment Office,Environmental Health Department,Ministry of the Environment, Japan
Environmental Risk Assessment Office,Environmental Health Department,Ministry of the Environment, Japan
Please address opinions and inquiries to:
1-2-2 Kasumigaseki, Chiyoda-ku, Tokyo 100-8975 JAPANTel (main) : +81-3-3581-3351 (extension 6343)Tel (direct): +81-3-5521-8262Fax: +81-3-3581-3578http://www.env.go.jp/en
The Exposure tochemical compounds in the Japanese People
The Exposure to chemical compounds in the Japanese People
- Survey of the Exposure to chemical compounds
in Human (2011~) -

Summary of “Survey of the Exposure to chemical compounds in Humans”
Introduction
Survey objectives
• Grasp accumulated levels of dioxins and other chemical compounds in Japanese people.
• Conduct a follow-up survey to observe chronological changes in the accumulation levels of chemical compounds in the previous participants.
• Conduct a monitoring survey of Persistent Organic Pollutants (POPs) in biological samples required by the Stockholm Convention.
Scope and methods of the survey
• Three areas per year selected from the survey regions in “Survey on the accumulation of dioxins and other chemical compounds in humans” conducted during FY 2002–2010.
• Within each survey area, 80 residents who were 40–59 at the time of the survey and who had lived in the area for a long period were recruited as survey subjects each year.
• Dioxins and other chemical compounds were measured in the blood and urine of the survey subjects.
• Food samples were collected over a three-day period from 15 survey subjects each fi scal year. The concentrations of chemical compounds in food were measured for calculating the intakes.
• A survey on the lifestyle of the subjects was conducted based on questionnaire.
The Environmental Risk Assessment Office, Environmental Health Department, Ministry of the Environment, Japan (MOE) has been conducting a survey titled ”Survey of the Exposure to Dioxins and other chemical compounds in Humans” to determine the exposure and accumulation levels of chemical compounds in Japanese subjects in FY 2011, and “Survey of the Exposure to chemical compounds in Humans” since FY 2012.The Environmental Risk Assessment Office has now compiled 5 years of survey results conducted during FY 2011‒2015.
Results from the dioxins survey
• For the 410 people who had their blood measured for dioxins in their blood, the average was 11 pg-TEQ/g-fat, with a range of 0.39–56 pg-TEQ/g-fat. Dioxin levels decreased in the blood of 73 out of 77 people who had participated in ”Survey of the Exposure to Dioxins and other chemical compounds in Humans” conducted from FY 2002 to 2007 (6–9 years from previous study).
• For the 75 people who had their food measured for dioxin intakes from food, the average was 0.50 pg-TEQ/kg body weight/day with a range of 0.035–2.4 pg-TEQ/kg body weight/day. No survey subjects exceeded the tolerable daily intake (TDI) of 4 pg-TEQ/kg body weight/day.

The Exposure to chemical compounds in the Japanese People
Results from the organic fl uorine compounds survey
• For the 326 people who had their blood measured for organic fl uorine compounds, the PFOS average was 4.3 ng/ml with a range of 0.29-17 ng/mL, and the PFOA average was 2.4 ng/mL with a range of 0.27-13 ng/mL. These results were within the range of surveys conducted from FY 2008 to 2010 are similar to those reported in other surveys.
• For the 15 people who had their food measured for organic fluorine compounds intakes from food, the PFOS average was 0.57 ng/kg body weight/day with a range of N.D. -1.7 ng/kg body weight/day, and the PFOA average was 0.69 ng/kg body weight/day with a range of N.D.- 2.9 ng/kg body weigh/day.
Results from the metals survey
・ As metals within blood, total mercury, lead, cadmium, total arsenic, copper, selenium, zinc, and manganese were measured. The median value of 410 people who had total mercury measured in their blood was 8.3 ng/mL, with a range of 1.5-41 ng/mL.
・ As metals within urine, cadmium and arsenic compounds were measured. The median value of 340 people who had cadmium measured in their urine was 0.79 μg/gCr, with a range of 0.11-4.7 μg/gCr.
・ As metals via food, total mercury, methyl mercury, lead, cadmium, total arsenic, copper, selenium, zinc, manganese intake were measured for 75 participants. The median value of methyl mercury was 0.055 μg/kg body weigt/day, with a range of N.D.-0.29 μg/kg body weight/day. No participants exceeded the methyl mercury TDI of 2.0 μg/kg body weight/week (subjected to pregnant or possibly pregnant women), established in Japan. In addition, the median value of cadmium was 0.23 μg/kg body weigt/day, with a range of 0.059-0.57μg/kg body weigt/day. No participants exceeded the cadmium TDI of 7 μg/kg body weight/week, established in Japan.
Results from other chemical compounds (including pesticides and plasticizers)
• Other chemical compounds including pesticides and plasticizers in blood of 60
people and urine of 340 people were measured.
Results from the POPs survey
• The concentrations of POPs by Stockholm Convention were measured in the blood
of 86 people. In addition, the intake of POPs from food was calculated for 15 people
(conducted only in FY 2011).
Table of Contents
Introduction
1 Overview of “Survey of the Exposure to chemical compounds in Humans” … 1
2 Survey methods ………………………………………………… 2
2-1 Target regions and subjects ………………………………… 2
2-2 Methods ……………………………………………………… 3
3 Results and Discussion ………………………………………… 5
3-1 Dioxins survey ……………………………………………… 5
3-1-1 Blood (chlorinated dioxins) ………………………… 5
3-1-2 Food (chlorinated dioxins) ………………………… 6
3-1-3 Blood (brominated dioxins) ………………………… 7
3-2 Organic fluorine compounds survey ……………………… 8
3-2-1 Blood ………………………………………………… 8
3-2-2 Food ………………………………………………… 9
3-3 Metals survey ………………………………………………… 10
3-3-1 Blood ………………………………………………… 10
3-3-2 Urine ………………………………………………… 11
3-3-3 Food ………………………………………………… 12
3-4 Other chemical compounds (including pesticides and plasticizers) … 13
3-4-1 Blood ………………………………………………… 13
3-4-2 Urine ………………………………………………… 13
3-5 POPs survey ………………………………………………… 16
3-5-1 Blood and food ……………………………………… 16
Committee members ………………………………………………… 18
Supplementary information ………………………………………… 19
1. Overview of “Survey of the Exposure to chemical compounds in Humans”
The Exposure to chemical compounds in the Japanese People
The Environmental Risk Assessment Office, Environmental Health Department, Ministry of the Environment, Japan, carried out a survey entitled “Survey on the accumulation of dioxins and other chemical compounds in humans” during FY 2002–2010. In this survey, blood dioxin concentrations were measured in 2,264 people living in typical environments in Japan. In addition, dioxin concentrations in the food of 625 people were measured and the intake from food was calculated (see Supplementary Information). Three areas were selected for each fiscal year for ”Survey of the Exposure to Dioxins and other chemical compounds in Humans”, and surveys were conducted as ”Survey of the Exposure to chemical compounds in Humans” in FY 2011 and as “Survey of the Exposure to chemical compounds in Humans” since FY 2012. Blood and urine were collected from the participating residents, and the accumulation of dioxins and other chemical compounds were measured. Furthermore, a food study (duplicate portions study) was conducted for a subset of survey subjects. The concentrations of chemical compounds in the food were measured, and the intakes were calculated. Thereafter, blood specimens of 410 people and urine specimens of 411 people from 15 survey regions were analyzed and the intakes of chemical compounds from food were estimated for 75 people.
Organization responsible for the survey
Environmental R isk Assessment Off ice , Environmental Health Department, Ministry of the Environment, Japan
Survey period FY 2011 and thereafter
Survey regions Three regions per year
Survey specimens
Blood(to ascertain the accumulation of chemical compounds in the body), urine (to ascertain the excreted amounts of rapidly-metabolized chemical compounds), and food (to ascertain the amount of intake of chemical compounds).
Number of subjects
411 people(FY 2011, 86 people; FY 2012, 84 people; FY 2013, 83 people; FY 2014, 81 people; FY 2015, 77peple; and 75 people participated in the food study).
“Survey of the Exposure to chemical compounds in Human”
01

2. Survey methods
In “Survey on the accumulation of dioxins and other chemical compounds in humans”
conducted during FY2002–2010, Japan was divided into five regions, of which one prefecture
was selected for each fiscal year. In a prefecture, three areas each classified as urban, agricultural,
or fishery area were selected. From FY 2011, three regions were selected from regions of
participated in previous studies. The local administrative authorities recruited the study subjects
from local residents, including those who have participated in previous studies, fulfilling the
following criteria.
Study subject criteria
・Age: 40–59
・A resident of the survey region for 10 years or more
・Rarely absent from the survey region for work or other reasons
・Ability to provide blood samples with no restrictions(e.g., no anemia)
2-1 Target regions and subjects
02
The Exposure to chemical compounds in the Japanese People
● Blood (all subjects)
Blood was collected from survey subjects
by a nurse in the presence of a physician.
Generally, fasting blood samples were taken.
.
● Urine (sampled from all subjects;
analysis for a subset of the subjects)
Urine was collected in a container on the
same day of blood sampling.
2-2 Methods
Analytes FY 2011
FY 2012
FY 2013
FY 2014
FY 2015
・ Pesticides and their matabolites (organophosphate, pyrethroid etc.)
○ ○ ○ ○ ○
・ Plasticizers, phthalate metabolites, and bisphenol A
○ ○ ○ ○ ○
・ Metals (cadmium and arsenic) ○ ○ ○ ○ ○
・ Other chemical substances (PAH, cotinine, and caffeine)
○ ○ ○ ○
・ General health examination items: specific gravity, glucose, and protein
○ ○ ○ ○ ○
Analytes FY 2011
FY 2012
FY 2013
FY 2014
FY 2015
・Chlorinated dioxins ○ ○ ○ ○ ○
・Brominated dioxins ○
・ Organic fluorine compounds ○ ○ ○ ○
・Metals ○ ○ ○ ○ ○
・ Hydroxylated polychlorinated biphenyls (PCB) ○ ○ ○ ○
・POPs ○
・ General health examination items: blood count, hepatic function, renal function, and glucose metabolism
○ ○ ○ ○ ○
・ Health effect indexes: thyroidal function, allergic function, and fatty acids
○ ○ ○ ○ ○
Analytes
Analytes
03
● Food (conducted on a subset of the
subjects)
The food study was conducted over
three days during the survey period. A
“duplicate portions study” was conducted
whereby duplicates of the subjects’ meals
were stored in containers and collected
afterwards. Nutritionists checked the food
items and weight. The meals were then
homogenized, the chemical compounds
were measured, and the intake of each
chemical compound (kg body weight per
day) was estimated.
● Lifestyle survey (questionnaire)
A public health nurse or a nutritionist
investigated the lifestyles of survey subjects
through individual interviews, referring to the
questionnaire that was answered in advance.
・ Personal medical history, residential history, occupational history, smoking habit, dietary history, lifestyle, and birth history
Analyzed chemicals FY 2011
FY 2012
FY 2013
FY 2014
FY 2015
・ Chlorinated dioxins ○ ○ ○ ○ ○・ Organic fluorine
compounds ○
・ Metals ○ ○ ○ ○ ○・ POPs ○
Analytes
Items of the questionnaire
04

3.Results and Discussion
The Exposure to chemical compounds in the Japanese People
3-1-1 Blood (chlorinated dioxins)
● Results summary
The blood dioxin concentrations are shown in Table 1. The average concentration of the 410 survey subjects was 11 pg-TEQ/g-fat. The range of the concentration was 0.39–56 pg-TEQ/g-fat.
□ Table 1. Statistics for blood dioxin concentrations(unit: pg-TEQ/g-fat)
FY 2011(n=86)
FY 2012(n=84)
FY 2013(n=83)
FY 2014(n=81)
FY 2015(n=76)
Total(n=410)
PCDDs+PCDFs +Co-PCBs
Average 17 10 9.9 9.8 9.7 11Standard deviation 10 6.9 6.6 5.9 7.0 8.1Median 14 9.0 8.9 8.3 8.4 9.5Range 0.83 ~ 56 0.42 ~ 40 0.40 ~ 33 1.1 ~ 34 0.39 ~ 49 0.39 ~ 56
● Comparison with previous survey results
Table 2 summarizes the comparison of the present results with the results from the “Survey on the accumulation of dioxins and other chemical compounds in humans (FY 2002 to FY 2010),” conducted on 2,264 subjects. Although it was difficult to compare in a simplified manner because the average age and number of subjects differed between the surveys, the blood dioxin concentrations obtained in the present survey were generally within the range of concentrations obtained in the previous surveys.
□ Table 2. Comparison with previous survey results (unit: pg-TEQ/g-fat)
Survey nameSurvey on the Accumulation of Dioxins
and other chemical compoundsThis survey
Survey year FY 2002 to FY 2010 FY2011 to FY2015
SubjectsPeople living in the general
envionmentPeople living in the
general envionmentNumber of subjects 2,264 410Age
Average (years) 44.5 50.1Range 15 ~ 76 24 ~ 77
PCDDs+PCDFs +Co-PCBs
Average 19 11Standard deviation 14 8.1Median 16 9.5Range 0.10 ~ 130 0.39 ~ 56
3-1 Dioxins survey
05

● Comparison of results for the same subjects
77 people participated in both the present and previous surveys, and a comparison of the results are shown in Table 3. The dioxin concentrations in the blood decreased in most of the subjects.
□ Table 3. Comparison of blood dioxin concentrations in the same subjects (unit: pg-TEQ/g-fat)
Survey namePast survey(n=77)
This survey(n=77)
Survey year FY 2002 to FY2007 FY 2011 to FY 2015
PCDDs+PCDFs+Co-PCBs
Average 22 12
Standard deviation 16 9.5
Median 18 9.9
Range 0.96 ~ 95 1.2 ~ 56
3-1-2 Food (chlorinated dioxins)
● Results summary
Table 4 summarizes the dioxin intake from food. The average intake was 0.50 pg-TEQ/kg bw/day with a range of 0.035–2.4 pg-TEQ/kg bw/day. Conceivable routes of intake include food, ambient air, and soil, but the intake from food is estimated to account for the largest portion (see the p33). In Japan, the tolerable daily intake (TDI) for dioxins is 4 pg-TEQ/kg bw/day as stipulated by the Law Concerning Special Measures against Dioxins. The TDI indicates the maximum ingestion of a given chemical substance per kg of body weight/day, and humans do not show adverse health effects even when the chemical is ingested below this level over a long period. No subjects in the survey exceeded this TDI value.
□ Table 4. Statistics for intake of intake from food(unit: pg-TEQ/kg bw/day)
FY 2011(n=15)
FY 2012(n=15)
FY 2013(n=15)
FY 2014(n=15)
FY 2015(n=15)
Total(n=75)
PCDDs+PCDFs+Co-PCBs
Average 0.65 0.72 0.32 0.43 0.37 0.50
Standard deviation 0.71 0.55 0.41 0.35 0.27 0.49
Median 0.39 0.57 0.23 0.34 0.25 0.34
Range 0.035 ~ 2.4 0.071 ~ 2.3 0.046 ~ 1.6 0.086 ~ 1.3 0.13 ~ 1.1 0.035 ~ 2.4
06
The Exposure to chemical compounds in the Japanese People
● Comparison with previous survey results
Table 5 summarizes the comparison with the results of “Survey on the Accumulation of Dioxins and other chemical compounds (FY 2002 to FY 2010)” conducted on 625 subjects. The results from this survey were generally within the range of concentrations obtained in the previous surveys.
□ Table 5. Comparison with previous survey results (unit: pg-TEQ/kg bw/day)
Survey nameSurvey on the Accumulation of Dioxins
and other chemical compoundsThis survey
Survey year FY 2002 to FY 2010 FY 2011 to FY 2015
SubjectsPeople living in the general
envionmentPeople living in the
general envionmentNumber of subjects 625 75
PCDDs+PCDFs+Co-PCBs
Average 0.82 0.50Standard deviation 0.86 0.49Median 0.56 0.34Range 0.031 ~ 6.2 0.035 ~ 2.4
3-1-3 Blood (brominated dioxins)
● Results summary
Table 6 summarizes the brominated dioxin concentrations in the blood for FY 2012 survey, which were below the detection limit for all 84 subjects.
□ Table 6. Statistics for brominated dioxins in the blood(unit: pg/g-fat)
FY 2012(n=84)
PBDDs+PBDFs
Average
All N.D.Standard deviationMedianRange
07
3-2-1 Blood
● Results summary
The results for organic fluorine compound concentrations in the blood are shown in Table 7.
□ Table 7. Statistics for organic fluorine compound concentrations in the blood(unit: ng/mL)
FY 2011(n=86)
FY 2013(n=83)
FY 2014(n=81)
FY 2015(n=76)
Total ( PFOS・PFOA: n=326, and
others:n=240)PFOS
Average 5.8 5.1 3.0 2.9 4.3Standard deviation 3.1 2.9 1.6 2.2 2.8Median 4.8 4.5 2.7 2.1 3.5Range 1.5 ~ 17 1.3 ~ 16 0.29 ~ 11 0.44 ~ 11 0.29 ~ 17
PFOA
Average 2.2 3.2 1.8 2.3 2.4Standard deviation 1.4 2.4 1.1 2.1 1.9Median 1.8 2.5 1.6 1.6 1.8Range 0.66 ~ 9.6 0.27 ~ 13 0.43 ~ 8.4 0.27 ~ 12 0.27 ~ 13
PFHxA
Median -All N.D. All N.D. All N.D. All N.D.
Range -
PFHpA
Median - N.D. N.D. N.D. N.D.Range - N.D. ~ 1.2 N.D. ~ 0.39 N.D. ~ 0.29 N.D. ~ 1.2
PFHxS
Median - 0.54 0.42 0.22 0.37Range - N.D. ~ 1.8 N.D. ~ 1.1 N.D. ~ 0.80 N.D. ~ 1.8
PFTeDA
Median - N.D. N.D. N.D. N.D.Range - N.D. ~ 0.33 N.D. ~ 0.41 N.D. ~ 0.30 N.D. ~ 0.41
PFNA
Median - 2.0 1.3 1.1 1.4Range - 0.60 ~ 7.7 0.35 ~ 5.9 0.30 ~ 5.2 0.35 ~ 7.7
PFDA
Median - 0.58 0.55 0.39 0.52Range - 0.23 ~ 2.0 0.092 ~ 2.7 0.12 ~ 1.6 0.092 ~ 2.7
PFUdA
Median - 1.4 1.1 1.1 1.2Range - 0.30 ~ 4.6 0.29 ~ 6.4 0.13 ~ 5.1 0.13 ~ 6.4
PFDS
Median - N.D.All N.D. All N.D.
N.D.Range - N.D. ~ 0.065 N.D. ~ 0.065
PFDoA
Median - 0.18 0.16 0.11 0.15Range - N.D. ~ 0.66 N.D. ~ 0.89 N.D. ~ 0.65 N.D. ~ 0.89
PFTrDA
Median - 0.38 0.45 0.36 0.39Range - N.D. ~ 1.3 N.D. ~ 2.7 N.D. ~ 2.5 N.D. ~ 2.7
3-2 Organic fluorine compounds survey
08
The Exposure to chemical compounds in the Japanese People
● Comparison with previous survey results
Table 8 summarizes the comparison of the present results with the results from “Survey on the Accumulation of Dioxins and other chemical compounds in Humans” conducted from FY 2008 to FY 2010 on 609 subjects. Although it was difficult to compare in a simplified manner because the average age and the number of subjects differed between the surveys, the results of present survey were generally within the range of results obtained in the previous surveys.
□ Table 8. Comparison with previous survey results(unit: ng/mL)
Survey nameSurvey on the Accumulation of Dioxins
and other chemical compoundsThis survey
Survey year FY 2008 to FY 2010 FY 2011, 2013 to FY 2015Subjects People living in the general
envionmentPeople living in the
general envionmentNumber of subjects 609 326
PFOS
Average 7.8 4.3Standard deviation 9.2 2.8Median 5.8 3.5Range 0.73 ~ 150 0.29 ~ 17
PFOA
Average 3.0 2.4Standard deviation 2.9 1.9Median 2.1 1.8Range 0.37 ~ 25 0.27 ~ 13
3-2-2 Food
The intake of organic fluorine compounds from food for 15 subjects is shown in Table 9. The average PFOS concentration was 0.57 ng/kg body weight/day with a range of N.D.-1.7 ng/kg body weight/day. The TDI has not been established for fluorine compounds in Japan.
□ Table 9. Statistics for the intake of organic fluorine compounds from food
(unit: ng/kg bw/day)
FY 2011(n=15)
PFOS
Average 0.57Standard deviation 0.51Median 0.53Range N.D. ~ 1.7
PFOA
Average 0.69Standard deviation 0.70Median 0.62Range N.D. ~ 2.9 09

3-3-1 Blood
● Results summary
The concentrations of metals (total mercury, lead, cadmium, total arsenic, copper, selenium, zinc, and manganese) in the blood were measured (Table 10).
□ Table 10. Statistics for blood metal concentrations(unit: ng/mL)
Metals FY 2011(n=86)
FY 2012(n=84)
FY 2013(n=83)
FY 2014(n=81)
FY 2015(n=76)
Total ( total mercury:
n=410 manganese: n=240, and
others: n=324)Total mercury
Median 9.1 9.0 7.3 7.2 7.9 8.3Range 2.4 ~ 29 1.7 ~ 41 2.1 ~ 33 1.5 ~ 22 1.5 ~ 38 1.5 ~ 41
LeadMedian - 12 10 13 11 11Range - 5.0 ~ 28 4.8 ~ 31 5.2 ~ 37 4.3 ~ 25 4.3 ~ 37
CadmiumMedian - 1.1 1.1 0.97 1.2 1.1Range - 0.25 ~ 3.5 0.40 ~ 2.7 0.37 ~ 4.4 0.38 ~ 6.2 0.25 ~ 6.2
Total arsenicMedian - 5.2 4.1 5.7 7.8 5.3Range - 1.4 ~ 35 1.2 ~ 19 1.0 ~ 110 0.70 ~ 39 0.70 ~ 110
CopperMedian - 800 870 890 830 850Range - 590 ~ 1,100 640 ~ 1,400 590 ~ 1,400 650 ~ 1,500 590 ~ 1,500
SeleniumMedian - 180 180 200 200 190Range - 110 ~ 480 130 ~ 390 160 ~ 260 150 ~ 340 110 ~ 480
ZincMedian - 6,300 6,500 6,400 6,500 6,400Range - 4,700 ~ 7,8004,700 ~ 7,8004,500 ~ 8,4003,800 ~ 8,600 3,800 ~ 8,600
ManganeseMedian - - 13 14 12 13Range - - 7.4 ~ 25 7.0 ~ 53 5.8 ~ 27 5.8 ~ 53
3-3 Metals survey
10

The Exposure to chemical compounds in the Japanese People
3-3-2 Urine
● Results summary
The concentrations in urine of cadmium and arsenic species [As(V), As(III), monomethylarsonic acid, dimethylarsinic acid, and arsenobetaine] were measured (Table 11).
□ Table 11. Statistics for urine metal concentrations(unit: μg/g Cr)
Metals Statistics FY 2011(n=15)
FY 2012(n=84)
FY 2013(n=83)
FY 2014(n=81)
FY 2015(n=77)
Total(n=340)
CadmiumMedian 0.97 0.89 0.64 0.81 0.69 0.79
Range 0.25 ~ 3.9 0.20 ~ 3.1 0.11 ~ 3.1 0.16 ~ 2.8 0.12 ~ 4.7 0.11 ~ 4.7
Arsenic
As(V)Median 0.30 N.D. N.D. N.D. N.D. N.D.
Range N.D. ~ 2.5 N.D. ~ 2.9 N.D. ~ 2.2 N.D. ~ 1.6 N.D. ~ 1.7 N.D. ~ 2.9
As( Ⅲ )Median 1.5 1.7 1.5 1.1 1.4 1.4
Range N.D. ~ 6.2 N.D. ~ 6.6 N.D. ~ 6.9 N.D. ~ 4.7 N.D. ~ 5.5 N.D. ~ 6.9
MMA(monomethylarsonic
acid)
Median 2.0 2.1 2.1 1.5 1.4 1.8
Range 0.89 ~ 5.1 0.38 ~ 8.5 N.D. ~ 13 N.D. ~ 6.2 N.D. ~ 4.9 N.D. ~ 13
DMA(dimethylarsinic
acid)
Median 42 33 30 27 26 30
Range 12 ~ 170 6.7 ~ 110 8.5 ~ 100 6.2 ~ 150 9.4 ~ 140 6.2 ~ 170
AB(arsenobetaine)
Median 73 40 31 54 59 44
Range 15 ~ 300 2.8 ~ 640 2.1 ~ 390 6.1 ~ 2,3004.5 ~ 1,600 2.1 ~ 2,300
11

3-3-3 Food
● Results summary
Metals (total mercury, methyl mercury, lead, cadmium, total arsenic, copper, selenium, zinc, and manganese) were measured in the food (Table 12). In Japan, among the metals measured in this survey, the TDIs have been established methyl mercury and cadmium. The TDIs for methyl mercury and cadmium are 2.0μg/kg body weight/week (subjected to pregnant or possibly pregnant women) and 7.0μg/kg body weight/week, respectively. No subjects in this survey exceeded these TDIs.
□ Table 12. Statistics for the intake of metals from food(unit:μg/kg bw/day)
Metals FY 2011(n=15)
FY 2012(n=15)
FY 2013(n=15)
FY 2014(n=15)
FY 2015(n=15)
Total ( total mercury・methyl mercury・lead・ cadmium: n=75,
manganese: n=45,and
others:n=60)
Total mercuryMedian 0.063 0.079 0.039 0.061 0.051 0.060Range N.D. ~ 0.16 0.025 ~ 0.30 0.013 ~ 0.16 N.D. ~ 0.16 N.D. ~ 0.30 N.D. ~ 0.30
Methyl mercuryMedian 0.063 0.078 0.034 0.056 0.051 0.055Range N.D. ~ 0.14 0.022 ~ 0.29 N.D. ~ 0.15 N.D. ~ 0.15 N.D. ~ 0.29 N.D. ~ 0.29
LeadMedian 0.094 0.11 0.083 0.064 0.048 0.074Range 0.024 ~ 0.17 0.031 ~ 0.28 0.036 ~ 0.22 0.032 ~ 0.17 N.D. ~ 0.13 N.D. ~ 0.28
CadmiumMedian 0.24 0.25 0.23 0.21 0.19 0.23Range 0.059 ~ 0.39 0.11 ~ 0.57 0.11 ~ 0.56 0.13 ~ 0.47 0.12 ~ 0.42 0.059 ~ 0.57
Total arsenicMedian - 2.8 1.8 2.8 2.0 2.2Range - 1.0 ~ 14 0.76 ~ 5.8 0.71 ~ 10 0.54 ~ 3.7 0.54 ~ 14
CopperMedian - 16 19 16 13 16Range - 8.2 ~ 26 12 ~ 23 8.2 ~ 24 8.6 ~ 38 8.2 ~ 38
SeleniumMedian - 1.3 1.2 1.2 1.2 1.2Range - 0.90 ~ 1.8 0.64 ~ 2.5 0.74 ~ 1.9 0.56 ~ 1.5 0.56 ~ 2.5
ZincMedian - 140 130 120 90 120Range - 80 ~ 170 99 ~ 190 65 ~ 160 73 ~ 220 65 ~ 220
ManganeseMedian - - 66 52 50 58Range - - 38 ~ 110 34 ~ 72 28 ~ 140 28 ~ 140
12

The Exposure to chemical compounds in the Japanese People
3-4-2 Urine
The results of other chemical compounds (including pesticides and plasticizers) in urine are shown in Tables 14-1 to 14-4.
□ Table 14-1. Statistics of pesticides, plasticizers, and others in urine (1)(unit:μg/g Cr)
Classification
Chemical compounds
StatisticsFY 2011(n=15)
FY 2012(n=84)
FY 2013(n=83)
FY 2014(n=81)
FY 2015(n=77)
Total(n=340)
Plasticizers
Phthalate mono-esters
MBPMedian 20 17 20 14 12 16Range 11 ~ 670 6.6 ~ 540 5.5 ~ 5,200 3.7 ~ 48 3.9 ~ 57 3.7 ~ 5,200
MEHPMedian 4.2 2.9 3.2 1.9 2.6 2.7Range 0.98 ~ 8.1 0.61 ~ 21 0.54 ~ 22 0.23 ~ 13 0.40 ~ 21 0.23 ~ 22
MEHHPMedian 15 9.9 11 7.4 5.4 8.8Range 5.7 ~ 44 2.7 ~ 59 2.8 ~ 58 1.8 ~ 42 1.2 ~ 28 1.2 ~ 59
MEOHPMedian 9.6 6.3 7.1 4.7 4.3 5.6Range 4.6 ~ 18 1.6 ~ 31 1.1 ~ 35 1.0 ~ 35 0.55 ~ 21 0.55 ~ 35
MBzPMedian 0.59 0.68 0.60 0.44 0.42 0.53Range 0.25 ~ 10 N.D. ~ 38 N.D. ~ 7.0 N.D. ~ 15 N.D. ~ 4.3 N.D. ~ 38
Bisphenol AMedian 0.76 0.44 0.26 0.26 0.29 0.31Range 0.23 ~ 1.4 N.D. ~ 31 N.D. ~ 8.2 N.D. ~ 2.5 N.D. ~ 3.2 N.D. ~ 31
3-4-1 Blood
The results for hydroxylated PCB concentrations in blood are shown in Table 13.
□ Table 13. Statistics for hydroxylated PCB concentrations in blood(unit:pg/g)
Chemical compounds StatisticsFY 2012(n=15)
FY 2013(n=15)
FY 2014(n=15)
FY 2015(n=15)
Total(n=60)
Hydoroxyleted PCB
5Cl-HO-PCBs Median 24 21 29 35 27Range 1.2 ~ 69 7.6 ~ 120 9.2 ~ 110 11 ~ 110 1.2 ~ 120
6Cl-HO-PCBs Median 27 30 34 26 30Range 1.6 ~ 120 12 ~ 200 11 ~ 110 13 ~ 170 1.6 ~ 200
7Cl-HO-PCBs Median 23 22 40 23 26Range 4.0 ~ 94 9.0 ~ 130 9.6 ~ 73 9.6 ~ 200 4.0 ~ 200
3-4 Other chemical compounds (including pesticides and plasticizers)
13
□ Table 14-2. Statistics of pesticides, plasticizers, and others in urine (2)(unit:μg/g Cr)
Classification
Chemical compounds StatisticsFY 2011(n=15)
FY 2012(n=30)
FY 2013(n=30)
FY 2014(n=30)
FY 2015(n=77,
only Ethylenethiourea
n=15)
Total(n=182,
only Ethylenethiourea
n=120)
Pesticides
Organic phosphorusmetabolites
DMPMedian 5.6 2.4 3.3 2.9 2.5 2.8Range 1.8 ~ 14 0.60 ~ 11 N.D. ~ 140 N.D. ~ 15 N.D. ~ 30 N.D. ~ 140
DEPMedian 5.8 5.6 2.1 2.0 2.7 3.1Range N.D. ~ 32 N.D. ~ 520 N.D. ~ 14 N.D. ~ 13 N.D. ~ 150 N.D. ~ 520
DMTPMedian 12 7.7 3.5 5.1 2.8 4.7Range N.D. ~ 62 N.D. ~ 82 N.D. ~ 110 N.D. ~ 61 N.D. ~ 77 N.D. ~ 110
DETPMedian N.D. N.D. N.D. N.D. N.D. N.D.Range N.D. ~ 2.7 N.D. ~ 8.3 N.D. ~ 4.6 N.D. ~ 5.1 N.D. ~ 16 N.D. ~ 16
Pyrethroid pesticidemetabolites
PBAMedian 0.22 0.22 N.D. 0.42 0.27 0.27Range N.D. ~ 3.4 N.D. ~ 1.6 N.D. ~ 3.3 N.D. ~ 2.0 N.D. ~ 8.7 N.D. ~ 8.7
DCCAMedian N.D. N.D.
All N.D.N.D. N.D. N.D.
Range N.D. ~ 13 N.D. ~ 3.1 N.D. ~ 2.5 N.D. ~ 21 N.D. ~ 21
Carbamate pesticidemetabolite
EthylenethioureaMedian N.D. N.D.
All N.D. All N.D. All N.D.N.D.
RangeN.D. ~
0.23N.D. ~
0.50N.D. ~
0.50
TriclosanMedian 1.3 1.3 1.1 1.2 1.7 1.3Range 0.27 ~ 79 0.15 ~ 1200.15 ~ 3800.17 ~ 1300.12 ~ 270 0.12 ~ 380
□ Table 14-3. Statistics of pesticides, plasticizers, and others in urine (3)(unit:μg/g Cr)
Classification
Chemical compounds StatisticsFY 2012(n=30)
FY 2013(n=15)
FY 2014(n=15)
FY 2015(n=15, only
Imidachloprid metabolite
n=77)
Total(n=75, only
Imidachloprid metabolite
n=137)
Pesticides
AcephateMedian N.D. N.D. N.D. N.D. N.D.Range N.D. ~ 0.30 N.D. ~ 1.9 N.D. ~ 0.61 N.D. ~ 11 N.D. ~ 11
MethamidophosMedian N.D.
All N.D. All N.D.N.D. N.D.
Range N.D. ~ 0.058 N.D. ~ 0.19 N.D. ~ 0.19
Imidachloprid metabolite
6-Chloronicotinic acid
Median N.D.All N.D. All N.D.
N.D. N.D.Range N.D. ~ 1.8 N.D. ~ 0.74 N.D. ~ 1.8
Fenitrothion metabolite
3-Methyl-4-nitrophenol
Median N.D. 0.30 N.D. N.D. N.D.Range N.D. ~ 2.8 N.D. ~ 2.7 N.D. ~ 3.6 N.D. ~ 4.2 N.D. ~ 4.2
p-NitropheolMedian 0.67 0.97 0.44 0.42 0.67Range 0.23 ~ 4.6 0.49 ~ 2.4 N.D. ~ 2.6 N.D. ~ 2.9 N.D. ~ 4.6
14

The Exposure to chemical compounds in the Japanese People
□ Table 14-4. Statistics of pesticides, plasticizers, and others in urine (4)(unit:μg/g cr)
Classification
Chemical compounds StatisticsFY 2012(n=30)
FY 2013(n=15)
FY 2014(n=15)
FY 2015(n=15)
Total(n=75,
only 8-OHdG n=15)
Others
DeetMedian
All N.D. All N.D. All N.D.N.D. N.D.
Range N.D. ~ 0.087 N.D. ~ 0.087
Parabens
MethylparabenMedian 55 95 120 91 82Range 1.3 ~ 870 1.4 ~ 2,500 3.5 ~ 1,100 5.9 ~ 630 1.3 ~ 2,500
EthylparabenMedian 2.5 3.4 2.7 7.6 4.3Range N.D. ~ 120 N.D. ~ 410 N.D. ~ 290 N.D. ~ 100 N.D. ~ 410
PropylparabenMedian 1.0 2.0 1.1 N.D. 1.1Range N.D. ~ 71 N.D. ~ 77 N.D. ~ 41 N.D. ~ 110 N.D. ~ 110
ButylparabenMedian N.D. N.D. 0.61 N.D. N.D.Range N.D. ~ 25 N.D. ~ 64 N.D. ~ 87 N.D. ~ 7.0 N.D. ~ 87
BenzylparabenMedian
All N.D. All N.D. All N.D. All N.D. All N.D.Range
IodineMedian 310 290 300 340 300Range 110 ~ 3,000 75 ~ 9,100 73 ~ 3,400 110 ~ 8,800 73 ~ 9,100
Perchloric acidMedian 3.5 4.7 3.1 3.8 3.7Range 1.2 ~ 10 N.D. ~ 67 N.D. ~ 12 N.D. ~ 29 N.D. ~ 67
PAH
metabolites
1-HydoroxypyreneMedian 0.19 0.071 0.098 0.075 0.12Range 0.045 ~ 0.76 N.D. ~ 0.54 0.022 ~ 4.7 N.D. ~ 0.33 N.D. ~ 4.7
1&9- Hydroxyphenanthrene
Median 0.15 0.085 0.060 0.080 0.12Range 0.038 ~ 0.60 0.029 ~ 0.21 N.D. ~ 0.69 N.D. ~ 0.35 N.D. ~ 0.69
2- Hydroxyphenanthrene
Median 0.14 0.066 N.D. 0.12 0.095Range 0.031 ~ 0.39 N.D. ~ 0.19 N.D. ~ 0.46 0.062 ~ 0.26 N.D. ~ 0.46
3- Hydroxyphenanthrene
Median 0.24 0.079 0.057 0.20 0.17Range 0.077 ~ 0.65 N.D. ~ 0.37 N.D. ~ 0.57 0.093 ~ 0.49 N.D. ~ 0.65
4- Hydroxyphenanthrene
Median N.D. N.D. N.D. N.D. N.D.Range N.D. ~ 0.20 N.D. ~ 0.043 N.D. ~ 0.12 N.D. ~ 0.065 N.D. ~ 0.20
CotinineMedian 0.92 N.D. 0.11 N.D. 0.29Range 0.060 ~ 1,600 N.D. ~ 2.0 N.D. ~ 1,400 N.D. ~ 3,000 N.D. ~ 3,000
8-OHdGMedian
- - -5.0 5.0
Range 1.2 ~ 7.7 1.2 ~ 7.7
CaffeineMedian 1,100 3,200 1,900 1,600 1,800Range 0.36 ~ 9,100 100 ~ 22,000 360 ~ 14,000 230 ~ 16,000 0.36 ~ 22,000
Benzophenone-3Median N.D. N.D. N.D. N.D. N.D.Range N.D. ~ 120 N.D. ~ 190 N.D. ~ 2.0 N.D. ~ 120 N.D. ~ 190
Ph
ytoe
strog
en
s
GenisteinMedian 1,700 880 940 800 1,100Range 360 ~ 5,700 190 ~ 3,800 74 ~ 4,700 89 ~ 7,600 74 ~ 7,600
DaidzeinMedian 2,700 1,600 1,500 1100 1,600Range 240 ~ 7,800 97 ~ 19,000 200 ~ 17,000 27 ~ 9,100 27 ~ 19,000
EquolMedian 690 170 12 510 190Range 6.1 ~ 28,000 N.D. ~ 11,000 4.1 ~ 3,100 N.D. ~ 14,000 N.D. ~ 28,000
15
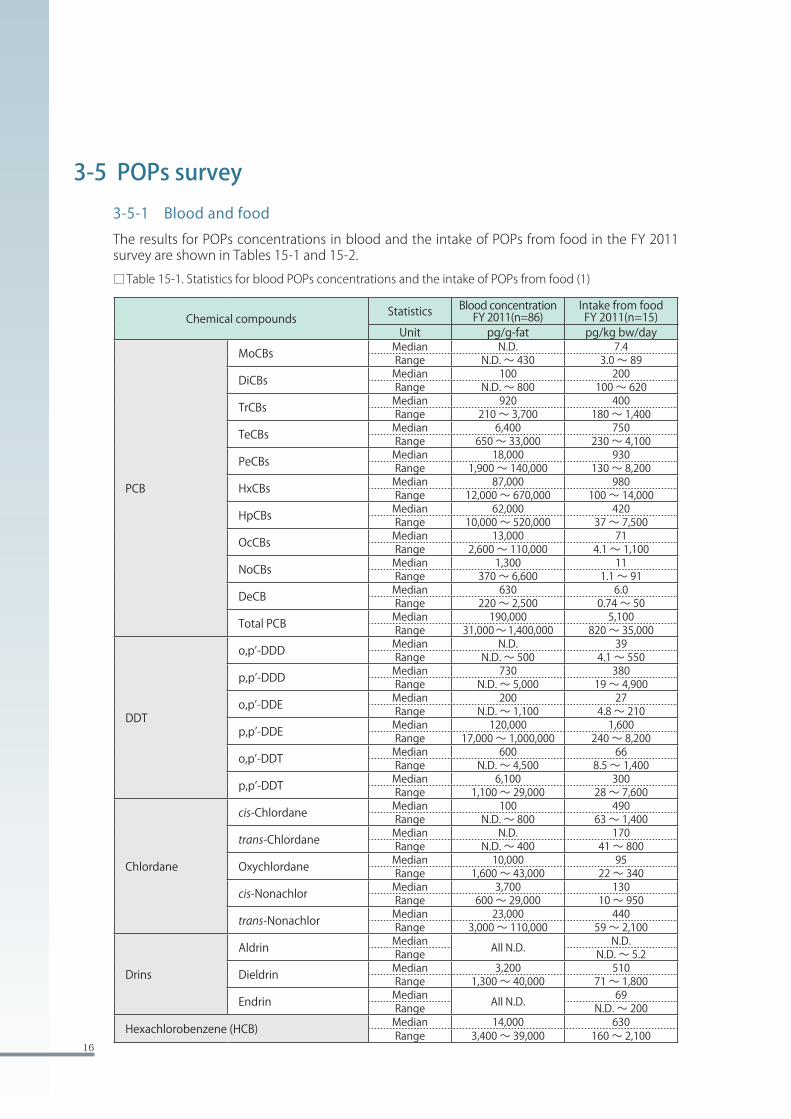
3-5-1 Blood and food
The results for POPs concentrations in blood and the intake of POPs from food in the FY 2011 survey are shown in Tables 15-1 and 15-2.
Chemical compounds Statistics Blood concentrationFY 2011(n=86)
Intake from foodFY 2011(n=15)
Unit pg/g-fat pg/kg bw/day
PCB
MoCBs Median N.D. 7.4Range N.D. ~ 430 3.0 ~ 89
DiCBs Median 100 200Range N.D. ~ 800 100 ~ 620
TrCBs Median 920 400Range 210 ~ 3,700 180 ~ 1,400
TeCBs Median 6,400 750Range 650 ~ 33,000 230 ~ 4,100
PeCBs Median 18,000 930Range 1,900 ~ 140,000 130 ~ 8,200
HxCBs Median 87,000 980Range 12,000 ~ 670,000 100 ~ 14,000
HpCBs Median 62,000 420Range 10,000 ~ 520,000 37 ~ 7,500
OcCBs Median 13,000 71Range 2,600 ~ 110,000 4.1 ~ 1,100
NoCBs Median 1,300 11Range 370 ~ 6,600 1.1 ~ 91
DeCB Median 630 6.0Range 220 ~ 2,500 0.74 ~ 50
Total PCB Median 190,000 5,100Range 31,000 ~ 1,400,000 820 ~ 35,000
DDT
o,p’-DDD Median N.D. 39Range N.D. ~ 500 4.1 ~ 550
p,p’-DDD Median 730 380Range N.D. ~ 5,000 19 ~ 4,900
o,p’-DDE Median 200 27Range N.D. ~ 1,100 4.8 ~ 210
p,p’-DDE Median 120,000 1,600Range 17,000 ~ 1,000,000 240 ~ 8,200
o,p’-DDT Median 600 66Range N.D. ~ 4,500 8.5 ~ 1,400
p,p’-DDT Median 6,100 300Range 1,100 ~ 29,000 28 ~ 7,600
Chlordane
cis-Chlordane Median 100 490Range N.D. ~ 800 63 ~ 1,400
trans-Chlordane Median N.D. 170Range N.D. ~ 400 41 ~ 800
Oxychlordane Median 10,000 95Range 1,600 ~ 43,000 22 ~ 340
cis-Nonachlor Median 3,700 130Range 600 ~ 29,000 10 ~ 950
trans-Nonachlor Median 23,000 440Range 3,000 ~ 110,000 59 ~ 2,100
Drins
Aldrin Median All N.D. N.D.Range N.D. ~ 5.2
Dieldrin Median 3,200 510Range 1,300 ~ 40,000 71 ~ 1,800
Endrin Median All N.D. 69Range N.D. ~ 200
Hexachlorobenzene (HCB) Median 14,000 630Range 3,400 ~ 39,000 160 ~ 2,100
3-5 POPs survey
□ Table 15-1. Statistics for blood POPs concentrations and the intake of POPs from food (1)
16

The Exposure to chemical compounds in the Japanese People
Chemical compounds Statistics Blood concentrationFY 2011(n=86)
Intake from foodFY 2011(n=15)
Unit pg/g-fat pg/kg bw/day
Heptachlor
Heptachlor Median All N.D. 13Range 4.5 ~ 47
cis-Heptachlor epoxide Median 1,800 110Range 600 ~ 6,500 63 ~ 430
trans-Heptachlor epoxide Median All N.D. All N.D.Range
Toxaphene
parlar-26 Median 790 52Range N.D. ~ 3,500 N.D. ~ 340
parlar-50 Median 1,100 98Range N.D. ~ 4,300 1.5 ~ 550
parlar-62 Median N.D. 73Range N.D. ~ 3,400 N.D. ~ 430
Mirex Median 1,800 14Range 400 ~ 6,600 2.2 ~ 190
PBDE
TeBDEs Median 520 290Range 180 ~ 1,100 160 ~ 1,500
PeBDEs Median 210 150Range N.D. ~ 870 63 ~ 710
HxBDEs Median 800 36Range N.D. ~ 2,600 8.9 ~ 510
HpBDEs Median All N.D. N.D.Range N.D. ~ 40
OcBDEs Median 300 25Range N.D. ~ 3,400 N.D. ~ 110
NoBDEs Median N.D. 36Range N.D. ~ 2,000 N.D. ~ 120
DeBDEs Median 700 230Range N.D. ~ 5,100 72 ~ 980
Total PBDEs Median 2,600 780Range 500 ~ 8,600 530 ~ 3,000
Pentachlorobenzene Median 300 63Range 40 ~ 1,500 31 ~ 220
HCH
α -HCH Median 120 160Range N.D. ~ 1,200 64 ~ 1,000
β -HCH Median 27,000 250Range 2,800 ~ 240,000 48 ~ 2,000
γ -HCH Median N.D. 47Range N.D. ~ 1,000 23 ~ 430
δ -HCH Median All N.D. 14Range 3.7 ~ 29
Chlordecone Median N.D. All N.D.Range N.D. ~ 1.0
Hexabromobiphenyl Median N.D. N.D.Range N.D. ~ 700 N.D. ~ 6.3
Endosulfanα - Endosulfan Median 1,300 570
Range N.D. ~ 3,700 390 ~ 1,300
β - Endosulfan Median N.D. 280Range N.D. ~ 1,200 130 ~ 810
HBCD
α -HBCD Median N.D. N.D.Range N.D. ~ 10 N.D. ~ 9.0
β -HBCD Median All N.D. All N.D.Range
γ -HBCD Median N.D. All N.D.Range N.D. ~ 3.4
δ -HBCD Median All N.D. All N.D.Range
ε -HBCD Median All N.D. All N.D.Range
□ Table 15-2. Statistics for blood POPs concentrations and the intake of POPs from food (2)
17

Committee members for the survey of Human Exposure to Chemical Compounds
Professor, Social and Environmental Medicine Division, Graduate School of Biomedical Sciences, Tokushima University
Professor, University of Kitakyushu Graduate School
Professor, Division of Environmental Medicine, Center for Community Medicine, Jichi Medical University
Senior Principal Researcher, Environmental Measurement Research Center, National Institute for Environmental Studies
Professor, Department of Public Health, Hyogo College of Medicine
Former President, Kansai Medical Technical College
Leader, Center for Health and Environmental Risk Research, National Institute for Environmental Studies
Visiting professor, Faculty of Medicine, University of Tsukuba
Leader, Integrated Health Risk Assessment Section Centre for Environmental Health Sciences, National Institute for Environmental Studies
Professor, Department of Public Health, Saitama Medical University
Professor, Department of Hygiene & Preventive Medicine, Fukushima Medical University
Professor emeritus, Setsunan University
Associate Professor, Graduate School of Frontier Sciences, University of Tokyo
Arisawa, Kokichi.
Kadokami, Kiwao.
Kayama, Fujio.
Shibata, Yasuyuki.
Shima, Masayuki.
Suzuki, Takaichiro.
Suzuki, Noriyuki.
Tohyama, Chiharu.
Nakayama, Shoji.
Nagai, Masaki.
Fukushima, Tetsuhito.
Miyata, Hideaki.
Yoshinaga, Jun.
18
Supplementary Information
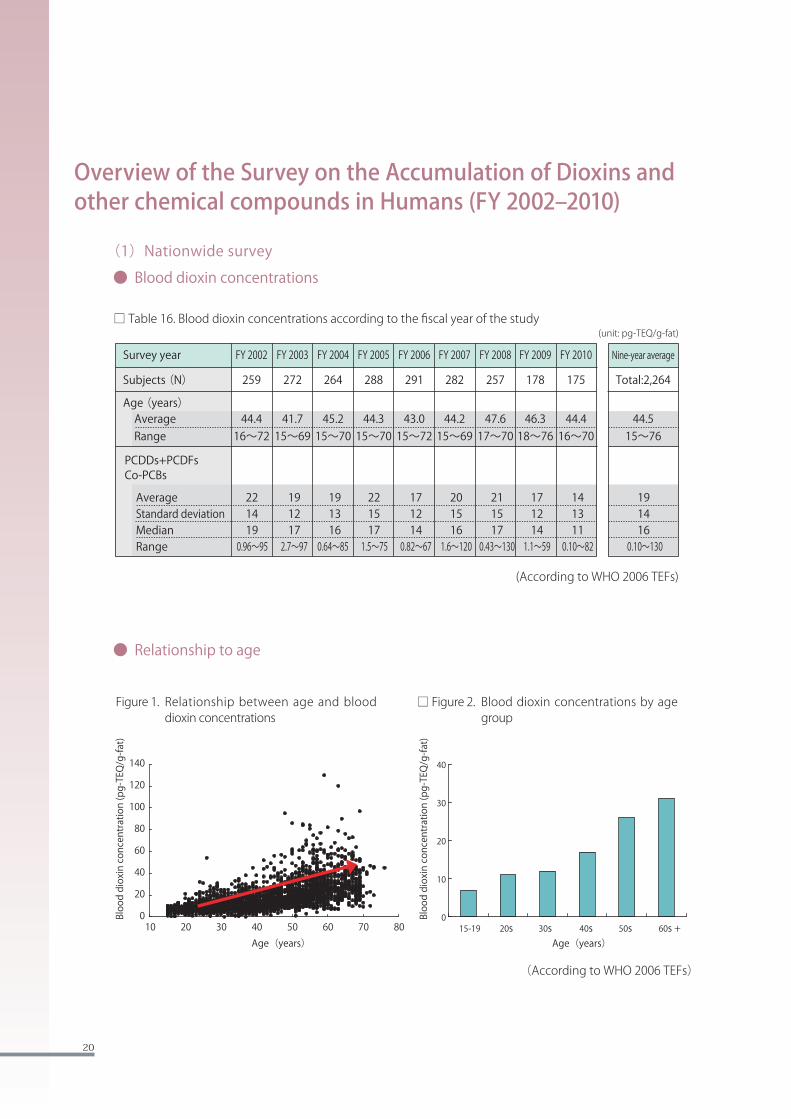
(1)Nationwide survey
● Blood dioxin concentrations
□ Table 16. Blood dioxin concentrations according to the fiscal year of the study(unit: pg-TEQ/g-fat)
● Relationship to age
Figure 1. Relationship between age and blood dioxin concentrations
□ Figure 2. Blood dioxin concentrations by age group
Overview of the Survey on the Accumulation of Dioxins and other chemical compounds in Humans (FY 2002–2010)
PCDDs+PCDFsCo-PCBs
Subjects (N) 259 272 264 288 291 282 257 178 175 Total:2,264
Age (years) Average 44.4 41.7 45.2 44.3 43.0 44.2 47.6 46.3 44.4 44.5 Range 16~72 15~69 15~70 15~70 15~72 15~69 17~70 18~76 16~70 15~76
Average 22 19 19 22 17 20 21 17 14 19 Standard deviation 14 12 13 15 12 15 15 12 13 14 Median 19 17 16 17 14 16 17 14 11 16 Range 0.96~95 2.7~97 0.64~85 1.5~75 0.82~67 1.6~120 0.43~130 1.1~59 0.10~82 0.10~130
Survey year FY 2002 FY 2003 FY 2004 FY 2005 FY 2006 FY 2007 FY 2008 FY 2009 FY 2010 Nine-year average
(According to WHO 2006 TEFs)
Bloo
d di
oxin
con
cent
ratio
n (p
g-TE
Q/g
-fat)
10 20 30 40 50 60 70 800
20
40
60
80
100
120
140
0
10
20
30
40
Age(years)15-19 20s 30s 40s 50s 60s +
Age(years)
Bloo
d di
oxin
con
cent
ratio
n (p
g-TE
Q/g
-fat)
(According to WHO 2006 TEFs)
20
The Exposure to chemical compounds in the Japanese People
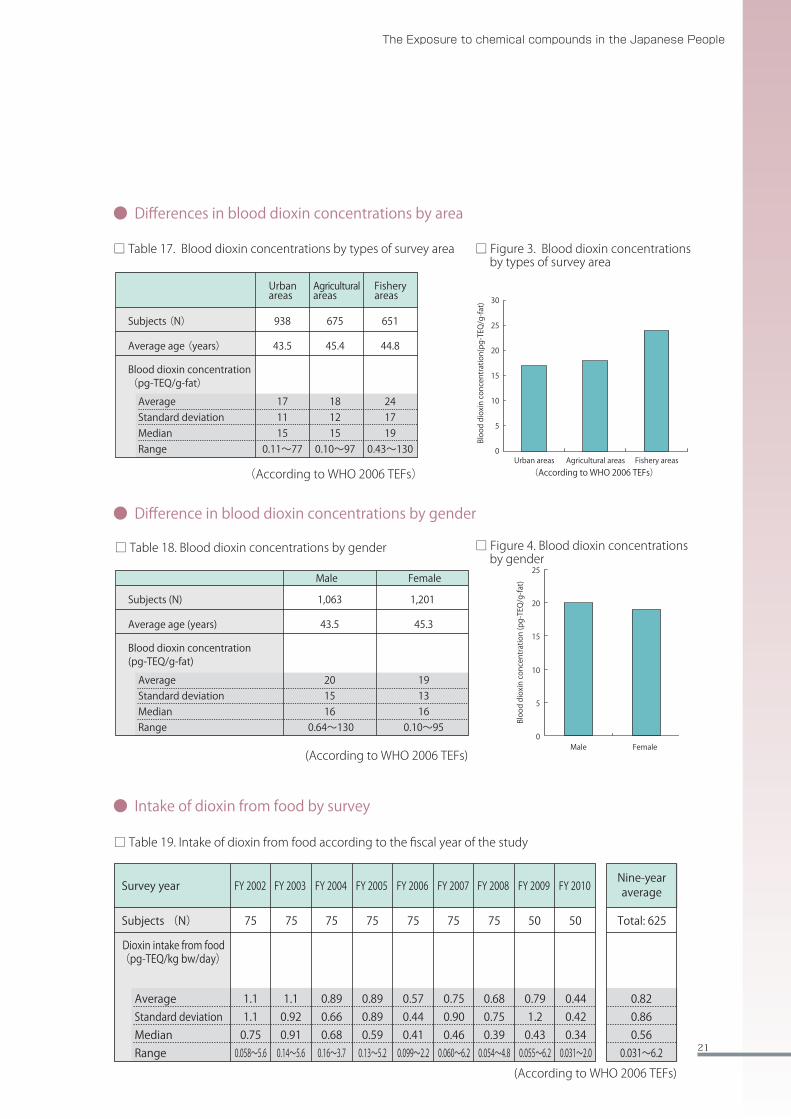
● Differences in blood dioxin concentrations by area
□ Table 17. Blood dioxin concentrations by types of survey area
● Difference in blood dioxin concentrations by gender
□ Table 18. Blood dioxin concentrations by gender
● Intake of dioxin from food by survey
□ Table 19. Intake of dioxin from food according to the fiscal year of the study
Urbanareas
Fishery areas
Agricultural areas
Subjects (N) 938 675 651
Average age (years) 43.5 45.4 44.8
Blood dioxin concentration (pg-TEQ/g-fat)
Average 17 18 24 Standard deviation 11 12 17 Median 15 15 19 Range 0.11~77 0.10~97 0.43~130
Bloo
d di
oxin
con
cent
ratio
n(pg
-TEQ
/g-fa
t)
0
5
10
15
20
25
30
(According to WHO 2006 TEFs)Urban areas Agricultural areas Fishery areas
(According to WHO 2006 TEFs)
Male Female
Subjects (N) 1,063 1,201
Average age (years) 43.5 45.3
Blood dioxin concentration(pg-TEQ/g-fat)
Average 20 19 Standard deviation 15 13 Median 16 16 Range 0.64~130 0.10~95
0
5
10
15
20
25
Male Female
Bloo
d di
oxin
con
cent
ratio
n (p
g-TE
Q/g
-fat)
(According to WHO 2006 TEFs)
Average 1.1 1.1 0.89 0.89 0.57 0.75 0.68 0.79 0.44 0.82 Standard deviation 1.1 0.92 0.66 0.89 0.44 0.90 0.75 1.2 0.42 0.86 Median 0.75 0.91 0.68 0.59 0.41 0.46 0.39 0.43 0.34 0.56 Range 0.058~5.6 0.14~5.6 0.16~3.7 0.13~5.2 0.099~2.2 0.060~6.2 0.054~4.8 0.055~6.2 0.031~2.0 0.031~6.2
Survey year FY 2002 FY 2003 FY 2004 FY 2005 FY 2006 FY 2007 FY 2008 FY 2009 FY 2010Nine-year average
Subjects (N) 75 75 75 75 75 75 75 50 50 Total: 625
Dioxin intake from food (pg-TEQ/kg bw/day)
(According to WHO 2006 TEFs)
Urbanareas
Fishery areas
Agricultural areas
Subjects (N) 938 675 651
Average age (years) 43.5 45.4 44.8
Blood dioxin concentration (pg-TEQ/g-fat)
Average 17 18 24 Standard deviation 11 12 17 Median 15 15 19 Range 0.11~77 0.10~97 0.43~130
Bloo
d di
oxin
con
cent
ratio
n(pg
-TEQ
/g-fa
t)
0
5
10
15
20
25
30
(According to WHO 2006 TEFs)Urban areas Agricultural areas Fishery areas
□ Figure 3. Blood dioxin concentrations by types of survey area
Male Female
Subjects (N) 1,063 1,201
Average age (years) 43.5 45.3
Blood dioxin concentration(pg-TEQ/g-fat)
Average 20 19 Standard deviation 15 13 Median 16 16 Range 0.64~130 0.10~95
0
5
10
15
20
25
Male Female
Bloo
d di
oxin
con
cent
ratio
n (p
g-TE
Q/g
-fat)
□ Figure 4. Blood dioxin concentrations by gender
21

● Differences in the intake of dioxin from food by area
□ Table 20. Intake of dioxin from food by area
□ Figure 6. Relationship between fatty acids and blood dioxin concentrations
● Relationship between blood concentrations and intake from food
□ Figure 7. Relationship between dioxin intake from food and blood dioxin concentrations
Urban areas
Subjects(N) 229 201 195
Average 0.66 0.82 1.0 Standard deviation 0.65 0.86 1.0 Median 0.46 0.53 0.71 Range 0.031~6.2 0.080~5.6 0.054~6.2
Dioxin intake from food(pg-TEQ/kg wg/day)
Agricultural areas
Fishery areas
Dio
xin
inta
ke fr
om fo
od (
pg-T
EQ/k
g/da
y)
0.0
0.2
0.4
0.6
0.8
1.0
1.2
1.4
Urban areas Agricultural areas Fishery areas
(According to WHO 2006 TEFs)
Dihomo-gamma-linolenic acid (DGLA)
Blood DGLA concentration (μg/mL)Blood dioxin concentration (pg-TEQ/g-fat)
Arachidonic acid (AA)
Blood AA concentration (μg/mL)Blood dioxin concentration (pg-TEQ/g-fat)
Eicosapentaenoic acid (EPA)
Blood EPA concentration (μg/mL)Blood dioxin concentration (pg-TEQ/g-fat)
Docosahexaenoic acid(DHA)
Blood DHA concentration (μg/mL)Blood dioxin concentration (pg-TEQ/g-fat)
0 20 40 60 80 100 120 0 100 200 300 400
0 200 400 600 8000 100 200 300 400 500
0
20
40
60
80
100
120
140
0
20
40
60
80
100
120
140
0
20
40
60
80
100
120
140
0
20
40
60
80
100
120
140
0 1 2 3 4 5 6 70
20
40
60
80
100
120
Dioxin intake from food (pg-TEQ/kg wg/day)
Bloo
d di
oxin
con
cent
ratio
n (p
g-TE
Q/g
-fat)
□ Figure 5. Intake of dioxin from food by area
22

The Exposure to chemical compounds in the Japanese People
(2)Follow-up survey
□ Figure 8. Chronological change in blood dioxin concentrations in Nose, Osaka Prefecture
□ Figure 9. Chronological change in blood dioxin concentrations in Saitama Prefecture
Minimum-maximum25%-75%Average
Survey year
Bloo
d di
oxin
con
cent
rati
on (p
g-TE
Q/g
-fat
)
0
20
40
60
80
100
FY 1998 FY 1999 FY 2000 FY 2002 FY 2003 FY 2004 FY 2005 FY 2006 FY 2007
Minimum-maximum25%-75%Average
Survey year
Bloo
d di
oxin
con
cent
rati
on(
pg-T
EQ/g
-fat
)
0
20
40
60
80
100
FY 1998 FY 1999 FY 2000 FY 2002 FY 2003 FY 2004 FY 2005 FY 2006 FY 2007
23
1.Dioxins
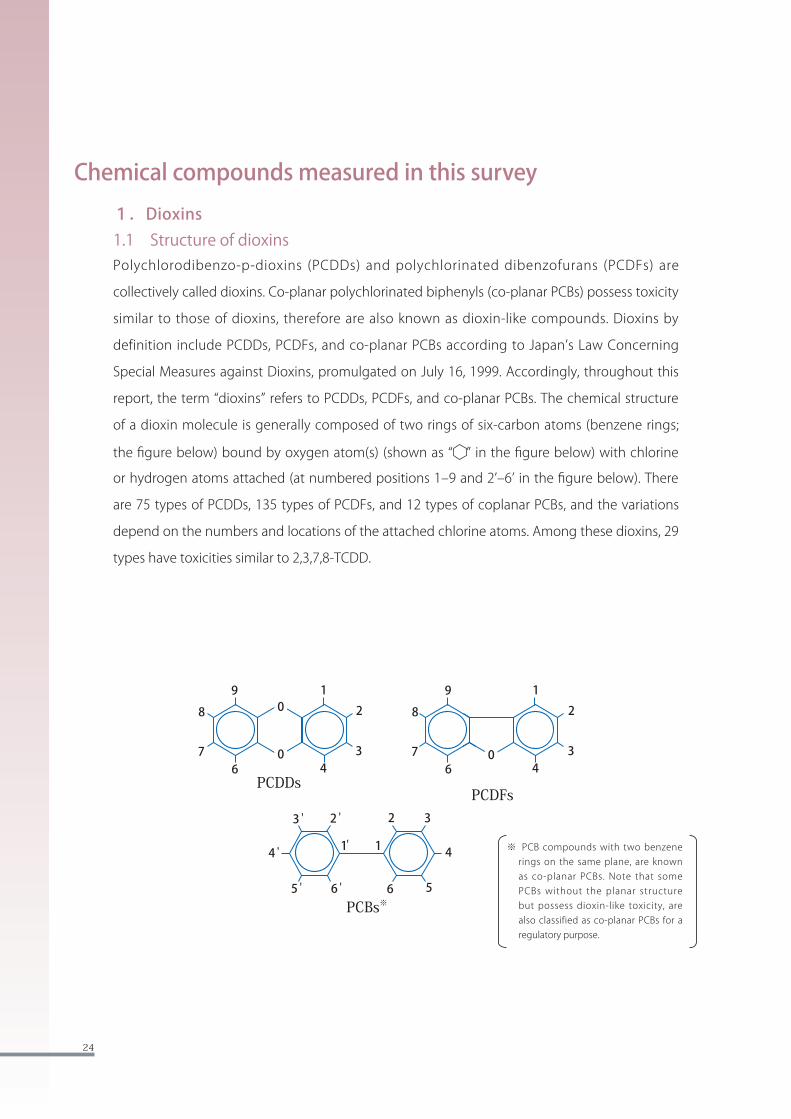
Chemical compounds measured in this survey
1.1 Structure of dioxinsPolychlorodibenzo-p-dioxins (PCDDs) and polychlorinated dibenzofurans (PCDFs) are
collectively called dioxins. Co-planar polychlorinated biphenyls (co-planar PCBs) possess toxicity
similar to those of dioxins, therefore are also known as dioxin-like compounds. Dioxins by
definition include PCDDs, PCDFs, and co-planar PCBs according to Japan’s Law Concerning
Special Measures against Dioxins, promulgated on July 16, 1999. Accordingly, throughout this
report, the term “dioxins” refers to PCDDs, PCDFs, and co-planar PCBs. The chemical structure
of a dioxin molecule is generally composed of two rings of six-carbon atoms (benzene rings;
the figure below) bound by oxygen atom(s) (shown as “ ” in the figure below) with chlorine
or hydrogen atoms attached (at numbered positions 1–9 and 2’–6’ in the figure below). There
are 75 types of PCDDs, 135 types of PCDFs, and 12 types of coplanar PCBs, and the variations
depend on the numbers and locations of the attached chlorine atoms. Among these dioxins, 29
types have toxicities similar to 2,3,7,8-TCDD.
PCB compounds with two benzene rings on the same plane, are known as co-planar PCBs. Note that some PCBs without the planar structure but possess dioxin-like toxicity, are also classified as co-planar PCBs for a regulatory purpose.
※
24
The Exposure to chemical compounds in the Japanese People
1.2 Properties of dioxinsDioxins are generally colorless solids of very low water solubility and low vapor pressure, but
characteristically exhibit a high degree of solubility in fats and oils. They are generally stable,
do not react easily with other compounds, acids, and alkalis, and are considered to decompose
gradually in the presence of solar ultraviolet light.
1.3 Dioxin toxicityCarcinogenicity and chronic toxicity are health risks posed by dioxins. In rats, dioxins have been
reported to show carcinogenicity, such as the production of hepatocellular carcinoma, follicular
adenoma of the thyroid, lymphoma, and other cancers. Dioxins are known to act as promoters
for the carcinogenic mechanism; that is, dioxins do not act directly on genes, instead they
promote the carcinogenic activity of other carcinogens. At present, the International Agency
for Research on Cancer (IARC) and the World Health Organization (WHO) have classified 2,3,7,8-
TCDD as a human carcinogen. In terms of hepatotoxicity, it is recognized to cause elevated
liver enzymes and hyperlipidemia. However, for assessing the consequences of dioxin exposure
during fetal stages, reproductive organ toxicity, central nervous system toxicity, and immune
system toxicity received attentions when the WHO reevaluated the risks of dioxins and related
compounds in 1998, as well as risk assessments that are being conducted both nationally and
internationally. Shortened anogenital distance in males, congenital abnormalities in vagina,
diminished learning ability, diminished resistance to viral infection, and other outcomes in
laboratory animals. At present, the effects of dioxins are widely recognized to develop due to
endocrine disruption through the arylhydrocarbon receptor (AhR) within cells. However, further
studies are required because there is limited data available regarding the appearance of these
diverse toxicities.
25
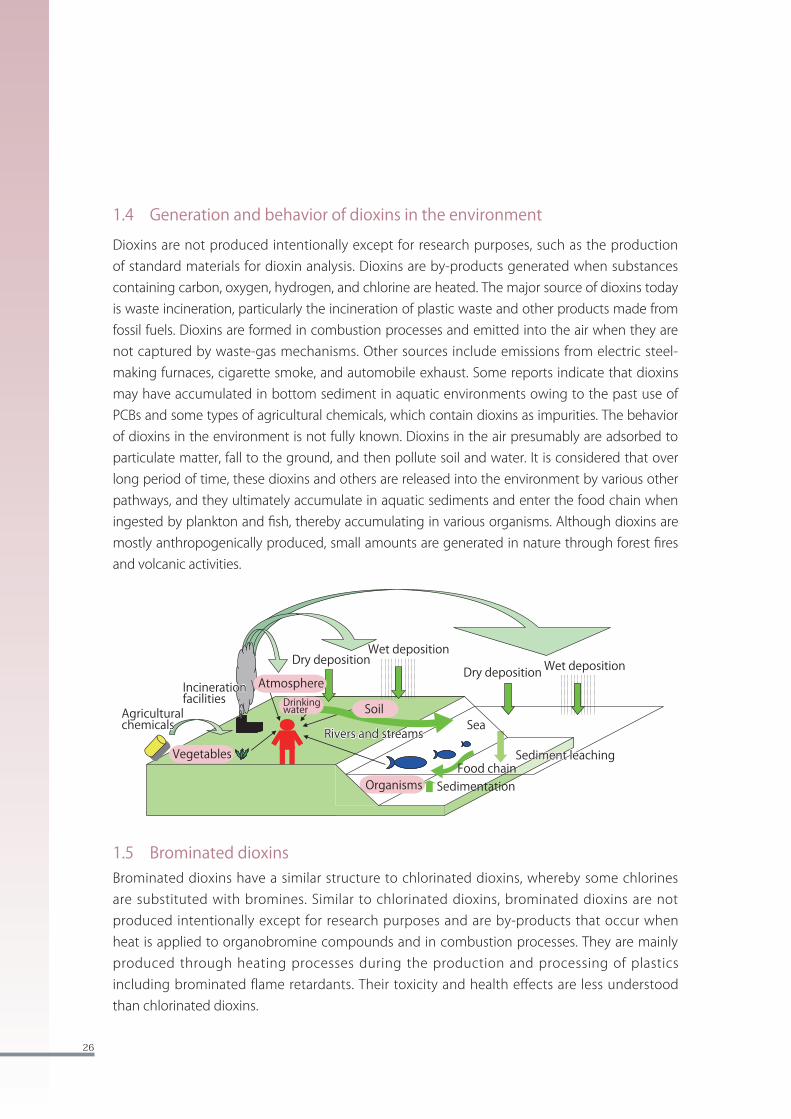
1.4 Generation and behavior of dioxins in the environment
Dioxins are not produced intentionally except for research purposes, such as the production of standard materials for dioxin analysis. Dioxins are by-products generated when substances containing carbon, oxygen, hydrogen, and chlorine are heated. The major source of dioxins today is waste incineration, particularly the incineration of plastic waste and other products made from fossil fuels. Dioxins are formed in combustion processes and emitted into the air when they are not captured by waste-gas mechanisms. Other sources include emissions from electric steel-making furnaces, cigarette smoke, and automobile exhaust. Some reports indicate that dioxins may have accumulated in bottom sediment in aquatic environments owing to the past use of PCBs and some types of agricultural chemicals, which contain dioxins as impurities. The behavior of dioxins in the environment is not fully known. Dioxins in the air presumably are adsorbed to particulate matter, fall to the ground, and then pollute soil and water. It is considered that over long period of time, these dioxins and others are released into the environment by various other pathways, and they ultimately accumulate in aquatic sediments and enter the food chain when ingested by plankton and fish, thereby accumulating in various organisms. Although dioxins are mostly anthropogenically produced, small amounts are generated in nature through forest fires and volcanic activities.
1.5 Brominated dioxinsBrominated dioxins have a similar structure to chlorinated dioxins, whereby some chlorines are substituted with bromines. Similar to chlorinated dioxins, brominated dioxins are not produced intentionally except for research purposes and are by-products that occur when heat is applied to organobromine compounds and in combustion processes. They are mainly produced through heating processes during the production and processing of plastics including brominated flame retardants. Their toxicity and health effects are less understood than chlorinated dioxins.
Sea
Dry depositionDry deposition
Wet depositionWet deposition
Rivers and streams
Organisms Sedimentation
Sediment leaching
Rivers and streams
Sediment leachingFood chain
SoilAgricultural chemicalsAgricultural chemicals
Incineration facilitiesIncineration facilities
Atmosphere
Vegetables
Drinking water
26
The Exposure to chemical compounds in the Japanese People
2.Organic fluorine compoundsPFOS and PFOA are organic fluorine compounds that have fluoride atom(s) bound to carbon. Carbon and fluoride are strongly bound to each other, and the compounds are highly resistant to heat and chemicals. These compounds have been used widely as “surfactants” because they are readily soluble in oil and water, and are used in water-repellent sprays, foam fire extinguishers, and until very recently, in coatings of nonstick frying pans. However, it has been reported that they are resistant to decomposition in the environment and in living organisms, and that they have substantial bioaccumulation properties. PFOS is listed as a POPs in the Stockholm Convention on Persistent Organic Pollutants. In the present survey, organic fluorine compounds including PFOS and PFOA were studied in blood and food.
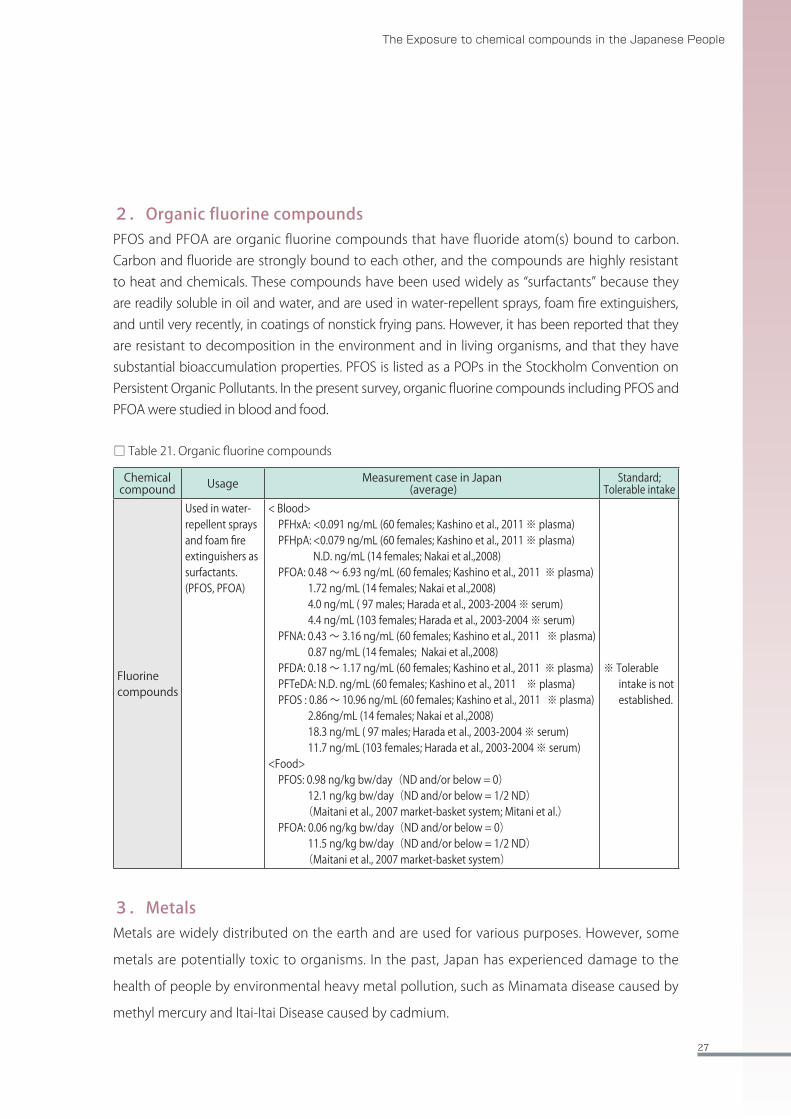
□ Table 21. Organic fluorine compounds
Chemical compound Usage Measurement case in Japan
(average)Standard;
Tolerable intake
Fluorine compounds
Used in water-repellent sprays and foam fire extinguishers as surfactants.(PFOS, PFOA)
< Blood> PFHxA: <0.091 ng/mL (60 females; Kashino et al., 2011 ※ plasma) PFHpA: <0.079 ng/mL (60 females; Kashino et al., 2011 ※ plasma) N.D. ng/mL (14 females; Nakai et al.,2008) PFOA: 0.48 ~ 6.93 ng/mL (60 females; Kashino et al., 2011 ※ plasma) 1.72 ng/mL (14 females; Nakai et al.,2008) 4.0 ng/mL ( 97 males; Harada et al., 2003-2004 ※ serum) 4.4 ng/mL (103 females; Harada et al., 2003-2004 ※ serum) PFNA: 0.43 ~ 3.16 ng/mL (60 females; Kashino et al., 2011 ※ plasma) 0.87 ng/mL (14 females; Nakai et al.,2008) PFDA: 0.18 ~ 1.17 ng/mL (60 females; Kashino et al., 2011 ※ plasma) PFTeDA: N.D. ng/mL (60 females; Kashino et al., 2011 ※ plasma) PFOS : 0.86 ~ 10.96 ng/mL (60 females; Kashino et al., 2011 ※ plasma) 2.86ng/mL (14 females; Nakai et al.,2008) 18.3 ng/mL ( 97 males; Harada et al., 2003-2004 ※ serum) 11.7 ng/mL (103 females; Harada et al., 2003-2004 ※ serum)<Food> PFOS: 0.98 ng/kg bw/day(ND and/or below = 0) 12.1 ng/kg bw/day(ND and/or below = 1/2 ND) (Maitani et al., 2007 market-basket system; Mitani et al.) PFOA: 0.06 ng/kg bw/day(ND and/or below = 0) 11.5 ng/kg bw/day(ND and/or below = 1/2 ND) (Maitani et al., 2007 market-basket system)
※ Tolerable intake is not established.
3.MetalsMetals are widely distributed on the earth and are used for various purposes. However, some
metals are potentially toxic to organisms. In the past, Japan has experienced damage to the
health of people by environmental heavy metal pollution, such as Minamata disease caused by
methyl mercury and Itai-Itai Disease caused by cadmium.
27

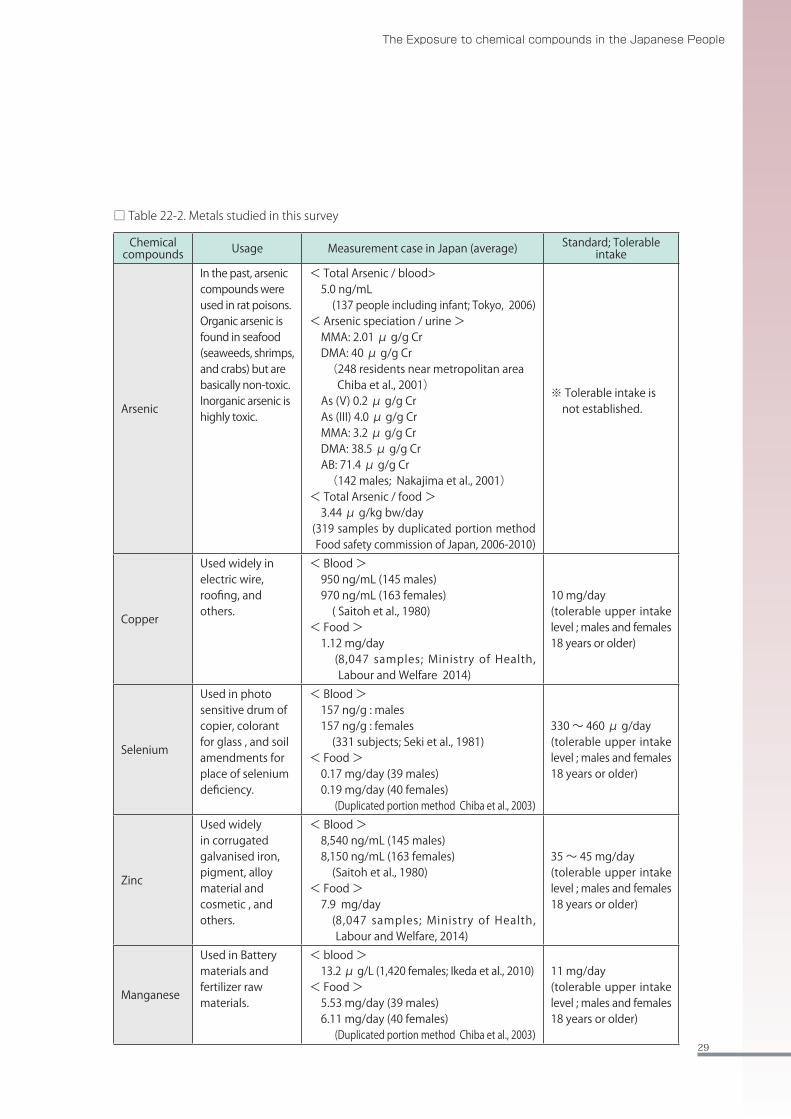
□ Table 22-1. Metals studied in this survey
Chemical compounds Usage Measurement case in Japan (average) Standard; Tolerable
intake
Totalmercury/Methyl mercury
Metal mercury is used in fluorescent lights, amalgam, batteries, catalysts, and others. Methyl mercury is produced by methylation of metal mercury.Methyl mercuryhave higher toxicity.
< Total mercury / blood > 5.4 ng/mL (600 mothers; Shimada et al., 2008) 5.18 ng/mL (115 mothers; Sakamoto et al., 2007) 18.2 ng/mL (56 females; Yamauchi et al., 1994)< Total mercury / food > 0.225 μ g/kg bw/day ( Tokyo, 2005; 10 samples by duplicated portion method) 0.17 μ g/kg bw/day (Tokyo, 2014 market-basket system)< Methyl mercury / food > 0.198 μ g/kg bw/day (Tokyo, 2005; 10 samples by duplicated portion method) 0.13 μ g/kg bw/day (Tokyo, 2014; market-basket method)
< Methyl mercury >2.0 μg/kg bw/week
Lead
Used widely inelectrodes, weight,glass products ,solder, and others.
< Blood > 10.7 ng/mL ( 352 people:1-15 years ;Yoshinaga et al.,
2008-1010) 13 ng/mL (137 people including infant; Tokyo, 2006)< Food > 0.129 μ g/kg bw/day ( 319 samples by duplicated portion
method; Food safety commission of Japan, 2006-2010)
0.18 μ g/kg bw/day (Tokyo, 2014; maket-basket method)
※ Tolerable intake is not established.
Cadmium
Used in watchbatteries, platingmaterials , andothers. Cadmiumis produced andrecovered duringthe zinc refineryprocess.
<Blood> 2.54 μ g/L (1243 females; kayama et al., 2010-2011)< Urine > 3.46 μ g/g Cr (1243 females; Kayama et al., 2000 – 2001) 1.26 μ g/g Cr (10753 females; Ikeda et al., 2000 – 2001)< Food > 0.320 μ g/kg bw/day ( Tokyo, 2005 10 samples by duplicated
portion method) 0.34 μ g/kg bw/day (Tokyo, 2014; market-basket method)
7 μ g/kg bw/week
28
The Exposure to chemical compounds in the Japanese People
□ Table 22-2. Metals studied in this survey
Chemical compounds Usage Measurement case in Japan (average) Standard; Tolerable
intake
Arsenic
In the past, arseniccompounds wereused in rat poisons.Organic arsenic isfound in seafood(seaweeds, shrimps,and crabs) but arebasically non-toxic.Inorganic arsenic ishighly toxic.
< Total Arsenic / blood> 5.0 ng/mL (137 people including infant; Tokyo, 2006)< Arsenic speciation / urine > MMA: 2.01 μ g/g Cr DMA: 40 μ g/g Cr ( 248 residents near metropolitan area Chiba et al., 2001) As (V) 0.2 μ g/g Cr As (III) 4.0 μ g/g Cr MMA: 3.2 μ g/g Cr DMA: 38.5 μ g/g Cr AB: 71.4 μ g/g Cr (142 males; Nakajima et al., 2001)< Total Arsenic / food > 3.44 μ g/kg bw/day ( 319 samples by duplicated portion method
Food safety commission of Japan, 2006-2010)
※ Tolerable intake is not established.
Copper
Used widely in electric wire, roofing, and others.
< Blood > 950 ng/mL (145 males) 970 ng/mL (163 females) ( Saitoh et al., 1980)< Food > 1.12 mg/day ( 8,047 samples; Ministry of Health,
Labour and Welfare 2014)
10 mg/day(tolerable upper intake level ; males and females 18 years or older)
Selenium
Used in photo sensitive drum of copier, colorant for glass , and soil amendments forplace of seleniumdeficiency.
< Blood > 157 ng/g : males 157 ng/g : females (331 subjects; Seki et al., 1981)< Food > 0.17 mg/day (39 males) 0.19 mg/day (40 females) ( Duplicated portion method Chiba et al., 2003)
330 ~ 460 μ g/day(tolerable upper intake level ; males and females 18 years or older)
Zinc
Used widely in corrugated galvanised iron, pigment, alloy material and cosmetic , and others.
< Blood > 8,540 ng/mL (145 males) 8,150 ng/mL (163 females) (Saitoh et al., 1980)< Food > 7.9 mg/day ( 8,047 samples; Ministry of Health,
Labour and Welfare, 2014)
35 ~ 45 mg/day(tolerable upper intake level ; males and females 18 years or older)
Manganese
Used in Batterymaterials andfertilizer rawmaterials.
< blood > 13.2 μ g/L (1,420 females; Ikeda et al., 2010)< Food > 5.53 mg/day (39 males) 6.11 mg/day (40 females) ( Duplicated portion method Chiba et al., 2003)
11 mg/day(tolerable upper intake level ; males and females 18 years or older)
29
4.Other chemical compounds (including pesticides and plasticizers)
□ Table 23-1. Pesticides, plasticizers, and others studied in this survey
Chemical compound Usage Measurement case in Japan
(average)Hydroxylated PCB
Metabolite of PCB. < Blood > 120 pg/g ( 128 pregnant women; Hisada et al., 2009-2011)
Phthalatemonoesters
Used as plasticizer in plastic, adhesiveagents, and others.
< Urine > MBP : 52.2 μ g/g Cr (48.1 ng/mL) MEHP : 5.84 μ g/g Cr (4.44 ng/mL) MEHHP :10.1 μ g/g Cr (8.61 ng/mL) MEOHP :11.0 μ g/g Cr (9.2 ng/mL) MBzP : 4.70 μ g/g Cr (3.46 ng/mL) (149 pregnant women; Suzuki et al., 2010)
※ median
Bisphenol A
Used as monomer or ingredients in plastic manufacturing.
< Urine > N.D. μ g/g Cr (39 out of 56 pregnant women) 1.7 μ g/g Cr( median ; 17 out of 56 pregnant women) ( Fujimaki et al., 2003)
Organophosphorous compound metabolites
Used in pesticides, disinfectant, woodpreservatives, and others (metaboliteswere measured).
< Urine > DMP :1.5 μ g/L(73 subjects, Toyama) :3.1 μ g/L(60 subjects, Tokyo) DMTP :3.2 μ g/L(73 subjects, Toyama) :5.8 μ g/L(60 subjects, Tokyo) DEP :0.8 μ g/L(73 subjects, Toyama) :1.2 μ g/L(60 subjects, Tokyo) DETP :<0.5 μ g/L(73 subjects, Toyama) :<0.5 μ g/L(60 subjects, Tokyo) (Nakazaki et al.,)
Pyrethroid pesticidemetabolites
Used in pesticides, insecticides, andothers (metabolites were measured).
< Urine > PBA:0.40 μ g/g Cr (42 males Toshima et al., 2010) PBA:0.73 μ g/g Cr (448 subjects; Ueyama et al., 2009)
Carbamate pesticidemetabolites
Used in pesticides, insecticides, andothers (metabolites were measured). -
Triclosan Used as disinfectant -
AcephateA type of organophosphorus pesticides.Used widely as pesticides and insecticides, known as “Orthoran”.
-
MethamidophosA type of organophosphoruspesticide. Used as pesticides and insecticides (banned to use in Japan).
-
Imidachlopridmetabolite
Metabolite of neonicotinoidpesticide. -
Fenitrothionmetabolite
Metabolite of fenitrothion. -
p-nitrophenol Metabolite of pesticides. -Deet Used as mosquito and mite repellent. -
30

The Exposure to chemical compounds in the Japanese People
□ Table 23-2. Pesticides, plasticizers, and others studied in this surv
Chemical compound Usage Measurement case in Japan
(average)
Parabens
Used as antiseptic (antibacterial) agent in food, medicine, cosmetics, etc.
< Urine > Methylparaben : 109 μ g/g Cr Ethylparaben : 8.0 μ g/g Cr Propylparaben : 33.5 μ g/g Cr Butylparaben : 0.743 μ g/g Cr ( 111 pregnant women; Shirai et al., 2007-
2010) ※ median
Iodine
Essential element for human and is the main component of thyroid hormone.Found abundantly in sea weeds.Deficiency causes hyperthyroidism, but excessive intake also causes thyroid abnormalities as well.
< Urine > 259.5 μ g/g Cr ( 622 pregnant women; Orito et al., 2005-
2006) ※ median
Perchloric acid
Has strong oxidizing effect. Used as analytical chemistry reagent, metal/ alloy/ mineral ore solvent, organic synthesis catalysis, and as manufacturing material of perchloric acid and its derivatives.
-
PAHs metabolitesMetabolite of PAHs, found mainly as mixtures in tar, crude oil, and in petroleum.
< Urine > 1-Hydoroxypyrene :124 μ g/g Cr (149 pregnant women; Suzuki et al., 2010) ※ median
Cotinine
Metabolite of nicotine found in tobacco.
< Urine > 16 μ g/g Cr( smoking parents) 12 μ g/g Cr (Only the mother smokes) 3 μ g/g Cr (only the father smokes) 1 μ g/g Cr (non-smoking parents) ( 927 three year old children; Tateishi et al.) 3,048 μ g/g Cr (smoking) 28.7 μ g/g Cr (non-smoking and passive smoking) 33.9 μ g/g Cr (non-smoking and non- passive smoking) ( 504 adults; Sakanashi et al., 2009)
8-OHdG 8-OHdG is generated when DNA is exposed to UV, radiation, and/or chemical substances.
< Urine > 15.4 μ g/g Cr (248 healthy people; Yamauchi et al., 2002)
CaffeineNaturally derived organic compound found abundantly in coffee, tea, and chocolate. -
Benzophenone-3Used in sunscreen cosmetics due to its ultraviolet absorption effect. -
Phytoestrogens
Found abundantly in leguminous plants (bean plants) such as soy beans, and act as female hormone .
< Urine > Daizein: 1,000 μ g/g Cr Genistein: 860 μ g/g Cr (80 adult women; Tsukane et al.)
5.POPsPOPs is the abbreviation of Persistent Organic Pollutants and have the following properties: 〇 they remain intact for exceptionally long period of time, 〇 they accumulate in bodies of organisms, 〇 they can be transported long distances and are widely distributed on the earth, 〇 they have toxic effects within organisms.
31

The Stockholm Convention on Persistent Organic Pollutants is an international treaty. Initially, 12 POPs were recognized, which has now added up to 22. These compounds include those produced and used intentionally as pesticides and others. On the other hand, there are compounds like dioxins, which could be produced in the process of combustion or manufacturing of other chemicals. In the Convention, each member State is to prohibit the production, use, import and export of POPs, and to take every measure possible to eliminate and reduce the unintentional production of compounds. Furthermore, each member State is encouraged to undertake measures for POPs under the Stockholm Convention. Considering this, monitoring surveys on the environment and biological samples are conducted by Ministry of the Environment, Japan. In the present survey, all POPs listed in the Stockholm Convention were measured in blood and food.
□ Table 24. POPs studied in this survey
Chemical compounds Usage
Dioxins Produced unintentionally due to combustion, as well as during the manufacture of chlorinated substances
PCBs Used as heat exchange fluids, in electric transformers, and as additives in carbonless copy papers and such
DDT Used as hygiene pesticides and insecticides
Chlordane Used to control termites and as pesticides
Aldrin Used as pesticides
Dieldrin Used as pesticides, insecticides, and termite control
Endrin Used as pesticides
Hexachlorobenzene (HCB) Used as material for herbicide manufacturing
Heptachlor Used as pesticide and termite control
Toxaphene Used as pesticides overseas
Mirex Used as pesticides overseas
PBDE Used as fire-retardant
Pentachlorobenzene Used as chemical intermediate of agricultural fungicides
HCH Used as pesticides
Chlordecone Used as insecticides overseas
Hexabromobiphenyl Used as fire-retardant
Endosulfan Used as pesticides and insecticides
HBCD Used as fire-retardant
32
The Exposure to chemical compounds in the Japanese People
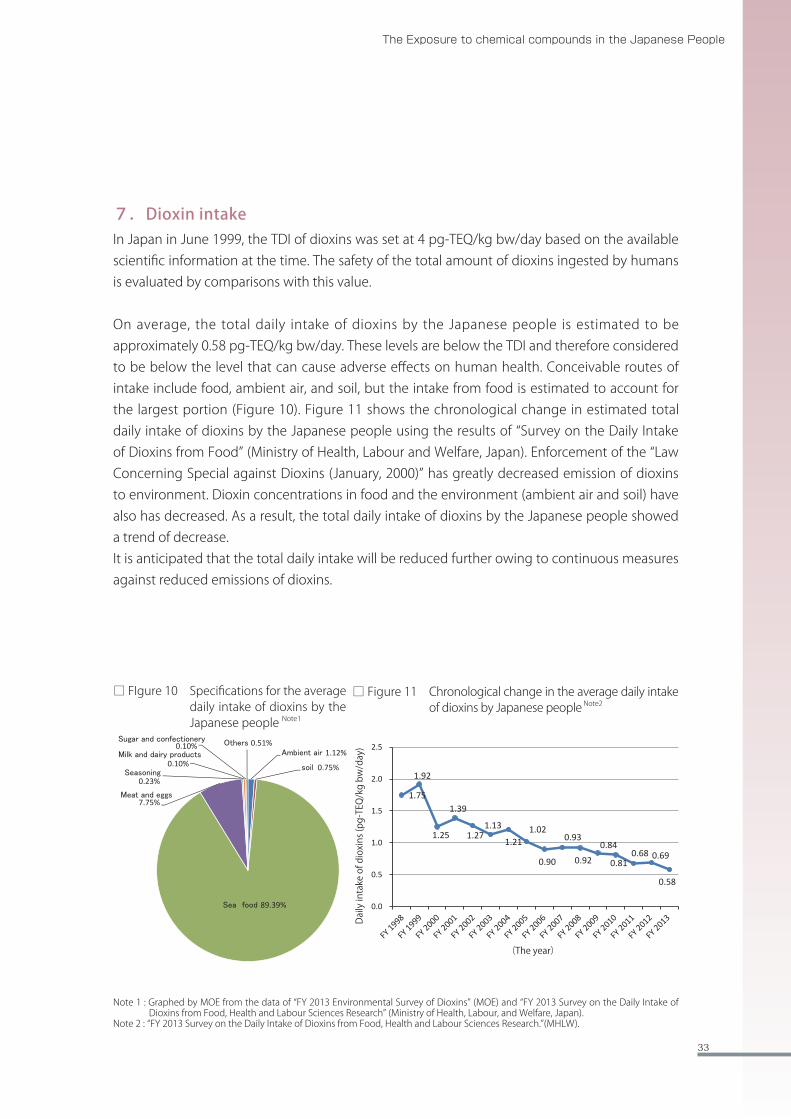
7.Dioxin intakeIn Japan in June 1999, the TDI of dioxins was set at 4 pg-TEQ/kg bw/day based on the available scientific information at the time. The safety of the total amount of dioxins ingested by humans is evaluated by comparisons with this value.
On average, the total daily intake of dioxins by the Japanese people is estimated to be approximately 0.58 pg-TEQ/kg bw/day. These levels are below the TDI and therefore considered to be below the level that can cause adverse effects on human health. Conceivable routes of intake include food, ambient air, and soil, but the intake from food is estimated to account for the largest portion (Figure 10). Figure 11 shows the chronological change in estimated total daily intake of dioxins by the Japanese people using the results of “Survey on the Daily Intake of Dioxins from Food” (Ministry of Health, Labour and Welfare, Japan). Enforcement of the “Law Concerning Special against Dioxins (January, 2000)” has greatly decreased emission of dioxins to environment. Dioxin concentrations in food and the environment (ambient air and soil) have also has decreased. As a result, the total daily intake of dioxins by the Japanese people showed a trend of decrease. It is anticipated that the total daily intake will be reduced further owing to continuous measures against reduced emissions of dioxins.
Ambient air 1.12%
soil 0.75%
Sea food 89.39%
Meat and eggs7.75%
Seasoning0.23%
Milk and dairy products0.10%
Sugar and confectionery0.10% Others 0.51%
□ FIgure 10 Specifications for the average daily intake of dioxins by the Japanese people Note1
Note 1 : Graphed by MOE from the data of “FY 2013 Environmental Survey of Dioxins” (MOE) and “FY 2013 Survey on the Daily Intake of Dioxins from Food, Health and Labour Sciences Research” (Ministry of Health, Labour, and Welfare, Japan).
Note 2 : “FY 2013 Survey on the Daily Intake of Dioxins from Food, Health and Labour Sciences Research.”(MHLW).
□ Figure 11 Chronological change in the average daily intake of dioxins by Japanese people Note2
FY 1998
FY 1999
FY 2000
FY 2001
FY 2002
FY 2003
FY 2004
FY 2005
FY 2006
FY 2007
FY 2008
FY 2009
FY 2010
FY 2011
FY 2012
FY 2013Da
ily in
take
of d
ioxin
s (pg
-TEQ
/kg
bw/d
ay)
(The year)
1.75
1.92
1.25
1.39
1.27 1.13
1.21 1.02
0.90
0.93
0.92
0.84
0.81 0.68 0.69
0.58
0.0
0.5
1.0
1.5
2.0
2.5
33

2016 Environmental Risk Assessment Office,Environmental Health Department,Ministry of the Environment, Japan
Environmental Risk Assessment Office,Environmental Health Department,Ministry of the Environment, Japan
Please address opinions and inquiries to:
1-2-2 Kasumigaseki, Chiyoda-ku, Tokyo 100-8975 JAPANTel (main) : +81-3-3581-3351 (extension 6343)Tel (direct): +81-3-5521-8262Fax: +81-3-3581-3578http://www.env.go.jp/en
The Exposure tochemical compounds in the Japanese People
The Exposure to chemical compounds in the Japanese People
- Survey of the Exposure to chemical compounds
in Human (2011~) -