the extrahop stream analytics platform · enabling data integration with complementary technologies...
TRANSCRIPT
© 2016 by The Enterprise Strategy Group, Inc. All Rights Reserved.
Wire Data for the Real-time Enterprise
By Mike Leone, Senior ESG Lab Analyst May 2016 This ESG Lab Report was commissioned by ExtraHop and is distributed under license from ESG.
Enterprise Strategy Group | Getting to the bigger truth.™
ESG Lab Validation
The ExtraHop Stream Analytics Platform

Lab Validation Report: The ExtraHop Stream Analytics Platform: Wire Data for the Real-time Enterprise 2
© 2016 by The Enterprise Strategy Group, Inc. All Rights Reserved.
Contents
Introduction .......................................................................................................................................................................... 3
Methodology .................................................................................................................................................................... 3
Background ....................................................................................................................................................................... 4
The ExtraHop Platform ..................................................................................................................................................... 5
ESG Lab Validation
Deployment, Discovery, and Analysis ............................................................................................................................... 6
Granularity, Extensibility, and Integration ........................................................................................................................ 9
Performance and Cost Analysis ...................................................................................................................................... 13
ESG Lab Validation Highlights ............................................................................................................................................. 17
Issues to Consider ............................................................................................................................................................... 17
The Bigger Truth ................................................................................................................................................................. 18
ESG Lab Reports
The goal of ESG Lab reports is to educate IT professionals about data center technology products for companies of all types and sizes. ESG Lab reports are not meant to replace the evaluation process that should be conducted before making purchasing decisions, but rather to provide insight into emerging technologies and prescriptive guidance on the evaluation criteria for end-users. Our objective is to test, review, and validate the top features and functions of products, show how they can be used to solve real customer problems, and identify any areas needing improvement. ESG Lab's expert third-party perspective is based on our own hands-on testing as well as on interviews with customers who use these products in production environments.

Lab Validation Report: The ExtraHop Stream Analytics Platform: Wire Data for the Real-time Enterprise 3
© 2016 by The Enterprise Strategy Group, Inc. All Rights Reserved.
Introduction
This ESG Lab Validation documents our hands-on testing of the ExtraHop platform with the objective of assessing and
highlighting key factors required for a next-generation IT Operations Analytics (ITOA) platform. We tested the speed and
ease of deployment, auto-discovery functions, the efficacy of real-time processing and analysis of a wide range of network
and application protocols. This includes payload extraction and analysis, and the type of granular insight that can be
derived from analyzing all data-in-flight. ESG Lab evaluated the ease of use, simplicity, and intuitiveness of the user
interface for analytics and the simplicity of integrating ExtraHop’s wire data with 3rd party and open data stores. For the
final step, ESG Lab tested ExtraHop’s claims of 40 Gbps of continuous stream analysis and performed a market price
comparison to determine platform value.
Methodology
ESG Lab conducted a functional validation of the ExtraHop platform across five key categories as shown in Table 1.
TABLE 1. Test Categories and Goals of Testing
Test Category Goals of Testing
Deployment Assessing time for setup and configuration determines time to value and provides insight into ongoing maintenance efforts and long-term costs.
Discovery, Classification, and Mapping Discovering, classifying, and mapping the environment with minimal manual intervention enables higher levels of productivity, which is essential in today’s dynamic environments.
Breadth and Granularity Understanding the breadth, depth, and real-time nature of the platform ensures it will meet current needs, while being able to quickly and easily adapt to the future needs of the business.
Extensibility and Integration Assessing the extensibility of the platform for customization purposes, while enabling data integration with complementary technologies supports open “big data” initiatives eliminating isolated solutions and vendor dependencies.
Performance and Price Maintaining functionality at scale while continuing to meet mission-critical SLAs, directly impacts short- and long-term costs.

Lab Validation Report: The ExtraHop Stream Analytics Platform: Wire Data for the Real-time Enterprise 4
© 2016 by The Enterprise Strategy Group, Inc. All Rights Reserved.
Background
As organizations look to become more data-driven, they must improve IT processes and workflows. This challenge includes
reconsidering IT strategies and evaluating new technologies that can enable informed decisions faster. The network is an
essential element for any IT organization. Whether it be the internal network used for communication and collaboration,
the external network that handles mission-critical applications, or public cloud networks that are running workloads and
micro-services, the network is the one common element that is shared regardless of technologies. The same is true for
most businesses - the network is where all business transacts. It is perhaps the richest source of empirical data from your
environment available today, but mining it in real time for meaningful insights has been difficult to achieve.
With businesses understanding the importance and potential of the networking infrastructure, it is not surprising that most
organizations leverage network performance monitoring and diagnostic tools. But what they may not understand is that
their network holds more than network data, which legacy NPM tools cannot access. According to recent ESG research,
there are a number of tools leveraged by organizations to get network visibility.1 As shown in Figure 1, the highest
percentage of respondents leverage event and log data analysis tools, along with in-house custom tools and packet probe
analysis. One thing is clear: no single tool covers everything. Therefore, complementary tools are deployed together to
collect and analyze varying levels of information depending on the business unit, applications, security requirements, and
degree of business importance.
FIGURE 1. Tools Leveraged for Network Performance Monitoring and Diagnostics
Source: Enterprise Strategy Group, 2016
Of course, the more tools that are deployed, the more complexity. Aside from collecting duplicate information, each tool
requires a different management interface to access the data and are often used by different IT teams, making
collaboration and rapid decision making difficult. Then comes the complexity of attempting to unify different data sets to
provide a single view for uncovering insight into user, network, infrastructure, and application behavior. ESG research
shows that nearly one in four organizations find that there are too many tools that are required to monitor different tasks
or domains preventing a “single view” of information.2 This can lead to unproductive behavior between teams, increased
risks, and poor investment decisions due to a lack of unified visibility and insight.
1 Source: ESG Research Report, Trends in Data Center Networking, February 2016. 2 ibid.
50%
51%
54%
55%
58%
58%
59%
Network Packet Broker
SNMP
Open source tools
Vendor custom
Packet probe analysis
In-house custom tools
Event and log data analysis
Which of the following technologies does your organization leverage for network performance monitoring and diagnostics? (Percent of respondents, N=306)

Lab Validation Report: The ExtraHop Stream Analytics Platform: Wire Data for the Real-time Enterprise 5
© 2016 by The Enterprise Strategy Group, Inc. All Rights Reserved.
The ExtraHop Platform
The ExtraHop platform delivers real-time wire data analytics through the use of a non-invasive, agentless architecture that
processes all streams of data between all clients and systems. ExtraHop can observe, analyze, classify, index, store, and
visualize all traffic, including network, application, and business transactions, passively through a SPAN port or Tap. That
traffic is converted to structured and searchable wire data. ExtraHop enables organizations to gain deep levels of insight
through comprehensive, cross-tier visibility of their networking, application, and client infrastructure without impacting
data workflows. And this is all delivered from a single appliance at a wire speed of 40 Gbps.
The ExtraHop Platform consists of three appliances:
The Discover appliance serves as the base appliance, which connects to a network and performs the real-time pre-
processing and analysis of all packet data through stateful reassembly, decoding, content analysis, and measurement of
these data streams. This meta data, referred to as wire data in the industry, provides real-time insight through powerful
visualizations and visual search. Flexible deployment models are available through physical and virtual deployment options
on-premises or in the cloud.
For even more detail and granularity, the Explore appliance offers organizations the ability to leverage common Big Data
techniques on all pre-processed and structured wire data. ExtraHop’s visual query language provides multi-dimensional
analysis of all user, application, and system transaction details as well as flow records, from grouping, sorting, and filtering,
to pivoting and selecting time-ranges. The simplicity and intuitiveness enables non-specialists to simply point and click on
responsive visualizations to uncover deeper insights. Though the Explore appliance requires a Discover appliance, the
integration is seamless, with the data accessed through a single Web UI for both appliances.
The Command appliance serves as a manager of managers for all the Discover and Explore appliances deployed throughout
an organization, whether across business units or geographies. The Command appliance provides centralized management
for deployments with up to 100 ExtraHop nodes and unifies all transaction metrics across all nodes in a single Web UI.
FIGURE 2. The ExtraHop Platform
Lab Validation Report: The ExtraHop Stream Analytics Platform: Wire Data for the Real-time Enterprise 6
© 2016 by The Enterprise Strategy Group, Inc. All Rights Reserved.
ESG Lab Validation ESG Lab performed hands-on evaluation and testing of the ExtraHop platform at ExtraHop’s facilities, in Seattle,
Washington. Testing was designed to demonstrate the essential elements that are required for a next-generation ITOA
platform used for real-time network, application, security, and business monitoring, as delivered by ExtraHop.
Deployment, Discovery, and Analysis
The ExtraHop platform offers flexibility; the deployment process is nearly identical for the physical, virtual, and cloud
appliances. ExtraHop supports all top hypervisors including VMware, Hyper-V, KVM, and has an AMI for AWS. At the time
of this writing, ExtraHop was set to release a cloud appliance for Azure but this was not tested nor validated by ESG. ESG
Lab deployed a virtual ExtraHop Discover appliance to understand the ease of getting started. After downloading the
Discover virtual appliance firmware (~250 MB) for VMware (OVA) from the ExtraHop website, ESG Lab imported the OVA
through VMware. Multiple OVAs are available with different configuration options related to vCPU and vRAM, but all come
pre-configured with the ExtraHop software. After reviewing an OVA summary and deploying the VM, ESG Lab navigated to
the appliance IP address through a web browser to access the UI and finish the deployment.
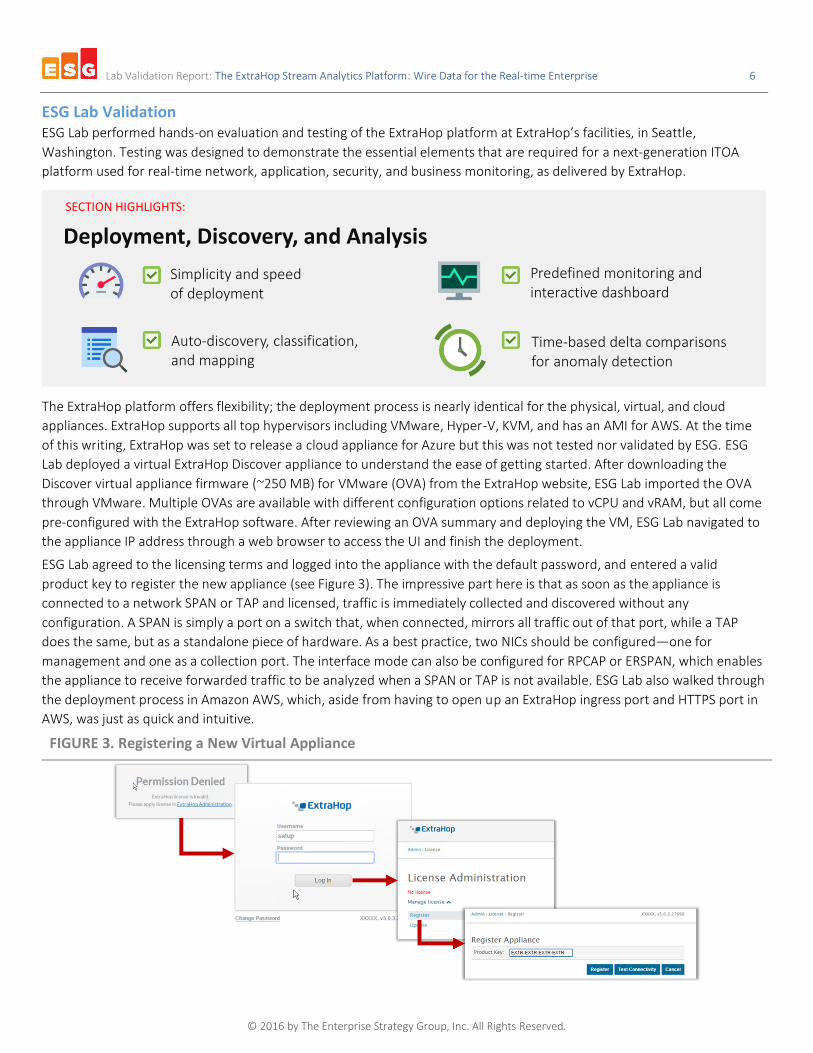
ESG Lab agreed to the licensing terms and logged into the appliance with the default password, and entered a valid
product key to register the new appliance (see Figure 3). The impressive part here is that as soon as the appliance is
connected to a network SPAN or TAP and licensed, traffic is immediately collected and discovered without any
configuration. A SPAN is simply a port on a switch that, when connected, mirrors all traffic out of that port, while a TAP
does the same, but as a standalone piece of hardware. As a best practice, two NICs should be configured—one for
management and one as a collection port. The interface mode can also be configured for RPCAP or ERSPAN, which enables
the appliance to receive forwarded traffic to be analyzed when a SPAN or TAP is not available. ESG Lab also walked through
the deployment process in Amazon AWS, which, aside from having to open up an ExtraHop ingress port and HTTPS port in
AWS, was just as quick and intuitive.
FIGURE 3. Registering a New Virtual Appliance
Deployment, Discovery, and Analysis
Simplicity and speed of deployment
Auto-discovery, classification, and mapping
Predefined monitoring and interactive dashboard
Time-based delta comparisons for anomaly detection
SECTION HIGHLIGHTS:

Lab Validation Report: The ExtraHop Stream Analytics Platform: Wire Data for the Real-time Enterprise 7
© 2016 by The Enterprise Strategy Group, Inc. All Rights Reserved.
Next, ESG Lab viewed the auto-discovery, -classification, and -mapping of all transactions and data flows. For discovery and
classification, this review included all client, server, and application data flows along with context related to response
times, errors, latency, and others aspects that impact the underlying data and application delivery chain. All dependencies
that communicate on the network are automatically categorized as part of the mapping to provide a comprehensive view
of the network, infrastructure, and applications. This functionality provides insight into who, what, when, how much, and
how often as well as all of the underlying dependencies that help answer those questions.
ESG Lab connected to a blank data feed from a SPAN. After we had enabled SPAN, data was discovered and classified.
Classification does not depend on port IDs but on full protocol analysis. After logging into the main ExtraHop user interface,
ESG Lab viewed the out-of-the-box Activity dashboard, which provides an instant overview of all analyzed traffic. The
comprehensibility was impressive, providing the ability to view activity based on device types, networks, and applications
(L2-L7 protocols). ESG Lab was able to view over 2,000 auto-discovered devices that were active on the network and with a
simple click, could drill-down to discover all the devices that were connected and how they were communicating (DHCP,
UDP, HTTP, SQL, AD etc.). ESG Lab also validated that HTTP was correctly classified over a non-standard port. The ExtraHop
Web UI also provides default dashboard views that display common network and application performance metrics, like
packets per second, total bytes, application errors, URI process time, storage and file access times to name a few. As
shown in Figure 4, ESG Lab viewed all traffic being classified by the correct L4-L7 protocol, including SSL, HTTP, RTP, TCP,
SSH, FTP, NFS, and CIFS. Again, all of this data was collected, analyzed, classified, and mapped in real time as soon as the
SPAN was enabled.
ExtraHop provides a native metrics catalog that consists of over 3,600 metrics derived from the real-time analysis and
records attributes of more than 50 network and application protocols out-of-the-box. ExtraHop’s Metrics Explorer enables
organizations to easily search, combine, and display those metrics into customized interactive visualizations. Further,
ExtraHop offers integrated global search that spans the entire network of connected clients, systems, applications, devices,
and their individual sessions, flows, and transactions. This capability works across distributed ExtraHop appliances, which
enables users to search from device IP address and hostnames, to URIs, database queries, filenames, and the users
accessing those files. The detailed search can even return results for granular application payload details related to unique,
end-user IDs from within a monitored application.
FIGURE 4. Activity Feed and Traffic Overview
ExtraHop provides a delta comparison function, which helps detect and alert anomalous user, network, and application
behavior by comparing activity across time periods. This feature enables organizations to improve network and application
performance while also enhancing security, planning, and compliance by comparing activity over any time period.
After24 hours, ESG Lab evaluated the speed and effort required to identify an application anomaly. Through the time-
based delta comparison functionality, current network and application activity was reviewed and compared to the previous
day. By simply clicking on the different protocols in the traffic overview, the comparable charts displayed the packets per
second of each protocol for the given time period. Within minutes, ESG Lab identified anomalous activity. A burst of SSH
traffic and data was discovered, followed shortly after by a spike of anonymous FTP data. The comparisons and individual
protocol interactions are shown in Figure 5.

Lab Validation Report: The ExtraHop Stream Analytics Platform: Wire Data for the Real-time Enterprise 8
© 2016 by The Enterprise Strategy Group, Inc. All Rights Reserved.
FIGURE 5. Delta Comparisons to Uncover Anomalies
All data points within the charts could be clicked to drill down into specific activity. ESG Lab dug deeper into the SSH traffic
to identify where the requests originated and who serviced them. From the ExtraHop Web UI, ESG Lab selected from a list
of all devices that requested or received data over SSH. By simply sorting by the number of received packets, the device
that caused the anomalous SSH activity was found. Clicking on the device provided all collected L2-L7 activity for that
specific device, including the SSH activity. From within the device-specific data, ESG Lab was able to view peer devices,
which displayed the host of the request. This entire process was completed from within the same Web UI without
configuring any customized data collectors in less than a few minutes, which is essential for reducing the Mean Time to
Identification (MTTI) as well as the Mean Time to Remediation (MTTR). (see Figure 6).
FIGURE 6. Identifying the Culprit of an Anomaly

Lab Validation Report: The ExtraHop Stream Analytics Platform: Wire Data for the Real-time Enterprise 9
© 2016 by The Enterprise Strategy Group, Inc. All Rights Reserved.
Granularity, Extensibility, and Integration
After deploying the ExtraHop platform and learning some of the basics, ESG Lab went deeper into understanding the levels
of granularity, extensibility, and integration that organizations could expect when customizing the technology to their
business.
ESG Lab tested and validated the granularity of the platform through a payment processing use case that was composed of
secure web transactions (HTTPS) with XML as the payload that contained all of the payment processing details. After
logging into the Web UI, a number of customized dashboards were developed. The dashboards displayed everything from
the total number of order transactions and transactions/sec to the regional breakdown of transactions, the process times
of those transactions, credit cards used, and merchant details by location. A view of the custom dashboard is shown in
Figure 7.
Why This Matters
The complexity of managing a dynamic, heterogeneous IT environment is well documented. Organizational growth, virtualization, and mobility are just a few of the recent drivers that have caused IT to use a “deploy and forget” mentality just to stay ahead of the number of incoming requests. The continuous management required to ensure uninterrupted service and happy end-users is massive and continues growing as new devices are added to the network. Legacy NPM, APM, and Log Aggregation tools do not scale due to the constant attention they require. The need for a next-generation tool has never been more apparent, one that can ensure auto-discovery of all resources in real time with insight not only into everything communicating on the network but, more importantly, what they are communicating. This provides network administrators, DevOps, app support, and security teams with a comprehensive understanding of all behavior in the environment and the time to focus on optimizing performance, security, and business analysis.
ESG Lab validated the simplicity and speed of deployment, which included the auto-discovery, classification, and mapping of every device and the transactions between all clients, applications, servers, networks, and infrastructure. Within minutes, ESG Lab had a virtual Discover appliance installed, which collected and analyzed all data sourced from the network in real time. From the default Activity dashboard, all systems, and protocols were immediately discovered and classified. Within a day of monitoring traffic, an anomaly was detected. Interactive dashboards enabled ESG Lab to point and click on any data point desired, which eventually led to tracking down the underlying culprit. This analysis was all performed with the out-of-the-box, predefined monitoring capabilities of ExtraHop.
Granularity, Extensibility, and Integration
Customized dashboards for granular views into transactional data
Application inspection triggers for custom payload data Analysis
Extended data store
functionality for long-term,
off-appliance data storage
Streaming of wire data to
third-party applications
with Open Data Streams
SECTION HIGHLIGHTS:
End-user experience analysis with
real-time user monitoring

Lab Validation Report: The ExtraHop Stream Analytics Platform: Wire Data for the Real-time Enterprise 10
© 2016 by The Enterprise Strategy Group, Inc. All Rights Reserved.
If your environment requires
custom metrics and additional
insights, ExtraHop’s Application
Inspection (AI) Triggers provide
the ability to extract and
monitor payload data
exchanged between clients,
applications, sensors, and
machines. A trigger is an event-
driven action that is
automatically executed to
collect custom information for
any data in flight. ExtraHop also
has a capability called Universal
Payload Analysis (UPA) that
enables a user to write their
own decoders, extracting information from the payload and measuring the behavior of nearly any TCP- or UDP-based
protocol. This extensibility requires zero modifications to applications or the existing environment and provides DevOps,
network, security, and Big Data teams with information that can be impractical and even impossible to gather. ESG Lab did
not specifically test UPA functionality, but did test the trigger capabilities, which is leveraged by UPA. A related feature,
called Precision Packet Capture (PPC), is also based on AI Triggers, which allow users to selectively capture and store the
raw packets based on a pre-defined event. Unlike continuous packet capture systems, ExtraHop uses a continuous ring
buffer, which stores in memory up to a million of the most recent packets traversing the network. When a pre-defined
event occurs triggering a precision packet capture, ExtraHop will surgically extract the specific packets that were sent prior
to and potentially causing the event’s occurrence. The capture can then be analyzed on the appliance or exported for
calibration with a third-party tool. ExtraHop provides a full programming environment that allows for user-defined code to
monitor custom events and metrics via triggers that tie directly into the business logic.
To prove the payment processing use case, ESG Lab created a custom trigger to monitor transactions for duplicate orders.
An example of the development environment is shown in Figure 8, along with the custom trigger as displayed in the main
dashboard in the ExtraHop management interface. It should be noted that one area that ESG Lab found unique and helpful
was the ability to incorporate real-time runbooks within any of the custom dashboards. Organizations can add prescriptive
guidance, escalation steps, or any information associated with native or custom metrics directly next to the visuals,
whether it is in the form of text to help analysts understand more technical terminology or steps to follow when
troubleshooting. ESG Lab incorporated a runbook into the duplication transaction dashboard that linked to a pre-defined
query of all payment transaction records for granular analysis.
FIGURE 8. Custom Triggers, Visualization, and Real-time Runbooks
FIGURE 7. Custom Dashboards and Visualizations

Lab Validation Report: The ExtraHop Stream Analytics Platform: Wire Data for the Real-time Enterprise 11
© 2016 by The Enterprise Strategy Group, Inc. All Rights Reserved.
After the custom trigger detected a duplicate transaction, ESG Lab performed a search to verify the duplicate. By simply
clicking on the OrderID from within the duplicate transaction trigger visualization, ESG Lab navigated to a query view that
provided a structured, tabular view of all Order transactions. The intuitive Visual Query Language displayed all transaction
record details related to the selected OrderID. ESG Lab was easily able to validate that the same transaction was in fact
executed twice. The Web UI displayed the same transaction ID and dollar amount from the same merchant in the same
state within milliseconds of one another. The result of the transaction query and wire data format is shown in Figure 9.
FIGURE 9. Validating a Duplicate Transaction with ExtraHop Explore
The navigation from the custom dashboard to the query view seamlessly transitioned functionality from the Discover
appliance to the Explore appliance through the unified ExtraHop Web UI. With all information being displayed through the
same interface, ESG Lab could not even tell a new appliance was being leveraged to provide finer details into the
transaction record logs. The seamless integration between the two appliances was impressive.
With the Real-User Monitoring (RUM) solution, ESG Lab monitored the end-user experience as users interacted with a web
application. For this test use case, a particular user attempted to check out from the shopping cart and abandoned the
order. During this process, ESG Lab witnessed a load time exceeding ten seconds. Looking into the issue, the URL had
loaded slowly multiple times. Leveraging the intuitive ExtraHop Web UI, ESG Lab viewed all transactions across all users
and filtered by web browser type. This immediately uncovered an issue that only affected Internet Explorer version 7
users, pinpointing the cause and impact as well as a course of action for remediation. By filtering the transaction records to
include only those with IE7, ESG Lab could rapidly deduce the number of affected clients and the degree of impact.
Further, if 25% of the users were using IE7 and abandoning their shopping cart because of slow performance, that is an
issue that business operations would want to address immediately. The correlation of network, application, and real-user
monitoring data in one Web UI is rare and powerful.
Extensibility and Integration
ExtraHop offers extensibility through the extended data store functionality, which enables organizations to capture, index,
store, and search as much wire data as required leveraging off-appliance storage. ESG Lab quickly walked through the
setup, which was simple, and then accessed the wire data stored on a NAS device. Data was accessed seamlessly across
the local appliance data store and the extended data store and visualized through the same unified view. In fact, the view
was so seamless that ESG Lab had no knowledge of where data was stored, except for the fact that a time comparison
clearly displayed older data, which resided on the extended data store.
Similar to extending the data store to in-house NAS, ExtraHop’s Open Data Stream (ODS) enables organizations to stream
real-time wire data to other platforms for analysis and cost savings. This flexibility enables organizations to store, analyze,
and visualize with any platform of their choosing. ExtraHop integrates with platforms that leverage both proprietary data
stores (Splunk, FireEye, AppDynamics) and non-proprietary data stores (MongoDB, Elasticsearch), as well as messaging
brokers like Kafka to complete multidimensional analysis with other datasets. As an example, Figure 10 displays the
integration with ODS between ExtraHop and Splunk, where ExtraHop extracts payload data, such as transaction order IDs
and account numbers (data not always available in logs), and sends only that data for integration and analysis with Splunk’s
self-reported machine data set.

Lab Validation Report: The ExtraHop Stream Analytics Platform: Wire Data for the Real-time Enterprise 12
© 2016 by The Enterprise Strategy Group, Inc. All Rights Reserved.
FIGURE 10. ExtraHop Integration with Splunk
Why This Matters
Monitoring the network with a traditional NPM tool can provide details about a conversation taking place between two entities. Very little insight can be gleaned from this information. In an attempt to gain more insight, organizations deploy multiple tools that require all the data to be merged and structured into a proprietary format for the specific tool selected to complete the analysis. This approach does not meet the demands for information to be returned in near real time, never mind real time. Organizations are looking for the least number of tools that will provide a global as well as granular view of more than just a conversation taking place. They want a platform that will uncover the actual content of the conversation to learn about its meaning.
ESG Lab validated that ExtraHop provides detailed views of wire data that uncover deeper insights into user, network, infrastructure, and application communications including data payloads. In the payment processing use case, custom dashboards provided high-level visualizations of granular transaction details, while a custom trigger was created and executed based on the recognition of a duplicate transaction. The transition from analyzing wire data on the Discover appliance to the Explore appliance was seamless, leveraging the same interface to query specific transaction details related to the application. Further, real-time user monitoring enabled ESG Lab to monitor the user experience for a web application and uncover a performance issue only affecting clients with older web browsers. The extended data store functionality ensured capacity and cost concerns are put to rest by supporting external storage, while Open Data Stream provided simple data integration with other tools for flexibility and familiarity.

Lab Validation Report: The ExtraHop Stream Analytics Platform: Wire Data for the Real-time Enterprise 13
© 2016 by The Enterprise Strategy Group, Inc. All Rights Reserved.
Performance and Cost Analysis
ExtraHop’s differentiating architecture delivers greater functionality and higher levels of performance than legacy network,
application, or infrastructure monitoring tools. Organizations have a unique opportunity to achieve real-time monitoring of
up to 40 Gbps of traffic from a single physical appliance. ESG Lab audited performance results run by the ExtraHop team to
measure near-wire rates on a physical ExtraHop appliance while handling small, medium, and large data packet sizes across
HTTP and HTTPS protocols. This analysis also included measuring the performance impact of a lightweight Application
Inspection Trigger that executed, measured, and recorded the result of payload data analysis from decrypted HTTP
transactions.
All tests were run through ExtraHop’s Transaction Generation Server (TGS) software, which leverages internal and external
components to simulate network traffic. When a test begins, the test driver runs pre-configured test scripts across each
client in the TGS network. These scripts configure the traffic load and ExtraHop device, run the traffic, limit rates, query for
stats, and export reports for analysis. After a test is kicked off, the client script makes HTTP calls through Apache Bench
from the clients to the NGINX web servers. These calls retrieve the predefined payload size from the web server and
gradually increase the rate until drops begin to occur as viewed through the ExtraHop Web UI. While the rate increases, a
transaction control tool smooths that rate and eliminates micro-spikes of data.
The test bed for performance testing is shown in Figure 11. Two subnets, each consisting of a group of workload
generating servers, make up the TGS network. Both subnets are connected to the same switch with each subnet producing
20 Gbps of traffic. The switch forwards the traffic to the NGINIX web server where the payload is identified. At the same
time, the switch copies and sends all traffic out the SPAN port to a physical ExtraHop appliance for real-time analysis.
FIGURE 11. Performance Test Bed
Performance and Cost Analysis
SECTION HIGHLIGHTS:
Sustainable throughput performance at near-wire speed of 40 Gbps
Scalable performance with millions of packets/sec and transactions/sec
Minimal performance
impact of secure protocols
like HTTPS with SSL
2.5x savings when compared to
NPM industry average pricing

Lab Validation Report: The ExtraHop Stream Analytics Platform: Wire Data for the Real-time Enterprise 14
© 2016 by The Enterprise Strategy Group, Inc. All Rights Reserved.
ESG Lab tested two common protocols with three different payload sizes. HTTP and HTTPS were used as the protocols and
measured transactions until drops began to occur. With HTTP, drops serve as an indication that the maximum number of
transactions are attained. Further, with HTTPS, just a single drop can impact SSL reassembly and parsing. The SSL testing
applies a 2,048-bit key with each HTTPS transaction to complete a new SSL negotiation. A third comparison point paired
the HTTP protocol analysis with a lightweight trigger, which measured the potential impact of extracting and analyzing
payload data based on specific events and content. Three payload sizes were tested that were selected based on the most
common sizing criteria: 1b, 1kb, and 100kb. For the 1b and 1kb tests, a session is opened, a single request packet is sent,
and a single response packet is received. These tests were ideal for measuring the total number of transactions per second
(TPS). Due to the size of the 100kb payload, the process slightly differed; a session is opened, a single request packet is
sent, but then multiple response packets are received. This made the 100kb payload size ideal for measuring throughput
(Mbps) and packets per second (PPS).
Throughput and Packets per Second Analysis
The standard measurement for analyzing network performance is throughput. This measurement is determined by the
number of packets per second being analyzed in real time for a given payload size with the maximum achievable
throughput capped at the bandwidth capabilities of the network. Achieving wire speed is the ultimate goal, meaning the
measured throughput is equal to the available bandwidth.
ExtraHop is capable of delivering 40 Gbps of continuous analysis throughput, so ESG Lab measured throughput speeds for
the three payload sizes, with a focus on the largest payload size of 100kb., This serves as the ideal candidate to measure
throughput and PPS. Figure 12 highlights the throughput performance for the 100kb payload size, while Table 2 highlights
all throughput and PPS results across all payload sizes. Testing did not include overhead like interpacket gap. Interpacket
gap (IPG) provides a minimum idle period between transmission of packets, interframe spacing, or an interframe gap. This
brief recovery time between packets enables devices to prepare for reception of the next packet.
FIGURE 12. Throughput Performance with 100kb Payload Size
TABLE 2. Transactions/sec Results for All Payloads
Payload Size
Throughput (Mbps) Packets Per Second (PPS)
HTTP HTTPS HTTP with
Trigger HTTP HTTPS
HTTP with Trigger
1b 6,217.90 6,687.06 5,666.59 3,540,303.73 3,084,473.43 3,226,298.10
1kb 16,927.27 15,767.25 15,817.42 2,887,692.03 2,517,203.23 2,699,181.67
100kb 39,234.60 27,700.29 39,249.32 3,841,260.40 2,798,986.37 3,839,629.47
0
10,000
20,000
30,000
40,000
150 300 450 600 750 900 1,050
Thro
ugh
pu
t (M
bp
s)
Elapsed Time (s)
Throughput Performance with 100kb Payload Size
HTTP HTTPS HTTP with Trigger
Maximum Bandwidth

Lab Validation Report: The ExtraHop Stream Analytics Platform: Wire Data for the Real-time Enterprise 15
© 2016 by The Enterprise Strategy Group, Inc. All Rights Reserved.
ESG Lab witnessed throughput performance at near-wire speed, with the HTTP test processing 39,234.60 Mbps of a
maximum 40,000 Mbps. Even more impressive was the result of the trigger test, which achieved slightly more throughput
at 39,249.32 Mbps. After factoring in IPG, ExtraHop throughput levels come even closer to the theoretical maximum that is
attainable over the 40Gbps wire. These results put ExtraHop in a performance class of its own as ESG Lab is unaware of
anyone else in the network, application, or infrastructure monitoring space capable of these levels of performance from a
single physical appliance.
These results were further correlated and validated through the ExtraHop Web UI during the test runs. Figure 13 displays
the measured throughput and packets per second of the 100kb HTTP test case. Aside from the obvious display of near-wire
throughput, an interesting takeaway can be seen in the key of the throughput chart on the right. ExtraHop achieved this
high level of throughput while all traffic was processed and analyzed in real time. This is truly an impressive feat for a single
ExtraHop Discover appliance.
FIGURE 13. Throughput and PPS in ExtraHop Management Interface
Transactions per Second Analysis
Measuring performance with ExtraHop is based primarily on the number of transactions per second. A transaction consists
of completing a three-way handshake: establishing a connection, transferring the data, and closing the connection.
Depending on the protocol being tested, the number of packets per transaction vary and, depending on the size of the
payload, the connection might remain open until the entire payload is transferred, which is important for larger payloads.
Figure 14 shows the protocol comparisons for the 1b payload size, while Table 3 highlights all payload size results. As
expected, the HTTP protocol test yielded the highest number of transactions per second (1,282,962.13), while the
additional security of SSL affected performance by about 30%. The impressive takeaway from this comparison is that when
a trigger is executed, the impact to performance was less than 15%. This value is more than acceptable considering the
amount of additional metrics being calculated in real time.
FIGURE 14. Transactions per Second with 1b Payload Size

Lab Validation Report: The ExtraHop Stream Analytics Platform: Wire Data for the Real-time Enterprise 16
© 2016 by The Enterprise Strategy Group, Inc. All Rights Reserved.
TABLE 3. Transactions per Second Results for All Payloads
Payload Size Total Transactions per Second
HTTP HTTPS HTTP with Trigger
1b 1,282,962.13 886,103.13 1,094,030.87
1kb 1,234,738.90 881,863.60 1,043,870.40
100kb 40,665.27 27,569.43 38,814.87
Price for Performance Analysis
The last phase of analysis focused on a high-level price for performance model. ESG Lab looked across the NPM industry to
calculate average pricing for NPM vendors with a customer requirement of delivering 40 Gbps of analytics throughput.
NPM pricing was compared to an ExtraHop EH6100, EH8100, and EH9100 and the basic analysis is shown in Figure 15.
As mentioned throughout this Lab
Validation report, ExtraHop
delivers 40 Gbps of real-time
analysis from a single appliance.
No other vendor currently
supports this level of analytics
throughput. In fact, as of the date
of this publication, every other
monitoring vendor requires a
minimum of four appliances to
achieve 40 Gbps of sustained
throughput (10 Gbps per
appliance). This value has a
significant effect on the initial cost of acquisition and overall cost of ownership. Even when comparing a single ExtraHop
appliance to the competition, the EDA 9100 is a more cost-effective option than even two appliances from an average-cost
competing solution. Although the displayed pricing is an average for an NPM solution, ESG Lab affirms that no outlier exists
that would deliver 40 Gbps at a lower cost compared to ExtraHop.
FIGURE 15. Price/Performance Analysis
Why This Matters
Wire data is essential to understanding the global state of what is happening in your environment right now. Whether you’re looking for insight on web application performance, file share usage, streaming media behavior, or all of the above, organizations need real-time performance visibility across tiers and into user and system behavior to make more informed business decisions. But issues can quickly arise if a monitoring product does not meet the performance or functional requirements of the business which can have a detrimental impact on employee productivity and the profitability of the organization. Because traditional network-based monitoring tools require writing packets to disk first, organizations typically have had to make a tradeoff between performance, depth and breadth of analysis, as well as real-time insight.
ESG Lab validated that ExtraHop delivered high levels of sustainable performance from a single appliance with the unique functionality that only real-time stream processing can bring to the table. Because ExtraHop pre-processes and analyzes all traffic before any data is written to disk, the platform is not bottlenecked by disk I/O. Measured throughput levels reached near-wire speed of 40 Gbps for 100kb payload sizes, while 1b payloads yielded impressive total transactions per sec while real-time analysis was being performed. When looking at ExtraHop’s 40 Gbps price/performance, the platform offers customers an average savings of more than 2.5x when compared to NPM industry average pricing. ExtraHop customers get 40 Gbps of real-time stream analysis and perhaps the richest source of empirical insight, wire data, for just $5,450 per Gbps. This equates to less than $15 a day per 1 Gbps of analytics making the overall price, performance, and functionality of the platform a compelling value.
* This is based on North American pricing. International pricing will vary depending
upon country, localized configuration, currency, tariffs, and applicable taxes etc.

Lab Validation Report: The ExtraHop Stream Analytics Platform: Wire Data for the Real-time Enterprise 17
© 2016 by The Enterprise Strategy Group, Inc. All Rights Reserved.
ESG Lab Validation Highlights
ESG Lab deployed a virtual ExtraHop Discover appliance in minutes. This deployment simplicity spread to the physical appliance, while the cloud appliance took just as little time with minimal configuration adjustments.
A comprehensive set of protocols and metrics were monitored out-of-the-box, with visualizations displayed in real time in the main dashboard.
ESG Lab easily discovered an anomalous event using the ExtraHop trending and comparison visualization capabilities. The interactive charts and graphs enabled point-and-click functionality to quickly uncover the culprit.
Custom dashboards were created for a simulated payroll processing use case, which tracked and displayed details about all transactions, including geographies, credit card types, and merchants. ESG Lab created a trigger to monitor for duplicate transactions.
The Explore appliance was leveraged to not only search and validate that a duplicate transaction occurred, but to also demonstrate the real-time user monitoring capabilities.
Extensibility through the extended data store functionality enabled in-house NAS to serve as a long-term data store, which could be seamlessly combined with on-appliance data from a single interface.
ESG Lab validated the integration between ExtraHop and other popular third-party tools to support a complementary wire data analytics strategy with existing, and familiar tools.
The physical ExtraHop appliance delivered sustainable levels of performance. Wire speed of 40 Gbps was achieved from a single appliance, without impacting other data flows and while real-time stream processing was occurring on the back-end.
The ability to achieve 40 Gbps of sustained throughput from a single appliance puts the ExtraHop platform in a category of its own from a price/performance standpoint. When compared to traditional network monitoring tools, ExtraHop delivers significantly more functionality for a fraction of the cost, saving approximately 2.5x.
Issues to Consider
The question of ‘What is real time?’ is heavily debated. In an ExtraHop appliance, real time represents the collection of data as soon as an action on the network has occurred. Though all data is processed in real time, a small delay to visualize that data can occur while updating the Web UI to reflect the most recently collected data.
All performance testing highlighted in this report was done in a controlled environment with ExtraHop’s Transaction Generation Server (TGS) software. Performance in a live, production environment might vary. This is especially true when leveraging custom triggers. Depending on the amount of detail requested, executing a trigger can affect overall performance.
Throughput test results did not factor in the overhead of interpacket gap. When factored into to the overall throughput, a physical ExtraHop appliance achieved wire speed performance of 40 Gbps.
An architecture that leverages agents can easily monitor server performance and this data might never be seen the wire. Since the ExtraHop platform is agent-less, only application activity, behavior, and metrics that are observed on the wire can be captured and analyzed. Machine or agent data would be required to capture host-level statistics and metrics such as CPU and RAM usage.
ExtraHop can see information related to CIFs and NFS shares, such as who is accessing what file and when on the network. ESG Lab feels that this functionality is often overlooked and that many organizations feel as though they need a completely different solution to satisfy this requirement. There are companies out there focusing solely on this type of functionality. The ExtraHop platform provides this out-of-the-box.

Lab Validation Report: The ExtraHop Stream Analytics Platform: Wire Data for the Real-time Enterprise 18
© 2016 by The Enterprise Strategy Group, Inc. All Rights Reserved.
The Bigger Truth
Network and application monitoring products have been around for years with little innovation. Traditionally, NPM tools
simply capture packets, write to disk, and perform some basic flow analysis or are constrained by the limitations of deep
packet inspection in monitoring the network. Organizations can often see that an interaction occurred between two
endpoints with some application detail, but not much more. Application monitoring has traditionally required agents to be
deployed on all hosts which can provide deep insight regarding server, O/S, and even code level performance but neither
NPM or APM can provide a comprehensive or global state perspective. These legacy solutions are often built on a software
architecture that is ill-equipped to handle the depth, breadth, and amount of information organizations require to be
processed and analyzed today. Because of this limitation, tradeoffs often take place which sacrifices either IT insight,
workflows, performance, or the amount of data that can be collected and analyzed. The only source for a real-time global
view is through wire data.
Wire data is the meta data analyses created by the real-time stream processing of all unstructured, often fragmented, and
out of order packet data flowing through a network. More than network data, it’s the analysis of all data-in-flight which
provides significantly more context for IT. Producing wire data requires precision time-stamping, the stateful reassembly of
all packets into their individual flows, sessions, and transactions. The protocols must be decoded in real time so precise
measurements can be calculated, and the content analyzed, indexed, and stored. The result is the auto-discovery,
classification, and mapping of all connected systems, their individual transaction record details, and even insights extracted
from the application payload itself. ESG Lab testing showed that wire data can provide a complete picture of who, when,
how, what and why transactions are happening and the content being shared. ExtraHop provides granular and
comprehensive visibility and analysis to customers enabling them to get a global, unified, and accurate view of the
performance, reliability, usage, and behavior across their entire application delivery chain, from their datacenters, as well
as the public cloud environment. The fact that all of this analysis happens in real time means IT can utilize a platform that
provides faster time to insight, resolution and better decision-making.
You do not have to pick between performance and functionality when it comes to a monitoring solution. You should pick a
cost-effective solution that does not affect existing workflows and that can be deployed as quickly and easily as possible
whether on-premises or in the cloud—a solution that integrates with complementary products to deliver comprehensive
visibility. The solution should provide best-in-class performance without sacrificing functionality or user experience. Based
on our testing and validation of ExtraHop’s capabilities, ESG Lab recommends evaluating ExtraHop, a plug-and-play stream
analytics platform to analyze, index, store, search, and visualize all of your wire data at wire speed.
All trademark names are property of their respective companies. Information contained in this publication has been obtained by sources The
Enterprise Strategy Group (ESG) considers to be reliable but is not warranted by ESG. This publication may contain opinions of ESG, which are subject
to change from time to time. This publication is copyrighted by The Enterprise Strategy Group, Inc. Any reproduction or redistribution of this
publication, in whole or in part, whether in hard-copy format, electronically, or otherwise to persons not authorized to receive it, without the express
consent of The Enterprise Strategy Group, Inc., is in violation of U.S. copyright law and will be subject to an action for civil damages and, if applicable,
criminal prosecution. Should you have any questions, please contact ESG Client Relations at 508.482.0188.
Enterprise Strategy Group is an IT analyst, research, validation, and strategy firm that provides market intelligence and actionable insight to the global IT community.
© 2016 by The Enterprise Strategy Group, Inc. All Rights Reserved.
www.esg-global.com [email protected] P. 508.482.0188