the extremely young open cluster ngc 6611: compiled ... · the extremely young open cluster ngc...
TRANSCRIPT

ASTRONOMY & ASTROPHYSICS FEBRUARY I 1999, PAGE 525
SUPPLEMENT SERIES
Astron. Astrophys. Suppl. Ser. 134, 525–536 (1999)
The extremely young open cluster NGC 6611: Compiled catalogue,absorption map and the HR diagram?
A.N. Belikov1, N.V. Kharchenko2, A.E. Piskunov1, and E. Schilbach3
1 Institute of Astronomy of the Russian Acad. Sci. 48 Pyatnitskaya St., Moscow 109017, Russiae-mail: [email protected]
2 Main Astronomical Observatory, Golosiiv, 252650 Kiev, Ukrainee-mail: [email protected]
3 Astrophysikalisches Institut Potsdam, An der Sternwarte 16, D-14482 Potsdam, Germanye-mail: [email protected]
Received May 29; accepted September 18, 1998
Abstract. A compiled catalogue of astrometric and pho-tometric data for about 2200 stars down to V = 16.8m ispresented. The stars are located in an area with a radiusof 22.8 arcmin around the extremely young open clus-ter NGC 6611 with the cluster center at (α, δ)2000.0 =18h18m40s,−13◦47.1′. The catalogue is based on newreductions of positions, proper motions, and of photo-metric data that have been published in this regionand includes, among others, Hipparcos, AC/GSC andTautenburg Schmidt plate observations. For the member-ship determination, spatial and proper motion distribu-tions of stars in the region were analysed. An extinctionmap of the area and the cluster color-magnitude diagramdown to MV = +1m were constructed. The distance ofNGC 6611 was determined as 2.14± 0.10 kpc.
Key words: open clusters — HR diagram
1. Introduction
The open cluster NGC 6611 located near the exter-nal border of the Sagittarius-Carina spiral arm (l, b) =17.0◦,+0.8◦ has been a subject of many studies based onastrometric and astrophysical methods. This interest hasbeen caused by the extremely young age of NGC 6611and by the importance of such investigations for the un-derstanding of star formation and evolution. The clusteris probably associated with the extensive bright emissionnebula M 16 (The Eagle Nebula). Morgan et al. (1953)
Send offprint requests to: E. Schilbach? The complete catalogue is available at the CDS via
anonymous ftp to cdsarc.u-strasbg.fr (130.79.128.5) or viahttp://cdsweb.u-strasbg.fr/Abstract.html
assumed NGC 6611 to be physically connected with theassociation Ser I.
The first extensive photometric study of NGC 6611was carried out by Walker (1961) from photoelectric andphotographic UBV observations of 532 stars down to V= 16.7m. He used color excesses of stars as a criterionto pick out cluster members. Hoag et al. (1961) obtainedphotoelectric UBV photometry of 24 stars down to V =14.7m in this region. The spectral classification and pho-toelectric UBV photometry for the 15 brightest stars wascarried out by Hiltner & Morgan (1969). Sagar & Joshi(1979) determined photoelectric UBV magnitudes for 50cluster members. The measurements of 89 stars in UBVRIphotometric bands were carried out by The et al. (1990).Hillenbrand et al. (1993) studied this cluster by combiningCCD observations in the UBV system of 1022 stars downto V = 18.7m with spectroscopic and infrared (JHK) pho-tometric data. The CCD observations were also used toderive equatorial coordinates of these stars.
Using plates taken with the 30-cm double refractorof the Observatorium Hoher List, Van Schewick (1962)and Tucholke et al. (1986) determined proper motions of231 stars down to B = 13m with a baseline of 40 yearsand of 253 stars down to B = 15.1m with a baseline of64 years, respectively. Kamp (1974) obtained proper mo-tions for 142 stars down to V = 13.2m with plates takenover 47 years with the Yerkes 40-inch refractor. In all thesestudies, proper motion membership probabilities were de-termined by assuming two different distribution functionsfor field and cluster stars.
The brightest stars in this region are included inthe PPM-South catalogue (Bastian & Roser 1993).For about 200 stars, proper motions were derived byRoser (1996) from the comparison of positions from theAstrographic Catalogue and the Guide Star Catalog.
526 A.N. Belikov et al.: The extremely young open cluster NGC 6611. I.
A study of the cluster NGC 6611 based on Schmidtplate observations is given by Kharchenko and Schilbach(1995), hereafter referred to as KS95. Equatorial coor-dinates, proper motions and photographic B, V mag-nitudes for about 36 000 stars were derived in a fieldof 8.95 sq. degrees from three plates of the TautenburgSchmidt telescope (134/203/401) with a scale of51.4 arcsec/mm and a time-span of 24.2 years. The clus-ter membership probabilities were obtained in the four-dimensional phase space with two components for propermotions and two components for plate coordinates.
On the basis of all these data we compiled an astro-metric and photometric survey down to V = 16.8m withina circular area of 0.45 sq. degrees centered at the clus-ter NGC 6611. With 2185 entries, the catalogue gives themost representative list of stars in this region and containsequatorial coordinates for the equinox 2000.0 and epoch1990.77, proper motions in the Hipparcos system as wellas optical and infrared photometric data. The catalogueis described in Sect. 2.
Using color excess data gathered in the catalogue, weanalyse in Sect. 3 the spatial distribution of the absorp-tion within the cluster, derive the reddening map of thisregion, construct the reddening-free color-magnitude dia-grams, and determine the cluster distance.
2. Compiled catalogue
2.1. Stellar content
The basic set of 2 033 stars down to V = 16.8m was ex-tracted from the Tautenburg survey which provides themost complete list of stars in the NGC 6611 region. Theobservations, measurements, procedures for proper mo-tion and B, V determination as well as the accuracy of theTautenburg data are described in KS95. The list was com-pleted by adding 152 bright stars and close optical com-panions found in the literature. On Schmidt plates, thesestars could not be measured properly due to a crowdingeffect.
Figure 1 shows a map of all 2185 stars included in thecompiled catalogue in the NGC 6611 region. The V mag-nitudes of the stars range from 8.01m to 16.78m. The co-ordinates of the cluster center as determined in this studyare (α, δ)2000.0 = 18h18m40s,−13◦47.1′ (see Table 3).
2.2. Coordinates
Right ascensions and declination (α, δ) were computedfrom the plate coordinates measured on the Tautenburgfirst epoch (1963.45) plate with respect to 51 PPM stars(V from 6.52m to 10.13m) uniformly distributed over thefield. The solutions were carried out with the least squares
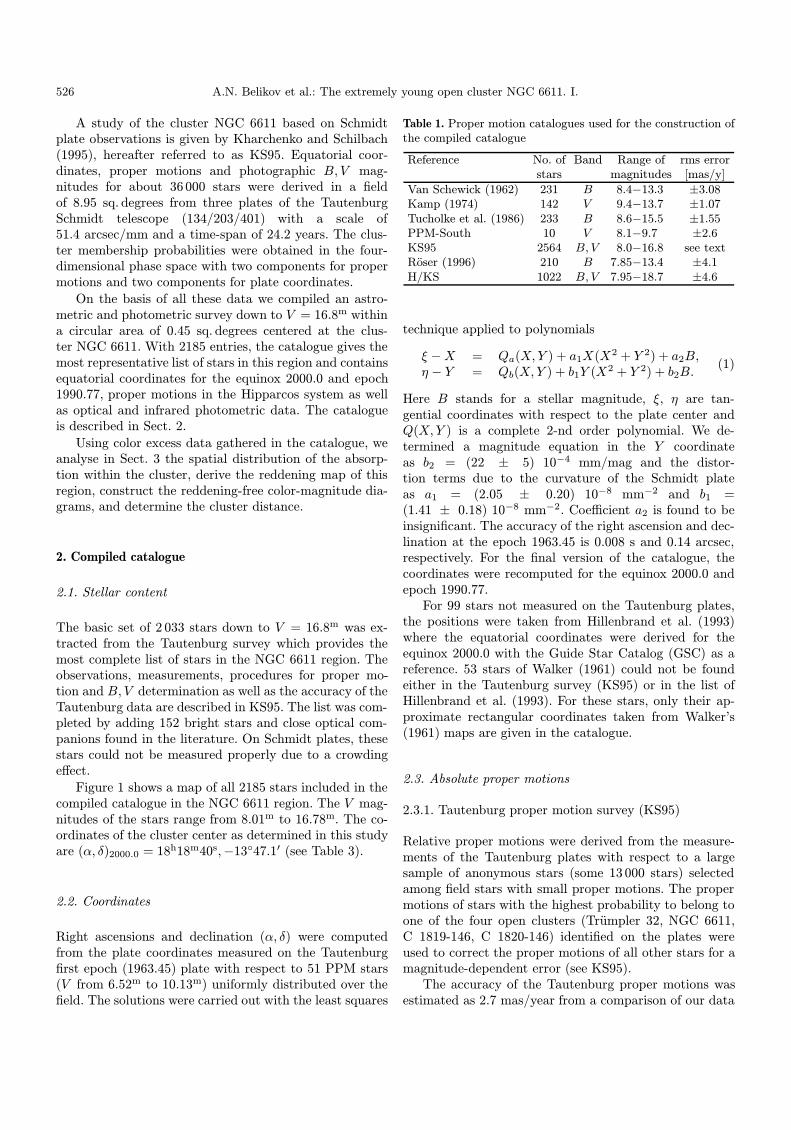
Table 1. Proper motion catalogues used for the construction ofthe compiled catalogue
Reference No. of Band Range of rms errorstars magnitudes [mas/y]
Van Schewick (1962) 231 B 8.4−13.3 ±3.08Kamp (1974) 142 V 9.4−13.7 ±1.07Tucholke et al. (1986) 233 B 8.6−15.5 ±1.55PPM-South 10 V 8.1−9.7 ±2.6KS95 2564 B,V 8.0−16.8 see textRoser (1996) 210 B 7.85−13.4 ±4.1H/KS 1022 B,V 7.95−18.7 ±4.6
technique applied to polynomials
ξ −X = Qa(X,Y ) + a1X(X2 + Y 2) + a2B,η − Y = Qb(X,Y ) + b1Y (X2 + Y 2) + b2B.
(1)
Here B stands for a stellar magnitude, ξ, η are tan-gential coordinates with respect to the plate center andQ(X,Y ) is a complete 2-nd order polynomial. We de-termined a magnitude equation in the Y coordinateas b2 = (22 ± 5) 10−4 mm/mag and the distor-tion terms due to the curvature of the Schmidt plateas a1 = (2.05 ± 0.20) 10−8 mm−2 and b1 =(1.41 ± 0.18) 10−8 mm−2. Coefficient a2 is found to beinsignificant. The accuracy of the right ascension and dec-lination at the epoch 1963.45 is 0.008 s and 0.14 arcsec,respectively. For the final version of the catalogue, thecoordinates were recomputed for the equinox 2000.0 andepoch 1990.77.
For 99 stars not measured on the Tautenburg plates,the positions were taken from Hillenbrand et al. (1993)where the equatorial coordinates were derived for theequinox 2000.0 with the Guide Star Catalog (GSC) as areference. 53 stars of Walker (1961) could not be foundeither in the Tautenburg survey (KS95) or in the list ofHillenbrand et al. (1993). For these stars, only their ap-proximate rectangular coordinates taken from Walker’s(1961) maps are given in the catalogue.
2.3. Absolute proper motions
2.3.1. Tautenburg proper motion survey (KS95)
Relative proper motions were derived from the measure-ments of the Tautenburg plates with respect to a largesample of anonymous stars (some 13 000 stars) selectedamong field stars with small proper motions. The propermotions of stars with the highest probability to belong toone of the four open clusters (Trumpler 32, NGC 6611,C 1819-146, C 1820-146) identified on the plates wereused to correct the proper motions of all other stars for amagnitude-dependent error (see KS95).
The accuracy of the Tautenburg proper motions wasestimated as 2.7 mas/year from a comparison of our data

A.N. Belikov et al.: The extremely young open cluster NGC 6611. I. 527
Fig. 1. Distribution of field stars (triangles) and the cluster members (open circles) of the survey within the NGC 6611 region.The size of symbols corresponds to the brightness of stars. The magnitude range is ∆V = 8.01− 16.78m. The coordinates X,Yare given in arcmin with respect to the Walker’s star 125 (α, δ)2000.0 = 18h18m26.21s , −13◦50′05.3′′ and increase with rightascension (X) and declination (Y )
with the results published by Van Schewick (1962), Kamp(1974) and Tucholke et al. (1986) for the stars in common(B = 9.8m − 14.6m). Outside of this magnitude range theproper motion accuracy is lower and decreases rapidly forstars fainter than B = 16m. A dependence of the propermotion rms error εµ on magnitudes within B = 7m− 17m
was found to be best fitted by a polynomial
εµ[mas/y] = 0.0101(B − 13)4 + 0.051(B − 13)3
−0.4478(B − 13) + 2.6832.
(2)
Since no galaxies could be found in this direction of thesky, we originally used PPM-South stars (Bastian & Roser1993) in KS95 to convert the relative proper motions fromthe Tautenburg survey to absolute ones. Meanwhile, theHipparcos catalogue (ESA 1997) is available, so we re-computed the zero point corrections for the Tautenburgproper motions with respect to the Hipparcos referencesystem. Although 22 Hipparcos stars were identified inthe Tautenburg survey covering a field of 8.95 sq. de-grees, one half of them was too bright to be properlymeasured on Schmidt plates. The zero point corrections
for the Tautenburg proper motions with respect to theHipparcos reference system were computed to be
µX − µHIPPX = −0.4± 1.5 mas/yr,
µY − µHIPPY = +1.1± 0.95 mas/yr.
After the Tautenburg data were corrected for the zeropoint and magnitude-dependent errors, we assume KS95to represent the proper motion system on which the com-piled catalogue is now based.
2.3.2. Proper motions (H/KS) for Hillenbrand et al.(1993) stars
Whereas proper motions for the bright stars in theNGC 6611 region were determined by several authors,there are only two studies, KS95 and Hillenbrand et al.(1993), where astrometric information for stars fainterthan V = 15m is presented. That was the main reasonto include CCD-positions obtained by Hillenbrand et al.(1993) in our catalogue. In their paper the authors listed

528 A.N. Belikov et al.: The extremely young open cluster NGC 6611. I.
the equatorial coordinates of about 1 000 stars for theequinox 2000.0 and epoch 1990.77. The coordinates werederived in the system of the GSC. The accuracy of po-sitions was estimated by the authors to be 0.2 arcsec.Proper motions were derived by combining these positionswith the coordinates at the epoch 1963.45 computed ac-cording to Eq. (1) from measurements of the first epochplate of the Tautenburg survey. The sample is marked byH/KS in Table 1. Taking into account the accuracy ofthe Tautenburg and CCD-positions and a time-span of27.32 years, a formal error of 9 mas/yr may be expectedfor these proper motions. Nevertheless, from a compari-son of the proper motions from H/KS with the data ofVan Schewick (1962), Kamp (1974) and Tucholke et al.(1986) an accuracy of 4.6 mas/yr was estimated for thestars in common (B = 8.0m−14.6m). This result indicatesthat at least for these stars the errors seem to be over-estimated both for the Tautenburg and CCD-positionsfrom Hillenbrand et al. (1993). For the Tautenburg surveythis conclusion seems to be justified because the error of0.12−0.14 arcsec given in Chapter 2.2 for the coordinatesrefers to stars distributed over the whole field covered bya Tautenburg plate (c.a. 9 sq.degrees) whereas the clus-ter NGC 6611 is located close to the plate center. As inHillenbrand et al. (1993) the coordinates were used exclu-sively for the identification reasons, the authors gave onlya brief description of the atrometric reduction applied.In any case, we may conclude that the accuracy of theHillenbrand et al. (1993) coordinates should be betterthan the authors assumed.
Using the data from KS95 and H/KS, one has to takeinto account that the proper motions are highly correlatedsince they are based on the same first epoch observations.They differ due to the second epoch observations and thereduction method applied. The Tautenburg proper mo-tions were derived by a plate-to-plate reduction with atime baseline of 24.2 years. The H/KS proper motionswere computed from differences of equatorial coordinatesfor the equinox 2000.0 over a time-span of 27.32 years.
2.3.3. Compilation of the proper motions
In order to derive proper motions in a common system, weapplied a method which is generally used for the construc-tion of compilation catalogues (e.g., Eichhorn 1974). Eachproper motion catalogue from Table 1 was reduced to thesystem of the Tautenburg survey (KS95) by correction fordifferent zero points and magnitude-dependent errors.
In order to determine weights for each catalogue, weused about 250 stars with at least three independentproper motion determinations (note: the catalogue pairsKS95 and H/KS as well as Van Schewick (1962) andTucholke et al. (1986) were considered as correlated cat-alogues). From proper motion residuals of the same starsincluded in three catalogues, external rms errors of each
Table 2. Photometric catalogues used for the construction ofthe compiled catalogue
Reference Method No. of stars Range of VUBV E(B−V ) magnitude
Walker (1961) photoel. 55 75 8.24−16.75Walker (1961) photogr. 536 9.78−16.84Hoag et al. (1961) photoel. 24 − 8.19−14.69Hiltner & Morgan (1969) photoel. 15 15 8.24−11.18Sagar & Joshi (1979) photoel. 50 50 8.21−13.29The et al. (1990) photoel. 89 52 8.20−15.07Hillenbrand et al. (1993) CCD 1022 − 7.95−18.7KS95 photogr. 2564 − 8.0−16.8
catalogue could be estimated (see KS95). The correspond-ing rms errors which were used to define weights of thecatalogues are given in the last column of Table 1. Theseweights were used in computing the mean proper motionsand the corresponding rms errors for stars of the com-piled catalogue. For the stars whose proper motions wereobtained with the Tautenburg plates only, the rms errorswere computed according to Eq. (2). Figure 2 shows thedifferences of proper motions from the compiled catalogueand the source catalogues. Only those stars are plottedwhich appear in at least two catalogues listed in Table 1.
In total, our catalogue contains proper motions for2074 stars. To check these proper motions for possi-ble magnitude-dependent errors, we used data on clustermembers with the assumption that the proper motionsof cluster stars are independent of the apparent magni-tude. Figure 3 shows absolute proper motions versus stel-lar magnitude V for all 2074 stars and for probable clustermembers. According to Fig. 3, we can conclude that theproper motions are free from magnitude-dependent errorsboth in X and Y directions.
2.4. Photometric data
The calibration of B and V Tautenburg plates in KS95was based on photoelectric sequences taken from Walker(1961), Sagar & Joshi (1979), and Nicolet (1978). Thebackground effect due to M 16 was taken into account inphotographic magnitudes by a term
k · exp[−0.5 · [(X −X)2/σ2X + (Y − Y )2/σ2
Y ]]
where X,Y are the coordinates of the centre of M 16.For the factor k values of 0.25m ± 0.06, 0.32m ± 0.04 and0.15m ± 0.04 were obtained for two B plates and one Vplate, respectively. The accuracy of the photometric datawas estimated as σB = ±0.12m and σV = ±0.10m (seeKS95).
In addition, we included the relevant data from thephotometric catalogues obtained in the NGC 6611 region(see Table 2).

A.N. Belikov et al.: The extremely young open cluster NGC 6611. I. 529
Fig. 2. Differences in proper motions between the compiled and the original catalogues (see Table 1) as a function of V
Fig. 3. Absolute proper motion components in X and Y directions versus V magnitude. Dots: all stars included in the compiledcatalogue; open circles: stars with the highest membership probability based both on proper motions and coordinates; crosses:stars with the highest membership probability based on proper motions only

530 A.N. Belikov et al.: The extremely young open cluster NGC 6611. I.
Fig. 4. Differences in magnitudes, colors and color excesses between the compiled catalogue and the original photoelectric data(see Table 2) versus V magnitudes. Small, medium and large circles indicate stars with (B − V ) ≤ 0.5m, 0.5 < (B − V ) ≤ 0.8m
and (B − V ) > 0.8m, respectively
Fig. 5. Differences in magnitudes and colors between the compiled catalogue and original CCD and photographic data (seeTable 2). Small, medium and large open circles indicate the stars with (B−V ) ≤ 0.5m, 0.5< (B−V ) ≤ 0.8m and (B−V ) > 0.8m,respectively. Only stars with photoelectrically determined magnitudes and colors are plotted

A.N. Belikov et al.: The extremely young open cluster NGC 6611. I. 531
The photometric UBV system of the compiled cata-logue is defined by the common photoelectric sequencesdescribed below. Since the accuracy of the photoelec-tric data achieved by the authors from Table 2 iscomparable, we assumed equal weights for all photoelec-tric catalogues. However, from a comparison of magni-tudes for stars in common, we found systematic differencesbetween the data of Walker (1961), Sagar & Joshi (1979),The et al. (1990) on one side and Hoag et al. (1961),Hiltner & Morgan (1969) on the other side. Especially,for U magnitudes this effect was highly significant (seeFig. 4). Therefore, the photometric reduction was per-formed in three steps: for each of the two groups, we de-rived its own photoelectric system; the common photoelec-tric system was defined as the mean of the intermediatesystems; finally, the corresponding zero point correctionwas introduced in the original magnitude for each star.A similar procedure was applied to the original color ex-cesses E(B−V ) to combine them into a common system.Our catalogue includes 121, 118, 115 and 97 stars withphotoelectric V magnitudes, (B − V ), (U − B) and colorexcesses E(B−V ), respectively.
For stars without photoelectric data, magnitudes andcolors in our catalogue are based on CCD and photo-graphic measurements. A deep CCD photometry was ob-tained in the NGC 6611 region by Hillenbrand et al.(1993). An analysis of these data (Fig. 5) showed thatthey differed systematically by a few 0.01m from the com-piled photoelectric system which we assumed to be themost reliable.
From a comparison of the photoelectric and CCD se-quences, we computed the corrections to UBVCCD mag-nitudes of Hillenbrand et al. (1993) as
Uphotoel. − UCCD = 0.201m − 0.0157UCCD,
Bphotoel. −BCCD = 0.185m − 0.0146BCCD,
Vphotoel. − VCCD = 0.184m − 0.0165VCCD.
The photographic data from KS95 and Walker (1961) werealso reduced to the compiled photoelectric system. TheU,B, V magnitudes of stars without photoelectric pho-tometry were computed as weighted mean values of the re-duced CCD and photographic data. Weights for the CCDdata were determined from rms errors given in Hillenbrandet al. (1993) as a function of the V magnitudes (theirFig. 3). For photographic data, much higher rms errors,σV = ±0.10m, σB = ±0.12m, and σU = ±0.15m, wereassumed.
Thus all UBV photometric data were derived into acommon system based on the photoelectric sequence de-scribed above. Totally, our catalogue includes 2185 starswith V magnitudes and (B − V ) color indexes, 917 starswith (U−B) color indexes and 97 stars with E(B−V ) colorexcesses. For completeness, the original infrared JHKphotometry obtained by Hillenbrand et al. (1993) from
Table 3. Parameters of the distribution functions in theNGC 6611 region
Parameter Units
Xcl [arcmin] +3.5
Y cl [arcmin] +3.0
σcoreXY [arcmin] 1.20
σcoronaXY [arcmin] 4.77
µX cl [mas/year] +1.42
µY cl [mas/year] +2.02
µX df [mas/year] −0.07
µY df [mas/year] +1.68
µX nf [mas/year] −4.75
µY nf [mas/year] +1.92
σXclY clµ [mas/year] 1.52
σXdf Y dfµ [mas/year] 6.13
σXnf Y nfµ [mas/year] 14.04
ncl [per cent] 17
ndf [per cent] 68
nnf [per cent] 14
CCD observations are also given in the compiled catalogue(384 stars).
2.5. Cluster membership probabilities
For such distant clusters as NGC 6611, the extraction ofmembers from proper motions only is rather uncertain duethe low significance of the differences between individualproper motions of cluster members and distant field stars.On the other hand, distant clusters show a local concen-tration of stars in the projection on the sky which providesan additional criterion for the selection of members.
In order to improve the reliability of membership de-termination, we applied a statistical method described inKS95 and Kharchenko et al. (1997) which used the infor-mation both position and proper motion distributions ofstars in the cluster neighbourhood.
The distribution function F (µX , µY ,X, Y ) of stars inthe vicinity of a cluster is assumed to be the sum of twodistribution functions of field and cluster stars, respec-tively:
F (µX , µY ,X, Y ) = Ff(µX , µY ,X, Y ) + Fcl(µX , µY ,X, Y ).
The cluster distribution itself can be divided in two com-ponents, the core and corona distributions which have dif-ferent spatial dispersions. The field stellar population is

532 A.N. Belikov et al.: The extremely young open cluster NGC 6611. I.
Table 4. Distribution of the color excesses E(B−V ) (top) and RV values (bottom) over the NGC 6611 region. The coordinatesof the cluster centre are (X,Y ) = +3.5,+3.0 which correspond to (α, δ)2000.0 = 18h18m40s,−13◦47.1′
Y, X, arcminarcmin −17 −15 −13 −11 −9 −7 −5 −3 −1 1 3 5 7 9 11 13 15 17 19 21 23
−15–
–
–
–
–
–
–
–
–
–
–
–
–
–
–
–
–
–
–
–
–
–
–
–
–
–
–
–
0.77
–
–
–
–
–
–
–
–
–
–
–
–
–
−13–
–
–
–
–
–
–
–
–
–
–
–
0.58
3.97
–
–
–
–
1.13
–
–
–
–
–
–
–
0.75
–
–
–
–
–
0.76
–
–
–
–
–
–
–
–
–
−11–
–
–
–
–
–
–
–
–
–
–
–
–
–
0.81
–
–
–
0.62
–
0.98
–
–
–
–
–
0.84
–
0.85
–
–
–
0.62
3.10
–
–
–
–
–
–
–
–
−9–
–
–
–
–
–
–
–
–
–
–
–
–
–
0.69
–
–
–
–
–
0.81
–
0.74
–
0.63
3.19
–
–
–
–
–
–
0.81
–
–
–
0.68
–
–
–
–
–
−7–
–
–
–
–
–
–
–
–
–
–
–
–
–
0.54
–
–
–
–
–
0.80
–
0.53
3.80
0.97
–
0.63
3.16
0.67
4.42
0.58
–
–
–
–
–
–
–
–
–
–
–
−5–
–
–
–
–
–
–
–
–
–
–
–
0.68
–
–
–
–
–
1.04
3.86
0.78
3.19
1.08
3.29
1.07
–
0.57
3.38
1.34
–
0.61
3.50
1.04
–
0.93
–
0.84
–
–
–
–
–
−31.28
–
–
–
0.63
–
0.72
3.40
0.56
4.35
–
–
0.98
2.80
1.05
3.74
0.59
3.90
–
–
1.27
2.90
1.18
3.14
0.77
2.49
0.53
–
0.70
3.10
0.60
–
1.18
–
–
–
–
–
–
–
0.68
–
−11.29
–
1.04
–
–
–
0.83
–
1.00
3.30
–
–
1.51
3.47
–
–
1.14
2.92
1.35
2.86
0.81
3.51
–
–
–
–
0.95
3.11
1.00
–
0.59
3.10
0.85
–
1.12
–
–
–
–
–
–
–
1–
–
–
–
–
–
–
–
1.71
–
–
–
–
–
–
–
–
–
0.86
3.43
0.71
3.51
0.88
3.47
0.69
3.45
0.86
3.40
–
–
0.65
–
0.76
–
–
–
–
–
–
–
–
–
3–
–
–
–
–
–
–
–
–
–
–
–
1.26
3.70
–
–
0.86
3.23
–
–
0.77
3.68
0.82
3.61
0.75
3.58
–
–
0.87
–
–
–
0.78
–
–
–
–
–
–
–
–
–
50.60
–
–
–
–
–
–
–
–
–
–
–
0.68
3.37
0.99
4.50
1.13
3.59
0.92
3.70
1.10
3.56
1.16
3.62
0.62
3.10
0.63
3.10
0.61
3.10
–
–
0.62
3.10
0.72
–
0.62
–
–
–
–
–
7–
–
–
–
–
–
–
–
–
–
–
–
1.38
2.83
1.74
2.63
0.68
2.90
1.38
3.94
1.49
3.51
0.84
2.75
0.66
4.51
0.83
3.45
0.92
3.10
0.83
–
–
–
–
–
–
–
–
–
–
–
9–
–
–
–
–
–
–
–
0.65
–
–
–
–
–
1.18
–
–
–
1.71
3.30
–
–
–
–
–
–
–
–
1.56
3.53
0.70
2.99
–
–
–
–
–
–
–
–
–
–
11–
–
–
–
–
–
1.14
–
–
–
0.83
–
–
–
–
–
–
–
–
–
1.02
–
–
–
–
–
1.18
–
–
–
–
–
–
–
–
–
0.62
–
–
–
–
–
13–
–
–
–
–
–
–
–
0.84
–
–
–
–
–
0.54
–
1.33
–
–
–
–
–
1.31
–
–
–
0.73
–
–
–
1.12
–
–
–
1.09
–
0.62
3.10
–
–
1.01
–
15–
–
–
–
–
–
–
–
–
–
–
–
–
–
–
–
–
–
–
–
–
–
0.72
–
0.84
–
1.17
–
–
–
–
–
0.62
3.10
1.06
–
–
–
–
–
–
–
17–
–
–
–
–
–
–
–
–
–
–
–
–
–
–
–
–
–
–
–
–
–
–
–
–
–
–
–
–
–
0.79
–
0.84
–
–
–
–
–
–
–
–
–
19–
–
–
–
–
–
–
–
–
–
–
–
–
–
–
–
0.82
–
–
–
–
–
1.38
–
–
–
–
–
–
–
–
–
–
–
0.89
–
–
–
–
–
–
–
21–
–
–
–
–
–
–
–
–
–
–
–
–
–
–
–
–
–
–
–
–
–
–
–
0.85
–
–
–
0.82
–
0.53
–
–
–
–
–
–
–
–
–
–
–
not homogeneous also, since field stars being observed atdifferent distances have different kinematical properties.Therefore, the distribution function of proper motions offield stars can be regarded again as the sum of at leasttwo components (near and distant). So we get
F = Ff + Fcl = F nearf + F distant
f + F corecl + F corona
cl .
We assume normal distributions for proper motions of fieldand cluster stars. Also, the spatial distribution of clustermembers is normal distribution, whereas field stars areuniformly distributed over the area. The parameters of thedistribution functions were derived in a four-dimensionspace of proper motions (µX , µY ) and plate coordinates
(X,Y ) by applying the maximum likelihood technique. Toincrease the stability of the solution, we only considered656 stars with V < 16.0m and proper motion less than50 mas/y. The results of the solution are given in Table 3.The cluster membership probabilities for the core and
corona were computed as
P (t) = exp[−0.5
K
K∑i=1
(ti − ti/σti)2] 100%
where ti denote proper motions µX , µY or coordinates X,Y (K = 4); ti and σti are the corresponding mean val-ues and dispersions. The membership probabilities basedon proper motions alone (K = 2) are also given in our

A.N. Belikov et al.: The extremely young open cluster NGC 6611. I. 533
Fig. 6. Reddening map of the NGC 6611 region. The size of thefilled circles is proportional to the color excess value averagedover 2′× 2′ cells. Stars from our catalogue brighter than 11.0m
are plotted, too (open circles, with sizes proportional to stellarmagnitudes). Radial distances r = 3σcore
X Y (solid line) and r =3σcorona
X Y (dashed line) are also indicated
Fig. 7. Distribution of 467 catalogue stars with different clustermembership probabilities over AV . Dotted-dashed line: starswith proper motion membership probability P (pm) > 63%;solid line: stars with P (pm) > 14%; dashed line: stars withP (pm) ≤ 14%. Four absorption groups showed in Fig. 8 areseparated provisionally by dotted-dashed vertical lines
catalogue. The stars with membership probabilities higherthan 61%, 14%, 1% are located at distances less than 1σ,2σ, 3σ from the maximum of the distribution function andwere considered as high probable, probable or low proba-ble members, respectively.
Absolute proper motions of NGC 6611 along the Y axis(direction of the Galactic rotation) and Z axis (directionto the Galactic North Pole) are +2.49± 0.11 and −0.25±0.10 mas/year, respectively. This corresponds to spatialvelocity components of VY = +24.8±1.1 and VZ = −2.5±1.0 km s−1.
3. Absorption and the color-magnitude diagram
NGC 6611 is the extremely young open cluster associatedwith the nebula M 16. High and variable reddening andan anomalous extinction law were observed in this region(e.g. Sagar & Joshi 1979; The et al. 1990; Hillenbrandet al. 1993; De Winter et al. 1997). Therefore, the as-sumption of an average value of the color excess E(B−V )
and RV = AV /E(B−V ) for all cluster stars may lead toincorrect results and conclusions by a study of clusterproperties.
3.1. Spatial distribution of absorption
In order to construct the de-reddened color-magnitude di-agram for the cluster, we need to know the distributions ofcolor excesses and RV over the cluster area. Since data onindividual values of interstellar absorption for cluster starsare rather poor, a reddening map may present a useful toolfor the cluster studies. The first map of color excesses inNGC 6611 was constructed by Sagar & Joshi (1979) onthe basis of 50 stars in the inner cluster region (20 × 20sq. arcmin). Our catalogue supplemented by recently pub-lished extinction data of De Winter et al. (1997) gives abasis for the construction of a new reddening map in theNGC 6611 region.
To improve the statistics of individual E(B−V ) and RVdata, we applied the Q-method technique to multicolorCCD observations of Hillenbrand et al. (1993). Stars withQUBV < −0.43m and (B − V ) < 0.20m were taken intoaccount and numerical parameters from Johnson (1966)and Hillenbrand et al. (1993) were used:
QUBV = (U −B)− 0.69(B − V ),
(B − V )0 = 0.332 QUBV ,
(V −K)0 = 1.05 QUBV
and
E(B−V ) = (B − V )− 0.332 QUBV ,
RV =1.1((V −K)−1.05 QUBV )/((B−V )−0.332 QUBV ).
The following data sources (listed according to their prior-ity) were included in the absorption study and reddeningmap construction:
– color excesses E(B−V ) from our catalogue and RVtaken from The et al. (1990) and De Winter et al.(1997);
534 A.N. Belikov et al.: The extremely young open cluster NGC 6611. I.
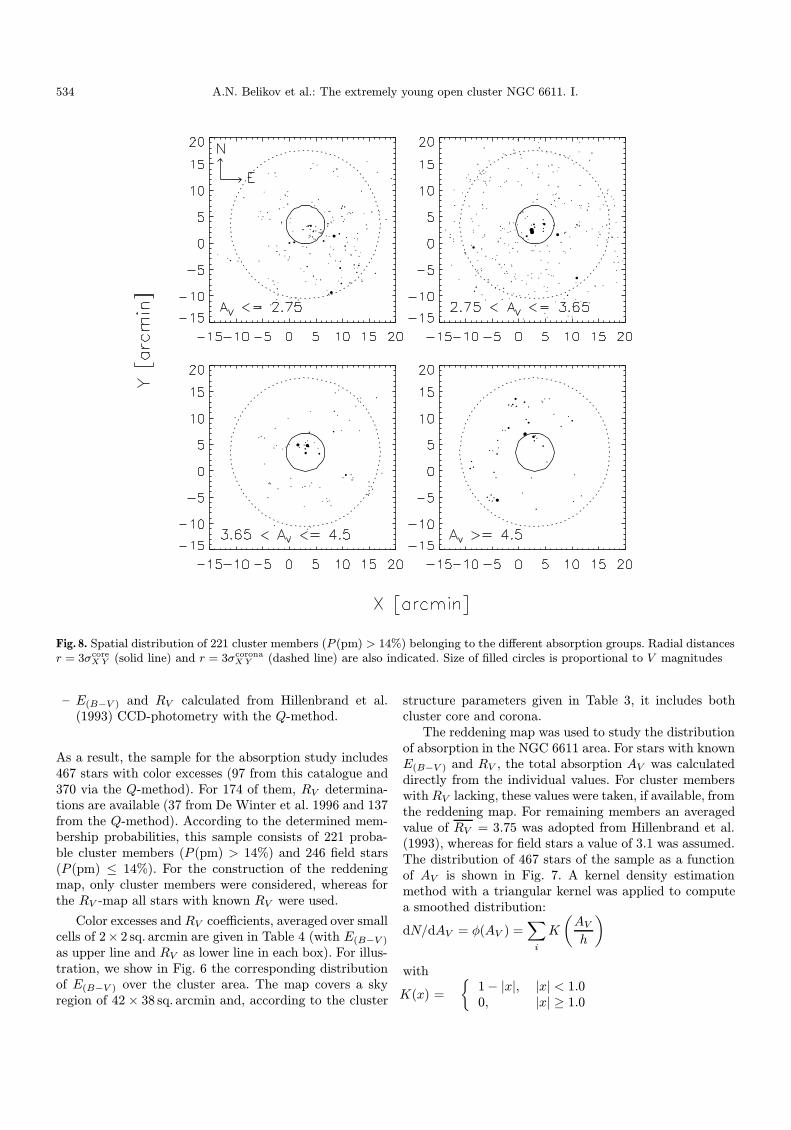
Fig. 8. Spatial distribution of 221 cluster members (P (pm) > 14%) belonging to the different absorption groups. Radial distancesr = 3σcore
X Y (solid line) and r = 3σcoronaX Y (dashed line) are also indicated. Size of filled circles is proportional to V magnitudes
– E(B−V ) and RV calculated from Hillenbrand et al.(1993) CCD-photometry with the Q-method.
As a result, the sample for the absorption study includes467 stars with color excesses (97 from this catalogue and370 via the Q-method). For 174 of them, RV determina-tions are available (37 from De Winter et al. 1996 and 137from the Q-method). According to the determined mem-bership probabilities, this sample consists of 221 proba-ble cluster members (P (pm) > 14%) and 246 field stars(P (pm) ≤ 14%). For the construction of the reddeningmap, only cluster members were considered, whereas forthe RV -map all stars with known RV were used.
Color excesses and RV coefficients, averaged over smallcells of 2× 2 sq. arcmin are given in Table 4 (with E(B−V )
as upper line and RV as lower line in each box). For illus-tration, we show in Fig. 6 the corresponding distributionof E(B−V ) over the cluster area. The map covers a skyregion of 42× 38 sq. arcmin and, according to the cluster
structure parameters given in Table 3, it includes bothcluster core and corona.
The reddening map was used to study the distributionof absorption in the NGC 6611 area. For stars with knownE(B−V ) and RV , the total absorption AV was calculateddirectly from the individual values. For cluster memberswith RV lacking, these values were taken, if available, fromthe reddening map. For remaining members an averagedvalue of RV = 3.75 was adopted from Hillenbrand et al.(1993), whereas for field stars a value of 3.1 was assumed.The distribution of 467 stars of the sample as a functionof AV is shown in Fig. 7. A kernel density estimationmethod with a triangular kernel was applied to computea smoothed distribution:
dN/dAV = φ(AV ) =∑i
K
(AV
h
)with
K(x) =
{1− |x|, |x| < 1.00, |x| ≥ 1.0

A.N. Belikov et al.: The extremely young open cluster NGC 6611. I. 535
Fig. 9. Reddening free color-magnitude diagrams of NGC 6611stars. Panel a) MB − (U − B)0, panel b) MV − (B − V )0.Stars with P (pm, xy) > 63% are plotted only. Solid line is theZAMS from Schmidt-Kaler (1982), horizontal and vertical barsindicate errors in colors and magnitudes, respectively
and i running through the sample. According to prelimi-nary tests on the smoothing parameter h in an appropriaterange of [0.1, 2.0], we chose h = 1.0 as the best compromiseto avoid statistical noise and to prevent an oversmoothingof the distribution.
According to Fig. 7, distributions of cluster mem-bers with proper motion probabilities P (pm) > 63% orP (pm) > 14% show a similar behaviour and differ signif-icantly from the distribution of field stars. This fact maybe interpretated as an independent evidence for the cor-rectness of the kinimatic selection procedure.
In contrast to the distribution of the cluster members,the distribution of field stars shows two distinct compo-nents. We attributed a low-absorption peak at AV ≈ 2.5m
to the foreground field, while the second peak at AV ≈
3.7m includes background stars highly obscured by thecluster parent cloud. Unfortunately, we cannot make moreconcise quantitative conclusions due to strong selectioneffects influencing the sample of stars with available indi-vidual E(B−V ) values.
The location of distribution features obtained for clus-ter candidates coincides well with the positions of themaxima of the E(V−K)/E(B−V ) distribution in Fig. 6 ofHillenbrand et al. (1993). Assuming an average ofE(B−V ) = 0.79, the peaks at RV = 3.1 and RV = 3.75correspond to AV = 2.5m and AV = 3.0m.
Considering the local minima in the cluster memberdistributions over AV , we divided 221 cluster members(P (pm) > 14%) into four absorption groups indicatedin Fig. 7 by vertical lines. The spatial distribution ofthese stars is shown in Fig. 8. This distribution confirmsa patchy behavior of absorption over the cluster. Themost obscured stars are observed within a strip locatedto the NW of the cluster core. The less obscured group(3.65 < AV ≤ 4.5) is randomly distributed within the coreand corona whereas stars with 2.75 < AV ≤ 3.65 whichcould be considered as typical for this cluster unifomly fillthe corona area. The stars absorbed least (AV ≤ 2.75)mark a “transparency” window in the SE sector of thecorona. Note that stars of other groups tend to avoid thewindow.
3.2. Color-magnitude diagrams and distance
The magnitudes taken from our catalogue were correctedfor reddening by use of individual color excesses andthe redenning map. In order to determine the distancemodulus of the cluster, we constructed a color-magnitudediagram (CMD) for 72 probable cluster members witha membership probability higher than 63%. Figure 9shows both MB − (U − B)0 and MV − (B − V )0 CMDsconstructed with
MB = MV + (B − V )0, and
(U −B)0 = (U −B)− 0.72 E(B−V ).
The ZAMS calibrations were taken from Schmidt-Kaler(1982). The distance modulus resulting from a fit of theZAMS to the upper part of the CMDs (MB < −3m) wasderived as (m0 −M) = 11.65m ± 0.10m which is in goodagreement with Hillenbrand et al. (1993) ((m0 −M) =11.5m). The corresponding distance is 2.14± 0.10 kpc.
4. Conclusions
The main goal of this work was to gather and combineastrometric and photometric data obtained by differentauthors in the NGC 6611 region during the past 30 years.As a result of a careful analysis, a catalogue of about

536 A.N. Belikov et al.: The extremely young open cluster NGC 6611. I.
2 000 stars was compiled which includes proper motions inthe Hipparcos system and magnitudes, colours and extinc-tion data in a common photoelectric system. Astrometricmembership probabilities were computed and included inthe catalogue, too. The data form an observational ba-sis for further studies of this very young open cluster.The complete catalogue is available at cdsarc.u-strasbg.fr(CDS) via anonymous ftp.
Acknowledgements. We thank S. Roser for providing us withthe stellar sample from AC/GSC catalogue. We thank theKarl-Schwarzschild-Observatorium Tautenburg for supplyingand the MAMA team, particularly J. Guibert for measuringthe plates. A. Belikov, N. Kharchenko and A. Piskunov thanksthe Deutsche Forschungsgemeinschaft for financial support.
References
Bastian U., Roser S., 1993, PPM Star Catalogue 3, 4. SpectrumAcademischer Verlag
Eichhorn H., 1974, Astronomy of star positions. FrederickUngar Publishing Co., New York, p. 357
ESA, 1997, The Hipparcos and Tycho Catalogues, ESASP-1200
Hillenbrand L.A., Massey P., Strom S.E., Merrill K.M., 1993,AJ 106, 1906
Hiltner W.A., Morgan W.W., 1969, AJ 74, 1152Hoag A.A., Johnson H.L., Iriarte B., Mitchell R.I., et al., 1961,
Publ. U.S. Naval Observ., 2nd Series 17, 347Johnson H.L., 1966, Vgl. Ref. 823 S, 193Kamp L.W., 1974, A&AS 16, 1Kharchenko N., Schilbach E., 1995, Astron. Nachr. 316, 91
(KS95)Kharchenko N., Scholz R.-D., Lehmann I., 1997, A&AS 121,
439Morgan W.W., Whitford A.E., Code A.D., 1953, ApJ 118, 318Nicolet B., 1978, A&AS 34, 1Roser S., 1996, in: Ferraz-Mello S., Morando B. and Arlot
J.-E. (eds.) An updated GSC as the astrometric referencefor minor planet observations. Kluwer Dordrecht, p. 481
Sagar R., Joshi U.C., 1979, Astrophys. Sp. Sci. 66, 3.Dordrecht, Reidel Publ. Comp., p. 451
Schmidt-Kaler Th., 1982, Landolt-Berstein Numerical Dataand Functional Relationships in Science and Technology,New Series, Group IV. Berlin-Heidelberg, New York:Springer-Verlag Press 2, p. 15
The P.S., de Winter D., Feinstein A., Westerlund B.E., 1990,A&AS 82, 319
Tucholke H.-J., Geffert M., The P.S., 1986, A&AS 66, 311Van Schewick H., 1962, Veroff. Univ. Sternw. Bonn 62, 1Walker M.F., 1961, ApJ 133, 438de Winter D., Koulis C., The P.S., van den Ancker M.E., Perez
M.R., Bibo E.A., 1997, A&AS 121, 223