the fading promise of welfare reform to end child poverty
DESCRIPTION
The Fading Promise of Welfare Reform to End Child Poverty. Duncan Lindsey. The Overlap of Welfare, CPS and Foster Care. Welfare Families. Families served by CPS. Foster Care. Child welfare and welfare. Frame (1998) - PowerPoint PPT PresentationTRANSCRIPT

The Fading Promise of Welfare Reform to End Child Poverty
Duncan Lindsey

The Overlap of Welfare, CPS and Foster Care
WelfareFamilies
Families served
by CPS
Foster Care

Child welfare and welfare
Frame (1998) 25% of children in new welfare cases in California had history of involvement with child welfare system.
Shook (1999)40% of children in foster care were on welfare the month before placement.Another 20% on welfare in previous months.
Palmer, Rogers, Digre, & Williams (1997)70% of child welfare families receiving welfare.

Children new to foster care from welfare families:
California 90%
Illinois 85%
North Carolina 90%
Source: Needell, Cucaro-Alamin, Brookhard, and Lee (1999)

Foster Care in Los Angeles
97% of foster care children in Los Angeles come from homes below the poverty line
Source: Los Angeles Times (1999)

Welfare provides income support for low income mothers.
Historic concern that providing welfare made women dependent on it.
Welfare reform was meant to encourage single mothers to work so that they wouldn’t need welfare.
It was believed that welfare reform would improve the situation of poor children.

Welfare Reform Debate
The Washington Post (1995) wrote:“Now here is the part you need to know: Mr. Clinton’s own advisors have told him that it would likely consign as many as a million more children to poverty.
------------------------------------------Marian Wright Edelman (1995) An open letter to President Clinton
It would be a great moral and practical wrong for you to sign any welfare “reform” bill that will push millions of already poor children and families deeper into poverty. .. But longer-term and perhaps irreparable damage will be inflicted on children if you permit to be destroyed the fundamental moral principle that an American child, regardless of the state or parents the child chanced to draw, is entitled to protection of last resort by his or her national government.
Entitlement

Marian Wright Edelman (1995)
[The proposed welfare reform] .. is the
domestic equivalent of bombing Vietnamese villages in order to save them. It is moral hypocrisy for our nation to slash income, health and nutrition assistance for poor children while leaving untouched hundreds of billions in corporate welfare, giving new tax breaks of over $200 billion for non-needy citizens…

Daniel Patrick Moynihan (1995)
If in 10 years time we find children sleeping on grates, picked up in the morning frozen, and ask, Why are they here scavenging, awful to themselves, awful to one another …it will have begun on the House floor this spring and the Senate chamber this autumn.”

Daniel Patrick Moynihan (1995)
described the welfare reform bill as “the most brutal act of social policy since reconstruction” and predicted “those involved will take this disgrace to their graves.”

President Clinton campaigned on a promise toChange welfare as we know it.
The welfare system was widely viewed as a failed system, the time for reform was ripe:
On August 18, 1996 President Clinton signed the welfare reform bill into law.

Welfare ReformPersonal Responsibility and Work Opportunity Reconciliation Act (PRWORA)
1. No longer an entitlement.
2. States provided block grants and greater flexibility.
3. Time limits.
4. Work requirements.

Results: What happened?
You are working with many of these families. What have you seen?
Has there been an improvement in the lives of families that used to be on welfare?
Did welfare reform strengthen these families?

What has been the impact of welfare reform on children?
Are there fewer poor children?
Is the situation for poor children improving?
How can we answer these questions?

Welfare Recipients
0
2,500,000
5,000,000
7,500,000
10,000,000
12,500,000
15,000,000
1936
1939
1942
1945
1948
1951
1954
1957
1960
1963
1966
1969
1972
1975
1978
1981
1984
1987
1990
1993
1996
1999
2002
Source: http://www.acf.dhhs.gov/news/stats/recipients.htm

Greatest declines1993 2002
Wisconsin 241,000 44,000
Florida 702,000 129,000
Illinois 686,000 154,000
Louisiana 263,000 65,000
Mississippi 121,000 23,000
Source: http://www.acf.dhhs.gov/news/stats/caseload.htm

Robert Rector and Patrick Fagan (2001)
“Overall poverty, child poverty and black child poverty have all dropped substantially. .. there are 4.2 million fewer people living in poverty today than there were in 1996, according to Census Bureau figures. Some 2.3 million fewer children live in poverty today than in 1996.”
“Welfare caseloads have been cut nearly in half and employment of the most disadvantaged single mothers has increased from 50 to 100 percent.”
Jay Hein (2001) of the Hudson Institute
Indeed, the success of TANF has exceeded even the brightest of reform’s optimists. All the important social indicators are pointing in the right direction:
welfare rolls are down;
employment is up;
teen pregnancy is down; and
wages are up.

Children receiving welfare
1993 9,382,000
1996 8,671,000
2001 4,055,000
Source: http://www.acf.dhhs.gov/programs/opre/ar2001/0203c.htm

0
5
10
15
20
25
30
35
40
45
50
Per
cen
t
Black
Hispanic
White
Asian
Black 44.2 45.6 46.3 45.9 43.3 41.5 39.5 36.8 36.4 32.7 30.7
Hispanic 37.7 39.8 39 39.9 41.1 39.3 39.9 36.4 33.6 29.9 27.3
White 11.6 12.4 12.4 12.8 11.8 10.6 10.4 10.7 10 8.8 8.8
Asian 17 17.1 16 17.6 17.9 18.6 19.1 19.9 17.5 11.5 14.3
1990 1991 1992 1993 1994 1995 1996 1997 1998 1999 2000
Child Poverty Rates in the United States, 1990 to 2000
Child poverty in the US

10
15
20
25
30
35
40
1990 1994 1996 1997 1998 2000
Per
cen
t o
f C
hil
dre
n L
ivin
g b
elo
w P
ove
rty
FloridaIllinoisLouisianaMississippiWisconsin
Child Poverty in States with the Greatest Decreases in Welfare Recipients
Child poverty in states with welfare declines

Imprecision of CPS estimates?
Did declines in welfare caseloads match declines in child poverty rates?
Did child poverty decline?

Precision of Estimates

1996 to 1999 Children Removed
from Welfare1996 to 1999
Children Out of Poverty
Illinois 187,530 110,500
Florida 246,519 138,548
Wisconsin 98,499 17,784
Mississippi 66,165 29,457
Louisiana 85,203 42,665
Total 683,916 338,954
The Number of Children Removed from Welfare Compared to the Number of Children Removed from Poverty
Children removed from poverty

1999
1996
1999
1996
1999
1996
1999
1996
0 5000 10000 15000 20000 25000
Children on Welfare
Children on WelfareIdaho
Wyoming
Idaho and Wyoming

1999
1996
1999
1996
1999
1996
1999
1996
- 10,000 20,000 30,000 40,000 50,000 60,000 70,000
Children in Poverty
Children on Welfare
Children in Poverty
Children on WelfareIdaho
Wyoming
Children Leaving Welfare and Poverty
Idaho and Wyoming 2

What about other child welfare indicators?
Did out-of-wedlock births decline?
Have foster care caseloads declined?

Changes in the Percentage of Births to Unmarried Women
30.131.0
32.6 32.2 32.4 32.4 32.8 33.0
20.0
25.0
30.0
35.0
40.0
45.0
50.0
1992 1993 1994 1995 1996 1997 1998 1999
Pe
rce
nt
of
all
bir
ths
to
un
ma
rrie
d w
om
en
Florida Illinois Louisiana
Mississippi Wisconsin U.S. Average

Foster Care in the United States
Source: http://www.acf.dhhs.gov/programs/cb/dis/tables/sec11gb/national.htm#national
-
100,000
200,000
300,000
400,000
500,000
600,000
1990 1991 1992 1993 1994 1995 1996 1997 1998 1999
Total Foster Care
IV-E (TANF) Foster Care

Children in Foster Care in Wisconsin
Source: ACF and CWLA

Children in Foster Care in Florida
Source: ACF and CWLA

Did single mothers work more?

Employment Status of Single and Married Mothers, 1990 – 2000
Source: U.S. Census Bureau

How can we assess the economic impact of welfare reform?
Once a family leaves welfare, then systematic data is no longer collected by the agency.
Census data on poverty are limited.
Based on samples that have small sub samples of welfare families.
These sub samples have levels of confidence that restrict the precision of measurement.

Where might we find more reliable data?
Who might have data on these families?
Child welfare agencies?
Child support enforcement agencies?
Schools? Police? Hospitals?

Food Stamps and Welfare
Most people receiving welfare, also receive food stamps.
Food stamp offices collect extensive income data on clients to determine eligibility.
Independent of welfare eligibility.
Children are the largest recipient group.

Welfare and Food Stamps
What happens with food stamp caseload should mirror what happens with welfare. That is, as welfare caseloads decline, food stamp caseloads should also decline.
What happens with children receiving welfare, should be mirrored by children receiving food stamps.

Food stamps and welfare parallel each other
0%
10%
20%
30%
40%
50%
60%
70%
80%
90%
100%
Percent of Children in PovertyReceiving Food Stamps
86% 70% 78% 77% 75% 75% 87% 94% 91% 78% 75%
Percent of Children in PovertyReceiving Welfare
63% 52% 54% 57% 59% 57% 60% 63% 61% 47% 34%
1980 1982 1984 1986 1988 1990 1992 1994 1996 1998 2000

Income of the Average Food Stamp family.
Source: USDA (2002). See http:www.fns.usda.gov

Comparison of Food Stamp and Welfare
Recipient Declines in Wisconsin
Welfare / Food Stamps 1993 = 71% 2002 = 17%
-
50,000
100,000
150,000
200,000
250,000
300,000
350,000
1993 1994 1995 1996 1997 1998 1999 2000 2001 2002
Change from 96 -02

Comparison of Food Stamp and Welfare Recipient Declines in Florida
Welfare / Food Stamps 1993 = 47%% 2002 = 13%
-
200,000
400,000
600,000
800,000
1,000,000
1,200,000
1,400,000
1,600,000
1993 1994 1995 1996 1997 1998 1999 2000 2001 2002
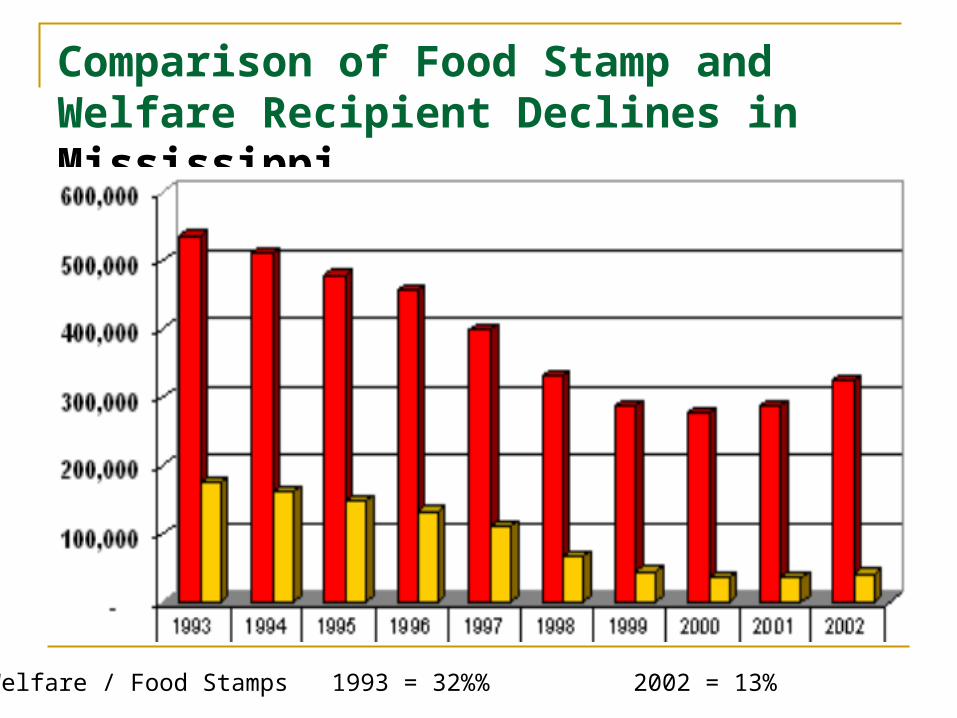
Comparison of Food Stamp and Welfare Recipient Declines in Mississippi
Welfare / Food Stamps 1993 = 32%% 2002 = 13%

Comparison of Food Stamp and Welfare Recipient Declines in Louisiana
Welfare / Food Stamps 1993 = 34%% 2002 = 11%

Comparison of Food Stamp and Welfare Recipient Declines in Illinois
Welfare / Food Stamps 1993 = 58% 2002 = 18%
-
200,000
400,000
600,000
800,000
1,000,000
1,200,000
1993 1994 1995 1996 1997 1998 1999 2000 2001 2002

Why the divergence?
Why did the decline in the welfare caseload so exceed the decline in Food Stamp recipients?
Both programs address the same problem.

Child Recipients of Welfare and Food Stamps

Average Monthly Benefit per Person for the Food Stamp Program

Parents provided welfare (2001)
No parent 1 parent 2 parents
Florida 52.8% 47.2% 0
Illinois 30.1 69.3 .6
California 38.3 61.7 0
See: L.A. Times (August 24, 2002)

What does the Food Stamp data indicate?
The economic situation of most poor children has not improved.
This contradicts welfare caseload declines that suggests substantial improvement.
Is there other data that would allow for further examination this question?
Triangulate
The program specifically targeted to poor children that could help is the Federally Subsidized Free Lunch program.
The modern day soup line for kids.

The Federal Free Lunch Program
Family income less than 130% of poverty line.
Requires parent complete application and supply income information.
Applications are checked and audited for eligibility.

Children Receiving Welfare and Federally Subsidized Lunch in Florida
Why the divergence?

Children Receiving Welfare and Federally Subsidized Lunch in Wisconsin
Why the divergence?

Children Receiving Welfare and Federally Subsidized Lunch in Mississippi
Why the divergence?

Children Receiving Welfare and Federally Subsidized Lunch in Louisiana
Why the divergence?
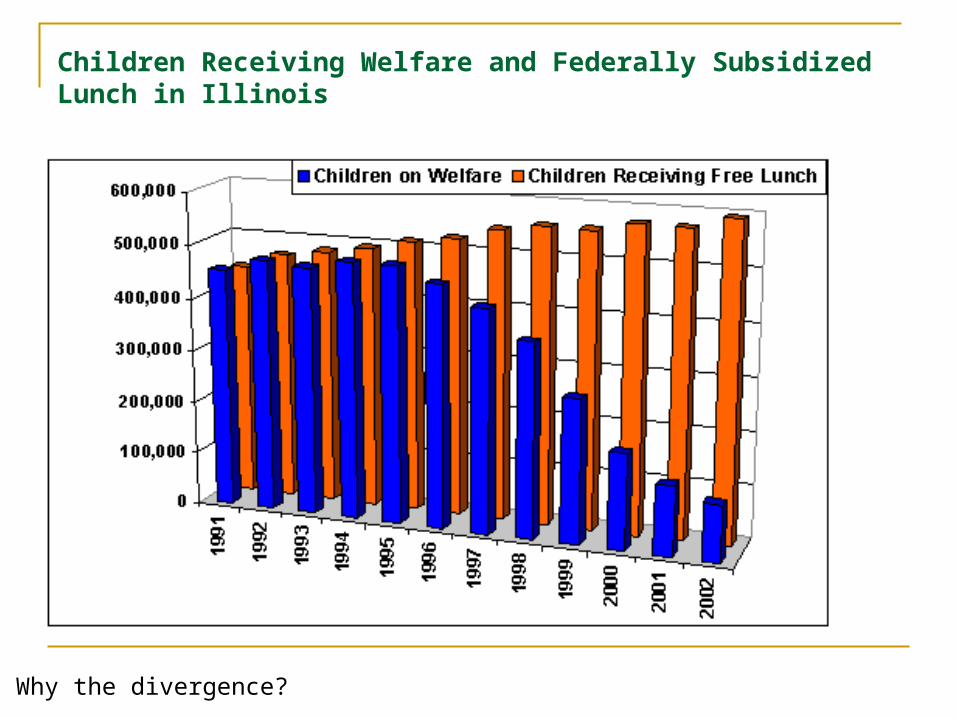
Children Receiving Welfare and Federally Subsidized Lunch in Illinois
Why the divergence?

Children Receiving Welfare and Federally Subsidized Lunch in California
Why the divergence?

Child Recipients of Welfare and Free Lunch

Critics of welfare reform have expressed concern that removing the entitlement status would give states carte blanche to reduce their welfare caseload.
The data examined here suggest that many states may, in fact, have sharply reduced their caseload by simply no longer providing many poor children with welfare regardless of their economic circumstance.

It appears that millions of poor children that in the past would have received welfare no longer receive it.
Data from the Food Stamp program indicates the number of poor children who have lost welfare benefits even though their economic situation has not improved is about 2 million.
Data from the Free Lunch program indicates the number of poor children who have lost their welfare benefits even though their economic situation has not improved may be as high as 5 million.

What has happened to the children who no longer receive welfare but who apparently are still very poor?
The data examined here suggest they remain poor.
Who are these children?

The disproportionate number of Black children in America’s welfare system is staggering.
Black families are overrepresented. Spend a day at the welfare office and you will see the unmistakable color of the welfare system.
Dorothy Roberts, Shattered Bonds
Over representation of Black children

Composition of the welfare caseload in Wisconsin
Why the discrepancy?

Composition of the welfare caseload in Mississippi
Why the discrepancy?

Composition of the welfare caseload in Louisiana
Why the discrepancy?

Composition of the welfare caseload in Florida
Why the discrepancy?

Composition of the welfare caseload in Illinois
Why the discrepancy?

Color of Children on Welfare
Black Children White Children
State Population TANF Population State Population TANF Population
Wisconsin 8% 50% 82% 18%
Florida 21% 55% 57% 23%
Illinois 19% 74% 60% 13%
Mississippi 46% 87% 53% 13%
Louisiana 41% 87% 56% 12%
New York 19% 42% 58% 19%
New Jersey 16% 61% 62% 11%
California 7% 23% 36% 21%
Pennsylvania 13% 55% 80% 29%
North Carolina 26% 66% 63% 24%
Michigan 18% 55% 73% 39%
Ohio 14% 56% 80% 40%
Texas 13% 30% 44% 16%
Virginia 24% 69% 67% 27%
Georgia 36% 81% 58% 17%
Alabama 32% 78% 65% 22%

The data examined here suggest that the consequence of welfare reform is not the great achievement some have heralded.
The story of that achievement, at least for poor children, is a myth.

For children in poor families where mom has left welfare and gone to work, the promise of welfare reform may have been realized. But these children are the minority.

Millions of poor children who used to receive income protection (welfare) now find themselves without it.
Millions of poor children have kept their food stamps and free lunch while losing their welfare benefit.
From the perspective of poor children, welfare reform appears to be a substantial net financial loss.

childwelfare.com

California

CalWORKs Caseload

AFDC/TANF Foster Care in California
0
10,000
20,000
30,000
40,000
50,000
60,000
70,000
80,000
90,000
100,000

California’s Child Population (2000)
California's Child Population (2000)
Hispanic or Latino46%
White37%
Black7%
Asian10%

Foster care in LA
Foster Care Placement Rates in California and LA (2000)
50.8
8.5
8.1
2.2
62.8
8.5
9.3
2.0
0.0 10.0 20.0 30.0 40.0 50.0 60.0 70.0
Black
White
Hispanic
Asian/Oth.
Placement Rate Per 1000
LA
CA

“the child welfare system . . . is a state-run program that disrupts, restructures, and polices Black families. I hope to capture the injustice of a system that separates thousands of Black children from their parents every year and relegates them to damaging state institutions. There is little evidence that the foster care system has improved the well-being of Black children.
Dorothy Roberts, Shattered Bonds
Roberts

Black Children
State Population
Foster Care Population
California 7% 35%
Florida 21% 47%
Georgia 36% 58%
Illinois 19% 76%
Louisiana 41% 64%
New Jersey 16% 64%
New York 19% 44%
Pennsylvania 12% 51%
Texas 12% 31%
Wisconsin 8% 50%
FC by Race

Access to UCLA
Access to UCLA
Black White Hispanic Asian
18 year olds in LA 13,506 30,153
78,481 13,187
UCLA Freshman 157 1,362
525 1,671
% of 18yr in LA @ UCLA 1.2% 4.5% 0.7% 12.7%

UCLA and Foster Care
Looking at L.A. CountyPercent of Population in Foster Care and at UCLA (2000)
46%
14%
39%
1%
4%
37%
14%
45%
0% 10% 20% 30% 40% 50%
Black
White
Hispanic
Asian/Oth.
UCLA
Foster Care