the fco cockpit · exponential characteristics ... as well as the financial and insurance sectors....
TRANSCRIPT
TheFCOCockpit- GlobalBubbleStatusReport 1stJanuary2018
Jan-ChristianGerlach,DidierSornette&KeWu
ChairofEntrepreneurialRisksDepartmentofManagement,TechnologyandEconomicsETHZurichScheuchzerstrasse 78092Zurich,Switzerland
January1st ,2018
TheFCOCockpitGlobalBubbleStatusReport

TheFCOCockpit- GlobalBubbleStatusReport 1stJanuary2018
Contents
AboutMethodologyGeneral ResultsResults per Asset ClassSingle StocksSectorsFinal Remarks

TheFCOCockpit- GlobalBubbleStatusReport 1stJanuary2018
About
The Financial Crisis Observatory (FCO) monthly report discusses the historical evolution ofbubbles in and between different asset classes and geographies.
It is the result of an extensive analysis done on the historical time series of about 450systemic assets and about 850 single stocks. The systemic assets are bond, equity andcommodity indices, as well as a selection of currency pairs. The single stocks are mainly USand European equities. The data is from Thomson Reuters.
In the first part of this report, we present the state of the world, based on the analysis of thesystemic assets. In the second part, we zoom in on the bubble behavior of single stocks anddiscuss some specific cases.
For an intuitive explanation of the methodology and the specifics of the indicators that are used in thisreport, we refer to: D. Sornette and P. Cauwels, Financial bubbles: mechanisms and diagnostics. Review ofBehavioral Economics 2 (3), 279- 305 (2015)http://arxiv.org/abs/1404.2140 and http://ssrn.com/abstract=2423790

TheFCOCockpit- GlobalBubbleStatusReport 1stJanuary2018
Positivebubble: imitationinbuying Negativebubble:imitationinselling
Methodology
We use the Log-Periodic Power Law Singularity (LPPLS) model to hunt for the distinctfingerprint of Bubbles:1. Price rises faster than exponentially, therefore the logarithm of the price rises faster
than linearly;2. There are accelerating oscillations, with a distinct characteristic.
Starting Nov 2017, we have a major upgrading of our LPPLS bubble warning signals. The newmethod significantly increases the prediction power of the signal, and better normalizes thesignal values. A bubble signal is identified if our new bubble indicator is larger than 0%.Bubble Size is the cumulative return since the starting point of the bubble we identified.

TheFCOCockpit- GlobalBubbleStatusReport 1stJanuary2018
In this report, we reintroduce a revised version of our indicator time series plots. Above, two exampleplots for a positive, respectively, negative bubble are depicted. The plots always show the price of anasset in blue, as well as the duration of the most recent identified bubble, if there is one, as representedby the green/red shaded regions. Furthermore, the value of the DS LPPL Confidence indicator, rangingbetween 0-1, is depicted. The color of the indicator series changes according to the type of the associatedbubble (positive = green, negative = red).
In addition to providing new indicator plots, we introduce a slight change to the filtering methodology ofbubble signals. We impose the additional constraint that besides exhibiting bubble signals, the associatedidentified bubble size of an asset needs to be at least 5% in magnitude. This measure prevents noisy andtoo small price movements from being identified as significant bubbles, although they might exhibit super-exponential characteristics (which is the behavior that drives the intensity of the indicator values).
Announcement

TheFCOCockpit- GlobalBubbleStatusReport 1stJanuary2018
GeneralResults– TheBigPicture
-30%
-20%
-10%
0%
10%
20%
30%
40%
50%
01/2017
01/2017
03/2017
04/2017
05/2017
05/2017
06/2017
07/2017
08/2017
09/2017
10/2017
11/2017
12/2017
Historical evolution of the fraction of assets within an asset class that show significant bubble signals
Fixed Income PBF
Fixed Income NBF
Equity PBF
Equity NBF
Commodities PBF
Commodities NBF
Currencies PBF
Currencies NBF
TheFCOCockpit- GlobalBubbleStatusReport 1stJanuary2018
GeneralResults– ThisMonth’sOverview
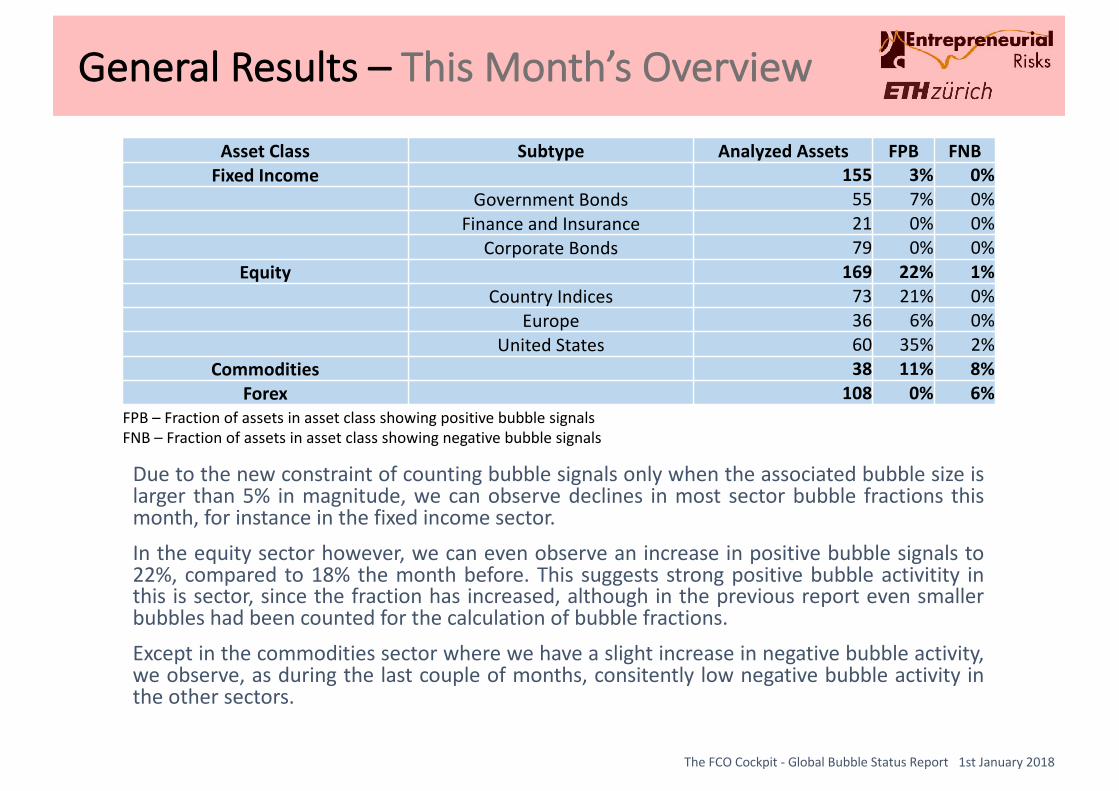
FPB – Fraction of assets in asset class showing positive bubble signalsFNB – Fraction of assets in asset class showing negative bubble signals
AssetClass Subtype Analyzed Assets FPB FNBFixedIncome 155 3% 0%
GovernmentBonds 55 7% 0%FinanceandInsurance 21 0% 0%
CorporateBonds 79 0% 0%Equity 169 22% 1%
CountryIndices 73 21% 0%Europe 36 6% 0%
UnitedStates 60 35% 2%Commodities 38 11% 8%
Forex 108 0% 6%
Due to the new constraint of counting bubble signals only when the associated bubble size islarger than 5% in magnitude, we can observe declines in most sector bubble fractions thismonth, for instance in the fixed income sector.In the equity sector however, we can even observe an increase in positive bubble signals to22%, compared to 18% the month before. This suggests strong positive bubble activitity inthis is sector, since the fraction has increased, although in the previous report even smallerbubbles had been counted for the calculation of bubble fractions.Except in the commodities sector where we have a slight increase in negative bubble activity,we observe, as during the last couple of months, consitently low negative bubble activity inthe other sectors.

TheFCOCockpit- GlobalBubbleStatusReport 1stJanuary2018
FixedIncome- GovernmentBonds
During the previous month, a slight decline in positive bubble activity could be observed in thegovernment bond sector while negative bubble signals remain near a level of zero activity.
As, at the beginning of 2018, government bonds are the only assets within the fixed incomesector exhibiting bubble activity with significant bubble sizes above five percent, the positivebubble fraction within the complete fixed income sector has dropped by about 25%.
A positive bubble at small size is identified in Indonesian government bonds with a high levelof 75% for the confidence indicator. The time evolution of the index and associated confidenceindicator are shown on the next slide.
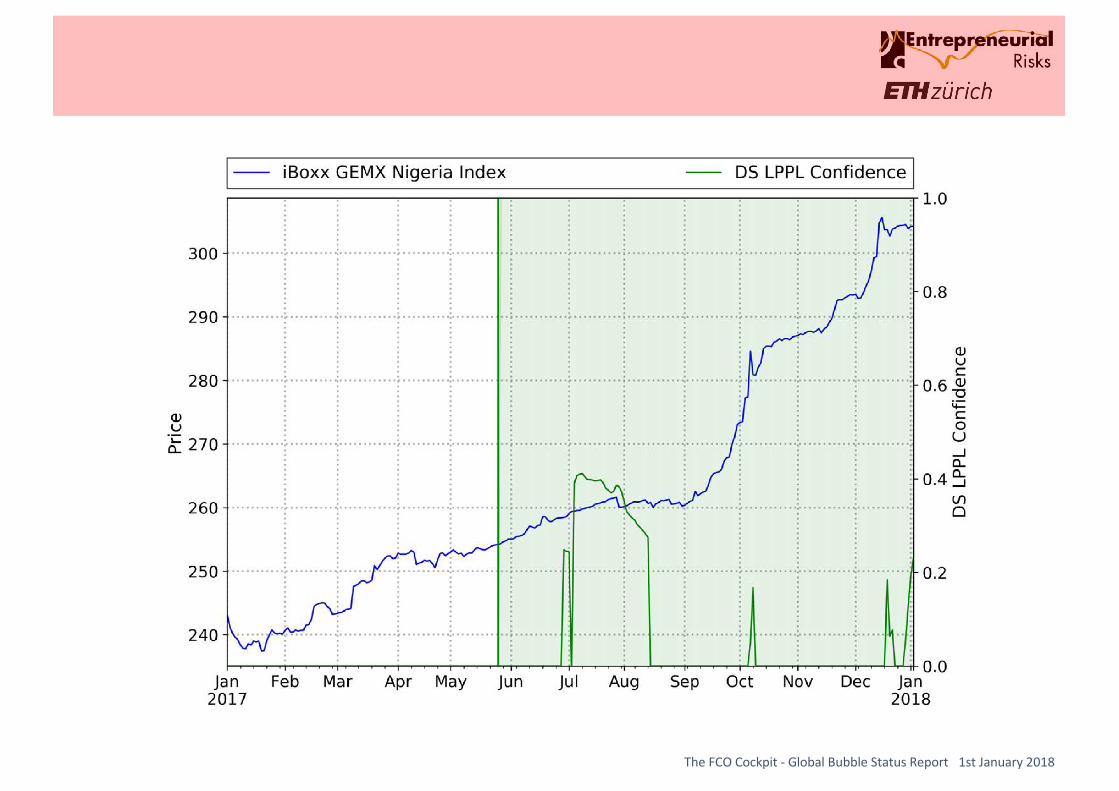
Moreover, a medium-sized bubble is identified in the Nigerian government bond index at alow level of the DS LPPL Confidence indicator. The Nigerian index will therefore be monitoredin future reports, in order to show the development of the indicator value. A snapshot ofprevious year‘s index development is already given in one of the following slides.
Most other bond indices that had been mentioned in the previous report have vanished fromthe list due to their insignificant bubble size.
Name YOY-Return Bubblesize DSLPPLConfidenceiBoxxAsiaIndonesiaIndex 15% 8% 75%iBoxxAsiaIndonesiaGovernmentIndex 15% 8% 74%iBoxxGEMXHungaryIndex 7% 7% 16%iBoxxGEMXNigeriaIndex 27% 18% 13%

TheFCOCockpit- GlobalBubbleStatusReport 1stJanuary2018
TheFCOCockpit- GlobalBubbleStatusReport 1stJanuary2018

TheFCOCockpit- GlobalBubbleStatusReport 1stJanuary2018
In this month‘s analysis, no bubbles at bubble sizes above five percent areidentified in both the corporate bond general, as well as the financial andinsurance sectors.
All assets put in focus in last month‘s report were identified at low bubble sizes,which is why they disappeared from our present list now including a minimumbubble size of 5%.
An exception from this might be the iBoxx Euro Sovereigns index, which wasidentified to be in a 3% positive bubble at a confidence level of 99% one monthago. Meanwhile, it has undergone a minor correction, as visible on the followingslide. As a result, the indicator value dropped. From the corresponding plot, it canalso be seen that previously, in mid 2017, bubble-typical super-exponentialbehavior followed by a crash had been correctly identified in advance.
All in all, we conclude our fixed income part with the positive news, that only fewbubble signals worth mentioning have been detected at the end of 2017. Thissuggests a relaxation of the bond sector, which had been much more tumultuous(in terms of positive bubble formation) during mid 2017, for example, as can beseen from the bubble fraction overview plot, in the beginning of the report.
FixedIncome- CorporateBonds,F&IBonds

TheFCOCockpit- GlobalBubbleStatusReport 1stJanuary2018

TheFCOCockpit- GlobalBubbleStatusReport 1stJanuary2018
Equities- CountryPerformance
In the equity country indices section, at the top of our list of positive bubble candidates, weidentify the Vietnam index with a detected bubble size of more than 40% at a medium-levelindicator value. The year-over-year trend of the Vietnam Index is shown on the next slide,where it can be seen that we consistently identified periods of super-exponential pricebehaviour during the previous half year. In the beginning of December, we could observe anintermediate crash of the index, which was correctly forecasted in our November report. Thiscorrection on the one hand led to a temporary decline of the indicator value, but on theother hand through the now again increasing value of the confidence indicator, we can seethat the price trajectory of the Vietnam Index is entering a super-exponential phase, again,which presumably is why it jumped back to the top of our list. Therefore, we suggest to keepin mind the increasing risk of a crash of possibly significant size occurring in the VietnameseMarkets in the near future.
Name YOY-Return Bubblesize DSLPPLConfidenceVietnamIndex 47% 41% 53%S&PBSESensexIndex 24% 15% 41%DowJonesCompositeIndex 21% 15% 36%DowJonesIndustrialAverageIndex 25% 17% 30%NewZealandSeTop50FreeIndex 19% 7% 26%PXPragueSEIndex 18% 13% 25%JakartaSECompositeIndex 19% 9% 23%TOPIXStockPriceIndex 20% 20% 20%ASXAllOrdinariesIndex 7% 8% 15%NASDAQCompositeIndex 27% 14% 12%

TheFCOCockpit- GlobalBubbleStatusReport 1stJanuary2018

TheFCOCockpit- GlobalBubbleStatusReport 1stJanuary2018
Equities- UnitedStatesandEurope
Name YOY-Return Bubblesize DSLPPLConfidenceSTOXXEurope600Travel&LeisureEURPriceIndex 15% 6% 95%STOXXEurope600InsuranceEURPriceIndex 8% 8% 2%
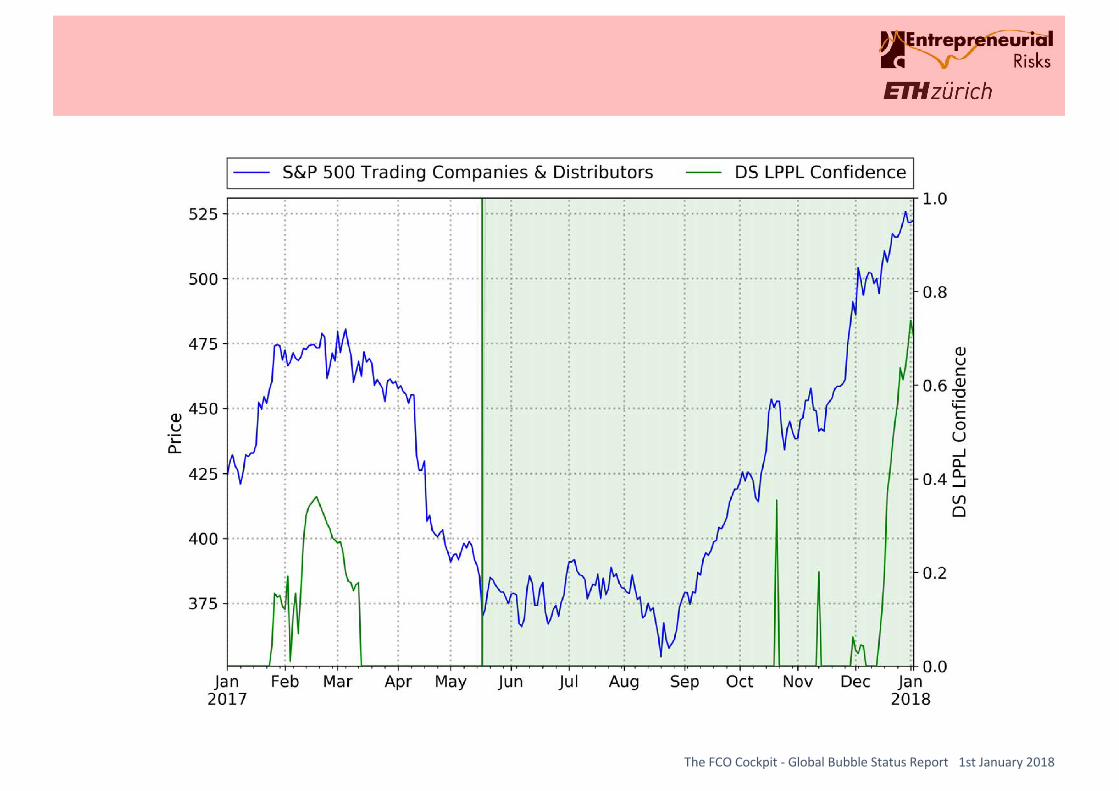
Name YOY-Return Bubblesize DSLPPLConfidencePositiveBubblesS&P500HealthCareProviders&Services(Industry) 25% 12% 85%S&P500Machinery(Industry) 37% 26% 64%S&P500AirFreight&Logistics(Industry) 20% 25% 63%S&P500ConsumerFinance(Industry) 18% 28% 52%S&P500TradingCompanies&Distributors(Industry) 20% 41% 51%S&P500Banks(Industry) 24% 23% 36%S&P500TechnologyHardware,Storage&Peripherals(Industry) 41% 29% 35%S&P500Distributors(Industry) 12% 22% 31%S&P500CapitalMarkets(Industry) 25% 16% 30%S&P500Road&Rail(Industry) 34% 25% 30%NegativeBubblesS&P500IndustrialConglomerates(Industry) -9% -11% 36%

TheFCOCockpit- GlobalBubbleStatusReport 1stJanuary2018
Equities- UnitedStatesandEurope
This month, increased positive bubble activity could be observed in both the US andEuropean Equity markets, with the latter however with smaller bubble sizes than the USmarket.
The strongest signal has been identified in the Health care sector, however at medium bubblesize. The air freight and logistics branch of the S&P 500 is on the list for the second monthnow with larger bubble size (from 16% to 25%), as well as an increased indicator value (from38% to 63%), compared to the beginning of December 17. The corresponding indicator timeseries is shown on the next page.
We can furthermore observe that a fairly large bubble (41%), having its beginning about sixmonths ago, has been identified in the American Trading Companies & Distributors Index.
Strong signals in the real estate sector identified one month ago, have cooled down again,possibly due to the sideward movement of the index during December (see two pagesahead).
In the US markets, we detect one negative bubble asset this month, and none in the analyzedEuropean equities.

TheFCOCockpit- GlobalBubbleStatusReport 1stJanuary2018
TheFCOCockpit- GlobalBubbleStatusReport 1stJanuary2018

TheFCOCockpit- GlobalBubbleStatusReport 1stJanuary2018

TheFCOCockpit- GlobalBubbleStatusReport 1stJanuary2018

TheFCOCockpit- GlobalBubbleStatusReport 1stJanuary2018
Commodities
Commodities show slightly lower positive bubble activity and increased negative bubbleactivity. On the following few slides, the indicator time series for this month’s top candidatesare shown. From the plots of Crude Oil and Palladium, which both continue to be in a positivebubble state for about half a year now, one can observe that recently indicator valuesdeclined at intermediate correction points. Nevertheless, prices for both goods continue tosurge, which is why no all-clear can be given on these commodities and they will be analyzedand discussed in the coming reports as well. Interestingly, this month, the Robsta coffeeindex has been joined by the coffee index on the list of negative bubble assets, whichconfirms the negative bubble trend that seems to be evolving in this branch.
Name YOY-Return Bubblesize DSLPPLConfidencePositiveBubblesCrudeOilERIndex 6% 28% 37%PalladiumERIndex 45% 29% 36%HeatingOilERIndex 21% 30% 11%GasoilERIndex 21% 30% 9%NegativeBubblesNaturalGasERIndex -31% -12% 17%RobstaCoffeeERIndex -23% -14% 17%CoffeeERIndex -22% -22% 15%

TheFCOCockpit- GlobalBubbleStatusReport 1stJanuary2018

TheFCOCockpit- GlobalBubbleStatusReport 1stJanuary2018

TheFCOCockpit- GlobalBubbleStatusReport 1stJanuary2018

TheFCOCockpit- GlobalBubbleStatusReport 1stJanuary2018
Name YOY-Return Bubblesize DSLPPLConfidenceREERIndexHongKong -15% -6% 98%REERIndexBrazil -7% -5% 48%REERIndexEcuador -7% -6% 37%REERIndexVietnam -8% -5% 22%REERIndexJapan -6% -6% 7%REERIndexPanama -7% -5% 4%
As introduced in the previous report, we start our currency market analysis by providing results on REERcurrency indices, which are good representatives for the collective value of a country’s currency. It canbe seen that this month, we only identify significant negative bubbles. At the top of our list is the HongKong Dollar REER Index, which is identified to be in a small negative bubble with a large confidenceindicator value. This month, the Vietnam REER Index appears in our list like in the previous report. Thisresult should be put in correspondence with the positive bubble identifed in the Vietnamese CountryEquity index, as discussed earlier in this report. The devaluation of the currency compared to othercurrencies (which is represented by a lower REER index value) could in fact be one of the drivers of theuptrend in the Vietnamese country index, as an anticipation of the increased economic competitivenessresulting from its weakening currency. On the next slide, our currency analysis is continued with thePrincipal Component Analysis (PCA) part, which was also introduced in the previous report. In the legendof the shown plot, the explained variances of the depicted first principal components are provided. Onnone of the PCA’s, however, any signal was detected, which is why no additional table is given.
Currencies– RealEffectiveExchangeRates
REER:realeffectiveexchangerate

TheFCOCockpit- GlobalBubbleStatusReport 1stJanuary2018
Currencies– PCA
As an ….
Plotofthefirstprincipalcomponentsofthetenanalyzedmajorcurrencies

TheFCOCockpit- GlobalBubbleStatusReport 1stJanuary2018
Currencies– Cryptocurrencies
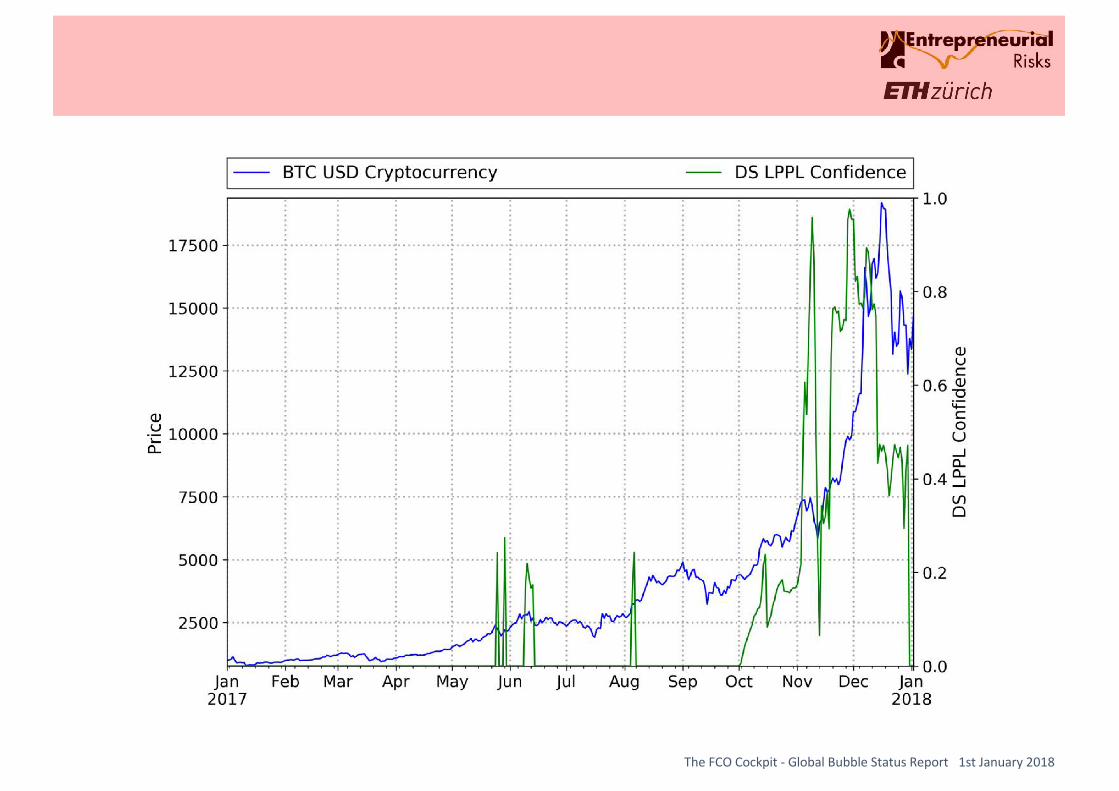
We conclude our currency section with the new section on cryptocurrencies. In comparisonto the previous report, we extend the list of analyzed cryptocurrency pairs to Bitcoin, BitcoinCash, Ethereum and Ripple Coin (all against the US Dollar). These four cryptocurrenciesaccount for more than 70% of the total capitalization of the cryptocurrency market[coinmarketcap.com].
This month, we do not detect any bubble signals on any of the analyzed currencies. Tofrequent observers of the cryptocurrency markets, this should not be much of a surprise, asthe cryptocurrency markets recently experienced a wave of large crashes. This correctionnaturally led to a decline in values of the DS LPPL confidence indicator.
As mentioned earlier, again, a decline in indicator values must not be understood as thedefinitive end of a bubble, even when a correction occurs. Much more, we can view bubblyassets as evolving periodically in waves of strong price growth followed by intermediatecrashes. This view leaves open the possibility of regarding the cryptocurrency as still veryprone to crashes.
When we take a look at the Bitcoin time series on the next slide, we can see that our modelhas reliably generated warning signals in advance for the majority of significant crashesoccurring during the previous year.
TheFCOCockpit- GlobalBubbleStatusReport 1stJanuary2018

TheFCOCockpit- GlobalBubbleStatusReport 1stJanuary2018
For 804 stocks, we calculate the bubble warning indicators as well as two financial strengthindicators, which indicate the fundamental value of the stock and the growth capabilityrespectively.
The stocks are the constituents of the Stoxx Europe 600, the S&P 500 and the Nasdaq 100 indices.From these, all doubles and stocks with incomplete data are removed. Because our financialstrength indicators are specifically designed for corporates, all financial institutions are taken out ofthe set as well.
The two financial strength indicators are:
A value score that is based on the ROIC (Return on Invested Capital) taking into account the EV(Enterprise Value) to normalize for high/low market valuations and/or high/low debt;
A growth score that has characteristics similar to the PEG ratio, which is the Price to Earnings rationormalized for expected EPS-growth (Earnings per Share).
Both scores give a value between zero and one, one being the best of the set and zero the worst, sothe higher the score, the higher the financial strength.
We upgrade the calculation method of the value score, which takes into account the ROICheterogeneity among different industries.
SingleStocks

TheFCOCockpit- GlobalBubbleStatusReport 1stJanuary2018
2
Byplottingthevaluescoreagainsttheaggregatedbubblescore,wecandividethestocksintofourquadrants*:
1. Quadrant1: Stockswithastrongpositivebubblescoreandastrongvaluescore(e.g.AppleInc);
2. Quadrant2: Stockswithastrongpositivebubblescoreandaweakvaluescore(e.g.CintasCorp);
3. Quadrant3: Stockswithastrongnegativebubblescoreandaweakvaluescore(e.g.Incyte Corp);
4. Quadrant4: Stockswithstrongnegativebubblescoreandastrongfinancialstrength(e.g. SSEPLC)
1
3
4
*Astrongpositivebubblesignalisidentifiedifbubblescoreislargerthan10%,andastrongnegativebubblesignalisidentifiedifbubblescoreissmallerthan-10%.Astrongvaluescoreisidentifiedifvaluescoreislargerthan60%,andaweakvaluescoreisidentifiedifvaluescoreissmallerthan40%.
SingleStocks

TheFCOCockpit- GlobalBubbleStatusReport 1stJanuary2018
Each quadrant has its own specs:
1. Quadrant 1: Stocks with a strong value score are cheap relative to their earnings potential. Thestrong positive bubble signal should be interpreted as a momentum indicator possibly theconsequence of a repricing based on the fundamentals. As an investor, one could be a trend-following buyer.
2. Quadrant 2: Stocks with a weak value score are expensive relative to their earnings potential.The strong positive bubble signal is an indication of sentiment and herding increasing the price untilit is not linked to fundamentals anymore. As an investor, one could be a contrarian seller.
3. Quadrant 3: These stocks are expensive relative to their earnings potential. On top of that,there are clear negative bubble signals. Such stocks should be considered as falling knives. As aninvestor, one could be a trend-following seller.
4. Quadrant 4: These stocks are cheap relative to their financial performance. The strong negativebubble signal is an indication of sentiment and herding. These stocks can be considered as over-sold. As an investor, one could be a contrarian buyer.
SingleStocks

TheFCOCockpit- GlobalBubbleStatusReport 1stJanuary2018
Quadrant1and2stocksStrongpositivebubblesignalswithstrong(respectivelyweak)fundamentals
1
2
1
2
SingleStocks

TheFCOCockpit- GlobalBubbleStatusReport 1stJanuary2018
Quadrant3and4stocksStrongnegativebubblesignalswithweakrespectivelystrongfundamentals
3
44
3
SingleStocks
TheFCOCockpit- GlobalBubbleStatusReport 1stJanuary2018
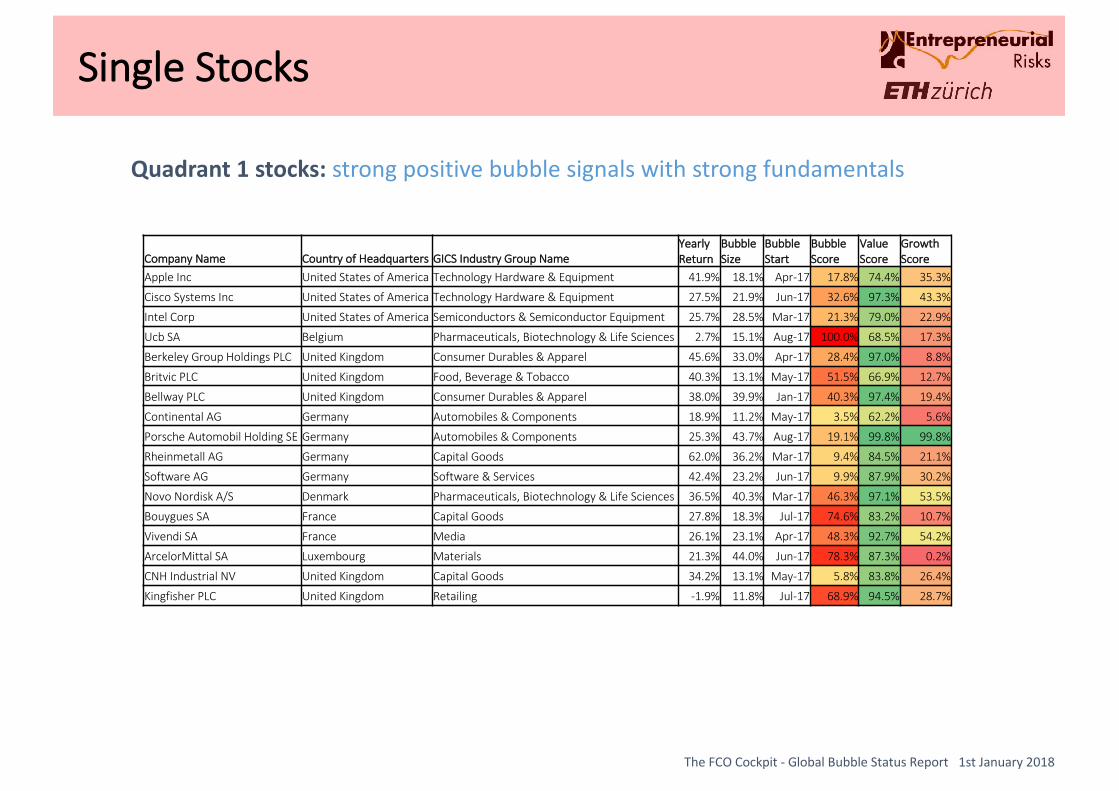
Quadrant1stocks:strongpositivebubblesignalswithstrongfundamentals
SingleStocks
CompanyName CountryofHeadquarters GICSIndustryGroupNameYearlyReturn
BubbleSize
BubbleStart
BubbleScore
ValueScore
GrowthScore
AppleInc UnitedStatesofAmerica TechnologyHardware&Equipment 41.9% 18.1% Apr-17 17.8% 74.4% 35.3%
CiscoSystemsInc UnitedStatesofAmerica TechnologyHardware&Equipment 27.5% 21.9% Jun-17 32.6% 97.3% 43.3%
IntelCorp UnitedStatesofAmerica Semiconductors&SemiconductorEquipment 25.7% 28.5% Mar-17 21.3% 79.0% 22.9%
UcbSA Belgium Pharmaceuticals,Biotechnology&LifeSciences 2.7% 15.1% Aug-17 100.0% 68.5% 17.3%
BerkeleyGroupHoldingsPLC UnitedKingdom ConsumerDurables&Apparel 45.6% 33.0% Apr-17 28.4% 97.0% 8.8%
BritvicPLC UnitedKingdom Food,Beverage&Tobacco 40.3% 13.1% May-17 51.5% 66.9% 12.7%
BellwayPLC UnitedKingdom ConsumerDurables&Apparel 38.0% 39.9% Jan-17 40.3% 97.4% 19.4%
ContinentalAG Germany Automobiles&Components 18.9% 11.2% May-17 3.5% 62.2% 5.6%
PorscheAutomobilHoldingSE Germany Automobiles&Components 25.3% 43.7% Aug-17 19.1% 99.8% 99.8%
RheinmetallAG Germany CapitalGoods 62.0% 36.2% Mar-17 9.4% 84.5% 21.1%
SoftwareAG Germany Software&Services 42.4% 23.2% Jun-17 9.9% 87.9% 30.2%
NovoNordiskA/S Denmark Pharmaceuticals,Biotechnology&LifeSciences 36.5% 40.3% Mar-17 46.3% 97.1% 53.5%
BouyguesSA France CapitalGoods 27.8% 18.3% Jul-17 74.6% 83.2% 10.7%
VivendiSA France Media 26.1% 23.1% Apr-17 48.3% 92.7% 54.2%
ArcelorMittalSA Luxembourg Materials 21.3% 44.0% Jun-17 78.3% 87.3% 0.2%
CNHIndustrialNV UnitedKingdom CapitalGoods 34.2% 13.1% May-17 5.8% 83.8% 26.4%
KingfisherPLC UnitedKingdom Retailing -1.9% 11.8% Jul-17 68.9% 94.5% 28.7%

TheFCOCockpit- GlobalBubbleStatusReport 1stJanuary2018
Quadrant1stocks:strongpositivebubblesignalswithstrongfundamentals
SingleStocks
CompanyName CountryofHeadquarters GICSIndustryGroupNameYearlyReturn
BubbleSize
BubbleStart
BubbleScore
ValueScore
GrowthScore
StatoilASA Norway Energy 9.0% 15.5% Feb-17 16.3% 88.1% 88.8%
WHSmithPLC UnitedKingdom Retailing 48.5% 36.6% Jun-17 15.6% 98.0% 62.6%
TUIAG Germany ConsumerServices 37.0% 32.3% May-17 10.2% 75.1% 81.0%
AccenturePLC Ireland;Republicof Software&Services 32.2% 25.4% Jun-17 79.2% 64.2% 64.7%
ChevronCorp UnitedStatesofAmerica Energy 7.8% 12.0% Mar-17 6.3% 69.9% 87.9%
EastmanChemicalCo UnitedStatesofAmerica Materials 18.3% 16.0% Mar-17 15.9% 72.6% 43.2%
FedExCorp UnitedStatesofAmerica Transportation 33.2% 33.9% Apr-17 34.4% 61.7% 35.8%
FluorCorp UnitedStatesofAmerica CapitalGoods -3.6% 31.8% Aug-17 57.2% 84.8% 30.8%
GapInc UnitedStatesofAmerica Retailing 41.9% 41.9% Jan-17 41.7% 89.9% 56.3%
JacobsEngineeringGroupInc UnitedStatesofAmerica CapitalGoods 14.9% 22.6% Jun-17 21.1% 90.3% 24.0%
Johnson&Johnson UnitedStatesofAmerica Pharmaceuticals,Biotechnology&LifeSciences 21.9% 14.7% Apr-17 2.8% 69.7% 62.3%
MichaelKorsHoldingsLtd UnitedKingdom ConsumerDurables&Apparel 47.6% 89.7% May-17 92.3% 97.9% 37.6%
KohlsCorp UnitedStatesofAmerica Retailing 31.3% 37.6% Mar-17 47.3% 86.2% 24.9%
LennarCorp UnitedStatesofAmerica ConsumerDurables&Apparel 44.8% 21.7% Jul-17 32.1% 90.4% 27.6%
MosaicCo UnitedStatesofAmerica Materials -18.3% 24.5% Aug-17 81.2% 81.7% 9.2%
PVHCorp UnitedStatesofAmerica ConsumerDurables&Apparel 47.3% 35.9% Mar-17 59.7% 88.6% 54.1%
RobertHalfInternationalInc UnitedStatesofAmerica Commercial&ProfessionalServices 12.5% 21.9% May-17 2.9% 75.6% 73.9%
Sherwin-WilliamsCo UnitedStatesofAmerica Materials 44.6% 18.7% Jul-17 13.0% 92.8% 48.4%
TextronInc UnitedStatesofAmerica CapitalGoods 13.7% 14.3% Jan-17 2.6% 60.7% 84.6%
ValeroEnergyCorp UnitedStatesofAmerica Energy 38.2% 47.2% May-17 94.8% 76.7% 10.9%

TheFCOCockpit- GlobalBubbleStatusReport 1stJanuary2018
The above graph shows the one year cumulative return of the stock in blue (left hand scale), S&P 500in green (left hand scale) and the calculated DS LPPLS Bubble Score in red (right hand scale). Thegreen shaded period is the strong positive bubble we identified. The Bubble Score of this sevenmonth bubble has reached 94.8% with a bubble size 47.2%.
Quadrant1stocks:strongpositivebubblesignalswithstrongfundamentalsExampleValeroEnergyCorp:
SingleStocks- Quadrant1stocks

TheFCOCockpit- GlobalBubbleStatusReport 1stJanuary2018
Lastmonthexample:strongpositivebubblesignalswithstrongfundamentals,PublicServiceEnterpriseGroupInc.
SingleStocks- Quadrant1stocks
The figure below plots the one year cumulative return of the stock (blue), S&P 500 (green)and LPPLS Bubble Score (red lines on the right y-axis). The green shaded period is the strongpositive bubble we identified and reported last month. Note that the stock went into a strongcorrection this month, which is in agreement with the DS LPPLS indicator, notwithstandingthe strong fundamentals.

TheFCOCockpit- GlobalBubbleStatusReport 1stJanuary2018
Quadrant 2 stocks: strong positive bubble signals with weak fundamentals
This month we again observe an abnormally large number of stocks in thisQuadrant.
This suggests that the fundamentals are still dominantly weak while there is ageneral positive investment sentiment, possibly in denial of the weakness of theexisting recovery.
SingleStocks- Quadrant2stocks

TheFCOCockpit- GlobalBubbleStatusReport 1stJanuary2018
Quadrant 2 stocks: strong positive bubble signals with weak fundamentals
SingleStocks- Quadrant2stocks
CompanyName CountryofHeadquarters GICSIndustryGroupNameYearlyReturn
BubbleSize
BubbleStart
BubbleScore
ValueScore
GrowthScore
AkamaiTechnologiesInc UnitedStatesofAmerica Software&Services -7.0% 29.6% May-17 20.8% 25.6% 34.0%
CintasCorp UnitedStatesofAmerica Commercial&ProfessionalServices 36.2% 36.2% Jan-17 42.7% 11.1% 86.6%
DollarTreeInc UnitedStatesofAmerica Retailing 38.4% 39.9% Feb-17 21.4% 24.1% 32.8%
FastenalCo UnitedStatesofAmerica CapitalGoods 13.9% 26.6% Jun-17 38.3% 10.9% 65.4%
FiservInc UnitedStatesofAmerica Software&Services 19.8% 14.1% Feb-17 53.8% 10.6% 71.0%
IntuitInc UnitedStatesofAmerica Software&Services 34.8% 18.8% Jun-17 25.0% 34.6% 50.7%
JBHuntTransportServicesInc UnitedStatesofAmerica Transportation 16.1% 30.8% Jun-17 29.9% 10.2% 73.4%
MarriottInternationalInc UnitedStatesofAmerica ConsumerServices 65.7% 56.0% Feb-17 13.3% 5.3% 86.3%
MonsterBeverageCorp UnitedStatesofAmerica Food,Beverage&Tobacco 46.8% 34.7% Mar-17 12.2% 5.2% 46.3%
PaychexInc UnitedStatesofAmerica Software&Services 11.0% 18.1% Jun-17 12.2% 12.6% 77.1%
TractorSupplyCo UnitedStatesofAmerica Retailing -1.6% 40.5% Aug-17 87.9% 8.3% 53.4%
TexasInstrumentsInc UnitedStatesofAmerica Semiconductors&SemiconductorEquipment 39.5% 38.3% Jan-17 22.6% 14.9% 34.5%
WynnResortsLtd UnitedStatesofAmerica ConsumerServices 83.4% 31.7% Jul-17 92.3% 38.8% 83.2%
UmicoreSA Belgium Materials 43.6% 48.6% Jan-17 5.3% 17.5% 31.0%
B&MEuropeanValueRetailSA Luxembourg Retailing 40.8% 25.0% Jun-17 16.5% 26.1% 38.8%
BTGPLC UnitedKingdom Pharmaceuticals,Biotechnology&LifeSciences 28.5% 12.9% Apr-17 7.1% 35.4% 28.9%
UnitedInternetAG Germany Software&Services 47.3% 19.7% Jun-17 41.9% 10.4% 22.5%
BiomerieuxSA France HealthCareEquipment&Services 53.4% 30.1% Apr-17 7.8% 35.1% 90.5%
RemyCointreauSA France Food,Beverage&Tobacco 45.5% 26.5% Apr-17 21.1% 15.5% 29.2%
SodexoSA France ConsumerServices 7.3% 7.7% Jul-17 83.4% 33.0% 11.1%
KerryGroupPLC Ireland;Republicof Food,Beverage&Tobacco 34.5% 21.4% Aug-17 75.1% 26.7% 70.1%
SGSSA Switzerland Commercial&ProfessionalServices 19.8% 20.7% Mar-17 16.6% 10.7% 48.5%
SSPGroupPLC UnitedKingdom ConsumerServices 74.3% 40.1% Jul-17 59.0% 21.1% 36.1%
AmetekInc UnitedStatesofAmerica CapitalGoods 43.7% 19.8% Jun-17 28.7% 23.8% 69.7%

TheFCOCockpit- GlobalBubbleStatusReport 1stJanuary2018
Quadrant 2 stocks: strong positive bubble signals with weak fundamentals (cont’d)
SingleStocks- Quadrant2stocks
CompanyName CountryofHeadquarters GICSIndustryGroupNameYearlyReturn
BubbleSize
BubbleStart
BubbleScore
ValueScore
GrowthScore
A.O.SmithCorp UnitedStatesofAmerica CapitalGoods 28.1% 21.4% Apr-17 18.5% 16.8% 52.5%
AirProductsandChemicalsInc UnitedStatesofAmerica Materials 12.5% 16.4% Jan-17 10.0% 27.4% 51.7%
AutozoneInc UnitedStatesofAmerica Retailing -10.0% 37.6% Jul-17 12.8% 39.6% 63.7%
Brown-FormanCorp UnitedStatesofAmerica Food,Beverage&Tobacco 55.5% 46.7% Mar-17 34.9% 13.1% 64.1%
CaterpillarInc UnitedStatesofAmerica CapitalGoods 67.7% 64.7% Jan-17 13.3% 23.1% 46.6%
Deere&Co UnitedStatesofAmerica CapitalGoods 48.8% 46.6% Jan-17 14.6% 29.0% 18.5%
DollarGeneralCorp UnitedStatesofAmerica Retailing 26.4% 26.4% Jul-17 16.5% 33.5% 39.7%
EsteeLauderCompaniesInc UnitedStatesofAmerica Household&PersonalProducts 60.8% 39.4% May-17 31.6% 19.4% 47.6%
WWGraingerInc UnitedStatesofAmerica CapitalGoods 0.0% 40.0% Jul-17 96.7% 27.9% 40.0%
HomeDepotInc UnitedStatesofAmerica Retailing 40.3% 25.2% Jun-17 51.3% 10.1% 45.8%
HiltonWorldwideHoldingsInc UnitedStatesofAmerica ConsumerServices 44.2% 28.3% Jun-17 26.0% 16.9% 49.1%
IllinoisToolWorksInc UnitedStatesofAmerica CapitalGoods 36.1% 20.6% May-17 58.0% 20.0% 61.9%
MascoCorp UnitedStatesofAmerica CapitalGoods 37.1% 18.1% Aug-17 74.3% 9.5% 66.3%
McCormick&CompanyInc UnitedStatesofAmerica Food,Beverage&Tobacco 12.4% 6.9% Jun-17 29.3% 16.0% 68.8%
MarathonPetroleumCorp UnitedStatesofAmerica Energy 34.0% 33.9% Mar-17 27.0% 27.5% 7.7%
OccidentalPetroleumCorp UnitedStatesofAmerica Energy 6.7% 25.1% Jul-17 100.0% 19.2% 93.3%
Snap-OnInc UnitedStatesofAmerica CapitalGoods -1.8% 15.9% Jul-17 93.6% 28.1% 46.8%
ConstellationBrandsInc UnitedStatesofAmerica Food,Beverage&Tobacco 54.9% 17.9% Jul-17 29.4% 19.0% 49.5%
TotalSystemServicesInc UnitedStatesofAmerica Software&Services 48.5% 35.2% May-17 78.4% 35.7% 66.9%
UnionPacificCorp UnitedStatesofAmerica Transportation 28.1% 23.8% Jun-17 48.6% 30.8% 60.7%
VFCorp UnitedStatesofAmerica ConsumerDurables&Apparel 42.8% 26.2% Jul-17 11.8% 26.9% 78.4%
WasteManagementInc UnitedStatesofAmerica Commercial&ProfessionalServices 23.5% 15.4% Jul-17 88.2% 14.6% 56.1%
WyndhamWorldwideCorp UnitedStatesofAmerica ConsumerServices 51.0% 18.7% Aug-17 47.9% 35.8% 51.4%
SvenskaCellulosaSCAAB Sweden Materials 87.1% 33.1% Jun-17 12.7% 30.3% 93.7%

TheFCOCockpit- GlobalBubbleStatusReport 1stJanuary2018
The above graph shows the one year cumulative return of the stock in blue (left hand scale), NASDAQ100 in green (left hand scale) and the calculated DS LPPLS Bubble Score in red (right hand scale). Thegreen shaded period is the strong positive bubble we identified. The Bubble Score of this five monthbubble has reached 92.3% with a bubble size 31.7%. The strong positive bubble signals and weakfundamentals indicate a high probability of correction in the future.
Quadrant 2 stocks: strong positive bubble signals with weak fundamentalsExample: Wynn Resorts Ltd.
SingleStocks- Quadrant2stocks

TheFCOCockpit- GlobalBubbleStatusReport 1stJanuary2018
Last month example: strong positive bubble signals with weak fundamentals, VFCorp.
SingleStocks- Quadrant2stocks
The figure below plots the one year cumulative return of the stock (blue), S&P 500 (green)and LPPLS Bubble Score (red lines on the right y-axis). The green shaded period is the strongpositive bubble we identified and reported in last month. Note that the stock continued toappreciate after a quick correction, in agreement with our DS LPPLS indicator, butcontradiction with the weak fundamentals. We expect this stock to have a future correctiondue to the strong bubble and weak fundamentals.

TheFCOCockpit- GlobalBubbleStatusReport 1stJanuary2018
Quadrant 3 stocks: strong negative bubble signals with weak fundamentals
SingleStocks- Quadrant3stocks
CompanyName CountryofHeadquarters GICSIndustryGroupNameYearlyReturn
BubbleSize
BubbleStart
BubbleScore
ValueScore
GrowthScore
Ctrip.Com InternationalLtd China Retailing 1.7% -26.2% Jul-17 -1.9% 17.7% 23.1%
IncyteCorp UnitedStatesofAmerica Pharmaceuticals,Biotechnology&LifeSciences -19.4% -29.4% Jul-17 -14.9% 0.1% 59.8%
Genmab A/S Denmark Pharmaceuticals,Biotechnology&LifeSciences -17.7% -27.2% Jul-17 -48.4% 1.1% 18.4%
TelefonicaSA Spain TelecommunicationServices -11.3% -21.5% Apr-17 -48.9% 36.4% 93.9%
GlanbiaPLC Ireland;Republicof Food,Beverage&Tobacco -7.9% -18.5% Apr-17 -35.5% 39.2% 28.0%
GlaxoSmithKlinePLC UnitedKingdom Pharmaceuticals,Biotechnology&LifeSciences -15.5% -20.6% Mar-17 -29.0% 30.7% 26.7%
UnileverNV Netherlands Household&PersonalProducts 20.8% -4.3% Jul-17 -5.5% 24.8% 32.6%
InmarsatPLC UnitedKingdom TelecommunicationServices -31.0% -38.9% May-17 -35.6% 21.4% 1.1%
OrionOyj Finland Pharmaceuticals,Biotechnology&LifeSciences -27.0% -35.2% Mar-17 -21.0% 18.0% 38.3%

TheFCOCockpit- GlobalBubbleStatusReport 1stJanuary2018
The above graph shows the one year cumulative return of the stock in blue (left hand scale), STOXX600 in green (left hand scale) and the calculated DS LPPLS Bubble Score in red (right hand scale). Thered shaded period is the strong negative bubble we identified. The Bubble Score of this six monthbubble has reached 48.4% with a bubble size -27.2%.
Quadrant 3 stocks: strong negative bubble signals with weak fundamentalsExample: Genmab A/S.
SingleStocks- Quadrant3stocks

TheFCOCockpit- GlobalBubbleStatusReport 1stJanuary2018
Last month example: strong negative bubble signals with weak fundamentals,Industria de Diseno Textil SA.
SingleStocks- Quadrant3stocks
The figure below plots the one year cumulative return of the stock (blue), STOXX 600 (green)and LPPLS Bubble Score (red line on the right y-axis). The red shaded period is the strongnegative bubble we identified and reported in last month. Note that the stock went downagain after a rebound at the beginning of this month, which is in synchrony with our DS LPPLSindicator and the weak fundamentals.

TheFCOCockpit- GlobalBubbleStatusReport 1stJanuary2018
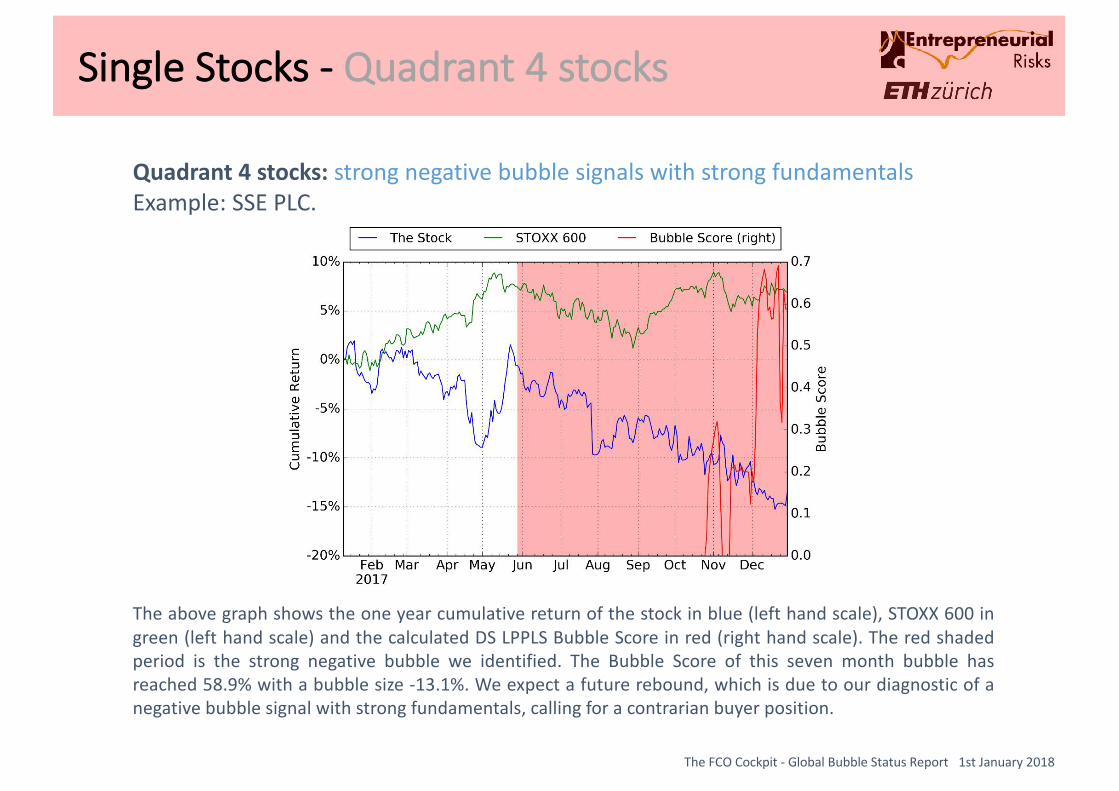
Quadrant 4 stocks: strong negative bubble signals with strong fundamentals
SingleStocks- Quadrant4stocks
CompanyName CountryofHeadquarters GICSIndustryGroupNameYearlyReturn
BubbleSize
BubbleStart
BubbleScore
ValueScore
GrowthScore
WalgreensBootsAllianceInc UnitedStatesofAmerica Food&StaplesRetailing -13.5% -13.5% Jan-17 -7.1% 62.4% 26.5%
APMoeller- MaerskA/S Denmark Transportation -9.4% -11.0% May-17 -63.6% 94.2% 99.5%
SSEPLC UnitedKingdom Utilities -14.7% -13.1% May-17 -58.9% 62.9% 10.1%
CooperCompaniesInc UnitedStatesofAmerica HealthCareEquipment&Services 22.8% -8.6% Jun-17 -30.7% 74.8% 73.0%
TheFCOCockpit- GlobalBubbleStatusReport 1stJanuary2018
The above graph shows the one year cumulative return of the stock in blue (left hand scale), STOXX 600 ingreen (left hand scale) and the calculated DS LPPLS Bubble Score in red (right hand scale). The red shadedperiod is the strong negative bubble we identified. The Bubble Score of this seven month bubble hasreached 58.9% with a bubble size -13.1%. We expect a future rebound, which is due to our diagnostic of anegative bubble signal with strong fundamentals, calling for a contrarian buyer position.
Quadrant 4 stocks: strong negative bubble signals with strong fundamentalsExample: SSE PLC.
SingleStocks- Quadrant4stocks

TheFCOCockpit- GlobalBubbleStatusReport 1stJanuary2018
Last month example: strong negative bubble signals with strong fundamentals, JMAB.
SingleStocks- Quadrant4stocks
The figure below plots the one year cumulative return of the stock (blue), STOXX 600 (green)and LPPLS Bubble Score (red line on the right y-axis). The red shaded period is the strongnegative bubble we identified and reported in last month. Note that the stock went downagain after a small rebound at the beginning of this month, which is in synchrony with our DSLPPLS indicator, notwithstanding the strong fundamentals. We expect this stock to appreciatein the future due to the strong fundamentals and following its neglect by investors inprevious months.

TheFCOCockpit- GlobalBubbleStatusReport 1stJanuary2018
Sectors
GICS Industry Group Name Yearly Return Bubble Size Bubble Score Value Score Growth ScoreJan 1st Dec 1st Jan 1st Dec 1st Jan 1st Dec 1st Jan 1st Dec 1st Jan 1st Dec 1st
Pharmaceuticals, Biotechnology & Life Sciences 12.2% 14.1% 0.0% 0.0% 0.0% 0.0% 61.2% 61.0% 61.1% 60.5%Consumer Services 28.0% 26.4% 0.0% 8.2% 0.0% 100.0% 29.2% 29.3% 54.9% 54.8%Retailing 22.7% 19.8% 0.0% 0.0% 0.0% 0.0% 18.7% 18.8% 53.5% 51.8%Transportation 21.7% 21.0% 18.3% 0.0% 28.5% 0.0% 65.1% 63.1% 63.4% 62.7%Consumer Durables & Apparel 25.7% 27.8% 15.8% 12.9% 80.4% 52.0% 39.5% 39.2% 59.1% 58.5%Semiconductors & Semiconductor Equipment 36.7% 37.9% 0.0% 0.0% 0.0% 0.0% 62.5% 63.1% 30.4% 30.0%Technology Hardware & Equipment 32.7% 35.5% 14.5% 13.7% 22.3% 22.2% 76.7% 73.8% 36.3% 36.9%Automobiles & Components 16.8% 17.3% 16.8% 0.0% 10.3% 0.0% 76.2% 78.1% 48.8% 48.3%Telecommunication Services 0.9% 3.0% 0.0% 0.0% 0.0% 0.0% 58.4% 59.6% 53.3% 52.8%Energy 2.5% -1.4% 6.3% 0.0% 26.8% 0.0% 51.4% 51.5% 58.2% 57.6%Software & Services 31.9% 32.6% 0.0% 18.4% 0.0% 50.4% 34.9% 35.0% 45.9% 46.0%Materials 21.7% 21.4% 0.0% 0.0% 0.0% 0.0% 50.2% 49.8% 52.5% 52.3%Health Care Equipment & Services 22.8% 26.8% 0.0% 23.1% 0.0% 7.4% 64.5% 64.4% 60.9% 60.7%Capital Goods 20.8% 19.9% 17.0% 0.0% 7.6% 0.0% 47.9% 46.6% 50.7% 50.7%Media 2.9% 2.7% 0.0% 0.0% 0.0% 0.0% 43.0% 43.5% 59.5% 59.2%Commercial & Professional Services 18.5% 19.8% 7.1% 0.0% 94.1% 0.0% 24.9% 26.2% 58.9% 58.6%Food & Staples Retailing 8.6% 7.0% 0.0% 0.0% 0.0% 0.0% 59.9% 60.1% 51.4% 51.3%Household & Personal Products 20.4% 19.7% 0.0% 0.0% 0.0% 0.0% 36.6% 37.2% 41.9% 41.8%Food, Beverage & Tobacco 14.2% 13.2% 0.0% 0.0% 0.0% 0.0% 42.6% 41.7% 58.3% 57.7%Utilities 10.4% 17.4% 0.0% 0.0% 0.0% 0.0% 52.8% 53.4% 52.3% 52.4%Insurance 17.3% 17.3% 12.2% 11.7% 27.5% 8.0% - - - -Real Estate 10.2% 13.3% 0.0% 0.0% 0.0% 0.0% - - - -Diversified Financials 20.9% 18.3% 14.7% 15.4% 20.0% 5.9% - - - -Banks 16.6% 14.4% 13.2% 14.4% 32.7% 24.9% - - - -

TheFCOCockpit- GlobalBubbleStatusReport 1stJanuary2018
Sectors
Since Dec 2017, we start to use MSCI World Industry Group Indices and to calculate bubble size and bubble score ofthe corresponding sectors. To determine the value scores and growth scores of the sectors, we average over thecorresponding values for each stock of a given sector, weighted by market cap.
As we can see from the results showed in the previous slide, we found 10 industry groups with significant positivebubble scores: Automobiles & Components, Banks, Capital Goods, Commercial & Professional Services, ConsumerDurables & Apparel, Diversified Financials, Energy, Insurance, Technology Hardware & Equipment, Transportation.
The figure above shows the cumulative return of these 10 industries. The figures in the next three slides show theone year cumulative return of each industry index in blue (left hand scale), and the calculated DS LPPLS Bubble Scorein red (right hand scale). The green shaded period is the strong positive bubbles we identified.

TheFCOCockpit- GlobalBubbleStatusReport 1stJanuary2018
Sectors

TheFCOCockpit- GlobalBubbleStatusReport 1stJanuary2018
Sectors

TheFCOCockpit- GlobalBubbleStatusReport 1stJanuary2018
Sectors

TheFCOCockpit- GlobalBubbleStatusReport 1stJanuary2018
Here we illustrate the methodology of the portfolio construction process based on the resultsof our previous analyses.
For individual stocks that we identified in the 4 quadrants, we constructed 4 portfolios basedon the 4 quadrants defined in the last report. Each portfolio consists of all the stocks listed inthe corresponding quadrant.
(1)Trend-Following Long Stock Portfolio (TFLSP) is made of the stocks that have a positivebubble signal as well as a strong value score. For instance, TFLSP November consists of all thestocks listed in quadrant 1, identified in slide 37 of November 2017 FCO Report.
(2)Trend-Following Short Stock Portfolio (TFSSP) is made of the stocks that have a negativebubble signal as well as a weak value score.
(3)Contrarian Long Stock Portfolio (CLSP) is made of the stocks that have a negative bubblesignal as well as a strong value score.
(4)and Contrarian Short Stock Portfolio (CSSP) is made of the stocks that have a positivebubble signal as well as a weak value score.
PortfolioConstruction&Performance

TheFCOCockpit- GlobalBubbleStatusReport 1stJanuary2018
At the same time, we also classified 20 industries into 4 quadrants, and constructed 4 type ofindustry portfolios based on the 4 industry quadrants. Each portfolio consists of all the stocksin the industries listed in the corresponding quadrant. Following the same definitions asabove, we have Trend-Following Long Industry Portfolio (TFLIP), Trend-Following ShortIndustry Portfolio (TFSIP), Contrarian Long Industry Portfolio (CLIP), and Contrarian ShortIndustry Portfolio (CSIP).
In each month, we initiated 8 new portfolios based on the updated results. The performanceof every 8 portfolios we initiated in November 2017 are presented in the next slide. All of thestocks in our portfolios are weighted by their market capitalizations and we don’t considertransaction cost in the portfolio performance.
Since we started to use a new version of bubble signals and algorithm last month, we onlypresent the portfolios we initiated in November 2017.
PortfolioConstruction&Performance

TheFCOCockpit- GlobalBubbleStatusReport 1stJanuary2018
This month, we find that Contrarian Long Stock Portfolio initiated in November and December 2017 have goodperformances. We have seen some rebounds in the stocks (e.g. Discovery Communications Inc) of quadrant 4 identified inlast month report, which contributes to the out-performance of the Contrarian Long Stock Portfolio. Contrarian Portfoliosare more delicate to use due to their sensitivity to timing the expected reversal and exhibit very volatile performances,indicating that most of bubbles in the market are still dominating and that fundamentals have not yet played out. We expecttrend-following positions to perform in the months following the position set-up and then contrarian positions to over-perform over longer time scales as the predicted corrections play out.
PortfolioConstruction&Performance

TheFCOCockpit- GlobalBubbleStatusReport 1stJanuary2018
VisittheFinancialCrisisObservatoryformoreinformation
http://www.er.ethz.ch/financial-crisis-observatory.html