the financial crisis of 2008: what went wrong? marshall april... · the financial crisis of 2008:...
TRANSCRIPT
The Financial Crisis of 2008: What Went Wrong?
David Marshall*S i Vi P id tSenior Vice President Federal Reserve Bank of Chicago
27th Annual Options Industry Conference27 Annual Options Industry ConferenceWeston, FloridaMay 1, 2009
1*The opinions in this presentation are the presenter’s and do not reflect positions of the Federal Reserve Bank of Chicago or the Federal Reserve System.
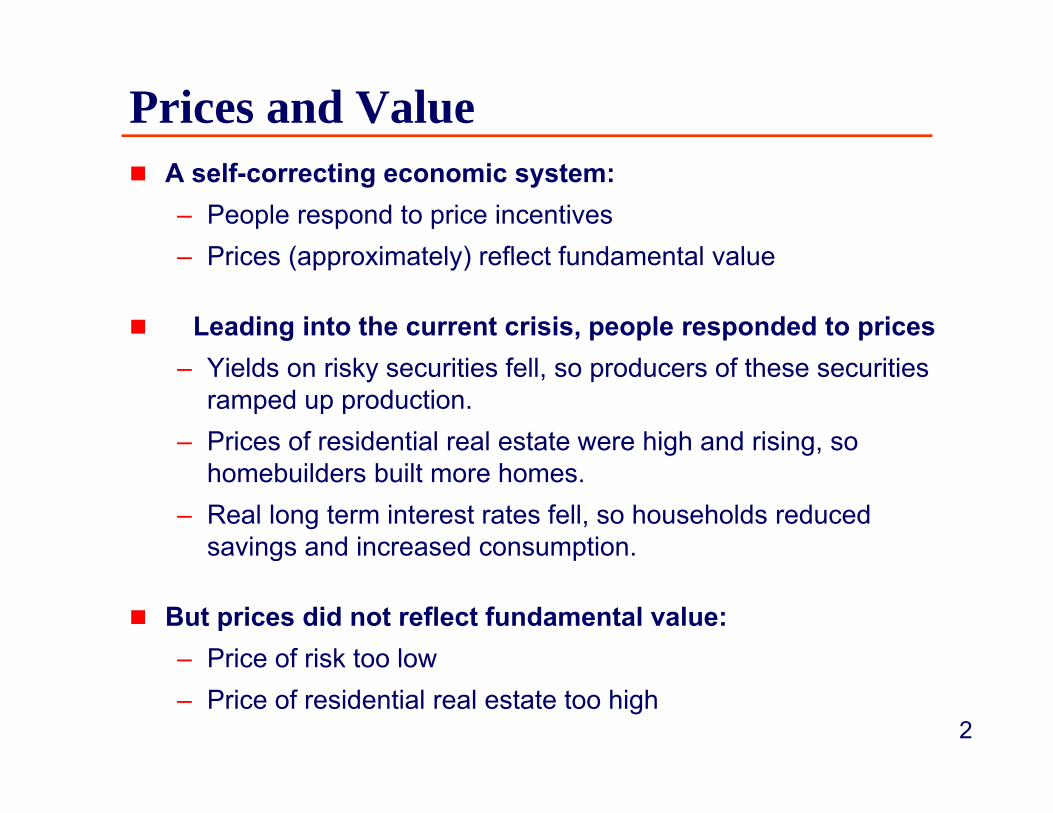
Prices and ValueA self-correcting economic system:– People respond to price incentives
Prices (approximately) reflect fundamental value– Prices (approximately) reflect fundamental value
Leading into the current crisis, people responded to prices – Yields on risky securities fell, so producers of these securities
ramped up production. – Prices of residential real estate were high and rising, so
homebuilders built more homes. – Real long term interest rates fell, so households reduced
savings and increased consumption. g p
But prices did not reflect fundamental value:– Price of risk too low
2
Price of risk too low– Price of residential real estate too high
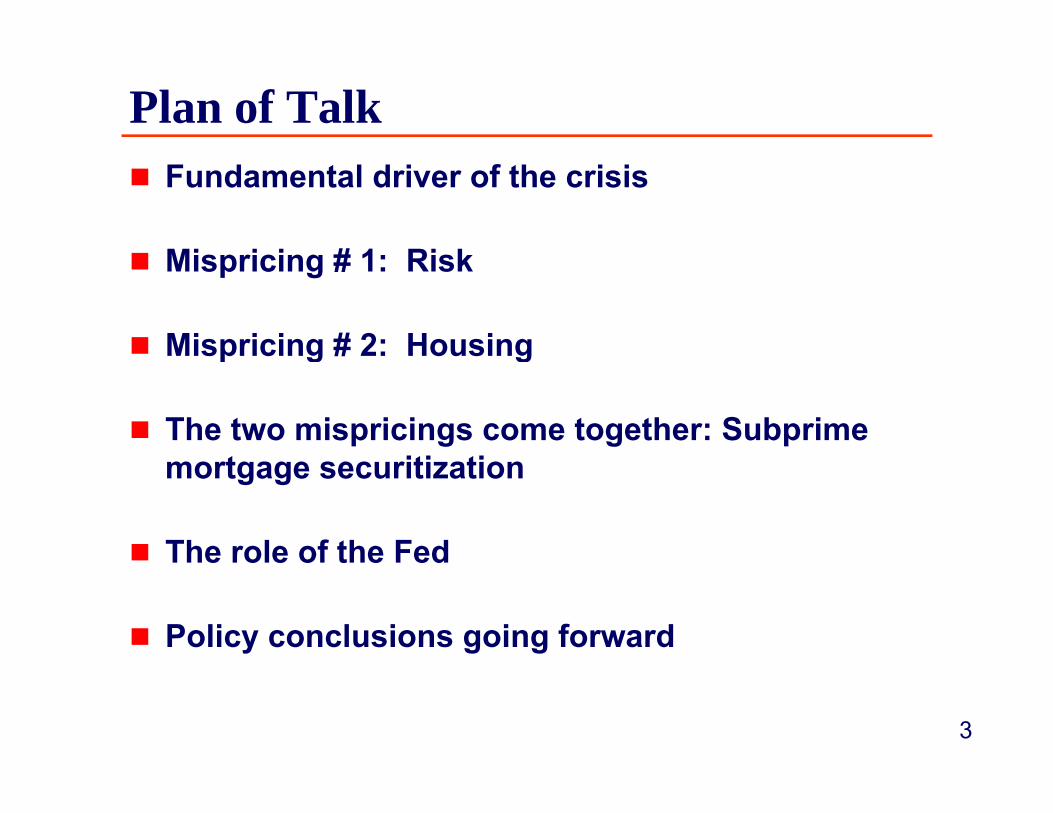
Plan of TalkFundamental driver of the crisis
Mi i i # 1 Ri kMispricing # 1: Risk
Mispricing # 2: HousingMispricing # 2: Housing
The two mispricings come together: Subprime t iti timortgage securitization
The role of the FedThe role of the Fed
Policy conclusions going forward
3

The Fundamental Driver
Massive global capital flows into the U.S. 1998 - 2006 – Increased productivity of East and South Asian workersIncreased productivity of East and South Asian workers– High saving rate– Savings invested in U.S. financial marketsg– Anomaly: Poor countries sending capital to rich.
R lt l l i t t tResult: very low real interest rates
4
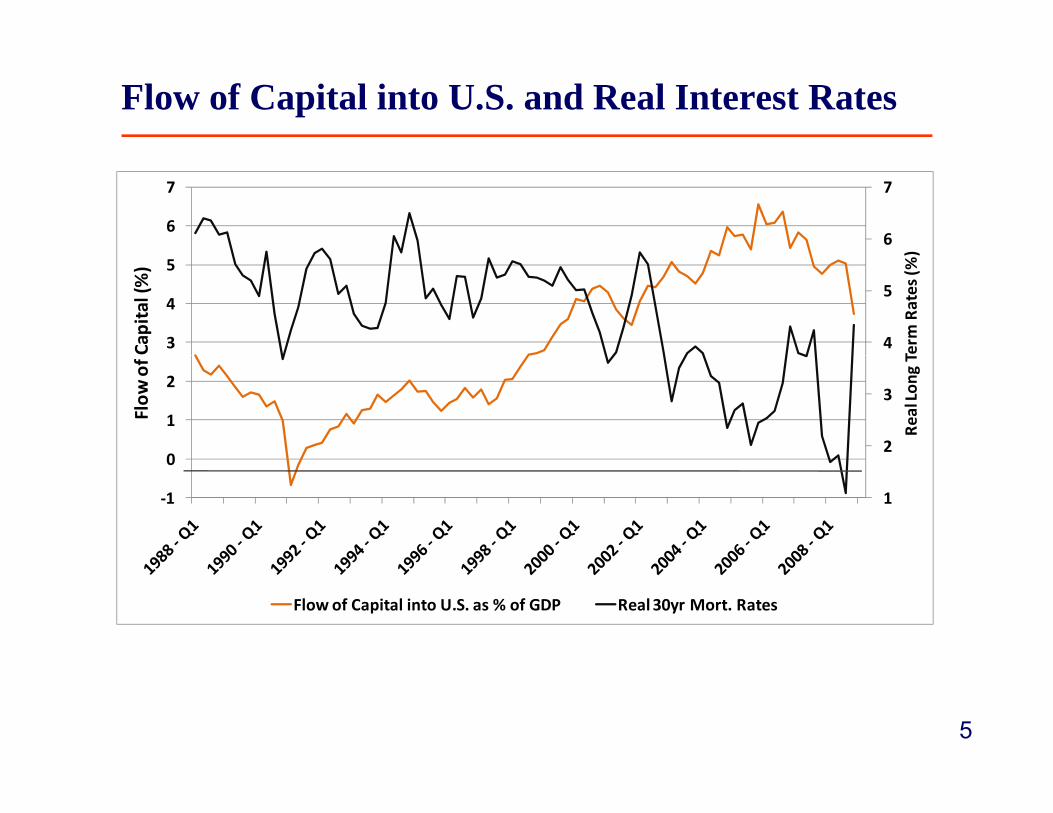
Flow of Capital into U.S. and Real Interest Rates
6
7
6
7
)
4
5
3
4
5
Term
Rates (%
)
Capital (%)
2
3
0
1
2
Real Lon
g T
Flow
of
1‐1
0
Flow of Capital into U.S. as % of GDP Real 30yr Mort. Rates
5

Price of Risk: VIX + Junk Bond Spread
6
7
60
70
4
5
6
40
50
60
Spread
(%)
x Va
lue
2
3
20
30
Junk
Bon
d S
VIX Inde
x
0
1
0
10
VIX Junk Bond Spread
6
Low Risk Pricing
Typical explanation: “The great moderation”– Business cycle variability since 1984 dramatically lowerBusiness cycle variability since 1984 dramatically lower – Lower fundamental risk in the economy
7
Lower Risk or Higher Risk Tolerance?
Alternative explanation: Not only a reduction in risk, but also an increase in risk tolerance.
Strong incentives for portfolio managers to seek out risk:L l i t t t l d i t t h f i ld– Low real interest rates lead investors to search for yield.
– Only way to increase yield: take on additional risk.– Portfolio manager compensation contracts provided further– Portfolio manager compensation contracts provided further
incentives for risk-taking
Bonuses for short-term performance
Hedge fund compensation based on “high water mark”
8
Tail RiskManagers would preferentially take on tail risk:– Risk of low probability but high impact events.– Example: risk of a broad-based house price decline.
Tail risk is extremely difficult to quantifyTail risk is extremely difficult to quantify.
Most risk management approaches measure risk by h t l tilit hi h ’t t t il tshort-run volatility, which can’t capture tail events.
High yields associated with tail-risk strategies show up as α (high risk-adjusted performance) while it really represents β (compensation for risk).
9AIG Financial Products
Mispricing of HousingSurplus capital from abroad increases demand for U.S. securities. – This demand was met by securitizing residential real estate
MBS securitizers needed flow of mortgages to satisfy demand– Vast expansion of sub-prime mortgage originationp p g g g
Major public policy push to extend home-ownership to previously underserved households. p y
Volume of sub-prime mortgages soared to meet this demand– From 2000-2007,From 2000 2007,
Outstanding amount of conforming mortgages doubled,
But subprime grew 800%!
10
– By 2006 , Subprime /Alt-A mortgage issuance ≈ 30% of the mortgage market
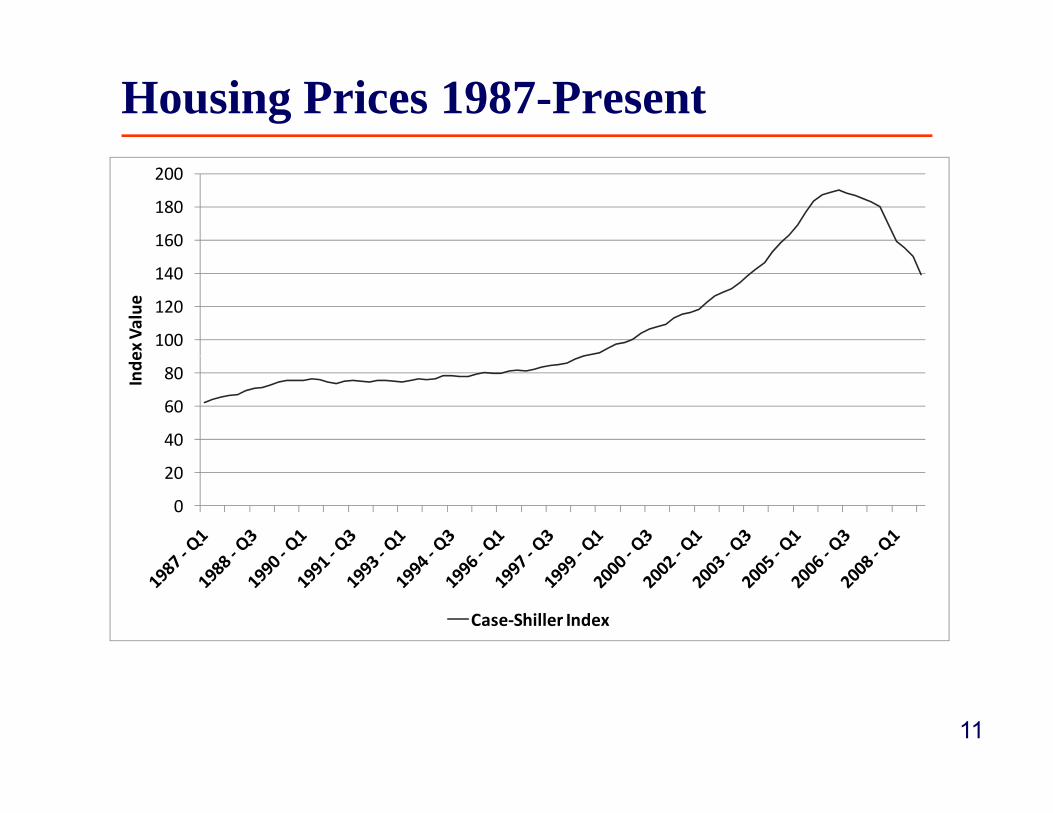
Housing Prices 1987-Present
160
180
200
100
120
140
ex Value
40
60
80Inde
0
20
Case‐Shiller Index
11

Housing Starts: 1960 - Present
3000
2000
2500
tarts
1000
1500
ousand
s of S
500
1000
Tho
0
12

Housing BubbleHow did housing prices get so far above fundamental value?– It’s hard to detect a bubble when you’re in the middle
of it. – Housing starts in 2000 – 2005 within historical range.– Analysis in 2006: increased housing investment could
be justified by fundamentalsbe justified by fundamentalsIncreased household wealth
Financial innovationFinancial innovation.
13
Subprime Mortgage Securitization
Demand for tail risk + housing bubble combined to create a perfect storm: Subprime MBSs
Design of MBSs: equity tranche protects the senior tranches. – Allows senior tranches to achieve AAA status– But: Equity tranche only provides protection if defaults within the
mortgage pool have low correlation. – Rating agencies estimated these correlations from past data.g g p– Impact of tail events on these correlations not taken into
consideration
14

Subprime Mortgage Securitization
Problem: Sub-prime mortgages much more sensitive to house price decline than conventional mortgages
Wh h i i f ll ( i 2006) ll th l ti– When housing prices fall (as in 2006), all the correlations become extremely high!
S i t h t t d f ll f AAA t j kSenior tranches unprotected, fall from AAA to junk.
These formerly AAA-rated assets are now the “toxic assets” – Clogging bank balance sheets– Limiting liquidity provision – Starving the economy for credit– Starving the economy for credit
15
Did the Fed play a role in the housing bubble?
A story put forth by some observers:– The housing bubble was caused by excessively easyThe housing bubble was caused by excessively easy
monetary policy from 2001 – 2004.
T l t thi t d t kTo evaluate this story, we need to ask:– Was the Fed’s monetary policy excessively easy
given the circumstances prevailing in 2001 – 2004?given the circumstances prevailing in 2001 2004?– How much could the housing bubble have been offset
by a more restrictive monetary policy from 2001 –2004?
16
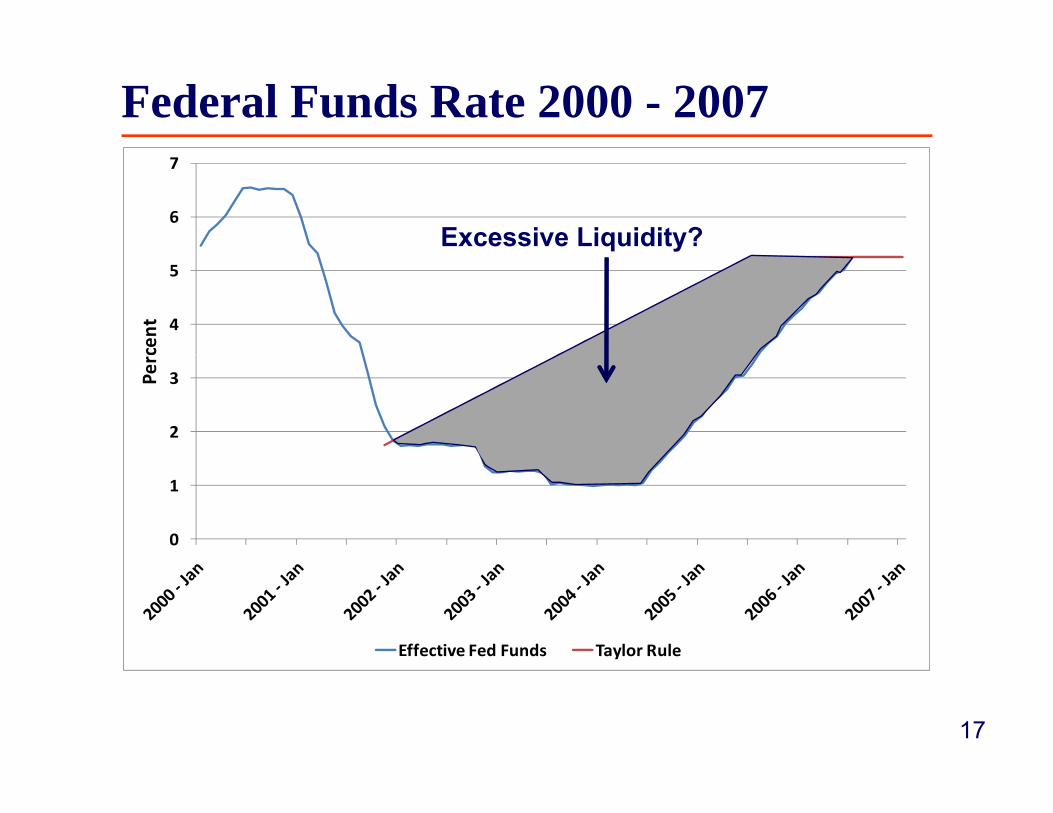
Federal Funds Rate 2000 - 2007
6
7
Excessive Liquidity?
4
5
cent
2
3Per
0
1
Effective Fed Funds Taylor Rule
17
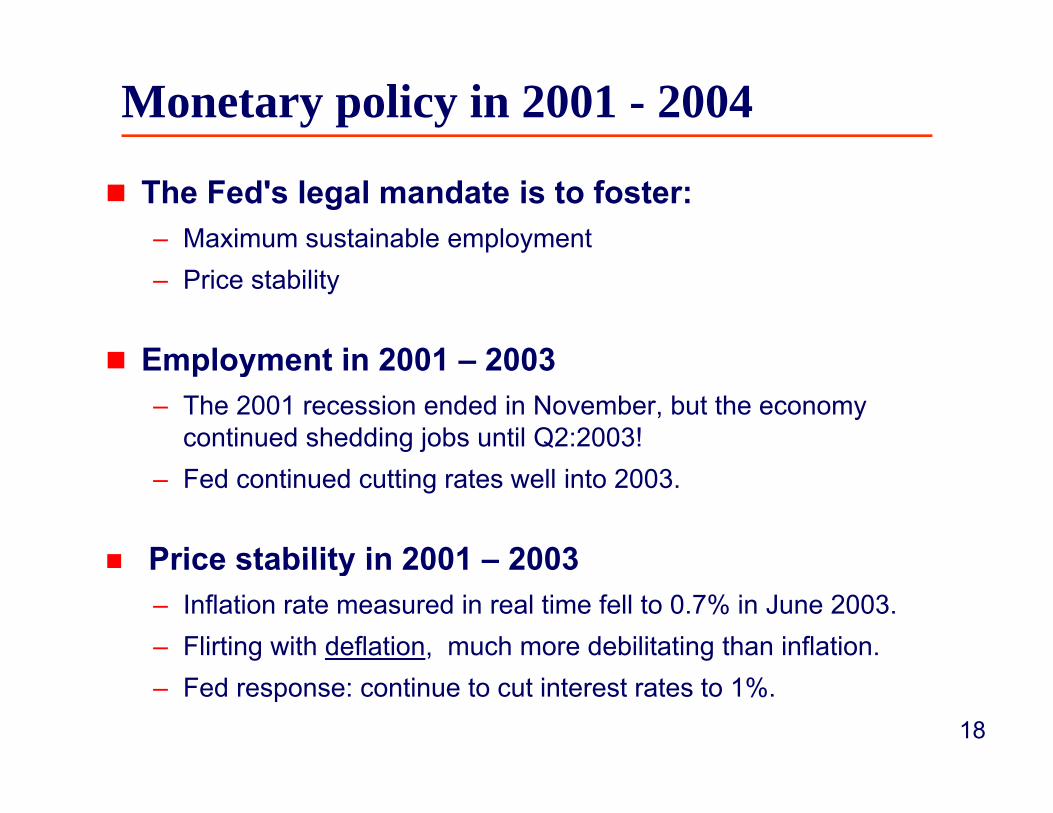
Monetary policy in 2001 - 2004
The Fed's legal mandate is to foster:– Maximum sustainable employment– Price stability
Employment in 2001 2003Employment in 2001 – 2003– The 2001 recession ended in November, but the economy
continued shedding jobs until Q2:2003! – Fed continued cutting rates well into 2003.
Price stability in 2001 – 2003Price stability in 2001 – 2003– Inflation rate measured in real time fell to 0.7% in June 2003. – Flirting with deflation, much more debilitating than inflation.
18
– Fed response: continue to cut interest rates to 1%.
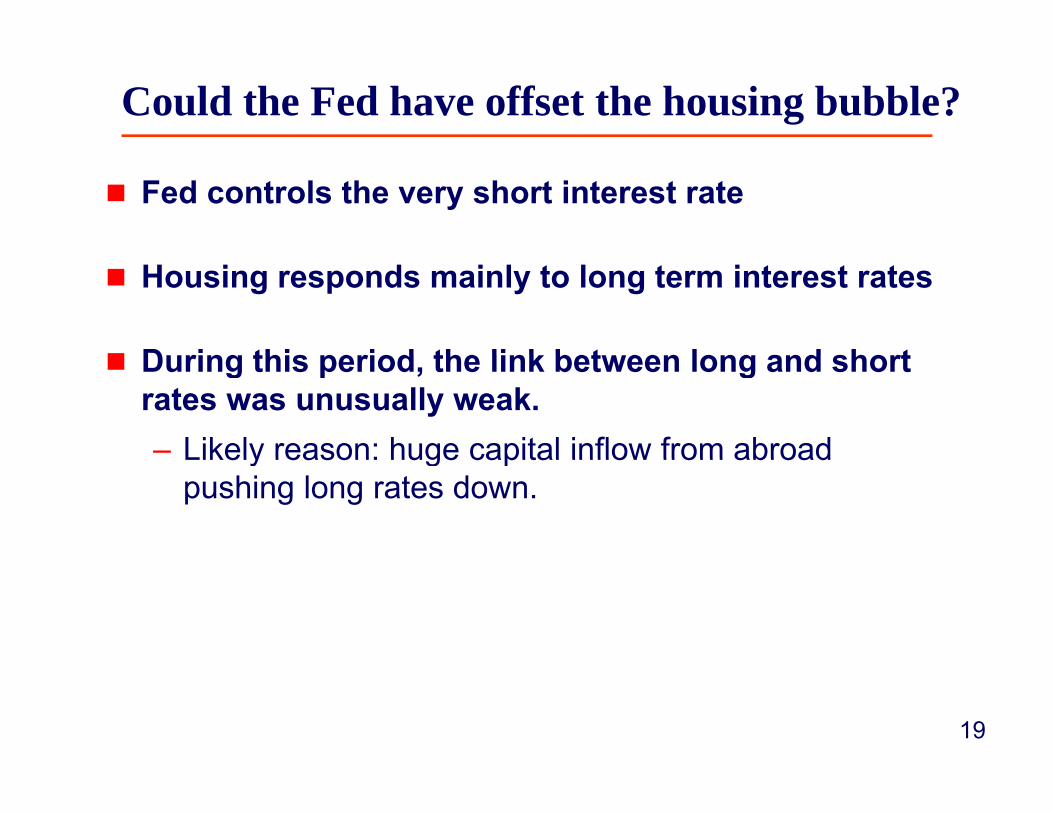
Could the Fed have offset the housing bubble?
Fed controls the very short interest rate
Housing responds mainly to long term interest rates
During this period the link between long and shortDuring this period, the link between long and short rates was unusually weak.– Likely reason: huge capital inflow from abroadLikely reason: huge capital inflow from abroad
pushing long rates down.
19

Relationship between long rates and short rates
20
25
15
cent
10
Perc
0
5
10‐Year T‐Note Yield Fed Funds (Effective)
20
10 Year T Note Yield Fed Funds (Effective)
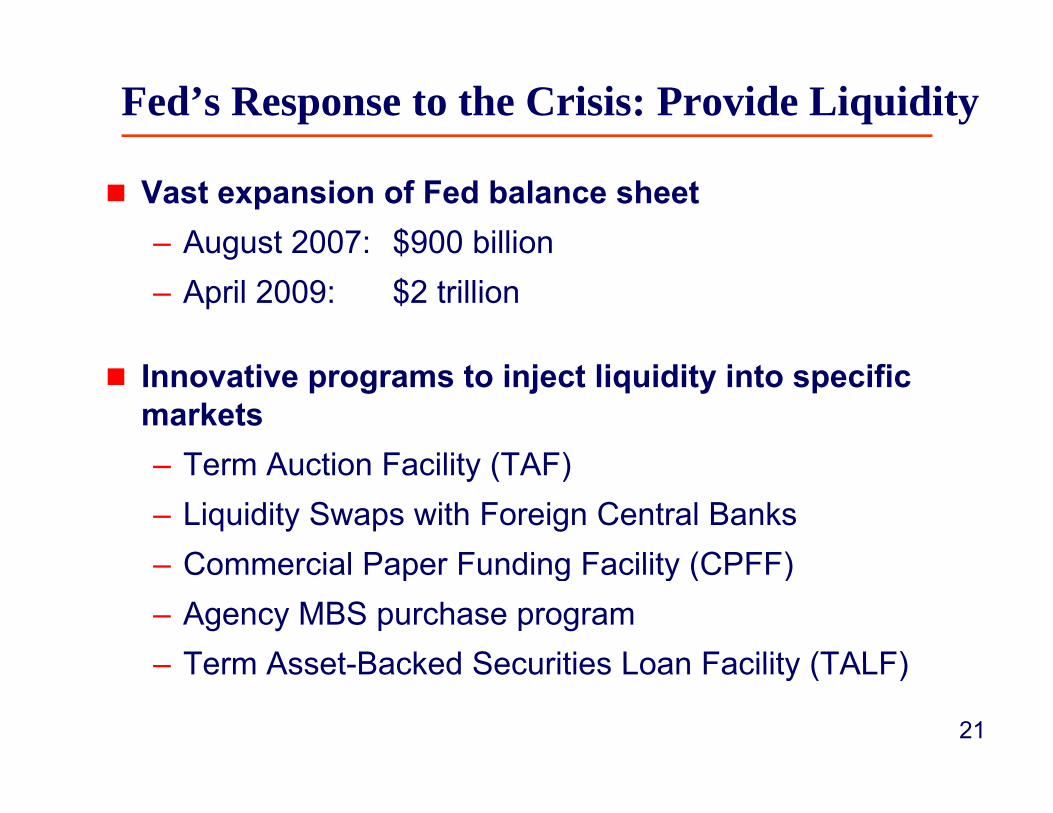
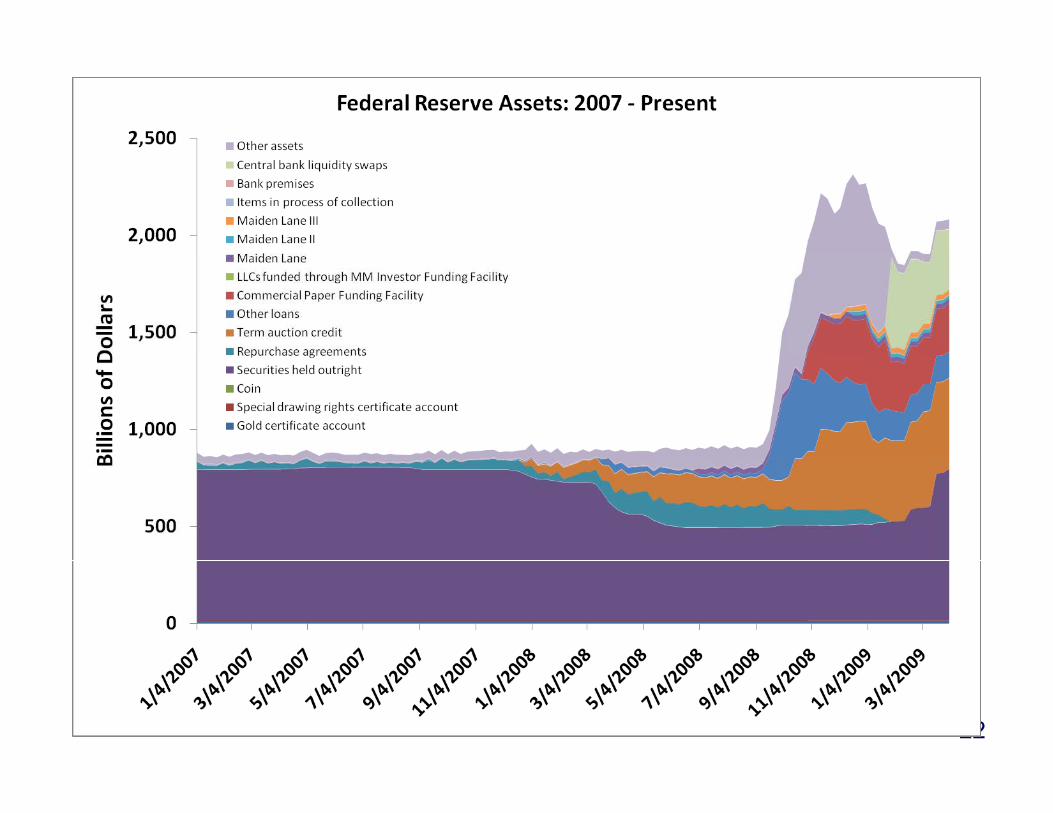
Fed’s Response to the Crisis: Provide Liquidity
Vast expansion of Fed balance sheet– August 2007: $900 billionAugust 2007: $900 billion– April 2009: $2 trillion
Innovative programs to inject liquidity into specific markets
T A ti F ilit (TAF)– Term Auction Facility (TAF)– Liquidity Swaps with Foreign Central Banks
Commercial Paper Funding Facility (CPFF)– Commercial Paper Funding Facility (CPFF)– Agency MBS purchase program
Term Asset Backed Securities Loan Facility (TALF)
21
– Term Asset-Backed Securities Loan Facility (TALF)
22
Long Run Policy ImplicationsMeasurement and containment of tail risk– Managerial incentives– Disruptive effects of housing mispricing
Thorough revision of failure resolution proceduresThorough revision of failure resolution procedures– Bank failure resolution through FDIC works fairly well– No comparable procedures for bank holding companies or non-
banks
Should the Fed pop asset price bubbles?Should the Fed pop asset price bubbles?– Can the Fed identify bubbles in a timely fashion?– Can Fed action have a substantial impact on a bubble?
23
– Will the benefits from popping a bubble exceed the cost?