the fine structure of the spectral lines of h2:...
TRANSCRIPT

The fine structure of the spectral lines of H 2: measurements with a reflexion echelon
B y E. W. F o s t e r a n d S i r O w e n R ic h a r d s o n , F .R .S .
(Received 5 December 1944)
[P la te 4]
The fine structure of the lines of the H 2 spectrum was discovered by Richardson & Williams in 1931, and a short account of their observations was published in a letter to Nature a t the time. Since then no further publication on the subject has appeared. The present paper represents the results of experiments and observations made during the last six years with improved apparatus, including the Royal Society’s 40 plate reflexion echelon. About 250 lines a t the red end of the visible spectrum have been examined and their fine structures photographed and measured. These include most of the im portant lines of the triplet systems 3p3Il^r2 s3N and ‘id 3 E li A ->2p:!/7, as well as im portant lines of the system and 3Y-*-2s3E, together with some lines of the triplet system The singlets arerepresented by about 20 lines coming from the states 3c/1//,;, 3 s127, S1K , 1M ,and 1N and ending in 2pxE or belonging to the system i p 1II >2s127. There is also a small proportion of unclassified lines.
The present paper is limited to a descriptive account of the observations and the analysis and tabulation of the data obtained. The analysis of these data has already been carried out and the results will be published separately.
The plate which reproduces a photograph of the crossed spectra of the stronger lines dealt with is the first published picture showing the fine structure under consideration.
1. I n t r o d u c t io n
This fine structure was discovered by Richardson & Williams in 1931 and the only published description of it is in a letter to Nature (Richardson & Williams 1931) which is brief and provisional. The observations were made with a system consisting of a large Hilger quartz spectrograph crossed with a reflexion echelon. Those now to be described were made by the same method using a larger echelon (40 plates) and other improvements. The apparatus was, in fact, the same as that used by Drinkwater, Richardson & Williams (1940) to obtain the results published in the paper on ‘Determinations of the Rydberg constants, e/m, and the fine structures of H a and Da by means of a reflexion echelon’ apart from modifications adopted to meet the changed conditions of excitation and character of the fines. Altogether 244 fines measured by Gale, Monk & Lee (1928) have been photographed and measured and are here described and analysed. Actually the number of fines is considerably more than 244, as many of these are blends. This often increased the difficulty of interpretation. A photograph of the fine-structure patterns of the strongest of them is reproduced in plate 4. They fie between the wave numbers 17741-92 and 15443-06 (A 5634-807(8) to 6473-615(2)).
The photographing of the spectra was all done in 1938-39 and was brought to a sudden end by the events of September 1939, which included the evacuation of
Vol. 189. A. (17 A pril 1947) [ 1 4 9 ] IO
on July 12, 2018http://rspa.royalsocietypublishing.org/Downloaded from

King’s College, London. This accounts for the limited range of the spectrum represented. However, it is much the most interesting and important part, having regard to the resolution which can be brought to bear in practice on this spectrum at the present time. There were other regions which we should have looked into had there been time.
The work subsequent to September 1939 was carried on mainly a t Chandos Lodge, Alton, Hampshire. This included all measurements of the plates and their reduction, the enlarging and photometry and the analysis and interpretation of the resulting data.
The scope of this paper is confined to a description of the experimental results. The delay in publication is due to the frustrations and interruptions which are inevitable under conditions of total war. The analysis of these results will be dealt with in subsequent papers.
150 E. W. Foster and Sir Owen Richardson
2 . S p e c t r o g r a p h ic e q u ip m e n t a n d m e t h o d s
The spectrographic equipment consisted of a reflexion echelon (40 plates, step width 6*88 mm.) and a Hilger (E 1 type) Littrow spectrograph fitted with a glass optical train. The two instruments were crossed so that the high dispersion of the echelon was in a vertical plane perpendicular to the auxiliary coarse dispersion of the Littrow instrument. Since the particular dispersing apparatus used by us has already been described in detail (Williams 1933; Williams & Middleton 1939) we shall not here do more than briefly refer to it.
A mirror is mounted at each side of the echelon almost parallel to the reflecting faces of the steps. The normals to these mirrors are slightly inclined on opposite sides of the normal to the reflecting faces of the echelon so that the images of the echelon collimator slit in the mirrors provide a series of reference marks (Mv M2, plate 4) which are used for plate measurement. These marks also determine the change in the magnification of the optical system with wave-length.
The echelon is mounted in a vacuum chamber and molecular lines were measured directly (§ 6) in terms of the vacuum wave number of the standard Cd red line Aalr 6438*4696 A or Avac 6440*2491 A. Additional measurements were made with the vacuum chamber filled with air a t a pressure of a few centimetres of mercury. The inter-order dispersion was obtained from measurements of the separation of very sharp argon lines appearing in approximately the double-order position.
On each plate it was usual to record the standard Cd line several times with different exposures both before and after an exposure of the molecular spectrum. The argon spectrum also was usually exposed after the molecular spectrum. Unless there was good reason to do otherwise a plate was discarded if the Cd exposures before and after were not in agreement. This happened in only one case (when it is believed that some mechanical shock had disturbed the relative orientation of the echelon and its mirrors) after precautions to keep the laboratory temperature constant (+ 0*1° C) had been taken.
on July 12, 2018http://rspa.royalsocietypublishing.org/Downloaded from
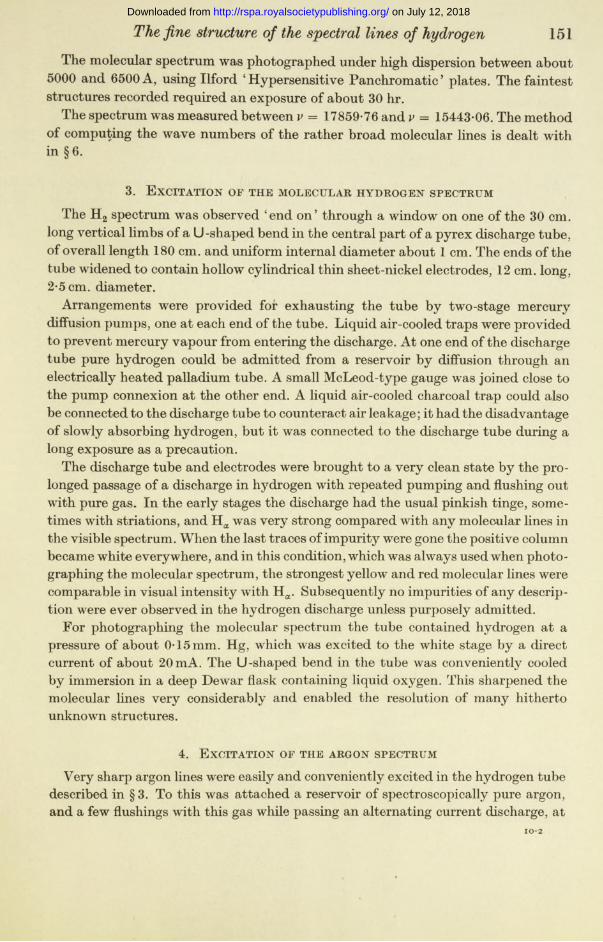
The molecular spectrum was photographed under high dispersion between about 5000 and 6500 A, using Ilford ‘Hypersensitive Panchromatic’ plates. The faintest structures recorded required an exposure of about 30 hr.
The spectrum was measured between v = 17859-76 and v = 15443-06. The method of computing the wave numbers of the rather broad molecular lines is dealt with in §6.
3. E x c it a t io n o f t h e m o l e c u l a r h y d r o g e n s p e c t r u m
The H2 spectrum was observed ‘end on’ through a window on one of the 30 cm. long vertical limbs of a U-shaped bend in the central part of a pyrex discharge tube, of overall length 180 cm. and uniform internal diameter about 1 cm. The ends of the tube widened to contain hollow cylindrical thin sheet-nickel electrodes, 12 cm. long, 2-5 cm. diameter.
Arrangements were provided for exhausting the tube by two-stage mercury diffusion pumps, one at each end of the tube. Liquid air-cooled traps were provided to prevent mercury vapour from entering the discharge. At one end of the discharge tube pure hydrogen could be admitted from a reservoir by diffusion through an electrically heated palladium tube. A small McLeod-type gauge was joined close to the pump connexion at the other end. A liquid air-cooled charcoal trap could also be connected to the discharge tube to counteract air leakage; it had the disadvantage of slowly absorbing hydrogen, but it was connected to the discharge tube during a long exposure as a precaution.
The discharge tube and electrodes were brought to a very clean state by the prolonged passage of a discharge in hydrogen with repeated pumping and flushing out with pure gas. In the early stages the discharge had the usual pinkish tinge, sometimes with striations, and Ha was very strong compared with any molecular lines in the visible spectrum. When the last traces of impurity were gone the positive column became white everywhere, and in this condition, which was always used when photographing the molecular spectrum, the strongest yellow and red molecular lines were comparable in visual intensity with Ha. Subsequently no impurities of any description were ever observed in the hydrogen discharge unless purposely admitted.
For photographing the molecular spectrum the tube contained hydrogen at a pressure of about 0-15 mm. Hg, which was excited to the white stage by a direct current of about 20mA. The U-shaped bend in the tube was conveniently cooled by immersion in a deep Dewar flask containing liquid oxygen. This sharpened the molecular lines very considerably and enabled the resolution of many hitherto unknown structures.
The fine structure of the spectral lines of hydrogen 151
4. E x c it a t io n o f t h e a r g o n s p e c t r u m
Very sharp argon lines were easily and conveniently excited in the hydrogen tube described in § 3. To this was attached a reservoir of spectroscopically pure argon, and a few flushings with this gas while passing an alternating current discharge, at
IO-2
on July 12, 2018http://rspa.royalsocietypublishing.org/Downloaded from

152 E. W. Foster and Sir Owen Richardson
about 100 mA, sufficed to remove residual hydrogen almost completely (Ha appeared very faintly). The converse process more rigorously applied was used to remove argon before an H2 exposure. When photographing the argon spectrum the discharge tube bend was cooled in liquid oxygen.
The-Cd red line was excited in a water-cooled hollow cathode tube very similar to tha t described by Schuler (1931). The iron cathode, about 3 cm. deep, 1 cm. bore, contained a few pieces of metallic cadmium. I t was found tha t the red line could be strongly excited in such a tube (exposure time about 2 min.) a t lower current (about 80 mA) using pure argon as the carrier gas instead of the more usual helium (about 200 mA), presumably due to the greater sputtering of the cadmium in argon. This resulted in such an obviously sharper contour for the red line tha t argon was adopted in spite of the more elaborate gas purification system required.
Pure argon, at a pressure of about 0*05 mm. Hg, was circulated continuously through the Cd tube. The purification was effected by including in the circulator system a second (&o£-cathode) Schuler tube containing metallic calcium. This tube passed a current of several amperes and effectively absorbed the inevitable residue of oxygen and nitrogen. Residual hydrogen was removed in the usual manner by passing the gas through a quartz tube containing red-hot copper oxide. W ater vapour and remaining impurities were condensed in a liquid oxygen-cooled trap. The continuous circulation was effected by a two-stage mercury diffusion pump.
The wave number of the Cd line as excited by this source was not compared with the wave number from a standard source. Williams & Gogate (1938), however, have compared the wave number from a Cd-He Schuler tube indirectly with a standard Cd source and have found no appreciable difference. We have assumed th a t the substitution of argon for helium carrier gas will make no difference to the wave number of the Cd line.
6 . M e a s u r e m e n t a n d r e d u c t io n o p p l a t e s
As will be seen from plate 4 (the dispersion is 0*726 cm-1 per order) the molecular lines are quite broad and, for reasons discussed below, it was not possible, in general, to reduce measurements directly by the simple method devised by Williams (1931) for sharp lines and thereby obtain results of the desired accuracy.
The equation of the echelon intensity envelope may be written
s being the echelon step width, A the wave-length and a and /? the (very small) angles of incidence and reflexion, for the reflecting surface of the step. When 0 a fine is said to be in single-order position; in which case, if the natural intensity distribution in the line is symmetrical, it will remain symmetrical in the diffraction
5. E x c it a t io n o f t h e s t a n d a r d c a d m iu m r e d l i n e
*7TS(0C + jS): A
on July 12, 2018http://rspa.royalsocietypublishing.org/Downloaded from

pattern. For all other values of X between ± /r the original symmetry will be distorted by the envelope effect.
I t appears that the position of the ‘optical centre of gravity’ of a distorted component in the echelon pattern can be measured to a good approximation by the method described in the following paragraph. I t is not obvious why this should be so, but we adopted the method in spite of its empirical nature since with the time and apparatus available it would have been impossible to microphotometer more than a small fraction of the lines actually measured, and owing to the considerable blending in the coarse dispersion it is doubtful whether the accuracy of the visual measures could have been improved much in very many cases.
Measurements were made with a specially constructed Hilger measuring microscope (Williams & Middleton 1939), the unusual feature of which was a travelling stage. On any one plate the position of a component was measured with respect to the reference marks M1 and M2 associated with the line in question. As a rule, twelve settings were made on the visually estimated centre of intensity of the component and six on each of the (considerably sharper) associated reference marks. Six of the settings on the component and three of those on the reference marks were made traversing the plate in the direction of increasing order of interference, and corresponding settings were made while traversing in the opposite direction. To change from the first measuring position to the second, the plate was rotated through 180° about a normal axis so tha t the microscope stage required moving in the same direction, whether for measurements in the direction of increasing or decreasing order of interference. The mean of the two sets of measures was taken. When a component appeared in more than orte order all orders were measured, but it seldom happened tha t more than two orders were visible. The weakest lines were measured on only one plate but the majority have been measured on five or six plates.
The problem remaining was to relate the position thus obtained for the ‘ optical centre of gravity ’ of the component with the position which the component would assume if its width is imagined to become vanishingly small, i.e. with the limiting position of the line, as the temperature of the source tends to zero. When this is solved the calculation of wave number may be concluded by Williams’s method referred to above.
The procedure adopted was as follows:(i) The characteristic linear inter-order dispersion was obtained by measurement
of several sharp argon lines appearing in almost symmetrical double-order position,* X = ± \n (when the intensities in the two orders are equal). These dispersions were reduced to the value for the Cd red fine, and it was assumed that this was the
* Cases w here th is is app rox im ate ly realized for lines o f th e H 2 spectrum can be seen on p la te 4; for th e following lines of 3 p377 -*■ 2s 15552*37 (10), 4 ->-4, 1,15859*86 (5), 3->3, P 0 ,16121*52(8), 2 2 , P 0 , 16314*99(4), 0 ->0, P 4, 16440*72(10), 1-»*1, R l , 16611*43(10), 0 -> 0 ,Q 1; for th e 2 ->0, R 1 line o f 3 p 3Z -> 2 s 3E: 15669*39(4); for th e high-frequency com ponent o f th e following lines ending on 2 p8i7 (the low -frequency com ponents w hich lie to th e left are invisible in th e le ft-hand orders owing to th e envelope effect) 16458*03(5), 3d 3I7d -> 2p 311.3 ->*3, P 1, 16654*24(9), 3d * 2 7 -+ 2p®/7, 0 -* 0, Q 3 a n d 16692*00(5), 3d ®77d 2p *J7, 1 -+1 , P 3.
The fine structure of the spectral lines of hydrogen 153 on July 12, 2018http://rspa.royalsocietypublishing.org/Downloaded from

154 E. W. Foster and Sir Owen Richardson
dispersion for infinitely sharp lines. Similar measurements were made on a number of molecular lines also appearing in (or very nearly in) the double-order position (the equality of intensity was checked microphotometrically), and the apparent linear dispersion at A Cd red was computed for these fines also. The value was less than the value for the sharp argon fines by about 0*02 order. One-half the difference between the argon and hydrogen order separations was taken as the displacement of a typical hydrogen fine towards the centre of the intensity envelope at = ± \n .We refer later to this quantity as the ‘half-order defect’.
(ii) The position of the intensity maximum relative to the midpoint of the mirror marks was found approximately for any plate by determination of the distance between the position of the midpoint of the mirror marks and the midpoint of the orders of a fine in double-order position. A fine was considered to be in double-order position when , microphotometer measures showed that the intensities in the two orders were equal. Having found the approximate position of the intensity maximum relative to the midpoint of the mirror marks it was a simple m atter to find an approximate value of the fractional part f j of every component referred to the intensity maximum, from the fractional part f m derived directly from the measurements.
(iii) I t was assumed that for a fine having a fractional part the displacement D towards the centre of the intensity curve would be proportional to the slope of tha t curve, i.e.
D = ~ K ~ = (X cos X - sinX)
at the point where the fine occurred. D was plotted against with the value of K adjusted so that the half-order defect was equal to D when r.
(iv) The defect in the fractional part for a fine in any position could then be found. This was added to the observed fractional p a r t/m giving the position which the fine would have occupied had it been infinitely sharp. The remainder of the calculation was carried out by the method of Williams.
Results for the same fine in different orders and in different positions (position varied by changing pressure in the echelon chamber) showed good agreement, so tha t for practical purposes the assumptions made were justified.
7. O n t h e p o s s ib il i t y o p s y s t e m a t ic e r r o r s i n t h e r e s u l t s f r o m m e a s u r e m e n t s ON PARTICULAR PLATES AND COMPARISON OF MEAN RESULTS WITHG a l e , M o n k a n d L e e ’s d a t a
Gale et al. (1928) interferometer measures on eleven single, or substantially single, fines are compared with our individual results from particular plates and with the means of our results in table 1. The eleven fines are all members of the system 3 p377-> 2s 3A7. There is little doubt that these fines have some structure, but for practical purposes they are observationally simple with the resolution tha t can be brought to bear on them at present.
on July 12, 2018http://rspa.royalsocietypublishing.org/Downloaded from

The fine structure of the spectral lines of hydrogen 155
Wave numbers in italic type have been obtained from the measurement of one order of a line only; in ordinary type they have all been obtained on measurements on two orders.
The ‘weighted mean of all our results = vF ’ may include results other than those given in the table. For comparison of results on individual plates, only results from measurements on the same number of orders for a given line on any one plate have been included.
T a b l e 1w eighted
p la te n u m b er -> 40 83 84 85 86 m ean o f all ou r
G.M .L. ou r resu lt (decim al p a r t only) resu lts defecty c m r 1 = vG (G.M .L. resu lt) — (our resu lt) = ‘d e fe c t’ = vF VG ~ VF
15552-37* (10) •327 •334 •328 •320 •327 •327 •0434 -* 4 , 1 •043 •036 •042 •050 •043 ? ± -008
15621-96* (10) •962 •963 •959 •958 •958 •960 •0003 -» 3 , 3 - •0 0 2 - 0 0 3 •001 •002 •002 ±•005
15767-10* (7) •062 •071 •067 •070 •068 ■067 •0333 -> 3 , 3 •038 •029 •033 •030 •032 ±•006
15787-23* (5) •218 •216 •213 •219 •206 •212 •0183 -*3 , Q 2a n d •012 •014 •017 ■Oil •024 ±•008
15800-76* (10) •739 •748 •740 •744 •746 •743 •0173 -> 3 , Q 1 an d ?$•021 •012 •020 •016 •014 ±•008
15870-10* (10) •066 •067 •068 •057 •058 •063 •0372 -> 2 , 3 •034 •033 •032 •043 •042 ± 0 0 6
16046-28* (7) •249 •251 •253 ■249 •258 •252 •0382 ->2, •031 •029 •027 ■031 ■022 ±•006
16121-52* (8) •490 •498 •494 •491 •486 •492 •0282 ->2, •030 •022 •026 •029 •034 ±•004
16168-95* (10) ■915 •916 •914 •912 •918 ■915 •0352 2, B 1 •035 •034 •036 •038 •032 ± -004
16330-59* (10) •567 •566 •568 •569 •571 •576 •0141 -►!, Q 1 •023 •024 •022 •021 •019 ±■006
16611-43* (10) •405 •401 •400 •396 •395 •399 •0310 -> 0 , 1 •025 •029 •030 •034 •035 ± 0 0 3
m ean defects •026 •023 •026 •028 •028 — •027
J See T able 3 for possible w eak blends.
The wave number of the line 15,552-37 may be affected by the nearby 15549-47 (3) 3p377-*• 2 s827, 3 3, P 4 which does not appear on our plates.
From table 1, and an expanded table of the same form which includes lines not measured with the interferometer by Gale et al., it is concluded that our plates give self-consistent results and that there is no systematic error relative to the mean result from all others, in any one of them > c. 0-002 cm.-1.
on July 12, 2018http://rspa.royalsocietypublishing.org/Downloaded from

156 E. W. Foster and Sir Owen Richardson
8 . O n t h e p o s s ib il i t y o f o u r m e a n r e s u l t s b e in g
SUBJECT TO A SYSTEMATIC ERROR
The H 2 lines were not measured directly in terms of the cadmium red line as an internal standard in the discharge tube, but one plate (no. 39) was obtained with a discharge atmosphere consisting of hydrogen and argon, and a few hydrogen lines given in table 2 were measured in terms of an accurately known argon line (i> = 15580*9840 ± 0-0005 cm.-1) which had been measured previously against the cadmium line as internal standard (plate no. 79). The results should, for practical purposes, be as significant as if the H2 lines had been measured against cadmium as an internal standard in a hydrogen discharge.
T a b l e 2
va 15552-37* 15767-lOf 16126-19f 16440-72f 16611-43fvFt •327 •067 •149 •693 •399V39 •341 •065§ •144§ •690 •404
Vq - V f •043 •033 •041 •027 •031VG-V30 •029 •035 •046 •030 •026
* See rem ark on th is line on p . 155. f Gale et al. in te rfe rom ete r m easures.X F igures in th is row are ta k e n from ta b le 3*§ M easured in one o rder only; th e o th e r figures in th is row are from tw o orders.
From table 2 are obtained the mean defects:
vG — vF — '035 cm.-1 and — -033 cm.-1.Hence it is concluded that there is no important systematic error in our final ( results, of table 3, unless there is some fundamental error of method.
9. O n t h e d i f f e r e n c e b e t w e e n o u r r e s u l t s a n d t h o s e o f G a l e , M o n k a n d L e e
From tables 1 to 3 it is clear tha t there is an appreciable difference between our vacuum wave numbers and those of Gale al. The irregular part of this difference in some cases is mainly due to the difficulty of eliminating completely the interference of neighbouring fines in this closely packed spectrum. But there is evidently a systematic difference of roughly 0-03 cm.-1, in the region 15,500 to 16,600 wave numbers, our values being lower. For this region, about 0-015 cm.-1 of the difference is accounted for by the different air-dispersion formulae used in the two cases.*
There seems to be no reason to doubt the validity of our results within the limits given. The residual difference of about 0-015 cm.-1 (0-006 A.) is difficult to account for.
* Gale et al. Aair m easurem ents w ere reduced w ith th e fo rm ula o f M eggers & P e te rs (1918), w hilst in ou r case th e v acuum w ave n u m b er o f th e Cd line w as co m p u ted using th e fo rm u la o f Sears & B arre ll (1939).
on July 12, 2018http://rspa.royalsocietypublishing.org/Downloaded from

1 0 . O n d e d u c i n g t h e s t r u c t u r e s
In this, the minimum amount of attention was paid to what was expected of a line, but in some of the more confused and badly blended lines it was often necessary to have some guidance as to structure besides what was provided by our observations. The structures given may not invariably be a unique interpretation of the observations in such cases, but, coupled with making a tolerably good fit with the v of Gale et al. and a reasonable balance with their intensities and also a fair fit with what might be expected from the stucture and properties of related fines for which the determinations are free from ambiguity, it is believed that the structures are substantially correct in most, if not all, cases. In the relatively few cases where our results show a substantial disagreement with those of Gale et al., it may sometimes be taken as a sign tha t something is amiss, but this does not always apply, since the poorest fits are mostly concerned with fines that were evidently not properly resolved by Gale et al., and hence probably not accurately measured. Moreover, the intensity distribution in our spectrum and tha t of Gale et al. or of Merton & Barratt (1922) is quite appreciably different. On our plates, as a rule, lines with high rotational quantum number (say n>3) are relatively quite weak compared with the Gale et al. value, so tha t in complex fines involving, for example, one such fine and a low rotational fine, comparatively large differences in the composite v may be tolerable.
The fine structure of the spectral lines of hydrogen 157
1 1 . E x a m p l e o f a n a l y s is o f a c o m p l e x s t r u c t u r e
We shall now describe an example of the treatment used in one of these, relatively few, instances where the echelon observations together with the results of Gale et al. are insufficient to provide a unique interpretation of complex patterns; so that we are obliged to make use of some empirical and certain theoretical predictions to analyse the patterns. No simple routine can be stated since every case is different, but the following example gives some idea of the kind of treatment.
The example chosen is the following group of fines taken from table 3:
VG in ten sity classificationreference
le tte r
approx . 2 (order o f
interference)16917-50 (3) 3 s3X ^ 2 p 3II , 1 -* 1 , X 23273-6116916-57 (0) 3 s3Z -* 2 p * I l , 1 -» 1 , an d
n d 3A e-+ 2p3II , 2 ->2, 6Y 23272-34 r
16915-33 (3) 3a3E ^ 2 p 3n , 1->1, Z 23270-63,
The path difference 2 tcorresponding to the position of the intensity maximum is about 1*3757124 cm., so that the order of interference at the position of the intensity maximum is as given in the right-hand column above. The range of wave numbers in this group is only about 2*2 so that the members appear as a single pattern. Comparing 2pf’s it is clear that overlapping orders will be formed for the fines in X and Y if both are single or if both have similar structures.
on July 12, 2018http://rspa.royalsocietypublishing.org/Downloaded from

158 E. W. Foster and Sir Owen Richardson
Our observations on this group combined measurements on four lines designated (A + ), (?6), (B) and ( . A), where (A + ) was evidently the next higher order of ( . ) and
need not be considered further for the present discussion. This leaves:
com ponen t (?&) (B ) (-4) \observed in te n s ity 1/3 3 8 1 (2)fractional p a r t , f m — 0*223 — 0*438 — 0*681 J
I t will be noted tha t none of these fractional parts corresponds with the fractions of the listed orders of interference (1). Now it is clear from the intensities (3) and (3) assigned respectively to X and Z and from the assignments of intensity (3) and (5) to (B) and (A) respectively tha t as far as the bulk of the intensity is concerned, (B) and (A) together somehow belong to the lines X and Z. Since the decimal parts of the orders of interference for X and Z are about the same and since Gale et al. intensities for these lines are also the same, this suggests that about one-half of (B) and one-half of (A) should be assigned to X and the other halves of each to Z. Assigning weights 3 and 5 to lines ( B )and (A) respectively, then
(3 x 0*438 + 5 x 0*6811 „ M- { ----------- 8------------} = - ° - 69
is obtained for the fractional parts of the * optical centre ’ of these components, in satisfactory agreement with the decimal parts of the orders of interference for X and Z,
In further support of the above is the fact tha t X and Z are classified fines, and it is known from results obtained on many rather similar fines ending on 3i7 that each is likely to appear as a doublet, with components a and b about 0*18 cm.-1
1(b) 2apart and intensity ratio 1(a) I t therefore appears that X is composed of
i 1 3 - d Z * — 1 of f r « J . so tha t = ?; thisbx intensity 2)
ratio should be
I(a1 + a2) 5’1(B) This suggests that B still contains some unassigned1(A) 5
strength.Turning now to the fine F, one has the component (?6) and the unassigned in
tensity of about 1 in (B). I t if be supposed that these two constitute the fine F, then1 x 0 223 4- 3 x 0 438j _ _ Q.gg jg obtained for the fractional part of the ‘optical
centre’, which is in good enough agreement with the decimal part of the corresponding 2 vt.Thus to Y is assigned components as, 63, having intensities 1 and 1/3 respectively.
I t thus appears tha t the three observed components (16), (B) and (A) are the result of the blending of a t least six lines of which component (A) has two and (B) has three. The effect on the pattern of the possible 2->2, P 6 in F is assumed
to be negligible since it would be very weak in our spectrum.
on July 12, 2018http://rspa.royalsocietypublishing.org/Downloaded from

A final check on these assignments is provided by the combinations between the individual components ax, b2, a2, b2, a3, b3 with other fines having final levels of the 2 pZIJ state. These will be considered in a subsequent paper dealing with the analysis of the fines ending on tha t state.
In table 3 the observed zly’s for 16,917*50 and 16,915*33 are both 0*193 cm.-1 but it is known from the behaviour of many fines ending on 2 377 that more probable values are the alternatives also entered in column 3. Our incomplete resolution does not show up these small differences.
The fine structure of the spectral lines of hydrogen 159
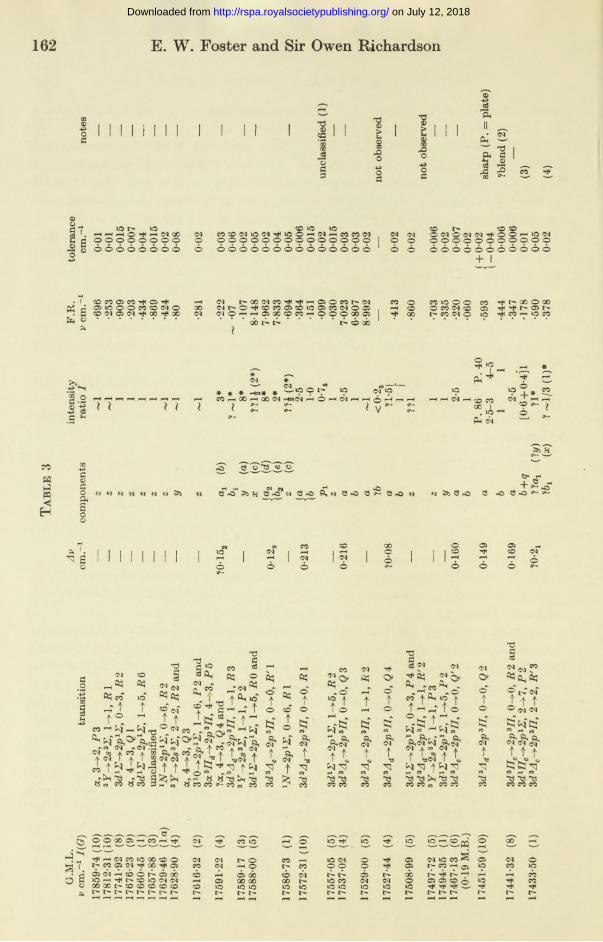
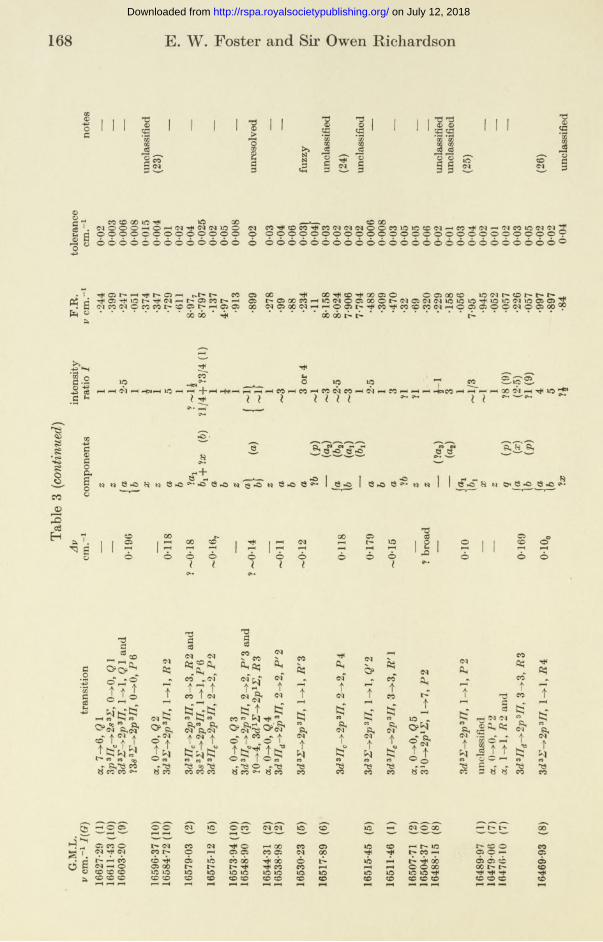
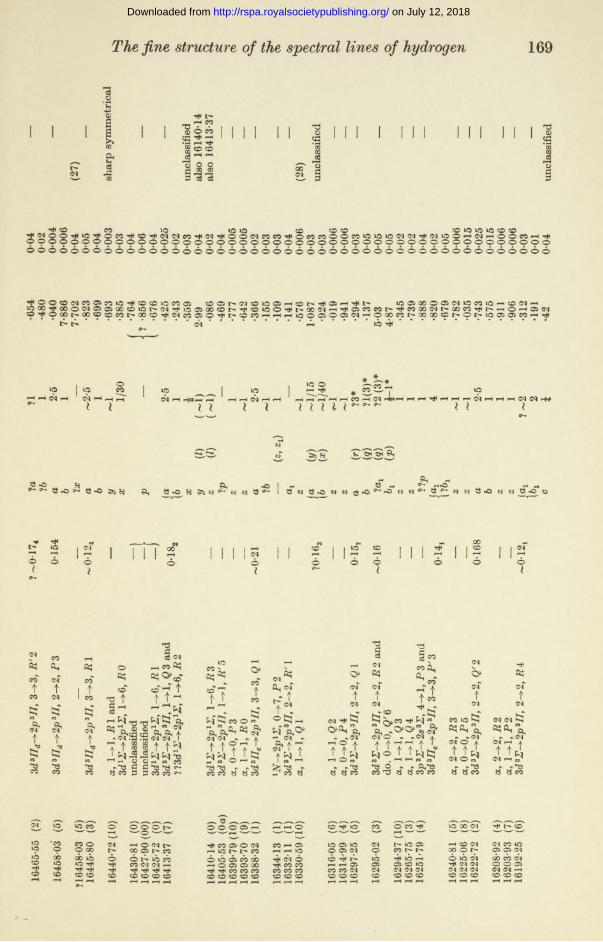
1 2 . G e n e r a l n o t e s t o t a b l e 3
Columns 1-3. Column 1 gives Gale et al. values of v for the fines followed by their intensity estimates. Column 2 gives the transitions of the classified lines, the notation used being that of Richardson (1934). The abbreviation a is used for the Fulcher system SpzI I ^ 2 s zU. In column 3 gives the separation of the fine- structure components of the fines ending on 2 3/7 of column 1 where this is great enough to be measured.
Column 4. In column 4 the notation used indicates the fine-structure components. Lines ending on 2 p3I7 have two components, but as they usually differ in intensity one may not appear on the photographs.f These are always referred to as a and 6, a being the higher frequency and also the stronger component; in some cases numerical subscripts are added to these letters. Letters other than a and b are used to designate structures which have not been allocated as components of a fine ending on 2 p3I7.
Column 5. The numbers in column 5 represent the intensities of the observed fine structures. Where only one component is observed in any particular fine and there is no reason to suspect others of appreciable strength, the intensity I is always written
I — 1. If another component is suspected (for example, because our measurements do not agree with those of Gale et al.) but has not been observed we write = ~ 1.
-j- On p la te 4 th e a com ponents a re alw ays to th e rig h t-h an d side o f th e b com ponent in th e sam e o rder o f interference. T he following exam ples show th e doublet (a + b) n ea r th e single-order position , so th a t th e in ten s ity o f th e im ages rep resen t app rox im ate ly th e re la tive in tensities o f th e com ponents: 16132-09 (5), 3d 3P -*■ 2 p3IT, 2 -> 2, 3 (the lower p a r t o f th e im age o f th e b com ponent is covered by 16126-19(10) in th is p ic ture): 16603-20(9), 3d 32 7 2 p 8i7, 1 -* 1 , Q 1: 16710-63(6), 3d 327 -*• 2p3i7, 1-*■!., P3. (In th is instance a an d b a re unresolved— Av = 0*06 cm .-1— an d th e ir in tensities are nearly equal.-T he d irect evidence th a t th e line is a doub le t is th e abnorm al w id th o f th e p a tte rn .)
Cases in w hich th e doub le t is n o t close to th e single-order position are num erous. Owing to th e in ten sity envelope effect th e w eaker (b) com ponent is frequen tly n o t seen in th e lower (left-hand) of th e tw o orders. E xam ples are: 16458-03 (6), 3d 3I7d-»-2p3I7, 3->3, 1,16654-24(9),3d 32-»■ 2 p 3II,0 ^ -0 , Q3; 16692-00(5), 3 d s77d -* 2p3I7, 1 - v l , 3; 16764-12(4), 3 d 327^-2p8I7, 0 -> 0 , Q' 2;16854*86(10), 3d 3Z -*■ 2p8I7, 0-4-0, 1; 16978-52(10), 3 d 3I7d -> 877, 1-+-1, jR l;17192-31(8), 3d sAe ->■ 2p3ZZ, 2 -> 2 , Q3; 17261-34(4), 3d 37IC -* 377, 0 ^ -0 , 3; 17279-01(7),3d 3d d 2p 3II , 2 -» 2 , R 1 (here th e w eaker b com ponent also can be seen in th e order on th e r ig h t w here the a com ponent is m issing): 17316-56(5), 3d -> 877, 1->1, 2; 17426-25(10),M * A d ^ 2 p 3II , 1 -* 1 , R l .
on July 12, 2018http://rspa.royalsocietypublishing.org/Downloaded from

160 E. W. Foster and Sir Owen Richardson
The symbol ~ is also used to denote intensities less accurate than usual more than one component is observed.
When two or more components of any single line are observed, the intensity figures are intended to be rough values of intensity ratio. The figures are rough, since (except where otherwise indicated) they are derived from ordinary visual estimates, but a correction has always been applied for inaccuracy caused by components occurring at different positions on the echelon intensity envelope.
The intensity-ratio system has been extended to include all components of two or more different fines when an asterisk* is placed beside the intensity figure. I f this system is applied to two different groups of close fines which occur consecutively in the table, the members of the second group are distinguished from those of the first by having two asterisks**. The intensities of members of each group are relatively correct, but the figures are not consistent in passing from one group to another.
Column 6. Column 6 gives the decimal part of our v values for the structures, the integral parts being the same as for the corresponding figures of column 1 except where a change is indicated by the insertion of the units figures in column 6. I t should be remembered that our v is usually about 0-03 cm."1 less than tha t of Gale et al.
Column 7. We believe that the figures given as tolerances in column 7 correspond to about twice the probable error (which can seldom be evaluated owing to indeterminate effects caused by blends).
In such a complex spectrum as H 2, using a wide slit, and with only the coarse dispersion of a Hilger E 1 spectrograph available to separate the fines, many cases of overlapping patterns and overlapping orders of different fines necessarily occur (quite apart from the numerous blends known to be present in the fines in Gale et al. fist in addition to those explicitly mentioned). Knowing the echelon step width it is easy from Gale et al. table to predict when such overlapping orders are likely to occur in neighbouring fines. To condense our notes we have not, therefore, always drawn attention to these instances of overlap. However, where they are known to occur or where they might be expected to occur we have allowed a greater tolerance than would have been quoted otherwise. *
Ordinarily where there is no confusion the tolerance figures depend on the number of times a fine has been measured and on the concordance of the results.
In general, the tolerance figures given are a kind of resultant of the effect of the concordance of the measured values and of the factors referred to in the original notes to table 3 (see below).
Column 8. The numbers in column 8 refer to a series of notes which will be found at the end of table 3.
Our original notes to table 3 are elaborate and are too bulky for publication. They include remarks on (a) blending, including predicted wave numbers and relative intensities of the fines of a blend, (6) details of our analysis of complex structures, and (c) new observational data which could not be tabulated. The
on July 12, 2018http://rspa.royalsocietypublishing.org/Downloaded from

The fine structure of the spectral lines of hydrogen 161
residue of these notes referred to in column 8 is mainly concerned with (c) and a few of the more outstanding of the other items.
(a) Wave numbers of blended lines are predicted by starting with a related line whose wave number is known and whose combination difference with the blended line is also known. The accuracy of this process can vary a great deal. There may be as many as six or more observationally sharp lines all free from blends and all connected with the predicted line by accurately known combinations.
In such a case there should be little difference between the six or more results, and the mean should be of the same kind of accuracy as that of the measurement of any good line in the spectrum.
At the other extreme the only related line available may itself be a blend. In this case one has to calculate the frequency of the constituents one is interested in. This requires a knowledge of the intensities of the two constituents. This can rarely be obtained accurately. Finally, the known combination on which one depends may not be very reliable.
There is obviously scope for much variation in the tolerance of the final result given by these processes, and assessing its value requires delicate judgement.
Predicted wave numbers are always given in square brackets [ ], and unless otherwise stated they are on our scale, i.e. vF. I t should be remembered that
Vq vF + 0*03. Predicted intensities are also given in [ ] mm
is frequently written
7(a/6) for convenience of printing. Similarly, 7 (720)
(720) means 7(720) etc. If, for
example, 7(Q 2)
this means that 7(72 0)(Q 2 ) T I(Q2)8 K and I(Q2) = 3 K referring
to the scale of Kapuscinski & Eymers (1929).(6) To cut down additional notes we have frequently used the following scheme
to indicate briefly how the various components in a complex pattern (including one or more of Gale et al. lines) have been assigned:
As already pointed out, intensities of members of any particular complex pattern are usually asterisked, i.e. they are all on the same scale. In such a group, besides the usual letter for each component of a fine (column 4) another letter is quoted in brackets. These bracketed letters indicate the observed components, and they may occur more than once amongst the various members of the asterisked group showing how each observed component has been assigned to the different transitions. See, for example, the lines 16,915*33, 16,916*57, 16,917*50 in table 3. In such cases, corresponding bracketed intensities are also given, the unbracketed intensities indicating how the observed intensity has been distributed amongst the various lines. In several such cases there are not enough data to distribute the intensities uniquely from the purely observational material.
on July 12, 2018http://rspa.royalsocietypublishing.org/Downloaded from
162 E. W. Foster and Sir Owen Richardson
I I I I I i I IandCDeg*8 x*o
T3<DSjsII _
PM SS^ ndff SI 2 CO
©S'? \o t> Id CO id id co coco2 1. h h h O ^ h NOO cm CO CO O* id <M ^ *d O pH <M pH CO CO Oi , <N O* ONONN^OOhiOINS d 0 0 0 0 0 - 0 0 0 o o o o o o o o o o o o o o o o o o o o o o o o o o o o,2 § 60666066 6 6 6 6 6 6 6 6 6 6 6 6 6 6 6 1 6 6 66666666666s +1
<4 a S o o n S n o 00 ©Jt^o^SwasoSosMaSoSi . 2 § o w n® §s ^ ® *. S«p «si os ssi ao ■<* op es> NOHH««ewHOOOopa oo i> w o »o eo i-m irj eo^ “ ........................................cife t>..............<© do
§.28 -g i if s
r * u» .* # * hn* * Si o o t 5 ig of»g .pH rH pH CO pH 00 pH 00 (M HnCI pH O pH (N pH pH p*4 pH pH pH pH (M pHM i * £ £ ! v w ^
^ 3 - . • * —f t '* t •9 •?+* S*
sow
5^1?
+ 5 ifpq O M cT pO* cf* p£? CpO &,N Q**0 3 >• S -O M M C pO $ pO©pO*"*«S,2 1H §
^ s09K>
6
O)CM6
CO CO i pH o 1 1 § 05 05CO oT<N6 1 « o 1 6 1 1 1 p""* 6pH6 6 6
h «$ft?,«~s tt ®
(NooACOAW aj ACM I A I 22 <N <NCO t y j y l t t«&S*28S3!&*
CO 2« j iid ^
2 '? ®i1 t. °<N
nd * £Sh ip co <*® °s Qq oj-V co ^<N
f f i T U tt£ »
0? &$ o £ ©t *1 to co o
5 ' i ?■ £ y &t & t? t J3 £ 33
CO <Mg o > ft?•v O pH
*? t tI (O pH3 #
t t• I o oc<l TJ
fciCO&t
1^ c8 p* <Mo> ^ b >f 5 f 2 r f fO t t O ^ P4 I?
t t w t t ^ ? ? t w ^ ^ ^ CO CO CO co CO CO
o»to
t?COt*«
c3
«V''<N t f f° Ci (Mfciplfc?
t t tt t e VCO fH 09 ^ ^ ^
^ C <»-N —S /» s5 OOOOOiHCOH- (M -rt COlOj sr ™ ^ w ^ ~ "^HWCOIOWCOO W <N |> oh | t > c o o c s i ’T t* a o T t< c a c o p h o• rt iw H ooh ic ib 6 ph 6 6Z5 H lO » -H T f< l> C O lO ( N (M pH 05 00 00
O 00 00 l> CO CO CO CO CO CO- i o »o U5^ !>- |> |> t>.
P ’S P S P S ^ N P* spH O IdCO pH t> CO6 6 00 l> id lO r-
P~s P—S P S P S P S » ^ P S^ iS, 2i d <M o ^ 05 W l O C O ^ 05 <MO O O ^ 05 * > C O p H ^ l d COt>t^» 6 l> 6 r« h* |H I—* pHid CO (N <M O 05 05 CO <-s *C ^id id id id r^^r^Op^ ^t > ! > |> |> h* t > l > t > l>pH f™p pH pH pH pH *H pH pH pH
on July 12, 2018http://rspa.royalsocietypublishing.org/Downloaded from

The fine structure of the spectral lines of hydrogen 163
' d0
i ' S | 1 * 8 1
T3 . ©
£,£ > < a 1 0 - 5 5
>1 pH
00
i i
< r §
1
i
rQO
<g
§
t * CO lO rfi O O h © © © © 6 6 6 6
IQ cei-i o o o 6 6
l O O O g o O O O OOJ <M <N <N *© _0 O 0 0 0 0 0 > - h 0 0 0 o 0 « _ _ _6 6 6 6 6 6 6 6 6 6 6 , 5 6 6 6 6 6
4 - I
CO CO 1C CO0 0 0 0
6 6 6 6
1> h* »jQ IONIOOOh NhhcOIO O O O O O O O O O O 6 6 6 6 6 6 6 6 6 6
CO < N I > © CO CO CO • ^ © O ^ O O C O O O oO* 0 0 CO QO I > © 1 1C ph C i © t* l > ^ ^ O iO W 0 » 0 pH 0 0 CO I CO 0 3 CO ^ o h 0 0 5 h O q0 i q ^ ^ 0 0 5
" f l i f • * ' - o
0)00 00 0 O CO X 1 0 <N O O <N
H I O I O O ^ X O O O« 0 ^ h c O W 5 0 h i O « 0 )©iOOOOIOhCOphcOt*’ * 6 6
* *9H«CS1 ph ph
lO lOpH pH P“< fH pH CM 1
l \v •**»cCM lO IO
io ^ h 6 <n«V/
1 0ph (M 1 pH pH p
ip oI W H ( N H
?
/* *
s 5
B n 8 - 0 Ne po
> • ^ a b a b
«Se pO
J ?d pO Q ^ ^ 0 - 0
vN> pOQ «*-. e p c vh n d «£ e p c e po 8 4 5 8
1 § 10
6 I
1 COpH
0
<M
00CO CO |
2
00 | CO1 T 4 0 1 ! |
CO IO0 0 0O pH
rH S JO
6>
6 6 6) ^
6 6 6 6 fiS»
6 6 6 O-
1 -
3 * .•v pH^ t
s r g
t t
2 § 3
ft? - #
o <N Vo > o > ^
^ CO
0 * o >
~r o ~r _tt • f ftl t 1 1 f t•“I TO H (^O pH pH
p‘ £4 s‘ ss? t!IN ' S i , ^ (H 1 IN ' £A <N ’i A * A A At tA a. t t tt3 I <N 'B T3 w-q n + 's] t?tq rg TJCO H 1 09 H « CO 093 re 'd ^ 2CO CO H CO COCO CO CO
ft?
<M «ta t ? ®
<N*fi *? t2 © >CO H
Q?
MtN
89
£
t309
'3 ® »§ © >
*® -Ta * f
<Neq O'* * ?
* ? f
£ $ f
£ t nr-* t « A <M 3^ iO t ^15 , 3 ? a ^ 3 ?
j t fpH ^ 09
d|08
^ C0 PH h C0
ft* <N &,&?&? ®? fis© ow«<r *4 ©| ; V " t t t t to 6 ^ 0 ^ o
t $ t q f c j t f f c f f c f80 Co <N » « 09 » «M* ’L ^ <§*f •■■«: f f f t t
h _**§ d d d 3c o c o *$ co co co CO CO
o »
to
fca09
tf c f89
1 0
o »
?6fc389
. t63°
5
s
pH
10<M6<M
/ - S /^ s»o 10 opH o <2<1 <M O COpH Th 6 pH OO ^ CO l> l> pH pH pH l>
p H pH
P»» >«*N >Pk PS PSCO PH 1C CO ©
CO © 00 00op 1 0 ^ o6 6 6 PH
pH pH pHCO CO CO COh> l> h*
pH pH pH
~ S '
2 S
V y-s, ^ *N,! (N CO ^ O <M
O O C 0 t > 00 pH ZO rt<CO p H h N CD 1 0 CO
6 6 l> 6 O pH- - --------- - - t s IH0 0 o 00 00<M JM «M <N <Ntr*» t> l> l> l>
pH pH pH pH
<Ml> l>
CO lO <N <M l> l>pH pH
on July 12, 2018http://rspa.royalsocietypublishing.org/Downloaded from

Tabl
e 3
(< co
164 E. W. Foster and Sir Owen Ricnardson
is&eg
l i
' i>SpOo-g
§
©ca1 ©egmmja
§3
§ id id oo id © oo id3 * | o o o o o o o o o o o o o o o o o o o o o o o o o o o o * ^ o o o o o or2 § 6 66606 6 66666666 6 666666666 I I I 66666 I 666666
05^ d ^ © t > ! 2 d a o d So’co’S o Jh Jo Jo ^ o o ^ ^ c o o* * • - * • ' - .................. 6 - - * ‘ ............... * I .................. I ..................* 1 l l
jjjj.2 ip i_i p t_lp 1 p p co ^ Jo SSSS | i_|)_i pjH P_| li....1 I-—11....■* (^» ^ ^ \ I ...I ^
OT43 T-<d *©O 03
§ - S 3 S2 Si-o _qT-o cT-o1 d »o S* d »o d »o $ *o ^ gS d ^ cTpQ4 Q ^ e *o 8 c »o *o ^
H
t aOO ID © © © © 00 ID 1C c* di—» Q 0 © ph id co © i> rh £5 i>pH p H pH O l pH p H p H pH p H p H
6 6 6 6 6 6 6 6 6 6 ®<>-•
CD Cl ^ d. of oS 2 1 5 6 . 96 6 * 6 i i
.1h f CO Iti o& fcfCO
*
TJ£c3TSDc3
f* d ^ pH
fl O' &5b>0> •2 o i—i o
t t t' <M Otq tq fc q
Os
©
tf01 £
t t i t 5? ttf tfn t r J t?co eo co eo p co^ 'd ^ ^ ^ ^ CO CO CO CO CO
"DaegCO L V COQAA3 ^ cT o co *t f f td O C O I
oo oo CO
pH
05 t t tp e -8oA CO CO COI *© »X5 © CO CO CO
tqCO£t
b>cTtCl
fcqco
&to
O'«<rt<M
t
Oh
7p H
tsCO£to
TJdos
2 ^ 'xsCO CO CO
P p H I—I
I "
Cl |t
co w co 00 ^ "d CO CO CO
T5acS
tpH
fcq"co
£t
t *?« cl^ tqt t
o ^ ^co Tq CO ’"d COCO "d CO *-• CO
b>to
153
tfcq
Cl
t©
tqIt
tq°
03ttqco
t$OoCO
ID&H7P"Htq"co
t
S' s4 ? » a '. go i lSk 2
© p HID © 6% <NrH pHCl (M t>
6©
S ' w S '
COs
© © © ^ 6 Th QO OOp H p Hl> 1>p H p H
cip
Jh
© ^
6CD Th
Io ' -
CO g■s-^CO
QO ° .
% » I sl>
qo ci oo ci ci
t"- ©© ©© ThCO 00© ©t"* t >pH
on July 12, 2018http://rspa.royalsocietypublishing.org/Downloaded from

The fine structure of the spectral lines of hydrogen 165
&c3
A
§c3
I I
*JO
3c8
pQ
pH pH
W£
r■s
Tl^ £ I s 1 Si'S I 213,0 cl
Qj pH
«18>>0-
I I I2 * 1
o3o<IIPh
o © o o o o o o o o © ° ° o o I l o o o o o o o ^ ^ O O O O O O O O O O O © o o o o o6 6 6 6 6 6 6 6 6 6 6 6 6 6 6 6 6 6 6 6 6 6 6 6 6 6 6 6 6 6 6 6 6 6 6 6 6 6 6 6 6
5 ® o o 2 a o 5 2 2 ! 5 ® o o o* c ? ® h S ’S ’® § « x o S o l o ^ o e M « ' 2 ’H ® ’H * ” o m § 6 o « ® S S 5i© ® F-i®t^w©»oc© esi«c»oopt >i© ep > »(s< »< • c5t »©ao®®' C|<»t lQ®'7, csS^®®©'***^M * l l —
h» tL.*ic
^ » r * 5 -3 j* * 2 $ $ §V, Sh« 1 ! * * * . _ * *?h h h h ^ h H n H n (M pH <M pH p h p H pH w N i - < h h ^ W H W n o p ^ wN*i- h p H H n
i H i i i i i
CO*p+# *t h ^ OJ <*
s SSSSSeeS'S;©'If ^ g* -5 : 3 S S I'S 3 g I Sw t H (}
q*0 *5*■©*® s -o e i-o df *cT cT ro*o 5*©"’■o' *"* n «£• e*^6 **^Spo I <* Mp© t t * t 1
T o St
®pH ®pHCft toCD O 01
6] CO2 | 1 a
osCSI S I<N 1
OCMO O 6 O 6 i 6 ®
iOi
O O3 1
u2Jo
CO COft$ o> xjT *2t t
H* p H
t3 £J*1 m1t t tfc? *fcf•9 to COCO CO CO
0>COt
&t
o>COtCO
fcsco&
<Mb>COtCOft?co
t « NJ
? 5> *^ CO co co *-•
<No>COtCOfc?co&t:?
PsC*-
tO£&ttf
<M
2 *§* '—*? frf®*
X ® t«?
e©&3
«*w 7t « J,
_ ,»<N f« ^ £ ?C5® S?
? 1 | f f 4 ? - I I $ ?4? £1 i § i sSS s
N05
t t iS‘ ft-fc!
At
fCO CO CO
tt
0? ®5■*'if tTh ^
TJ tjjT §5TofO»
t 1 0<N A
fc?°
f t m S '■e? co co p c o H j
o> 2 05 s «-^ t « t<J -H C<f
CO
ID
cJtCM
t?
I*«« t to 4 rl
2 *& %
pH ^
O 00 10CD CO pHGO O !>•<D CO ^O O O l>pH iH p H
2 2 2 S p*H pH ® m 2 spH 2 S E E
S ’CO S COCO 5 J ?co f <NCO pH _i> oa s lO O co oa co oa PH-
COCO0
CO0
cb0
100
co0
cb0 0
CDODa | §COl“H
do00ca Idoca
cboa
O CO T* Oa Oa 1§pH
t>pH
I>» i> £h co CO CO co co CO COH pH
Vol. 189.
on July 12, 2018http://rspa.royalsocietypublishing.org/Downloaded from

166 E. W. Foster and Sir Owen Richardson
'.InI I
*
*JoCO ^pH <M
*
b*
pH i-H <N r! i •
eo 3 u •—-co . SJSML i?esi iL e 5r* s ^ } ~ SI CO rt< fH pH Hn! i l i
*
CDiOp-i ^*
COg
05 cq 00 05 I 12
*8ss•<s>£5€>
a 9.
e
pq ^pq ^ pq * 2 ,3 ^ 3 3 3
^ pO cf po1 ©'•o* sfpo* e\o° I I 0 -o
& s $ ? S
e po_qpq cTpcT spo g *c> I e
JD3<3EH
H
^ spd“ O 0 5 © P <N p£ i-hp o ° o
<o"pH6 ~018
0193
1 2<0
I 2!<M00 JP Tt<05 0
2 1 21l pO GQ O 1 .0 1 .0 O 6 6 s 6
Qi° l i pDoSL
&i ^o *
2 7
©
5>bSco n CO 05 CO
*00c3TJSc8 cd
*»& h „0*^0* -f J f r f t + 1-1- 1 ■'-H fc;-jS-i? f ^ S , *, *8??.? M 1 1tY^pj C'Mfc} fc) £« ’tS co *C3 * « » o00 CO 00 CO ^ 3 PJ
CO ^ CO C*- ^3 CO CO J3
ft.to
' co fcj
(M
<Nt
<N
fc?eo
&t
83
pH COas o o ft t © *
£5S& ^U 4
<Mftit5n6 ttr
T3d tj Sw£«Nt o t« t w
4 ft n
w « 5t
eo
0*
I5eo£tfcf
COQ>o fb*
o>o ft
<N
t?« ^ <n b> t TJ
b] Pi
<Mft?
tO
tq<0&t
ft.COtCOfc:co
(N1t
^ co CO ^ ^3 00CO CO CO CO CO
/-S C s --- -^ ocoH!r ^ og 1 T* *?^ l i s
2 2
*<*» "VO C O O » O i O » O i O ^
5cbao
COCO10so
o 00I> Ttn0 ab
o<N
CO ^ 00 05 lb rh
05 00 05 05 0 0 00op 00 00 00 00 00
CO cD CD CD CDrH pH pH pH pH
cb00CD
600CD
o' CO ^
Tt< Cv|0 10ao 00CD CD
oS*CO00CD
21ift
on July 12, 2018http://rspa.royalsocietypublishing.org/Downloaded from

The fine structure of the spectral lines of hydrogen 167
0? oooo
1s- s?
d30,
§
■s£
T5©>©GOrQo•gd
©>
s
O~g
d
§ § § § f ? l s | | § S § § § § 1 1 1 1 § § § g l S S 1 S S S o o o l o l l o i l l^ ^ ^ w O O O O O O O O O O ' ^ ' 4 '-^ ' ^ ' ' ^ <'*k> <*“*> r n <—*> rA -A. rH A rH ^ -A -A g | -V Ah ^ rHO O O O 6 6 6 6 6 6 6 6 6 6 6 6 6 6 6 6 6 6 6 6 6
©7 S i© ao © © ( n S h o w © ? i o ^ * § S © ©Jf i©5 rH* § § oo ©5 co § oo 2 2 m m q S S - h I S SO 9 Oi V © © « 5 M ( M O l > © 0 0 t ' « H f l i i ( ^ W H O l > i© CO i© O C © C O C i I > - O S I > i © i © © 7 0 ,«J< [ o ^© » i * H H ....................................................* ’ W ’ * * ................................................................rH ’ i>ob
jk- t JS- ^TD^T*?rH rH ^ 0 7 —♦ 07 H W H i i H H i—I ___Cl* ©7 rH J© ©7^ ** 11: i l l * ?
* * * H<ai—( iH Hn ©7l l l
*cTHOO ! ^ <?-•
*
^ —>?rH rH ©J rH CO rH
i i *1
S o„ 3* 'Ml©Mh h ^ i
i l l
5L S .
A A
H S3 3 8£i8 S S 33 3^^ ^ ^ ^ ^ ~
<5 ^ 3 <=S e «i e h ^ gTrcT cm s ad e -o ^ e 3 ‘ £T 1 I ^ C AD S rO M CAD
1 *
£ 5
i>6l
i] © £
0 7
6*
0 9 0h 00
6 6 6^ i
6 o
^ < v i
toftt
CO T / <M
5 * ^ 5 *
« 1 *
t - m^ H J8 fc;n ^ O «^ wco >■• p CO
a,:
A
CO
& *A •»S l j t ? ®27
^ SM
as
t .o
5*
t
&fCO**3
T3 T3
g g07 CO ©7
* * * & 9«T * v^ ~
T O - Ot t ? t
°>y 1 t s 1y <m fc?
1 | CO o f
fc5%o X ^H eo A W eo"C '■e *CO CO *M 5 CO
Oh
t(M
it'ts
ts
» Ah<M *"
t ^07O
t? k“CO ^
f #CO co
1
* $t
(M
l l
t Ofc? tcT o3 tf
« « ^ rHS (^COTtln O*°5 *ftsa^ * 1
O f O HH f ift h | 07O r O | r-H ^
t s |
*1 t f f « tCO » H j , 1 « «
3 a
o-b
M » <M Af ? t ^
§E5sfo « ^^ M1 A
r A Ol O I Ai f y
a m m
&t■a
fc!
o$
f toej£5
07 07f teo eo
IH C ? o f
s g § 6 ^0 7
§ § § o O COrH iH rH
s 'S o S CP 2 s s O S.o o 5 s 2 oTS?
r? O tHl> tr cc S 07 07Tt* rH 41 % CO o o o § § B rHOl f rH I>rH ^
§§ g| | *o orH rH 1
t»o
rH rH 1- c©t-o oi©o
g2
§o6 07rH Cic©50 CD
eg§CD 1CD
61
l©CDCD 107 6s sCD CDi-H f"H
11-2
on July 12, 2018http://rspa.royalsocietypublishing.org/Downloaded from
Ta
ble
3
{c
ontin
ued)
168 E. W. Foster and Sir Owen Richardson
73a>eg
8 co32S
©>
'gI
*8eg
>> sn 2 ? 2a § ^ §
*0 T3 ® ©s iaj os§ § P-H 1—4 © © ST
2iS 'S i
73©eg
•BODJjj
§ * . n o o o h o h n ^ S n i o o <M CO ^ CO CO <N (M ©* o © CO 1C i© eo Od ph CO ©1 ph <M CO l© ©I ©I 3 !S g o o o o o o o o o o o o o o © © © © © o © o o o o ® o o o o o o o o o o o o o © ® 5 § 0 6 6 6 6 0 6 0 6 0 6 0 0 6 6 6 6 6 6 6 6 6 6 6 6 6 6 6 6 6 6 6 6 6 6 6 6 6 6 6 ®
o f g ^ © ^ k © i ? 5 ! © I ^ H t ^ * © C O I > 2 2 § 5 S o 5 a W H S w O d O O © S N 0 5 N § S § » 0 § S 5 ^ S c 5 0 ^ !q © ico © i© co co t^ co o 5 i> p H C 5 C 5 00 co co W N H O O O O O N O C i c p 0?dodo * ^
& K ,•53
3LCO O r oo
* ;H l l l l i l t■ ‘ PHo-
g-J « h»~ — ® S a 7 .SS. I J j j V .ij rg i-H p—I O l pH p £* pH I d pH pH “t * pH ptH pH p—I pH pH CO pH CO pH CO ©I CO pH © | pH CO pH pH pH He* CO >H pH pH pH 00 N pH Tff 1© ’ ”c •* l ^ / ) i l l l l ®“*“ i ?
k
g .
£S 2 2 2 2 3 " ^
e e " a s - a
^ ti e p© H ^ e p©a t p© e p© M C3 p© N Q P© 1 ^0 P© I e p© m ^ 1 1 cTh£ « m » 6 > 0 a .c
CO1 1 ?
00 | 3
oo co*pH pH 1 r 1 ? S3
00 f**■< pH i© ■1 o | O 1 {
pHC5CO o®
pH6 o o o 6 6 6 6 ‘ rQ ‘ 6 6 6l i f i i 1 0*-*
a731c3
TJ313
<N <M <N CO <Ns CO X*Vft5 ^
COfts a .
(Mb> aq
f p f t t l t
CO1 7 tco 1 o t - 2 t t
pH
<Nt
(N tpH
eot
«
<m fci Cq^fcqeo UJ eo fc? t tqco » ^ " tq
tqeo tq*" tqco
» t f f tfe T « S s i»> eo eo opy co^^
O o ,9\O A t f t
o < § - ^d t w o t *
teo3
#t
eo
teo
t
» s« tt «^ co "C3 CO CO CO
t r f f t tq* o ? " t ® »8 W ® i f w
fcfCOCO
t feoCO
<M%
t
ft® o*?C0
COft?CO
t"3 cos f c f
P ©I ©I «
& I 8: 0: ft i f 7 is« &
73 C ~ p CO P S « CO
tpH
fef
tH05
tpH
tq
6t
** O'—S^ pH © 05j S fM o CO oh I ©I t* ©I
23 S S H § o co o co ■S CO CO CO
pH pH pH
P S P S <*s> / “v . —“v ^-~vO O <M k© O CO ©I CM l© CO
I> W CO I> 6 ^ © goi© *©eo copH pH
CO <NO pH O pH C5C5 CO
6 6 6 rh 6CO 05 <M 00 6
t'* ^ ^ CO CO PH1© k© 1© 1© l© 1© k©eo co co co co co copH pH pH pH pH pH pH
1© pH C1 O 0 0
1©
6sco pscoH h i © t > CO pH
I> ^ GO O O 00 l© l© T* CO CO COp H p H pH
® 9 ® 6 6 6 qo i> t>^ 2 tco co cop H p H p h
05CO
CO
on July 12, 2018http://rspa.royalsocietypublishing.org/Downloaded from
The fine structure of the spectral lines of hydrogen 169
E
15.2
ia,C3
m
l>^ H W © 6 6 £2 'Tfl f-H
H ^
§ 2 2"3 o o3 QQ 003^-3
I II I I "d81go1 So §
2- 3
ns<DCg*9BOQrS
^WOO'^«5'^OCO^CO^^^cO^<Nri<OOC<lCOM^OCOMOOM»OlOlO(N(NrtlMiOo2SlHOO«fH^0 6 0 6 0 0 0 0 0 0 0 6 6 0 0 0 0 0 6 0 0 6 0 0 0 6 0 0 0 0 0 0 0 6 0 6 6 6 0 0 0 6 0 0 0 0 0
............................6 .......................... h ..............A'i
1 0 I 10 COH H C ^ H GSI rH r-t~ i i
* *.P L # g e .I rH~i-H*H H CO H N I rH12 S IOlO I *?
<N —< H H ? ] H H H H H H H M H M r t H i l H H l H N H H H N N H-#l l l l l l l l l l l
d 40O* d ^5 ^ d >0 555 « ©i d rO H «35 M MpO 1
m d 1i cT m d io «
10 1 ^ 1----‘ —v 0i1 | | 00 I I I 1 ^ 1
eoI I CO 1
6rH6
1 - 1 0 *
1 1 1 r I I I0 1 « 1 0 l
I I r I
2
1 S S £ 3 3 5
e - & -4*,0 mS m M d m M d «0 M M Q iO <
irT corH rH 6 6 *
wf6
00 «O | I CMrH I I H6 6l
<M
*3CO
tCO
65eo
&tfc?eo
a,oft
63I 't6?
0?CO
tCO
oco
-g ti ' l
08 <MrH CO ^
o f f f . t r*
fc5eo
■f “’.(S'i £ t£ n m $’"d 3 H *d 6 ^CO $ CO 53 2 CO CO «"•
5 * 2 « ** i t < wt l « fJ ttitTw o? 0 13»-« ’a.s,11* 05 ^ E^^0*^ O* _*v
t t a a hj> aSfJ ft£ C
3 3 * * 3 3 3 *
<8*_f
o>CsTf
<M
cq ■'* t?9 * Aft A (MH o |
03oft
<N
?‘5^o*
- <M
8 £ ** f f 2f eo f
eo w eo fciWL<§* 0 3 ^
A a C I A A a C IA A rH rH A | O AI I A A J ^9 * * J
<N (M
<N rH
G$oft
<M
g&
l i * U $ XX $£ *? 31 2? rd d d(W*w d d 21 d~ d~ m
jj , g g g o* 0 S 0 ?
§ ? § § ? s i s s s» o 0 0 GO 6 o O h i o wCO 1 0 ^ r *c© cor ^ rH
»©“ CO
I rH
^ CO <M <N rH ^ ^ Tt<c o CO CO CO 5©rH rH rH rH rH
53 y-'N /^S» /""NO O O OJ> rH rH rH Ow ' 'W, « h
^ CO © 0 < N CO rH 0 5 rH lO t r IT* CO rH rH lO 6 6 6 6 6 ^ 6 6 rH o 0 5 0 5 0 0 ^ CO CO^ ^ CO CO CO CO CO COCO CO ?D CD O C O O C OrH rH rH rH rH rH rH rH
S ' grH '*■-
e s o s r ^ f T t r ' c ?
1 0 0 5 1 0 O 0 5 <M O
M 0 0 5 CO l >
rH CO C9 O O O h
<M CO lO 0 5 0 5 (M
CO ^ t - 6 ^ 1 0 rH 6 6 6 6 6 6rH rH 0 5 CO CO <M
0 5CM
0 5 CO lO <M <M <M
<N <39 (M Ol <M
O O 0 5 N ( N h
CO CO COrH rH rH
c o CO CO COrH rH rH
CO CO COrH rH rH
CO CO COrH rH rH
on July 12, 2018http://rspa.royalsocietypublishing.org/Downloaded from

Tabl
e 3
(< co)
170 E. W. Foster and Sir Owen Richardson
I I II IIIO O pHS2,
.2-p©
&<3
I -I
T5©t
I tS S’o °
t H l© l© l© CO C O ^ f O f O O H H O O O O Ho o o o o o o o o o o oo o o o o o o o o o o o
00 l© 00 (0 00CO O O < M < N C 0 C 0 O O C 0 O < M 1 Oo o o o o o o o o o o o o o o o o o o o o o o o o o
1© l© O <No o o o 6 6 6 ©
O O COo o o o o o o 6
• I COCOCOTlOOOO<MCO<MCO ^ (0®<0HMM©©H10©10 OOOOH• OaO»0<NMCOC©Tt<OOi©aO CO GOCO iOOffOt pHCOMOl t^oooo“ H 1 0 M © 1 0 © h C 5 h ^ I ( M ( M h i- h © W l> © © h (M h O 00 t ' ^ N *© pHf t s ...........................^ ..................................................................... CM * * • . . •
00 O 1© <N© ^ © oO 00 ^ Tt-
*3 , CO c o g
j ! T T l7 " ~1 I rH I H CO <M H H rH ( C*-«
I S& w wfl ,£* ea « eo 8 *© W ^ ^ M Hw M M ^ 8 »Q W « C »0 « ^ W ^ w 8 «
ftf E*1 8 A ©
l
&hc<?t<Mt?&t
eo
CO
&Heo
£t
CO©><M
t<M- r t i*& ? ti s* 3
CO O H <N ^0sQ3O>O‘ftHr-T C<f C<f f-T
CM CM CM
fcfCO
&t
*> CO l©Oh©1©*©1
•* ^ ^ ISO <M <M CM At t t
O <M <M <M eo
8 8 8 8 8 W 3
CM CM >fci•s *p« CM
CO <N & A A A <M I
CO CM t ^8 8 y
! 9 *«>££
M3
m
r—N. ^-«s X—X 8 8 «V /-»S y - S S /««v 8 ,*—i>,O i © O GO O l> *© i—i CM O CM CM CO CO »© O CMr—I ' pH N—'pH ----------- '*-^rH ------------------------
/■‘■V / *SM O O H o O *© h CO''-^ '- - 'fH ----- pH ------------------$r S
. 4 < 5 0 0 * © 0 5 © w H o o 0 0 0 5 l > CD CO CO CM O <N CD Tt< O CM CO O © © © 0 0 l >H I *© 0 * 0 « ^ * © C O < N i - - i O I > C © t ^ C O l > CM CM pH 0 5 0 0 l© ^ l© CM O X ^ rH
• h £ r <*> ©* c d ^ o c d o s c M ' —« A i > c o d i c o ph c o ph c b c o i© esi cm o 0 5 i > i>>C5 W 0 0 0 0 COCO ( M ( N © ^ C O CO C O ( M © © ^ ^ T* CO CO CM CM CM O t > l>- l© <N i—(
© f“ l •—* f-HpH 1—l I-H o O O O 0 0 0 5 0 0 O O O O O O O O Q O GO 00 00 00 00^ CD CD CD CD CD CD CD CD CD CD CD CD 1© 1© I© 1 © 1 © 1 © 1 © l© l© l© l© l© l© l© l© l© l©
pH pH pH pH pH rH p H i—( rH pH H H pH pH pH pH pH H H pH pH pH pH i—< pH pH pH p H pH
on July 12, 2018http://rspa.royalsocietypublishing.org/Downloaded from

The fine structure of the spectral lines of hydrogen 171
0 rrt•e ©
1 § i i* o
frc8
'Soo
§
GO *0 00 >0 CO t> !>• t> lO t^ O J 00(M ^ O ^ h * 0 h O ^ i O W 5 > 0 h O O i i O O W h h O 1C VC O i ^ ^ ^ O O h h h O O p h Oo O O O O O O O O O O O O O O I o o o o o o o o o I o o o o o o o o o o © ©© © O O O O O O O O O O O O © o o o o o o o o o o o o o o o o o o o o o
<M p H | > 0 5 (N © I C H © W ^ W » W I C H o VOC ^ » H X ^ V C X ^ O f H l C G W i H H 0 0 0 0 I 0 0 V C O H V C X I > © O l C O O t ' l C V C W H H ? O X O h 0 5t > « O 0 0 r ' » H O C 5 0 0 C v | 0 5 O 0 5 C t t a 0 l > t > | 0 5 CO CSl IQ C<l T t V O X O S O Q p t ^ a C i C O W i H O J O O O 0 5 0 5* N H * H ’ ^ ’ * i ..................... * l b * * * * ’ * ' * H ..................... ..... * »i ’ * (N
* * CO »-»
%<I1 £
«5p H p H pH p H I p H p H p H i I p H p H p H p H p H p H i
6 ^ 0 W M N N N N N M * o O V) N 6>C ^ o ** N
©
*5555JC8
HtTp H
©{
t f
Jtftf00 C9© > < N O
j h« w " e « «8 •“ w 8 8
%s4
'd9 COM CO
* * jVo» **eo ^I t t
©{
c?
• o f
'♦<NK C0 t ifr(TJ>oC<f<N Qs ©>?’ ©>«, ,2,2 °i JS Os <N eo ,§ ,eo'<7 1 ! i ©f f eot t t ttqjj Mtli tN C O ^ W h o O ^ H «
*f 3 § « CO1 8
<N PH CO PH © H* ®G$ft? Q$ Q$ ph <N
m «> p * p o*O O O <N ^ O O f p h ^<N <N ( N V C f N ( N ^
N (N 3 W H <N (M *t 1 § 1 t <§* t t e j ! c? M
1©o*
w'm' p w’w'I? w’m' 8 8
t?CO
&t
3 1 1 ^ 1| a 'j 'j a*? j j 1 1 «^ r x m m
w 5 I | o o
§§88 I
PH ^ 7 <M
&H ^
o f©t - S j f
N f i " <N
eo t f ,-e M"
S ° ^ a i s4 3 4 4 4W* « W CO*
2 .
OJ
CSI
<*“•*» -<“***. ,^ S V r ~ s ,—v ^~s / S X-N /* S X*"1*.. P v P S /^N© lO l© »©, ^ O ^H_Q pH
CO 1© 05 CO O O O ^ O pH <N 05 © CO t> 00 O ^ CO pHt> O X N pH 05 CO 00 00 O CO N VC (N h 05 05 05o ib cbt> t> cb cb cb <n ob c b d s ib c b o ebd5cbpHOO 0 5 0 5 0 0 O C 4 C 4 C ^ H 0 0 CO CO CO i c ^ ( N ( N ( N h0 0 t > | > CO COCOCOCOCO COCOCOCOCOlO lO 1010 lOlOlOiOlO 1C 1010*01010 1010101010p H rH p H p H p H p H p H p H p H p H pH p H p H p H p H pH pH p H pH p H
<p s ' ^ « p v /p >-^N /»~s ^»«sO N O M ( N COCO pH <M
pH QO l > 00 pH 05 05 CO CO pHt > pH 5<J 0 5 < “ ^ 05 - *
• lO10 10*0 10 p H p H p H pH
<M lO (N CO05 O 05 Ocoo ^cb
O 05 lO CO CO <N (N oo ^C O IO I O IO I O *o *o ^ ^1010*01010 1010 10*0
p H p H p H pH
on July 12, 2018http://rspa.royalsocietypublishing.org/Downloaded from

2
3
45
6
7
89
10
1112
13
14
15
16
E. W. Foster and Sir Owen Richardson
N o t e s r e f e r r e d t o i n t a b l e 3, c o l u m n 8
Vo17672-31
componentaPzbPi
17451-59
17441-32
17433-5017261-34
17252-65
17218-50
17144-9317125-07
17033-21
17023-6717004-40
16990*70
16988-72
16917-50 16916-57 V 16915-33J 16841-63
There m ay be a further component p 2 in which case the alternative structure is:
I(o/6) vF tolerance notes2-5 0-364 0-006 —
0-3 0-19 0-03 (unassigned)1 0 0-14 0-02 —
0-5 0-10 0-02 (unassigned)All b components are incompletely resolved; their mean vF m 17572-127.
Pl. 86. Discharge tube pressure ~ 0-30 mm. Hg current m 25 mA.Pl. 40. Discharge tube pressure ~ 0-16 mm. Hg current = 15 mA.Lines considerably sharper w ith Pl. 40 conditions.P 2 = [17441-21];,this m ay be faint. There is no evidence for the bracketed
intensity assignments except th a t J(a/6) = ~ 4/1 gives a m ean v which gives a good combination and is consistent w ith the ‘regular and irregular’ doublet scheme.
Most of (x) m ight belong to 17436-24 (1 it).Gale et al. intensities for 17261*34 and 17260-69 apparently inverted by
misprint.Line probably strengthens with increase of pressure and tem perature.
Bad combination w ith R 4.R 2 [17218-51], Q '4 [17218-47]. I (JR2/Q'4) =~[151£/82q. a-and b have
each been assigned to R 2 and Q' 4. Ac Q' 4 R ' 3 interval seems satisfactory though this does not carry much weight because of poor m easures on 17433*50. I(ajb) R 2 should be ~ 4/1 and I(a/b) Q' 4 ~ 5/2. These do not combine to give the observed result. On our plates the line is weak for (8) ((?).
Some of (a) probably belongs to 17143-50 (0) G.Both components probably confused: see 17004-40. There is very little
confirmatory evidence of ours for va by combinations. ? ?6 component may be entirely due to 17127-12 (0) G.
probably > 1 . y assigned twice and it m ay also belong to 17031-67, 17030-88 and 17030-19.
(q) and (6) unresolved. (?0) m ay be partly 6 of 1->1, Q'2.z (q) does not appear to belong to I7d, 0->0, P '2 ; possibly x does. There
m ay be other components masked by 17006-43.1->1, R 3 needs [3/4] of the to ta l strength. Only 4/11 has been assigned.
This analysis gives doublet separations larger than expected for 1->1 R 3 and the two lines of 16988-72 q.v. with which the pattern is badly mixed.
See note 13. Ad, 1->1, R '2 needs [~ 1/3] to ta l strength. Q 1 uncertain bu t expected to be < 2/3 to ta l strength. I t is assumed th a t there are no overlapping orders in 88-72 and 90-71, otherwise there are insufficient data for a more detailed analysis.
See § 11 for discussion of this group.
?p, or some of it, m ight be due to 16836*04 (1)J(Q 1 :Q '2 :Q 3:Q '4 ) = [Z K zlK :^3 K :< Q -iK ].
There appear to be no lines between and y w ith I > I(x) + (4 or 5) a possible interpretation is y = Q 1 + Q'2f x = Q3, ?p = # '4 with in tensities I(Q 1: Q' 2 : Q 3: Q' 4) # [7 :2 :3 : £]; bu t there are several other possibilities.
on July 12, 2018http://rspa.royalsocietypublishing.org/Downloaded from

Foster and Richardson Proc. Roy. Soc. A, volume 189, plate 4w . 16611*43
liliiwy j — 16603-20
H M 8 i § l 16596*37
16330 59
16316 05 16314-99 16297-25+95-0!
15926-5215905-5315870-1015859-86
15817-4715800-7615795-0515793-8915787-2315767-10
15712-7915688-8115669-39
15662-5315650-2715642-4815621-9615591-98
15552-37
15528-92
15520-05
jMi Mxreflexion echelon spectrum of H a betw een 17741-92 and 15443-06 cm.-1
{Facing p . 172)
on July 12, 2018http://rspa.royalsocietypublishing.org/Downloaded from

The fine structure of the spectral lines of hydrogen 173note
number v017 16834*2718 16822*00
19 16802*37
20 16774*97
21 16764*1222 16753*44
23 16596*3724 16517*89
25 16488*15
26 16469*9327 ? 16458*03
28 16330*5929 16039*18
30 16032*09
31 16031*77
(Z), (m), (n) not clearly resolved.Very bad combination. Our results for the (*) lines of this group rather
doubtful: there m ay be an alternative analysis./(a/6) seems to tend towards lower values with our higher tem perature
and pressure discharges.P 2 [16775*06]: most of the strength in (a) component is due to the blend
16774*42. v P 2 is probably a b it high. Only very feeble signs of a; (6), (6') m ay be feebly blended respectively with the a and 6 components of 16772*74 (1).
Microphotometer gives /(a/6) = 2-95 0*3./(a/6) >4/2 unless there is a blend (?#) with the low frequency com
ponents; there may be something in this belonging to 16752*69 (0a).Surprisingly faint for a O (10) line on our plates.The centre of intensity seems to shift towards the low v end of this group
with a high tem perature source and most of the strength then seems to be in ax 6X or ax 6X and 62, all of which are blended by the increased line width. This m ay account for the different v’s of different observers.
(?a3) and (a2) are resolved on only one plate. There may be only one component and the apparent resolution a spurious effect of grain. Mean vF(a + a') = 16488* 175± 0*01.
Mean v for a and 6 is 16469*930± 0*005 c m r 1. lx may be spurious.v may differ from the given value by n times (0*727) c m r 1, where n is an
integer (or zero), probably about 5.The z component probably contains 6' of 16332*11 as a weak blend.The wave number may be variable (? blend). A t the lowest pressures we
get 16039*167 x^m.-1.Poor fit with Gale et at. Perhaps there are some overlapping orders
giving, for example, a component a t i> = w —0*727 c m r 1.Remarks of note 30 apply except th a t v = vz + 0*727 cm."1.
13. Comparison with Richardson and Williams’RESULTS FOR BANDS ENDING ON 2 p zI I
This paper will end by comparing the splittings (Av) and the intensity ratio /(a /6) of the fine-structure components of lines of the bands ending on the state as now found (table 3) with the values estimated by Richardson & Williams (1931). There are only six lines, all belonging to the system 3d zS~2p ZIJ, and the data are set out in table 4.
Table 4R. & W. (1931)
allocation and
L 1
I(a/b)F. & R. (1944)
wave number about about Av I(a/b) remarks
Q l 16854-86(10) 0-210 -*
30 bands
0-194 2-5 U means insufficientlyQ 3 16654-24 (9) 0-17 U 0-173 2-5 resolved for a reliR 2 16834-27(10) 0-11 u 0-114 4 ,U able estimate to beR 4 16710-63 (6) U u 0-06 U ca. 1 made
Q 1 16603-20 (9) 0-211
5/3-1 bands
0-196 2-5R 2 16584-72(10) o - o s U 0-118 5 —
on July 12, 2018http://rspa.royalsocietypublishing.org/Downloaded from

174 E. W. Foster and Sir Owen Richardson
The values in table 4 represent complete agreement within the limits for which reliance could be placed, in the estimates made from the 1931 observations. Too much confidence should not be placed in the last decimal figure in the 1944 results whether for Avor /(a /6), but some fines are better than others. Some guidance can be got from the figures in the tolerance column of table 3 with regard to this.
We wish to express our thanks to the Department of Scientific and Industrial Research and to the Royal Society for the provision of financial assistance which enabled this work to be carried out.
R e f e r e n c e s
Barrell, H. & Sears, J. E. 1939 Phil. Trans. A, 238, 32.Drinkwater, J. W., Richardson, Sir Owen & Williams, W. Ewart 1940 Proc. Boy. Soc. A,
174, 164.Gale, H. G., Monk, G. S. & Lee, K. O. 1928 Astrophys. J . 67, 89.Kapuscinski, W. & Eymers, J. G. 1929 Proc. Roy. Soc. A, 122, 58.Meggers, W. F. & Peters, C. G. 1918 Bull U.S. Bur. Stand. 14, 697.Merton, T. R. & Barratt, S. 1922 Phil. Trans. A, 222, 369.Richardson, O. W. 1934 Molecular hydrogen and its spectrum. New Haven: Yale University
Press; London: Oxford University Press.Richardson, O. W. & Williams, W. E. 1931 Nature, 127, 481.Schuler, H. 1931 Z. Phys. 72, 423.Williams, W. E. 1931 Nature, 127, 816.Williams, W. E. 1933 Proc. Phys. Soc. 45, 699.Williams, W. E. & Gogate, D. V. 1938 Proc. Roy. Soc. A, 167, 509.Williams, W. E. & Middleton, A. 1939 Proc. Roy. Soc. A, 172, 159.
on July 12, 2018http://rspa.royalsocietypublishing.org/Downloaded from