the first stage of developing preference-based measures: constructing a health-state classification...
TRANSCRIPT

The first stage of developing preference-based measures:constructing a health-state classification using Rasch analysis
Tracey Young Æ Yaling Yang Æ John E. Brazier ÆAki Tsuchiya Æ Karin Coyne
Accepted: 20 November 2008 / Published online: 11 December 2008
� Springer Science+Business Media B.V. 2008
Abstract
Objective To set out the methodological process for using
Rasch analysis alongside classical psychometric methods
in the development of a health-state classification that is
amenable to valuation.
Methods The overactive bladder questionnaire is used to
illustrate a five step process for deriving a reduced health-
state classification from an existing non-preference-based
health-related quality-of-life instrument. Step I uses factor
analysis to establish instrument dimensions, step II excludes
items that do not meet the initial validation process and step
III uses criteria based on Rasch analysis and other psy-
chometric testing to select the final items for the health-state
classification. In step IV, item levels are examined and
Rasch analysis is used to explore the possibility of reducing
the number of item levels. Step V repeats steps I–IV on
alternative data sets in order to validate the selection of
items for the health-state classification.
Results The techniques described enable the construction
of a five-dimension health-state classification, the OAB-5D,
amenable to valuation tasks that will allow the derivation of
preference weights.
Conclusions The health-related quality of life of patients
with conditions like overactive bladder can be valued and
quality adjustment weights estimated for calculation of
quality-adjusted life years.
Keywords Rasch analysis �Health-related quality of life � Condition-specific measure �Preference-based measures �Overactive bladder syndrome � Quality-adjusted life years
Abbreviations
DIF Differential item functioning
HRQL Health-related quality of life
Non-PBM Non-preference-based measure
MAUT Multiatribute utility theory
OAB Overactive bladder syndrome
OAB-q Overactive bladder questionnaire
PBM Preference-based measure
PSI Person separation index
QALY Quality-adjusted life years
SG Standard gamble
SRM Standardised response mean
TTO Time-trade off
Introduction
Economic evaluations are performed when appraising
health-care technologies to inform the allocation of
resources between competing health-care programmes. A
widely used methodology is cost-effectiveness analysis, in
which interventions are compared in terms of their cost per
quality adjusted life years (QALYs) gained. The QALY
T. Young (&) � Y. Yang � J. E. Brazier � A. Tsuchiya
School of Health and Related Research, HEDS University of
Sheffield, Regent Court 30 Regent Street, Sheffield S1 4DA, UK
e-mail: [email protected]
T. Young
Yorkshire and Humber Research Design Service (RDS),
University of Sheffield, Sheffield S1 4DA, UK
A. Tsuchiya
Department of Economics, University of Sheffield,
Sheffield S1 4DT, UK
K. Coyne
United BioSource Corporation Center for Health Outcomes
Research, Bethesda, MD, USA
123
Qual Life Res (2009) 18:253–265
DOI 10.1007/s11136-008-9428-0

captures health benefits in terms of the length of life (in the
form of ‘‘years’’) and the quality of life (in the form of
‘‘health state values’’) into a single summary measure,
based on people’s preferences. It achieves this by assigning
a value to each health state experienced by a patient on a
scale from one for full health to zero for states regarded
equivalent to being dead (and negative values for states
worse than being dead) [1].
A common way of estimating health-state values is to
use a ‘‘generic’’ preference-based instrument, such as the
EQ-5D [2] HUI3 [3], or SF-6D [4]. These measures have a
multi-dimensional classification for describing a person’s
health state [1]. So, for example, the EQ-5D has five
dimensions, where each dimension contains one item:
mobility, self care, usual activities, pain/discomfort, and
depression/anxiety. Each dimension has three levels: no
problem (level 1), moderate or some problems (level 2),
and severe problem (level 3). Together these five dimen-
sions define a total of 243 health states formed by different
combinations of the levels (i.e., 35). The EQ-5D is a one
page questionnaire designed for self completion and
responses to the five domains are used to assign a given
patient at a given point in time an EQ-5D health-state
classification. Each generic preference-based measure, like
the EQ-5D, has a preference-based algorithm for assigning
values to each health state. These preference weights are
obtained by asking members of the general public to value
the health states using a choice-based valuation technique
such as standard gamble or time trade-off [1].
These preference-based measures are normally generic,
where it is assumed that the measure is relevant to all health
care interventions and patient groups. This assumption has
been supported in some interventions and disease groups,
for example Marra et al. [5] demonstrated the discrimina-
tive ability of four generic measures across severity levels
for patient with rheumatoid arthritis. However, generic
measures of health have been found to be inappropriate or
insensitive for some medical conditions [6]. For this reason
many clinicians and researchers prefer condition-specific
measures. However, most condition-specific measures are
not preference-based, seeking to describe health rather than
value health, and therefore cannot be used to derive the
‘‘quality adjustment weight’’ for use in QALYs.
One approach has been to try to ‘‘map’’ from the condi-
tion-specific measures on to the generic preference-based
measures by judgement based methods, for example, using
panels of experts [7], or empirically, using a separate data set
containing the non-preference based measure and the gen-
eric preference-based measure [8–10]. Several studies have
mapped condition-specific non-preference-based measures
on to preference-based measures using regression-based
approaches (e.g., Tsuchiya et al., [10]). However, a review
of mapping functions from 28 studies found that their
performance, in terms of model fit and predictions, varied
substantially [11]. More concerning is the tendency of these
mapping functions to over-predict the preference-based
index at the lower, more severe end of the health-related
quality-of-life (HRQL) scale and under-predict at the higher
end (e.g., Gray et al., [12]). Further, mapping methods are
limited by the degree of overlap in terms of coverage
between the descriptive systems (questionnaire items) of
measures, where important dimensions of one instrument
are not necessarily covered by the other instrument.
These issues regarding mapping functions lead to the
exploration of a more direct methodological approach of
deriving preference-based quality-adjusted weights for the
condition-specific measure. In order to do this, it is usually
necessary to reduce the length of the original instrument, as
existing measures are typically too large to value. The
approach described here develops the methodology pio-
neered for the SF-36, where the 36-item instrument was
reduced to a six-dimension health-state classification, the
SF-6D, which was amenable to valuation by respondents
[4, 13].
This paper sets out to use Rasch analysis as a tool
alongside classical psychometric methods to help derive a
health-state classification system amenable to valuation
using a preference-elicitation technique such as time trade-
off (TTO) or standard gamble (SG). The Overactive
Bladder Questionnaire (OAB-q), a condition-specific
measure, is used as an example. Rasch analysis is a
mathematical modelling technique [14] that, in relation to
HRQL questionnaires, converts each categorical (qualita-
tive) item response to a continuous (unmeasured) latent
scale using a logit model, where the scale is conceived to
be a continuous measure of HRQL.
The process is the first stage of a three-part process in
creating a preference-based measure that can be obtained
directly from the original instrument [15]. In the first stage
Rasch analysis is used, first to select items from the ori-
ginal instrument and second to reduce the existing number
of item levels to a more manageable number for valuation
purposes. In this paper we do not argue that Rasch analysis
is offering a single formulaic solution to the problem of
developing a health-state classification small enough to be
subjected to a valuation survey from an existing HRQL
instrument. What we attempt to show is how Rasch anal-
ysis can help ensure that the process of creating a health-
state classification makes the best use of the richness and
sensitivity of the original instrument.
The second stage is to undertake a survey which asks a
representative sample of the general population to value a
selection of states defined by the reduced classification
system. The third stage is modelling the sample health-
state values and uses these econometric models to predict
health-state values for all possible states defined by the new
254 Qual Life Res (2009) 18:253–265
123

classification system. The resulting scoring algorithm or
population value set will provide a preference-based single
index measure for different condition-specific health states,
contributing toward calculation of QALYs. This paper
reports on the first stage; the second and third stages are
addressed in a separate paper [16].
The Overactive Bladder Questionnaire (OAB-q)
Overactive bladder (OAB) is characterised by urinary
urgency, with or without urgency incontinence, and is often
accompanied by urinary frequency and nocturia [17]. It has
been demonstrated that generic quality of life measures
such as the SF-36 and the EQ-5D may not be sensitive
enough to detect change in HRQL over time for patients
with specific symptoms [18], therefore, a condition-specific
measure may be more appropriate (e.g., OAB-q).
The OAB-q is a 33-item condition specific questionnaire
that was developed to assess the symptom bother and
impact of OAB on patients. The OAB-q has been well
validated in patients with continent and incontinent OAB,
and good internal consistency, test–retest reliability, con-
current validity, discriminate validity, and responsiveness
to treatment-related change have been demonstrated [19–
21]. The OAB-q consists of an eight-item symptom bother
scale and a 25-item HRQL scale with four subscales:
coping (eight items), sleep (five items), concern (seven
items), and social interaction (five items). Responses to the
OAB-q are based upon a six-point Likert scale with one
denoting no impact and six denoting high impact. Results
are reported in terms of domain scores or overall scores,
where neither scoring system is preference based.
Two versions of OAB-q exist—the 33-item version
described above and the 19-item short-form OAB-q com-
prising of items on symptom bother and 13 items on
HRQL. The 19 items in the short-form OAB-q are identical
in wording and item response options to those in the longer
version of the instrument.
OAB-q datasets and Rasch modelling
Rasch rating-scale models [14] are fitted to responses to the
OAB-q from patients with OAB, with or without urge
incontinence, from two datasets, ‘‘Trial I’’ and ‘‘Trial II’’.
Both Trial I and Trial II are multicentre randomised con-
trolled trials in which participants with OAB are asked to
complete the OAB-q at baseline, four weeks, and twelve
weeks [22]. A sub-sample of 391 patients randomly
selected from the baseline analysis of Trial I are used to
select items for the reduced health-state classification. Data
from the remaining patients in Trial I and Trial II are then
used to validate the item choices.
Methods: using Rasch analysis alongside
other psychometric methods in the construction
of a health-state classification
To date, Rasch analysis [14] has conventionally been
applied in HRQL studies in the development of new HRQL
questionnaires (for example Refs. [23–25]) and in the
validation of existing HRQL questionnaires (for example
Refs. [26–28]). When Rasch models are applied in the
development or validation of HRQL instruments it is
assumed that the construct under investigation is unidi-
mensional—only measuring one aspect of HRQL, for
example physical functioning [29]. However, the assump-
tion of unidimensionality is not valid for the health-state
classifications used by preference-based measures, like
EQ-5D or HUI3. These are based on assumptions related to
multiattribute utility theory (MAUT) and rely on the
dimensions being orthogonal [1, 30]. MAUT uses utility
weighting to combine the independent dimensions into a
single index.
The objective of this paper is to set out the process of
developing a health-state classification amenable to valu-
ation by respondents with a minimum loss of information
and subject to the constraint that responses to the original
instrument can be unambiguously mapped on to it. Thus,
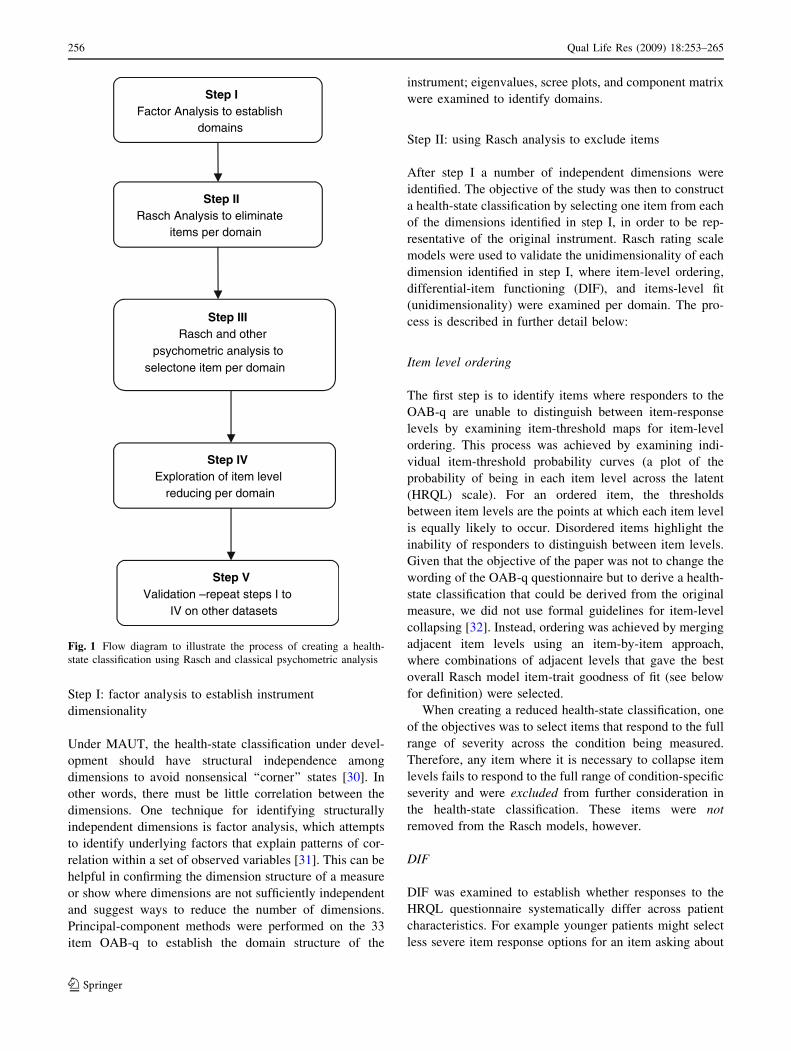
what we are seeking to present here is a five-step process
which, first, verifies and establishes the dimensionality of
the original non-preference-based measure (non-PBM).
These dimensions will then form the domains of the health-
state classification (Fig. 1). Once these dimensions have
been established Rasch analysis will be used alongside
classical psychometric tests to understand the relationship
between items (and item levels) and aid in selecting the
most representative item per domain for the health-state
classification (steps II and III). In the fourth step, item
levels are examined and Rasch analysis is used to explore
the possibility of reducing the number of item levels. The
final step repeats steps I to IV on alternative data sets to
validate the selection of items for the health-state
classification.
Prior to the item selection process, a decision should be
made about whether the reduced health-state classification
can be derived from all versions of the existing condition-
specific measure when multiple versions of the condition-
specific measure exist, (e.g., the 33-item OAB-q and the
19-item short-form OAB-q). Consideration should be given
to any potential differences in wording for those items
common across versions or to versions that combine two or
more items from previous versions. These differences are
important at the valuation stage of the health-state classi-
fication where any change in wording could lead to
responders placing different values on the health states
under consideration.
Qual Life Res (2009) 18:253–265 255
123
Step I: factor analysis to establish instrument
dimensionality
Under MAUT, the health-state classification under devel-
opment should have structural independence among
dimensions to avoid nonsensical ‘‘corner’’ states [30]. In
other words, there must be little correlation between the
dimensions. One technique for identifying structurally
independent dimensions is factor analysis, which attempts
to identify underlying factors that explain patterns of cor-
relation within a set of observed variables [31]. This can be
helpful in confirming the dimension structure of a measure
or show where dimensions are not sufficiently independent
and suggest ways to reduce the number of dimensions.
Principal-component methods were performed on the 33
item OAB-q to establish the domain structure of the
instrument; eigenvalues, scree plots, and component matrix
were examined to identify domains.
Step II: using Rasch analysis to exclude items
After step I a number of independent dimensions were
identified. The objective of the study was then to construct
a health-state classification by selecting one item from each
of the dimensions identified in step I, in order to be rep-
resentative of the original instrument. Rasch rating scale
models were used to validate the unidimensionality of each
dimension identified in step I, where item-level ordering,
differential-item functioning (DIF), and items-level fit
(unidimensionality) were examined per domain. The pro-
cess is described in further detail below:
Item level ordering
The first step is to identify items where responders to the
OAB-q are unable to distinguish between item-response
levels by examining item-threshold maps for item-level
ordering. This process was achieved by examining indi-
vidual item-threshold probability curves (a plot of the
probability of being in each item level across the latent
(HRQL) scale). For an ordered item, the thresholds
between item levels are the points at which each item level
is equally likely to occur. Disordered items highlight the
inability of responders to distinguish between item levels.
Given that the objective of the paper was not to change the
wording of the OAB-q questionnaire but to derive a health-
state classification that could be derived from the original
measure, we did not use formal guidelines for item-level
collapsing [32]. Instead, ordering was achieved by merging
adjacent item levels using an item-by-item approach,
where combinations of adjacent levels that gave the best
overall Rasch model item-trait goodness of fit (see below
for definition) were selected.
When creating a reduced health-state classification, one
of the objectives was to select items that respond to the full
range of severity across the condition being measured.
Therefore, any item where it is necessary to collapse item
levels fails to respond to the full range of condition-specific
severity and were excluded from further consideration in
the health-state classification. These items were not
removed from the Rasch models, however.
DIF
DIF was examined to establish whether responses to the
HRQL questionnaire systematically differ across patient
characteristics. For example younger patients might select
less severe item response options for an item asking about
Step IFactor Analysis to establish
domains
Step IIRasch Analysis to eliminate
items per domain
Step IIIRasch and other
psychometric analysis to selectone item per domain
Step IVExploration of item level
reducing per domain
Step VValidation –repeat steps I to
IV on other datasets
Fig. 1 Flow diagram to illustrate the process of creating a health-
state classification using Rasch and classical psychometric analysis
256 Qual Life Res (2009) 18:253–265
123

physical abilities than older patients. Items where it is
necessary to adjust for systematic DIF across groups of
responders are of limited value for making cross-popula-
tion comparisons and, therefore, were excluded from
further consideration.
Gender (male/female) and age (\65 years/[65 years)
were examined for DIF using item-characteristic curves
and item-by-characteristic ANOVA statistics. Adjustments
were made to Rasch models where DIF occurred by sep-
arating the item into different person factors, for example if
an item exhibits systematic DIF by gender the responses
are separated for males and females and the Rasch model
refitted. Any item for which it was necessary to adjust for
DIF was excluded from further consideration in the health-
state classification, although it was not eliminated from the
Rasch models.
Rasch model goodness of fit
The final stage was to achieve overall model goodness of fit
by examining item–trait interactions, the person separation
index (PSI), and person and item fit residuals. The item–
trait interaction measures whether data fit the Rasch model
for discrete groups of responders. The groups are selected
by dividing the responders into a series of subgroups based
upon where each responder lies on the latent scale of the
Rasch model. Thus responders who tend to have similar
HRQL for an OAB-q domain will be grouped together.
Observed and expected responses are compared across
items and traits and the difference between these responses
is summarised using the v2 test statistic. A well fitting
Rasch model should have no deviation between the
observed and expected responses and, therefore, the con-
vention is that the P-value for the overall model v2 statistic
should be [0.01 for a well fitting model [33]. Bonferroni
corrections were used to allow for multiple testing.
The person separation index (PSI) measures the level of
discrimination amongst different groups of responders,
where the higher the PSI value the better the level of dis-
crimination. A PSI of 0.7 or more indicates a well fitting
Rasch model [34].
Fit residuals estimate the amount of divergence between
the expected and observed responses for each respondent or
item response; fit residuals are summed over all items (item
fit residuals) or summed over all persons (person fit
residuals). The residuals are standardised to approximate
the Z-score and, therefore, the mean item or person fit
residual should be approximately zero with a standard
deviation approximately equal to unity.
For each domain, if the overall item-trait fit of the model
is statistically significant, i.e., poor Rasch model goodness
of fit, the fit of each of the individual items included in the
Rasch model was examined. As with the overall model
goodness of fit, items with an individual v2 P-value of
\0.01 (prior to Bonferroni adjustment) were said not to fit
the Rasch model, i.e., these items did not contribute to the
underlying latent scale, e.g., symptom bother, coping,
sleeping, concern or social HRQL. The item with the lowest
P-value (that is \0.01) was removed, the model was then
refitted and the overall goodness of fitness statistic exam-
ined for the new model. The process was repeated until only
well fitting items remained and the overall item-trait
goodness of fit of the model was non-significant. Any item
that was removed from the Rasch models was excluded
from further consideration in the health-state classification.
Item-level ordering was re-examined at each stage of the
Rasch analysis.
Step III: using Rasch analysis and other psychometric
analysis to select items
At the end of Step II there was a series of domain-based
Rasch models which potentially contain items with col-
lapsed item level and adjustments for DIF, alongside
unadjusted items. Step III examined item-level Rasch sta-
tistics alongside other conventional psychometric analysis
on the items that were not excluded from consideration in
the health-state classification in step II to select the best
items from the full condition-specific measure. The objec-
tive of the selection process for the reduced health-state
classification was to select items that span the full range of
condition severity. The criteria used are described below.
Rasch analysis
Item selection is predominantly based upon the spread of
item levels across the latent space, as selected items should
span the full range of condition severity, where the wider
the spread the better the item. Threshold probability curves
are used to examine the spread of item levels at a point on
the latent scale, typically at the central logit zero.
Item goodness of fit statistics (v2) were also taken into
consideration when selecting items, where the better the
goodness of fit (high v2 value and non-significant P-value)
the better the item represents the underlying unidimen-
sional latent scale for each domain.
Other psychometric analysis
It is recognised that Rasch analysis should be used along-
side classical psychometric methods in the construction of
HRQL measures [35]. Therefore, the performance of items
across conventional psychometric criteria should be taken
into consideration when selecting items, for example:
feasibility (rate of missing data), internal consistency
(correlation between item and domain scores), distribution
Qual Life Res (2009) 18:253–265 257
123

of responses (e.g., the absence of ceiling or floor effects),
and responsiveness (between baseline and follow-up vis-
its). The responsiveness of OAB-q was measured with the
standardised response mean (SRM) [36] using data from
Trial I at baseline and at 12 weeks follow-up. Although no
formal cut-off criteria were applied for the psychometric
methods, items were excluded from the analysis if, in the
opinion of the authors, the value under examination was
extremely low for SMR and correlations, or high for floor
effects, ceiling effects, and missing data.
The overall performance of items across Rasch and
psychometric tests was examined with preference given to
items with reasonable Rasch model goodness of fit and
spread of item levels. Rasch goodness-of-fit statistics and
item-level spread criteria were obtained from Rasch mod-
els fitted to the OAB-q domains derived in step I. These
Rasch models included items that were not under consid-
eration for inclusion in the reduced health-state
classification, e.g., items split for DIF or items with col-
lapsed item levels applied in step II, as these items
contribute to the original OAB-q overall domain measure
of HRQL.
Step IV: Rasch analysis as a tool to explore collapsing
item levels
At the end of step III the analyst will have a series of items,
one per domain, which will form the health-state classifi-
cation. In the construction of a reduced health-state
classification it is important to ensure that information
relating to items and item levels is not redundant. Previous
work with health-state classifications has found that
respondents sometimes have problems distinguishing
between item levels. Rasch analysis, alongside other psy-
chometric criteria, can be used to guide selection of
appropriate item levels for collapsing and examine whether
respondents are able to distinguish between item levels and
whether ordering makes sense. Item-level collapsing
should be carried out on items selected for the health-state
classification at the generic level, for items sharing a
common wording of item levels, for example ‘‘I have
problems with X none of the time/some of the time/all of
the time’’. A generic collapsing of item levels will aid
responders in the valuation survey in distinguishing
between health states.
Threshold probability curves, which show the distribu-
tion of item levels across latent space, can be examined, in
which item levels that are closer together, in comparison
with other levels, are candidates for item-level collapsing.
The distribution of responses across an item should also be
taken into account when merging item levels, where
adjacent item levels with low response frequencies are
candidates for collapsing. More than one possible solution
to item merging may be available and each solution should
be tested using Rasch analysis and the results compared,
using threshold maps and item goodness of fit statistics,
before deciding on the most appropriate solution.
For this step it is not applicable to apply a single Rasch
analysis to the items selected for the health-state classifi-
cation, given that the health-state classification is multi-
dimensional. Therefore, the collapsing of item levels is
explored using the domain specific Rasch models devel-
oped in step II of the health-state classification process,
where these Rasch models include items that were not
selected for the health-state classification.
For some health-state classifications the collapsing of
item levels may not be necessary, if this is the case then the
exploration of possible level collapsing at this step will
lead to Rasch models which are likely to result in unor-
dered items, problems with DIF, or poor goodness of fit, as
described in Step II. Should this arise, item levels should
not be reduced in the final health-state classification.
Step V: validation of item selection for the health-state
classification
The items selected for the health-state classification have
been selected on the basis of responses to the OAB-q at one
time point and from one dataset, and this process should be
validated by repeating the item selection and item-level-
reduction process on a random sample from the original
data set, or a second independent sample of patients. Fur-
ther, if the preference-based instrument is to be amenable
to multiple versions of the condition-specific measure, then
item selection and item-level reduction should be validated
for all versions of the instrument. This validation check
will inevitably strengthen the justification for items selec-
ted for the final preference-based instrument.
RUMM2020 [37] was used for all Rasch analysis and
SPSS version 14 for all other statistical analysis [38].
Results
For OAB, the research team decided that the health-state
classification should be derived from both versions of the
OAB-q. Thus, only the 19 questions common to both
instruments are considered for selection in the reduced
health-state classification (Table 1).
Step I: Factor analysis to establish instrument
dimensionality
The loadings from the principal-component method for all
OAB-q items indicated that items loaded into symptoms
items and HRQL items. Further analysis of the symptoms
258 Qual Life Res (2009) 18:253–265
123
items suggested that items 4 and 5, which asked about
nighttime urination, loaded differently into the remaining
items in the domain. Further, items 3 and 6, which related
to urine loss, grouped differently to items 1 and 2 which
asked about frequency and urge (Table 2). The remaining
HRQL items loaded into the four domains (coping, sleep,
concern, and social), previously defined by the instrument
developers. (Full principal-component analysis results are
available on request.) Therefore, it was decided to initially
consider four OAB-q HRQL domains (coping, sleep,
Table 1 Overall summary of the 19 items common to the OAB-q and short-form OAB-q and summary of eliminated items after step II
Item Question Rasch model included in
(domain)
Item levels collapsed DIF—characteristic
and split
Failed to meet
Rasch goodness
of fit criteria
1 An uncomfortable urge to urinate Symptom bothera
2 A sudden urge to urinate with little
or no warning
Symptom bothera
3 Accidental loss of small amounts
of urine
Symptom botherb Failed
4 Nighttime urination Symptom botherc Not at all and a little bit
5 Waking up at night because you had
to urinate
Symptom botherc
6 Urine loss associated with strong
desire to urinate
Symptom botherb
7 Made you uncomfortable while
travelling with others because of
needing to stop for a rest room
Coping
8 Interfered with your ability to get a
good night’s rest
Sleep
9 Awakened you during sleep Sleep Failed
10 Interfered with getting the amount of
sleep you needed
Sleep Failed
11 Made you avoid activities away
from rest rooms (i.e., walks,
running, hiking)
Coping A good bit of the time and
most of the time and all
of the time
12 Caused you to decrease your
physical activities (exercising,
sport etc.)
Coping None of the time and a little
of the time Most of the
time and all of the time
Some of the time and a
good bit of the time
13 Caused you to plan ‘‘escape routes’’
to rest rooms in public places
Coping
14 Caused you to locate the closest rest
room as soon as you arrive at a
place you have never been
Coping
15 Caused you embarrassment Concern
16 Made you feel like there is
something wrong with you
Concern A good bit of the time and
most of the time and all
of the time
17 Made you frustrated or annoyed
about the amount of time you
spend in the rest room
Concern Age \65 vs. [65 Failed
18 Affected your relationship with
family and friends
Social
19 Caused you to have problems with
your partner or spouse
Social A good bit of the time and
most of the time and all
of the time
a Item included in the symptom bother domain relates to symptoms of urgeb Item included in the symptom bother domain relates to symptoms of lossc Item included in the symptom bother domain relates to sleep-related symptoms
Qual Life Res (2009) 18:253–265 259
123
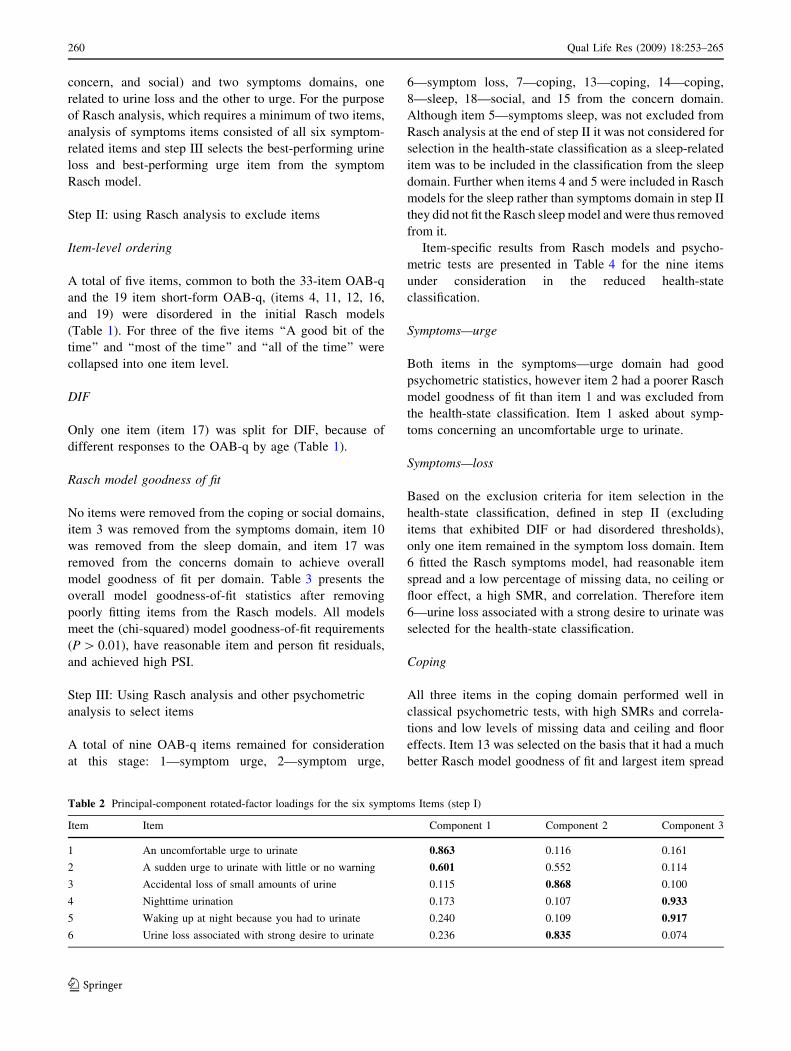
concern, and social) and two symptoms domains, one
related to urine loss and the other to urge. For the purpose
of Rasch analysis, which requires a minimum of two items,
analysis of symptoms items consisted of all six symptom-
related items and step III selects the best-performing urine
loss and best-performing urge item from the symptom
Rasch model.
Step II: using Rasch analysis to exclude items
Item-level ordering
A total of five items, common to both the 33-item OAB-q
and the 19 item short-form OAB-q, (items 4, 11, 12, 16,
and 19) were disordered in the initial Rasch models
(Table 1). For three of the five items ‘‘A good bit of the
time’’ and ‘‘most of the time’’ and ‘‘all of the time’’ were
collapsed into one item level.
DIF
Only one item (item 17) was split for DIF, because of
different responses to the OAB-q by age (Table 1).
Rasch model goodness of fit
No items were removed from the coping or social domains,
item 3 was removed from the symptoms domain, item 10
was removed from the sleep domain, and item 17 was
removed from the concerns domain to achieve overall
model goodness of fit per domain. Table 3 presents the
overall model goodness-of-fit statistics after removing
poorly fitting items from the Rasch models. All models
meet the (chi-squared) model goodness-of-fit requirements
(P [ 0.01), have reasonable item and person fit residuals,
and achieved high PSI.
Step III: Using Rasch analysis and other psychometric
analysis to select items
A total of nine OAB-q items remained for consideration
at this stage: 1—symptom urge, 2—symptom urge,
6—symptom loss, 7—coping, 13—coping, 14—coping,
8—sleep, 18—social, and 15 from the concern domain.
Although item 5—symptoms sleep, was not excluded from
Rasch analysis at the end of step II it was not considered for
selection in the health-state classification as a sleep-related
item was to be included in the classification from the sleep
domain. Further when items 4 and 5 were included in Rasch
models for the sleep rather than symptoms domain in step II
they did not fit the Rasch sleep model and were thus removed
from it.
Item-specific results from Rasch models and psycho-
metric tests are presented in Table 4 for the nine items
under consideration in the reduced health-state
classification.
Symptoms—urge
Both items in the symptoms—urge domain had good
psychometric statistics, however item 2 had a poorer Rasch
model goodness of fit than item 1 and was excluded from
the health-state classification. Item 1 asked about symp-
toms concerning an uncomfortable urge to urinate.
Symptoms—loss
Based on the exclusion criteria for item selection in the
health-state classification, defined in step II (excluding
items that exhibited DIF or had disordered thresholds),
only one item remained in the symptom loss domain. Item
6 fitted the Rasch symptoms model, had reasonable item
spread and a low percentage of missing data, no ceiling or
floor effect, a high SMR, and correlation. Therefore item
6—urine loss associated with a strong desire to urinate was
selected for the health-state classification.
Coping
All three items in the coping domain performed well in
classical psychometric tests, with high SMRs and correla-
tions and low levels of missing data and ceiling and floor
effects. Item 13 was selected on the basis that it had a much
better Rasch model goodness of fit and largest item spread
Table 2 Principal-component rotated-factor loadings for the six symptoms Items (step I)
Item Item Component 1 Component 2 Component 3
1 An uncomfortable urge to urinate 0.863 0.116 0.161
2 A sudden urge to urinate with little or no warning 0.601 0.552 0.114
3 Accidental loss of small amounts of urine 0.115 0.868 0.100
4 Nighttime urination 0.173 0.107 0.933
5 Waking up at night because you had to urinate 0.240 0.109 0.917
6 Urine loss associated with strong desire to urinate 0.236 0.835 0.074
260 Qual Life Res (2009) 18:253–265
123

at logit 0 than the other two items. Item 13 asked whether
bladder symptoms caused you to plan escape routes.
Sleep
As with the symptoms—loss domain, only item 8 remained
under consideration in the sleep domain for possible
selection. This item fitted the Rasch sleep model (signifi-
cance level after Bonferroni correction P [ 0.002), had
moderate item spread and percentage of missing data, no
ceiling or floor effect, a high SMR, and correlation. Item 8
asked about whether bladder symptoms interfered with
getting a good night’s sleep.
Social
Item 18, the only item under consideration from the social
domain, had a very high floor effect, where 61.8% of
responders felt that OAB never ‘‘affected your relationship
with family and friends’’. Additionally, item 18 had poor
responsiveness (SRM = 0.43) compared with other items.
Therefore, the team decided not to include an item from the
social domain in the preference-based measure.
Concern
After the exclusion criteria for item selection in the health-
state classification, defined in step II, had been applied,
only item 15 remained in the concern domain for possible
selection, this item fitted the Rasch concern model,
had moderate item spread and percentage of missing data,
no ceiling or floor effect, a high SMR, and correlation. Item
15 asked about whether bladder symptoms caused
embarrassment.
Thus five items were selected for the reduced health-
state classification, to be known as OAB-5D.
Step IV: Rasch analysis as a tool to explore collapsing
item levels
For the OAB-5D the objective was to explore the possi-
bility of having either four or five item levels rather than
the original six item levels. Items 1 and 6 present item
choices in terms of severity, ranging from ‘‘not at all’’ to ‘‘a
very great deal’’. The remaining three items ask about
frequencies and range from ‘‘none of the time’’ to ‘‘all of
the time’’.
Table 3 Rasch model goodness if fit for the five OAB-q domains after Step II
Domain v2Goodness
of fit
Degrees of freedom
(v2)
P-value
(v2)
Person
separation
index
Item fit
(SD)
Person fit
(SD)
Symptom
bother
50.6 45 0.262 0.89 0.51 (1.06) -0.66 (1.84)
Coping 53.4 45 0.183 0.93 0.03 (0.96) -0.36 (1.24)
Sleep 42.8 25 0.015 0.93 0.05 (1.63) -0.43 (1.02)
Social 31.9 20 0.035 0.88 0.04 (2.03) -0.46 (1.08)
Concerns 38.1 25 0.045 0.84 -0.15 (1.05) -0.29 (0.81)
Table 4 Results for the ten items not excluded from Rasch model validation common to OAB-q and short-form OAB-q (Step III)
Rasch criteria Other criteria
Item Domain Location Residual Item level
v25(P-value)
Spread at
logit 0
% response at
floor (level 1)
% response at
ceiling (level 6)
SRM % missing
data
Correlation with
domain score
1 Symptoms—urge -0.17 -0.11 5.28 (0.382) 0.88 2.0 7.9 0.79 6.5 0.67
2 Symptoms—urge -0.21 -0.38 14.98 (0.010) 0.81 3.1 9.6 0.82 7.8 0.74
6 Symptoms—loss 0.14 1.22 0.60 (0.988) 0.63 6.6 8.7 0.72 18.4 0.69
7 Coping 0.23 1.73 9.37 (0.095) 0.43 27.3 11.4 0.72 6.7 0.85
13 Coping 0.16 0.10 2.42 (0.788) 0.55 25.8 10.2 0.62 2.8 0.85
14 Coping -0.51 -0.46 6.28 (0.280) 0.54 16.4 19.1 0.77 1.6 0.84
8 Sleep -0.17 -0.47 18.51 (0.002) 0.78 11.0 28.4 0.84 1.3 0.91
18 Social 0.40 -1.86 6.46 (0.264) 0.63 61.8 4.0 0.43 3.4 0.88
15 Concern 1.18 -0.13 4.83 (0.437) 0.39 32.2 9.2 0.65 1.5 0.82
Qual Life Res (2009) 18:253–265 261
123

An examination of threshold curves (Fig. 2) for item 6
suggested that levels ‘‘a little bit’’ and ‘‘somewhat’’ were
closest together, this pattern was also true across other
items in the symptoms domain not selected for OAB-5D
(results not shown). However, item responses (Table 5)
suggested collapsing ‘‘not at all’’ with ‘‘a little bit’’ or ‘‘a
great deal’’ with a very great deal’’, as these response
categories had the fewest responders. Each of the three
options listed above were tested in Rasch analysis on the
validated symptoms domain and ‘‘a little bit’’ and ‘‘some-
what’’ gave the best Rasch model goodness of fit statistics
and thus was used in OAB-5D.
It was difficult to identify potential item-response cate-
gories for collapsing from the proportion of responses at
each level as these were fairly evenly distributed across all
item levels for items 8, 13, and 15 (Table 5). The threshold
probability curve for item 15 suggested that ‘‘most of the
time’’ and ‘‘all of the time’’ could be collapsed; item 13
implied ‘‘a good bit of the time’’ and ‘‘most of the time’’
could be collapsed, and item 8 suggested ‘‘a good bit of the
time’’ and ‘‘most of the time’’ and ‘‘all of the time’’ could
be collapsed. Each option was tested in Rasch analysis:
when two levels, ‘‘most of the time’’ and ‘‘all of the time’’,
or three levels, ‘‘a good bit of the time’’ and ‘‘most of the
time’’ and ‘‘all of the time’’ were collapsed, item 13
(coping) was no longer ordered in Rasch models, sug-
gesting further level collapsing. However, all three items
performed well when ‘‘a good bit of the time’’ and ‘‘most
of the time’’ were collapsed together. Figure 3 presents the
final instrument for OAB-5D.
Step V: validation of item selection for the health-state
classification
Rasch models were validated on the remaining 746 patients
from Trial I. Item selection was also validated on a second
dataset, Trial II (N = 793). All Rasch models were first
fitted to the 33-item OAB-q and further validated on the
short-form OAB-q. All analysis confirmed the selection of
items 1, 6, 8, 13, and 15 in OAB-5D. (Results are available
from the authors on request.)
Item 1 Item 6 Item 8
-3 -2 -1 0 1 2 3
Person Location (logits)
0.0
0.2
0.4
0.6
0.8
1.0
-3 -2 -1 0 1 2 3
Person Location (logits)
0.0
0.2
0.4
0.6
0.8
1.0
-3 -2 -1 0 1 2 3
Person Location (logits)
0.0
0.2
0.4
0.6
0.8
1.0
Pro
babi
lity
Pro
b ab i
lity
Pro
b ab i
lity
Pro
b ab i
lity
Pro
b ab i
lity
-3 -2 -1 0 1 2 3
Person Location (logits)
0.0
0.2
0.4
0.6
0.8
1.0
-3 -2 -1 0 1 2 3
Person Location (logits)
0.0
0.2
0.4
0.6
0.8
1.0 Threshold between:
Item levels 1 and 2
Item levels 2 and 3
Item levels 3 and 4
Item levels 4 and 5
Item levels 5 and 6
Item 13 Item 15
Fig. 2 Probability threshold curves for items 1, 6, 8, 13, and 15 of the OAB-5D prior to item-level collapsing (Step IV)
Table 5 Distribution of responses across item levels for five items selected for OAB-5D (Step IV)
Item Not at all A little bit Somewhat Quite a bit A great deal A very great deal
1 8 (2.0%) 60 (15.3%) 100 (25.6%) 104 (26.6%) 64 (16.4%) 31 (7.9%)
6 26 (6.6%) 45 (11.5%) 61 (15.6%) 90 (23.0%) 58 (14.8%) 34 (8.7%)
None of the time A little of the time Some of the time A good bit of the time Most of the time All of the time
8 43 (11.0%) 57 (14.6%) 69 (17.6%) 47 (12.0%) 59 (15.1%) 111 (28.4%)
13 101 (25.8%) 78 (19.9%) 71 (18.2%) 39 (10.0%) 47 (12.0%) 40 (10.2%)
15 126 (32.2%) 80 (20.5%) 74 (18.9%) 39 (10.0%) 29 (7.4%) 36 (9.2%)
262 Qual Life Res (2009) 18:253–265
123

Discussion and conclusions
The first stage of deriving a preference-based single-index
measure for use in calculating QALYs is to derive a health-
state classification system that is amenable to valuation
using a preference-elicitation technique. This paper has
presented a solution to this problem using Rasch analysis,
alongside other psychometric criteria. The advantage of
this is that the process of item selection becomes more
systematic than methods used previously.
Some of the methods suggested here are dependent on
data availability, for example patient and disease charac-
teristics for DIF analysis and data for additional
psychometric criteria and validation. This information
should be used in the derivation of the reduced health-state
classification, because it will strengthen the selection pro-
cess and increase the validity of the final item selection.
The process described here should be used as a guide in
the first stage of the development of a preference-based
measure and developers of such instruments set their own
criteria based on the aims and objectives of the instrument
they are deriving. It is important to verify the dimension-
ality of non-PBM, although the existing non-PBM may
have predefined dimensions, because results may indicate
additional dimensions or even fewer dimensions than
suggested by the developers. Further, checking the
dimensionality of the instrument is essential under MAUT,
where dimensions should be independent of each other in
the preference-based measure under development. Failure
to establish independence could result in the valuation of
implausible health states, for example feeling downhearted
and low most of the time and happy most of the time.
In addition, consideration may be given to the wording
of the items. It is important to ensure that the wording of
the health states derived from the items are comprehensible
and amenable to valuation. The item wording should be as
closely matched as possible to the wording of the original
instrument and reasonable in length to be conceivably used
in a preference-based measure. Additionally, linking items
into a single dimension should be avoided where possible,
because the item may be valued differently within the full
instrument from how it is valued within the reduced health-
state classification.
Similarly, the methods used to achieve a reduced num-
ber of item levels may vary by developers, with some
developers deciding not to reduce the number of item
levels. We have found that respondents to valuation exer-
cises sometimes struggle in distinguishing between item
levels and it is worthwhile exploring the possibility of
collapsing redundant levels Therefore, step IV is set out as
an exploration step, rather than a definitive step stating that
item levels must be collapsed. However, one of the prob-
lems of using Rasch analysis in the reduction process is
that the initial selection criteria is the spread of item levels,
where the wider the item spread the better, and the chosen
items typically had evenly spread item levels. Therefore,
any attempt to reduce the number of levels may result in
violation of Rasch model assumptions; thus the results
URGE1 Not at all bothered by an uncomfortable urge to urinate2 Bothered by an uncomfortable urge to urinate a little bit or somewhat3 Bothered by an uncomfortable urge to urinate quite a bit4 Bothered by an uncomfortable urge to urinate a great deal5 Bothered by an uncomfortable urge to urinate a very great dealURINE LOSS1 Not at all bothered by urine loss associated with a strong desire to urinate2 Bothered by urine loss associated with a strong desire to urinate a little bit or somewhat3 Bothered by urine loss associated with a strong desire to urinate quite a bit4 Bothered by urine loss associated with a strong desire to urinate a great deal5 Bothered by urine loss associated with a strong desire to urinate a very great dealSLEEP1 Bladder symptoms interfered with your ability to get a good night’s rest none of the time2 Bladder symptoms interfered with your ability to get a good night’s rest a little of the time3 Bladder symptoms interfered with your ability to get a good night’s rest some of the time4 Bladder symptoms interfered with your ability to get a good night’s rest a good bit or most of the time5 Bladder symptoms interfered with your ability to get a good night’s rest all of the timeCOPING1 Bladder symptoms caused you to plan ‘escape routes’ to restrooms in public places none of the time2 Bladder symptoms caused you to plan ‘escape routes’ to restrooms in public places a little of the time3 Bladder symptoms caused you to plan ‘escape routes’ to restrooms in public places some of the time4 Bladder symptoms caused you to plan ‘escape routes’ to restrooms in public places a good bit or most of the time5 Bladder symptoms interfered with your ability to get a good night’s rest all of the timeCONCERN1 Bladder symptoms caused you embarrassment none of the time2 Bladder symptoms caused you embarrassment a little of the time3 Bladder symptoms caused you embarrassment some of the time4 Bladder symptoms caused you embarrassment a good bit or most of the time5 Bladder symptoms caused you embarrassment all of the time
Fig. 3 OAB-5D health-state
classification system
Qual Life Res (2009) 18:253–265 263
123
from Rasch analysis should be considered alongside the
spread of item responses when making a judgement on how
to reduce item levels.
A further consideration when constructing a health-state
classification is the choice of sample. Developers should
ensure that the datasets they use to construct and validate
the health-state classification are representative of the
population they wish to use the final instrument on. Failure
to use a representative sample could result in a measure
that is not sensitive to changes in HRQL for some sub-
groups of the population.
This paper has described the first step in developing a
preference-based measure, illustrated using OAB-5D. The
valuation survey undertaken for OAB-5D on the general
population to evaluate a single index has been presented in
a companion paper [16]. The systematic use of psycho-
metric criteria to aid the construction of health-state
classifications from non-PBM is an important step forward.
Acknowledgments This study is funded by Pfizer Inc. John Brazier
is funded by the Medical Research Council Health Service Research
Collaboration. Zoe Kopp provided advice throughout the study. The
Trial I and Trial II datasets were provided by Pfizer Inc. The usual
disclaimer applies.
References
1. Brazier, J., Ratcliffe, J., Salomon, J. A., & Tsuchiya, A. (2007).
Measuring and valuing health benefits for economic evaluation.
New York: Oxford University Press.
2. Brooks, R. (1996). EQ-5D, the current state of play. HealthPolicy, 37, 53–72. doi:10.1016/0168-8510(96)00822-6.
3. Feeny, D., Furlong, W., Torrance, G. W., et al. (2002). Multiat-
tribute and single-attribute utility functions for the health utilities
index mark 3 system. Medical Care, 40, 113–128. doi:10.1097/
00005650-200202000-00006.
4. Brazier, J., Roberts, J., & Deverill, M. (2002). The estimation of a
preference-based measure of health from the SF-36. Journal ofHealth Economics, 21(2), 271–292. doi:10.1016/S0167-6296(01)
00130-8.
5. Marra, C. A., Woolcott, J. C., Kopec, J. A., et al. (2005). A
comparison of generic, indirect utility measures (the HUI2,
HUI3, SF-6D, and the EQ-5D) and disease-specific instruments
(the RAQoL and the HAQ) in rheumatoid arthritis. Social Scienceand Medicine, 60(7), 1571–1582. doi:10.1016/j.socscimed.2004.
08.034.
6. Brazier, J. E., Deverill, M., Harper, R., Booth, A., et al. (1999). A
review of the use of Health Status measures in economic evalu-
ation. Health Technology Assessment, 3(9), 1–147.
7. Coast, J. (1992). Reprocessing data to form QALYs. BMJ(Clinical Research Ed), 305(6845), 87–90.
8. Fryback, D. G., Dasbach, E. J., Klein, R., et al. (1993). The Bever
Dam health outcomes study: Initial catalogue of health-state
quality factors. Medical Decision Making, 13, 89–102. doi:
10.1177/0272989X9301300202.
9. Nichol, M. B., Sengupta, N., & Globe, D. R. (2001). Evaluating
quality adjusted life-years: Estimation of the Health Utility Index
(HUI2) from the SF-36. Medical Decision Making, 21, 105–112.
doi:10.1177/02729890122062352.
10. Tsuchyia, A., Brazier, J., McColl, E., Parkin, D., et al. (2002).
Deriving preference-based condition-specific instruments: con-
verting AQLQ into EQ-5D indices. Health Economics and
Decision Science Discussion Paper Series No. 02/01, Accessed
from http://www.shef.ac.uk/content/1/c6/01/87/47/DP0201.pdf.
11. Brazier, J., Yang, Y., Tsuchiya, A., et al. (2007). Review ofmethods for mapping between measures of health related qualityof life onto generic preference-based measures: a road tonowhere? Paper Presented at the Health Economics Study Group
Meeting, Brunel University, Uxbridge.
12. Gray, A., Rivero-Arias, O., & Clarke, P. M. (2006). Estimating
the association between SF-12 responses and EQ-5D utility val-
ues by response mapping. Medical Decision Making, 26, 18–29.
doi:10.1177/0272989X05284108.
13. Brazier, J., Usherwood, T., Harper, R., & Thomas, K. (1998).
Deriving a preference-based single index from the UK SF-36
health survey. Journal of Clinical Epidemiology, 51(11), 1115–
1128. doi:10.1016/S0895-4356(98)00103-6.
14. Rasch, G. (1960). Probabilistic models for some intelligence andattainment tests. Chicago: University of Chicago Press. Reprinted
1980.
15. Brazier, J., & Roberts, J. (2005). Estimation of a preference based
index measure of health for the SF-12 and comparison to the SF-
36. Medical Care, 42(9), 851–859. doi:10.1097/01.mlr.0000
135827.18610.0d.
16. Yang, Y., Brazier, J., Tsuchyia, A., Coyne, K., et al. (2009).
Estimating a preference-based single index from the Overactive
Bladder Questionnaire (OAB_q). Value in Health, 12(1).
17. Abrams, P., Cardozo, L., Fall, M., et al. (2002). The standardi-
zation of terminology of lower urinary tract function: Report from
the Standardization Sub-committee of the International Conti-
nence Society. Neurourology and Urodynamics, 21, 167–178. doi:
10.1002/nau.10052.
18. Kobelt, G., Kirchberger, I., & Malone-Lee, J. (1999). Quality-of-
life aspects of the overactive bladder and the effect of treatment
with tolterodine. BJU International, 83(6), 583–590. doi:10.1046/
j.1464-410x.1999.00004.x.
19. Coyne, K. S., Matza, L. S., & Thompson, C. L. (2005). The
responsiveness of the overactive bladder questionnaire (OAB-q).
Quality of Life Research, 14(3), 849–855. doi:10.1007/s11136-
004-0706-1.
20. Coyne, K., Revicki, D., Hunt, T., et al. (2002). Psychometric
validation of an overactive bladder symptom and health-related
quality of life questionnaire: The OAB-q. Quality of LifeResearch, 11(6), 563–574. doi:10.1023/A:1016370925601.
21. Matza, L. S., Thompson, C. L., Krasnow, J., Brewster-Jordan, J.,
Zyczynski, T., & Coyne, K. S. (2005). Test-retest reliability of
four questionnaires for patients with overactive bladder: The
overactive bladder questionnaire (OAB-q), patient perception of
bladder condition (PPBC), urgency questionnaire (UQ), and the
primary OAB symptom questionnaire (POSQ). Neurourology andUrodynamics, 24(3), 215–225. doi:10.1002/nau.20110.
22. Siami, P., Seidman, L. S., & Lama, D. (2002). A multicentre,
prospective, open-label study of tolterodine extended-release
4 mg for overactive bladder: The speed of onset of therapeutic
assessment trial (STAT). Clinical Therapeutics, 24(4), 616–628.
doi:10.1016/S0149-2918(02)85137-2.
23. Duncan, P. W., Bode, R. K., Min Lai, S., & Perera, S. (2003).
Glycine antagonist in neuroprotection Americans investigators.
Rasch analysis of a new stroke-specific outcome scale: The
Stroke Impact Scale. Archives of Physical Medicine and Reha-bilitation, 84(7), 950–963. doi:10.1016/S0003-9993(03)00035-2.
24. Gilworth, G., Chamberlain, M. A., Bhakta, B., Haskard, D., Sil-
man, A., & Tennant, A. (2004). Development of the BD-HRQL:
A quality of life measure specific to Behcet’s disease. TheJournal of Rheumatology, 31(5), 931–937.
264 Qual Life Res (2009) 18:253–265
123

25. Pesudovs, K., Garamendi, E., & Elliott, D. B. (2004). The quality
of life impact of refractive correction (QIRC) questionnaire:
Development and validation. Optometry and Vision Science,81(10), 769–777. doi:10.1097/00006324-200410000-00009.
26. Raczek, A. E., Ware, J. E., Bjorner, J. B., Gandek, B., Haley, S.
M., Aaronson, N. K., et al. (1998). Comparison of Rasch and
summated rating scales constructed from SF-36 physical func-
tioning items in seven countries: Results from the IHRQLA
project. Journal of Clinical Epidemiology, 15(11), 1203–1214.
doi:10.1016/S0895-4356(98)00112-7.
27. White, L. J., & Velozo, C. A. (2002). The use of Rasch mea-
surement to improve the Oswestry classification scheme.
Archives of Physical Medicine and Rehabilitation, 83(6), 822–
831. doi:10.1053/apmr.2002.32685.
28. Valderas, J. M., Alonso, J., & Prieto, L. (2004). Content-based
interpretation aids for health-related quality of life measures in
clinical practice. An example for the visual function index (VF-
14). Quality of Life Research, 13(1), 35–44. doi:10.1023/
B:QURE.0000015298.09085.b0.
29. Bond, T. G., & Fox, C. M. (2007). Applying the Rasch model:Fundamental measurement in the human sciences (2nd ed.). New
Jersey: Lawrence Erlbaum Associates.
30. Feeny, D. (2002). The utility approach to assessing population
health. In C. Murray, J. Salomon, C. Mathers, & A. Lopez (Eds.),
Summary measures of population health: Concepts, ethics.
measurement and applications (pp. 515–528). Geneva: World
Health Organisation.
31. Chatfield, C., & Collins, A. J. (1980). Introduction to multivariateanalysis. Cambridge: Chapman and Hall; University Press.
32. Linacre, J. M. (1999). Investigating rating scale category utility.
Journal of Outcome Measurement, 3(2), 103–122.
33. Kubinger, K. D. (2005). Psychological test calibration using the
Rasch model–some critical suggestions on traditional approaches.
International Journal of Testing, 5(4), 377–394. doi:10.1207/
s15327574ijt0504_3.
34. Nunnally, J. O. (1978). Psychometric theory. New York:
McGraw Hill.
35. Tennant, A., McKenna, S. P., & Hagell, P. (2004). Application of
Rasch analysis in the development and application of quality of
life instruments. Value in Health, 7(Supplement 1), S22–S26. doi:
10.1111/j.1524-4733.2004.7s106.x.
36. Guyatt, G. H., Osoba, D., Wu, A. W., Wyrwich, K. W., Norman,
G. R., et al. (2002). Clinical significance consensus meeting
group. Methods to explain the clinical significance of health
status measures. Mayo Clinic Proceedings, 77(4), 371–383.
37. Rasch Unidimensional Measurement Models (RUMM) 2020 �.
RUMM Laboratory Pty Ltd 1997-2004.
38. SPSS for Windows.Release. 14.0.1. 2005. Chicago: SPSS Inc.
2005.
Qual Life Res (2009) 18:253–265 265
123