the fixed income market in uruguay santiago, chile april 2007 julio de brun (universidad ort...
TRANSCRIPT

The Fixed Income Market in Uruguay
Santiago, ChileApril 2007
Julio de Brun (Universidad ORT Uruguay)
Néstor Gandelman (Universidad ORT Uruguay)
Herman Kamil (International Monetary Fund)
Arturo C. Porzecanski (American University and Columbia University)

Plan of the presentation• Introduction• The Development of the Uruguayan Capital Market
– Private sector– Public sector– Regulatory backdrop
• Supply side: the corporate sector– Financial structure of Uruguayan firms– Survey potential issues
• Demand side: institutional investors– Investors portfolios– Survey institutional investors
• Conclusions

Data sources
• Firms’ financial statements:– Office of the General Auditor (AIN) 2001-2003– Survey to potential corporate issuers -2004
• Supply and demand:– Survey to potential corporate issuers, – Survey to institutional investors,– Survey financial intermediates.

Development of the Capital Market
• The Uruguayan economy stagnated between 50s- 60s. • In the early 70s structural reforms allowed the country
to resume growth. These reforms included:– interest rate caps were non binding anymore
– exchange rate controls eliminated
– financial intermediaries were granted more liberal conditions.
• As a result an offshore banking industry developed, but the capital markets remain almost nonexistent.

Development of the Capital Market
• 1982- Large exchange-rate and banking system crisis. – brought new prudential regulations. Supervision rested on
internal control systems and external auditing.
• 1990’s - New legislation to spur development of the domestic capital market. – Law of Securities Markets (Law Nº 16.749/ 96)– Mutual Funds law (Law Nº 16.774/96) – Pension Funds law (Law Nº 16.713/95) – Law of Trust Funds (Law Nº 17.703/2003)

Development of the Capital Market:Corporate Sector
1994 1995 1996 1997 1998 1999 2000 2001 2002 2003 2004
Number of new issues 7 5 16 16 4 8 3 4 3 1 4
Number of issuing firms 6 5 16 16 4 7 3 4 3 1 2
Value of new issues (USD m) 30.6 42.0 199.0 139.9 19.5 118.5 12.0 38.0 8.4 100.0 106.4Of which: In USD (% of total) 100 100 90 92 100 100 100 100 100 100 95 Indexed to inflation (% of total) 0 0 10 8 0 0 0 0 0 0 5 In local currency (% of total) 0 0 0 0 0 0 0 0 0 0 0
Maturity of new issues (avg., years) 2.7 1.8 3.9 4.7 7.8 3.1 4.0 4.8 4.8 4.0 4.3
Moro-fraud2002-Crisis
Peak

Development of the Capital Market:Public Sector Debt
• In the mid-1970s, a domestic market for government securities began to develop.– The BCU started to issue debt through the
Montevideo Stock Exchange. (BVM)– This practice continued until the early 1990s,
when the BCU began to issue public debt through auctions held in the over-the-counter market.
Development of the Capital Market:Public Sector Debt
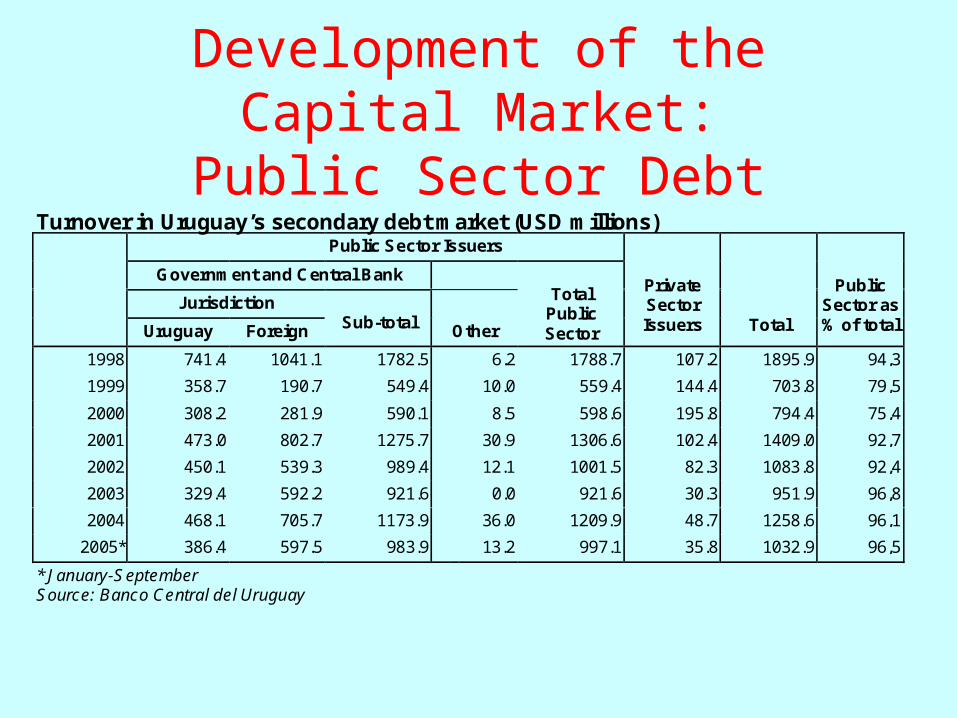
Turnover in Uruguay’s secondary debt market (USD millions)Public Sector Issuers
Government and Central Bank
Jurisdiction
Uruguay Foreign Sub-total Other
TotalPublicSector
PrivateSectorIssuers Total
PublicSector as% of total
1998 741.4 1041.1 1782.5 6.2 1788.7 107.2 1895.9 94,3
1999 358.7 190.7 549.4 10.0 559.4 144.4 703.8 79,5
2000 308.2 281.9 590.1 8.5 598.6 195.8 794.4 75,4
2001 473.0 802.7 1275.7 30.9 1306.6 102.4 1409.0 92,7
2002 450.1 539.3 989.4 12.1 1001.5 82.3 1083.8 92,4
2003 329.4 592.2 921.6 0.0 921.6 30.3 951.9 96,8
2004 468.1 705.7 1173.9 36.0 1209.9 48.7 1258.6 96,1
2005* 386.4 597.5 983.9 13.2 997.1 35.8 1032.9 96,5
* January-SeptemberSource: Banco Central del Uruguay
Development of the Capital Market:Public Sector Debt
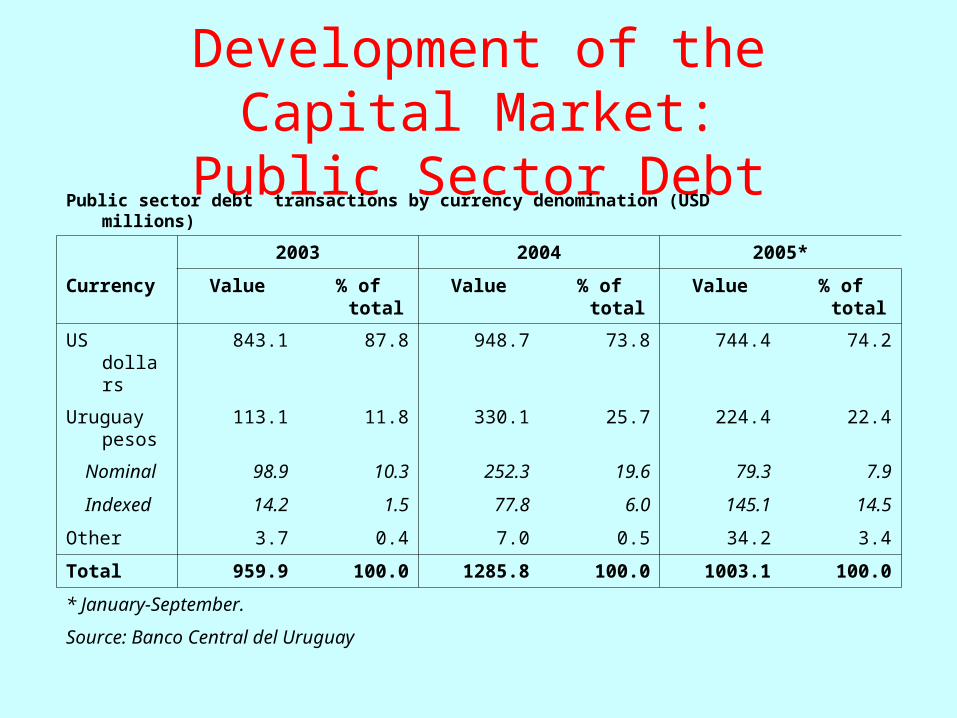
Public sector debt transactions by currency denomination (USD millions)
2003 2004 2005*
Currency Value % of total Value % of total Value % of total
US dollars 843.1 87.8 948.7 73.8 744.4 74.2
Uruguay pesos
113.1 11.8 330.1 25.7 224.4 22.4
Nominal 98.9 10.3 252.3 19.6 79.3 7.9
Indexed 14.2 1.5 77.8 6.0 145.1 14.5
Other 3.7 0.4 7.0 0.5 34.2 3.4
Total 959.9 100.0 1285.8 100.0 1003.1 100.0
* January-September.
Source: Banco Central del Uruguay

Development of the Capital Market:Public Sector Debt
• A liquid market of public debt generates externalities:
– Positive: they set a benchmark for private-sector debt issues, useful for pricing.
– Negative: crowding-out effects.

Public Sector Debt• The potential issuers surveyed seem to believe both effects to be small.
– 15% believe that the existence of a liquid market for sovereign debt may facilitate their own issuance.
– 22% perceived the government as a competitor in the search for financial resources.
• The investors survey pointed against crowding out effects. – Sovereign debt and corporate bonds are not perceived as substitutes in
their portfolio. – They also disagree with the statement:
• “A large stock of government bonds is important for the development of the corporate bond market”

Firms financial structure
Data sources:
• Office of the General Auditor (AIN) – Pre crisis 2001– Post crisis 2003
• Survey to potential corporate issuers 2004.

Firms financial structure• Banks have been by far the principal source of
financing.– 60% of corporate financing needs were met through
borrowing and 40% from retained earnings. The external funds sources are banks and suppliers’ credit.
– access to a local bond market has never been a realistic option for most firms, except for the few years during the mid-1990s when the Obligaciones Negociables,ONs became popular.
– However, the market dried up after 1998 following the filing for bankruptcy of one of the issuers – the poultry firm Moro.

Firms financial structure
• As a consequences of this sources of funding and the Uruguayan past instability history, Uruguayan firms liabilities are highly dollarized (severe currency mismatches) and have very short term maturity.
• Those two characteristics (high dollarization and short term debt maturitiy) are special remarkable in comparison with other LA countries.

Firms financial structureTerm and currency mismatches (median)
Term mismatches Currency mismatches
Pre-crisis
Post-crisis
Pre-crisis
Post-crisis
2001 2003 2001 2003
Total % of short term assets 0.67 0.63 % of assets in f.c. 0.19 0.17
% of short term liabilities 0.97 0.97 % of liabilities in f.c. 0.74 0.64
Term mismatch1 1.35 1.36 Currency mismatch 0.67 0.65
Term mismatch2 -0.16 -0.16
Non- % of short term assets 0.72 0.68 % of assets in f.c. 0.19 0.19
publicly % of short term liabilities 0.97 0.97 % of liabilities in f.c. 0.74 0.63
traded Term mismatch1 1.42 1.45 Currency mismatch 0.67 0.70
Term mismatch2 -0.13 -0.14
Publicly % of short term assets 0.47 0.31 % of assets in f.c. 0.27 0.06
traded % of short term liabilities 0.89 0.84 % of liabilities in f.c. 0.84 0.85
Term mismatch1 1.02 0.94 Currency mismatch 0.50 0.41
Term mismatch2 -0.41 -0.49
Note: % of short term assets = Short term assets/ total assets; % of Short term liabilities = Short term liabilities/ total liabilities; Term mismatch1 = Short term assets / Short term liabilities; Term mismatch2 = % of short term assets - % of short term liabilities; % of assets in f.c. = Assets in f.c. / total assets; % of liabilities in f.c. = Liabilities in f.c. / total liabilities; Currency mismatch= Assets in f.c. / Liabilities in f.c.; f.c.= foreign currency.

Firms financial structure
Comparison with other LA countries

Firms financial structure• Three stylized facts
– the highest level of financial dollarization in the corporate sector;
– the highest within-country correlation between firm-
specific dollarization ratios and debt maturity profiles
– the shortest country-averaged debt maturities.

Firms financial structure
(in %)
Total Assets
5% 6 11% 1% 2%10% 11 11% 2% 4%20% 24 32% 12% 11%40% 45 50% 15% 17%60% 74 67% 21% 33%80% 90 71% 26% 38%100% 109 72% 29% 43%
5% 4% 4% 2%10% 9% 11% 3%20% 17% 20% 7%40% 28% 33% 12%60% 45% 54% 36%80% 51% 61% 41%100% 60% 71% 47%
Number of Firms Under Financial
Distress
SHARE OF ECONOMY-WIDE
SHARE OF ECONOMY-WIDE
(Credit Risk Effect on Banking System)
If the Exchange Rate Were to Devalue:
If the Exchange Rate Were to Devalue:
Short Term Supplier Liabilities (Effect on Inter-Firm Chain of Payments)
Employment (Effect
on Unemployment)
Total Financial Liabilities Total Dollar Financial Liabilities
Sales (Growth and
Tax Revenue Effects)
Systemic effects of a sudden devaluation

Supply side:
Firms’ survey

Supply side: Firms’ survey• The INE conducts an annual survey of economic activity.
– Our survey includes all firms regularly surveyed by the INE with more than 50 employees.
• The rate of response was 100%.• We ended up with 463 firms, covering:
– D-Manufacturing– G-Commerce– H-Hotels and restaurants– I-Transportation services – K-Real estate and machine rentals– M-Educational services– N-Health services.

Supply side: Firms’ surveyList order effects
• In order to avoid the effect of the list order in the evaluation procedure, we generated two types of questionnaires, A and B. – The first item in Questionnaire A became the last one in
Questionnaire B; the second item in Questionnaire A became the next-to-last one in Questionnaire B; and so on and so forth.
– Questionnaires A and B were assigned randomly to firms.
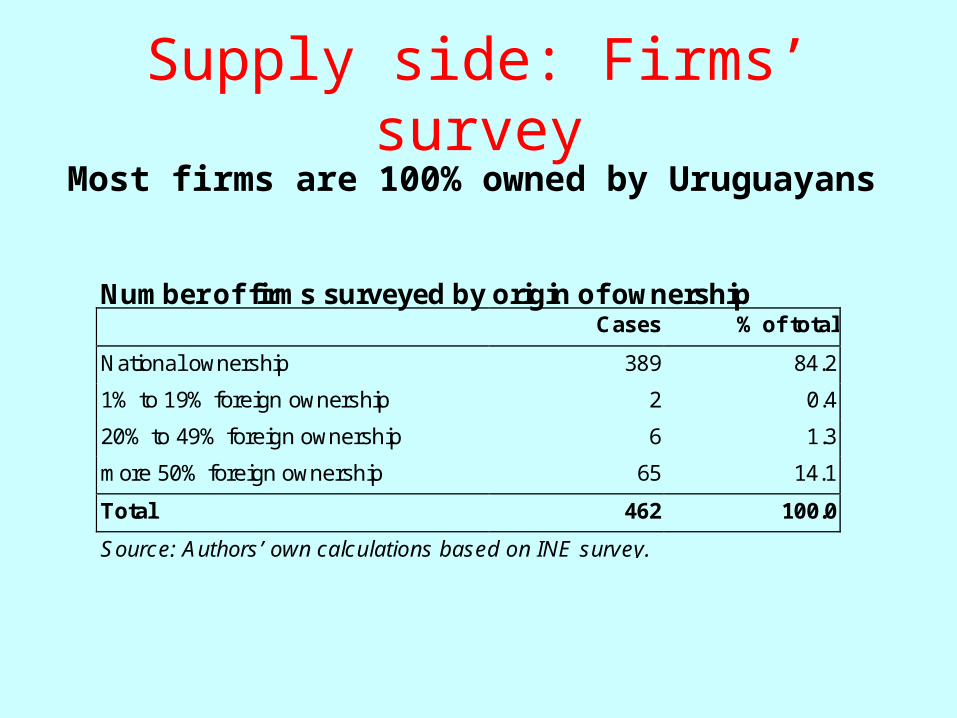
Supply side: Firms’ surveyMost firms are 100% owned by Uruguayans
Number of firms surveyed by origin of ownershipCases % of total
National ownership 389 84.2
1% to 19% foreign ownership 2 0.4
20% to 49% foreign ownership 6 1.3
more 50% foreign ownership 65 14.1
Total 462 100.0
Source: Authors’ own calculations based on INE survey.

Supply side: Firms’ surveyMost firms are closed corporations
Ownership structure of firms surveyedCases % of total
1.Not listed 449 97.6
2.Listed domestically 9 2.0
3. Listed abroad/ADR 2 0.4
Total 460 100.0
Source: Authors’ own calculations based on INE survey.

Supply side: Firms’ surveyLack of knowledge about financial instruments is pervasive despite
the branch of economic activity and origin of firm capital
Knowledge of financial instruments among firms surveyedBonds (ON) Trust funds
Cases % of total Cases % of total
1.Enough 125 27 105 23
2.Something 184 40 197 43
3.Nothing 154 33 161 35
Total 463 100 463 100
Source: Authors’ own calculations based on INE survey.

Supply side: Firms’ surveyThe capital market is not a source of financing for
Uruguayan firms
Issuance of bonds and trust funds by firms surveyed
Currently outstandingPast issuance
(2002-2005)Future plans(2006-2007)
Bonds Trust Fund Bonds Trust Fund Bonds Trust Fund
Yes 10 21 7 23 7 10
No 453 441 456 438 429 419
Uncertain 27 34
No data 1 2
Total 463 463 463 463 463 463
Source: Author’s own calculations based on INE survey

Supply side: Firms’ survey
Bank financing
• Mostly from local banks
• Main problems:– 1. High cost of peso-
denominated loans– 2. Collateral requirements– 3. Speed of approval and
disbursement.
Problems when borrowing from banks (% of total)
Banks located
In Uruguay Outside Uruguay
Collateral requirement 45,4 32,1
Bank monitoring 15,5 12,0
Perception of no lending 44,8 19,1
Slow approval process 40,2 25,1
High interest in pesos 54,8 18,4
Credit only in USD 19,5 18,5
Source: Authors’ own calculations based on INE survey.

Supply side: Firms’ survey
Bond financing
• Exclusively domestic bonds
• Main problems:– 1. Small size of the market
(Uruguay not abroad)– 2. Absence of market for
high yield bonds (“junk bonds”)
– 3. Credit rating agencies’ fees
Problems when issuing bonds (% of total)
Bonds issued
In Uruguay Outside Uruguay
Underwriters' fees 39,7 41,2
Credit rating agencies' fees 49,6 46,2
Disclosure requirements 47,0 23,8
Minimum issue requirements 38,7 39,8
Small size of the market 61,9 32,5
Absence of “junk bond” market
55,3 52,4
Other regulatory requirements 29,6 30,0
Source: Authors’ own calculations based on INE survey.

Supply side: Firms’ surveyBond financing - Willingness to disclosure information
• Most firms willing to disclosure information in order to be rated by a credit agency as a preliminary stem to an eventual issuance of bonds.
Willingness to disclose information by knowledge of bond market (% of total)Enough Something Nothing Total
Yes, for sure 51 31 21 33
Yes, probably 26 35 30 31
No, probably 19 26 29 25
No, for sure 5 8 20 11
Total 100 100 100 100
Source: Authors’ own calculations based on INE survey.

Supply side: Firms’ survey
Financing in Uruguay• Banks better with respect to:
– speed of access to required financing
– information requirements– minimum amount require
for loans-issuances.
• Bonds better with respect to:– long term funds– Guarantee requirements
(but still a considerable problem)
Problems to obtain financing in Uruguay (% of total)
Banks Bonds
Speed of access to required financing
38,3 46,3
Maturity of financing 43,8 28,5
Interest rate of financing 55,7 51,9
Minimum amount required for loans or issuance
15,5 43,1
Guarantee requirements 47,5 39,6
Information requirements 17,1 22,8
Currency denomination 23,0 23,9
Source: Authors’ own calculations based on INE survey

Supply side: Firms’ surveyRanking of financial alternatives
• Supplier's credit is by far the preferred alternative in almost all dimensions• Uruguayan banks are preferred with respect to long term lending and “close”to supplier's credit with
respect to size of potential market.
Best financing alternatives according to several criteria (% of total)Uruguay Outside Uruguay
Banks Bonds Banks Bonds Suppliers’credit
Interest rate cost 12 2 3 15 68
Local-currency lending 29 1 0 14 56
Indexation alternatives 29 6 1 11 53
Long-term lending 42 20 12 10 15
Non-interest rate costs 9 2 2 14 72
Tax treatment 19 7 2 14 58
Possibility of renegotiation 9 1 1 21 68
Costs related to disclosure requirements 8 1 1 13 77
Size of potential market relative to firm’s financing needs 31 6 9 16 38
Source: Authors’ own calculations based on INE survey.

Supply side: Cost of issuance
Costs of a “plain vanilla” domestic bond issue (in USD and %)
Face value issued (000 USD)
3000 10000 20000 50000
Underwriting fees (1%) 30000 100000 200000 500000
Arranger fees (0.75%) 22500 75000 150000 375000
Distribution costs 45000 150000 300000 500000
Legal fees 5000 8000 8000 10000
Stock exchange registration (*)
6000 15000 20000 40000
Rating agency 10000 12000 12000 15000
Total costs 118500 360000 690000 1440000
% of issue size 3,95% 3,60% 3,45% 2,88%
Source: Authors’ own calculations..
Costs of Domestic Bond Issue in several Latin American countries
(% of issue)
Faced value issued (000 USD)
10000 20000 50000
Brazil n/a 4.20% 2.78%
Chile 4.76% 4.20% 2.85%
Mexico n/a 1.99% 1.58%
Uru 3.60% 3.45% 2.88%
Source: Zervos (2004) and authors’ own calculations.

Demand side: institutional investors• The principal institutional investors are the pension funds:
– State owned • República AFAP (state owned)
– Private banks owned• Afinidad AFAP• Integración AFAP • Unión Capital AFAP.
• Other institutional investors include:– Banco de Seguros del Estado– Caja Profesional– Caja Bancaria

Demand side: Pension funds•Highly regulated:
–Jurisdictions:Not allowed to make any investments outside Uruguay;
–Currencies:Investments in f.c. below 60% of portfolio;
–Government exposure:Share Central Government securities below 60% assets;
–Exposure to banks: Certificates of deposits and cannot exceed 30% of assets.
–Exposure to firms (equity and bonds):•Private sector securities constrained by a 25% limit. •Securities issued by any particular firm must be less than 3% of total assets, and less than 50% of the amount outstanding of each security.
–Exposure to asset-backed securities: Total ABS must below 20% of assets and ABS of every single issues must be below 3% assets.
–Exposure to beneficiaries of the pension system: Below15% assets.
–Aggregate exposure to the non-financial private sector: •The sum of the last 3 exposures must be below 40% assets.

Demand side: Pension fundsCurrency composition of Uruguayan pensionfund portfolios (as of October 31, 2005)
% of total
Local currency 55.7
Pesos 10.5
Central government 5.3
Central Bank and BHU 1.8
Time deposits and CDs 1.5
Corporate bonds, stocks 0.2
Loans to affiliates 0.8
Cash 1.0
Indexed 45.2
Central government 22.0
Central Bank and BHU 21.9
Time deposits and CDs 0.9
Corporate bonds, stocks 0.3
Loans to affiliates 0.1
Foreign currency 44.3
Central government 31.7
Central Bank and BHU 1.0
Time deposits and CDs 5.2
Corporate bonds, stocks 0.6
CRIs, financial trusts 1.9
Cash 4.0
Source: Banco Central del Uruguay

Demand side: Pension funds
Portfolios of Uruguayan pension funds (as October 31, 2005)
Total República Afinidad UniónCapital
Integración
Value of the portfolio (USD millions) 2132.3 1200.6 382,1 369.5 180.1
Asset composition (% of total portfolio) 100.0 100.0% 100.0 100.0 100.0
Central government 59.0 59.3 59.1 59.9 55.2
BCU and BHU 24.7 23.0 27.1 27.5 25.5
Time deposits and CDs 7.6 8.5 7.0 6.7 4.3
Corporate bonds and stocks 1.1 1.5 0.3 1.1 0.9
CRIs, financial trusts 1.8 1.8 1.8 1.8 1.7
Loans to affiliates 0.9 1.1 0.6 0.6 0.6
Cash 4.9 4.9 4.1 2.5 11.7
Source: Banco Central del Uruguay

Demand side: Pension funds• Legal and regulatory constraints
– are not binding with respect to investing in corporate bonds
– binding with respect to investing abroad.
• Why they do not invest more in corporate bonds?– Perception of high risk (financial fragility: currency
mismatches, high indebtedness).
– Limited legal recourses in event of default.

Demand side: Pension funds• Not a problem:
– Availability of information
– Credit rating
• Usual strategy: “buy and hold”. Therefore:– Absence of a liquid secondary market not perceived as a
problem.
– But low capitalization is a problem (they do not have opportunities to invest).
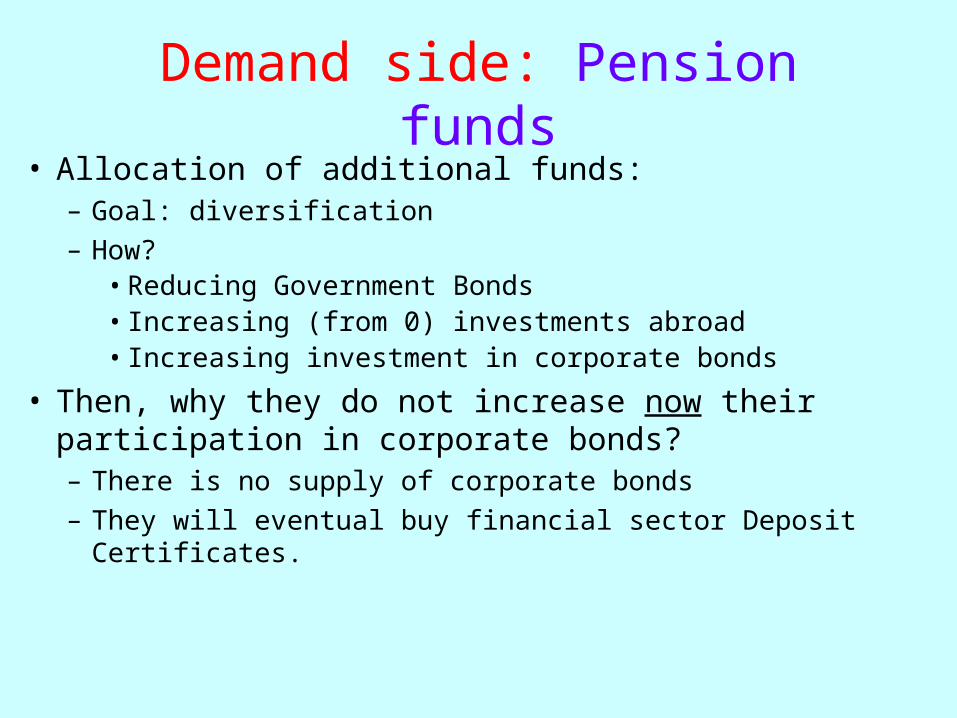
Demand side: Pension funds• Allocation of additional funds:
– Goal: diversification
– How?• Reducing Government Bonds• Increasing (from 0) investments abroad• Increasing investment in corporate bonds
• Then, why they do not increase now their participation in corporate bonds?– There is no supply of corporate bonds
– They will eventual buy financial sector Deposit Certificates.

Demand side: other institutional investors
• Also stress the high risk involved in corporate bonds.
• Three main differences with Pension funds.They perceive as problems:– Information availability
– Quality of credit rating
– Low liquidity of secondary market
Demand side: financial intermediates
• Mostly the same answers as before.
• The only noticeable difference is the disparity of perceptions with respect to quality of credit ratings.

Conclusions• The macroeconomic instability of the last decades is
responsible for the high dollarization of the Uruguayan economy and the absence of peso denominated financial instruments. – The government is pushing a de-dollarization agenda, and
institutional investors have played an important role in the development of a market for inflation-adjusted instruments.
– Households and firms are somewhat more reluctant to change long-term practices in personal portfolio management
– So it is not clear that currency mismatches will soon be reduced.

Conclusions• Uruguay has been the most dollarized country in Latin
America and yet also the country where corporate debt has had the shortest average maturity. – This situation has generated currency and maturity mismatches that
have exposed the country’s firms to dangerous currency and refinancing risks.
– This is perceived as the major problem by institutional investors to increase their participation in the corporate bonds market.
– Our stress test to a sudden devaluation confirms the persistence of system risk.

Conclusions• Although there may be some regulatory deficiencies, the
main determinants of this condition of limited access are not of a regulatory nature.
– The major perceived shortcomings by institutional investors are not inadequate information to assess the risks involved, but rather the vulnerability of Uruguayan firms to macroeconomic shocks and difficulties to enforce creditor rights in the event of defaults.

Conclusions• Moreover, potential issuers declare their willingness to
disclosure the requested information in order to be rated as a first step to eventual debt issuance.
• Beyond this declared willingness, there is surprisingly little knowledge among corporate managers about financial alternatives to borrowing from banks and suppliers.

Conclusions• Despite the fact that transparency is not perceived as a
problem by investors and the apparent readiness of many
firms to disclose information.
– The usual agency problems associated with long-term debt
have promoted opportunistic behavior by stockholders that in
the end have resulted in default episodes. These episodes
generated important negative externalities that affected and
still linger in the domestic capital market.

Conclusions• Finally,
– A deepening of the fixed-income market could help to extend corporate debt maturities, helping to reduce firms’ mismatches and thereby fostering investment in fixed assets and economic growth.
– We remain pessimistic about the future development of the corporate bond market. Most firms are likely to remain depending on short-term banking credit.