the flattening of the phillips curve in the philippines ... · looking behavior in explaining...
TRANSCRIPT

Price-setting Behaviour and Inflation Dynamics inSEACEN Member Economies and their Implications for Inflation 203
Chapter 8
THE FLATTENING OF THEPHILLIPS CURVE IN THE PHILIPPINES:
THE ROLE OF THE GLOBAL OUTPUT GAP1
ByJan Christopher G. Ocampo2 and Vanessa T. Españo3
1. Introduction
In forecasting inflation, policymakers rely on a suite of models, including the Phillips curve in an attempt to capture as accurately as possible the relationship between variables driving the inflation process and inflation itself. Because of the inherent uncertainty involved in inflation forecasting, the ability to come up with a reliable inflation forecast is crucial as it gives policymakers a better handle in deciding the appropriate stance of monetary policy and thus contribute to macroeconomic stability, especially during periods of unanticipated shocks. There has been a number of criticisms since the Phillips curve framework of linking nominal and real activity was introduced six decades ago. The most prominent one is that fluctuations in economic activity no longer generate the same inflationary pressures in the short run, compared to in the past. This phenomenon of the flattening of the Phillips curve, first observed in advanced economies (Roberts, 2006; Beaudry and Doyle, 2000; Iakova, 2007), and more recently in emerging economies (Dany-Knedlik and Garcia, 2018; Szrafranek, 2017) have been attributed to several factors, including credible monetary policy and globalization forces (Borio and Filardo, 2007).
The flattening of the Phillips curve has important policy implications. Mishkin (2007) notes that on the one hand, an economy facing overheating problems will no longer necessarily experience a corresponding large increase in inflation. On the other hand, a decline in the sensitivity of inflation to excess demand conditions also means that it would now be costlier, i.e., it would take a larger reduction in output, to bring inflation back to the desired target.
As is the practice in any inflation-targeting (IT) central bank, the Bangko Sentral ng Pilipinas’ (BSP’s) main consideration in setting the monetary policy stance is largely based on domestic considerations. Thus, if global factors were seen to become increasingly important in influencing the domestic inflation process, this could have important policy implications. The objective of this study is to examine whether globalization now plays a significant role in the domestic inflation process and how this might impact the conduct of monetary policy in the Philippines. There have been earlier studies using the Phillips curve framework in explaining the inflation dynamics for the Philippines. However, these studies have a few limitations, including the choice of variables which might not more fully capture the role of globalization (e.g., exchange rate and import price inflation) and the use of lags of inflation as a measure of inflation expectations which might not
1. The views expressed in this study are solely the responsibility of the authors and do not necessarily represent those of the BSP.
2. Bank Officer V, Department of Economic Research, BSP. 3. Bank Officer V, Department of Economic Research, BSP.

Price-setting Behaviour and Inflation Dynamics inSEACEN Member Economies and their Implications for Inflation
The SEACEN CentreThe Flattening of the Phillips Curve in the Philippines:The Role of the Global Output Gap
204
more accurately depict the forward-looking behavior of agents. The main contribution of the study is to extend the standard reduced-form Phillips curve model through the use of a trade-weighted global output gap (in addition to the nominal exchange rate and import price inflation) to proxy for the impact of globalization on the domestic inflation process, with the sample period divided into two sub-sample periods, namely the pre-IT era (1990Q1-2001Q4) and IT period (2002-2018Q2).
There are several channels by which globalization could affect the domestic inflation-output tradeoff in the short run, including via increased trade integration of international goods, labor, and capital or financial markets (Razin and Binyamini, 2007). This paper focuses only on the international trade in goods channel. In addition, to reflect the forward-looking behavior of agents since the BSP formally adopted an inflation targeting (IT) framework in 2002, this study employs survey-based measure of inflation expectations. Empirical evidence (Lyziak, 2013; Ang et al., 2007) indicates its superior performance over using expectations derived from models or those implied from financial instruments in explaining the behavior of inflation.
The rest of the paper is organized as follows. Section 2 provides a discussion on the merits of the Phillips curve as a framework for modelling inflation, as well as related studies on Phillips curve for the Philippines, and implications of increasing roles of inflation expectations and globalization in the conduct of monetary policy. Section 3 presents evidence of a flattening of the Phillips curve in the Philippines using different measures of inflation, while section 4 outlines the empirical strategy involved in determining the factors behind the flattening phenomenon, including by using domestic and global variables. Section 5 reports estimation results and analysis arising from the estimation procedure, and finally section 6 provides policy implications.
2. Related Studies
2.1 PhillipsCurveFrameworkofModelingInflation
Six decades have already passed since the Phillips curve was first introduced as a framework for modeling inflation, and yet no universal framework has emerged. Instead, several variants of the model have arisen, reflecting the need to modify the perceived shortcomings of earlier versions. For example, the specification of a simple reduced-form Phillips curve has inflation as a function of past inflation, a measure of economic slack, and other control variables such as supply shocks. However, this specification does not have a variable which explicitly accounts for the forward-looking behavior of agents in the economy (although the lagged inflation is sometimes used as a proxy). Meanwhile, a new Keynesian Phillips curve (NKPC), which is purely forward-looking has inflation being dependent on expected future inflation and a measure of excess demand conditions. A significant criticism of the NKPC, however, is its failure to capture the observed inertial component of inflation. To address this, a hybrid NKPC is introduced which incorporates the role of backward and forward-looking components of inflation, as well as the role of external factors. Thus, for an open emerging economy, a hybrid NKPC could take the following specification:
where denotes inflation; is expected inflation; is domestic output gap; is foreign output gap; is nominal effective exchange rate; is import price inflation, is a lag operator; and is the error term.

205 The SEACEN Centre The Flattening of the Phillips Curve in the Philippines:
The Role of the Global Output Gap
Price-setting Behaviour and Inflation Dynamics inSEACEN Member Economies and their Implications for Inflation
2.2 Phillips Curve Studies for the Philippines
An examination of earlier studies on the behavior of inflation in the Philippines using the Phillips curve yields mixed results. Dany-Knedlik and Garcia (2018), using quarterly data from 1995-2016 and a hybrid New Keynesian Phillips curve with time-varying parameters assess the changes in the contribution of long-term expectations, economic slack, oil price inflation, and non-oil import price inflation on inflation dynamics across the ASEAN-5 economies (e.g., Indonesia, Malaysia, the Philippines, Singapore, and Thailand). The study reports a greater role of forward-looking behavior in explaining headline inflation for the Philippines. The study also finds a significant steepening of the Phillips curve, and explains this increased sensitivity of domestic inflation to excess demand conditions to the reduced fluctuations in the output gap since the global financial crisis. At the same time, the study indicates a limited impact of oil price inflation to headline inflation, which is rather counterintuitive given that the Philippines is largely an oil-importing economy, importing nearly 100% of its total oil requirements abroad.
Meanwhile, Cacnio (2013), using quarterly data from 1988-2009 and also a hybrid New Keynesian Phillips curve finds evidence of a flattening of the Phillips curve and attributes this to the adoption of inflation targeting and increased trade openness. Her results are robust even with the introduction of globalization factors (e.g., exchange rate and the price of imported goods relative to wages), in contrast to the results of Dua (2006) which show the opposite. Nevertheless, a significant limitation of Cacnio’s (2013) study pertains to the measure of inflation expectations used, which is proxied instead by lagged inflation. Empirical evidence (Ang et al., 2007; Lyziak, 2013) indicates that the use of survey-based measures of inflation expectations has a relatively superior performance over expectations derived from models or those implied from financial instruments in explaining the behavior of inflation. Meanwhile, Bagsic (2004) and Dumlao (2005) present evidence of a short-run trade-off between inflation and unemployment.
2.3 IncreasingRoleofInflationExpectationsinMonetaryPolicyFormulation
Since the Bangko Sentral ng Pilipinas transitioned to an inflation targeting framework in 2002, Guinigundo (2016) reports a growing role for inflation expectations in explaining the inflation dynamics in the Philippines, as the public have now become more forward-looking in their decision-making process. The ability of a central bank to anchor the public’s inflation expectations around the inflation target becomes especially critical amid an environment characterized by elevated inflation and a greater degree of uncertainty. With a lower probability of inflation expectations becoming disanchored, or there being less deviation of inflation expectations from the inflation target, this implies that during unanticipated shocks, monetary policy need not react aggressively to bring the economy back to normal.
Thus, Calabria (2016) notes that the increasing role of behavioral economics now offers additional support to the use of a Phillips curve framework for analyzing inflation dynamics. As an example, he observes the presence of asymmetry between how individuals weigh potential losses and potential gains – that is, people generally tend to assign a greater weight on potential losses than potential gains. In a monetary policy setting, this kind of loss aversion may result in biased policymaking in the sense that policymakers may be compelled to adhere to inflation targets known by the public even when deviations may sometimes be acceptable or even optimal, as in the case of supply-side shocks wherein central banks, in principle, allow initial price increases to “pass through”, and only react when second-round effects emerge that could threaten the inflation

Price-setting Behaviour and Inflation Dynamics inSEACEN Member Economies and their Implications for Inflation
The SEACEN CentreThe Flattening of the Phillips Curve in the Philippines:The Role of the Global Output Gap
206
objective. However, this kind of loss aversion has not translated in biased policymaking in the case of the BSP, as in line with international best practices and economic theory, it has allowed inflation to deviate slightly from the target when price movements are deemed to be emanating mainly from supply-side shocks, such as the rising cost of crude oil and elevated commodity prices in the global market, which are best addressed via non-monetary government measures.
In the case of monetary policy decision-making, however, what is crucial is that when faced with a potential breach to the inflation target, policymakers may need to respond more aggressively to prevent inflation expectations from becoming dislodged.
2.4 ImpactofGlobalFactorsonDomesticInflation
From the point of view of policymakers, one of the most important implications of globalization is that it could complicate the conduct and effectiveness of monetary policy by dampening the role of or relative importance of domestic variables in the inflation process. As an example, Helbling et al.. (2006) observe that, in the mid-2000s, even against a backdrop of rising global commodity prices, a broad-based growth, and a generally accommodative monetary policy stance in major advanced economies, there has been an observed downtrend and relative stability in inflation across countries, leading some analysts to posit the argument that global factors have now become much more important than domestic factors in explaining the evolution of inflation. A situation of increasing dependence of domestic inflation on global conditions could potentially result in an undermining of a central bank’s ability to control the behavior of domestic inflation, by compelling it to give up part of its independence in the conduct of monetary policy in favor of tracking other national policies (Calza, 2008).
Several channels have been put forward to explain how globalization could influence the variables driving the domestic inflation process. These include increasing trade integration of international goods, labor, and capital or financial markets (Razin and Binyamini, 2007). This paper focuses only on the international trade in goods channel. Greater trade integration with the rest of the world suggests that increases in domestic demand could be addressed via a rise in imports, instead of merely relying on domestic production (Kuttner and Robinson, 2010). An important implication of this is that increases in domestic economic slack will now have a smaller impact on domestic marginal costs, and consequently, produce limited inflationary pressures. At the same time, greater world demand for local products could generate a corresponding larger impact on the price-setting behavior of domestic firms, by raising their flexibility to adjust prices when demand rises, thereby leading to a steepening of the Phillips curve (Ball, 2006). However, Iakova (2007) notes that greater external competitive pressures could also diminish the pricing authority of local businesses, limiting their ability to adjust prices when demand rises, thus contributing to the decline in the sensitivity of inflation to domestic slack, or a flattening of the Phillips curve.
Meanwhile, other studies point to the limited role of global factors. Calza (2008) provides evidence that foreign output gaps do not feature significantly in the euro area’s inflation dynamics and concludes that while external factors certainly merit closer monitoring, reacting to those factors do not appear to be warranted. Likewise, Roberts (2006) reports that shifts in monetary policy are almost entirely responsible for modifying the relationship between inflation and unemployment since the early 1980s. Aside from showing that there is now a reduced sensitivity of the change in inflation to the unemployment rate, he also finds that a significant part of the reduction in the volatility of the output gap can be explained by changes in monetary policy.

207 The SEACEN Centre The Flattening of the Phillips Curve in the Philippines:
The Role of the Global Output Gap
Price-setting Behaviour and Inflation Dynamics inSEACEN Member Economies and their Implications for Inflation
Nevertheless, while conceding that monetary policy does, to a great extent, explain the observed downtrend in inflation, Borio and Filardo (2007) provide evidence that inclusion of a proxy for global excess demand conditions, aside from other measures of external factors that could influence the domestic inflation process such as import and oil prices, resulted in a significant improvement in the ability of inflation models including the Phillips curve to predict inflation. In addition, they find the role of globalization factors as having grown over time and appeared to have contributed to the declining sensitivity of inflation to domestic economic slack.
3. Data
The coverage of the study is divided into two sub-sample periods, namely the pre-IT era (1990Q1-2001Q4) and IT period (2002Q1-2018Q2). Figure 1 provides a description of the variables.
Figure 1Description of Data
Year-on-year headline, core, Gross Domestic Product (GDP) deflator, Personal Consumption Expenditure(PCE) deflator
Domestic output gap
Foreign/global output gap
Year-on-year change in nominal effective exchange rate (NEER)
Import price inflation
Private sector one-year inflation expectations (from the Consensus Economics Survey); BSP one-year ahead inflation forecasts
3.1 HeadlineInflationandDomesticOutputGap
Figure 2 plots the evolution of the different measures of inflation (e.g., headline, core, GDP deflator, and PCE deflator) for the Philippines over the full sample period. Relative to the pre-IT period (pre-2002), headline inflation during the IT era (2002-present) has been generally low and stable. The BSP was able to achieve its inflation targets for six consecutive years from 2009-2014 and in 2017. At the same time, economic growth has been robust, with GDP growing annually by above 6 percent since 2012.

Price-setting Behaviour and Inflation Dynamics inSEACEN Member Economies and their Implications for Inflation
The SEACEN CentreThe Flattening of the Phillips Curve in the Philippines:The Role of the Global Output Gap
208
Figure 2InflationMeasures
Figure 3 illustrates how the domestic output gap has behaved over the last three decades. With the exception of crisis periods, most notably the 1997 Asian Financial Crisis and the 2008 Global Financial Crisis, domestic output gap has remained fairly constant at near zero.
Figure 3Domestic Output Gap
-.12
-.08
-.04
.00
.04
.08
1985 1990 1995 2000 2005 2010 2015
Output Gap (H-P Filter)Output Gap (One-Sided H-P Filter)
-.04
.00
.04
.08
.12
.16
.20
88 90 92 94 96 98 00 02 04 06 08 10 12 14 16 18
Headline Inflation Core InflationGDP Deflator Inflation PCE Deflator Inflation
209 The SEACEN Centre The Flattening of the Phillips Curve in the Philippines:
The Role of the Global Output Gap
Price-setting Behaviour and Inflation Dynamics inSEACEN Member Economies and their Implications for Inflation
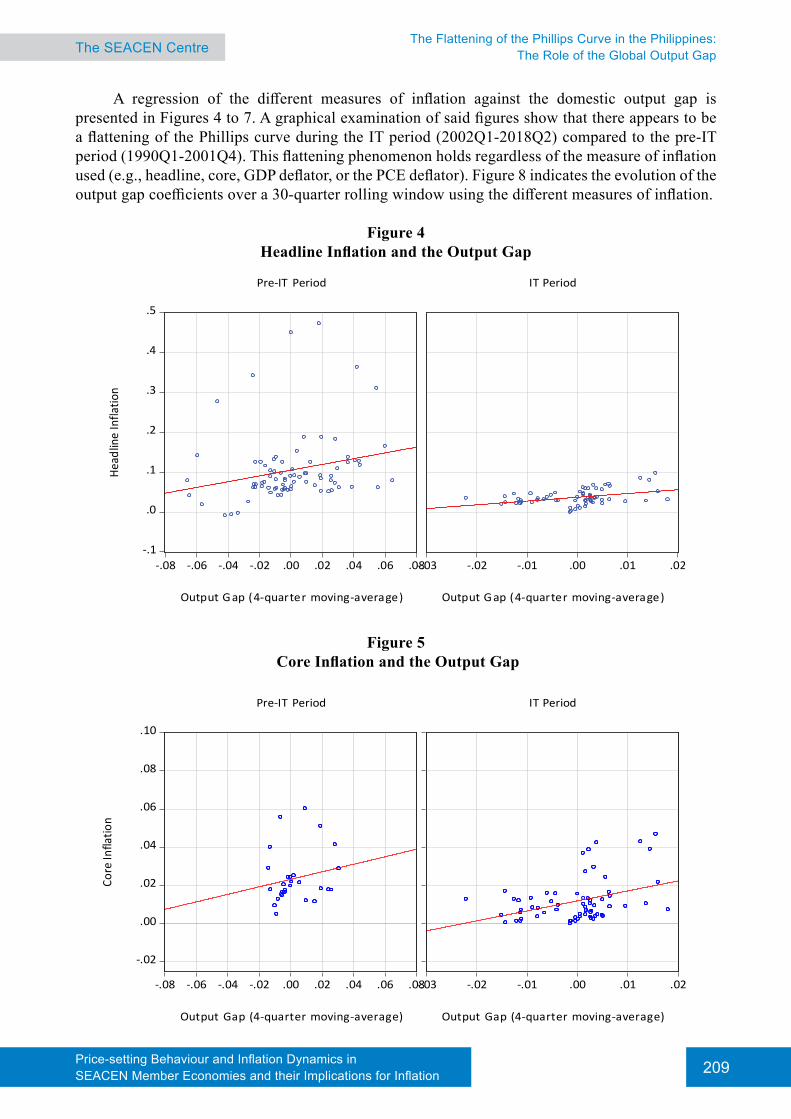
A regression of the different measures of inflation against the domestic output gap is presented in Figures 4 to 7. A graphical examination of said figures show that there appears to be a flattening of the Phillips curve during the IT period (2002Q1-2018Q2) compared to the pre-IT period (1990Q1-2001Q4). This flattening phenomenon holds regardless of the measure of inflation used (e.g., headline, core, GDP deflator, or the PCE deflator). Figure 8 indicates the evolution of the output gap coefficients over a 30-quarter rolling window using the different measures of inflation.
Figure 4 HeadlineInflationandtheOutputGap
Figure 5CoreInflationandtheOutputGap
-.02
.00
.02
.04
.06
.08
.10
-.08 -.06 -.04 -.02 .00 .02 .04 .06 .08
Output Gap (4-quarter moving-average)
Core
Infla
tion
Pre-IT Period
-.03 -.02 -.01 .00 .01 .02
Output Gap (4-quarter moving-average)
IT Period
-.1
.0
.1
.2
.3
.4
.5
-.08 -.06 -.04 -.02 .00 .02 .04 .06 .08
Output G ap (4-quarter moving-average)
Head
line
Infla
tion
Pre-IT Period
-.03 -.02 -.01 .00 .01 .02
Output G ap (4-quarter moving-average)
IT Period

Price-setting Behaviour and Inflation Dynamics inSEACEN Member Economies and their Implications for Inflation
The SEACEN CentreThe Flattening of the Phillips Curve in the Philippines:The Role of the Global Output Gap
210
Figure 6GDPDeflatorInflationandtheOutputGap
Figure 7PCEDeflatorInflationandtheOutputGap
-.1
.0
.1
.2
.3
.4
.5
-.08 -.06 -.04 -.02 .00 .02 .04 .06 .08
Output Gap (4-quarter moving-average)
GD
P D
efla
tor I
nfla
tion
Pre-IT Period
-.03 -.02 -.01 .00 .01 .02
Output Gap (4-quarter moving-average)
IT Period
-.1
.0
.1
.2
.3
.4
.5
-.08 -.06 -.04 -.02 .00 .02 .04 .06 .08
Output Gap (4-quarter moving-average)
PCE
Def
lato
r Inf
latio
n
Pre-IT Period
-.03 -.02 -.01 .00 .01 .02
Output Gap (4-quarter moving-average)
IT Period

211 The SEACEN Centre The Flattening of the Phillips Curve in the Philippines:
The Role of the Global Output Gap
Price-setting Behaviour and Inflation Dynamics inSEACEN Member Economies and their Implications for Inflation
Figure 8OutputGapCoefficient(30-QuarterRollingWindow)
3.2 Globalization Impact
3.2.1 Trade Channel
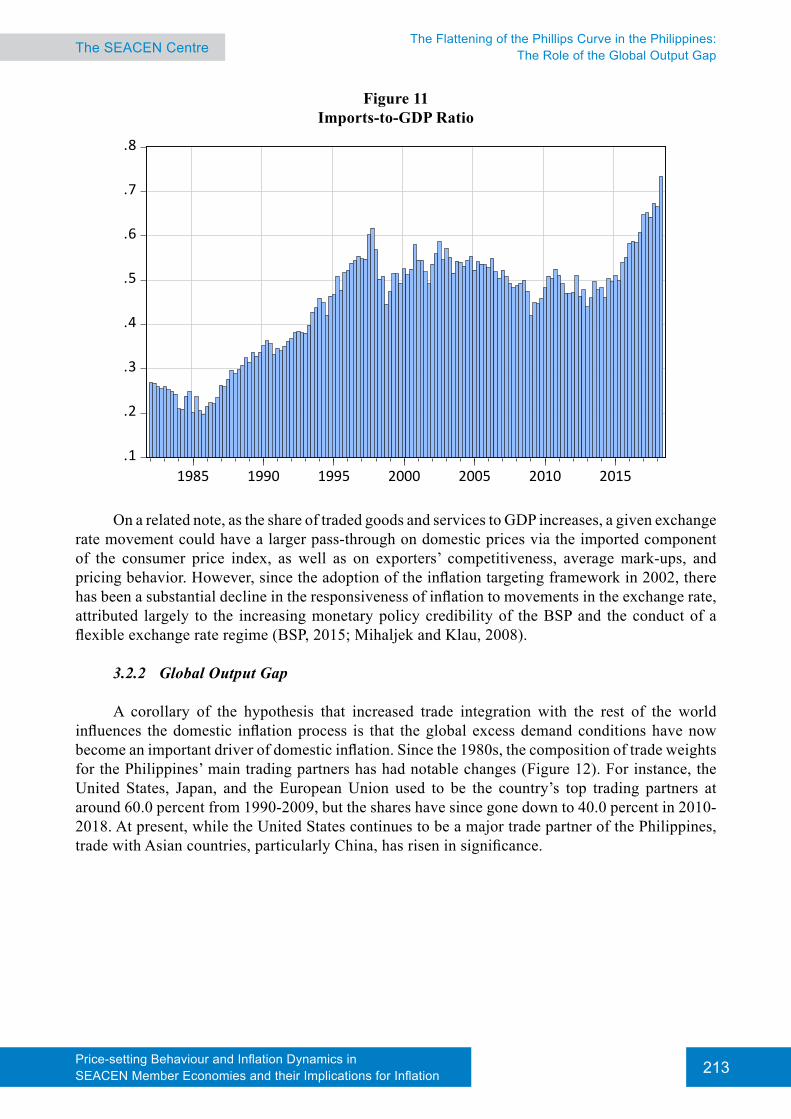
Increased openness of goods market is considered as one of the channels by which globalization can affect the variables driving the domestic inflation process. The role of trade in the Philippine has been increasing in significance, with total trade (imports plus exports) as a percentage of GDP, averaging less than 100.0 percent from 1990-2009 to more than 130.0 percent in 2018Q2 (Figure 9). In particular, the share of exports to GDP has risen from less than 50.0 percent from 1990-2009 to 60.0 percent in 2018 Q2 (Figure 10), while imports as a percentage of GDP has also picked up from less than 50.0 percent from 1990-2009 to more than 70.0 percent in 2018Q2 (Figure 11).
-0.6
-0.4
-0.2
0.0
0.2
0.4
0.6
0.8
1.0
92 94 96 98 00 02 04 06 08 10 12 14 16 18
Output Gap Coefficient for Headline Inflation+2 S.E.-2 S.E.
-0.6
-0.4
-0.2
0.0
0.2
0.4
0.6
0.8
1.0
02 03 04 05 06 07 08 09 10 11 12 13 14 15 16 17 18
Output Gap Coefficient for Core Inflation+2 S.E.-2 S.E.
-1.2
-0.8
-0.4
0.0
0.4
0.8
1.2
92 94 96 98 00 02 04 06 08 10 12 14 16 18
Output Gap Coefficient for GDP Deflator Inflation+2 S.E.-2 S.E.
-1.5
-1.0
-0.5
0.0
0.5
1.0
1.5
2.0
92 94 96 98 00 02 04 06 08 10 12 14 16 18
Output Gap Coefficient for PCE Deflator Inflation+2 S.E.-2 S.E.

Price-setting Behaviour and Inflation Dynamics inSEACEN Member Economies and their Implications for Inflation
The SEACEN CentreThe Flattening of the Phillips Curve in the Philippines:The Role of the Global Output Gap
212
Figure 9Trade-to-GDPRatio
Figure10Exports-to-GDPRatio
0.4
0.6
0.8
1.0
1.2
1.4
1985 1990 1995 2000 2005 2010 2015
Trade-to-GDP Ratio
.20
.25
.30
.35
.40
.45
.50
.55
.60
.65
1985 1990 1995 2000 2005 2010 2015
Exports-to-GDP Ratio
213 The SEACEN Centre The Flattening of the Phillips Curve in the Philippines:
The Role of the Global Output Gap
Price-setting Behaviour and Inflation Dynamics inSEACEN Member Economies and their Implications for Inflation
Figure 11Imports-to-GDPRatio
On a related note, as the share of traded goods and services to GDP increases, a given exchange rate movement could have a larger pass-through on domestic prices via the imported component of the consumer price index, as well as on exporters’ competitiveness, average mark-ups, and pricing behavior. However, since the adoption of the inflation targeting framework in 2002, there has been a substantial decline in the responsiveness of inflation to movements in the exchange rate, attributed largely to the increasing monetary policy credibility of the BSP and the conduct of a flexible exchange rate regime (BSP, 2015; Mihaljek and Klau, 2008).
3.2.2 Global Output Gap
A corollary of the hypothesis that increased trade integration with the rest of the world influences the domestic inflation process is that the global excess demand conditions have now become an important driver of domestic inflation. Since the 1980s, the composition of trade weights for the Philippines’ main trading partners has had notable changes (Figure 12). For instance, the United States, Japan, and the European Union used to be the country’s top trading partners at around 60.0 percent from 1990-2009, but the shares have since gone down to 40.0 percent in 2010-2018. At present, while the United States continues to be a major trade partner of the Philippines, trade with Asian countries, particularly China, has risen in significance.
.1
.2
.3
.4
.5
.6
.7
.8
1985 1990 1995 2000 2005 2010 2015
Imports-to-GDP Ratio

Price-setting Behaviour and Inflation Dynamics inSEACEN Member Economies and their Implications for Inflation
The SEACEN CentreThe Flattening of the Phillips Curve in the Philippines:The Role of the Global Output Gap
214
Figure 12TradeWeights
As a proxy for the global output gap, a trade (exports and imports)-weighted world GDP index is constructed using the Philippines’ primary trading partners (e.g., China, European Union, Hong Kong, Indonesia, Japan, Malaysia, South Korea, Singapore, Chinese Taipei, Thailand, and the United States), as follows:
In constructing a trade-weighted world GDP index, the bottom-up approach (which is done by summing up the weighted output gaps of trading partners,
) and top-down
method (by filtering the aggregate weighted GDPs of trading partners) were considered. Figure 14 illustrates that the top-down and bottom-up approaches in calculating the global output gap yields fairly similar estimates. Hence, this top-down approach will be used henceforth to avoid estimating the output of each trading partner.
0.0
0.1
0.2
0.3
0.4
0.5
0.6
0.7
0.8
0.9
1.0
1980 1985 1990 1995 2000 2005 2010 2015 2020
United States European Union JapanChina Hong Kong Chinese TaipeiSouth Korea Indonesia MalaysiaSingapore Thailand

215 The SEACEN Centre The Flattening of the Phillips Curve in the Philippines:
The Role of the Global Output Gap
Price-setting Behaviour and Inflation Dynamics inSEACEN Member Economies and their Implications for Inflation
-6%
-4%
-2%
0%
2%
4%
6%
8%
86 88 90 92 94 96 98 00 02 04 06 08 10 12 14 16 18
-6%
-4%
-2%
0%
2%
4%
02 03 04 05 06 07 08 09 10 11 12 13 14 15 16 17 18
Bottom-Up (H-P Filter)Top-Down (H-P Filter)
02 03 04 05 06 07 08 09 10 11 12 13 14 15 16 17 18
Bottom-Up (1-S ided H-P Filter)Top-Down (1-Sided H-P Filter)
-6%
-4%
-2%
0%
2%
4%
02 03 04 05 06 07 08 09 10 11 12 13 14 15 16 17 18
Output Gap (H-P Filter)World Output Gap (H-P Filter)
-6%
-4%
-2%
0%
2%
4%
02 03 04 05 06 07 08 09 10 11 12 13 14 15 16 17 18
Output Gap (1-Sided H-P Filter)World Output Gap (1-Sided H-P Filter)
Figure 13Trade-weightedWorldGDPGrowth
Figure 14Trade-weightedForeignOutputGap
A comparison of domestic and global output gaps, estimated using both the HP filter and one-sided HP filter (Figures 15) indicates that they move closely together.
Figure 15Domestic and Global Output Gap

Price-setting Behaviour and Inflation Dynamics inSEACEN Member Economies and their Implications for Inflation
The SEACEN CentreThe Flattening of the Phillips Curve in the Philippines:The Role of the Global Output Gap
216
4. Methodology
Six versions of the Phillips Curve model are estimated using the generalized method of moments as follows:
(0)
(1)
(2)
(3)
(4)
(5)
where refers to the measure of inflation used (e.g., headline, core, GDP deflator, and PCE deflator inflation); is domestic output gap; is foreign output gap; is nominal effective exchange rate; is import price inflation; is one-year ahead inflation expectations (from the BSP and Consensus Economics survey); and is an error term.
5. EstimationResultsandAnalyses
This section shows the estimation results for each equation using headline inflation as the endogenous variable.
For equation 0, the coefficient for domestic output gap for both filtering methods yield results that are not statistically different from zero in the pre-IT period. Meanwhile, the coefficients were found to be positive and significant for the IT period, which suggests that the Phillips curve for the Philippines has become steeper. However, this result could be explained by omitted variables bias as can be seen in the succeeding regression estimation results.
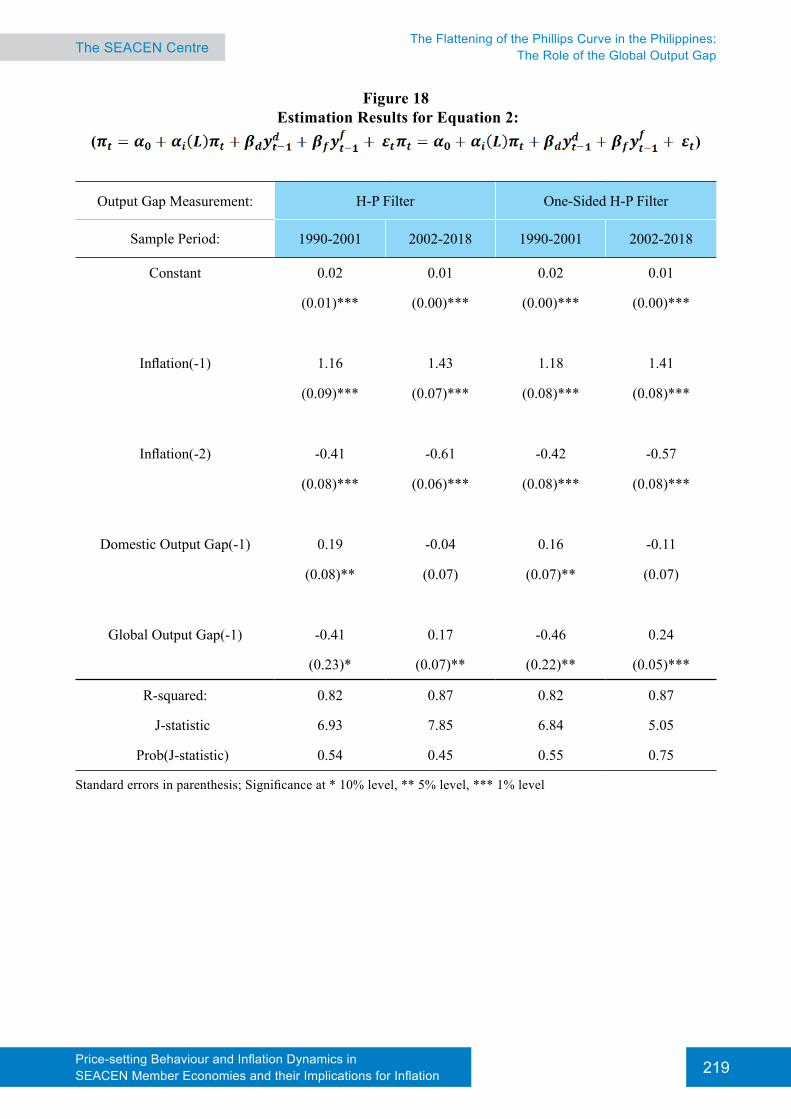
The inclusion of the global output gap in equation 1 results in lower coefficients for domestic output gap, albeit statistically insignificant, in the IT period. On the other hand, the coefficients for global output gap, which were statistically insignificant in the pre-IT period, has turned positive and statistically significant in the IT period (Figure 17). The estimates for equation 2 confirms the results of equation 1, which indicates the specification is not sensitive to the contemporaneous or lagged values of domestic and global output gaps (Figure 18).
Including the growth in the NEER in equation 3 as an added measure of global factors continues to show that the global output gap remains a positive and significant determinant of domestic headline inflation especially for the IT period (Figure 19). Extending the specification further by adding imported price inflation in equation 4 continues to yield a positive and significant coefficient estimate for the global output gap using the 1-sided H-P filter (Figure 20).

217 The SEACEN Centre The Flattening of the Phillips Curve in the Philippines:
The Role of the Global Output Gap
Price-setting Behaviour and Inflation Dynamics inSEACEN Member Economies and their Implications for Inflation
Finally, incorporating two measures of inflation expectations in equation 5, which are the year-ahead inflation forecast survey of private sector economists and the BSP’s year-ahead inflation forecast, again shows that global output remains a significant determinant of domestic headline inflation. Meanwhile, the positive and significant values for the coefficients of inflation expectations illustrate the importance the expectations channel in influencing inflation dynamics. Hence, monetary policy actions have a scope in affecting inflation movements by guiding the public’s inflation expectations.
In addition to headline inflation, robustness checks were conducted for equations 1 to 6 by using other measures of inflation such as core, GDP deflator, and personal consumption expenditure deflator.
Figure 16EstimationResultsforEquation0:
( )
Output Gap Measurement: H-P Filter One-Sided H-P Filter
Sample Period: 1990-2001 2002-2018 1990-2001 2002-2018
Constant 0.02 0.01 0.02 0.00
(0.00)*** (0.00)*** (0.00)*** (0.00)*
Inflation(-1) 1.19 1.35 1.21 1.39
(0.10)*** (0.08)*** (0.09)*** (0.09)***
Inflation(-2) -0.39 -0.51 -0.40 -0.52
(0.09)*** (0.07)*** (0.09)*** (0.10)***
Domestic Output Gap 0.03 0.20 -0.05 0.19
(0.09) (0.11)* (0.09) (0.10)*
R-squared: 0.81 0.86 0.81 0.85
J-statistic 4.34 3.24 4.64 4.18
Prob(J-statistic) 0.50 0.66 0.46 0.52
Standard errors in parenthesis; Significance at * 10% level, ** 5% level, *** 1% level

Price-setting Behaviour and Inflation Dynamics inSEACEN Member Economies and their Implications for Inflation
The SEACEN CentreThe Flattening of the Phillips Curve in the Philippines:The Role of the Global Output Gap
218
Figure 17Estimation Results for Equation 1:
( )
Output Gap Measurement: H-P Filter One-Sided H-P Filter
Sample Period: 1990-2001 2002-2018 1990-2001 2002-2018
Constant 0.02 0.01 0.02 0.01
(0.00)*** (0.00)*** (0.00)*** (0.00)***
Inflation(-1) 1.18 1.42 1.21 1.44
(0.08)*** (0.08)*** (0.08)*** (0.07)***
Inflation(-2) -0.40 -0.57 -0.42 -0.59
(0.08)*** (0.08)*** (0.08)*** (0.08)***
Domestic Output Gap 0.16 0.08 0.09 -0.07
(0.09) (0.13) (0.09) (0.10)
Global Output Gap -0.32 0.16 -0.33 0.23
(0.19) (0.08)* (0.20) (0.06)**
R-squared: 0.81 0.87 0.81 0.87
J-statistic 6.46 6.55 6.86 4.09
Prob(J-statistic) 0.60 0.59 0.55 0.85
Standard errors in parenthesis; Significance at * 10% level, ** 5% level, *** 1% level
219 The SEACEN Centre The Flattening of the Phillips Curve in the Philippines:
The Role of the Global Output Gap
Price-setting Behaviour and Inflation Dynamics inSEACEN Member Economies and their Implications for Inflation
Figure 18 Estimation Results for Equation 2:
( )
Output Gap Measurement: H-P Filter One-Sided H-P Filter
Sample Period: 1990-2001 2002-2018 1990-2001 2002-2018
Constant 0.02 0.01 0.02 0.01
(0.01)*** (0.00)*** (0.00)*** (0.00)***
Inflation(-1) 1.16 1.43 1.18 1.41
(0.09)*** (0.07)*** (0.08)*** (0.08)***
Inflation(-2) -0.41 -0.61 -0.42 -0.57
(0.08)*** (0.06)*** (0.08)*** (0.08)***
Domestic Output Gap(-1) 0.19 -0.04 0.16 -0.11
(0.08)** (0.07) (0.07)** (0.07)
Global Output Gap(-1) -0.41 0.17 -0.46 0.24
(0.23)* (0.07)** (0.22)** (0.05)***
R-squared: 0.82 0.87 0.82 0.87
J-statistic 6.93 7.85 6.84 5.05
Prob(J-statistic) 0.54 0.45 0.55 0.75
Standard errors in parenthesis; Significance at * 10% level, ** 5% level, *** 1% level

Price-setting Behaviour and Inflation Dynamics inSEACEN Member Economies and their Implications for Inflation
The SEACEN CentreThe Flattening of the Phillips Curve in the Philippines:The Role of the Global Output Gap
220
Figure 19Estimation Results for Equation 3:
( )
Output Gap Measurement: H-P Filter One-Sided H-P Filter
Sample Period: 1990-2001 2002-2018 1990-2001 2002-2018
Constant 0.02 0.00 0.00 0.01
(0.01)* (0.00)*** (0.01) (0.00)***
Inflation(-1) 0.94 1.26 0.97 1.46
(0.14)*** (0.09)*** (0.15)*** (0.12)***
Inflation(-2) -0.29 -0.36 -0.18 -0.62
(0.12)* (0.10)*** (0.12) (0.14)***
Domestic Output Gap -0.01 0.02 0.10 -0.13
(0.07) (0.13) (0.07) (0.10)
Global Output Gap -0.04 0.40 0.25 0.24
(0.18) (0.09)*** (0.12)* (0.06)***
%Change in NEER -0.06 -0.05 -0.10 0.00
(0.02)** (0.02)*** (0.02)*** (0.02)
R-squared: 0.61 0.87 0.60 0.87
J-statistic 6.10 10.48 6.15 7.71
Prob(J-statistic) 0.87 0.49 0.86 0.74
Standard errors in parenthesis; Significance at * 10% level, ** 5% level, *** 1% level

221 The SEACEN Centre The Flattening of the Phillips Curve in the Philippines:
The Role of the Global Output Gap
Price-setting Behaviour and Inflation Dynamics inSEACEN Member Economies and their Implications for Inflation
Figure20 Estimation Results for Equation 4:
( )
Output Gap Measurement: H-P Filter One-Sided H-P Filter
Sample Period: 1990-2001 2002-2018 1990-2001 2002-2018
Constant 0.03 0.00 0.02 0.01
(0.01)*** (0.00)*** (0.00)*** (0.00)***
Inflation(-1) 0.75 1.08 0.81 1.47
(0.09)*** (0.12)*** (0.06)*** (0.11)***
Inflation(-2) -0.26 -0.17 -0.26 -0.64
(0.06)*** (0.12) (0.06)*** (0.12)***
Domestic Output Gap -0.29 0.25 -0.18 -0.21
(0.06)*** (0.16) (0.08)** (0.09)**
Global Output Gap 0.07 0.23 0.23 0.21
(0.12) (0.14) (0.06)*** (0.06)***
%Change in NEER 0.02 -0.04 0.01 0.01
(0.01)** (0.02)*** (0.02) (0.01)
Import Price Inflation 0.10 0.07 0.08 0.03
(0.01)*** (0.03)** (0.01)*** (0.02)
R-squared: 0.67 0.88 0.66 0.88
J-statistic 7.64 10.14 7.60 8.04
Prob(J-statistic) 0.91 0.75 0.91 0.89
Standard errors in parenthesis; Significance at * 10% level, ** 5% level, *** 1% level

Price-setting Behaviour and Inflation Dynamics inSEACEN Member Economies and their Implications for Inflation
The SEACEN CentreThe Flattening of the Phillips Curve in the Philippines:The Role of the Global Output Gap
222
Figure 21 Estimation Results for Equation 5
( )
Output Gap Measurement: H-P Filter One-Sided H-P Filter
Sample Period: 2002-2018 2002-2018 2002-2018 2002-2018
Constant 0.00 -0.01 0.00 -0.01
(0.00) (0.00)*** (0.00) (0.00)***
Inflation Expectations (Survey) 0.34 0.53
(0.12)*** (0.10)***
Inflation Expectation (CB Forecasts) 0.76 0.72
(0.09)*** (0.08)***
Inflation(-1) 0.98 0.84 1.02 1.05
(0.12)*** (0.08)*** (0.10)*** (0.07)***
Inflation(-2) -0.27 -0.20 -0.52 -0.48
(0.10)*** (0.06)*** (0.08)*** (0.08)***
Domestic Output Gap 0.14 0.01 -0.10 -0.40
(0.12) (0.07) (0.09) (0.10)***
Global Output Gap 0.11 0.16 -0.33 0.23
(0.10) (0.05)*** (0.09)*** (0.08)***
%Change in NEER -0.02 -0.02 0.06 0.01
(0.01) (0.01)** (0.01)*** (0.01)
Import Price Inflation 0.09 0.07 0.17 0.03
(0.03)*** (0.01)*** (0.02)*** (0.02)
R-squared: 0.92 0.94 0.92 0.94
J-statistic 11.13 12.25 10.17 10.53
Prob(J-statistic) 0.85 0.78 0.90 0.88
Standard errors in parenthesis; Significance at * 10% level, ** 5% level, *** 1% level

223 The SEACEN Centre The Flattening of the Phillips Curve in the Philippines:
The Role of the Global Output Gap
Price-setting Behaviour and Inflation Dynamics inSEACEN Member Economies and their Implications for Inflation
Figure 22SummaryofGlobalOutputGapCoefficientsforHeadlineInflation
Output Gap Measurement: H-P Filter One-Sided H-P Filter
Sample Period: 1990-2001 2002-2018 1990-2001 2002-2018
Eq. 0 -0.32 0.16 -0.33 0.23
(0.19) (0.08) (0.20) (0.06)**
Eq. 1 -0.41 0.17 -0.46 0.24
(0.23)* (0.07)** (0.22)** (0.05)***
Eq. 2 -0.04 0.4 0.25 0.24
(0.18) (0.09)*** (0.12)* (0.06)***
Eq. 3 0.07 0.23 0.23 0.21
(0.12) (0.14) (0.06)*** (0.06)***
Eq. 4 0.11 -0.33
(0.10) (0.09)***
Eq. 5 0.16 0.23
(0.05)*** (0.08)***
Standard errors in parenthesis; Significance at * 10% level, ** 5% level, *** 1% level

Price-setting Behaviour and Inflation Dynamics inSEACEN Member Economies and their Implications for Inflation
The SEACEN CentreThe Flattening of the Phillips Curve in the Philippines:The Role of the Global Output Gap
224
Figure 23SummaryofGlobalOutputGapCoefficientsforCoreInflation
Output Gap Measurement: H-P Filter One-Sided H-P Filter
Sample Period: 1990-2001 2002-2018 1990-2001 2002-2018
Eq. 0 -0.15 0.14 -0.17 0.17
(0.12) (0.06)* (0.09) (0.05)**
Eq. 1 -0.08 0.14 -0.13 0.16
(0.08) (0.06)* (0.16) (0.04)**
Eq. 2 -0.06 0.17 0.02 0.14
(0.06) (0.05)** (0.06) (0.05)**
Eq. 3 -0.01 0.13 0.05 0.14
(0.02) (0.07) (0.03) (0.06)*
Eq. 4 0.02 -0.07
(0.05) (0.06)
Eq. 5 0.03 0.07
(0.06) (0.05)
Standard errors in parenthesis; Significance at * 10% level, ** 5% level, *** 1% level
225 The SEACEN Centre The Flattening of the Phillips Curve in the Philippines:
The Role of the Global Output Gap
Price-setting Behaviour and Inflation Dynamics inSEACEN Member Economies and their Implications for Inflation
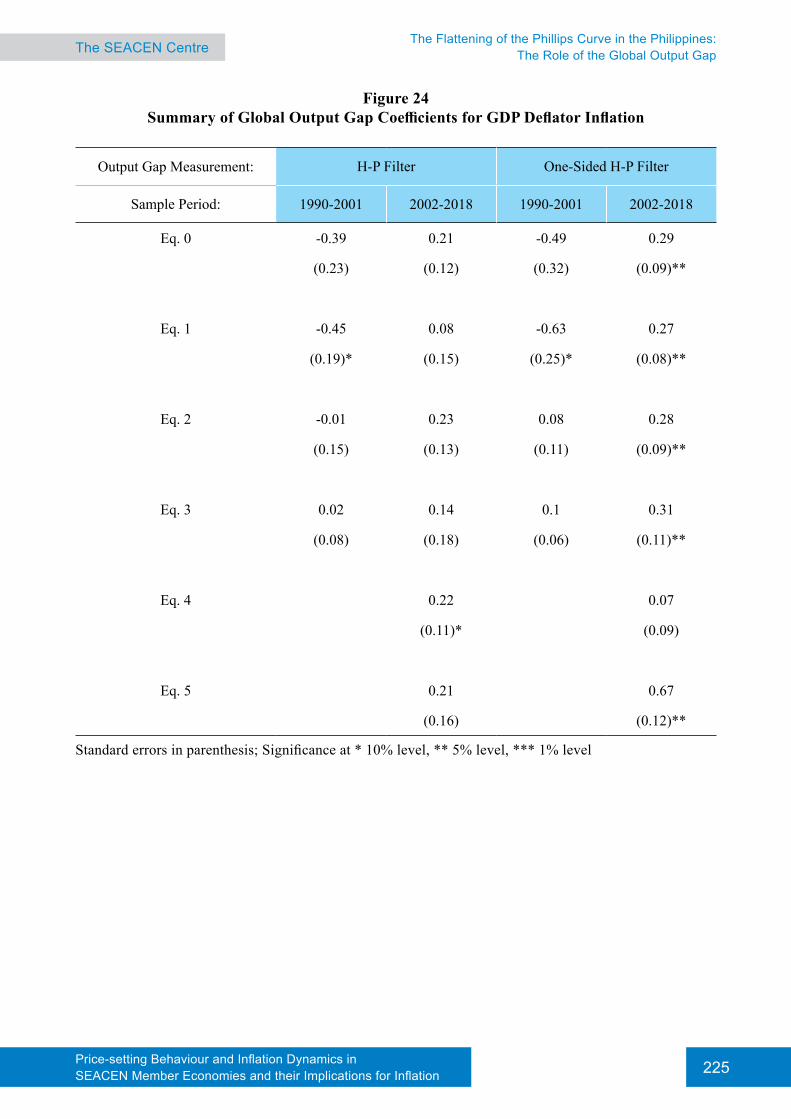
Figure 24SummaryofGlobalOutputGapCoefficientsforGDPDeflatorInflation
Output Gap Measurement: H-P Filter One-Sided H-P Filter
Sample Period: 1990-2001 2002-2018 1990-2001 2002-2018
Eq. 0 -0.39 0.21 -0.49 0.29
(0.23) (0.12) (0.32) (0.09)**
Eq. 1 -0.45 0.08 -0.63 0.27
(0.19)* (0.15) (0.25)* (0.08)**
Eq. 2 -0.01 0.23 0.08 0.28
(0.15) (0.13) (0.11) (0.09)**
Eq. 3 0.02 0.14 0.1 0.31
(0.08) (0.18) (0.06) (0.11)**
Eq. 4 0.22 0.07
(0.11)* (0.09)
Eq. 5 0.21 0.67
(0.16) (0.12)**
Standard errors in parenthesis; Significance at * 10% level, ** 5% level, *** 1% level

Price-setting Behaviour and Inflation Dynamics inSEACEN Member Economies and their Implications for Inflation
The SEACEN CentreThe Flattening of the Phillips Curve in the Philippines:The Role of the Global Output Gap
226
Figure 25SummaryofGlobalOutputGapCoefficientsforPCEDeflatorInflation
Output Gap Measurement: H-P Filter One-Sided H-P Filter
Sample Period: 1990-2001 2002-2018 1990-2001 2002-2018
Eq. 0 -0.23 0.43 -0.33 0.52
(0.24) (0.14)** (0.35) (0.12)**
Eq. 1 -0.2 0.4 -0.42 0.47
(0.19) (0.14)** (0.27) (0.09)**
Eq. 2 0.05 0.75 -0.02 0.54
(0.17) (0.14)** (0.19) (0.10)**
Eq. 3 0.21 0.39 0.13 0.44
(0.14) (0.24) (0.16) (0.13)**
Eq. 4 0.03 -0.07
(0.21) (0.16)
Eq. 5 0.16 0.39
(0.19) (0.15)*
Standard errors in parenthesis; Significance at * 10% level, ** 5% level, *** 1% level
6. Conclusion/PolicyImplications
This study presents a comprehensive assessment of the determinants of inflation in the Philippines, by accounting for the impact of global factors, in addition to domestic variables, as well as inflation expectations. This study also analyzes how the roles of the various drivers of inflation in the Philippines have evolved over time with the sample periods divided into the pre-IT era (1990Q1-2001Q4) and IT period (2002Q1-2018Q2).
227 The SEACEN Centre The Flattening of the Phillips Curve in the Philippines:
The Role of the Global Output Gap
Price-setting Behaviour and Inflation Dynamics inSEACEN Member Economies and their Implications for Inflation
The main findings of the study are the following. First, there have been changes in the contribution of the different drivers of inflation, with the domestic output gap now playing a less significant role, hence a flattening of the Phillips curve, during the IT period. Second, offsetting the diminished role of the domestic output gap is the growing role of global factors, as proxied by global output gap. This particular finding is consistent with the assumption in the literature that global developments have now become an important factor in influencing the short-run trade-off between domestic inflation and output. Adding other external variables such as the exchange rate and import price inflation does not diminish the explanatory of the global output gap. An important implication of this finding for monetary policy is whether the BSP would now consider incorporating the global output gap in its suite of inflation models, as this study has shown its significance and growing role in explaining the domestic inflation process.
Nevertheless, while the role of global factors has grown in significance over time, this study also highlights the relevance of domestic factors such as the role of the credibility of monetary policy (via the inflation expectations channel) in explaining the domestic inflation process. This finding is particularly relevant as the central bank’s ability to anchor inflation expectations is critical especially during periods marked by elevated inflation levels, unanticipated shocks, or greater degree of uncertainty. With a lower chance of inflation expectations becoming disanchored, monetary policy need not react aggressively during such times, in order to bring inflation back to the desired target. At the same time, there is also a need to preserve the credibility of the BSP such that in times wherein actual inflation has breached the inflation target, an explanation of what caused the breach and the measures needed to bring the inflation back to target, need to be carefully communicated to the public.

Price-setting Behaviour and Inflation Dynamics inSEACEN Member Economies and their Implications for Inflation
The SEACEN CentreThe Flattening of the Phillips Curve in the Philippines:The Role of the Global Output Gap
228
References
Ang, A.; G. Bekaert and M. Wei, (2007), “Do Macro Variables, Asset Markets, or Surveys Forecast Inflation Better?” Journal of Monetary Economics, 54 (4), pp. 1163–1212.
Bagsic, C., (2004), “The Phillips Curve and Inflation Forecasting: The Case of the Philippines,” Philippine Management Review, 11(1).
Ball, L., (2006), “Has Globalization Changed Inflation?” NBER Working Paper, No. 12687.
Bangko Sentral ng Pilipinas, (2015), Annual Report.
Beaudry, P. and M. Doyle, (2000), “What Happened to the Phillips Curve in the 1990s in Canada?” in Price Stability and the Long-run Target for Monetary Policy, pp. 51–82.
Borio, C. and A. Filardo, (2007), “Globalisation and Inflation: New Cross-Country Evidence on the Global Determinants of Domestic Inflation,” BIS Working Paper, No. 227.
Cacnio, F., (2013), “Analysing Inflation Dynamics in the Philippines Using the New Keynesian Phillips Curve,” The Philippine Review of Economics, Vol. L No. 2, December, pp. 53-82.
Calabria, M., (2013), “Behavioral Economics and Policymaking,” Cato Journal, Vol. 36, No. 3.
Calza, A., (2008), “Globalisation, Domestic Inflation and Global Output Gaps. Evidence from the Euro Area,” ECB Working Paper, No. 890, European Central Bank.
Dany-Knedlik, G. and J. Angel Garcia, (2018), “Monetary Policy and Inflation Dynamics in ASEAN Economies,” IMF Working Papers, 18/147.
Dua, P., (2006), “Inflation-unemployment Tradeoff in Asia,” Presented in the Project Link Meeting, United Nations, Geneva.
Dumlao, L., (2005), Capacity Utilization, Aggregate Supply and Phillips Curve in the Philippines, Ateneo de Manila University.
Guinigundo, D., (2016), “The Role of Expectations in Inflation Dynamics in the Philippines – Has it Changed Following the Global Financial Crisis?” BIS Papers Chapters in Bank for International Settlements (ed.), Inflation Mechanisms, Expectations and Monetary Policy, Vol. 89, pp. 291-302.
Helbling, F. and M. Sommer, (2006), “How has Globalization Affected Inflation?” IMF World Economic Outlook, Chapter 3, Washington: IMF, April.
Iakova, D., (2007), “Flattening of the Phillips Curve: Implications for Monetary Policy,” IMF Working Paper Series, 07/76.
Kuttner, K. and T. Robinson, (2010), “Understanding the Flattening of the Phillips Curve,” The North American Journal of Economics and Finance, 21, pp. 110-125.

229 The SEACEN Centre The Flattening of the Phillips Curve in the Philippines:
The Role of the Global Output Gap
Price-setting Behaviour and Inflation Dynamics inSEACEN Member Economies and their Implications for Inflation
Łyziak, T, (2016), “Survey Measures of Inflation Expectations in Poland: Are They Relevant from the Macroeconomic Perspective?” Baltic Journal of Economics, 16:1, pp. 33-52.
Mihaljek, D. and M. Klau, (2008), “Exchange Rate Pass-through in Emerging Market Economies: What Has Changed and Why?” in Transmission mechanisms for monetary policy in emerging market economies, Bank for International Settlements (Eds.), Vol. 35, pp. 103-130.
Mishkin, F.S., (2007), “Inflation Dynamics,” NBER Working Paper, 13147.
Razin, A. and A. Binyamini, (2007), “Flattened Inflation-output Tradeoff and Enhanced Anti-inflation Policy: Outcome of Globalization?” NBER Working Paper, 13280.
Roberts, J. M., (2006), “Monetary Policy and Inflation Dynamics,” International Journal of Central Banking, 2(3), pp. 193–230.
Szafranek, K., (2017), “Flattening of the New Keynesian Phillips Curve: Evidence for an Emerging, Small Open Economy,” Economic Modelling, 63, pp. 334-348.
