the flight of petrels and albatrosses (procellariiformes
TRANSCRIPT

The Flight of Petrels and Albatrosses (Procellariiformes), Observed in South Georgia and itsVicinityAuthor(s): C. J. PennycuickSource: Philosophical Transactions of the Royal Society of London. Series B, BiologicalSciences, Vol. 300, No. 1098 (Dec. 24, 1982), pp. 75-106Published by: The Royal SocietyStable URL: http://www.jstor.org/stable/2395926Accessed: 25/07/2009 07:24
Your use of the JSTOR archive indicates your acceptance of JSTOR's Terms and Conditions of Use, available athttp://www.jstor.org/page/info/about/policies/terms.jsp. JSTOR's Terms and Conditions of Use provides, in part, that unlessyou have obtained prior permission, you may not download an entire issue of a journal or multiple copies of articles, and youmay use content in the JSTOR archive only for your personal, non-commercial use.
Please contact the publisher regarding any further use of this work. Publisher contact information may be obtained athttp://www.jstor.org/action/showPublisher?publisherCode=rsl.
Each copy of any part of a JSTOR transmission must contain the same copyright notice that appears on the screen or printedpage of such transmission.
JSTOR is a not-for-profit organization founded in 1995 to build trusted digital archives for scholarship. We work with thescholarly community to preserve their work and the materials they rely upon, and to build a common research platform thatpromotes the discovery and use of these resources. For more information about JSTOR, please contact [email protected].
The Royal Society is collaborating with JSTOR to digitize, preserve and extend access to PhilosophicalTransactions of the Royal Society of London. Series B, Biological Sciences.
http://www.jstor.org

Phil. Trans. R. Soc. Lond. B 300, 75-106 (1982) [ 75 ] Printed in Great Britain
THE FLIGHT OF PETRELS AND ALBATROSSES (PROCELLARIIFORMES), OBSERVED IN SOUTH
GEORGIA AND ITS VICINITY
BY C. J. PENNYCUICK
Department of Zoology, University of Bristol, Woodland Road, Bristol BS8 1 UG, U.K.
(Communicated by Sir James Lighthill, F.R.S. - Received 19 April 1982)
CONTENTS PAGE
1. INTRODUCTION 76
2. STUDY AREA AND SPECIES 76
3. ANATOMICAL OBSERVATIONS 77 3.1. Mass and wing measurements 77 3.2. Flight muscles and shoulder lock 79
4. FLIGHT OBSERVATIONS: METHODS 82 4.1. Main divisions of the data 82 4.2. Slope-soaring observations 82 4.3. Flight over the sea, observed from Bird Island 84 4.4. Ship-borne observations 84 4.5. Air density 85 4.6. Reduction of observations 85
5. FLIGHT OBSERVATIONS: RESULTS 86 5.1. Types of flight 86 5.2. Flying height over the sea 87 5.3. Response to head and tail winds 88 5.4. Absolute and relative speeds over the sea 90 5.5. Airspeed distributions 91 5.6. Lift coefficient distributions 92
6. RANGE AND SPEED ON FORAGING EXPEDITIONS 95 6.1. Straight-line versus zigzag groundspeeds 95 6.2. Groundspeed estimates 97 6.3. Soaring techniques 97 6.4. Energy extraction from the wind gradient 98 6.5. Effect of wind gradient in a downwind glide 101 6.6. Estimated glide polars 101 6.7. Energy consumption in flight J03 6.8. Distance flown per unit energy consumed 104
REFERENCES 105
Nine procellariiform species, covering a range of body mass exceeding 200:1, were studied- during a visit''to''Bird'Island, South Georgia, with the British Ant- arctic Survey, in the 1979-1980 field season. Speed measurements were made by

76 C. J. PENNYCUICK
ornithodolite of birds slope-soaring over land, birds flying over the sea but observed from land, and birds observed from a ship.
In the second group, which showed the least anomalies, lift coefficients corre- sponding to mean airspeeds were about 1 for albatrosses, decreasing to about 0.3 for the smallest petrels. All species increased speed when flying against the wind. The small species proceeded by flap-gliding, while the large ones flapped infrequently, and only in light winds. The small species flew lower than the larger ones, but this may be related to the fact that most of the observations were of birds flying into wind.
The albatrosses (Diomedea, Phoebetria) and giant petrels (Macronectes) were found to have a 'shoulder lock', consisting of a tendon sheet associated with the pectoralis muscle, which restrained the wing from. elevation above the horizontal. This arrange- ment was not seen in the smaller species, and was interpreted as an adaptation reducing the energy cost of gliding flight.
The main soaring method in the large species appeared to be slope-soaring along waves. Windward 'pullups' suggestive of the classical 'dynamic soaring' technique were seen in large and medium-sized species. However, the calculated strength of the wind gradient would have been insufficient to maintain airspeed to the heights observed, and it was concluded that most of the energy for the pullups must come from kinetic energy, acquired by gliding along a wave in slope lift. Gliding downwind through the wind gradient should significantly increase the glide ratio, but this was not observed. Slope-soaring along moving waves in zero wind was recorded.
The data were used to derive estimates of the average speeds that the different species should be able to maintain on foraging expeditions. Estimates of the rate of energy consumption were also made, taking into account the greater dependence on flapping in the smaller species, and on soaring in the larger ones. The distance travelled in consuming fuel equivalent to a given fraction of the body mass would seem to be very strongly dependent on mass. Comparison of the largest species (Diomedea exulans) with the smallest (Oceanites oceanicus) suggests that 'range', defined in this way, varies as the 0.60 power of the mass, although the relation is more complex than a simple power function.
1. INTRODUCTION
This paper describes a comparative study of the flight of nine species of petrels and albatrosses (Procellariiformes), a group that includes species covering a wider range of body mass than any other order. In spite of this, the Procellariiformes are quite a uniform group in many aspects of their biology. As regards their flight, all are pelagic, coming ashore only to breed, and all
depend for successful breeding on making foraging excursions to feeding areas at sea, both
during incubation and when rearing their young. The time and energy requirements for for- aging flights, which are important elements in the breeding ecology of these birds, vary with
body mass in a way that depends ultimately on scale relations in the mechanics of flight. The aim of this study was to shed some light on these relations, and on their ecological and evolution- ary implications.
2. STUDY AREA AND SPECIES
South Georgia is one of a number of sub-Antarctic islands, which are the main breeding strongholds of the petrels and albatrosses (Tuck & Heinzel 1978). The present paper is based on observations made during a visit to the British Antarctic Survey (B.A.S.) base at Bird Island, South Georgia, from 1 December 1979 to 23 February 1980. Further observations were made at sea from the B.A.S. vessel R.R.S. Bransfield on 26-30 November 1979, during the passage from Rio de Janeiro3 -to- South Georgia, and on 14-17 March 1980, between South Georgia and the Falkland Islands.
FLIGHT OF PETRELS AND ALBATROSSES 77
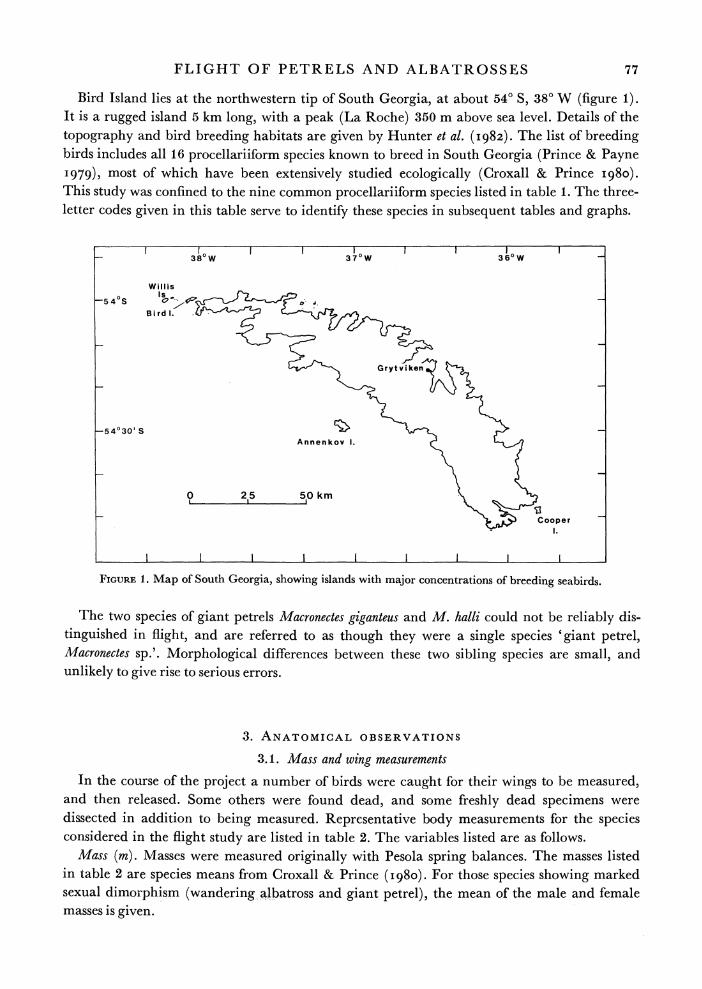
Bird Island lies at the northwestern tip of South Georgia, at about 540 S, 380 W (figure 1). It is a rugged island 5 km long, with a peak (La Roche) 350 m above sea level. Details of the topography and bird breeding habitats are given by Hunter et al. (I982). The list of breeding birds includes all 16 procellariiform species known to breed in South Georgia (Prince & Payne 1979), most of which have been extensively studied ecologically (Croxall & Prince I980). This study was confined to the nine common procellariiform species listed in table 1. The three- letter codes given in this table serve to identify these species in subsequent tables and graphs.
380W l
IW
36?W
Willis
-5 4?S O 47
Bird 1. r ,_
j <- A~~~~~~~~~~~Grytvike nt
-54030'3S S >
Annenkov 1. _
,0 2,5 5,0 km <
I I I I I II
FIGURE 1. Map of South Georgia, showing islands with major concentrations of breeding seabirds.
The two species of giant petrels Macronectes giganteus and M. halli could not be reliably dis- tinguished in flight, and are referred to as though they were a single species 'giant petrel, Macronectes sp.'. Morphological differences between these two sibling species are small, and unlikely to give rise to serious errors.
3. ANATOMICAL OBSERVATIONS
3.1. Mass and wing measurements
In the course of the project a number of birds were caught for their wings to be measured, and then released. Some others were found dead, and some freshly dead specimens were dissected in addition to being measured. Representative body measurements for the species considered in the flight study are listed in table 2. The variables listed are as follows.
Mass (m). Masses were measured originally with Pesola spring balances. The masses listed in table 2 are species means from Croxall & Prince (i980). For those species showing marked sexual dimorphism (wandering albatross and giant petrel), the mean of the male and female masses iS giVen.

78 C. J. PENNYCUICK
TABLE 1. MAIN STUDY SPECIES
(The three-letter codes are used to identify these species in subsequent tables and diagrams.)
WAN wandering albatross Diomedea exulans BBA black-browed albatross Diomedea melanophris GHA grey-headed albatross Diomedea chrysostoma STY light-mantled sooty albatross Phoebetria palpebrata MAC giant petrel Macronectes sp. WCP white-chinned petrel Procellaria aequinoctialis CAP cape pigeon Daption capensis PRN dove prion Pachyptila desolata WIL Wilson's petrel Oceanites oceanicus
TABLE 2. BODY MEASUREMENTS
wing wing disc aspect shoulder species mass span area loading loading ratio spacing
kg m m2 Nm-2 Nm-2 mm
WAN 8.73 3.03 0.611 140 11.9 15.0 130 BBA 3.79 2.16 0.356 104 10.1 13.1 100 GHA 3.79 2.18 0.352 106 9.96 13.5 100 STY 2.84 2.18 0.338 82.4 7.46 14.1 100 MAC 5.19 1.99 0.331 154 16.4 12.0 100 WCP 1.37 1.40 0.169 79.5 8.73 11.6 60 CAP 0.433 0.875 0.0773 55.0 7.06 9.90 36 PRN 0.168 0.626 0.0460 35.8 5.35 8.52 24 WIL 0.038 0.393 0.0192 19.4 3.07 8.04 15
exponent vs mass 0.376 0.635 0.365 0.248 0.117
(a) ___ b
(b)
midline
FIGURE 2. (a) 'Wing area' is defined as the projected area of both wings, plus that of the body between them (stippled). (b) To measure the area, a tracing of one wing is extended to the midline, as shown.
Wing span (b). This is the extreme tip-to-tip distance with wings spread to maximum extent.
The values in table 2 are the means of measurements made during the present study.
Wing area (S). This is considered as the projected area of both wings, including the area of the
body in between the wings (see figure 2 a). This was measured by spreading one wing to its
fullest extent over an expanse of newspaper, and tracing the outline. This outline was extended proximally to the body midline,--by measuring a distance 2b from the wing tip (figure 2 b). The
area as in figure 2 b was measured by counting squares on a transparent grid overlay, then

FLIGHT OF PETRELS AND ALBATROSSES 79
doubled to give the area for both wings as in figure 2 a. This method conforms to aeronautical conventions, but it may be noted that not all ornithologists have included the area of the intercepted body with the wing area, and some have been inexplicit as to what they actually measured. If the body area is neglected, the wing area in this group will be underestimated by around 14%, and this will lead to corresponding overestimates of wing loading, lift coefficient and aspect ratio. This could be the reason for some of the improbably high values for albatross aspect ratios to be found in the literature.
For calculations involving wing kinematics (not considered here) the area distal to the shoulder joint may be required. For this reason the distance between the shoulder joints has been included in table 2, although no use is made of this measurement in the present paper. The wing areas shown in table 2 are the means of measurements made during this study.
Aspect ratio (R). This is derived from the span and area measurements by the formula
R = b2/S. (1)
Wing loading (QS) This is derived from the mass and area measurements by the formula
Qs = mg/S, (2)
where g is the acceleration due to gravity, taken to be 9.81 m s-2.
Disc loading (Qd). This is derived from the mass and span measurements by the formula
Qd = mg/Sd, (3) where Sd is the disc area, defined as Sd = 2 (4)
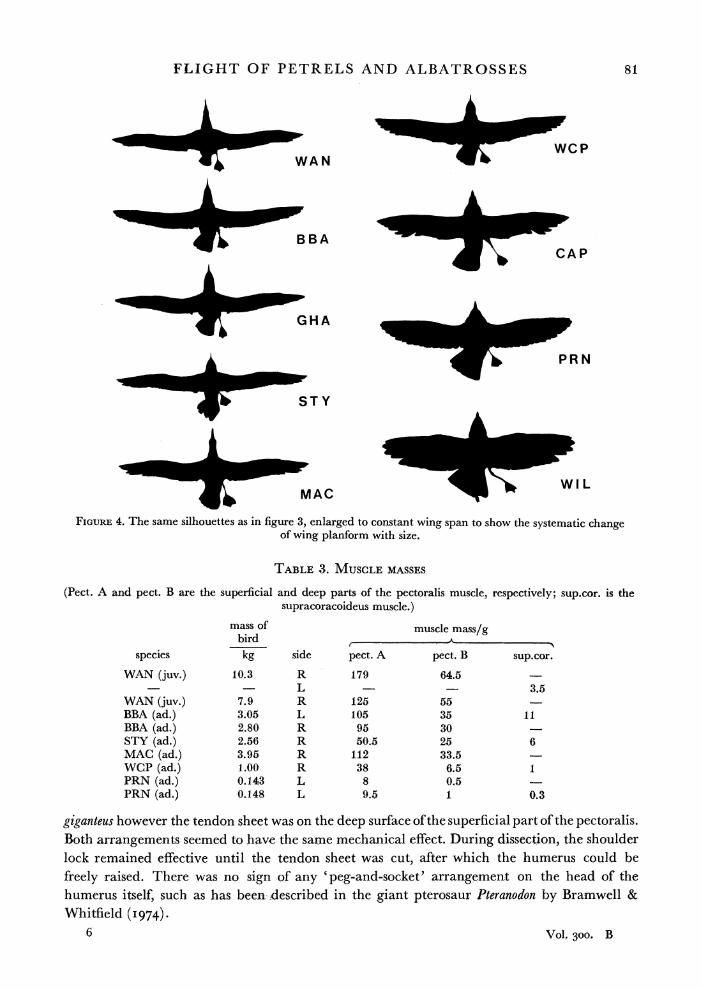
Silhouettes of the species listed in table 2 are shown in figure 3, all drawn to the same scale. These silhouettes were made from tracings of actual specimens, as indicated above. It may be noted that the different species are by no means geometrically similar, and that wing shape changes in a systematic way with size. In particular, wing span is found to vary with the 0.38 power of the mass, instead of the one-third power as would be predicted on geometrical simi- larity; that is to say, larger species have relatively longer wings than smaller ones. Exponents for the other variables are listed at the bottom of table 2. Wing loading increases with mass more rapidly than geometrical similarity would imply, disc loading less rapidly.
The silhouettes of figure 4 are the same as those of figure 3, but enlarged in this case to a constant wing span, to show the striking systematic change of shape with size. This corresponds to a variation of aspect ratio with the 0.12 power of the mass.
3.2. Flight muscles and shoulder lock
Some masses of flight muscles measured in dissection are listed in table 3. It should be borne in mind that, as no birds were killed for dissection, these data came from birds found dead, and some of them may have been starved or diseased.
It was noted by Kuroda (I96I) that the pectoralis muscle in all soaring birds is subdivided into a large, superficial part and a smaller deep part, distinguishable in gross dissection, while non-soaring birds have an undivided pectoralis. In the adult birds listed in table 3 the superficial pectoralis and supracoracoideus muscles were dark red, while the deep pectoralis was a paler pink. This was less evident in the nestling wandering albatrosses, which died before they had flown. In them, both the deep and the superficial pectoralis muscles were a similar shade of pink. The subdivision of the pectoralis is also prominent in vultures (Aegypiinae) and storks

80 C. J. PENNYCUICK
(Ciconiidae), both of which show a similar difference of colour between the dark red superficial part and the much paler deep part. The interpretation put on this by Pennycuick (I972) was that the superficial pectoralis is the main power unit for flapping flight, whereas the deep pectoralis is a slow tonic muscle, used to hold the wings in the horizontal position during gliding.
This interpretation is somewhat less attractive for albatrosses and giant petrels, since these birds were found to have another adaptation, which might be supposed to reduce or eliminate the need for a tonic muscle. It was noted that, if the wing of an intact albatross or giant petrel
I .
I I O 2 3 m
~~~m4~A ^ ~~~~~~~~MAC
i u ~~~~~~WCP
GHA *k CAP
_*'p PRN
e -STY ~ 4 - WIL
FIGURE 3. Silhouettes of the nine study species, made from tracings taken from specimens in the field. The species codes are given in table 1. The left side of each specimen is shown with the tail spread, and the right side with the tail furled and the foot spread.
was moved forward to the fully protracted position, then it strongly resisted an attempt to raise it above the horizontal position. The shoulder joint appeared to come up against a positive mechanical lock when raised to the horizontal position. When the humerus was retrac- ted a few degrees from the fully forward position, the lock no longer operated, and the wing could be raised.
It was found on dissection that the lock was due to a sheet of tendon forming part of the superficial pectoralis muscle. The tendon was fan-shaped, having a long origin along the keel of the sternum, and converging to unite with the rest of the pectoralis insertion on the deltoid crest of the humerus. In the three albatross species listed in table 3 the tendon sheet occupied a superficial level in the muscle, with a small amount of muscle tissue overlying it. In Macronectes
FLIGHT OF PETRELS AND ALBATROSSES 81
__c WCP F-4-p.~ WAN
^m4-p~ BBA < % -CAP
GHA
A _; ~~~~~~PRN
FIGURE 4. The same silhouettes as in figure 3, enlarged to constant wing span to show the systematic change of wing planform with size.
TABLE 3. MUSCLE MASSES
(Pect. A and pect. B are the superficial and deep parts of the pectoralis muscle, respectively; sup.cor. is the supracoracoideus muscle.)
mass of muscle mass/g bird A
species kg side pect. A pect. B sup.cor.
WAN (juv.) 10.3 R 179 64.5 - - - L 3.5
WAN (juv.) 7.9 R 125 55 BBA (ad.) 3.05 L 105 35 11 BBA (ad.) 2.80 R 95 30 STY (ad.) 2.56 R 50.5 25 6 MAC (ad.) 3.95 R 112 33.5 WCP (ad.) 1.00- R 38 6.5 1 PRN (ad.) 0.143 L 8 0.5 PRN (ad.) 0.148 L 9.5 1 0.3
giganteus however the tendon sheet was on the deep surface of the superficial part of the pectoralis. Both arrangements seemed to have the same mechanical effect. During dissection, the shoulder lock remained effective until the tendon sheet was cut, after which the humerus could be freely raised. There was no sign of any 'peg-and-socket' arrangement on the head of the humerus itselg? such as has Rbeen.-4.escribed i.n the giant pterosaur Pteranodon by Bramwiell &
6 Vol. 300. B
82 C. J. PENNYCUICK
In smaller species of petrels the wing could be raised above the horizontal position without any resistance. No sign of any locking mechanism was found in the two smaller species dissected, the white chinned petrel and dove prion. These species did, however, have a subdivided pectoralis similar in general appearance to those of the larger species. It can be seen from table 3 that in the small species the deep part of the pectoralis accounted for 6-15 % of the whole muscle, whereas in the large species, with the shoulder lock, it was relatively much bigger, 23-33 % of the whole. In vultures and storks the deep pectoralis is only 8-11 % of the whole (Pennycuick I972).
These observations suggest that, while the deep pectoralis may well be a tonic muscle in the smaller petrels (and also in land birds), it most probably has some other function in albatrosses and giant petrels. A possible explanation has been seen in cine film taken by the author and subsequently analysed by K. D. Scholey. He finds (personal communication) that the kine- matics of flapping flight are unusual in those species that have the shoulder lock, with limited upward movement of the wing. In normal flapping flight humerus elevations up to 250 above the horizontal were seen. Unless the humerus was retracted (unlikely) this would imply some distortion of the pectoral girdle, perhaps with elastic recoil as discussed by Weis-Fogh (I973).
When about to land, these species did not use the large-amplitude movements seen in most birds, but showed instead a peculiar motion involving rapid rotation of the wing about its own axis. The frequency of this type of flapping was about twice that of normal flapping, most probably implying that a separate muscle would be required. It may be suggested that this is the function of the deep pectoralis in these large species, so explaining its relatively large size. The pale colour would then be interpreted as due to specialization as a 'sprint' muscle, whereas the pale colour of the deep pectoralis of the smaller petrels, and land-soaring birds, would be due to its low specific power consumption, as a tonic muscle.
4. FLIGHT OBSERVATIONS: METHODS
4.1. Main divisions of the data
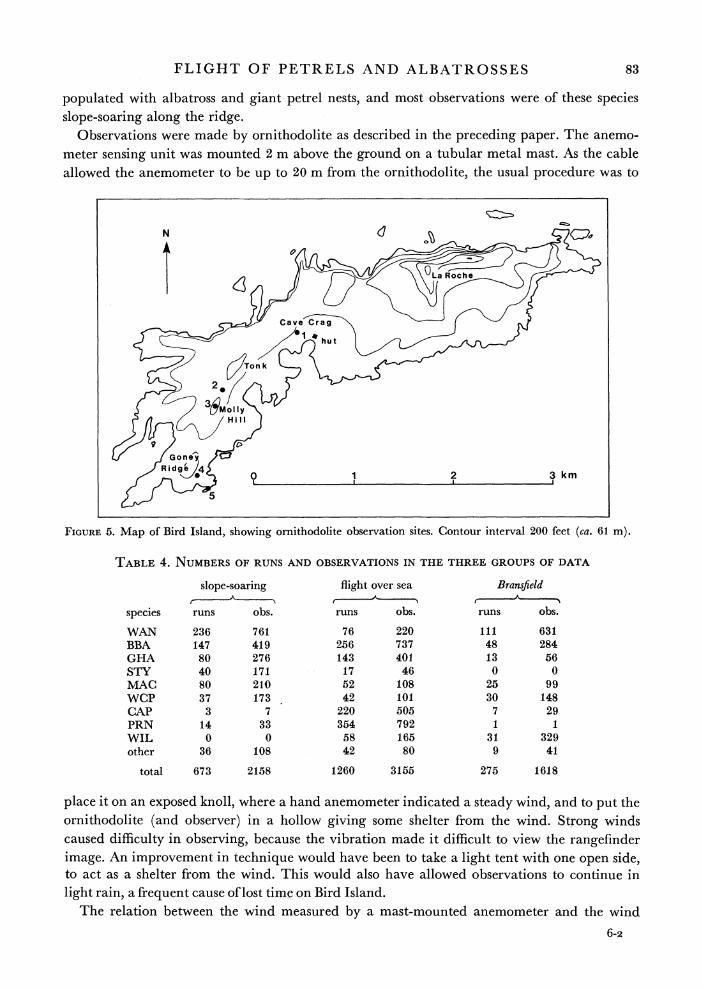
Ornithodolite observations were made on 31 days between 8 December 1979 and 19 February 1980, from five observation sites, marked on the map of Bird Island (figure 5). Further observa- tions were made at sea on nine days, during the passages to and from South Georgia. For analysis, the data were divided into three groups, comprising (i) observations of birds slope- soaring on Bird Island, (ii) observations, from Bird Island, of birds flying over the sea, and (iii) observations made at sea from R.R.S. Bransfield. As explained in the preceding paper, the data consisted of ' runs', each comprising a variable number of timed 'observations' of a bird's position. The numbers of runs and observations obtained in each group are listed in table 4. The numbers of observations listed are in fact the numbers of speed estimates derived from pairs of successive observations, the first position in each run being numbered zero. Details follow of the observation conditions and methods in each data group.
4.2. Slope-soaring observations
This category includes all observations made on Bird Island up to 1 January 1980, from observation sites 1-4. These sites were at heights between 60 and 120 m above sea level, along the ridge that forms the 'spine' of the southwestern part of the island. This area was well
FLIGHT OF PETRELS AND ALBATROSSES 83
populated with albatross and giant petrel nests, and most observations were of these species slope-soaring along the ridge.
Observations were made by ornithodolite as described in the preceding paper. The anemo- meter sensing unit was mounted 2 m above the ground on a tubular metal mast. As the cable
allowed the anemometer to be up to 20 m from the ornithodolite, the usual procedure was to
< O, ~~~~~1 2 3 km
FIGURE 5. Map of Bird Island, showing ornithodolite observation sites. Contour interval 200 feet (ca. 61 in).
TABLE 4. NUMBERS OF RUN5 AND OBSERVATIC)NS IN THE THREE GROUPS OF DATA
slope-soaring flight over sea Bransfield
species runs obs. runs obs. runs obs.
WAN 236 761 76 220 111 631 BBA 147 419 256 737 48 284 GHA 80 276 143 401 13 56 STY 40 171 17 46 0 0 MAC 80 210 52 108 25 99 WCP 37 173 42 101 30 148 CLAP 3 7 220 505 7 29 PRN 14 33 354 792 1 1 WIL 0 0 58 165 31 329 other 36 108 42 80 9 41
total 673 2158 1260 3155 275 1618
place it on an exposed knoll, where a hand anemometer indicated a steady wind, and to put the
ornithodolite (and observer) in a hollow giving some shelter from the wind. Strong winds caused difficulty in observing, because the vibration made it difficult to view the rangefinder image. An improvement in technique would have been to take a light tent with one open side, to act as a shelter from the wind. This would also have allowed observations to continue in light rain, a frequent cause of lost time on Bird Island.
The relation between the wind measured by a mast-mounted anemometer and the wind
6-2

84 C. J. PENNYCUICK
where the birds were flying is somewhat conjectural. The anemometer was always sited on a convex ridge, which would have accelerated the air flow. On the other hand, it was only 2 m from the surface, which would have retarded it. For slope-soaring observations, it was assumed that these opposing effects would roughly balance, and that the anemometer reading was representative of the wind experienced by a bird flying past at about the same height.
The anemometer indicator was read immediately after each run. The speed and direction readings were entered via the computer keyboard, together with the species and activity, and recorded on magnetic tape along with the ornithodolite data for the run. A 'run' consisted of a variable number of speed observations, as explained above.
4.3. Flight over the sea, observedfrom Bird Island
After a hiatus caused by equipment problems, observations were resumed on 17 January 1980. From this day onwards, all remaining observations on Bird Island were made from site 5, on the end of Goney Point, at the southwest tip of the island. On most days a constant stream of birds could be seen from this site, rounding the headland, and flying over the sea within range of the ornithodolite. Usually most of the birds were going westwards towards the open sea. All
species in the study were represented here, with dove prions being the most abundant species. Observations in this group are considered to be representative of flight over the sea, as opposed to slope-soaring over the island.
The observation procedure was the same as for slope-soaring observations, except that it was possible to correct the wind speed for height above the surface. Flying height relative to the ornithodolite could be obtained for each observation from the data. Eye height above the sea at site 5 was estimated on an occasion when a number of cape pigeons were feeding on the surface, at about mid-tide. The mean height was 31.5 m, and the standard deviation 1.5 m. This estimate was used to convert the ornithodolite observations to give flying height above sea level. This procedure is of course subject to errors caused by the tide and the waves. The tidal range was small, the greatest range seen on the jetty at Bird Island being 1.6 m at spring tides. The amplitude of the waves could not be accurately estimated, but would perhaps add a variation of 1.5 m either way to the mean level. Thus the total error anticipated would be of the order of 2 m or less. Interspecific differences of the order of metres should be discernible against this background.
To estimate the wind speed at the bird's flying height, it was assumed that the anemometer reading (V1) was representative of the wind at the same height (hl) over the sea. At the flying height, h2, the wind speed V2 was estimated from the classical wind gradient equation, as given, for instance, by Sutton (1953): V2 V ln(h2/h0)/ln(h1/h0)(
where ho is a scale height indicating the roughness of the surface; ho was taken to be 10-2 m for a very rough sea, 10-3 m for medium-rough, and 10-4 m for a calm sea.
4.4. Ship-borne observations
At sea the ornithodolite was used in the two-dimensional mode, as explained in the preceding paper. Flying height above the surface could not be determined.
Observations were made from the main deck at the stern of the ship, with the axis of the instrument aligned directly astern. Eye height at this station (in calm water) was 7.0 m above the surface. The observing position was sheltered by the helicopter deck immediately above.
FLIGHT OF PETRELS AND ALBATROSSES 85
Two anemometer stations were used. The Mariner 1 anemometer set was mounted by fixing its mast to the rail on the helicopter deck, above the observation position, with the sensing head 10.3 m above the water line. The wind strength and direction were read after each run, in the same way as on land. This arrangement was satisfactory if the relative wind was blowing from the side or from astern. If the relative wind was blowing from ahead, however, the anemometer was affected by turbulence from the ship's superstructure. In this case the ship's anemometer was read before and after each observing session, and the wind was obtained by interpolation, according to the time recorded for each run. The ship's anemometer was mounted on the foremast at a height of 27.2 m above the water line. Relative wind direction was obtained by observing a small wind sock, also mounted on the foremast. The wind sock was viewed from the deck at the foot of the mast, and its direction was assessed with a protractor, relative to some cables that were aligned with the longitudinal axis of the ship.
4.5. Air density
A representative value of air density was calculated for each observation session, from the temperature, pressure and altitude. On Bird Island, air temperatures were observed at the hut, and showed little variation. The extreme daytime temperatures observed on the entire visit were + 1.0 ?C and + 7.0 ?C, and the temperature seldom changed by more than 3 ?C between early morning and noon. The noon barometric pressure reading was supplied by radio each day from the B.A.S. base at Grytviken, 107 km away on a true bearing of 1080. These readings were corrected for the horizontal pressure gradient by the method given by Wallington (I96I),
with use of the mean wind observed during the session. This correction never amounted to more than 2 mbar (200 Pa). The sealevel density so calculated was then corrected for altitude for observing sites 1-4, while birds observed from site 5 were assumed to be flying at sea level. On Bransfield the air temperature and pressure were read from instruments on the bridge before and after each session, at the same time as the anemometer was read and the ship's heading and speed were obtained.
The mean sealevel air density during the study was 1.24 kg m--, and the extremes were 1.21 and 1.27 kgm-3.
4.6. Reduction of observations
The printed output obtained after the data tapes had been read back consisted of 'raw' encoder readings and times from the ornithodolite. These were first converted into polar coordinates for each observation; consisting of an azimuth angle (A), measured right or left of the centre line (positive or negative respectively), an elevation angle (E), measured above or below the horizontal, a range (R), and a time (t). Figure 6 shows these coordinates for two successive observations. The polar coordinates were converted into Cartesian coordinates x, y and z as shown in figure 6. By comparing the coordinates for successive observations, the straight-line distance and track, as projected on a horizontal surface, were calculated for each pair of observations. These, together with the elapsed time, allowed the groundspeed vector to be calculated. The height relative to the ornithodolite was also calculated for each observation, followed by the height increment between each pair of observations, and the vertical speed. During operation, the zero-azimuth line of the ornithodolite, which was also the centre line, was aligned with some landmark, whose magnetic bearing was recorded. Track directions were subsequently made relative to magnetic north. The wind vector was recorded for each run, also
86 C. J. PENNYCUICK
relative to magnetic north, and was combined with the groundspeed vector to give the airspeed vector.
The calculation was a little more complicated for ship-borne observations, on account of the motion of the ship. As explained in the preceding paper, the azimuth readings were corrected automatically for the yawing of the ship, before being recorded. The distance flown between successive observations, relative to the ship, was first computed, and the ship's speed and heading was then added vectorially to this, to give the ground distance flown, and the ground- speed vector. The recorded wind vector was the wind relative to the ship, and had first to be converted to the true wind, at the anemometer height ('masthead wind'), and then corrected, by applying equation (5), to give the estimated wind at the bird's flying height. As the latter could not be directly measured, 'typical' flying heights had to be assumed for each species.
Centre line
FIGURE 6. Polar and Cartesian coordinate systems used in the reduction of ornithodolite output (see text).
Apart from allowing for assumed interspecific differences, this correction also compensated appropriately for the two different anemometer positions used, as described above. The correc- ted wind vector was combined with the groundspeed vector to give the airspeed vector. Tracks, headings and wind directions were made relative to true rather than magnetic north in ship- borne operation, because the output of the ship's gyro compass was in this form.
The data from small samples of runs were reduced in the field, with the help of a Hewlett Packard HP-67 card-programmable calculator. However the bulk of the analysis was done later with an RML 380Z computer at Bristol. The raw printed data were transcribed by hand to disc files in this machine. Listings of these files were checked against duplicate copies of the original data (all the data, not samples). Finally, computer checks were made for transcription errors that would have resulted in recognizable anomalies in the data. While no system of transcribing data is completely immune from error, it is believed that these precautions have kept errors to a very low level.
5. FLIGHT OBSERVATIONS: RESULTS
5. 1. Types of flight
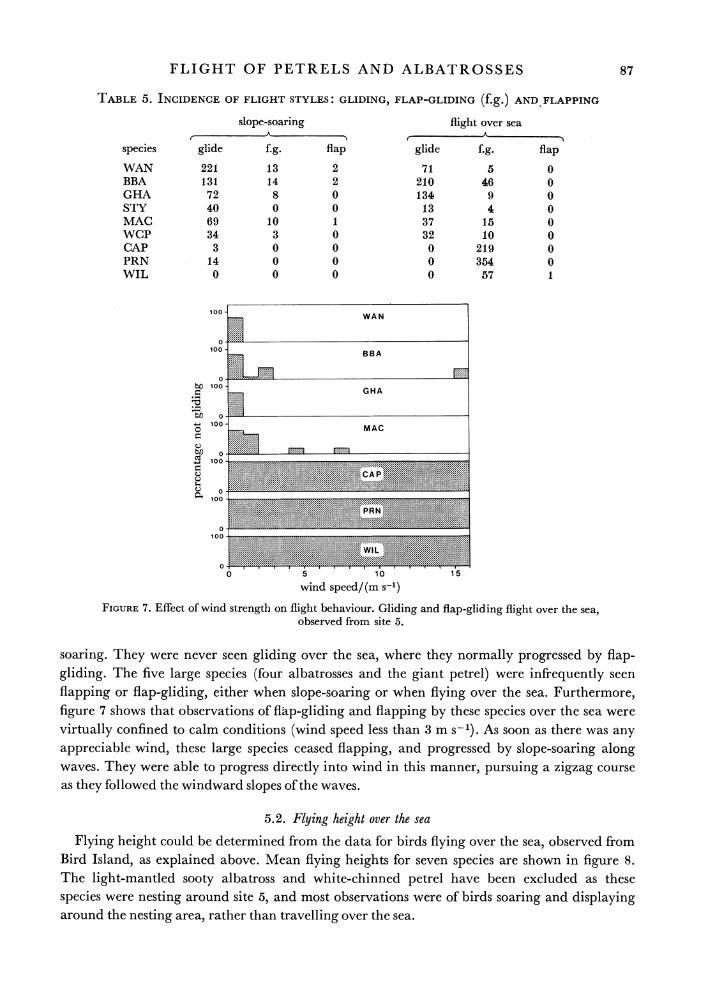
Three types of steady flight were distinguished, gliding, flap-gliding and flapping. Flap- gliding consisted of a regular alternation between short periods of flapping and gliding, the former comprising only a few wing beats at a time.
Some interspecific differences in flight style can be seen at once from table 5. The three smallest species, the cape pigeon, dove prion and Wilson's petrel, were infrequently seen slope-
FLIGHT OF PETRELS AND ALBATROSSES 87
TABLE 5. INCIDENCE OF FLIGHT STYLES: GLIDING, FLAP-GLIDING (f.g.) AND FLAPPING
slope-soaring flight over sea A , . A
species glide f.g. flap glide f.g. flap
WAN 221 13 2 71 5 0 BBA 131 14 2 210 46 0 GHA 72 8 0 134 9 0 STY 40 0 0 13 4 0 MAC 69 10 1 37 15 0 WCP 34 3 0 32 10 0 CAP 3 0 0 0 219 0 PRN 14 0 0 0 354 0 WIL 0 0 0 0 57 1
100 - WAN
100 MBBAC
b 0
5 100
CHAP
100
100
0 5 10 15
wind speed/(m s 1)
FIGURE 7. Effect of wind strength on flight behaviour. Gliding and flap-gliding flight over the sea, observed from site 5.
soaring. They were never seen gliding over the sea, where they normally progressed by flap- gliding. The five large species (four albatrosses and the giant petrel) were infrequently seen flapping or flap-gliding, either when slope-soaring or when flying over the sea. Furthermore, figure 7 shows that observations of flap-gliding and flapping by these species over the sea were virtually confined to calm conditions (wind speed less than 3 m s-1). As soon as there was any appreciable wind, these large species ceased flapping, and progressed by slope-soaring along waves. They were able to progress directly into wind in this manner, pursuing a zigzag course as they followed the windward slopes of the waves.
5.2. Flying height over the sea
Flying height could be determined from the data for birds flying over the sea, observed from Bird Island, as explained above. Mean flying heights for seven species are shown in figure 8. The light-mantled sooty albatross and white-chinned petrel have been excluded as these species were nesting around site 5, and most observations were of birds soaring and displaying around the nesting area, rather than travelling over the sea.

88 C. J. PENNYCUICK
Figure 8 shows a marked difference between the small species, flying at 1.3 to 1.4 m above the surface, and the large species at 3.2 to 7.7 m. As most of the observations were of birds flying against the wind, the effect was to reduce the wind speed for the smaller species, so that they were able to progress in spite of their lower airspeeds. No observations were obtained of birds being blown along by strong tail winds, and one might anticipate that the small species would fly higher in these circumstances.
1 WAN I
X~~~~~~~ 4 - 0
WIL I CP MAC GHIBA
CAP
0 _2 3
FIGURE 8. Mean height above sea level of birds observed gliding and flap-gliding from site 5. Vertical bars represent one standard deviation above and below the mean.
20 - 0 1
++ ++ ++4 +1 +
+ ~~++
-0 -10 0 1
(groundspeed - airspeed)/(m s-1)
FIGURE 9. Airspeed variation in response to wind in the black-browed albatross. Gliding and flap-gliding flight over the sea, observed from site 5.
5.3. Response to head and tail winds
It is well known that migrating birds increase their airspeed when flying against a head wind, a stratagem that is easily understood in terms of fuel economy (Pennycuick 1975). The magni- tude of the airspeed adjustment has been predicted (Pennycuick 1978), on the basis of a simpli- fied model relating power consumption in horizontal flight to air speed. The prediction was
presented in the form of a curve of Va against Vg -Va, where Va is the airspeed and Vg the groundspeed. The use of the scalar difference Vg -Va to represent the wind speed is explained

FLIGHT OF PETRELS AND ALBATROSSES 89
further in ? 6.2 below. In the interests of generality, dimensionless speeds were used, obtained by dividing the actual speeds by the estimated minimum power speed for the particular species.
Figures 9 and 10 are plots showing the effect for two species, the black-browed albatross and
dove prion, observed from site 5, flying over the sea. Gliding and flap-gliding observations have
been combined, but in fact the albatrosses were nearly all gliding, whereas the prions were all
flap-gliding (table 5). Most of the observations refer to birds flying against head winds (negative values on the abscissa), and no observations were obtained of birds being blown along by strong tail winds. Linear regression lines are shown, and, although these are dimensioned plots, it can be seen that they exhibit a negative slope in general agreement with the prediction.
20
_ + + _
O~~~~~~~~~~~~~~~+0 _+ 1Es, t.+1, + 1. 10
-20 -10 0 10 (groundspeed - airspeed)/(m s-1)
FIGURE 10. Airspeed variation in response to wind in the dove prion. Gliding and flap-gliding flight over the sea, observed from site 5.
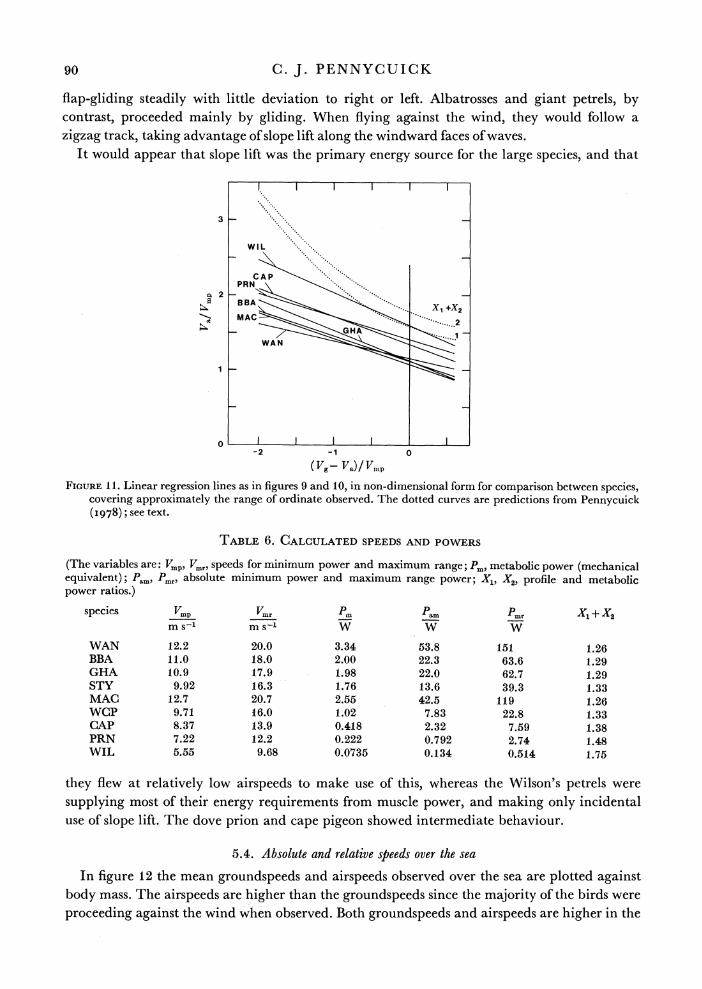
In figu^re 11 the regression lines have been converted into non-dimensional form, and plotted together for seven of the nine species (excluding white-chinned petrel and sooty albatross). Also shown are predicted curves from Pennycuick (I978), for two values of X1 + X2. These are the 'profile power ratio' and 'metabolic power ratio' respectively, and are constants defined on the assumption that profile power and metabolic power are independent of speed. X1 is also assumed to be independent of mass, whereas X2 declines with increasing mass. That is, large birds are assumed to devote a smaller proportion of their total energy expenditure to basal metabolism than do small birds. Estimated values of X1 + X2 for each species, obtained by using estimates of X1 and X2 from Pennycuick (1975), are shown in table 6, from which it can be seen that the values for all species should lie between the two dotted curves shown in figure 11.
It is immediately apparent that all species were flying more slowly than predicted, and also
that the slopes of the regression lines are less than predicted. The discrepancy in speed is least
in the smallest species, Wilson's petrel, and becomes progressively greater in the larger species. These discrepancies could be due to errors in calculating the minimum power speeds, or in
the theory defining the shape of the curve of power against speed. However, they can be
understood even if no such errors are assumed. The predicted curves are calculated on the
assumption that the bird flies steadily along, at the speed that will maximize the ratio of distance covered to fuel consumed. Wilson's petrels approximated most closely to this behaviour,
90 C. J. PENNYCUICK
flap-gliding steadily with little deviation to right or left. Albatrosses and giant petrels, by contrast, proceeded mainly by gliding. When flying against the wind, they would follow a zigzag track, taking advantage of slope lift along the windward faces of waves.
It would appear that slope lift was the primary energy source for the large species, and that
3
2 -2-0
( Vg V a)I VnP
FIGURE 11. Linear regression lines as in figures 9 and 10, in non-dimensional form for comparison between species, covering approximately the range of ordinate observed. The dotted curves are predictions from Pennycuick (1978); see text.
TABLE 6. CALCULATED SPEEDS AND POWERS
(The variables are: Vmp, Vmr, speeds for minimum power and maximum range; Pm metabolic power (mechanical equivalent); Pam, Pmr, absolute minimum power and maximum range power; X1, X'2, profile and metabolic power ratios.)
species Vmp Vmr Pm Pam 2mr
WAN 12.2 20.0 3.34 53.8 151 1.26 BBA 11.0 18.0 2.00 22.3 63.6 1.29 GHA 10.9 17.9 1.98 22.0 62.7 1.29 STY 9.92 16.3 1.76 13.6 39.3 1.33 MAC 12.7 20.7 2.55 42.5 119 1.26 WCP 9.71 16.0 1.02 7.83 22.8 1.33 CA\P 8.37 13.9 0.418 2.32 7.59 1.38 PRN 7.22 12.2 0.222 0.792 2.74 1.48 WIL 5.55 9.68 0.0735 0.134 0.514 1.75
they flew at relatively low airspeeds to make use of this, whereas the Wilson's petrels were supplying most of their energy requirements from muscle power, and making only incidental use of slope lift. The dove prion and cape pigeon showed intermediate behaviour.
5.4. Absolute and relative speeds over the sea
In figure 12 the mean groundspeeds and airspeeds observed over the sea are plotted against body mass. The airspeeds are higher than the groundspeeds since the majority of the birds were proceeding against the wind when observed. Both groundspeeds and airspeeds are higher in the

FLIGHT OF PETRELS AND ALBATROSSES 91
larger species. However, when these absolute speeds are converted into dimensionless relative speeds, by dividing by the minimum power speed, the means decline from 1.89 for Wilson's petrel to 1.20 for the giant petrel. Relative maximum range speeds, estimated by the method of Pennycuick (1975), are also shown in figure 12. It can be seen that only in Wilson's petrel does the observed mean airspeed approach the maximum range speed. In the larger species it becomes progressively less. Although the absolute speeds are high in the large species, these
MAC* a
GHA WAN-
CAP *.
12 C A P ...... . - ----- . BBA PRN . .MAC . b
I WIL *b LOI) ~~~~~~~BBA. WAN
CAP G..... - ..* * GHA
PR N..
8 - ... -
8 WIL
6- 2.0-
1.8 - WIL
* ....*. . BBA WA NC
. 1.6. - PRN GHA MAC -
LOI) ~~~~CAP
GHA WAN d
1.2 L . _*-,N 1.2
~~~~~~~~BBA MAC
-. .I . . I 1 ,. .I.. I I 0.05 0.1 0.5 1 5 10
mass/kg
FIGURE 12. Upper: (a) mean airspeeds, (b) mean groundspeeds for flight over the sea, observed from site 5. Lower: Speeds expressed in non-dimensional form. (c) Calculated still-air maximum range speed. (d) Observed mean airspeed, as above.
birds fly slowly in relation to their minimum power speeds. This is consistent with the interpre- tation that, although all species extract some energy from slope lift and augment this by muscular exertion, the emphasis is different in different species. The smallest species are behav- ing nearly as one would expect for a bird cruising under power, whereas the largest are flying at low relative speeds, in a manner consistent with slope-soaring along waves.
5.5. Airspeed distributions
The distribution of airspeeds shows interesting differences between slope-soaring birds and birds flying over the sea (observed from land) in the larger species that were observed in both situations. Figure 13 shows airspeed distributions for the wandering albatross. The mean air- speed is lower in the slope-soaring data, and the standard deviation is greater. The distribution
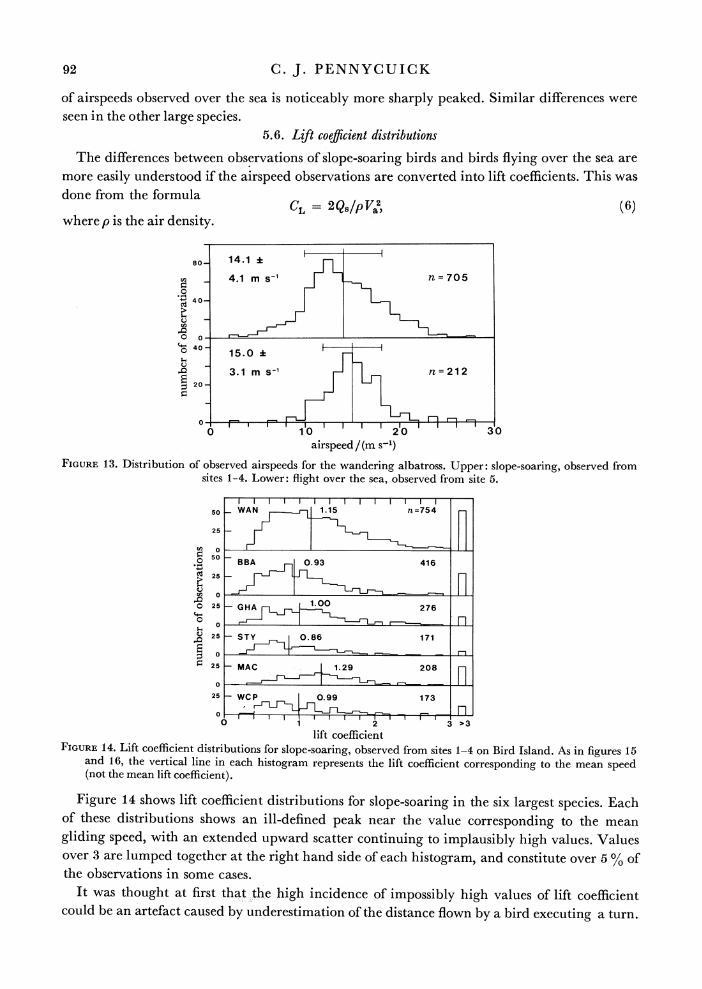
92 C. J. PENNYCUICK
of airspeeds observed over the sea is noticeably more sharply peaked. Similar differences were seen in the other large species.
5.6. Lift coefficient distributions
The differences between observations of slope-soaring birds and birds flying over the sea are more easily understood if the airspeed observations are converted into lift coefficients. This was done from the formula
CL= 2 QS/p Va2, (6) where p is the air density.
80- 14.1 i
4.1 m s-' n=705 -0 +- 4 0
o 0-
40 15.0*
3.1 m s-I n m212 20-
00F 1 0 2 0 30 airspeed/ (m s-1)
FIGURE 13. Distribution of observed airspeeds for the wandering albatross. Upper: slope-soaring, observed from sites 1-4. Lower: flight over the sea, observed from site 5.
50 _ WA N 1.1 5 n =75 4 l_
25-
0 50-
-.0 BBA 0.93 416
0 25 - GHA=0 276 n o ft
5 25 STY 0.86 171
25s - MAC 1.29 208 1
25 - WCp 0.99 173
1 2 ~~~~~3 >3
lift coefficient FIGURE 14. Lift coefficient distributions for slope-soaring, observed from sites 1-4 on Bird Island. As in figures 15
and 16, the vertical line in each histogram represents the lift coefficient corresponding to the mean speed (not the mean lift coefficient).
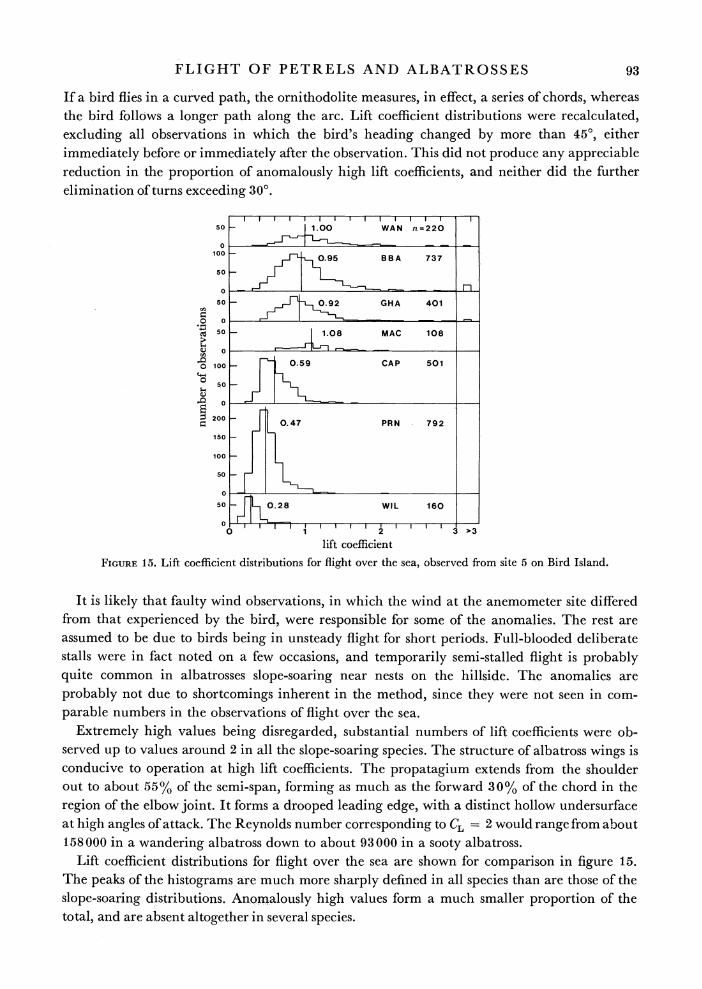
Figure 14 shows lift coefficient distributions for slope-soaring in the six largest species. Each of these distributions shows an ill-defined peak near the value corresponding to the mean gliding speed, with an extended upward scatter continuing to implausibly high values. Values over 3 are lumped together at the right hand side of each histogram, and constitute over 5 % of the observations in some cases.
It was thought at first thatf the high incidence of impossibly high values of lift coefficient could be an artefact caused by underestimation of the distance flown by a bird executing a turn.
FLIGHT OF PETRELS AND ALBATROSSES 93
If a bird flies in a curved path, the ornithodolite measures, in effect, a series of chords, whereas the bird follows a longer path along the arc. Lift coefficient distributions were recalculated, excluding all observations in which the bird's heading changed by more than 450, either immediately before or immediately after the observation. This did not produce any appreciable reduction in the proportion of anomalously high lift coefficients, and neither did the further elimination of turns exceeding 300.
50 _ 1.00 WAN n=220
0
100 _ p__ nm 0.95 BBA 737
50 -
0 - r 50 -0.92 GHA 401
0
50 - 08 MAC 108
V0
o i0o CAP 501 C-4
050 - m02 I 6
50
0 200 .47PRN 792
150-
100-
50
50 - 28 ~~~WIL 160
0) r | W I 1 2 r r ,>3
lift coefficient
FIGURE 15. Lift coefficient distributions for flight over the sea, observed from site 5 on Bird Island.
It is likely that faulty wind observations, in which the wind at the anemometer site differed from that experienced by the bird, were responsible for some of the anomalies. The rest are assumed to be due to birds being in unsteady flight for short periods. Full-blooded deliberate stalls were in fact noted on a few occasions, and temporarily semi-stalled flight is probably quite common in albatrosses slope-soaring near nests on the hillside. The anomalies are probably not due to shortcomings inherent in the method, since they were not seen in com- parable numbers in the observations of flight over the sea.
Extremely high values being disregarded, substantial numbers of lift coefficients were ob- served up to values around 2 in all the slope-soaring species. The structure of albatross wings is conducive to operation at high lift coefficients. The propatagium extends from the shoulder out to about 55% of the semi-span, forming as much as the forward 30% of the chord in the region of the elbow joint. It forms a drooped leading edge, with a distinct hollow undersurface at high angles of attack. The Reynolds number corresponding to CL= 2 would range from about 158000 in a wandering albatross down to about 93000 in a sooty albatross.
Lift coefficient distributions for flight over the sea are shown for comparison in figure 15. The peaks of the histograms are much more sharply defined in all species than are those of the slope-soaring distributions. Anomalously high values form a much smaller proportion of the total, and are absent altogether in several species.

94 C. J. PENNYCUICK
There is a very marked difference in the values corresponding to mean airspeeds in different species, ranging from around 1 in the large species down to 0.28 in Wilson's petrel. This corresponds to the fact, noted above, that the small species fly at higher relative speeds than the large species. The observations being compared in figure 15 are actually not homogeneous, since the three smallest species were flap-gliding, whereas the larger species were mainly gliding. However, it was noted above that flap-gliding speeds were lower than gliding speeds in species
75 -
0.77 WAN n=576 50
25-
0.70 BBA 276 25
o 25 0.78 M AC 95
25 0.6 WCp 148
~0
0
25- 0.84 CAP 29
75 0.40 WIL 316
50-
25-
lift coefficient
FIGURE 16. Lift coefficient distributions for observations made at sea from R.R.S. Bransfield.
where they could be compared. This would tend to raise the values of lift coefficient observed in the small, flap-gliding species, where the lift coefficient refers, of course, to the gliding phase of flight. Thus the very pronounced dependence of lift coefficient on size occurs in spite of differences in flight style, not because of them.
Distributions of lift coefficients from ship-borne observations are shown in figure 16. The four large species represented in these data show lower mean lift coefficients than those observed from Bird Island for birds flying over the sea, but the reverse is the case for the cape pigeon and Wilson's petrel. In spite of the low mean values for the large species, the histograms show a wide scatter, and a high incidence of improbably high values, reminiscent of the results from slope- soaring observations.
These apparently conflicting characteristics are probably due to the non-homogeneous nature of the ship-borne observations. Ihe birds were generally following the ship, often approaching from some distance astern. While trying to catch up with the ship, they would most probably be flying faster than usual, so accounting for the high incidence of low values of lift coefficient, and the low mean values. On arriving close astern, birds would fly more slowly, and perform search manoeuvres as they looked for scraps thrown from the ship, which may be partly responsible for the low speed (high CL) observations. Also airspeed errors may have been caused by the birds flying in air influenced by the proximity of the ship, and this is the most likely reason for the high incidence of anomalously large lift coefficients.
It is concluded that the measurements on birds flying over the sea, observed from Bird
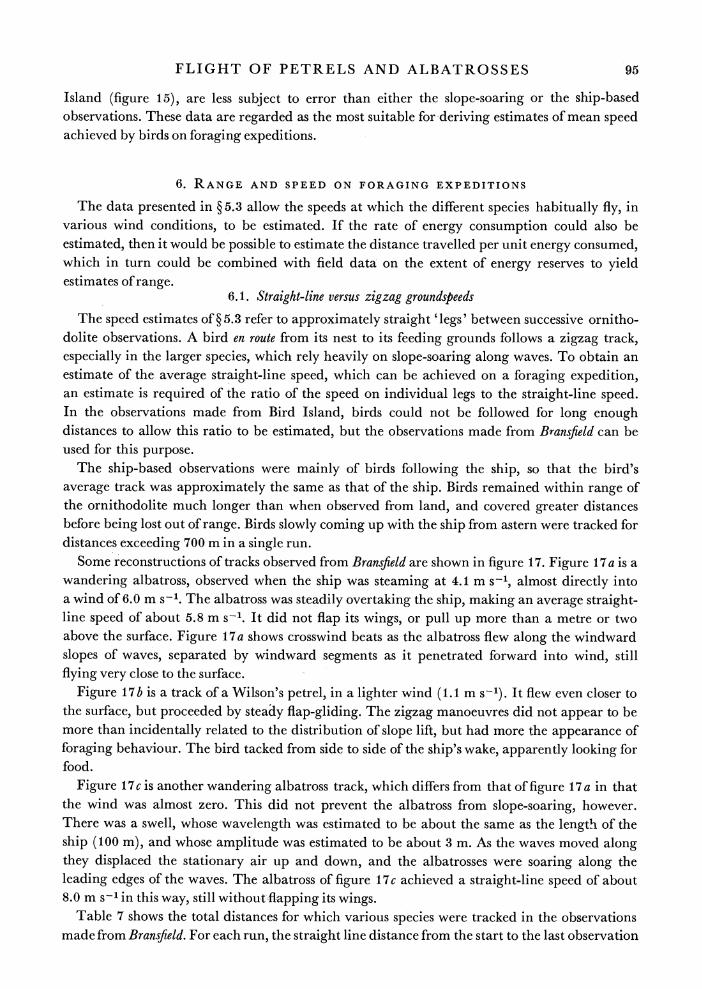
FLIGHT OF PETRELS AND ALBATROSSES 95
Island (figure 15), are less subject to error than either the slope-soaring or the ship-based observations. These data are regarded as the most suitable for deriving estimates of mean speed achieved by birds on foraging expeditions.
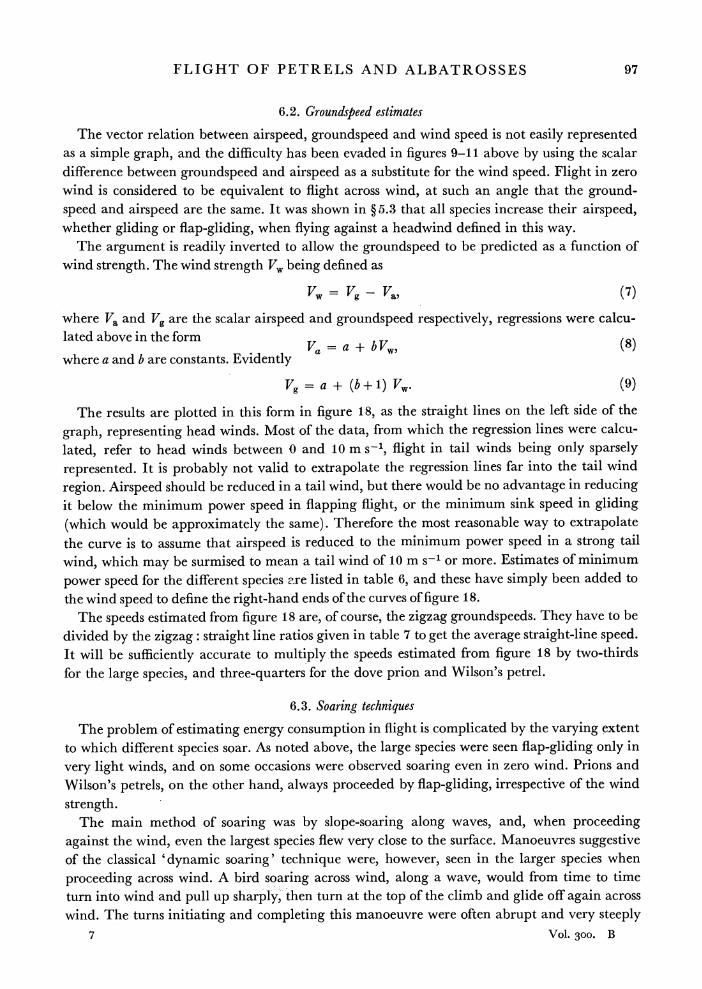
6. RANGE AND SPEED ON FORAGING EXPEDITIONS
The data presented in ? 5.3 allow the speeds at which the different species habitually fly, in various wind conditions, to be estimated. If the rate of energy consumption could also be estimated, then it would be possible to estimate the distance travelled per unit energy consumed, which in turn could be combined with field data on the extent of energy reserves to yield estimates of range.
6. 1. Straight-line versus zigzag groundspeeds The speed estimates of? 5.3 refer to approximately straight 'legs' between successive ornitho-
dolite observations. A bird en route from its nest to its feeding grounds follows a zigzag track, especially in the larger species, which rely heavily on slope-soaring along waves. To obtain an estimate of the average straight-line speed, which can be achieved on a foraging expedition, an estimate is required of the ratio of the speed on individual legs to the straight-line speed. In the observations made from Bird Island, birds could not be followed for long enough distances to allow this ratio to be estimated, but the observations made from Bransfield can be used for this purpose.
The ship-based observations were mainly of birds following the ship, so that the bird's average track was approximately the same as that of the ship. Birds remained within range of the ornithodolite much longer than when observed from land, and covered greater distances before being lost out of range. Birds slowly coming up with the ship from astern were tracked for distances exceeding 700 m in a single run.
Some reconstructions of tracks observed from Bransfield are shown in figure 17. Figure 17 a is a wandering albatross, observed when the ship was steaming at 4.1 m s-1, almost directly into a wind of 6.0 m s-1. The albatross was steadily overtaking the ship, making an average straight- line speed of about 5.8 m s-1. It did not flap its wings, or pull up more than a metre or two above the surface. Figure 17a shows crosswind beats as the albatross flew along the windward slopes of waves, separated by windward segments as it penetrated forward into wind, still flying very close to the surface.
Figure 17b is a track of a Wilson's petrel, in a lighter wind (1.1 m s-1). It flew even closer to the surface, but proceeded by steady flap-gliding. The zigzag manoeuvres did not appear to be more than incidentally related to the distribution of slope lift, but had more the appearance of foraging behaviour. The bird tacked from side to side of the ship's wake, apparently looking for food.
Figure 1 7c is another wandering albatross track, which differs from that of figure 17 a in that the wind was almost zero. This did not prevent the albatross from slope-soaring, however. There was a swell, whose wavelength was estimated to be about the same as the length of the ship (100 m), and whose amplitude was estimated to be about 3 m. As the waves moved along they displaced the stationary air up and down, and the albatrosses were soaring along the leading edges of the waves. The albatross of figure 17c achieved a straight-line speed of about 8.0 m s-4 in this way, still witho-ut;flapping its wings.
Table 7 shows the total distances for which various species were tracked in the observations made from Bransfield. For each run, the straight line distance from the start to the last observation

96 C. J. PENNYCUICK
was calculated, and the zigzag distance was also found. These total distances, and the zigzag: straight line ratio, are shown for each species in table 7. This ratio was between 1.47 and 1.55 for the large species, down to and including the white-chinned petrel, and 1.33 to 1.34
for the cape pigeon and Wilson's petrel.
(C) 27.5
55.5
0
\ /.2 m s-
0 100 200 30 4004m
0~~~~~~~~~~~~~ 40.5
26.3
6 1.1
0
0 (a) * 6.2.348.
32.7 42 0 ~~~~~~~6.0 ms-1
.~~~~~~~~~5 o ioo 200 300 400 m
FIGURE 17. Reconstructed tracks observed from R.R.S. Bransfield, as described in the text. The tracks have been rotated so that the ship's direction of travel is from left to right in each case. The arrows represent the wind strength and direction (zero in (c)). Times are shown in seconds from start.
TABLE 7. STRAIGHT AND ZIGZAG DISTANCES, OBSERVED FROM BRANSFIELD, FOR RUNS
OF FIVE OBSERVATIONS OR MORE
number distance/km of zigzag: straight
species runs zigzag straight ratio
WAN 51 18.3 12.2 1.50 BBA 26 9.02 5.85 1.54 GHA 6 1.62 1.11 1.47 MAC 7 1.92 1.24 1.55 WCP 12 4.08 2.73 1.49 CAP 2 0.49 0.37 1.33 WIL 23 9.41 7.02 1.34
It would be difficult to devise a statistical procedure to test whether or not this difference
between small and large species is significant. It could be a genuine effect, caused by a difference
between direct flapping flight in the small species, as opposed to zigzag slope-soaring along waves in the large species. The ratio is likely to be biased upwards in all species, on account of
some runs that ended in the bird turning away astern.
Be that as it may, the results can be used to give a rough indication of the groundspeed achievable by various species, in-various winds, on foraging expeditions.
FLIGHT OF PETRELS AND ALBATROSSES 97
6.2. Groundspeed estimates
The vector relation between airspeed, groundspeed and wind speed is not easily represented
as a simple graph, and the difficulty has been evaded in figures 9-11 above by using the scalar
difference between groundspeed and airspeed as a substitute for the wind speed. Flight in zero
wind is considered to be equivalent to flight across wind, at such an angle that the ground-
speed and airspeed are the same. It was shown in ? 5.3 that all species increase their airspeed,
whether gliding or flap-gliding, when flying against a headwind defined in this way.
The argument is readily inverted to allow the groundspeed to be predicted as a function of
wind strength. The wind strength Vw being defined as
Vw = Vg - Va, (7)
where Va and Vg are the scalar airspeed and groundspeed respectively, regressions were calcu-
lated above in the form Va = a + b VW) (8)
where a and b are constants. Evidently
Vg= a + (b+1) Vw (9)
The results are plotted in this form in figure 18, as the straight lines on the left side of the
graph, representing head winds. Most of the data, from which the regression lines were calcu-
lated, refer to head winds between 0 and 10 m s-', flight in tail winds being only sparsely
represented. It is probably not valid to extrapolate the regression lines far into the tail wind
region. Airspeed should be reduced in a tail wind, but there would be no advantage in reducing
it below the minimum power speed in flapping flight, or the minimum sink speed in gliding
(which would be approximately the same). Therefore the most reasonable way to extrapolate
the curve is to assume that airspeed is reduced to the minimum power speed in a strong tail
wind, which may be surmised to mean a tail wind of 10 m s-1 or more. Estimates of minimum
power speed for the different species are listed in table 6, and these have simply been added to
the wind speed to define the right-hand ends of the curves of figure 18.
The speeds estimated from figure 18 are, of course, the zigzag groundspeeds. They have to be
divided by the zigzag: straight line ratios given in table 7 to get the average straight-line speed.
It will be sufficiently accurate to multiply the speeds estimated from figure 18 by two-thirds
for the large species, and three-quarters for the dove prion and Wilson's petrel.
6.3. Soaring techniques
The problem of estimating energy consumption in flight is complicated by the varying extent
to which different species soar. As noted above, the large species were seen flap-gliding only in
very light winds, and on some occasions were observed soaring even in zero wind. Prions and
Wilson's petrels, on the other hand, always proceeded by flap-gliding, irrespective of the wind
strength. The main method of soaring was by slope-soaring along waves, and, when proceeding
against the wind, even the largest species flew very close to the surface. Manoeuvres suggestive
of the classical 'dynamic soaring' technique were, however, seen in the larger species when
proceeding across wind. A bird soaring across wind, along a wave, would from time to time
turn into wind and pull up sharply, then turn at the top of the climb and glide off again across
wind. The turns initiating and completing this manoeuvre were often abrupt and very steeply 7 Vol. 300. B

98 C. J. PENNYCUICK
banked, up to 700. This behaviour was seen in all the albatross species, and also in the giant petrel and white-chinned petrel. Cape pigeons were seen behaving in a similar way, but only close astern of the ship, in a region where the airflow could have been modified by the proximity of the ship. Prions were seen pulling up, but to a much lower height than the larger species.
Since elevation measurements could not be obtained from the ornithodolite in its ship-borne mode, owing to the lack of a stable horizontal reference, it was not possible to measure the height of these 'pullups' directly. However, rough estimates were obtained by observing from
20
"0 MA
0 I _ _ _ _ _ _ _ _
-10 0 10 wind/(m s1l)
FIGURE 18. Predicted groundspeed versus 'wind', here defined as the scalar difference between groundspeed and airspeed. The straight lines at left are derived from the regressions of figure 11I, and the curves on the right are extrapolated on the basis explained in the text.
different levels in the ship, the observer's eye level, when standing on different decks, having been determined from a scale drawing of the ship.
6.4. Energy extraction from the wind gradient
The highest pullups were observed on 16 March 1980, in a wind strength (at the masthead) of about 15 m skl Wandering albatrosses were pulling up frequently to about 15 m above the surface, and occasionally to 18-20 m. White-chinned petrels were also pulling up to about the
same height. On other occasions in lighter winds (6-8 m s'l) giant petrels and the smaller albatrosses were seen pulling up to 13-15 m above the surface.
Under the 'dynamic soaring' hypothesis the pullup would be interpreted as a manoeuvre in which energy is extracted from the wind gradient during the climb. A rou-gh idea of the magnitude of the wind gradient required may be obtained by considering a -dragless albatross, gliding upwards, along a flight path inclined at an angle 0i to the horizontal .(figure 19).
Such a bird tends to lose airspeed at a rate g sin jS, corresponding to- the component of its

FLIGHT OF PETRELS AND ALBATROSSES 99
weight directed backwards along the flight path. However, as it climbs into progressively stronger head wind, its airspeed tends to increase as a result of the wind gradient. The magni- tude of the wind gradient, w, is defined as
w = dVw/dh, (10)
where Vw is the wind speed at a height h above the surface; w has the dimensions of time-'. The bird is assumed to climb into wind at an airspeed V., so that its airspeed tends to increase at a rate wVa sin iS. Evidently these opposing tendencies balance if
w = g/Va. (11)
If the wind gradient is stronger than this, the bird can climb, and gain airspeed at the same time. If the wind gradient is weaker than g/ Va the airspeed declines, and the climb must end when the minimum gliding speed is reached. The airspeeds observed in wandering albatrosses
mg sin
{mgh
FIGURE 19. The upwind climb in 'dynamic soaring'.
were mostly between 14 and 20 m s-1. Therefore a wind gradient of at least 0.5-0.7 s-1 would be required to sustain airspeed in a windward climb, even in a dragless albatross.
The magnitude of the wind gradient as a function of height above the surface can be esti- mated by differentiating equation (5), thus:
w = dVW/dh = V2/{hln(h2/h0)}, (12)
where V2 is the wind speed at a reference height h2, and ho is the roughness scale height, as before. In figure 20 the wind speed from equation (5) is plotted against height above the surface for three cases, in which the reference wind at a height of 25 m is 5, 10 and 15 m s-1 respectively. The strength of the wind gradient, from equation (12), is plotted on the same diagram. It can be seen that, even in the strongest wind considered, a wind gradient of 0.5 s-1 or more is only to be expected up to a height of 3 m above the surface, which is about five times less than the height of the observed pullups. At 15 m above the surface, wind gradients of only 0.1 s-1 or so are expected, and this is not nearly enough to sustain airspeed in a windward climb.
Wilson (I 975) has proposed a different interpretation of the pullups performed by albatrosses. He suggests that the bird accelerates to the highest speed it can attain, by gliding along a wave in the zone of strongest slope lift, and then simply converts its excess kinetic energy into potential energy, pulling up at the expense of losing airspeed. The manoeuvre is seen as a means of leaving one wave and crossing to another, rather than a method of gaining energy in itself. To invoke the dragless albatross once again, if it accelerates to a speed V1 at a height h1 above
7-2
100 C. J. PENNYCUICK
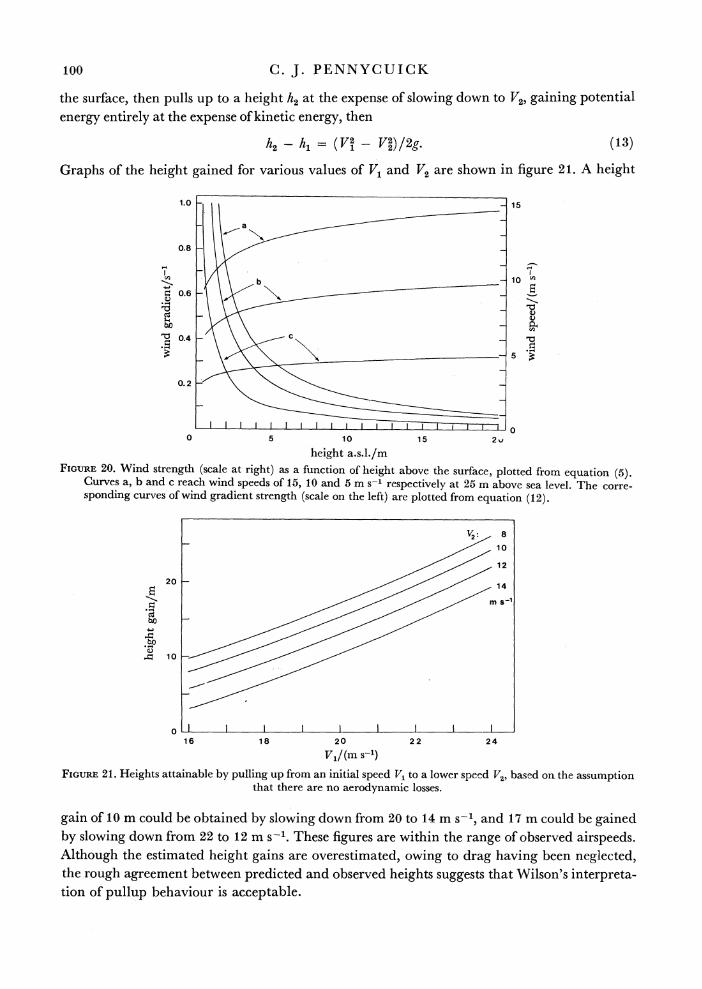
the surface, then pulls up to a height h2 at the expense of slowing down to V2, gaining potential energy entirely at the expense of kinetic energy, then
h2- h = (V2 - V2)/2g. (13)
Graphs of the height gained for various values of V1 and V2 are shown in figure 21. A height
1.0 5 15
0.8
b ~~~~~~~~~~~~~10 "
0.6 -
0. 4 - "
5
0
0 5 1 0 1 52
height a.s.l./m FIGURE 20. Wind strength (scale at right) as a function of height above the surface, plotted from equation (5).
Curves a, b and c reach wind speeds of 15, 10 and 5 m s-1 respectively at 25 m above sea level. The corre- sponding curves of wind gradient strength (scale on the left) are plotted from equation (12).
1 0
12
20 14
V1/(m s'l)
FIGURE 21. Heights attainable by pulling up from an initial speed V1 to a lower speed J7,, based on the assumption that there are no aerodynamic losses.
gain of 10 m could be obtained by slowing down from 20 to 14 m s-', and 17 m could be gained by slowing down from 22 to 12 m s-1. These figures are within the range of observed airspeeds. Although the estimated height gains are overestimated, owing to drag having been neglected, the rough agreement between predicted and observed heights suggests that Wilson's interpreta- tion of pullup .behaviour is ac.c.eptable.
FLIGHT OF PETRELS AND ALBATROSSES 101
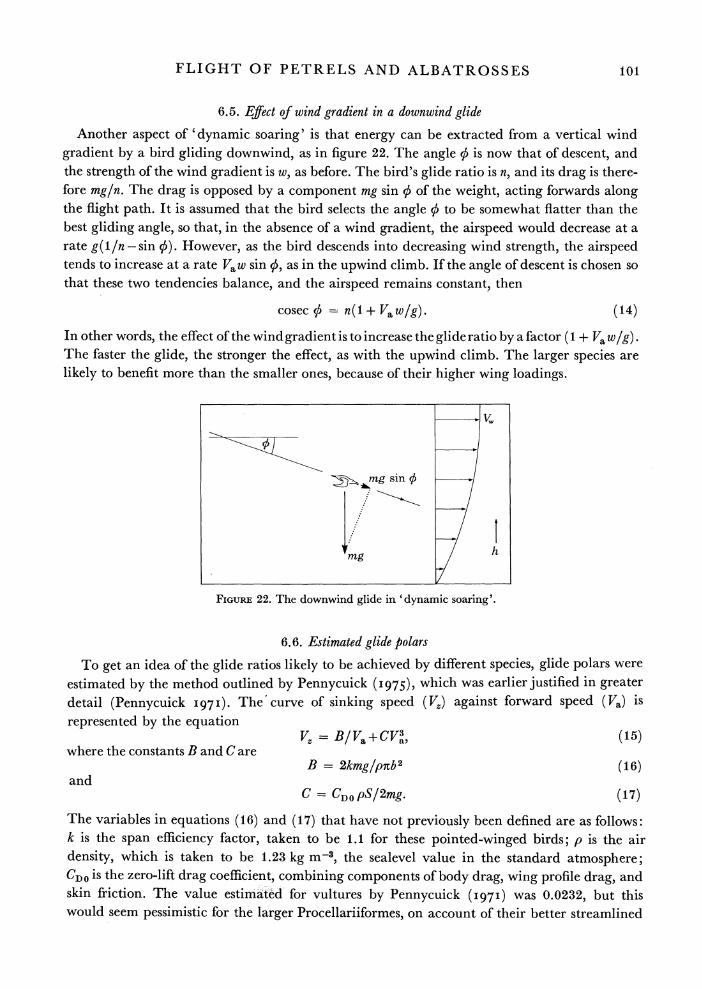
6.5. Effect of wind gradient in a downwind glide
Another aspect of 'dynamic soaring' is that energy can be extracted from a vertical wind gradient by a bird gliding downwind, as in figure 22. The angle 0 is now that of descent, and the strength of the wind gradient is w, as before. The bird's glide ratio is n, and its drag is there- fore mg/n. The drag is opposed by a component mg sin 0 of the weight, acting forwards along the flight path. It is assumed that the bird selects the angle 0 to be somewhat flatter than the best gliding angle, so that, in the absence of a wind gradient, the airspeed would decrease at a rate g(1 /n - sin q5). However, as the bird descends into decreasing wind strength, the airspeed tends to increase at a rate Vaw sin 0, as in the upwind climb. If the angle of descent is chosen so that these two tendencies balance, and the airspeed remains constant? then
cosecq5 = n(1 + V.w/g). (14)
In other words, the effect of the wind gradient is to increase the glide ratio by a factor (1 + Va w/g). The faster the glide, the stronger the effect, as with the upwind climb. The larger species are likely to benefit more than the smaller ones, because of their higher wing loadings.
mg sin
4~~~~~~~~~~~~~~~~~~~~~~~~~~~~~~~~~~
mgh
FIGURE 22. The downwind glide in 'dynamic soaring'.
6.6. Estimated glide polars
To get an idea of the glide ratios likely to be achieved by different species, glide polars were estimated by the method outlined by Pennycuick (I 975), which was earlier justified in greater detail (Pennycuick I97I). The curve of sinking speed (V,) against forward speed (V,,) is represented by the equation
= B/Va+CV3, (15) where the constants B and C are
B = 2kmg/pitb2 (16) and
C = CDO pS/2mg. (17)
The variables in equations (16) and (17) that have not previously been defined are as follows: k is the span efficiency factor, taken to be 1.1 for these pointed-winged birds; p is the air density, which is taken to be 1.23 kg m-3, the sealevel value in the standard atmosphere; CDO is the zero-lift drag coefficient, combining'components of body drag, wing profile drag, and skin friction. -The value estimated' for vultures by Pennycuick (I97I) was 0.0232, but this would seem pessimistic for the larger Procellariiformes, on account of their better streamlined

102 C. J. PENNYCUICK
bodies and thicker, less cambered wing profiles. In the absence of experimental measurements, a value of 0.020 is assumed for CDO.
Using these values, and the body measurements from table 2, equation (15) has been used to
calculate Vm., the airspeed at which the minimum sinking speed V,O occurs, and Vbg, the speed
at which the maximum glide ratio, nmax, occurs. The results are listed in table 8 for the larger
species, down to the white-chinned petrel.
TABLE 8. GLIDING PERFORMANCE ESTIMATES
(Vms, Vbg, speeds for minimum sink and best glide ratio.)
species Vms min. sink Vbg max. m s' m s- m s-1 glide ratio
WAN 11.9 0.594 15.7 23.2 BBA 10.7 0.568 14.0 21.7 GHA 10.6 0.559 14.0 22.0 STY 9.30 0.479 12.2 22.4 MAC 13.2 0.738 17.4 20.7 WCP 9.59 0.543 12.6 20.4 CAP 8.29 0.508 10.9 18.8 PRN 6.95 0.460 9.15 17.5 WIL 5.19 0.353 6.83 17.0
MAC
80 - WA N
BBA
" 60
"bi 40
0
20
0 0.2 0.4
wind gradient/s'
FIGURE 23. Percentage increase in the glide ratio predicted for the different species in a downwind glide, as a function of wind gradient strength. The airspeed is assumed to be that for best glide ratio in still air.
Figure 23 is calculated from equation (14), and shows the percentage increase in the glide
ratio expected in various species, at various values of the wind gradient w. Each species is
assumed to be flying at its best glide speed (Vbg), as listed in table 8. It can be seen that a wind
gradient of 0.2 s-1 is sufficient to give quite substantial increases in the glide ratio; of the order
of 20-30 %. Reference to figure 20 shows that a wind gradient of this strength may be expected
to extend above 5 m in medium to strong winds. It is to be regretted that no field data were obtained on downwind flight over the sea. It
would appear that a technique approximating the to classical 'dynamic soaring' would be
advantageous downwind. The cycle would begin with a crosswind glide, close to the surface, along a wave,-followed by a pullup in which most or all of the energy for the climb would
be derived indirectly from slope lift. If the bird were to turn into wind for the climb, some

FLIGHT OF PETRELS AND ALBATROSSES 103
additional energy could be obtained from the wind gradient. An extended downwind glide
would follow, in which the glide angle would be progressively flattened as the bird descended
through the strengthening wind gradient. Not much downwind progress would be made during
the crosswind glides and pullups, but the bird would spend relatively little of its time in these phases of the cycle. A large fraction of its time would be spent gliding downwind, at a ground-
speed roughly equal to the sum of the wind speed and Vbg.
Different authors have placed varying amounts of emphasis on the alternative sources of
energy available to soaring seabirds. Magnan (1925) identified slope-soaring along waves as
the primary method of soaring, but other writers have placed greater emphasis on the extraction
of energy from the wind gradient. This somewhat esoteric method of soaring was actually the first to be honoured with formal analysis (Lord Rayleigh I883), and has perhaps attracted a
disproportionate amount of attention for that reason. Idrac (I924) made ship-borne observa-
tions similar in principle to those of the present study, and concluded that soaring, using the
wind gradient alone, should be possible for wandering albatrosses in winds of 6 m s-1 or more,
with pullups to 10-20 m, depending on the wind strength. Cone (I964) aslo concluded that
soaring using this method alone should be feasible, on the basis of a very elaborate theoretical analysis. Wood (I973) reached a similar conclusion from computer simulations of various
possible flight paths, based on reasonable assumptions about the structure of the wind gradient
and the gliding performance of albatrosses. The present observations do not in any way refute the view that albatrosses and the larger
petrels extract energy from the wind gradient in both upwind climbs and downwind descents.
The observations suggest, however, that in practice most of the energy for windward pullups
comes from slope lift, as Wilson (I975) proposed, and relatively little from the wind gradient. The wind gradient may supply relatively more energy in downwind flight, but no direct
observations were obtained to support this.
6.7. Energy consumption in flight
The rate at which energy is consumed in flight may be represented as the sum of two powers, the metabolic power, due to basal metabolism, and the power required for flight as such. The
latter is required both in gliding and in flapping flight, but for different reasons, and scales
differently with body mass in the two types of flight. The metabolic power as used here, Pm, is the mechanical equivalent of the basal metabolic
rate. Metabolic rate measurements as such refer to rates of consumption of chemical energy,
whereas mechanical work is derived from chemical energy, with a certain conversion efficiency,
generally thought to be in the region of 0.2. Pm is therefore taken to be one-fifth of the estimated
(chemical) metabolic rate. The estimnates of Pm given in table 6 have been calculated by the
method given by Pennycuick (I975), which is itself ultimately derived from the regression
equations given by Lasiewski & Dawson (I967). Prince et al. (i98I) estimated metabolic rate
in the black-browed and grey-headed albatrosses, by observing the rates at which incubating
(and therefore fasting) birds lost mass. Their estimates were quite close to the rates predicted by the Lasiewski & Dawson equation.
To begin with gliding, although no actual mechanical work is done, the wings need to be
held in the horizontal position by the pectoralis, muscles, which therefore have to exert a steady (tonic) force. The power needed for this in vultures was estimated by Pennycuick (1971) to be roughly similar in magnitude to the metabolic power. It was also argued that the power needed
104 C. J. PENNYCUICK
to maintain the required force should scale with mass in about the same way as the metabolic power, so that it may validly be expressed as a multiple of the metabolic power, in the manner favoured by physiologists. On this basis it was suggested that the total rate of energy expenditure should be around twice the metabolic power, or somewhat less, in any gliding bird of the same general shape, irrespective of body mass. Later Baudinette & Schmidt-Nielsen ( I974) obtained a similar result experimentally in an unrelated species (Larus argentatus) , so lending some support to the validity of the generalization. Albatrosses, with their high aspect ratio wings, would need relatively more force in the pectoralis tendon, but on the other hand the 'shoulder lock' mechanism described above would reduce the power needed to maintain this force. In the absence of experimental evidence, it will be assumed that Procellariiformes with or without shoulder locks consume twice their metabolic power when gliding.
At the other extreme, cruising flight under power is usually represented as steady flapping flight at the maximum range speed. The mechanical component of the power required to fly at this speed scales more steeply with mass than the metabolic power. The ratio of mechanical to metabolic components is larger in large birds than in small ones, and it is not valid to imply that the total power is a constant multiple of the metabolic power in birds of different mass. This conspicuous fact has been explained in a number of previous publications (Pennycuick 1972, 1975, I978), and no doubt will eventually be recognized in the physiological literature.
Methods of calculating the maximum range speed, and the power required to fly horizontally at that speed, are given by Pennycuick (I975). The speeds and powers so calculated for the nine species in the study are listed in table 6.
6.8. Distance flown per unit energy consumed
On a foraging flight, the distance flown per unit energy consumed is the ratio of the mean straight-line speed to the total power consumption. To calculate the latter for different species it would be necessary to know the proportion of the time spent soaring. This cannot readily be estimated, but the evidence put forward in ? 5.3 above suggests that reasonable assumptions can be made about the smallest and largest species. The albatrosses never flap their wings except in very light winds (and sometimes not even then), and so may fairly be represented as spending the whole of their airborne time gliding. By contrast Wilson's petrel seems to derive only a little of its energy from soaring. It is only slightly pessimistic to regard it as a flapping bird, proceeding under power at its maximum range speed. The dove prion, cape pigeon and white-chinned petrel may be regarded as progressively less dependent on flapping, and more on soaring, while the giant petrel is essentially a pure soarer like the albatrosses.
We can now make a comparison between the largest and smallest species. As an indication of range, the distance flown while consuming a quantity of fat equivalent to 1 % of the body mass will be estimated, and also the time taken to fly this distance.
For the wandering albatross the power is taken to be twice the metabolic power (2Pm), while for Wilson's petrel it is Pmr, the power for flapping at the maximum range speed. These are mechanical powers, or mechanical equivalents. To convert them into rates of fat consump- tion, they are divided by the work equivalent of fat, e, which is taken to be 8 x 10⁶ J kg-1. This assumes that oxidation of fat yields 4 x 10⁷ J kg-' of chemical energy, and that the con- version efficiency to mechanical work is 0.20.
The speeds are estimated by'''the method of ? 6.2. The mean airspeeds from the zero-wind intercepts on figure 18 are 14.1 m s-1 for the wandering albatross, and 8.80 m s-l for Wilson's
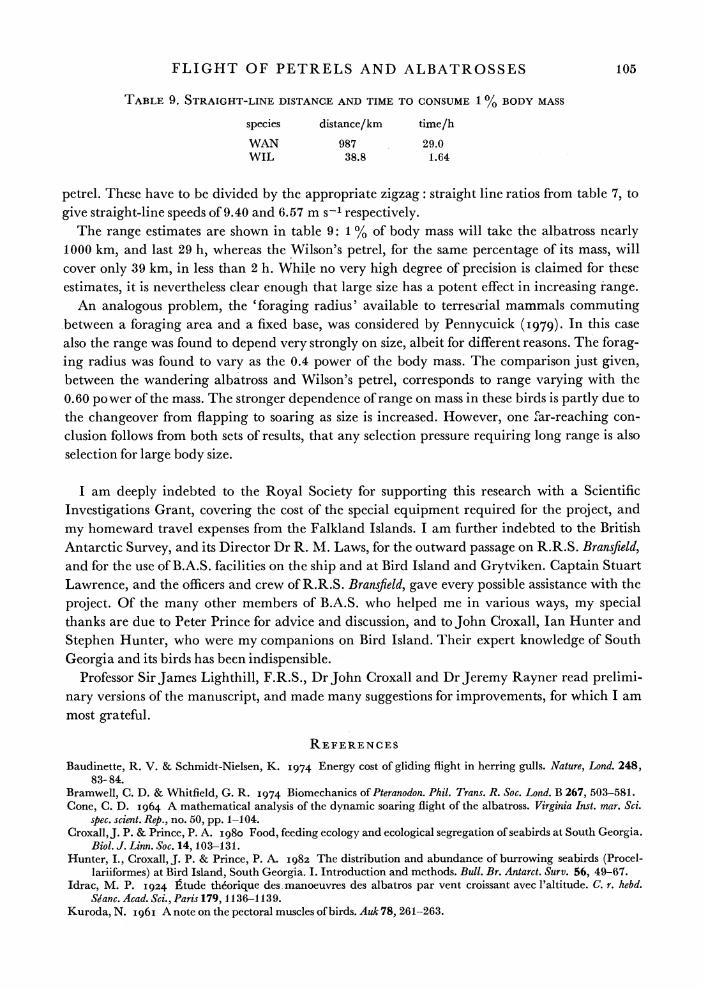
FLIGHT OF PETRELS AND ALBATROSSES 105
TABLE 9. STRAIGHT-LINE DISTANCE AND TIME TO CONSUME 1 % BODY MASS
species distance/km time/h
WAN 987 29.0 WIL 38.8 1.64
petrel. These have to be divided by the appropriate zigzag: straight line ratios from table 7, to give straight-line speeds of 9.40 and 6.57 m s-1 respectively.
The range estimates are shown in table 9: 1 % of body mass will take the albatross nearly 1000 km, and last 29 h, whereas the Wilson's petrel, for the same percentage of its mass, will
cover only 39 km, in less than 2 h. While no very high degree of precision is claimed for these
estimates, it is nevertheless clear enough that large size has a potent effect in increasing range. An analogous problem, the 'foraging radius' available to terrestrial mammals commuting
between a foraging area and a fixed base, was considered by Pennycuick (1979). In this case also the range was found to depend very strongly on size, albeit for different reasons. The forag- ing radius was found to vary as the 0.4 power of the body mass. The comparison just given,
between the wandering albatross and Wilson's petrel, corresponds to range varying with the
0.60 power of the mass. The stronger dependence of range on mass in these birds is partly due to
the changeover from flapping to soaring as size is increased. However, one far-reaching con-
clusion follows from both sets of results, that any selection pressure requiring long range is also
selection for large body size.
I am deeply indebted to the Royal Society for supporting this research with a Scientific
Investigations Grant, covering the cost of the special equipment required for the project, and
my homeward travel expenses from the Falkland Islands. I am further indebted to the British
Antarctic Survey, and its Director Dr R. M. Laws, for the outward passage on R.R.S. Bransfield, and for the use of B.A.S. facilities on the ship and at Bird Island and Grytviken. Captain Stuart
Lawrence, and the officers and crew of R.R.S. Bransfield, gave every possible assistance with the project. Of the many other members of B.A.S. who helped me in various ways, my special
thanks are due to Peter Prince for advice and discussion, and to John Croxall, Ian Hunter and
Stephen Hunter, who were my companions on Bird Island. Their expert knowledge of South
Georgia and its birds has been indispensible. Professor Sir James Lighthill, F.R.S., Dr John Croxall and Dr Jeremy Rayner read prelimi-
nary versions of the manuscript, and made many suggestions for improvements, for which I am
most grateful.
REFERENCES
Baudinette, R. V. & Schmidt-Nielsen, K. 1974 Energy cost of gliding flight in herring gulls. Nature, Lond. 248, 83-84.
Bramwell, C. D. & Whitfield, G. R. 1974 Biomechanics of Pteranodon. Phil. Trans. R. Soc. Lond. B 267, 503-581. Cone, C. D. I964 A mathematical analysis of the dynamic soaring flight of the albatross. Virginia Inst. mar. Sci.
spec. scient. Rep., no. 50, pp. 1-104. Croxall, J. P. & Prince, P. A. I 980 Food, feeding ecology and ecological segregation of seabirds at South Georgia.
Biol. J. Linn. Soc. 14, 103-131. Hunter, I., Croxall, J. P. & Prince, P. A. I982 The distribution and abundance of burrowing seabirds (Procel-
lariiformes) at Bird Island, South Georgia. I. Introduction and methods. Bull. Br. Antarct. Suirv. 56, 49-67. Idrac, M. P. 1924 Rtude theorique des manoeuvres des albatros par vent croissant avec l'altitude. C. r. hebd.
Se'anc. Acad. Sci., Paris 179, 1136-1139. Kuroda, N. I96I A note on the pectoral muscles of birds. Auk 78, 261-263.
106 C. J. PENNYCUICK
Lasiewski, R. C. & Dawson, W. R. I967 A re-examination of the relation between standard metabolic rate and body weight in birds. Condor 69, 13-23.
Magnan, A. 1925 Le vol a voile Paris: Roche d'Estrez. Pennycuick, C. J. I97I Gliding flight of the white-backed vulture Gyps africanus. J. exp. Biol. 55, 13-38. Pennycuick, C. J. 1972 Soaring behaviour and performance of some East African birds, observed from a motor-
glider. Ibis 114, 178-218. Pennycuick, C. J. I975 Mechanics of flight. In Avian biology, vol. 5 (ed. D. S. Farner & J. R. King), pp. 1-75.
New York: Academic Press. Pennycuick, C. J. 1978 Fifteen testable predictions about bird flight. Oikos 30, 165-176. Pennycuick, C. J. 1979 Energy costs of locomotion and the concept of 'foraging radius'. In Serengeti: dynamics
of an ecosystem (ed. A. R. E. Sinclair & M. Norton Griffiths), pp. 164-184. University of Chicago Press. Prince, P. A. & Payne, M. R. I979 Current status of birds at South Georgia. Bull. Br. Antarct. Surv., no. 48,
pp. 103-118. Prince, P. A., Ricketts, C. & Thomas, G. I98I Weight loss in incubating albatrosses and its implications for their
energy and food requirements. Condor 83, 238-242. Lord Rayleigh I883 The soaring of birds. Nature, Lond. 27, 534-535. Sutton, 0. G. 1953 Micrometeorology. New York: McGraw Hill. Tuck, G. & Heinzel, H. 1978 Afield guide to the seabirds of Britain and the world. London: Collins. Wallington, C. E. I96I Meteorologyforgliderpilots. London: Murray. Weis-Fogh, T. 1973 Quick estimates of flight fitness in hovering animals, including novel mechanisms for lift
production. J. exp. Biol. 59, 169-230. Wilson, J. A. 1975 Sweeping flight and soaring by albatrosses. Nature, Lond. 257, 307-308. Wood, C. J. 1973 The flight of albatrosses (a computer simulation). Ibis 115, 244-256.