the floods of may 17-18, 1985 and october 6-7, 1985 …the floods of may 17-18, 1985 and october...
TRANSCRIPT

THE FLOODS OF MAY 17-18, 1985
AND
OCTOBER 6-7, 1985 IN PUERTO RICO
By
Ferdinand Quinones and Karl G. Johnson
U.S. GEOLOGICAL SURVEY
OPEN-FILE REPORT 87-123
Prepared in cooperation with the
PUERTO RICO DEPARTMENT OF NATURAL RESOURCES, PUERTO RICO ENVIRONMENTAL QUALITY BOARD,
AND PUERTO RICO HIGHWAY AUTHORITY
San Juan, Puerto Rico
1987

DEPARTMENT OF THE INTERIOR
DONALD PAUL HODEL, Secretary
U.S. GEOLOGICAL SURVEY
Dallas L. Peck, Director
For additional Information write to:
Chief, Caribbean District, WRDU.S. Geological SurveyGPO Box 4424
San Juan, Puerto Rico OO936
Copies of this report can be purchased from:
U.S. Geological Survey Books and Open-File Reports Federal Center, Bldg. 41 Box 25425 Denver, Colorado 8O225

Ill
CONTENTSPAGE
Abstract..................................................... 1
Introduction................................................. 1
The floods of May 17-18, 1985................................ 3
Rainfall................................................ 3
Flooding and damages.................................... 3
Peak discharges......................................... 4
The floods of October 6-7, 1985.............................. 10
Rainfall................................................ 10
Flooding and damages.................................... 10
Peak discharges......................................... 14
Landslides.............................................. 14
Comparison of the 1985 floods with historical floods......... 14
Summary...................................................... 19
References cited............................................. 20
LIST OF ILLUSTRATIONS
Figure 1. Map of Puerto Rico showing locations mentionedin this report:................................ 2
2. Map showing cumulative precipitation over PuertoRico during May 15-19, 1985................... 4
3. Map showing areas in Puerto Rico where floodingwas most severe during May 1985............... 6
4. Map showing network of streamflow gaging stations operated by the U.S. Geological Survey in Puerto Rico................................... 7
5. Graphs showing discharge hydrographs at keystreamflow gaging stations during the May 15-19, 1985 floods at:a) Rio Grande de Manati at Highway 2,
near Manati,b) Rio Fajardo near Fajardo,c) Rio Inabon at Real Abajo, andd) Rio Grande de Anasco near San Sebastian.... 9

IV
LIST OF ILLUSTRATIONS (Continued)PAGE
Figure 6. Map showing cumulative precipitation over PuertoRico during October 6-7, 1985................. 10
7. Graph showing hourly and cumulative rainfall during October 6-7, 1985 at Tallaboa gage near Penuelas, southern Puerto Rico................ 11
8. Map showing areas flooded in southern Puerto Ricoduring the October 6-7, 1985 floods........... 13
9. Graphs showing discharge hydrographs at key streamflow gaging stations during the October 6-7, 1985 floods at:a) Rio Grande de Manati at Highway 2 near
Manati,b) Rio Grande de Loiza at Caguas,c) Rio Inabon at Real Abajo, andd) Rio Cerrillos near Ponce................... 16
10. Map showing location of Barrio Mameyes near thecity of Ponce in southern Puerto Rico......... 17
11. Graph showing comparison of unit discharges duringthe 1960 and 1985 floods in Puerto Rico....... 18
LIST OF TABLES
Table 1. Daily precipitation, in inches, for May 15-19, 1985 at selected National Weather Service- National Oceanic and Atmospheric Administration (NWS-NOAA) stations throughout Puerto Rico....
2. Summary of gage heights and discharges during floods of May 17-18, 1985 at selected U.S. Geological Survey streamflow gaging stations throughout Puerto Rico........................
3. Daily precipitation, in inches, for October5-8, 1985 at selected National Weather Service- National Oceanic and Atmospheric Administration (NWS-NOAA) stations throughout Puerto Rico.... 12
A. Summary of gage heights and discharges during floods of October 6-7, 1985 at selected U.S. Geological Survey streamflow gaging stations throughout Puerto Rico............... 15

CONVERSION FACTORS
For the convenience of readers who may want to use the International Systems of Units (Si), the data may be converted by using the following factors:
Multiply inch-pound units
inch (in.)
foot (ft)
mile (mi)
square mile (mi )
acre-foot (acre-ft)
cubic yard (yd )
3 cubic foot per second (ft /s)
cubic foot per second
by To obtain SI units
25.4 millimeter (mm) 2.54 centimeter (cm)
0.3048 meter (m)
1.609 kilometer (km)
2 2.590 square kilometer (km )
3 1,233 cubic meter (m )
3 0.7646 cubic meter (m )
0.02832 cubic~meter per second (m /sec)
.2-per square mile [(ft /s)/mi ) 0.01093
Specific Combinations
cubic meter per second per~square9kilometer [(in /s)/km ]
1 acre-ft = 226.3 gal/min, during one day
1 ft3/s = 448.8 gal/min
1 ft /s =0.65 Mgal/d

THE FLOODS OF MAY 17-18, 1985
AND OCTOBER 6-7, 1985 IN PUERTO RICO
By Ferdinand Quifiones and Karl G. Johnson
ABSTRACT
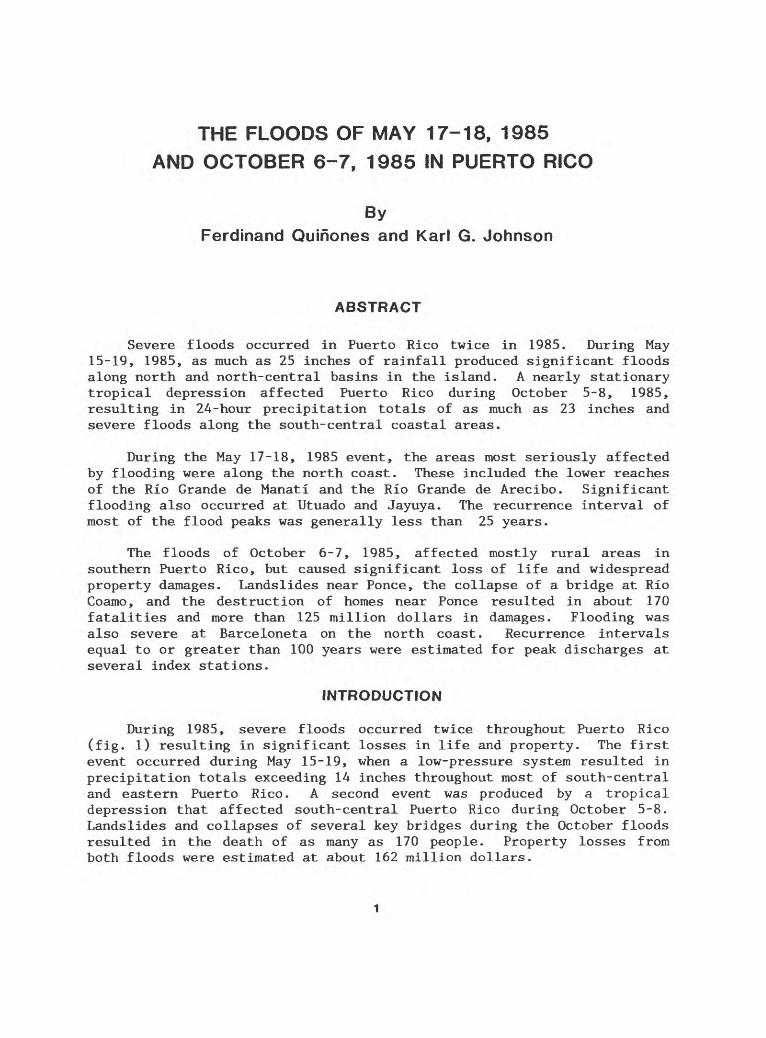
Severe floods occurred in Puerto Rico twice in 1985. During May 15-19, 1985, as much as 25 inches of rainfall produced significant floods along north and north-central basins in the island. A nearly stationary tropical depression affected Puerto Rico during October 5-8, 1985, resulting in 24-hour precipitation totals of as much as 23 inches and severe floods along the south-central coastal areas.
During the May 17-18, 1985 event, the areas most seriously affected by flooding were along the north coast. These included the lower reaches of the Rio Grande de Manati and the Rio Grande de Arecibo. Significant flooding also occurred at Utuado and Jayuya. The recurrence interval of most of the flood peaks was generally less than 25 years.
The floods of October 6-7, 1985, affected mostly rural areas in southern Puerto Rico, but caused significant loss of life and widespread property damages. Landslides near Ponce, the collapse of a bridge at Rio Coamo, and the destruction of homes near Ponce resulted in about 170 fatalities and more than 125 million dollars in damages. Flooding was also severe at Barceloneta on the north coast. Recurrence intervals equal to or greater than 100 years were estimated for peak discharges at several index stations.
INTRODUCTION
During 1985, severe floods occurred twice throughout Puerto Rico (fig. 1) resulting in significant losses in life and property. The first event occurred during May 15-19, when a low-pressure system resulted in precipitation totals exceeding 14 inches throughout most of south-central and eastern Puerto Rico. A second event was produced by a tropical depression that affected south-central Puerto Rico during October 5-8. Landslides and collapses of several key bridges during the October floods resulted in the death of as many as 170 people. Property losses from both floods were estimated at about 162 million dollars.

10
67°
16*
67°0
0*45'
30'
15'
66*0
0*4
6'
65*3
0'
18
°30
*
15
'
18°0
0'
17
°45
'-
Rib
Gra
nd
e
die
Aftasc
o
ftib
Y
ag
ue
z P
ib G
uana
jib
o
10
2
0 K
ILO
ME
TE
RS
Fig
ure
1
. M
ap
of
Pu
erto
Ric
o s
how
ing
loca
tio
ns
me
nti
on
ed
in
this
rep
ort
.

INTRODUCTION (Continued)
The U.S. Geological Survey, Water Resources Division, collected and analyzed data on the magnitude, frequency and extent of the 1985 floods. The investigations were conducted as part of the ongoing cooperative water resources investigation program in cooperation with the Puerto Rico Department of Natural Resources, the Puerto Rico Environmental Quality Board, and the Puerto Rico Highway Authority. Information related to rainfall quantities and intensities throughout the island was provided by Robert Calvesbert, of the National Weather Service, National Oceanic and Atmospheric Administration (NWS-NOAA), U.S. Department of Commerce.
This report summarizes the rainfall and streamflow data collected during the two 1985 flood events. This information should be of value and interest to engineers, developers, planners and government officials. Additionally, it will provide a historical record of data from the floods to supplement several flood atlases now in preparation.
THE FLOODS OF MAY 17-18, 1985
Rainfall
Severe flooding affected most of the north and north-central parts of Puerto Rico during May 17-18 as a result of intense precipitation that began on May 15 and continued through May 19. The rains were produced by a nearly stationary low-pressure center that moved from the northwest on May 15. During the next five days, almost continuous precipitation of varying intensity was recorded throughout most of the south-central and eastern part of Puerto Rico.
Precipitation totals for the 5 days of the storm ranged from 8 to 25 inches (fig. 2). The most intense rainfall occurred over an area extending west of a north-south line at the town of Orocovis toward Mayaguez. A second cell of less intense rainfall affected the Rio Grande de Loiza basin, in the eastern part of the island. The recorded precipitation total for the 5-day period May 15-19 was 25.21 inches at Jayuya. Precipitation totals for the 5-day period at individual stations operated by the NWS-NOAA are summarized in table 1.
Flooding and Damages
The most significant floods occurred on May 17 and 18. Flooding was severe in the lower reaches of streams in the Rio Grande de Arecibo, the Rio Tanama, the Rio Grande de Manati, the Rio Grande de Jayuya, the Rio Orocovis, the Rio Turabo, the Rio de La Plata, and the Rio Grande de Afiasco basins. Flooding of urban areas was reported at the towns of Arecibo, Utuado, Jayuya, Orocovis, Vega Baja, Dorado, Toa Baja, Barceloneta, Caguas, and Loiza.

18 30'
67 15' 67 00' _____45'______
^TL^ANTICARECIBO
15'
18 00*
30' 15'
OCEAN6600' 6545*
MAYA
CARIBBEAN SEA0 10 20 KILOMETERS
10 20 MILES
Figure 2. Cumulative precipitation (Isohyets In Inches) over Puerto Rico during May 15-19, 1985.
THE FLOODS OF MAY 17-18. 1985 (Continued)
Flooding and Damages (Continued)
The worst flooding occurred at Arecibo and Barceloneta, (fig. 3). The flooding at Arecibo covered slightly less area than during the 1928 record flood (Hickenlooper, 1968). The flood at the town of Barceloneta was lower and inundated a lesser area than the 1970 flood. Undefined conditions appear to have caused backwater effects in several areas in Barceloneta on the Rio Grande de Manati flood plain. The floods at the towns of Jayuya and Utuado were lower than the record floods of 1975 (Johnson, 1982).
Damage estimates to private and public property during the floods reached 37 million dollars according to the Federal Emergency Management Administration (FEMA).
Peak Discharges
The U.S. Geological Survey collected peak stage and flow data from its network of gaging stations throughout Puerto Rico (fig. A). At sites where recording instruments failed or were damaged during the floods, high-water marks were surveyed shortly after the event to determine the peak stage and discharge. Flood stages, discharges, and other information pertinent to the gaging stations are summarized in table 2. Flood hydrographs at key gaging stations for the period from May 15-21, 1985 are shown in figures 5a to 5d.

Table 1. Dally precipitation, In Inches, for May 15-19, 1985 at selected NationalWeather Service-National Oceanic and Atmospheric Administration
(NWS-NOAA) stations throughout Puerto Rico
IJOCATION
NORTH COASTAL
Borinquen AirportCandelaria-Toa BajaRio Piedras AESSan Juan WSFOToa Baja 1 SSW
SOUTH COASTAL
Aguirre CentralCentral San FranciscoLajas AESMagueyes IslandPonce 4 EPonce CitySanta Isabel 2 ENE
NORTHERN SLOPES
CanovanasFajardoIsabela AESI .a Muda - CaguasMauati 3 ETrujillo Alto 2 SSW
SOUTHERN SLOPES
Corral ViejoJuana Diaz CampMaunaboPat il lasPuerto RealRoosevelt RoadsSabana Grande 2 ENEYauco 1 NNW
EASTERN INTERIOR
Caguas 1 WCayey 1 ECidra 1 EGurabo AESJuncosPi co del EsteSan Lorenzo 3 SSan Lorenzo Farm 2 NW
WESTERN INTERIOR
Ad juntas AESArecibo ObservatoryCerro MaravillaColosoCorozal AESDos BocasJayuyaLares 2 SEMaricao Fish HatcheryMorovis 1 NNegro-CorozalSan Sebastian 2 WNWUtuadoVillalba 1 E
MAY15
1.40.00
1.272.08.75
1.45.18.33.56.29.90.35
2.17.33T1.09.01
2.02
.28
.92
.34
.69
.25
.82
.57
.28
.75l.LO1.10.80
1.082.501.42.80
.24
.001.40.17ft
.00
.03
.00
.00
.05
.09
.00
.072.10
16
0.45.00
1.44T.90
1.651.011.601.493.442.101.30
2.152.25.46.81
1.44.90
3.171.761.64.06.47.49.18
1.75
1.503.012.002.204.402.514.253.40
2.94.46
4.582.001.13.73
3.24.42.25
1.72.85.00
1.732.70 -
17
2.002.90.96
1.17.78
.20
.281.57.58
1.34.99.40
.45
.901.221.27.40.62
.892.74.27.07
1.542.42.65
2.65
.721.681.30.67
1.254.50.94
1.10
2.29.35
5.72.45
1.32.47
4.67.90
2.231.971.78.37
1.273.68
18
0.655.001.78.88
4.45
2.00.34.40*1.78.50
1.88
1.597.13.70
1.50.79
1.40
1.043.164.36.37.65
5.822.001.05
5.655.204.457.006.184.907.867.40
14.20.75
10.003.857.681.065.571.552.484.832.52.93
2.542.27
19
0.70.00.50.00
1.10
1.702.301.19
ft1.441.35.77
.50
.851.93.76
1 .46.95
5.34.00
2.022.001.83.00
4.403.22
.753.07.60.30
2.78.60.40
1.65
.342.172.25.18
1.333.75
11.704.655.661.492.152.555.39.00
5-DAY TOTALS
5.207.905.954.137.98
7.004.115.092.638.295.844.70
6.8611.464.315.434.105.89
10.728.588.633.194.749.557.808.95
9.3714.069.4510.9715.6915.0114.8714.35
20.013.73
23.956.6511.466.01
25.217.5210.6210.067.393.85
11.0010.75
EXPLANATION:
T - Trace.* - No reading from rain gage.

o>6
6°4
5'
18
°30'
40
' 3
5'
T
L A
]N
T
I C
30
'
O
C2
5'
66
C20
'
BA
N
'.P
unta
Pue
rto
Nue
vo
25'
20'
15
'
Pun
ta P
alm
as A
ltas Man
ati*
Lagu
na
Tort
ugue
ro VE
GA
BA
JA VE
GA
AL
TA
*F
LO
OD
ED
A
RE
AS
OR
OV
IQ
Igne
ous
and
UK
OV
IS
sed
imen
tary
roc
ks
Dra
inag
e bo
unda
ry
£a
t
Lago
C
aon
illas
Dra
inag
e \
boun
dary
. "
V
0246 K
ILO
ME
TE
RS
i__
_i
i
6 M
ILE
S
Fig
ure
3. A
re a
s In
Pu
erto
Ric
o w
her
e fl
oo
din
g w
as m
ost
sev
ere
du
rin
g M
ay
1985
.

67°1
566
*00'
45
'65°3
0'
18°3
0'
15'
18*0
0*
17
°45
'
0~ ^
' $v
O
" 'C'
1'1 Ow
«?
< $>
'&'
$ ' t
if*
6 ^^
*V
«>
ww
^wR I
E
A
N
SE
A
o o
10
20
KIL
OM
ET
ER
Si
t
10
ao M
ILES
Fig
ure
4. N
etw
ork
o
f s
tre
am
flo
w g
agin
g s
tati
on
s o
pe
rate
d b
y th
e U
.S.
Ge
olo
gic
al
Su
rvey
in
Pu
erto
Ric
o.

00
Tab
le 2
. S
um
mar
y o
f g
ag
e h
eig
hts
an
d d
isc
ha
rge
s d
uri
ng
flo
od
s o
f M
ay
17-1
8,
19
85
at
sele
cte
d
U.S
. G
eo
log
ica
l S
urv
ey s
tream
flo
w g
agin
g s
tati
on
s t
hro
ug
ho
ut
Pu
erto
Ric
o
MA
XIM
UM
DU
RIN
G
17-1
8,
1985 F
LO
OD
ST
AT
ION
N
UM
BE
RS
TA
TIO
N N
AM
E
5001
4800
5001
5700
5002
7750
5002
8000
50028400
5003
1200
5003
5000
5003
8100
5003
8320
50039500
5004 iOOO
50046000
5005
0900
5005
1150
5005
1180
50051310
5005
3050
5005
5000
5005
5650
5005
6400
50056900
50057000
5006
5500
5007
1000
5011
1500
5011
2500
50114000
5011
5000
5011
5900
50144000
5014
7800
Rio
Camuy
near Bayaney
Rio
Camuy
near
Hatillo
Rio
Grande de Arecibo
above
Arecibo
Rio
Tanama ne
ar Ut
uado
Rio
Tanama near Ch
arco
Ho
ndo
Rio
Grande de Manati ne
ar Mo
rovi
sRio
Gran
de de Ma
nati
at Ci
ales
Rio
Grande de Manati at Hwy
2ne
ar Manati
Rio
Cibuco below
Corozal
Rio
Cibu
co at
Vega Ba
ja
Rio
de la
Plata
at Proyecto la
Plata
Rio
de la
Plata
near
To
a Alta
Rio
Grande de Loiza
at Quebrada
Aren
asQuebrada Bl
anca
at
El
Ja
qual
Quebrada Salvatierra
near
San
Lore
nzo
Rio
Cayaguas at Cerro
Gord
oRi
o Turabo at
Borinquen
Rio
Grande de Loiza
at Ca
guas
Quebrada Caimito
near
Juncos
Rio
Valenciano ne
ar Ju
ncos
Quebrada Mamey
near
Gu
rabo
Rio
Gurabo at
Gu
rabo
Rio
Mame
yes
near
Sa
bana
Rio
Fajardo
near
Fajardo
Rio
Jacaguas at
Juana
Diaz
Rio
Inab
on at Re
al Abajo
Rio
Cerrillos
near
Ponce
Rio
Portugues
near
Po
nce
Rio
Portugues
at Hw
y 14
at Ponce
Rio
Grande de Anasco ne
arSa
n Sebastian
Rio
Culebrinas at
Hw
y 404
near
Moca
ND ND140.00
18.4
057.60
55.2
012
8.00
197.00
15.10
99.10
54.80
200.
00
6.00
3.25
3.74
10.20
7.89
89.80
0.82
16.4
0
2.30
60.20
6.88
14.9
049.80
9.70
17.80
8.82
18.6
0
94.30
71.20
1984
1984
1982-84
1960-84
1969-71
1983
-84
1965-84
1960-84
1963-84
1970-84
1959-84
1960
-84
1960
-84
1978-84
1985
1984
1978-84
1984
1960-84
1984
1972-84
1984
1960
-84
1969
-73
1983-84
1960-84
1984
1964-84
1964-84
1965
-84
1965
-84
1963
-84
1969
-84
09-18-84
09-19-84
09-13-82
05-17-63
04-21-69
10-09-70
10-09-70
10-09-70
11-0
7-79
12-1
3-81
08-2
7-61
09-06-60
07-18-79
-06-10-84
08-31-79
02-15-84
09-06-60
09-20-84
08-31-79
06-10-84
09-06-60
09-04-73
10-24-74
09-21-84
10-09-70
09-1
6-75
09-16-75
09-16-75
09-1
6-75
09-16-75
11.5
3-
13.0
516
.29
12.22
20.30
24.00
33.3
019.80
18.8
4
32.20
36.3
5
13.4
0-
15.1
2
9.44
9.75
31.1
79.79
20.1
7
8.11
27.70
13.0
2
13.6
28.
07
20.60
.11.20
10.1
017
.38
33.90
36.60
2040
3000
9310
8950
4120
35000
1250
00
1190
0013
600
30300
59600
95500
8950-
6300
13200
2650
71500
228
23300
1050
74600
1980
0
1960
0357
5720
22400
1310
014
500
140000
69000
- -
66486 72 634
977
604
901
306
1090 478
1490-
1680
1290 336
796
278
1420 457
1240
2880
13207
540
1260
1490 780
1480 969
ND ND ND 10 ND 15 30 20 10 30 15 25 20-
ND 10 ND 20 ND 20 ND 15 10 10 ND
7100 25 30 100 25
18 18 18 18 18 18 18 18 18 18 18 18 18 17 17 18 17 18 18 18 18 18 17 17 18 18 18 18 18 18 18
14.4
220
.67
18.2
217
.45
17.95
17.8
919
.62
3510
6250
45800
12190
1500
0
4800
074
300
j33
.54
18.5
518
.12
21.10
21.6
1
10.37
14.5
817
.10
19.7
117
.06
21.4
012.07
21.30
8.43
23.3
511
.44
9.88
18.78
17.84
14.6
49.
8712
.46
26.7
7
29.6
5
1360
0010
800
22200
26530
38700
4290
7400
9320
8180
1160
028
000
678
25700
1190
38200
1390
0
6000
1270
0
3410
8270
3050
5000
77200
3280
0
ND ND 330
660
260
870
580
690
720
220
480
190
715
2280
2490 800
1470 310
830
1570 520
630
2020 400
260
350
460
350
270
820
460
ND ND ND 50 ND 50 15 255
20
5 5 5ND ND
3ND5
ND 25 ND5 5 2
ND
5 5 2 5
50
5
EX
PL
AN
AT
ION
ND
- N
ot
det
erm
ined
.

DIS
CH
AR
GE
, IN
CU
BIC
FE
ET
PE
R S
EC
ON
D
g8
DIS
CH
AR
GE
, IN
CU
BIC
FE
ET
PE
R S
EC
ON
D
p
8
fill
0)
»
DIS
CH
AR
GE
, IN
CU
BIC
F
EE
T P
ER
S
EC
ON
D
- o
oD
ISC
HA
RG
E,
IN
CU
BIC
F
EE
T
PE
R
SE
CO
ND
5 5 I » o- to
CO I
»«>*
5
o
i -
*»«:
^ ®
f«-10"
! to
3 a
to
111 *h
s*« Jt
<Q 3" <Q
o
o
o "o
o o
o
o "o
o o
en CO CO
CO
10
THE FLOODS OF OCTOBER 6-7, 1985
Rainfall
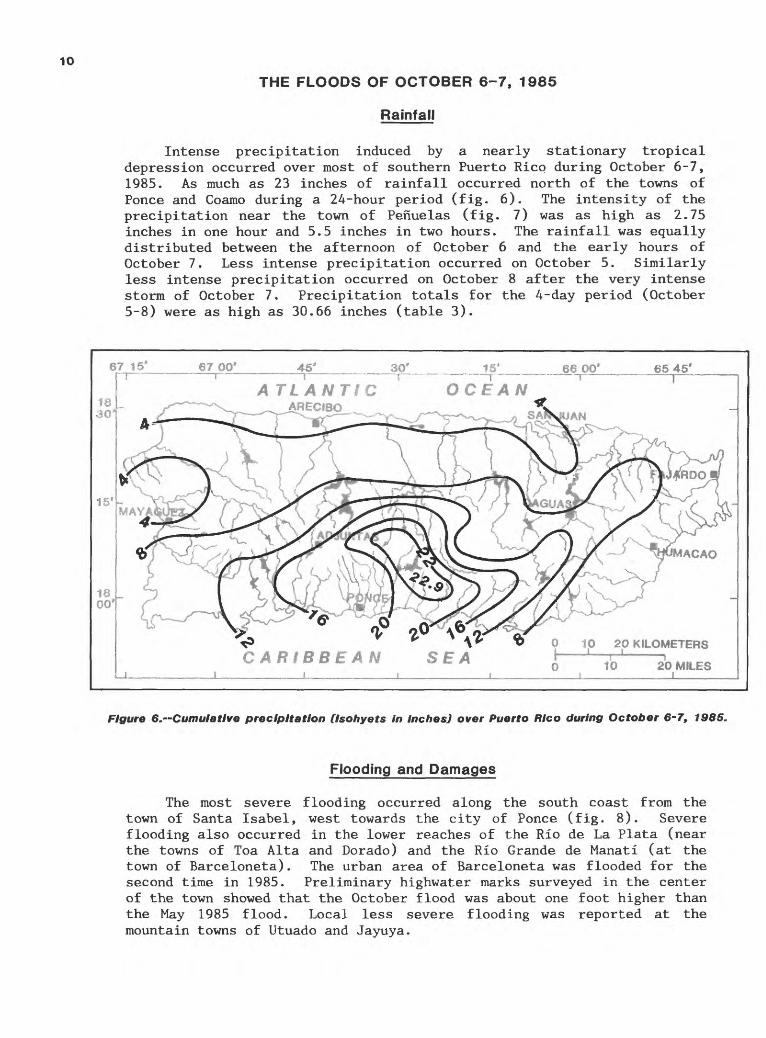
Intense precipitation induced by a nearly stationary tropical depression occurred over most of southern Puerto Rico during October 6-7, 1985. As much as 23 inches of rainfall occurred north of the towns of Ponce and Coamo during a 24-hour period (fig. 6). The intensity of the precipitation near the town of Penuelas (fig. 7) was as high as 2.75 inches in one hour and 5.5 inches in two hours. The rainfall was equally distributed between the afternoon of October 6 and the early hours of October 7. Less intense precipitation occurred on October 5. Similarly less intense precipitation occurred on October 8 after the very intense storm of October 7. Precipitation totals for the 4-day period (October 5-8) were as high as 30.66 inches (table 3).
67 16* 6700* 45' 30' 16' 6600' 6546'
*_JL
A TLANTiCARECJBO
OCEAN
MACAO
V 2U V CARIBBEAN SEA
0 10 20 KILOMETERS
6 10 20 MILES
Figure 6.~Cumulative precipitation (Isohyets In Inches) over Puerto Rico during October 6-7, 1985.
Flooding and Damages
The most severe flooding occurred along the south coast from the town of Santa Isabel, west towards the city of Ponce (fig. 8). Severe flooding also occurred in the lower reaches of the Rio de La Plata (near the towns of Toa Alta and Dorado) and the Rio Grande de Manati (at the town of Barceloneta). The urban area of Barceloneta was flooded for the second time in 1985. Preliminary highwater marks surveyed in the center of the town showed that the October flood was about one foot higher than the May 1985 flood. Local less severe flooding was reported at the mountain towns of Utuado and Jayuya.

113.0
R °0 10 20 30 HOURS BEGINING AT
0100 OCTOBER 6, 1985
8 12 16 OCTOBER 6
8 12 16 OCTOBER 7
Figure 7. Hourly and cumulative rainfall during October 6-7, 1985 atTallaboa gage near Penuelas, southern Puerto Rico.
(Data courtesy of Puerto Rico Energy Power Authority.)
THE FLOODS OF OCTOBER 6-7, 1985 (Continued)
Flooding and Damages (Continued)
The floods along the south coast in the Santa Isabel to Ponce area exceeded the historical floods of 1970 (Haire, 1971). Flooding in the lower valley of the Rio Jacaguas (south of the town of Juana Diaz) was not as severe as in the Rio Coamo area in spite of about equal precipitation in both basins. The Toa Vaca reservoir attenuated most of the peak, storing a significant amount of the runoff. The reservoir filled-up to its capacity (original capacity of about 55,000 acre-feet) only for the second time since its construction in 1972. Flooding along the Rio Cerrillos and the city of Ponce was also minimal in comparison to previous events of lesser magnitude. The Rio Cerrillos flood channel contained most of the flood runoff within its boundaries.
Damages to private and public property during the floods were estimated by FEMA at about 125 million dollars. About 3,000 homes were damaged, of which 1,300 were a total loss. The deaths of about 40 people (other than fatalities related to landslides) were attributed to the floods. The worst incident occurred at the Rio Coamo bridge on Las Americas Expressway (Highway 52). The approach to the west bound lanes on the bridge collapsed sometime between midnight and 3:00 a.m. on October 7. An unknown number of vehicles plunged into the river, with at least 24 fatalities. Flooding at the Quebrada del Agua (west of the city of Ponce) resulted in 16 fatalities.

12
Table 3. Dally precipitation, In Inches, for October 5-8, 1985 at selected National Weather Service-National Oceanic and Atmospheric Administration (NWS-NOAA) stations throughout Puerto Rico
IXJCATION
NORTH COASTAL
Borinquen AirportCandelaria - Toa BajaRio Piedras AESSan Juan WSFOToa Baja 1 SSW
SOUTH COASTAL
Aguirre CentralCentral San FranciscoLajas AESMagueyes IslandPonce 4 EPonce CitySanta Isabel 2 ENESanta Rita
NORTHERN SLOPES
CanovanasFajardoIsabela AESLa Muda-CaguasManat i 3 ETrujillo Alto 2 SSW
SOUTHERN SLOPES
Corral ViejoJuana Diaz CampMaunaboMayaguez AirportPatillasPuerto RealRoosevelt RoadsSabana Grande 2 ENEYauco 1 NNW
EASTERN INTERIOR
Cayey 1 ECidra 1 EGurabo AESJuncosPico del EsteSan Lorenzo 3 SSan Lorenzo 2 NW
WESTERN INTERIOR
Ad juntas AESArecibo ObservatoryBarranquitas 2 SSWCerro MaravillaCorozal AESDos BocasJayuyaLares 2 SEMorovis I NNegro - CorozalSan Sebastian 2 WNW
OCTOBER5
0.45.03
1.70.29
1.04
.40
.14
.16
.22
.52
.58
.38
.00
1.50.09.02
1.08.80.50
.42ft
.85
.081.65.00
1.04.28.14
.44
.561.00.87.57
1.15.50
.10
.041.00.41.95.30.49.04.62.58.06
6
0.603.021.452.923.50
.93
.21
.08*
.75*.85
15.00
2.452.16.19
1.09.20
1.25
.38A
2.21.00
1.10.00
5.81.00.23
1.511.251.061.206.753.603.60
.20
.186.001.95.42.18.79.15.72.40.02
7
2.507.963.152.627.28
12.3012.008.4510.2518.203.70
21.522.30
3.557.603.558.106.094.15
15.9022.236.332.014.9010.80
.5413.7515.05
11.6011.077.388.385.005.606.20
11.707.8010.0022.907.587.00
16.416.707.502.664.02
8
0.75.32.32T.22
1.102.101.302.642.611.161.93.00
.38
.52
.64
.51
.79
.65
1.013.02.11.50
1.16.86T2.251.30
1.632.001.192.12.45
1.05.80
3.551.901.055.40.36
1.676.661.60.49
1.131 .08
/.-DAYS TOTALS
4.3011.336.625.8312.04
14.7314.459.9913.1122.085.44
24.6817.30
7.8810.374.4010.787.886.55
17.7125.259.502.598.8111.667.3916.2816.72
15.1814.8810.6312.5712.7711.4011.10
15.559.9218.0530.669.319.15
24.358.499.334.775.18
EXPLANATION:
T - Trace.* - No reading from rain gage.

66
°37
'30
'66°2
2'3
0'
Dra
inag
e bo
unda
ry
SV
ILLA
LB
A
DE
ST
RO
YE
D
BR
IDG
ES
LA
ND
SLID
ES
AR
EA
B
AR
RIO
M
AM
EY
ES 01
23
45
6
KIL
OM
ET
ER
SI
I I
0123456
MIL
ES
CA
RIB
BE
AN
18°0
0'
Fig
ure
8. A
reas f
loo
de
d i
n so
uth
ern
Pu
erto
Ric
o d
uri
ng
th
e O
cto
be
r 6
-7,
19
85
flo
od
s.
CO

14
THE FLOODS OF OCTOBER 6-7, 1985 (Continued)
Peak Discharges
The U.S. Geological Survey collected peak stage and discharge information during and after the floods throughout its network of gaging stations in Puerto Rico. Historical peak flows were recorded at several stations in the network. These included gaging stations at the Rio Coamo, the Rio Inabon, the Rio Descalabrado, the Rio Jacaguas, the Rio Cerrillos, the Rio Portugues, and the Rio Grande de Manati (table A). Recurrence intervals equal to or greater than 100 years were estimated for most of the peaks recorded at the gaging stations from Santa Isabel to Ponce. Discharge hydrographs at key gaging stations showed that the peak discharges occurred during the early hours of October 7 (fig. 9).
Landslides
Landslides occurred throughout Puerto Rico as a result of saturation of the soils during the intense rains of October 5-8. The most severe landslide occurred on a hill at Barrio Mameyes, on the northwestern fringe of the city of Ponce (fig. 10). A slab of calcareous sandstone detached from the crest of the hill, slipping toward the bottom of a populated ravine. Field estimates showed that about 260,000 cubic yards of material slid from the hill.
The Mameyes landslide destroyed about 90 homes causing the death of about 130 people. Most of the houses were buried under mud and debris. The time of occurrence of the incident (around 3:00 a.m. on October 7) and the intensity of the rain at that time, affected the rescue efforts (only about 50 bodies were recovered). Although many other smaller landslides occurred throughout the island, the incident at Mameyes was the only one that resulted in loss of life. The Puerto Rico Department of Natural Resources is currently conducting an inventory of the landslides recorded during the floods.
COMPARISON OF THE 1985 FLOODS WITH HISTORICAL FLOODS
The floods of May and October 1985 were of severe magnitude and extreme frequency. Record peak discharges occurred at several basins including some of the largest in Puerto Rico. The recurrence interval of many of the instantaneous peak discharges equaled or exceeded the 100-year flood.
The "Myers Rating" method can be utilized to compare the intensity of floods from different basins and/or different events (Haire, 1972). In the Myers's technique, the unit discharge (flow per unit area) of a particular flood is compared with the maximum known floods throughout the world or in the study area. In Puerto Rico, the most recent extreme floods occurred in 1960, 1970, and 1975. Data from the 1960 floods and the 1985 floods were compared using the Myers's technique (fig. 11).

15
Table 4. Summary of gage heights and discharges during floods of October 6-7, 1985 at selected U.S. Geological Survey streamflow gaging stations throughout Puerto Rico
MAXIMUM PREVIOUSLY RECORDED
STAT'ON NAME
MAXIMUM DURING 6-7, 1985 FLOOD/V
50010600
50011200
50011400
5001480050015700
500277505002800050028400
5003120050035000
50038100
50038320500395005004300050046000
50050900
5005115050051180
5005131050053050
5005500050055650500564005005690050057000
5006180050063440500635005006380050065500
500670005007100050075000
50092000
50106500
50108000
50111500501125005011400050115000
5011590050124200501299005013600050138000
50144000
50147800
Rio Guajataca above Lago deGuajataca
Rio Guajataca below Lago deGuajataca
Rio Guajataca above mouth nearQuebradillas
Rio Camuy near BayaneyRio Camuy near Hatillo
Rio Grande de Arecibo above AreciboRio Tanama near UtuadoRio Tanama at Charco Hondo
Rio Grande de Manati near MorovisRio Grande de Manati at Ciales
Rio Grande de Manati at Hwy 2near Manati
Rio Cibuco below CorozalRio Cibuco at Vega BajaRio de la Plata at Proyecto La PlataRio de la Plata at Hwy 2
near Toa Alta
Rio Grande de Loizaat Quebrada Arenas
Quebrada Blanca at el JaqualQuebrada Salvatierra near
San LorenzoRio Cayaguas at Cerro GordoRio Turabo at Borinquen
Rio Grande de Loiza at CaguasQuebrada Caimito near JuncosRio Valenciano near JuncosQuebrada Mamey near GuraboRio Gurabo at Gurabo
Rio Canovanas near Campo RicoQuebrada Sonadora near El VerdeQuebrada Toronja at El VerdeRio Espiritu Santo near Rio GrandeRio Mameyes near Sabana
Rio Sabana at SabanaRio Fa jar do near Fa jar doRio Icacos near Naguabo
Rio Grande de Patillas nearPatillas
Rio Coamo near Coamo
Rio Descalabrado near Los Llanos
Rio Jacaguas at Juana DiazRio Inabon at Real Aba joRio Cerrillos near PonceRio Portugues near Ponce
Rio Portugues at Hwy 14 at PonceRio Guayanilla near GuayanillaLaguna Cartagena near BoqueronRio Rosario at RosarioRio Guanajibo near Hormigueros
Rio Grande de Anasco nearSan Sebastian
Rio Culebrinas at Hwy 404 near Moca
ND
ND
ND
NDND
140.0018.4057.60
55.20128.00
197.0015.1099.1054.80
200.00
6.003.25
3.7410.207.89
89.800.8216.402.30
60.20
9.841.010.068.626.88
3.9614.901.26
18.3046.00
12.90
49.809.7017.808.82
18.6018.90
ND16.40
120.00
134.0071.20
1984-85
1984-85
1969-701984-85
19851985
1982-851960-851969-711983-851965-851960-85
1963-851970-851959-851960-85
1960-85
1978-851985
19851978-85
1985
1960-851985
1972-851985
1960-85
1967-851983-851983-851966-851969-731983-85
1979-851961-851945-531962-661979-85
1966-851967-68
19701984-851966-691984-85
19851964-851964-851965-85
1963-851981-851984-851975-851973-85
1963-851969-85
05-18-85
09-18-84
09-19-84
05-18-8505-18-85
05-18-8505-18-8505-18-85
05-18-8510-09-70
05-18-8511-07-7912-13-8108-27-61
09-06-60
07-18-7905-17-85
05-17-8508-31-7905-17-85
09-06-6005-18-8505-18-8505-18-8509-06-60
12-13-8212-02-8307-05-8312-02-8309-04-73
04-21-8310-24-7404-21-83
09-16-7510-09-70
05-21-69
05-18-8510-09-7009-16-7509-16-75
09-16-7509-12-8206-11-8409-16-7509-16-75
09-16-7509-16-75
12.03
9.94
8.10
14.4220.67
18.2217.4517.95
17.8924.00
33.5419.8018.8432.20
36.35
13.4014.58
17.109.4417.06
31.1712.0721.308.43
27.70
13.108.601.71
12.0713.02
19.3513.628.96
12.4521.40
11.50
18.7820.6011.2010.10
17.3820.4011.0419.6028.50
33.9036.60
2600
590
3090
35106250
458001219015000
48000125000
136000136003030059600
95500
89507400
93201320011600
71500700
257001190
74600
150001410
181240019800
9010196002860
1480022000
7000
127005720
2240013100
1450014700
9433800128000
14000069000
--
--
--
NDND
330660260
870977
6909013061090
478
14902280
249012901470
79685015705201240
1520140028114402880
228013202270
809478
543
26054012601490
780778--
20601070
1480969
ND
ND
ND
NDND
ND50ND
5030
25103015
25
20ND
ND10ND
20ND25ND15
5NDND1010
51075
515
10
ND7
10025
30NDND10020
10025
6
6
6
77
77
77
7776
7
66
666
66676
66776
666
67
7
7777
77777
77
10.10
10.40
7.97°
17.7024.81
15.6917.11°
13.17°19.75
1550
730
2970
649010500
784011500
2850075400
33.80 150000813.0817.9822.00°
24.58
10.039.24
10.3915.2613.27
19.8013.3711.337.66
19.40
9.807.561.607.598.57
13.1910.485.18
11.04--
24.37C
29.42°--
20.8320.20°
43202020028900
75000"
38701500"
198039505120
2280010007470840
19400
6960330>1034905850
22006860620
585054000
18800"
37000°15000"24000"15500"
17.70 [>1600019.13°14.3810.0228.00°
21.94°26.94
119007400"664030000"
53600"23000
ND
ND
ND
NDND
ND430200
520590
761290200530
375
650460
530390650
2501220460370320
710330
>170400850
560460490
3201170
1450
740155013501760
860630ND400250
400320
ND
ND
ND
NDND
5ND
1215
302
155
20
2ND
ND2
ND
3ND2
ND3
3NDND22
222
2100
100
ND100
>10070
35NDND25
305
EXPLANATION EXPLANATION
a - Estimate based on rating extension b - Estimate based on poor highwater mark > - Greater than given value
ND - Not determinedc - High-water mark elevatione - Estimated, subject to revision.

DIS
CH
AR
GE
, IN
CU
BIC
FE
ET
PE
R S
EC
ON
Do>
8<
01
I * 8«
._
O
-»- »
- »
*
0
UK
v»*6
«»
m
5a>
203,
2. *>
3D
||!|o
*W
®
>^
Q.
15**
!| .
;i°i
;iS
&82
:*?
2 »*
"-21
*o
°>
<°*
- o
-*»J
0) ttl
01"
2 c<
o 5(
oa
§»g5
r*»
* 2
* <
* 5&
a
^^
g*r
r5
3 *
to
<0
01 «
Q)
*
1Q)
3
§
«
*
V>?
»
" v
* O
**
M
Jg
UJ
s z
3
OM
S * 00
^
j
00
-i
O
O
C
$ 8
S 8
8.
......
.. ..
. .
....
...^
; .
i!
i ^
, ,
} i
I|
!y
j j
. ;
11^
'^
-^_
i si
O
"~~ >- _
__
=
i
2 2
o ^
! 01
^
- __
n *
8
^-^
=^
S!F=
="
|?
:
^5
.
1 "
5^
.»
&
-.,<
^ a*
; X
: /"
!;
. .
/' ..
.. i
. . .
.
DIS
CH
AR
GE
, IN
CU
BIC
FE
ET
PE
R S
EC
ON
D
P
$ *
O
O
G
3
0
0
G
3
O
S
O.
^
, ...
.......
: _
^>
' >
®
t
"*
B) If
-*»
«v
§ g
O
" ~"~
~~" K
^_
^-
§
^^
^
^4"
ft
Tg
S'-^
L .£
»
^^
^ ̂
/«
*"
* ^
^./ 8
10
-*
i - .
-=afc
- ci
J:
^k
*
^A
^
^
8
^
yO
:
>
li
:<
0
i /'"'
! i
:
- .
i .
, 1
, .
, ,
i ,
, :
o
oo 8
p 8o
o 8 oo 8
01 §° 00
en I 8
DIS
CH
AR
GE
, IN
CU
BIC
FE
ET
PE
R S
EC
ON
D.1 P 8
§ o
o
o

66°37'30
18*02'
17
18*00Base from USGS topo quad of Ponce, PR, Scale: 1:20,000
Figure 10. Location of Barrio Mameyes near the city of Ponce in southern Puerto Rico.

LU
OC
TO
BE
R 7
, 1985
GR
AN
GE
DE
MA
Y
18,
19
85
EX
PL
AN
AT
ION
UN
IT D
ISC
HA
RG
ES
FO
R
MA
XIM
UM
FL
OO
DS
AS
FO
LL
OW
S
SE
PT
EM
BE
R 8
. 1
98
0A
M
AY
1
7-1
8.
1985
OC
TO
BE
R 8
-7.
1985
4
8 8
10
2O
DR
AIN
AG
E A
RE
A.
M S
QU
AR
E M
ILE
S20
03
00
Fig
ure
11. C
om
pari
so
n o
f u
nit
dis
char
ges
du
rin
g t
he
1980
an
d
198S
flo
od
s In
Pu
erto
Ric
o.

19
COMPARISON OF THE 1985 FLOODS WITH HISTORICAL FLOODS (Continued)
The upper line in figure 11 represents the maximum known floods in the world expressed as a correlation between the unit discharge and the drainage area by the equation Q = 10,000/VA. This is commonly referred to as the "100 percent Myers rating." The lower line represents the "50 percent Myers rating" expressed by the equation Q = 5,000/</A.
The data from the 1985 floods show that the unit discharges were not as high as the 1960 events. At least five (5) events during the 1960 floods approached the 100 percent Myers rating. In general, unit discharges for the 1985 floods were in the vicinity of the 50 percent Myers curve. The only events of the 1985 floods that approached the record 1960 unit discharges occurred at the Rio Grande de Anasco near San Sebastian during the May event (table 2) and, the Rio Coamo near Coamo during the October event (table A).
SUMMARY
Puerto Rico was affected by severe floods twice during 1985. During May 15-19, 1985, a low-pressure system that moved from the north resulted in as much as 25 inches of precipitation over the south-central and up to 1A inches over the eastern basins of the island. Flooding was widespread along the mainstem and tributaries of the Rio Grande de Arecibo, the Rio Grande de Manati, and the Rio de La Plata on the north coast. Urban areas in the towns of Arecibo, Barceloneta, Jayuya, and Utuado were affected by the floods. Less severe flooding occurred at Caguas, Loiza, Dorado, Vega Baja, and Toa Baja. Property losses were estimated at about 37 million dollars.
The second flood event occurred during October 6-7, 1985. A nearly stationary tropical depression, preceded by several days of rainfall, resulted in record precipitation and floods along the south-central and eastern part of Puerto Rico. Precipitation totals were as high as 23 inches during 2A hours. Intensities of 5.5 inches in two hours were recorded near the city of Ponce. Flooding was severe and widespread from Santa Isabel to Ponce. The worst flooding occurred in the Rio Coamo basin, but was also significant along the north coast in the towns of Barceloneta, Arecibo, and Toa Baja. Recurrence intervals equal to or greater than 100 years were recorded at several index stations. Property damages were about 125 million dollars.
The rain and floods of October 6-7, 1985 resulted in landslides throughout the affected areas. The worst landslide occurred at Barrio Mameyes, near the city of Ponce. A slab of sandstone with a volume of about 260,000 cubic yards detached from a hill, destroying about 90 homes in the Mameyes community. The death total from the landslide was about 130 people.
The collapse of the approach section of the bridge over the Rio Coamo on Las Americas Expressway resulted in the death of 2A people. Flooding at the Quebrada del Agua, west of Ponce, resulted in an additional 16 fatalities.

20
REFERENCES CITED
Hickenlooper, I.J., 1968, Floods at Arecibo, Puerto Rico: U.S.Geological Survey Hydrologic Investigation Atlas HA-271, 1 plate.
Haire, W.J., 1971, Floods in the Santa Isabel Area, Puerto Rico: U.S. Geological Survey Hydrologic Investigations Atlas HA-448, 1 plate.
Haire, W.J., 1972, Floods of October 5-10, 1970 in Puerto Rico: U.S. Geological Survey Water Resources Bulletin 12, 38 p.
Johnson, K.G., and Carrasquillo, Ramdn, 1982, Floods of October 9, 1970 and September 16, 1975 at Jayuya, Puerto Rico: U.S. Geological Survey Water Resources Investigations 81-346, 1 plate.

Rib Grande de Arecibo at Sector Santa Barbara, near Arecibo, May 19, 1985.
Rio Grande de Arecibo at De Diego Expressway bridge In Arecibo, May 19, 1985.

Coamo Dam, downstream side, October 8, 1985.
Lago Coamo at Coamo dam, October 2O, 1985.