the floor of yellowstone lake is d anything but quiet—new … · 2008-01-07 · the floor of...
TRANSCRIPT

DThe Floor of Yellowstone Lake is Anything but Quiet—New Discoveries from High-Resolution Sonar Imaging, Seismic-Reflection Profiling, and Submersible Studies
By Lisa A. Morgan, Wayne C. Shanks III, Kenneth L. Pierce, David A. Lovalvo, Gregory K. Lee, Michael W. Webring, William J. Stephenson, Samuel Y. Johnson, Stephen S. Harlan, Boris Schulze, and Carol A. Finn
Chapter D ofIntegrated Geoscience Studies in the Greater Yellowstone Area— Volcanic, Tectonic, and Hydrothermal Processes in the Yellowstone Geoecosystem
Edited by Lisa A. Morgan
Professional Paper 1717
U.S. Department of the InteriorU.S. Geological Survey

Contents
Abstract .........................................................................................................................................................95Overview: History of Mapping Yellowstone Lake ...................................................................................95Geologic Setting ...........................................................................................................................................97Acknowledgments .......................................................................................................................................97Methods.........................................................................................................................................................97Results and Discoveries of High-Resolution Mapping ..........................................................................99
Topographic Margin of the Caldera .................................................................................................99Rhyolitic Lava Flows .........................................................................................................................103Large Hydrothermal-Explosion Craters .........................................................................................106Hydrothermal Vents and Domes on the Floor of Yellowstone Lake ..........................................107Siliceous Spires.................................................................................................................................112Fissures and Faults ...........................................................................................................................112Landslide Deposits............................................................................................................................116Submerged Shorelines ....................................................................................................................116Glacial Deposits and Features ........................................................................................................117
Discussion ...................................................................................................................................................117Newly Discovered Features in Yellowstone Lake Pose Potential Geologic Hazards ...........117Do Rhyolitic Lava Flows Control Hydrothermal Activity? ...........................................................118
Summary and Conclusions .......................................................................................................................120References Cited........................................................................................................................................120
Plates[In pocket]
1. Series of maps showing the evolution of mapping Yellowstone Lake over the past 130 years.
2. Bathymetric map of Yellowstone Lake. 3. High-resolution bathymetric images in the northern part of Yellowstone Lake.
Figures 1. Maps of Yellowstone National Park: A. Index map showing the Yellowstone caldera .................................................................98 B. Geologic shaded-relief map of area surrounding Yellowstone Lake ..........................98 C. Color shaded-relief-image aeromagnetic map ..............................................................98 2. High-resolution bathymetric maps of Yellowstone Lake: A. West Thumb basin .............................................................................................................100 B. Northern basin ...................................................................................................................100 C. Central basin ......................................................................................................................101 D. South, Southeast, and Flat Mountain Arms ..................................................................102 3. Geologic map of Yellowstone Lake ........................................................................................104
4. High-resolution seismic-reflection images of: A. Northwestern West Thumb basin ...................................................................................107 B. Elliott’s explosion crater ...................................................................................................107 5. Distribution of hydrothermal vents in Yellowstone Lake shown
on blue-shaded bathymetric map ..........................................................................................108 6. High-resolution images and simplified map of the “inflated plain”
in northern basin of Yellowstone Lake: A. Blue-shaded-relief bathymetric map of the northern basin .......................................109 B. Aeromagnetic map of the northern basin .....................................................................109 C. Map showing deformation of the Yellowstone caldera from 1923–1975 ..................109 D. Gray-shaded-bathymetric close-up of the “inflated plain” ........................................110 E. Gray-scale-amplitude map of the “inflated plain” .......................................................110 F. Two-dimensional color-bathymetric map of the “inflated plain” ..............................110 G. Three-dimensional color-shaded-relief image of the “inflated plain” .....................110 7. Annual lake-level variations in Yellowstone Lake ...............................................................113 8. Siliceous spires in Bridge Bay in northern basin of Yellowstone Lake: A. Bathymetric image of spires ............................................................................................114 B. Photographs of exterior and interior of a siliceous spire ...........................................114 C. SEM image of diatoms, silicified filamentous bacteria, and amorphous silica
from a spire sample ..........................................................................................................114 D. Summary bar graph of chemical analyses of spire samples .....................................114 9. Monument Geyser Basin: A. Photograph of Monument Geyser Basin .......................................................................115 B. Index map ...........................................................................................................................115 C. Photograph looking south into Monument Geyser Basin ...........................................115 D. Photograph of spire-like structures, northern edge of Monument Geyser Basin ..115 E. Photograph of spire-like structure actively venting steam and H2S .........................115 F. Underwater photograph of large spire structure in Bridge Bay
in northern basin of Yellowstone Lake ...........................................................................115 10. Flow model for hydrothermal vents and rhyolitic lava flows in Yellowstone Lake: A. Schematic diagram showing physical features of a rhyolitic lava flow ..................119 B. Fluid-flow model with no caprock ..................................................................................119 C. Fluid-flow model with caprock ........................................................................................119 D. Map showing locations of hydrothermal vents on the northern
Yellowstone Lake floor ......................................................................................................119 E. Fluid-flow model that includes a basal breccia zone beneath
an impermeable lava flow ................................................................................................119
Appendix
D-1. Digital models and visualizations of bathymetry and topography in the Yellowstone Lake area, by Gregory K. Lee and Michael W. Webring ....................................................125

The Floor of Yellowstone Lake is Anything but Quiet— New Discoveries from High-Resolution Sonar Imaging, Seismic-Reflection Profiling, and Submersible Studies
By Lisa A. Morgan,1 Wayne C. Shanks III,1 Kenneth L. Pierce,2 David A. Lovalvo,3 Gregory K. Lee,1 Michael W. Webring,4 William J. Stephenson,5 Samuel Y. Johnson,6 Stephen S. Harlan,7 Boris Schulze,8 and Carol A. Finn4
“…we arrived at the summit of the first ridge…It was a pretty steep climb to the top of it, over a volcanic sand composed of broken down obsidian which composed the only rocks around us.” Albert Peale, mineralogist, U.S. Geological Survey, Hayden survey, August 6, 1871.
Abstract
Discoveries from multibeam sonar mapping and seis-mic-reflection surveys of Yellowstone Lake provide new insight into the recent geologic forces that have shaped a large lake at the active front of the Yellowstone hot spot, a region strongly affected by young (<2 m.y.), large-volume (>100–1,000s km3) silicic volcanism, active tectonism, and accompanying uplift.
Specifically, our mapping has identified the extent of postcaldera-collapse volcanism and active hydrothermal processes occurring above a large magma chamber beneath the lake floor. Multiple advances and recessions of thick glacial ice have overlapped volcanic and hydrothermal activity leaving a lake basin that has been shaped predominantly by fire and ice. Yellowstone Lake has an irregular bottom covered with dozens of features directly related to hydrothermal, tectonic, volcanic,
1U.S. Geological Survey, Box 25046, MS 973, Federal Center, Denver, CO 80225, [email protected].
2U.S. Geological Survey, Northern Rocky Mountain Science Center, Box 173492, Montana State University, Bozeman, MT 59717.
3Eastern Oceanics, Inc., 25 Limekiln Rd., W. Redding, CT 06896.
4U.S. Geological Survey, Box 25046, MS 964, Federal Center, Denver, CO 80225.
5U.S. Geological Survey, Box 25046, MS 966, Federal Center, Denver, CO 80225.
6U.S. Geological Survey, 400 Natural Bridges Drive, Santa Cruz, CA 95060.
7George Mason University, Department of Geography and Earth Systems Science, 4400 University, MS 5F2, Fairfax, VA 22030-4444.
8L-3 Communication Elac Nautik GmbH Neufeldtstrasse, D-24118 Kiel, Germany.
and sedimentary processes. Detailed bathymetric, seismic-reflection, and magnetic evidence reveals that rhyolitic lava flows underlie much of Yellowstone Lake and exert fundamental control on lake morphology and localization of hydrothermal activity in the northern, West Thumb, and central basins. Many previously unknown features have been identified and include more than 660 hydrothermal vents, several very large (>500-m diameter) hydrothermal-explosion craters, many small hydrothermal-vent craters (~1- to 200-m diameter), domed lacustrine sediments related to hydrothermal activity, elongate fissures cutting postglacial sediments, siliceous hydrothermal-spire structures, sublacustrine landslide deposits, submerged former shorelines, large glacial melting features, incipient faulting along the trace of the Eagle Bay fault zone, and a recently active graben. Sampling and observations with a submersible remotely operated vehicle confirm and extend our understanding of the identified features. Faults, fissures, hydrothermally inflated domal structures, hydrothermal-explosion craters, and sublacustrine landslides constitute potentially significant geologic hazards. Toxic elements derived from hydrothermal processes also may significantly affect the Yellowstone ecosystem.
Overview: History of Mapping Yellowstone Lake
Yellowstone Lake (fig. 1A) is the largest high-altitude lake in North America with an altitude of 2,357 m and a surface area of 341 km2 (pl. 1). More than 141 rivers and streams flow into the lake. The Yellowstone River, which enters at the south end of the Southeast Arm, dominates the inflow of water and sediment. The only outlet from the lake is at Fishing Bridge (fig. 1B) where the Yellowstone River flows north and discharges 375–4,600 cfs (http://nwis.waterdata.usgs.gov; accessed 3/30/2005).
The earliest attempt to produce a detailed map of the shoreline and bathymetry of Yellowstone Lake occurred during the 1871 U.S. Geological Survey (USGS) expedition.

96 Integrated Geoscience Studies in the Greater Yellowstone Area
Ferdinand V. Hayden led 28 scientists, scouts, and cooks in a survey of what is now known as Yellowstone National Park (Merrill, 1999). The sheer effort expended by this group in the most primitive of working conditions in tandem with the many accomplishments of the survey is impressive. A primary goal of the 1871 Hayden party was “***mak(ing) a most thorough survey of it [Yellowstone Lake]” (F.V. Hayden, letter of June 4, 1871, to Professor Spencer Fullerton Baird, in Merrill, 1999) and reflects Hayden’s general interest in watersheds and river drainage basins (M.D. Merrill, written commun., 2002). A 4.5-ft by 11-ft (1.4-m by 3.4-m) oak boat with a woolen-blanket sail (A. Peale, July 28, 1871, in Merrill, 1999) was used to map Yellowstone Lake. Mapping took 24 days and included approximately 300 lead-sink soundings (pl. 1B). Navigation was carried out using a prismatic compass. As Albert Peale (Merrill, 1999) described in his journal, “a man stands on the shore with a compass and takes a bearing to the man in the Boat as he drops the lead, giving a signal at the time. Then the man in the Boat takes a bearing to the fixed point on the shore where the first man is located and thus the soundings will be located on the chart****[Elliott will] make a systematic sketch of the shore with all its indentations [from?] the banks down, indeed, making a complete topographical as well as a pictorial sketch of the shores as seen from the water, for a circuit of at least 130 mi (209 km). He will also make soundings, at various points” (A. Peale, July 1871, in Merrill, 1999). The survey mapped a shoreline of 130 mi (209 km); the most recently mapped shoreline shows the perimeter of Yellowstone Lake to be 227 km. More than 40 soundings were taken along the north and west shores in the Hayden survey, the deepest being around 300 ft (91 m). The survey estimated the deepest part of the lake would be farther east and no deeper than 500 ft (152 m) (Merrill, 1999). This depth range is comparable to what we know today; the deepest point in Yellowstone Lake is due east of Stevenson Island (pl. 2, pl. 3B) at 131 m deep (Kaplinski, 1991; this study). In addition, the Hayden survey identified the long northeast-trending trough crossing the central basin. Plate 1 shows the map of Yellowstone Lake as drawn by Henry Elliott of the Hayden survey (oral commun., Marlene Merrill, 2000). The map not only shows a detailed topographical sketch of the Yellowstone Lake shoreline, but many of the points where soundings were taken for the survey.
A second map of Yellowstone Lake incorporated elements of the original 1871 Elliott map from the Hayden expedition and was published in 1896. Even though no mention is made in the official U.S. Geological Survey report (Hague and others, 1896) of additional mapping or modifications made to the Elliott Yellowstone Lake map during the years of the Hague survey (1883–89, 1890–91, and 1893), clearly the lake was resurveyed and triangulated by H.S. Chase and others—this information is shown on maps in the Hague report (see plate 1D). The 1896 map built upon the Elliott map and refined areas on the shoreline, such as in the Delusion Lake area between Flat Mountain Arm and Breeze Point. Where the Elliott map of Yellowstone Lake
shows Delusion Lake as an arm of the lake, the Hague map delineates the boundaries of Delusion Lake and identifies swampy areas nearby. The maps from the Hague survey of Yellowstone National Park also include a rather sophisticated geologic map of portions of the park around the lake.
The next significant attempts to map Yellowstone Lake came a hundred years later (Otis and others, 1977; Kaplinski, 1991). Kaplinski (1991) employed a single-channel echo sounder and a mini-ranger for navigation requiring interpolation between track lines. More than 1,475 km of sonar profiles were collected in 1987 using track lines spaced approximately 500 m apart and connected by cross lines spaced 1 to 2 km apart. An additional 1,150 km of sonar profiles were collected in 1988 to fill in data gaps from the 1987 survey. The map identified many thermal areas on the floor of the lake. The bathymetric map produced by Kaplinski (1991) (pl. 1E) has served as the most accurate lake map for Yellowstone National Park for more than a decade and has proven invaluable in addressing serious resource-management issues, specifically monitoring and catching the aggressive and piscivorous lake trout. The lake trout is estimated to consume as many as 60 native Yellowstone Lake cutthroat trout per year (Ruzycki and Beauchamp, 1997).
Ten years after the Kaplinski (1991) bathymetric map, development of global-positioning technology and high-resolution multibeam sonar imaging justified a new, high-resolution mapping effort of the lake. Mapping and sampling conducted in 1999 through 2002 as a collaborative effort between the U.S. Geological Survey, Eastern Oceanics, Inc., and the National Park Service (NPS) (Yellowstone National Park) utilized state-of-the-art bathymetric, seismic, and submersible remotely operated vehicle (ROV) equipment to collect data along 200-m track lines with later infill, where necessary. The 1999–2002 mapping effort of Yellowstone Lake took 62 days during a 4-year period—compared to Hayden’s survey of 24 days in 1871—and began in 1999 with mapping the northern basin, continued in 2000 in West Thumb basin, in 2001 in the central basin, and in 2002 in the southern part of the lake including the Flat Mountain, South, and Southeast Arms (see inset in pl. 2). A small area, informally referred to as the “inflated plain,” in the northern basin was resurveyed in 2002. In 2003, seismic-reflection profiles were collected in the South and Southeast Arms. Unlike any of the previous mapping efforts of Yellowstone Lake, the 1999–2002 swath, multibeam survey produced continuous overlapping coverage that collected more than 240 million soundings and produced high-resolution bathymetric images. Seismic-reflection records of the upper 25 m of the lake bottom were obtained along with the bathymetry of the entire lake. This effort has resulted in a map that is accurate to <1 m in most areas. The following report focuses on results of this mapping effort and the interpretation of newly discovered features.

97 The Floor of Yellowstone Lake is Anything but Quiet— New Discoveries
Geologic Setting
Powerful geologic processes in Yellowstone National Park have contributed to the unusual shape of Yellowstone Lake, which straddles the southeast margin of the Yellowstone caldera (fig. 1), one of the world’s largest active silicic volcanoes (Mason and others, 2004). Volcanic forces contributing to the lake’s form include the explosive caldera-forming 2.05-Ma eruption of the Huckleberry Ridge Tuff followed by eruption of the 0.64-Ma Lava Creek Tuff to form the Yellowstone caldera (Christiansen, 1984, 2001; Hildreth and others, 1984; U.S. Geological Survey, 1972). Following explosive, pyroclastic-dominated activity, large-volume rhyolitic lava flows were emplaced along the caldera margin, infilling much of the caldera (figs. 1A and 1B). A smaller caldera-forming event about 200 ka (Morgan and Shanks, 2005), comparable in size to Crater Lake, Oreg., created the West Thumb basin (Christiansen, 1984; U.S. Geological Survey, 1972). Several significant glacial advances and recessions continued to shape the lake and overlapped the volcanic events (Pierce, 1974, 1979; Richmond, 1976, 1977). Glacial scour deepened the central basin of the lake and the faulted South and Southeast Arms (fig. 1B). More recent dynamic processes shaping Yellowstone Lake include currently active fault systems, development of a series of postglacial-shoreline terraces, and postglacial (<15–12 ka) hydrothermal-explosion events that created the Mary Bay hydrothermal-explosion crater complex and other craters.
Formation of hydrothermal features in Yellowstone Lake is related to convective-meteoric hydrothermal-fluid circulation, steam separation during fluid ascent, and possible CO
2
accumulation and release above an actively degassing magma chamber. Hydrothermal explosions result from accumulation and sudden release of steam and (or) CO
2, possibly reflect
ing changes in confining pressure that accompany, and may accelerate, failure and fragmentation of overlying lithologies. Sealing of surficial-discharge conduits due to hydrothermal-mineral precipitation contributes to overpressuring and catastrophic failure. Heat-flow maps show that both the northern and West Thumb basins of Yellowstone Lake have extremely high heat flux (1,650–15,600 mW/m2) compared to other areas in the lake (Morgan and others, 1977). Earthquake epicenter locations indicate that the area north of the lake is seismically active (Smith, 1991), and ROV studies identify hydrothermally active areas within the lake (Balistrieri and others, this volume; Klump and others, 1988; Remsen and others, 1990; Shanks and others, this volume).
The objective of the present work is to understand the geologic processes that shape the lake floor. Our three-pronged approach to mapping the floor of Yellowstone Lake located, imaged, and sampled bottom features, such as sublacustrine hot-spring vents and fluids, hydrothermal deposits, hydrothermal-explosion craters, rock outcrops, glacial features, slump blocks, faults, fissures, and submerged shorelines.
Acknowledgments
We thank Kate Johnson, Ed duBray, Geoff Plumlee, Pat Leahy, Steve Bohlen, Tom Casadevall, Linda Gundersen, Denny Fenn, Elliott Spiker, Dick Jachowski, Mike Finley, John Varley, Tom Olliff, and Paul Doss for supporting this work. We gratefully acknowledge our collaboration and work with individuals from L-3 Communications, Jorg Duhn, Joerg Brockhoff, and Peter Gimpel. We thank Dan Reinhart, Lloyd Kortge, Paul Doss, Rick Fey, John Lonsbury, Ann Deutch, Jeff Alt, Julie Friedman, Brenda Beitler, Charles Ginsburg, Jim Bruckner, Pam Gemery, Rick Sanzolone, Dave Hill, Bree Burdick, Erica Thompson, Eric White, Bob Evanoff, Wes Miles, Rick Mossman, Gary Nelson, Christie Hendrix, Tim Morzel, and many others for assistance with field studies. We thank Marlene Merrill for use of the map by Henry Elliott of the 1871 Hayden survey. We thank Bob Christiansen, Karl Kellogg, Geoff Plumlee, Paul Carrara, Ian Ridley, and Tom Judkins for constructive reviews that substantially improved the manuscript. We are grateful to Coleen Chaney, Debi Dale, Joan Luce, Mary Miller, Vicky Stricker, Sandie Williamson, and Robert Valdez for their skillful assistance with project logistics. This research was supported by the U.S. Geological Survey, the National Park Service, and the Yellowstone Foundation.
Methods
Surveys of Yellowstone Lake (fig. 1A; pl. 2) between 1999–2002 (Morgan and others, 2003) utilized state-of-theart bathymetric, seismic (except for the South, Southeast, and Flat Mountain Arms survey in 2002), and submersible remotely operated vehicle equipment. The multibeam swath-bathymetric surveys employed a SeaBeam 1180 (180 kHz) instrument with a depth resolution of <1 percent of the water depth. Water depth varied from ~4–133 m in the survey areas. The multibeam instrument uses 126 beams arrayed over a 150° ensonification angle to map a swath width of 7.4 times water depth. Sub-bottom seismic-reflection profiling utilized an EdgeTech SB-216S, which sweeps a frequency range from 2–10 kHz and has a beam angle of 15°–20°. Both the swath-unit transducer and the sub-bottom unit were rigidly mounted to the transom of an 8-m-long aluminum boat used for survey purposes. The new survey, which was navigated to an accuracy of <1 m using differential GPS, utilized more than 240 million soundings to produce high-resolution continuous overlapping coverage of the lake’s bathymetry. In 1999, 2000, and 2001, we also surveyed more than 2,500 linear km with high-resolution seismic-reflection profiling that penetrated the upper ~25 m of the lake bottom. In 2003, additional seismic-reflection data was collected in the South, Southeast, and Flat Mountain Arms.

N
0 10 20 30 40 50 KILOMETERSA
X
X
Yellowstone Lake
Yellowstone National Park
2.05-Ma Huckleberry Ridge caldera boundary
Postcollapse rhyolite lava flowsHot spring areas
0.64-Ma Yellowstone caldera boundary
Lava Creek Tuff
Norris-Mammoth
Corridor
Resurgent domesYellowstone
Plateau MGB
PB
98 Integrated G
eoscience Studies in the Greater Yellow
stone Area
IP TL PV
SoutheastArm
SouthArm
LV SPt
SP
MB
SI
Tvu
Tvu
Eagle Bayfault
Qpcp
Qpca
Qs
Qs
Qs
Qpca
Qpci
Qpcd
Qpcu
Qpcw
Qpce
Qpce
Qpce
Qpcw
Qpcw
Qs Qs
Qs
Qpcu Qpcpv
Tvu
Tvu
Tvu
Qps
Qpca
West Thumbbasin
Northernbasin
YELLOWSTONE CALDERAMARGIN
Qy
Tvu(?)
Central basin
LB
AbsarokaRange
ThePromontory
FlatMtn.Arm
Tvu
Tvu
Tvu
Tvu
TMzs
Qy
Qhe
Qhe
Qy Qy
Qy
Qpcn
DI
FI PPt
PP
DL
Qmf
Qy
Qy B
110°40' 110°30'
FB
105.4 -47.1 -134.8 -203.5 -257.3 -310.1 -413.6
nt
110°20' 110°10' 110°10'
44°35'
44°30'
44°25'
44°20'
44°15' l
Spruce Creekflow
Tv(?) Tv
Tv
Tv
Tv?
Qpcd
Qpcw
Qpca
Qpca
AsterCreekflow
Pelican Valleyflow
ElephantBack flow
ElephantBack flow
Dry Creekflow
Qpcpv
Qpce
Qpcn
WestThumb
flow
PloverPoint
44°36'
44°15'
110°40'
C
0 5 10 KILOMETER

99 The Floor of Yellowstone Lake is Anything but Quiet— New Discoveries
The Eastern Oceanics submersible ROV is small (~1.5 m amplitude magnetic lows in the reduced-to-the-pole magnetic × 1 m × 1 m) and attached to the vessel with a 200-m tether. map (Finn and Morgan, 2002) (fig. 1C). The anomalies coin-The ROV provides live video coverage and remote control of cide with bathymetric troughs (figs. 2B, 2C, and 2D)cameras and sampling equipment. The ROV has a full-depth identified by the new mapping. The location of the caldera rating of 300 m and is capable of measuring temperature, west of Frank Island continues through a series of subtle conductivity, depth, and retrieving hydrothermal-vent-water bathymetric lows toward the head of Flat Mountain Arm. samples and rock samples as long as 40 cm. Here, the caldera margin separates Tertiary andesitic rocks
and pre-caldera and caldera-forming rhyolitic ignimbrites to the south from young, postcollapse rhyolitic lava flows to the north and northwest (U.S. Geological Survey, 1972; Results and Discoveries of High-Christiansen, 2001).
Resolution Mapping Pronounced magnetic highs over much of the Absaroka Range along the eastern side of Yellowstone Lake (fig. 1C) are related to rugged topographic relief and highly magnetizedTopographic Margin of the Caldera Tertiary andesitic debris flows, dikes, and lava flows (Smedes and Prostka, 1972). Similar magnetic anomaliesGeologic maps (U.S. Geological Survey, 1972; Christiansen, over The Promontory, which separates South Arm from 2001; Richmond, 1974) estimate the underwater topographic Southeast Arm (figs. 1B and 2D), are associated with Tertiary margin of the Yellowstone caldera in Yellowstone Lake to be andesitic lava and debris flows prominently exposed in cliffs between the western entrance to Flat Mountain Arm and north
of Lake Butte (fig. 1B). Our mapping of the central basin of several hundred meters thick. The same magnetic signature
Yellowstone Lake in 2001 clearly identified the topographic occurs along the eastern shore of the lake north and slightly margin of the 0.64-Ma Yellowstone caldera as a series of west of Park Point, where a thin exposure of the Lava Creek elongated troughs northeast from Frank Island across the deep Tuff overlies the magnetically dominant Tertiary volcanic basin of the lake. Based on our new data and high-resolution rocks. North and east of Plover Point in southern Yellowstone aeromagnetic data (Finn and Morgan, 2002), we infer the Lake, the magnetic signature is similar to that of nearby topographic margin of the Yellowstone caldera to pass through Tertiary volcanic rocks; we suggest Tertiary volcanic rocks the southern part of Frank Island (pl. 2; figs. 1 and 3). are present at depth and are overlain by younger Yellowstone
East and north of Frank Island, the topographic margin Group volcanic rocks (figs. 1C and 2D). These positive mag-of the caldera follows a series of discontinuous moderate- netic anomalies are caused by Tertiary volcanic rocks at
Figure 1. Maps of Yellowstone National Park. A, Index map showing the 0.64-Ma Yellowstone caldera, the distribution of its erupted ignimbrite (Lava Creek Tuff, medium gray), postcaldera rhyolitic lava flows (light gray), subaerial hydrothermal areas (red), and the two resurgent domes (shown as ovals with faults). The inferred margin of the 2.05-Ma Huckleberry Ridge caldera is also shown. Data are from (Christiansen, 2001). Locations of Monument Geyser Basin (MGB) and Pocket Basin (PB) are shown. B, Geologic shaded-relief map of the area surrounding Yellowstone Lake in Yellowstone National Park. Geologic mapping is from U.S. Geological Survey (1972), and Yellowstone Lake bathymetry is from Kaplinski (1991). The lithologic symbols are as follows: Qpci: tuff of Bluff Point; Qpcd: Dry Creek flow; Qpca: Aster Creek flow; Qpcw: West Thumb flow; Qpce: Elephant Back flow; Qpcu: Spruce Creek flow; Qpcn: Nez Perce flow; Qpcp: Pitchstone Plateau flow; Qpcpv: inferred “Pelican Valley flow”; Qs: Quaternary sediments (yellow); Qh: hydrothermal deposit; Qhe: hydrothermal explosion deposit; Qhi: cemented ice-contact deposits localized by hot springs; Qy: Quaternary Yellowstone Group ignimbrites (brown) (Christiansen, 2001; U.S.Geological Survey, 1972); Qyl: Lava Creek Tuff; Tyh: Huckleberry Ridge Tuff; Tvu: Tertiary volcanic rocks, undifferentiated; TMzs: Tertiary and Mesozoic sediments, undifferentiated. Location of Yellowstone caldera margin is from Christiansen (1984) with slight modifications from Finn and Morgan (2002). DI: Dot Island; DL: Duck Lake; FB: Fishing Bridge; FI: Frank Island; IP: Indian Pond; LB: Lake Butte; LV: Lake Village; MB: Mary Bay; PPt: Park Point; PV: Pelican Valley; PP: Plover Point; SI: Stevenson Island; SP: Sand Point; SPt: Storm Point; TL: Turbid Lake. Several postcaldera rhyolitic lava flows, outlined in white, shown in the lake are highlighted to emphasize their distribution in Yellowstone Lake. C, Color shaded-relief image of high-resolution, reduced-to-the-pole aeromagnetic map (Finn and Morgan, 2002). Sources of the magnetic anomalies are shallow and include the postcaldera rhyolite lava flows (some outlined in white) that have partly filled the Yellowstone caldera. Commonly, rhyolitic lava flow margins have low permeability glassy rinds that are not subject to hydrothermal alteration and produce distinctive positive magnetic anomalies. Extensive areas of negative magnetic anomalies in the West Thumb and northern basins and along the caldera margin northeast of the lake are areas of high heat flow and intense present and past hydrothermal alteration, as suggested by sublacustrine-vent locations (fig. 1B). Several postcaldera rhyolitic lava flows, outlined in white, shown in the lake are highlighted to emphasize their distribution in Yellowstone Lake. See figure 1B for descriptions of geologic units.

LakeVillage
West Thumb basin Northern basin 100
Integrated Geoscience Studies in the G
reater Yellowstone A
rea
Qs Qs
Qs
Qs
Qps
Qps
Qh
Qhe
Qpce
Qpcd
Qpcd
Qpcd
Qpcw Qpce
Qpce
Qpcw
West Thumboutlet to
YellowstoneLake
1 km
Qh
Qpcd
Submergedlakeshoreterraces
Hydrothermalvents
Hydrothermalvents
Explosioncrater Lava
flows
Lavaflows
Submergedlakeshoreterraces
DuckLake
N
Qs
Qp ce
Qpce
Qpce
Qs
Qs Qyl Qci
Qh e
Tl
Qyl
Tl
Qyl
Qs Tl
Qs
Qpcw
Qpcw
Qpcw
110°16'
'
110°24'
'
110°22'
'
110°26'
YellowstoneRiver
Qpcw
Qyl
SandPt.
Qyl
Landslidedeposits
Calderamargin
Hydrothermalvents
Ejectadeposits
Explosioncraters
Lake Hotelgraben
Spirefield
Fissures
PelicanRoost
Lavaflows
Lavaflows
StormPoint
Indian Pond
Qhe
Mary Bay
TurbidLake
SteamboatPoint
Hydrothermalvents
Submergedlakeshoreterraces
StevensonIsland
Elliott'scrater
PelicanValleyA
A
A'
B
B
B'
GullPt.
BridgeBay
44°28'
44°26'
44°24'
110°34' 110°30'110°32'
1 km
110°18'110°20'
44°35'
44°30'
44°31'
44°32'
44°33'
44°34'
Figure 2. Close-up images of Yellowstone Lake bathymetric maps. A, New high-resolution bathymetric map of the West Thumb basin of Yellowstone Lake, acquired by multibeam-sonar imaging and seismic mapping in 2000, showing a previously unknown ~500-m-wide hydrothermal-explosion crater (east of Duck Lake), numerous hydrothermal vents, submerged lakeshore terraces, and rhyolitic lava flows that underlie 7–10 m of postglacial sediments. See figure 1B for descriptions of geologic units.B, High-resolution bathymetric map of the northern basin of Yellowstone Lake, acquired in 1999, showing large hydrothermal-explosion craters in Mary Bay and south–southeast of Storm Point, numerous smaller craters related to hydrothermal vents, and landslide deposits along the eastern margin of the lake near the caldera margin (fig. 1). Postcaldera rhyolitic lava flows underlie much of the northern basin. See fig. 1B for descriptions of geologic units. Fissures west of Stevenson Island and the graben north of it may be related to the young Eagle Bay fault (see fig. 1B). C, High-resolution bathymetric map of the central lake basin, acquired by multibeam-sonar imaging and seismic mapping in 2001,showing the Yellowstone caldera topographic margin, a large hydrothermal-explosion crater south of Frank Island, and numerous faults, fissures, and hydrothermal vents as indicated. See figure 1B for descriptions of geologic units.

central basin
The Floor of Yellowstone Lake is A
nything but Quiet—
New
Discoveries
101
Qs
Tvu?
Tvu
Qs
Tvu
Tvu
Tvu?
ParkPoint
FrankIsland
DotIsland
Lavaflows
Calderamargin
Explosioncrater
Explosioncrater?
Hydrothermalvents
Hydrothermalvents
Lavaflow
1 km
Qpca
Qpca
Eagle Bayfault zone
Rock Point Fissures
Breeze Point
Qpce
Qpca
Qy
Central basin
Qpcw
Qpcw
110°27'30" 110°20'
Delusio
n Lake
ElkPoint
Qs
Qs
Qs
Qs
Qs
44°30'
44°25'
C

Figure 2d.Yellowstone LakeMorgan et al
South, Southeast, and Flat Mountain Arms
1 km
"Potholes ofthe Southeast Arm"
DelusionLake
AlderLake
Eagle Bayfault zone
Calderamargin
PloverPoint
SouthArm
Flat MountainArm
SoutheastArm
Qs Qs
Qs
Qs
Qs
Qs
Qs
Qs
Qpca
Qmf
Qmf Qmf
Tyh
Tyh
Qyl
Qyl
Qyl
Qyl
Qyl
TMzs
TMzs
TMzs
Tvu
Tvu
Tvu
Tvu
Tvu
Tvu
Tvu
Tvu
1 km
D
102 Integrated G
eoscience Studies in the Greater Yellow
stone Area
D, High-resolution bathymetric map of the South, Southeast, and Flat Mountain Arms, acquired by multibeam-sonar imaging in 2002, showing the glaciated landscape of the lake floor in the southernmost part of Yellowstone Lake and several faults. The bathymetry in the Southeast Arm contains many glacial-meltwater and stagnant-ice-block features; the area, informally referred to as the “Potholes of the Southeast Arm,” resembles much of the kettle-dominated topography mapped by Ken Pierce and others in Jackson Hole, Wyo. See fig. 1B for descriptions of geologic units. The inset is a gray-shaded-relief map of “ThePotholes” in Jackson Hole. Image from Good and Pierce (1996).

The Floor of Yellowstone Lake is Anything but Quiet— New Discoveries 103
the surface, as exposed at The Promontory and in the Absaroka Range; alternatively, Tertiary volcanic rocks are buried at shallow depths in the lake, such as north of Plover Point extending northward into the southern third of Frank Island (Finn and Morgan, 2002). The high amplitude of the magnetic anomaly over the southern part of Frank Island is comparable to that present in the Absaroka Range, immediately to the east, or on The Promontory, suggesting a similar Tertiary source.
In contrast, the moderate amplitudes of positive magnetic anomalies in the reduced-to-the-pole map over the northern part of Frank Island are similar to those associated with postcollapse rhyolitic lava flows, such as seen in much of the West Thumb, Hayden Valley, and Aster Creek flows (figs. 1B and 1C) (Finn and Morgan, 2002). The topographic margin of the caldera immediately south of Frank Island may be represented by a series of concentric zones, possibly related to down-dropped (toward the north) blocks on the topographic margin of the caldera margin (fig. 2C). These areas may contain significant amounts of Tertiary volcanic rock as part of the slumped caldera wall, contributing to the magnetic signature seen in the reduced-to-the-pole aeromagnetic map of the southern third of Frank Island (fig. 1C).
Several blocks of slumped or detached material may be present along the eastern shore of Yellowstone Lake and may be associated with formation and development of the Yellowstone caldera or with sliding of detritus off the steep slopes of the highly altered terrain of the Absaroka Range, immediately to the east (pl. 2). A couple of these proposed slump blocks are located outside of, but close to, the southeastern caldera boundary. Another block lies slightly farther north and is just along and within the caldera boundary (fig. 3). We propose this block may be a slumped wall of the caldera or a detached block of material that slid off the adjacent steep-sloped Absaroka Range; it is due west of Elk Point (fig. 2C) where bathymetric mapping shows a slab-like structure rising 40 m from the lake floor. The reduced-to-the-pole magnetic map (Finn and Morgan, 2002) shows a moderate-amplitude anomaly associated with this structure, slightly different in magnetic signature than that described for the majority of Tertiary volcanic rocks in the area. Perhaps this structure is a rotated block of Tertiary volcanic material. Alternatively, this structure may be a northeastward extension of a thin section of the postcollapsecaldera Aster Creek rhyolite flow that appears separated from the main unit by glacial scouring. The thickest ice cap (>1 km) in the most recent glacial period resided in the central basin of Yellowstone Lake (Pierce, 1979). Additional areas of northeast-trending glacial scour can be seen immediately west of the deep central basin and continuing south onto land in the Delusion Lake area between West Thumb basin and Flat Mountain Arm (fig. 2D).
Rhyolitic Lava Flows
Large-volume subaerial rhyolitic lava flows (tens of cubic kilometers) on the Yellowstone Plateau control much of the local topography and hydrology. Characteristic lava-flow morphologies include near-vertical margins (some as high as 375 m, Christiansen, 2001), rubbly flow carapaces, hummocky or ridged tops, and strongly jointed interiors. Stream drainages tend to occur along flow boundaries, rather than within flow interiors (fig. 1B). Many flows have vitrophyric exterior rinds with shrinkage cracks and sheet-jointed crystallized interior zones. Spherulitic and lithophysal zones commonly include large cavities. Breccias occur locally.
A major discovery of the lake surveys is the presence of previously unrecognized rhyolitic lava flows underlying much of the lake floor. We believe the lava flows are key to controlling many morphologic and hydrothermal features in the lake.
Shelf areas of the lake bottom around the perimeter of the West Thumb, northern, and central basins (figs. 2A, 2B, 2C, and 3; pl. 2) have steep, nearly vertical margins, bulbous edges, and irregular hummocky surfaces, similar to postcollapse rhyolitic lava flows of the Yellowstone Plateau. Seismic-reflection profiles in the near-shore areas of West Thumb basin show high-amplitude reflectors beneath about 7–10 m of layered lacustrine sediments (fig. 4A). We interpret these sublacustrine features to be sediment-veneered rhyolitic lava flows that partly fill the interior of the 140-ka West Thumb caldera.
Based on air-gun seismic-reflection data, Otis and others (1977) recognized a high-amplitude reflector at various depths beneath glaciolacustrine sediments in the lake. Despite the hummocky top to the reflector and the extensive exposures of postcollapse rhyolitic lava flows nearby to the west and northwest of Yellowstone Lake, the reflector was misidentified as the Lava Creek Tuff. Whereas the Lava Creek Tuff and the postcollapse lava flows are both high-silica rhyolites, many of their physical properties differ, such as cooling-zonation patterns and magnetic characteristics; these differences have significant implications for localization of hydrothermal activity.
Unaltered, topographically high, postcollapse rhyolite flow deposits produce moderate-amplitude positive magnetic anomalies. Smaller areas within the flows show magnetic lows that are related to topographically low basins and faults as well as hydrothermally altered areas (Finn and Morgan, 2002). In contrast to the rhyolite flows whose vertical and vitric edges are easily discerned on the reduced-to-the-pole aeromagnetic map, the wide range of bulk-susceptibility values and the ignimbrite’s tendency to have its vitrophyre as a horizontal basal layer rather than a vertical edge preclude clear identification of the Lava Creek Tuff as an individual geologic unit on the high-resolution aeromagnetic map. Positive anomalies are observed over the most magnetic and thickest (50–100 m) sections of the ignimbrite in elevated terrain (Finn and Morgan, 2002).
Areas such as the West Thumb and Potts Geyser Basins in West Thumb basin (pl. 1F) and Mary Bay in the northern basin, currently have extremely high heat-flow values (1,650–15,600 mW/m2; Morgan and others, 1977), high

11,000
Sediments
Shallow-lake sediments—Shallow water deposits and submerged shoreline deposits
Deep-lake sediments—Laminated deep-basin depositsHydrothermal-explosion deposits
Hydrothermal deposits
Landslide deposits
Talus and slope deposits
Glacial(?) deposits
QUATERNARY UNITS
Qs
Ql
Qld
Qhe
Qh
Qls
Qt
Qg
QTplc
Tv
pE
Quaternary and Tertiary pre-Lava Creek Yellowstone Group rhyolites, undifferentiated
Tertiary volcanic rocks, undifferentiated
Pre-Eocene rocks, undifferentiated
Qpcu
Qpce
Qpcw
Qpca
Qpci
Qpcd
Qpcpv
Qyl
Spruce Creek rhyolite flow
Elephant Back rhyolite flow
West Thumb rhyolite flow
Aster Creek rhyolite flow
Tuff of Bluff Point
Dry Creek rhyolite flow
Pelican Creek rhyolite flow
Lava Creek Tuff
Contour on upper surface of 16-ka ice cap
OLDER UNITS
EXPLANATION
Water
Direction of 16-ka ice flow
Submerged shoreline
Hydrothermal vent
Fracture, fault—Dashed where approximately located or inferred; dotted where concealed; bar and ball on
Caldera margin and related structures
Contact
Underwater contact
Yellowstone Lake shoreline
SCALE: 1:76,821
0
0 5 KILOMETERS
3 MILES1
1
2
2 3 4
13°
APPROXIMATE MEANDECLINATION, 2007
TRUE
NOR
TH
MAG
NETI
C NO
RTH
downthrown side
11,000
QTplc
Tv
pE
Quaternary and Tertiary pre-Lava Creek Yellowstone Group rhyolites, undifferentiated
Tertiary volcanic rocks, undifferentiated
Pre-Eocene rocks, undifferentiated
Contour on upper surface of 16-ka ice cap
OLDER UNITS
EXPLANATION—CONTINUED
Water
Direction of 16-ka ice flow
Submerged shorelineHydrothermal vent
Fracture, fault—Dashed where approximately located or inferred; dotted where concealed; bar and ball on
Caldera margin and related structures
Contact
Underwater contact
Yellowstone Lake shoreline downthrown side
13°
TRUE
NOR
TH
MAG
NETI
C NO
RT
H
SCALE: 1:76,821
0 1 2 3 MILES
0 1 2 3 4 5 KILOMETERS EXPLANATION—Continued on facing page. APPROXIMATE MEAN
DECLINATION, 2007
QUATERNARY UNITS
Qs
Ql
Qld
Qhe
Qh
Qls
Qt
Qg
Hydrothermal-explosion deposits Qpcu
Qpce
Qpcw
Qpca
Spruce Creek rhyolite flow Qpci
Qpcd
Qpcpv
Qyl
Tuff of Bluff PointSediments
Dry Creek rhyolite flowShallow-lake sediments—Shallow water Hydrothermal deposits Elephant Back rhyolite flow deposits and submerged shoreline deposits
Landslide deposits Pelican Creek rhyolite flowWest Thumb rhyolite flowDeep-lake sediments—Laminated deep-basin
deposits Aster Creek rhyolite flow Lava Creek TuffTalus and slope deposits
Glacial(?) deposits
104 Integrated Geoscience Studies in the Greater Yellowstone Area
Qg
Qt
Qt
Qt
Qt
Qt
Qt
Qt
Qt
Qg(?) Qh
Qg
Qg
Qh
Qh
Qh
Qh
Qhe
Qhe
Qhe
Qhe
Qhe
Ql
Ql
Ql
Ql Ql
Ql
Ql
Ql
Ql
Ql
Ql
Ql
Ql
Qpcw
Ql
Ql
Ql
Ql
Qld
Qpcd
Qpce Qpce
QpceQpcu
Qs
Qs
Qs
Qs
Qs
Qs
Qs
Qs
Qs
Qs
Qs
Qs
Qyl
Tv
Tv
Tv
Tv
Tv
Tv
Tv
Tv
Tv
Tv
Tv
Tv
Tv
Tv
Qyl
Qyl
Qyl
Qyl
Qyl pE
pE
Qyl
Qyl
Qs
Qs
Qpce
Qpcd
Qpcd
Qpci
Qpci
Qld
Qld
Qld
Qld
Qld
Qpcw
Qpcw
Qpcw
Qpcw
Qls
Qls
Qls
Qls
Qld
Ql
Ql
Ql
Ql
Ql
Qhe
Qpcpv
Qpca
Qpca
Qpca
Qpca
Qpca
Qpca
Qpca
Qpcw
Qs
pE
pE
QTplc
QTplc
QTplc
QTplc
QTplc
QTplc
11,000
11,000
11,000
11,000
11,000
110°35' 110° 30' 110° 25' 110° 20' 110°15'
44°20'
44°25'
44°30'
44°35'
ELEPHANT BACK FISSURE ZONE
WEASEL CREEK LINEAMENT
WEST THUMB CALDERA
YELLOWSTONE CALDERA
RED MOUNTAIN FAULT ZONE
YELLOWSTONE CALDERA
FISHING BRIDGE FAULT
LAKE HOTEL GRABEN
STEVENSON ISLAND
DOT ISLAND
FRANK ISLAND
INCIPIENT GRABEN
ICE CAP AXIS
EXPLOSION CRATEREAGLE BAY
FAULT ZONE
FLAT MOUNTAIN TECTONIC
ZONE
MOLLY ISLANDS
PEALE ISLANDHeart
Lake
RiddleLake
DelusionLake
BeachLake
YellowstoneRiver
IndianPond
TurbidLake
Alder Lake
LewisLake
Figure 3. Geologic map of Yellowstone Lake.

Sediments
Shallow-lake sediments—Shallow water deposits and submerged shoreline deposits
Deep-lake sediments—Laminated deep-basin deposits
QUATERNARY UNITS
Qs
Ql
Qld
Hydrothermal-explosion deposits
Hydrothermal deposits
Landslide deposits
Talus and slope deposits
Glacial(?) deposits
Qhe
Qh
Qls
Qt
Qg
Qpcu
Qpce
Qpcw
Qpca
Qpci
Qpcd
Qpcpv
Qyl
Spruce Creek rhyolite flow
Elephant Back rhyolite flow
West Thumb rhyolite flow
Aster Creek rhyolite flow
Tuff of Bluff Point
Dry Creek rhyolite flow
Pelican Creek rhyolite flow
Lava Creek Tuff
EXPLANATION—Continued on facing page.
SCALE: 1:76,821
0
0 5 KILOMETERS
3 MILES1
1
2
2 3 4
13°
APPROXIMATE MEANDECLINATION, 2007
TRUE
NOR
TH
MAG
NETI
C NO
RTH
EXPLANATION—CONTINUED
OLDER UNITS Contact
QTplc
Tv
pE
Direction of 16-ka ice flowQuaternary and Tertiary pre-Lava Creek Yellowstone Group rhyolites, undifferentiated Fracture, fault—Dashed where approximately located or Underwater contact
inferred; dotted where concealed; bar and ball onTertiary volcanic rocks, undifferentiated 11,000 Contour on upper surface of 16-ka ice capdownthrown side
Yellowstone Lake shorelinePre-Eocene rocks, undifferentiated Caldera margin and related structures Submerged shorelineHydrothermal vent Water
The Floor of Yellowstone Lake is Anything but Quiet— New Discoveries 105
enough to contribute significantly to the demagnetization of rocks by hydrothermal alteration. Current heat-flow values in Bridge Bay area (580 mW/m2; Morgan and others, 1977) of the northern basin are relatively low compared to Mary Bay, yet the Bridge Bay area has low magnetic-intensity values in the reduced-to-the-pole magnetic map (Finn and Morgan, 2002); evidence for past hydrothermal activity is present as inactive hydrothermal vents and structures and may have been responsible for demagnetization of the rocks there (fig. 5, vents). Additionally, south of Bridge Bay and west of Stevenson Island, low magnetic-intensity values reflect active hydrothermal venting and relatively high heat-flow values (Morgan and others, 1977). Low magnetic-intensity values in the northern West Thumb basin also may be due to past hydrothermal activity, as evidenced by vent structures there (fig. 5). Field examination of rhyolite flows shows that many areas with low magnetic intensity values correspond to areas with hydrothermal activity or faulting or fracturing along which hydrothermal alteration has occurred. In contrast, the mapped extent of the Lava Creek Tuff is not revealed in the magnetic data. This difference may be due in part to the quenched vertical and thick (>100 m) flow margins common in many of the large-volume rhyolitic lava flows, whereas the Lava Creek Tuff is more tabular in extent, is generally thinner, and does not have quenched edges.
Because of the high-resolution, shallow-penetration seismic-reflection method we employed, rhyolitic-lava-flow tops are imaged as high-amplitude reflectors only in areas where sediment cover is thin. In other areas, high-resolution aeromagnetic data in conjunction with our recent bathymetric map provide critical evidence. Comparison of geologic maps (fig. 1B) (Blank, 1974; Christiansen, 1974; Christiansen and Blank, 1975; Richmond, 1973) with the high-resolution aeromagnetic maps (Finn and Morgan, 2002) shows a crude relation of magnetic anomalies to the mapped individual lava flows on land (fig. 1C). The magnetic signatures, combined with the high-resolution bathymetric and seismic-reflection data, allow identification and correlation of sediment-covered rhyolitic lava flows far out into the lake (figs. 1 and 2). For example, the Aster Creek flow (map unit Qpca, fig. 1B) southwest of the lake (figs. 1C and 3) is associated with a consistent moderately positive magnetic anomaly that extends over the lake in the southeast quadrant of West Thumb basin, along the southern half of the West Thumb channelway, and over the central basin of the lake well past Dot and Frank Islands (figs. 1 and 2C). The Aster Creek flow has few mapped faults and few areas that have been hydrothermally altered. Similarly, the West Thumb flow (map unit Qpcw, fig. 1B) can be traced into the lake in northeastern West Thumb basin, along the northern half of West Thumb
channelway, and into the northern basin beneath Stevenson Island and Bridge Bay (figs. 2B and 3). In contrast, the Elephant Back flow contains a well-developed system of northeast-trending faults or fissures that has been extensively altered so that the magnetic signature of this unit is erratic, with a wide range of magnetic intensity values (figs. 1C and 3).
In the northern basin, rhyolitic lava flows are inferred mainly from the bathymetry. Interpretation of the magnetic data is somewhat more complicated owing to high temperatures and extensive hydrothermal alteration reflected in the low values of magnetic intensity. Extremely high heat flow in the Mary Bay area (1,650–15,600 mW/m2) (Morgan and others, 1977) and abundant sublacustrine hydrothermal activity (fig. 1B; pl. 2) have resulted in hydrothermal alteration destroying or significantly reducing the magnetic susceptibility of minerals in rocks and sediments, producing the observed negative magnetic anomalies.
A rhyolitic body present at depth in the northern basin of Yellowstone Lake and in the lower Pelican Valley (figs. 2B and 3) is indicated from hydrothermally altered, quartz-bearing, felsite lithic clasts present in the hydrothermal-explosion breccia of Mary Bay and prevalent in the alluvium of the lower Pelican Valley (map unit Qpcpv, fig. 1B). This unit has not been described before and is not a mapped unit in Christiansen (2001). We suggest the felsite clasts are derived from either a buried volcanic or shallow intrusive unit beneath the lower Pelican Valley and the northern lake basin. This felsite produces a moderate positive magnetic anomaly in the lower Pelican Valley and a strong negative magnetic anomaly in the lake extending north as seen in the reduced-to-the-pole map (map unit Qpcpv, fig. 1C) in the lower Pelican Valley (Finn and Morgan, 2002).
Topographically low areas and hydrothermally altered areas cause magnetic lows over the Yellowstone Lake area. The altered portions of lava flows often produce characteristic high-amplitude (200–600 nT), circular or oval, magnetic lows that are particularly evident over the active geyser basins. Modeling of two of the characteristic anomalies within the caldera shows that the lows are caused by the magnetization contrast between ~200- to 500m-thick non-magnetic altered zones and adjacent rhyolites with magnetizations between 3 and 6 A/m (Finn and Morgan, 2002). Hydrothermal-explosion craters, such as Mary Bay, Indian Pond, and Duck Lake, produce magnetic lows due to topography as well as hydrothermal alteration and high heat flow.
Field examination of subaerial rhyolitic lava flows indicates that negative magnetic anomalies, for the most part, are associated with extensive hydrothermal alteration or, in places, alteration due to emplacement of lava flows into water, such as ancestral Yellowstone Lake, or contact with ice. For example, the West Thumb rhyolite flow, due west of the Yellowstone

106 Integrated Geoscience Studies in the Greater Yellowstone Area
River (figs. 1B, 2B, and 3), is glassy, flow-banded, and fresh; the magnetic intensity values in this area generally are high (fig. 1C). In contrast, in areas where flows were emplaced into water, such as the West Thumb rhyolite flow exposed on the northeast shore of West Thumb basin (figs. 1B and 2A), magnetic-intensity values are low (fig. 1C). The low magnetic values of flows emplaced into water may be primarily carried by the fine-grained and altered matrix in the massive rhyolitic breccias, highly fractured perlitic vitrophyre, clastic dikes, and entrained stream, beach, and lake sediments in an altered matrix.
Large Hydrothermal-Explosion Craters
Subaerial hydrothermal explosions have occurred repeatedly during the past 14 k.y. in Yellowstone National Park (Muffler and others, 1971; Pierce and others, this volume; Morgan and others, 1998) and are confined primarily within the boundaries of the Yellowstone caldera (fig. 1). Large (>500 m) circular, steep-walled, flat-bottomed depressions are mapped at several sites in Yellowstone Lake in the West Thumb, central, and northern basins (figs. 2A, 2B, and 2C; pl. 2). These are interpreted as large composite hydrothermal-explosion craters similar in origin to those on land, such as Duck Lake, Pocket Basin in the Lower Geyser Basin (not in mapped area), the 8.3-ka Turbid Lake crater, and the 3.0-ka Indian Pond crater (figs. 1B, 2A, 2B, and 2C) (Morgan and others, 1998; Pierce and others, 2002; Muffler and others, 1971).
A newly discovered 500-m-diameter sublacustrine explosion crater, referred to informally as the Evil Twin explosion crater, in the western part of West Thumb basin near the currently active West Thumb Geyser Basin, is only 300 m northeast of Duck Lake (fig. 2A), a postglacial (<12 ka) hydrothermal-explosion crater (Muffler and others, 1971; Christiansen, 1974, 2001; Richmond, 1973; U.S. Geological Survey, 1972). In the western part of West Thumb basin, heat-flow values are as high as 1,500 mW/m2 (Morgan and others, 1977), reflecting the hydrothermal activity that contributed to the formation of the offshore explosion crater. The 500-m-wide Evil Twin explosion crater is surrounded by 12- to 20-m-high, nearly vertical, walls and has several smaller nested craters along its eastern edge. These nested craters are as deep as 40 m and are younger than the main crater. Temperatures of hydrothermal fluids emanating from the smaller northeast nested crater have been measured at 72°C by ROV.
Another newly discovered, large, subaqueous hydrothermal-explosion crater is the >600-m-wide, elongate, steep-walled, flat-floored crater south of Frank Island (fig. 2C). Muted topography suggests that this explosion crater is one of the oldest still recognizable in Yellowstone Lake. Further, this crater occurs in an area where heat-flow values are, at present, relatively low. Submersible ROV investigations do not indicate hydrothermal activity within the crater.
In the northern basin of Yellowstone Lake, Mary Bay contains an approximately 2.4-km by 2.8-km area of coalesced explosion craters (Morgan and others, 1998; Wold and others, 1977) (fig. 2B), thus making it the world’s largest known hydrothermal-explosion system (Browne and Lawless, 2001). Boiling temperature
in the deep part of Mary Bay is about 160°C. Investigations using a submersible ROV show that fluids from a 35-m-deep hydrothermal vent in Mary Bay have temperatures near the 120°C limit of the temperature probes used, reflecting extremely high heat-flow values in this area (Morgan and others, 1977). Radiocarbon dates from charcoal in breccia deposits and underlying soils exposed in wave-cut cliffs along the shore of Mary Bay indicate that eruption of this crater occurred at 13.0 ka (Morgan and others, 1998; Pierce and others, 2002). Detailed stratigraphic measurements of the breccia deposits indicate that multiple explosions occurred during formation of this large and complex feature. A clean, planar-bedded sand overlying varved lake sediments occur as a sedimentary inter-bed between breccia deposits within the Mary Bay breccia deposit; the fine-sand unit may represent deposition from a wave-generated event associated with the development of the Mary Bay complex (Morgan and others, 1998; Morgan and others, 2002).
One kilometer southwest of the Mary Bay crater complex is another newly discovered, large (~800 m diameter) composite depression informally referred to as Elliott’s crater (fig. 2B; pl. 3A), named after Henry Elliott, who helped map Yellowstone Lake in the 1871 Hayden survey (pl. 1B) (Merrill, 1999). Development of Elliott’s hydrothermal-explosion crater is best illustrated in a north-south seismic-reflection profile (fig. 4B). Zones of nonreflectivity in the seismic profile on the floor and flanks of the large crater probably represent hydrothermally altered, and possibly heterolithic, explosion-breccia deposits, similar in character to those exposed on land and associated with subaerial explosion craters (Muffler and others, 1971). Seismic profiles in the hummocky area southeast of Elliott’s crater also are nonreflective and may represent a layer of heterolithic and (or) hydrothermally altered material erupted from this crater. In contrast to the subaerial craters, which have radial aprons of explosion-breccia deposits that rim the crater (Hamilton, 1987; Muffler and others, 1971), many of the sublacustrine circular depressions lack an obvious apron. This may indicate more widespread dispersal of ejection deposits in the lake water or that some other process, such as catastrophic collapse of sealed caprock, created the depressions.
Following the initial major explosive event of Elliott’s crater, lacustrine sediments, imaged as laminated reflective layers in the seismic profile (fig. 4B), accumulated in the floor of the crater and on its south flank. Posteruptive sediment thickness of ~8 m indicates the main hydrothermal explosion occurred between 13 and 8 ka, based on sedimentation rates in the lake. Opaque zones within the stratified sedimentary fill of the crater indicate the presence of hydrothermal fluids and (or) gases. The presence of two younger craters at the south end of the main crater floor and the presence of many smaller hydrothermal vents further indicates more recent hydrothermal activity and possibly younger explosions. Along the southeast rim of the main crater, more than 3 km south from shore, are rocks exposed above lake sediments on the lake floor of varying lithic compositions; these rocks may be the product of a more recent hydrothermal explosion. A north-south seismic profile across Elliott’s explosion crater shows about 10 m of vertical difference in height between the rims. This difference may result from doming associated with hydrothermal activity prior to initial explosion.

1 KILOMETER B' -10 0.0 10
B South North
0.00
36.25
72.50
108.75
145.00
1 KILOMETER
Water bottom Lacustrine sediments
Domal feature
Gas pocket
Vent
Vent Uplifted, tilted blockwith deformed
sediments
Vent
Gas pockets
Domal structures
Lacustrine sediments
B
DEPT
H (M
)
A' A South North
0.00
High-amplitude reflector (rhyolite flow)
Fault
Draped lacustrine sediments
Water bottom
"Gas-outs"
Domed sediments Domed
sediments
A
Second high amplitude reflector (older rhyolite flow?)
DEPT
H (M
)
36.25
72.50
The Floor of Yellowstone Lake is Anything but Quiet— New Discoveries 107
Figure 4. High-resolution seismic-reflection images. A, High-resolution seismic-reflection image from northwestern West Thumb basin showing high-amplitude (discontinuous red and yellow) reflector interpreted as a sub-bottom rhyolitic lava flow. Glacial and lacustrine sediments, marked in blue, overlie this unit. The data amplitudes have been debiased and spatially equalized only; no additional gain corrections or filtering were applied. B, High-resolution seismic-reflection image (line YL72) across part of Elliott’s explosion crater showing small vents, gas pockets, and domed sediments in the lacustrine sediments that overlie the crater flank. Lacustrine-sediment thickness in the main crater indicates 5–7 thousand years of deposition since the main explosion. More recent explosions, in the southern part of the large crater, ejected postcrater lacustrine sediments and created new and smaller craters. Colors are the same as for figure 4A.
Hydrothermal Vents and Domes on the Floor of ecosystem (Balistrieri and others, this volume). ROV observations indicate that shallow hydrothermal vents are home toYellowstone Lake abundant bacteria and amphipods that form the base of the food chain. This food chain includes indigenous cutthroat trout Seismic-reflection profiles of the surveyed areas in the
northern, central, and West Thumb basins of Yellowstone Lake and piscivorous, exotic lake trout, as well as grizzly bears,
reveal a lake floor covered with laminated, diatomaceous, bald eagles, and otters that feed on the potamodromous cut-
lacustrine muds, many of which are deformed, disturbed, and throat trout during spawning in streams around the lake (Chaf
altered. High-resolution bathymetric mapping reveals that fee, Shanks, and others, this volume).
many areas contain small (<20 m) depressions pockmarking In seismic-reflection profiles (fig. 4B), hydrothermal-the lake bottom (pl. 1F and fig. 3). vent features typically are imaged as V-shaped structures
Geochemical studies of the vents (fig. 5) indicate that ~10 associated with reflective layers that are deformed or have percent of the total deep-thermal-water flux in Yellowstone sediments draped across their edges. Areas of high opacity or National Park occurs on the lake bottom. Hydrothermal fluids no reflection occur directly beneath them and are interpreted containing potentially toxic elements (As, Sb, Hg, Mo, W, and as gas pockets containing steam or CO
2, gas-charged fluids, or
Tl) significantly influence lake chemistry and possibly the lake hydrothermally altered zones. Evidence for lateral movement

44°30'
44°25'
44°20'
110°35' 110°30' 110°25' 110°20' 110°15' 110°10'108
Integrated G
eoscience Studies in the Greater Yellow
stone Area
Figure 5. Blue-shaded bathymetric map of Yellowstone Lake surrounded by a gray-shaded topographic map of the surrounding area shows the distribution of hydrothermal vents, shown as yellow dots, in the lake. More than 660 active and inactive hydrothermal-vent structures have been identified in this recent mapping effort.

A.
B.
YellowstoneRiver
YellowstoneLake
LewisLake
topographicmargin of theYellowstone caldera
Ring-fracture zoneRoad and leveling lineElephant Back fissures
SourCreek
dome
0
200
200
100
200
300
400
300100
500
600
700
45o00"N
111o00"W
110o10"W
44o20"N
0 10 km
YELLOWSTONE NATIONAL PARK
. . .
MallardLake dome
.
.
1923-1975 uplift in mmrelative to K-12
LBK-12
C.
Fig. 5 aY_LakeMorgan and others
200
Weasel Creek-Storm Pointlinear trend
105.4
-47.1
-134.8
-203.5
-257.3
-310.1
-413.6
nT
0 10 km
C
Yellowstone River
Yellowstone Lake
Lewis Lake
topographic margin of the Yellowstone caldera
Ring-fracture zone Road and leveling line Elephant Back fissures
Sour Creek
dome
0
200
200
100
200
300
400
300
100
500
600
700
45o00"N
111o00"W
110o10"W
44o20"N
0 10 km
YELLOWSTONE NATIONAL PARK
. . .
Mallard Lake dome
.
.
1923-1975 uplift in mm relative to K-12
LB K-12
200
Weasel Creek-Storm Point linear trend
A.
B.
Elliott'scrater
StormPoint
inflatedplain
EBFZ
Gull Point
Sand Point
Rock Point
Qs
Qpce
Qhe
Weasel Creek
Weasel Creek-Storm Point linear trend
Qs
C.
Fig. 5 aY_LakeMorgan and others
Indian PondQpcw
Weasel Creek-Storm Point linear trend
0
Weasel Creek-Storm Point linear trend B
105.4
-47.1
-134.8
-203.5
-257.3
-310.1
-413.6
nT
10 km
A Weasel Creek-Storm Point linear trend
Elliott's crater
Storm Point
inflated plain
EBFZ
Gull Point
Sand Point
Rock Point
Qs
Qpce
Qhe
Weasel Creek
Qs
Indian Pond Qpcw
The Floor of Yellowstone Lake is Anything but Quiet— New Discoveries 109
Figure 6. High-resolution images and simplified map of the “inflated plain” in northern basin of Yellowstone Lake. A, High-resolution blue-shadedrelief bathymetric map of the northern basin of Yellowstone Lake highlighting the location of the “inflated plain,” Storm Point, Elliott’s hydrothermal-explosion crater, Elephant Back fissure zone (EBFZ), and the northeast-trending Weasel Creek–Storm Point linear trend. A geologic shaded-relief map of the area surrounds the lake (U.S. Geological Survey, 1972). Geologic units shown are in pink (Qpce, Quaternary Elephant Back flow; Qpcw, Quaternary West thumb flow), yellow (Qs, Quaternary sediments), and tan (Qhe, Quaternary hydrothermal-explosion deposit). B, High-resolution aeromagnetic map (Finn and Morgan, 2002) of the area shown in figure 6A. The shoreline of Yellowstone Lake is represented by a thick, solid-yellow line; Stevenson Island is shown as a thin, solid-yellow line. Note the location of the “Weasel Creek–Storm Point linear trend.” C, Simplified map of Yellowstone National Park highlighting location of the topographic margin of the Yellowstone caldera, its two resurgent domes (Mallard Lake dome and Sour Creek dome), the Elephant Back fissures, and Yellowstone Lake. Superimposed on this, in black, are contour lines (in mm) showing the amount of total caldera uplift that occurred between 1923–1975 (modified from Dzurisin and others, 1994). The Weasel Creek–Storm Point linear trend is shown in purple and coincides approximately with the 450-mm-uplift contour interval.

N
Depth (m)
5.7 m
46.6 m 44°32'18.78"
5.56
11.07
16.59
22.10
27.62
33.13
38.65
44.16
49.67
110°21'07.52"
44°31'56.01"G 110°21'46.01"
110 Integrated Geoscience Studies in the Greater Yellowstone Area
44°32'15"
44°32'10"
44°32'05"
44°32'00"
D 0 100 200 300 400 500 METERS
110°21'40" 110°21'30" 110°21'20" 110°21'10"
E
110°21'40" 110°21'30" 110°21'20" 110°21'10"
44°32'00"
44°32'05"
44°32'10"
44°32'15"
0 100 200 300 400 500 METERS
F
44°32'00"
44°32'10"
44°32'20"
44°32'30"
110°21'50" 110°21'30" 110°21'20" 110°21'00"
Depth (m) 5.56
11.07
16.59
22.10
27.62
33.13
38.65
44.16
49.67
0 200 400 600 800 1,000 METERS
D, Gray-shaded-bathymetric close-up image of the “inflated plain.” Illumination is from due north with a sun-angle of 45°. E, Gray-scale backscatter-amplitude map of the same area shown in figure 6D. Bright areas are reflective due to their relative hardness and degree of silicification. Dark areas are sites of active hydrothermal vents. The range of reflectivity is from 26 to –20 dB. F, Two-dimensional color-bathymetric map of the “inflated plain.” Area shown in black box is the area shown in figures 6D and 6E. Total depth ranges from 5.56 to 49.76 m. G, Three-dimensional color-shadedrelief image of the “inflated plain.” Area shown is same as area in figure 6F; the image is rotated so that north is at 340° and is tilted 20°. Total depth ranges from 5.56 to 49.76 m. Data shown in figures 6A, D, E, F, and G are from 2002 mapping when the “inflated plain” was resurveyed.

The Floor of Yellowstone Lake is Anything but Quiet— New Discoveries 111
of hydrothermal fluids is seen beneath and adjacent to hydrothermal vents identified in the seismic-reflection profiles. The areas of opacity in the seismic data and of low values of magnetic intensity in the aeromagnetic data represent larger zones of hydrothermal alteration than those seen in the surficial hydrothermal vents (fig. 5) (Finn and Morgan, 2002) and provide further evidence of lateral migration of hydrothermal fluids.
Many vent areas are associated with smaller domal structures in which the original horizontally laminated, diatomaceous, lacustrine sediments have been arched upward as much as several meters by underlying pockets of gas or gas-charged fluids, presumably rich in steam and possibly CO
2. Hydro
thermal fluids, rich in silica, beneath the domes flow into the overlying sediments resulting in their silicification. The cap sediments become sealed, impermeable, and weakly lithified so that their resultant compaction is minimal. In contrast, the unaltered muds surrounding these domes become more compacted over time and contribute to the overall domal morphology. These domal structures may be preserved as domes, may develop into large craters associated with hydrothermal explosions, or may develop smaller craters within the dome that collapse due to dissolution of the underlying sediment. All these scenarios would pose different levels of hazards, from very little associated with a dome to significant, as would be the case for a hydrothermal explosion.
A large domal structure, informally referred to as the “inflated plain” (fig. 6), was originally recognized in the 1999 bathymetric survey of the northern basin (Morgan and others, 1999) and was resurveyed in 2002. The “inflated plain” covers an approximately circular area with a diameter of ~0.7 km, has a relatively flat or plain-like top covered with smaller craters, and stands ~30 m above the surrounding lake floor. The dome hosts numerous active and vigorous hydrothermal vents and smaller domal structures and is the largest dome identified in the lake. Differential analysis of the 1999 data with that collected in 2002 shows no measurable changes in the surface of the structure.
As shown in figure 6A, the “inflated plain” lies along a northeast linear trend in line with other structures. Northeast of the dome on land is Storm Point, a 4- to 6-ka hydrothermal dome, and Indian Pond, a 3-ka hydrothermal-explosion crater. Southwest of the “inflated plain” is an unnamed trough in the lake that continues on land into the Weasel Creek drainage, west of Yellowstone Lake (fig. 6A). We informally refer to the northeast linear trend as the “Weasel Creek lineament.” This 14-km-long structure is subparallel to fissures in the Elephant Back fissure zone to the northwest (fig. 6A). Weasel Creek has an unusually straight drainage, as do two smaller subparallel drainages due north and at least one drainage due south of Weasel Creek. These fissures may represent linear zones of weakness, similar in origin to the fissures on Elephant Back Mountain and related to the inflation/deflation cycles of deformation of the Yellowstone caldera (fig. 6C) (Dzurisin and others, 1994). The Weasel Creek lineament, the most developed of these zones of weakness south of Elephant Back Mountain, is reflected as a discontinuous linear zone of low magnetic
intensity in the high-resolution reduced-to-the-pole magnetic map of the area (fig. 6B) and may reflect a zone of upwelling hydrothermal fluids, which have contributed significantly to the demagnetization of the rocks present. This structure appears to left-laterally offset the “outlet graben” to the north from an incipient graben to the south associated with the “fissures” area in the lake, due west of Stevenson Island.
In late summer of 2002, while traversing the “inflated plain” area in the RV Cutthroat, we noted several unusual phenomena not observed in our previous surveys, which were conducted in late June and July. Phenomena included a strong scent of H2
S, a 30- to 50-m-diameter plume of fine sediments, and large concentrations of bubbles, many of them quite vigorous, at the lake surface. The fine-sediment plume was first detected by the Fathometer as a strong reflector concentrated ~3 m below the lake surface and later observed. We have reoccupied this site in subsequent years during the early summer and fall, and note that the phenomena observed in late summer 2002 are not apparent in the early summer. This timing coincides with changes in lake levels, which are high in June and July and quickly drop off by late August (fig. 7). Lake level data were calculated from discharge data available at http://nwis.waterdata.usgs.gov/wy/nwis/discharge/?site_ no=06186500. We now attribute the observed phenomena in late summer and fall as being associated with a drop in lake level, significant enough to lower the hydrostatic head on active hydrothermal-vent systems. Balistrieri and others (this volume) have considered the cause of lake level drop and have calculated an annual average evaporation rate of 0.17 km3/y, which is insignificant compared to discharge that averages 1.19 km3/y. As shown in figure 7, the level of water in Yellowstone Lake increases as much as 1 m over a 2-month period in late spring associated with runoff from melt of snow pack in surrounding mountains. Lake level peaks in late July and drops sharply by late August coinciding when the observed phenomena associated with the “inflated plain” begin. This drop allows finely disseminated clays in the vents to rise to the surface along with an increase in bubble activity which pop at the surface releasing H
2S. Based on lake level changes (fig.
7), it may be that the phenomena described is normal and is obscured from observation due to a rapid increase in lake level for a 2-month period.
A close-up bathymetric image of the “inflated plain” (fig. 6D) domal structure pockmarked with numerous hydrothermal vents and craters. Clear evidence of hydrothermal alteration is seen in the amplitude map (fig. 6E) where bright areas are reflective due to their relative hardness. We infer that these brighter areas reflect higher degrees of silicification and may represent silicified caprock material, whereas the darker and less hard areas are places where little silicification has occurred. Figures 6F and 6G show the “inflated plain” in 2-dimensional and 3-dimensional perspectives, respectively, and plainly show how this feature rises as much as 30 m from the lake floor. Note smaller domal structures lie immediately northeast of the “inflated plain” in line with the Weasel Creek linear trend.
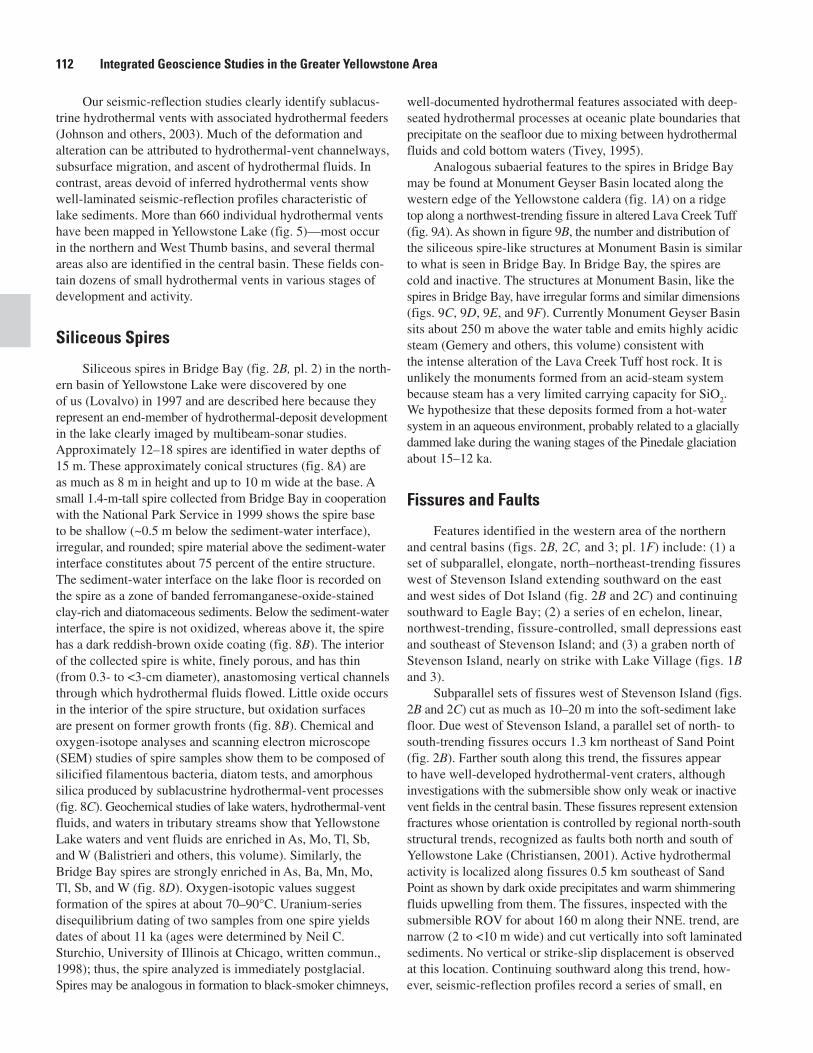
112 Integrated Geoscience Studies in the Greater Yellowstone Area
Our seismic-reflection studies clearly identify sublacustrine hydrothermal vents with associated hydrothermal feeders (Johnson and others, 2003). Much of the deformation and alteration can be attributed to hydrothermal-vent channelways, subsurface migration, and ascent of hydrothermal fluids. In contrast, areas devoid of inferred hydrothermal vents show well-laminated seismic-reflection profiles characteristic of lake sediments. More than 660 individual hydrothermal vents have been mapped in Yellowstone Lake (fig. 5)—most occur in the northern and West Thumb basins, and several thermal areas also are identified in the central basin. These fields contain dozens of small hydrothermal vents in various stages of development and activity.
Siliceous Spires
Siliceous spires in Bridge Bay (fig. 2B, pl. 2) in the northern basin of Yellowstone Lake were discovered by one of us (Lovalvo) in 1997 and are described here because they represent an end-member of hydrothermal-deposit development in the lake clearly imaged by multibeam-sonar studies. Approximately 12–18 spires are identified in water depths of 15 m. These approximately conical structures (fig. 8A) are as much as 8 m in height and up to 10 m wide at the base. A small 1.4-m-tall spire collected from Bridge Bay in cooperation with the National Park Service in 1999 shows the spire base to be shallow (~0.5 m below the sediment-water interface), irregular, and rounded; spire material above the sediment-water interface constitutes about 75 percent of the entire structure. The sediment-water interface on the lake floor is recorded on the spire as a zone of banded ferromanganese-oxide-stained clay-rich and diatomaceous sediments. Below the sediment-water interface, the spire is not oxidized, whereas above it, the spire has a dark reddish-brown oxide coating (fig. 8B). The interior of the collected spire is white, finely porous, and has thin (from 0.3- to <3-cm diameter), anastomosing vertical channels through which hydrothermal fluids flowed. Little oxide occurs in the interior of the spire structure, but oxidation surfaces are present on former growth fronts (fig. 8B). Chemical and oxygen-isotope analyses and scanning electron microscope (SEM) studies of spire samples show them to be composed of silicified filamentous bacteria, diatom tests, and amorphous silica produced by sublacustrine hydrothermal-vent processes (fig. 8C). Geochemical studies of lake waters, hydrothermal-vent fluids, and waters in tributary streams show that Yellowstone Lake waters and vent fluids are enriched in As, Mo, Tl, Sb, and W (Balistrieri and others, this volume). Similarly, the Bridge Bay spires are strongly enriched in As, Ba, Mn, Mo, Tl, Sb, and W (fig. 8D). Oxygen-isotopic values suggest formation of the spires at about 70–90°C. Uranium-series disequilibrium dating of two samples from one spire yields dates of about 11 ka (ages were determined by Neil C. Sturchio, University of Illinois at Chicago, written commun., 1998); thus, the spire analyzed is immediately postglacial. Spires may be analogous in formation to black-smoker chimneys,
well-documented hydrothermal features associated with deep-seated hydrothermal processes at oceanic plate boundaries that precipitate on the seafloor due to mixing between hydrothermal fluids and cold bottom waters (Tivey, 1995).
Analogous subaerial features to the spires in Bridge Bay may be found at Monument Geyser Basin located along the western edge of the Yellowstone caldera (fig. 1A) on a ridge top along a northwest-trending fissure in altered Lava Creek Tuff (fig. 9A). As shown in figure 9B, the number and distribution of the siliceous spire-like structures at Monument Basin is similar to what is seen in Bridge Bay. In Bridge Bay, the spires are cold and inactive. The structures at Monument Basin, like the spires in Bridge Bay, have irregular forms and similar dimensions (figs. 9C, 9D, 9E, and 9F). Currently Monument Geyser Basin sits about 250 m above the water table and emits highly acidic steam (Gemery and others, this volume) consistent with the intense alteration of the Lava Creek Tuff host rock. It is unlikely the monuments formed from an acid-steam system because steam has a very limited carrying capacity for SiO2
. We hypothesize that these deposits formed from a hot-water system in an aqueous environment, probably related to a glacially dammed lake during the waning stages of the Pinedale glaciation about 15–12 ka.
Fissures and Faults
Features identified in the western area of the northern and central basins (figs. 2B, 2C, and 3; pl. 1F) include: (1) a set of subparallel, elongate, north–northeast-trending fissures west of Stevenson Island extending southward on the east and west sides of Dot Island (fig. 2B and 2C) and continuing southward to Eagle Bay; (2) a series of en echelon, linear, northwest-trending, fissure-controlled, small depressions east and southeast of Stevenson Island; and (3) a graben north of Stevenson Island, nearly on strike with Lake Village (figs. 1B and 3).
Subparallel sets of fissures west of Stevenson Island (figs. 2B and 2C) cut as much as 10–20 m into the soft-sediment lake floor. Due west of Stevenson Island, a parallel set of north- to south-trending fissures occurs 1.3 km northeast of Sand Point (fig. 2B). Farther south along this trend, the fissures appear to have well-developed hydrothermal-vent craters, although investigations with the submersible show only weak or inactive vent fields in the central basin. These fissures represent extension fractures whose orientation is controlled by regional north-south structural trends, recognized as faults both north and south of Yellowstone Lake (Christiansen, 2001). Active hydrothermal activity is localized along fissures 0.5 km southeast of Sand Point as shown by dark oxide precipitates and warm shimmering fluids upwelling from them. The fissures, inspected with the submersible ROV for about 160 m along their NNE. trend, are narrow (2 to <10 m wide) and cut vertically into soft laminated sediments. No vertical or strike-slip displacement is observed at this location. Continuing southward along this trend, however, seismic-reflection profiles record a series of small, en

6/19/1997
1/5/1998
7/24/1998
2/9/1999
8/28/1999
3/15/2000
10/1/2000
4/19/2001
11/5/2001
5/24/2002
12/10/2002
6/28/2003
1/14/2004
8/1/2004
2/17/2005
LAKE
LEV
EL (M
)
2,360.20
Snowpack melt flowing into lake and
significantly increasing lake levels 2,360.00
Rapid discharge
2,359.80
2,359.60
2,359.40
2,359.20
2,359.00
2,358.80
Stable lake level
2,358.60
1998
1999
2000
2001
2002
2003
2004
The Floor of Yellowstone Lake is Anything but Quiet— New Discoveries 113
Figure 7. Lake-level variations in Yellowstone Lake from 1998 through early 2005 (http://nwis.waterdata.usgs.gov/wy/nwis/discharge/ ?site_no=06186500). The average annual change in lake level is ~<1-m total. As shown in the diagram, the highest lake levels occur within approximately a 3-month interval starting in late May–early June and continuing until late July when the runoff from snowpack melt in the mountains surrounding the lake basin is at a maximum. Lake levels are at a maximum in late July and rapidly decrease during the month of August. Lake levels are stable and lower during the nine-month interval between peak runoff and discharge.
echelon, normal faults with displacements of several tens of centimeters to 1–2 meters that occur due southwest of Rock Point (fig. 2C). Examination of the high-resolution magnetic-intensity map of this area shows a linear zone of relatively lower magnetic intensities that spatially coincides with the fissures and graben to the north, referred to as the Lake Hotel graben (figs. 1C, 2C, 2D, and 3).
Observation of the features east of Stevenson Island (fig. 2B) using the submersible ROV indicates that small, well-developed hydrothermal vents coalesce along northwest-trending fissures. These may be similar to, but more developed, than those vents and fissures west of Stevenson Island. A large hydrothermal vent at the south end of the northernmost set of aligned vents, in the deepest part of Yellowstone Lake, at 133 m (pl. 3B), emits hydrothermal fluids as hot as 120°C.
Finally, east–west seismic-reflection profiles across the down-dropped block north of Stevenson Island reveal a north–
northwest-trending graben structure bounded by normal faults. This graben, the Lake Hotel graben, was identified by previous investigations (Kaplinski, 1991; Otis and others, 1977; Shuey and others, 1977) but our studies, using differential GPS navigation and high-resolution seismic and bathymetric data, provide the first accurate information on location and displacement on this important structure. Measured displacements along the two bounding faults are variable, but displacement along the western boundary is generally ~6 m, whereas displacement along the eastern normal fault is ~2 m. The eastern bounding fault cuts Holocene lake sediments, indicating recent movement. Analyses of the seismic profiles across the graben indicate the graben developed during three main events: the initial phase between 15–12 ka, a second event at 12–7.5 ka, and the most recent event between 2.5 and 0.1 ka (Johnson and others, 2003). The graben projects (or strikes) toward Lake Village (figs. 1B and 2B), posing a potential seismic hazard in that area.

llll llllllllllllllllll
114 Integrated Geoscience Studies in the Greater Yellowstone Area
1
10
100
1,000
10,000
ll llllll
l l
ll
ll
ll
ll
l ll
l
As Ba Mn Mo Sb Tl W
l l l l l l l l l l l l l
l l
l l
ll
lll
l l
l l
ll
lll
l l
l l
ll
lll
D
Samples from oxidized exterior
Samples from siliceous interior{ {
EXPLANATION
PPM
C 10 μm
Filamentous bacteria
Diatom
B
10 cm
Cut interior section
Growth fronts
Exterior Interior
*
10 cm
A
Depth (meters)
4 METERS 18.32
13.66
14.13
14.59
15.06
15.53
15.99
16.46
16.92
17.39
17.85
Figure 8. Siliceous spires in Bridge Bay in northern basin of Yellowstone Lake. A, Bathymetric image of spires in Bridge Bay showing their approximately conical shapes. Approximately a dozen such siliceous sinter spires—some are as tall as 8 m—occur near Bridge Bay. Many of the spires occupy lake-bottom depressions (possible former explosion or collapse craters). B, Photographs of the exterior and interior of a 1.4-m-tall spire sample recovered from Bridge Bay by National Park Service divers. The sediment–water interface of this spire is apparent near the base of the exterior section as seen in the dramatic color change from the outer rind of red-brown ferromanganese oxide to the light-gray interior. (The red asterisk on the photograph of the exterior is on a natural external surface of the spire below the sediment–water interface.) Former growth fronts on the spire can be seen as shown in the photograph of the interior section. C, SEM image of diatoms, silicified filamentous bacteria, and amorphous silica from a spire sample. D, Summary bar graph of chemical analyses of spire samples showing substantial concentrations of the potentially toxic elements arsenic, barium, manganese, molybdenum, antimony, thallium, and tungsten.

The Floor of Yellowstone Lake is Anything but Quiet— New Discoveries 115
A
D
C
F
Bridge Bay silica spires
5 Meters
Monument Geyser Basin
4947500
4947550
4947600
4947650
4947700
4947750
4947800
4947850
519500 519550 519600 519650
498.3 and 3518.18.2 (g) 88.7°C 88.5°C
1.8 1.1
498.1 and 3518.19.3 (g) 83.7°C 88.7°C
1.1
498.4 and 3518.15.1a (g) 87.7°C 86.8°C 2.5
3518.14.1 86.8°C
3518.17.1 82°C 1.6
498.5 21.9°C
2.3
495.1 88.5°C
1.1
495.2 88.4°C
1.3
495.4 90.6oC
1.1
498.2 23.4°C
1.2
528.1, 528.5 (duplicates)
71.1°C 1.1
UTM coordinates, Zone 12, NAD27
SPIRE #1 Monument Geyser (steam)
SPIRE #6
SPIRE #5 Whale
SPIRES #2 and 3 Sphinx and Walrus
SPIRES #4A and 4B Bison and Shrub
B
50 Meters
Acid alteration area
Spires
Hot springs
Water samples
EXPLANATION
E
Monument Geyser Basin

116 Integrated Geoscience Studies in the Greater Yellowstone Area
The set of fissures west and southwest of Stevenson Island may be an incipient graben that is offset from and forming to the south–southwest of the Lake Hotel graben. This structure is on trend with the Eagle Bay fault system (fig. 3).
The sublacustrine fissures and faults revealed by the high-resolution bathymetry are related to the regional tectonic framework of the northern Rocky Mountains, variable depths to the brittle-ductile transition zone (Fournier, 2000), and the subcaldera magma chamber (Eaton and others, 1975; Fournier, 1989; Fournier and others, 1976; Lehman and others, 1982; Stanley and others, 1991; Wicks and others, 1998) and play important roles in shaping the morphology of the floor of Yellowstone Lake. Many recently identified features along the western margin of the northern and central basins, such as the active fissures west of Stevenson Island, the faults southwest of Rock Point, and the Lake Hotel graben in the northern basin, are oriented approximately north–south and probably are related to a regional structural feature in western Yellowstone Lake on strike with the Neogene Eagle Bay fault zone (fig. 1B) (Locke and Meyer, 1994; Pierce and others, 1997). Seismicity maps of the Yellowstone region (see U.S. Geological Survey Yellowstone Volcano Observatory Web site: http://volcanoes.usgs.gov/yvo) show concentrations of epicenters at various locations in Yellowstone Lake, including the western and eastern portions of West Thumb basin, west of Stevenson Island, southwest of Rock Point, east of Breeze Point (fig. 2C), east and west of Dot Island, the northern basin, and a northwest-trending set west of Park Point.
Figure 9. Monument Geyser Basin. A, Photograph of Monument Geyser Basin as seen looking west. Monument Geyser Basin caps a larger hydrothermal system along a north–northwest-trending fissure. Area in white is composed of hydrothermally altered Lava Creek Tuff and sinter. B, Index map of Monument Geyser Basin, surveyed using a total field station, showing extent of hydrothermal alteration and distribution of spire-like structures, hot springs, and water-sample localities. Values in the boxes represent individual sample numbers (data found in Gemery and others, this volume), temperatures of hot springs, and pH. C, View looking south into Monument Geyser Basin. Note that the basin has a central trough and contains as many as seven spire-like siliceous structures. Person in the mid-foreground provides scale. D, Photograph of one of the spire-like structures, informally referred to as the Walrus, in the northern edge of the basin. Person in background provides scale. E, Photograph of another spire-like structure, known as Monument Geyser or Thermos Bottle, actively venting steam and H2S. This structure is ~2 m tall. F, Underwater photograph of a large (~8 m) spire structure in Bridge Bay in the northern basin of Yellowstone Lake. The subaerial structures at Monument Geyser Basin are very similar to the spires in Bridge Bay (in terms of size, scale, and distribution) and are irregular in form.
Landslide Deposits
Multibeam-bathymetric data reveal hummocky lobate terrain at the base of slopes along the margins—especially along the northeast, eastern, and western margins—of the lake basin (figs. 2A and 3, pl. 1F). Seismic-reflection data indicate that the deposits range in thickness from ≥10 m at the eastern edge of the lake and are recognizable as thin (<1 m) units extending as far as 500 m into the interior of the lake basin (Johnson and others, 2003). We interpret these as landslide deposits. The thickness of the lacustrine-sediment cap deposited above the landslide deposits is variable and suggests that the landslides were generated by multiple events. We suggest that the landslides were triggered by ground shaking associated with earthquakes and (or) hydrothermal explosions. Alternatively, some landslide deposits may represent water-saturated debris flows coming off the steep slopes of the adjacent Absaroka Range directly east of Yellowstone Lake. The eastern shore of Yellowstone Lake, near where many of these landslide deposits occur, marks the margin of the Yellowstone caldera (Christiansen, 1984, 2001; Hildreth and others, 1984; U.S. Geological Survey, 1972) and abuts steep terrain of the Absaroka Range to the east, both possible factors contributing to landslide events. Certainly the area along this eastern boundary with high, hydrothermally altered terrane is susceptible to major slide-block development as interpreted to occur in the eastern part of Yellowstone Lake near Elk and Signal Points. The volume of material identified in these deposits as well as the smaller landslide deposits would result in a significant displacement of lake water and may pose a potential hazard on shore.
Submerged Shorelines
Several submerged former lake shorelines form underwater benches in the West Thumb, northern, and central basins of Yellowstone Lake (figs. 2A, 2B, and 2C). The submerged, shallow margins (depth <15–20 m) of the northern basin are generally underlain by one to three relatively flat, discontinuous, postglacial terraces that record the history of former lake levels. Correlation of these submerged shoreline terraces around the lake is based primarily on continuity inferred from multibeam bathymetric data and shore-parallel seismic-reflection profiles. These data indicate that lake levels were significantly lower in the past. An extensive bench occurs south of Steamboat Point and along the western shore of the northern basin south of Gull Point (fig. 2B). In Bridge Bay, pebbly, submerged beach sand, 5.5 m below the present lake level, yielded a carbon-14 date of 3,835 yr (Pierce and others, 2002). Well-developed submerged shoreline terraces are present in West Thumb basin, especially along its southern and northern edges.
Relief on these terraces is as much as 2–3 m, a measure of postdepositional vertical deformation. Documentation of the submerged terraces adds to a database of as many as nine separate emergent terraces around the lake (Locke and Meyer, 1994; Locke and others, 1992; Meyer and Locke, 1986; Pierce

The Floor of Yellowstone Lake is Anything but Quiet— New Discoveries 117
and others, 2002). Significant, non-seasonal changes in lake level during the last 9,500 radiocarbon years have occurred primarily in response to episodic uplift and subsidence (inflation and deflation) of the central part of the Yellowstone caldera (Dzurisin and others, 1994; Pelton and Smith, 1982; Pierce and others, 1997, 2002; Pierce, Cannon, and others, this volume; Wicks and others, 1998). Holocene changes in lake level recorded by these terraces have been variably attributed to intra-caldera magmatic processes, hydrothermal processes, climate change, regional extension, and (or) glacioisostatic rebound (Dzurisin and others, 1994; Locke and Meyer, 1994; Meyer and Locke, 1986; Pierce and others, 1997, 2002; Wicks and others, 1998).
Glacial Deposits and Features
Yellowstone Lake straddles the southeast corner of the Yellowstone caldera, with approximately 40 percent of the lake southeast and outside of the caldera margin. This area is dominated by deposits and features of glacial, alluvial, and colluvial origin. Flat Mountain, South, and Southeast Arms are fault-bounded valleys enhanced by glacial scour.
The area around the Southeast Arm and the floor of much of the Southeast Arm is characterized with a hummocky bathymetry with many depressions reflective of kettle and glacial-meltwater terrain seen elsewhere in Yellowstone and Grand Teton National Parks (see fig. 2D; pl. 1F). Blocks of ice from the last glacial recession appear to have ponded in the southern and central parts of the Southeast Arm. These kettle-like features do not seem as abundant in the South Arm; however, Alder Lake is most likely a former kettle (fig. 2D). These features are very similar to “The Potholes” in Jackson Hole, Wyo. (see inset in fig. 2D), where glacial-meltwater streams deposited sand and gravel around blocks of stagnant ice (Good and Pierce, 1996). Upon melting, voids left by the ice were later partially filled with slumped sediment leaving large (tens of meters), irregularly shaped depressions.
Discussion
Newly Discovered Features in Yellowstone Lake Pose Potential Geologic Hazards
The bathymetric, seismic, and submersible surveys of Yellowstone Lake have identified various geologic deposits and features that indicate significant potential hazards may exist on the lake floor and adjacent near-shore areas. Potential hazards include hydrothermal explosions, seismic activity, landslides, and possible sudden collapse of hydrothermally altered areas of the lake floor through fragmentation of hydrothermally altered caprock material. Any of these events could result in a sudden shift in lake level generating large waves
or seiches that could cause rapid local flooding. Evidence for previous seiche activity can be found in deposits now exposed along the wave-cut cliffs of the northern shore of the lake. Here, dark, well-sorted, crossbedded to planar-bedded, generally fine grained, nonindurated sands are present at the base of and within the 13.0-ka (Pierce, Cannon and others, this volume) Mary Bay explosion-breccia deposit. The sand unit is variable in thickness and in appearance and is similar in character to what has been described for other paleoseismites (Bartholomew and others, 2002). We suggest that this sand deposit represents deposition from a possible earthquake-generated wave that led to displacement of water above a large and sealed hydrothermal system in Mary Bay. The sudden displacement of water may have significantly reduced the total hydrostatic head over Mary Bay, resulting in a rapid decrease in the confining pressure around the hydrothermal system and triggering a large hydrothermal explosion.
Ejecta from past hydrothermal explosions that formed craters in and around Yellowstone Lake extend several kilometers from their crater rims and include rock fragments in excess of several meters in diameter (Hamilton, 1987; Love and others, this volume; Pierce, Cannon, and others, this volume; Morgan and others, 1998; Richmond, 1973, 1974, 1976, 1977). About 12–15 large hydrothermal-explosion craters have been mapped in or near Yellowstone Lake and within the Yellowstone caldera. All of these formed since the last glacial recession about 16 ka and have 14C radiometric ages from 13.0 ka to 3.0 ka (Pierce, Cannon, and others, this volume; Richmond, 1973, 1976; Morgan and others, 1998). On land, deposits from the 3.0-ka Indian Pond hydrothermal-explosion event extend northeast as much as 3 km from its crater and are as thick as 3–4 m (Pierce and others, 2002). The potential of another large hydrothermal-explosion event may exist, as indicated by the abundance of hydrothermal venting and domal structures observed especially in the northern basin where heat-flow values and measured fluid temperatures are extremely high. The area covered by the large hydrothermal dome, informally referred to as the “inflated plain,” is comparable in scale to its neighboring features: Storm Point, on land and Elliott’s crater, in the lake. Northeast of the “inflated plain,” Storm Point, a 850-m-diameter, 6- to 4-ka (Pierce, Cannon, and others, this volume) hydrothermal dome, stands at about 40 feet above the surrounding landscape and is capped with multiple smaller collapse craters. East of the “inflated plain” is the 800-m-diameter, ~8.0-ka Elliott’s hydrothermal-explosion crater (figs. 2B and 6A), containing many smaller craters and active hydrothermal vents. In addition to hazards affecting humans, hydrothermal explosions are likely to be associated with the rapid release of steam and hot water into the lake (Fournier and others, 1991), possibly affecting water chemistry by the release of potentially toxic trace metals. Such changes could have significant impact on the fragile ecosystem of Yellowstone Lake and vicinity (Shanks and others, 2001; Chaffee, Shanks, and others, this volume).

118 Integrated Geoscience Studies in the Greater Yellowstone Area
Do Rhyolitic Lava Flows Control Hydrothermal Activity?
One of the basic observations from our surveys is that a close spatial relationship exists between the distribution of hydrothermal vents, explosion craters, and sublacustrine rhyolitic lava flows. Does the presence of fully cooled lava flows in a subaqueous environment affect the distribution of hydrothermal vents? Could the identification of rhyolitic lava flows be used as a tool to help predict where some hydrothermal activity may occur in the future?
The floor of Yellowstone Lake, two-thirds of which is within the Yellowstone caldera, lies above a large magma chamber that may be periodically replenished (Eaton and others, 1975; Fournier, 1989; Fournier and others, 1976; Lehman and others, 1982; Stanley and others, 1991; Wicks and others, 1998). The relationship between sublacustrine hydrothermal features and the areas of high relief, interpreted here as rhyolitic lava flows, can be seen in figures 1B, 2A, 2B, 3, 5, and 10D. Based on our observations of the abundant present-day distribution of hydrothermal vents, we infer that fully cooled, post-Yellowstone caldera rhyolitic lava flows exert a fundamental influence on subsurface hydrology and hydrothermal-vent locations. We speculate that upwelling hydrothermal fluids are focused preferentially through rhyolitic lava flows, whereas hydrothermal fluids conducted through lake and glacial sediments tend to be more diffuse (fig. 10). In addition, convective flow moves laterally away from thicker, more impermeable segments of the rhyolite flow toward the fractured-flow margin, where the majority of hydrothermal activity is observed (fig. 10E).
In order to evaluate the effect of rhyolitic lava flows on convective-fluid flow in the sublacustrine environment, three simple 2-dimensional flow models were constructed (fig. 10). Flow modeling was carried out using the program Basin2, v. 4.0.1, 1982–1999, developed by Craig Bethke, University of Illinois. This program uses finite-difference methods to solve Darcy’s law for fluids of varying density. The program allows the user to model topographic, compaction-driven, and (or) convective flow by setting parameters related to fluid density and viscosity, heat capacity, heat flow, porosity, and permeability.
The first model involves fluid flow in a sediment volume 1 km thick by 10 km wide (fig. 10B) covered by lake water 200 m deep. Both left and right edges of the sediment volume are open to flow. Closing left and right boundaries results in an almost stagnant-flow situation, so that option was not pursued further. Vertical-direction permeability (z) is 10-15 m2 and horizontal-direction (x) permeability is 10-14
m2, properties expected for lacustrine or glacial sediments. In order to simulate a magma chamber at depth, heat flow through the base of the section is set at 4 HFU or 167.6 mW/m2 (1 heat flow unit = 10-6 cal/cm2/sec = 41.9 mW/m2), close to the bottom of the range of a typical continental value of 40–70 mW/m2. The basal heat-flow value used in these calculations produces the highest possible thermal gradient
without violating the assumptions of the modeling approach (boiling not allowed, fluid density and viscosity extremes not allowed, and fluid temperature <300°C). Results of this fluid-flow model (fig. 10B) indicate uniform increase of temperature with depth to a maximum of 114°C, recharge at the surface, flow out of both ends, and low fluid-flow rates of <1 mm/yr.
Addition of a sublacustrine 190-m-thick caprock, in this case a fully cooled lava flow, on top of the model sedimentary section (fig. 10C) produces dramatic changes in fluid flow. The fractured lava flow is assigned permeabilities of 2.5 × 10⁻¹⁴ m2 in the z-direction and 5 × 10-14 m2 in the x-direction, within the range measured for fractured-volcanic rocks. Results indicate that a sublacustrine lava flow atop the sediment causes focusing of intense thermal upflow through the lava flow and strong discharge at the surface of the flow into the overlying lake waters. In contrast to the simple sedimentary model, fluid-flow rates beneath the lava-flow caprock are as much as 150 mm/yr and temperatures are ≥140°C.
Our bathymetric mapping shows that hydrothermal vents in the lake are concentrated along lava-flow margins and structures, such as the caldera margin and fissures in the northern and central basins. To simulate the affects of a lava flow with a thick impermeable cap that thins toward its margins and has a basal breccia zone, a 3-layer model was applied. In this case, the lower sedimentary prism is unchanged but is overlain by a thin (20 m) basal unit with the properties of a fractured lava flow that is capped by a 170-m-thick unfractured lava flow with low permeability. In this case, the unfractured portion of the lava flow is assigned permeabilities of 6.3 x 10⁻¹⁶ m2 in the z-direction and 6.3 x 10⁻¹⁵ m2 in the x-direction, within the range measured for unfractured-volcanic rocks.
Results of this model (fig. 10E) indicate strong convective upflow under the lava flow, with maximum subsurface temperatures of 150°C and flow rates as much as 160 mm/yr. As expected, upflow is strongly influenced by the overlying low-permeability unfractured lava flow and is deflected laterally to the edges of the flow. Lateral flow proceeds within the 20-m-thick “basal” fractured zone away from the central upwelling zone toward the flow edges on either side, resulting in hydrothermal venting on the lake floor near the margins of lava flows. This physical model explains the preferential distribution of hydrothermal vents near or at the edges of rhyolitic lava flows in Yellowstone Lake (fig. 10D). In fact, this relationship can also be seen on land where hydrothermal fields and vents are located along the margins of rhyolitic lava flows or where several lava flows have flowed into a common area creating a depression, such as at Pocket Basin, which is surrounded by the Summit Mountain, Nez Perce, and Elephant Back flows or along the edge of the Pitchstone Plateau flow, just to list two examples.

130 90
90
90
50
50
10
10
110
90
90 70
70 50
50 30
30
10
10
Lake level Lake level
Fractured Sediments with no capping lava flow
10 10
30 30
50 50
70 70
90 90
110 110 0.5
lava flow
50100 m Temperature, °CTemperature, °C
100 m 0.5
1000 m 1000 m 5010 62.5 115 mm/yr 10 62.5 115 mm/yr
B C
Hydrothermal vents in northern Yellowstone Lake Low permeability Fracturedlava flow basal unitLake level
Temperature, °C 50 100 m
50 1 km 1000 mD E 10 60 110 mm/yr
Lake level
Rhyolitic lava flow Sheeting120–150° Large gas Upper jointscavities vitrophyreSwath sonar Shrinkage Hydrothermal-
joints explosion crater ROV Hot springs
Hot springs
Hot springs
Hot springs
Near-vent Feeder pyroclastic
Basal flow Basal breccia vitrophyre
Lake sediments dikes deposits
Focused fluid flow throughA basal breccias and fractures
The Floor of Yellowstone Lake is Anything but Quiet— New Discoveries 119
Figure 10. Flow model for hydrothermal vents and rhyolitic lava flows in Yellowstone Lake. A, Schematic diagram showing physical features of a rhyolitic lava flow (modified from Bonnichsen and Kauffman, 1987). B, Two-dimensional fluid-flow model with simple glaciolacustrine-sedimentary aquifer (no caprock) that results in low flow velocities, recharge at the surface, and lateral flow out of both ends of the model aquifer. Subsurface temperatures never exceed 114°C, as indicated by contours and color map. Fluid-flow rates are low (<0.7 mm/yr) as indicated by velocity vectors. C, Fluid-flow model with a fully cooled rhyolitic lava flow acting as caprock. The

120 Integrated Geoscience Studies in the Greater Yellowstone Area
Summary and Conclusions
Mapping in Yellowstone Lake extends subaerial geologic mapping, allowing the lake basin to be understood in the geologic context of the rest of the Yellowstone region (Blank, 1974; Christiansen, 1974, 2001; Richmond, 1973; U.S. Geological Survey, 1972). Rhyolitic lava flows contribute greatly to the geology and morphology of Yellowstone Lake, as they do to the subaerial morphology of the Yellowstone Plateau. We infer from our high-resolution bathymetry and aeromagnetic data that Stevenson, Dot, and Frank Islands are underlain by large-volume rhyolitic lava flows (figs. 2B, 2C, and 3). Mapped late Pleistocene glaciolacustrine-sediment deposits on these islands (Otis and others, 1977; Richmond, 1974; Richmond and Waldrop, 1975; Shuey and others, 1977) merely mantle or blanket the flows. Similarly, the hydrothermally cemented beach deposits exposed on Pelican Roost, located ~1 km southwest of Steamboat Point (fig. 2B), blanket another submerged large-volume rhyolite flow. The margin of the Yellowstone caldera (Richmond, 1974; Richmond and Waldrop, 1975) passes through the central part of the lake through Frank Island and northward along the lake’s eastern edge (fig. 1). We suggest that postcollapse rhyolitic lava flows are present along much of the caldera margin beneath Yellowstone Lake and control much of the distribution of the sublacustrine hydrothermal vents—this is similar to most of the rest of the topographic margin of the Yellowstone caldera (fig. 1A). Many potential hazards have been identified in our mapping effort. Next steps will include hazard assessments and the determination of methodologies to be employed in monitoring these potentially dangerous features; this will be done under the aegis of the Yellowstone Volcano Observatory.
underlying sedimentary aquifer and heat flow are exactly the same as in the previous model. The addition of a 200-m-thick fractured crystalline-rock cap strongly focuses the upward limb of an intense convection cell under the caprock. In this model, fluid temperatures reach 140°C and flow velocities are as high as 150 mm/yr. D, Locations of hydrothermal vents on the northern lake floor mapped using seismic reflection. Lava flow boundaries are based on high-resolution bathymetry and aeromagnetic data. E, Fluid-flow model that includes a basal breccia zone beneath an impermeable lava flow. In this case, the lower sedimentary unit is overlain by a thin, fractured, lava-flow unit (20 m thick) that extends the entire width of the sedimentary prism. Above the more permeable basal unit is a 170-m-thick low-permeability unfractured lava flow. Flow vectors indicate strong upflow under the lava flow with maximum subsurface temperatures of ~150°C and flow rates up to 160 mm/yr. Upflow is deflected laterally within the 20-m-thick “basal” fractured zone toward the flow edges resulting in hydrothermal venting on the lake floor near the margins of lava flows.
References Cited
Bartholomew, M.J., Stickney, M.C., Wilde, E.M., and Dundas, R.G., 2002, Late Quaternary paleoseismites—Syndepositional features and section restoration used to indicate paleoseismicity and stress-field orientations during faulting along the main Lima Reservoir fault, southwestern Montana, in Ettensohn, F.R., Rast, N., and Brett, C.E., eds., Ancient seismites: Geological Society of America Special Paper 359, p. 29–48.
Blank, H.R., 1974, Geologic map of the Frank Island quadrangle, Yellowstone National Park, Wyoming: U.S. Geological Survey Geologic Quadrangle Map GQ-1209a, scale 1:62,500.
Bonnichsen, B., and Kauffman, D.F., 1987, Physical features of rhyolite lava flows in the Snake River Plain volcanic province, southwestern Idaho, in Fink, J.H., ed., The emplacement of silicic domes and lava flows: Geological Society of America Special Paper 212, p. 119–145.
Browne, P.R.L., and Lawless, J.V., 2001, Characteristics of hydrothermal eruptions, with examples from New Zealand and elsewhere: Earth-Science Reviews, v. 52, p. 299–331.
Christiansen, R.L., 1974, Geologic map of the West Thumb quadrangle, Yellowstone National Park, Wyoming: U.S. Geological Survey Geologic Quadrangle Map GQ-1191, scale 1:62,500.
Christiansen, R.L., 1984, Yellowstone magmatic evolution—Its bearing on understanding large-volume explosive volcanism, in Explosive volcanism—inception, evolution, and hazards: Washington, D.C., National Academy Press, p. 84–95.
Christiansen, R.L., 2001, The Quaternary and Pliocene Yellowstone Plateau volcanic field of Wyoming, Idaho, and Montana: U.S. Geological Survey Professional Paper 729-G, 145 p.
Christiansen, R.L., and Blank, H.R., Jr., 1975, Geologic map of the Canyon Village quadrangle, Yellowstone National Park, Wyoming: U.S. Geological Survey Geologic Quadrangle Map GQ-1192, scale 1:62,500.
Dzurisin, D., Yamashita, K.M., and Kleinman, J.W., 1994, Mechanisms of crustal uplift and subsidence at the Yellowstone caldera, Wyoming: Bulletin of Volcanology, v. 56, p. 261–270.
Eaton, G.P., Christiansen, R.L., Iyer, H.M., Pitt, A.M., Mabey, D.R., Blank, H.R., Jr., Zietz, I., and Gettings, M.E., 1975, Magma beneath Yellowstone National Park: Science, v. 188, no. 4190, p. 787–796.
Finn, C.A., and Morgan, L.A., 2002, High-resolution aeromagnetic mapping of volcanic terrain, Yellowstone National Park: Journal of Volcanology and Geothermal Research, v. 115, p. 207–231.

The Floor of Yellowstone Lake is Anything but Quiet— New Discoveries 121
Fournier, R.O., 1989, Geochemistry and dynamics of the Yellowstone National Park hydrothermal system: Annual Review of Earth and Planetary Sciences, v. 17, p. 13–53.
Fournier, R.O., 2000, Hydrothermal processes related to movement of fluid from plastic into brittle rock in the magmatic-epithermal environment: Economic Geology, v. 94, p. 1,193–1,212.
Fournier, R.O., Thompson, J.M., Cunningham, C.G., and Hutchinson, R.A., 1991, Conditions leading to a recent small hydrothermal explosion at Yellowstone National Park: Geological Society of America Bulletin, v. 103, p. 1,114–1,120.
Fournier, R.O., White, D.E., and Truesdell, A.H., 1976, Convective heat flow in Yellowstone National Park, in Second U.N. symposium on the development and use of geothermal resources, proceedings: Washington D.C., San Francisco, U.S. Government Printing Office, v. 1, p. 731–739.
Good, J.M., and Pierce, K.L, 1996, Interpreting the landscapes of Grand Teton and Yellowstone National Parks— Recent and ongoing geology: Grand Teton National Park, Moose, Wyoming, Grand Teton Natural History Association, 58 p.
Hague, A., Weed, W.H., and Iddings, J.P., 1896, Yellowstone National Park: U.S. Geological Survey Geologic Atlas of U.S., Folio 30, 20 p.
Hamilton, W.L., 1987, Water level records used to evaluate deformation within the Yellowstone caldera, Yellowstone National Park: Journal of Volcanology and Geothermal Research, v. 31, nos. 3–4, p. 205–215.
Hildreth, W., Christiansen, R.L., and O’Neil, J.R., 1984, Catastrophic isotopic modification of rhyolitic magma at times of caldera subsidence, Yellowstone Plateau volcanic field: Journal of Geophysical Research, v. 89, no. 10, p. 8,339–8,369.
Johnson, S.Y., Stephenson, W.J., Morgan, L.A., Shanks, W.C., III, and Pierce, K.L., 2003, Hydrothermal and tectonic activity in northern Yellowstone Lake, Wyoming: Geological Society of America Bulletin, v. 115, no. 8, p. 954–971.
Kaplinski, M.A., 1991, Geomorphology and geology of Yellowstone Lake, Yellowstone National Park, Wyoming: Flagstaff, Northern Arizona University, M.S. thesis, 82 p.
Klump, J.V., Remsen, C.C., and Kaster, J.L., 1988, The presence and potential impact of geothermal activity on the chemistry and biology of Yellowstone Lake, Wyoming, in DeLuca, M., and Babb, I., eds., Global venting, midwater and benthic ecological processes: NOAA Symposium on Undersea Research, v. 4, p. 81–98.
Lehman, J.A., Smith, R.B., and Schilly, M.M., 1982, Upper crustal structure of the Yellowstone caldera from seismic delay time analyses and gravity correlations: Journal of Geophysical Research, v. 87, p. 2,713–2,730.
Locke, W.W., and Meyer, G.A., 1994, A 12,000 year record of vertical deformation across the Yellowstone caldera margin—The shorelines of Yellowstone Lake: Journal of Geophysical Research, v. 99, p. 20,079–20,094.
Locke, W.W., Meyer, G.A., and Pings, J.C., 1992, Morphology of a postglacial fault scarp across the Yellowstone (Wyoming) caldera margin, United States, and its implications: Bulletin of the Seismological Society of America, v. 82, no. 1, p. 511–516.
Mason, B.G., Pyle, D.M., and Oppenheimer, Clive, 2004, The size and frequency of the largest explosive eruptions on Earth: Bull. Volcanology, v. 66, p. 735–748.
Merrill, M.D., 1999, Yellowstone and the Great West—Journals, letters, and images from the 1871 Hayden Expedition: Lincoln and London, University of Nebraska Press, 315 p.
Meyer, G.A., and Locke, W.W., 1986, Origin and deformation of Holocene shoreline terraces, Yellowstone Lake, Wyoming: Geology, v. 14, p. 699–702.
Morgan, L.A., and Shanks, W.C., III, 2005, Influences of rhyolitic lava flows on hydrothermal processes in Yellowstone Lake and on the Yellowstone Plateau, in Inskeep, W.P., and McDermott, T.R., eds., Geothermal biology and geochemistry in Yellowstone National Park: Proceeding of the Thermal Biology Institute workshop, Yellowstone National Park, Wyoming, p. 31–52.
Morgan, L.A., Shanks, W.C., Lovalvo, D., Johnson, S.Y., Stephenson, W.J., Harlan, S.S., White, E.A., Waples, J., and Klump, J.V., 1999, New discoveries from the floor of Yellowstone Lake—Results from sonar imaging, seismic reflection, and magnetic surveys [abs.]: Geological Society of America, Abstracts with Programs, v. 31, no. 7, p. A207.
Morgan, L.A., Shanks, W.C., III, Lovalvo, D., Johnson, S.Y., Stephenson, W., Pierce, K.L., Harlan, S., Finn, C., Lee, G., Webring, M., Schulze, B., Duhn, J., Sweeney, R., and Balistrieri, L., 2003, Exploration and discovery in Yellowstone Lake—Results from high-resolution sonar imaging, seismic reflection profiling, and submersible studies: Journal of Volcanology and Geothermal Research, v. 2003, no. 122, p. 221–242.
Morgan, L.A., Shanks, W.C., III, and Pierce, K.L., 2002, Possible earthquake-generated wave deposits near Yellowstone Lake—Clues into triggering mechanisms of a large hydrothermal explosion crater [abs.]: Eos, Transactions of the American Geophysical Union, v. 83, no. 47, p. F1,423.

122 Integrated Geoscience Studies in the Greater Yellowstone Area
Morgan, L.A., Shanks, W.C., III, Pierce, K.L., and Rye, R.O., 1998, Hydrothermal explosion deposits in Yellowstone National Park—Links to hydrothermal processes [abs.]: Eos, Transactions of the American Geophysical Union, fall annual meeting, v. 79, p. F964.
Morgan, P., Blackwell, D.D., Spafford, R.E., and Smith, R.B., 1977, Heat flow measurements in Yellowstone Lake and the thermal structure of the Yellowstone caldera: Journal of Geophysical Research, v. 82, p. 3,719–3,732.
Muffler, L.J.P., White, D.E., and Truesdell, A.H., 1971, Hydrothermal explosion craters in Yellowstone National Park: Geological Society of America Bulletin, v. 82, p. 723–740.
Otis, R.M., Smith, R.B., and Wold, R.J., 1977, Geophysical surveys of Yellowstone Lake, Wyoming: Journal of Geophysical Research, v. 82, p. 3,705–3,717.
Pelton, J.R., and Smith, R.B., 1982, Contemporary vertical surface displacements inYellowstone National Park: Journal of Geophysical Research, v. 87, p. 2,745–2,751.
Pierce, K.L., 1974, Surficial geologic map of the Tower Junction quadrangle and part of the Mount Wallace quadrangle, Yellowstone National Park, Wyoming and Montana: U.S. Geological Survey Miscellaneous Investigations Series Map I-647, scale 1:62,500.
Pierce, K.L., 1979, History and dynamics of glaciation in the northern Yellowstone National Park area: U.S. Geological Survey Professional Paper 729-F, 89 p.
Pierce, K.L., Cannon, K.P., and Meyer, G., 1997, Yellowstone caldera “heavy breathing” based on Yellowstone Lake and River changes in post-glacial time [abs.]: Eos, Transactions of the American Geophysical Union, v. 78, p. 802.
Pierce, K.L., Cannon, K.P., Meyer, G.A., Trebesch, M.J., and Watts, R., 2002, Post-glacial inflation-deflation cycles, tilting, and faulting in the Yellowstone caldera based on Yellowstone Lake shorelines: U.S. Geological Survey Open-File Report 02-142, 65 p.
Remsen, C.C., Klump, J.V., Kaster, J.L., Paddock, R., Anderson, P., and Maki, J.S., 1990, Hydrothermal springs and gas fumaroles in Yellowstone Lake, Yellowstone National Park, Wyoming: National Geographic Research, v. 6, p. 509–515.
Richmond, G.M., 1973, Surficial geologic map of the West Thumb quadrangle, Yellowstone National Park, Wyoming: U.S. Geological Survey Miscellaneous Investigations Series Map I-643, scale 1:62,500.
Richmond, G.M., 1974, Surficial geologic map of the Frank Island quadrangle, Yellowstone National Park, Wyoming: U.S. Geological Survey Miscellaneous Investigations Series Map I-642, scale 1:62,500.
Richmond, G.M., 1976, Surficial geologic history of the Canyon Village quadrangle, Yellowstone National Park, Wyoming: U.S. Geological Survey Bulletin 1427, 35 p., for use with map I-652.
Richmond, G.M., 1977, Surficial geologic map of the Canyon Village quadrangle, Yellowstone National Park, Wyoming: U.S. Geological Survey Miscellaneous Investigations Series Map I-652, scale 1:62,500.
Richmond, G.M., and Waldrop, H.A., 1975, Surficial geologic map of the Norris Junction quadrangle, Yellowstone National Park, Wyoming: U.S. Geological Survey Miscellaneous Investigations Series Map I-650, scale 1:62,500.
Ruzycki, J.R., and Beauchamp, D.A., 1997, A bioenergetics modeling assessment of the lake trout impact on Yellowstone Lake, in Hamre, R., ed., Wild trout VI: Fort Collins, Colo., Trout Unlimited and Federation of Fly Fishers, p. 127–133.
Shanks, W.C., III, Balistrieri, L., Alt, J., Morgan, L.A., Meeker, G., Rye, R.O., Sturchio, N., Lovalvo, D., Cuhel, R., and Klump, J.V., 2001, Geochemical studies of hydrothermal vents and sublacustrine siliceous deposits in Yellowstone Lake, in Agenda and abstracts, Yellowstone Lake—Hotbed of chaos or reservoir of resilience? [abs.]: 6th Biennial Scientific Conference on the Greater Yellowstone Ecosystem, Yellowstone National Park, October 8–10, 2001, National Park Service, p. 35–36.
Shuey, R.T., Ugland, R.O., and Smith, R.B., 1977, Magnetic properties and secular variation in cores from Yellowstone and Jackson Lakes, Wyoming: Journal of Geophysical Research, v. 82, p. 3,739–3,746.
Smedes, H.W., and Prostka, H.J., 1972, Stratigraphic framework of the Absaroka Volcanic Supergroup in the Yellowstone National Park region: U.S. Geological Survey Professional Paper 729-C, 33 p.
Smith, R.B., 1991, Earthquake and geodetic surveillance of Yellowstone: Seismological Research Letters, v. 62, p. 27.
Stanley, W.D., Hoover, D.B., Sorey, M.L., Rodriguez, B.D., and Heran, W.D., 1991, Electrical geophysical investigations in the Norris-Mammoth corridor, Yellowstone National Park, and the adjacent Corwin Springs Known Geothermal Resources Area: U.S. Geological Survey Water Resources Investigations, v. 91-4052, p. D1–D18.

The Floor of Yellowstone Lake is Anything but Quiet— New Discoveries 123
Tivey, M.K., 1995, Modeling chimney growth and associated fluid flow at seafloor hydrothermal vent sites, in Humphris, S.E., Zierenberg, R.A., Mullineaux, L.S., and Thomson, R.E., eds., Seafloor hydrothermal systems; physical, chemical, biological, and geological interactions: Washington, D.C., American Geophysical Union Monograph 91, p. 158–177.
U.S. Geological Survey, 1972, Geologic map of Yellowstone National Park: U.S. Geological Survey Miscellaneous Investigations Series Map I-711, scale 1:125,000.
Wicks, C.W., Jr., Thatcher, W.R., and Dzurisin, D., 1998, Migration of fluids beneath Yellowstone caldera inferred from satellite radar interferometry: Science, v. 282, no. 5388, p. 458–462.
Wold, R.J., Mayhew, M.A., and Smith, R.B., 1977, Bathymetric and geophysical evidence for a hydrothermal explosion crater in Mary Bay, Yellowstone Lake, Wyoming: Journal of Geophysical Research, v. 82, no. 26, p. 3,733–3,738.

124 Integrated Geoscience Studies in the Greater Yellowstone Area
Appendix

The Floor of Yellowstone Lake is Anything but Quiet— New Discoveries 125
Appendix D-1. Digital Models and Visualizations of Bathymetry and Topography in the Yellowstone Lake Area
By Gregory K. Lee1 and Michael W. Webring2
Data Processing
High-resolution multi-beam swath sonar data were collected using a SeaBeam 1180 instrument that uses 126 beams covering a 150-degree ensonification angle to map a swath width of 7.4 times water depth. The studies produced approximately 244 million soundings across the lake, which occupies 34,157.9 hectares (341.579 km2, or 131.9 mi2) and has a shoreline length of 227 km (141 mi). According to data collected for this study, maximum lake depth is 120.7 m (396 ft).
Data collected in 1999 covered the northern basin of the lake; 2000 data included West Thumb basin; 2001 data covered the central part of the lake; and the 2002 survey covered the southern extent of the lake, including the “arms” (Morgan and others, 2003, this volume). Figure 1 shows the approximate areas of Yellowstone Lake that were covered by the four separate surveys. Recorded measurements included beam identifier, signal return time, transmission signal strength,
1U.S. Geological Survey, Mail Stop 973, Box 25046, Denver, CO, 80225.
2U.S. Geological Survey, Mail Stop 964, Box 25046, Denver, CO, 80225.
return signal amplitude, and real-time recordings of shipboard parameters such as position, azimuth, roll, pitch, heave, and yaw. These data, together with sound velocity profiles, were used to calculate depth (meters), backscatter amplitude (decibels), latitude (decimal degrees), and longitude (decimal degrees) for each beam sounding. Gridded bathymetric models of the four sections of the lake were calculated from these data and were merged to produce a composite grid of the entire lake bottom. The bathymetric grid was then combined with 10-m digital elevation data that cover the entire park, obtained from the National Elevation Dataset (NED), available online at URL http://ned.usgs.gov/, to produce a digital elevation model of Yellowstone National Park (the Park) that includes the bottom of Yellowstone Lake.
The spatial coordinates of data from each survey were projected from decimal degrees, WGS 84 spheroid and datum, to Universal Transverse Mercator meters, zone 12, using the GRS 1980 spheroid and North American Datum of 1983. Point data from each of the four surveys, totaling approximately 244 million observations, were transformed to regularly spaced grid arrays, using a minimum curvature gridding algorithm (Webring, 1982) to create bathymetric grid
Yellowstone Lake
2000
2001
1999
2002
Yellowstone Lake
Figure 1. Approximate areas of multi-beam swath sonar surveys conducted in Yellowstone Lake, 1999–2002. Figure 2. Shaded relief of bathymetric model of Yellowstone Lake.

126 Integrated Geoscience Studies in the Greater Yellowstone Area
Figure 3. Shaded-relief image of Yellowstone National Park, including the floor of Yellowstone Lake (shoreline shown in black).Yellowstone National Park
models of lake depth. The algorithm was modified to select the median (instead of mean) depth value for the typical case in which a grid cell contained multiple soundings. Successive iterations of low- and high-pass filtering were implemented at various grid cell dimensions to identify and remove false artifacts in the data, while retaining features more likely to be real.
The shoreline of Yellowstone Lake, including its islands, was digitized from 1:24,000-scale Digital Raster Graphics (DRG) images of nine 1:24,000-scale 7.5-minute USGS topographic map quadrangles (Lake, WY; Lake Butte, WY; Sylvan Lake, WY; Frank Island, WY; Dot Island, WY; West Thumb, WY; Heart Lake, WY; Alder Lake, WY; and Trail Lake, WY) that contain square grid cell edge dimensions of approximately 2.4 m. The digitized shoreline was then “densified,” using ERDAS IMAGINE software, to produce nearly 121,000 closely spaced zero-depth points to provide control for the gridding algorithm at the lake edge, beyond the spatial extents of the survey swaths.
Using IMAGINE software applications, the bathymetric depth grids were converted to elevation models in terms of feet above mean sea level, using the North American Vertical Datum of 1988 (NAVD88). These grids were merged to create an elevation model of the entire bottom of Yellowstone Lake (fig. 2). Grid spacing of each of the models is 10 m.
The collars of twelve 7.5-minute (1:24,000-scale) lake-area DRGs (Beach Lake, Lake, Lake Butte, Mount Chittenden, Sylvan Lake, Frank Island, Dot Island, West Thumb, Mount Sheridan, Heart Lake, Alder Lake, and Trail Lake) were removed, and the resulting clipped images were mosaicked to provide a single DRG covering the vicinity of Yellowstone Lake.
We created a 10-m digital elevation model (DEM) of Yellowstone National Park by merging a USGS DEM of 10-m-elevation data (available at http://seamless.usgs.gov/) covering the Park using the NAVD88 elevation datum. Eight retrievals were required to accommodate download-file-size limitations. These were received in ArcGrid format and converted to IMAGINE files. The 8 digital elevation files were mosaicked and the combined result was clipped to exclude areas outside the Park. These data were merged with the Yellowstone Lake bathymetric-elevation model to produce a digital elevation model of the entire Park that includes the floor of Yellowstone Lake. Figure 3 shows a shaded-relief image of Yellowstone National Park that includes the bathymetry of Yellowstone Lake.
References Cited
Morgan, L.A., Shanks, W.C., III, Lovalvo, D.A., Johnson, S.Y., Stephenson, W.J., Pierce, K.L., Harlan, S.S., Finn, C.A., Lee, G., Webring, M., Schulze, B., Dühn, J., Sweeney, R., and Balistrieri, L., 2003, Exploration and discovery in Yellowstone Lake: results from high-resolution sonar imaging, seismic reflection profiling, and submersible studies: Journal of Volcanology and Geothermal Research, v. 122, p. 221–242.
Webring, Michael, 1982, MINC, a gridding program based on minimum curvature: U.S. Geological Survey Open-File Report 81-1224, 43 p.