the florida institute of phosphate research was created...
TRANSCRIPT


The Florida Institute of Phosphate Research was created in 1978 bythe Florida Legislature (Chapter 378.101, Florida Statutes) andempowered to conduct research supportive to the responsibledevelopment of the state's phosphate resources. The Institute hastargeted areas of research responsibility. These are: reclamationalternatives in mining and processing, including wetlandsreclamation, phosphogypsum storage areas and phosphatic claycontainment areas; methods for more efficient, economical andenvironmentally balanced phosphate recovery and processing;disposal and utilization of phosphatic clay; and environmentaleffects involving the health and welfare of the people, includingthose effects related to radiation and water consumption.
FIPR is located in Polk County, in the heart of the central Floridaphosphate district. The Institute seeks to serve as an informationcenter on phosphate-related topics and welcomes informationrequests made in person, by mail, or by telephone.
Research Staff
Executive DirectorRichard F. McFarlin
Research Directors
G. Michael Lloyd Jr.Hassan El-ShallSteven G. RichardsonRobert S. AkinsGordon D. Nifong
-Chemical Processing-Beneficiation-Reclamation-Mining-Environmental Services
Florida Institute of Phosphate Research1855 West Main StreetBartow, Florida 33830
(863) 534-7160Fax:(863) 534-7165

FINAL REPORT
FIPR DOE CONTRACT # 87-04-037R
PHOSPHATE MATRIX PIPELINE DESIGN DATAAND TOOLS FOR EFFICIENCY IMPROVEMENT
BY
GIW TESTING LABORATORY5000 Wrightsboro Road
Grovetown, Georgia 30813
1 August 1987 to 26 August 1988
Performed forTHE FLORIDA INSTITUTE OF PHOSPHATE RESEARCH
1855 West Main StreetBartow, FL 33830
Graeme R. AddieProject Director

DISCLAIMER
The contents of this report are reproduced herein as receivedfrom the contractor.
The opinions, findings and conclusions expressed herein are notnecessarily those of the Florida Institute of Phosphate Research,nor does mention of company names or products constitute endorse-ment by the Florida Institute of Phosphate Research.

FINAL REPORT PERSPECTIVE
Florida Institute of Phosphate ResearchRobert S. Akins - Research Director, Phosphate Mining
For many years the phosphate industry has recognized that thehydraulic transport of phosphate matrix from the point of mining to thewash plant is not energy efficient. Changes that would contribute togreater efficiency are operating at lower slurry velocities -- closer tothe critical velocity -- pumping at higher percent solids concentrationsand utilizing smaller diameter pipe sizes. In practice, however, the needto maximize production and provide system reliability takes precedenceover the incentive to minimize energy consumption. This results in atendency to overdesign the system. Overdesign can be partly justifiedby the fact that matrix pumping characteristics can vary over shortperiods of time and the system must handle the full range of thesevariations. However, the absence of easy to use,methods and fundamental design data contribute tooverdesign.
reliable designthe tendency to
In August of 1987 the Institute contracted withInc. to develop rapid and reliable techniques for
GIW Industries,designing phosphate
matrix pumping systems. The project's specific goals were to collectfield and laboratory data and to develop user friendly, computersoftware suitable for designing the large scale, multiple pump systemscommon to modern Florida mining operations. The economic justificationfor the project was to increase the energy efficiency of this importantunit operation.
The project consisted of three major work elements:
Collection of matrix samples and field pump and pipelineperformance data at operating mines, and subsequently, testingthese samples in GIW's laboratory pipeline test loop over arange of pipeline diameters, specific gravities andvelocities.
Analysis and correlation of the field and laboratory data anddevelopment of algorithms to project performance data over thefull range of possible operating conditions.
Preparation of a menu driven, PC software package that doesthe following for each matrix type:
Calculates specific energy consumption and head loss for eachslurry concentration, velocity and pipe diameter.
Evaluates an existing pipe system against a given set of pumpsand predicts the system operating characteristics.
Selects for a specified pipe system the best pump(s) toachieve a recommended operating rate or velocity.

-- Calculates pipeline pressure gradients and energy requirementsfor a specified system under both steady state andstartup conditions.
An important aspect of the work was recognizing that differentmatrix samples behave differently in terms of their pumpingcharacteristics. Some are reported as easy to pump while others areviewed as more difficult. This consideration led to the need to conductthe tests with a number of different types of matrix -- easy to pump,average and difficult -- and the need to establish a practical system ofcharacterizing these different types. The system chosen to characterizematrix types was the commonly used parameters of size classification,namely the percentage distribution of pebble, feed and fines.Consequently, the algorithms developed to solve the design problemsrequire only data from operating mines that are readily available to thefield engineer.
This report describes in detail the tests that were run andsummarizes the data collected. Individual test data tabulations forboth lab and field work are contained in a set of Appendices that areavailable in the Institute's library. The computer program manual isbeing published as a separate report. In addition to this report,copies of both the computer program (on 5-l/2" floppy disks suitablefor loading to hard disk) and the manual are available to interestedparties on written request.
GIW has agreed to update the computer software when appropriate fora period of three years. By applying the program to a greater varietyof matrix types than the three chosen for this project and with feedbackfrom program users, we expect a more accurate and precise model willevolve.

TABLE OF CONTENTS
I. INTRODUCTION
II. EXECUTION OF THE WORK
III. GEOLOGICAL ANALYSIS
IV. LAB TESTS AND ANALYSIS OF PIPELINE DATA
V. FIELD TESTS
VI. EXTRUSION RHEOMETER
VII. PUMP PERFORMANCE ANALYSIS
COMPUTER PROGRAM MANUAL (Published Separately)
APPENDICES
A.
B.
C.
D.
E.
F.
G.
H.
I.
Original Proposal and Contract
Calibration Data for Lab Tests
Test Data for Lab Tests
Paper entitled 'Full Scale Experimental Study of the PipelineTransport of Phosphate Matrix Slurries' (Noralyn phase only)presented at the 11th Annual Hydrotransport Conference atStratford-upon-Avon in England.
Paper entitled 'Experimental Study of the Fullscale PipelineTransport Phosphate Matrix Slurries', presented at the AIMERegional conference 1988, Lakeland Civic Center, October28-29, 1988.
'Continuous Measurement of the Density of Flowing Slurries'by Roland Clift and Diana Manning Clift.
Photographs
Extrusion Rheometer Test Data
Sieve Analysis Test Data
ii

NOTATION
A
cW
D
d
M
P
AP
Q
R
Re
Rec
S
V
vC
Vsu
V co
'wh
ct
E
rl
x
Pipe cross-sectional area
Delivered weight concentration
Pipe diameter
Particle diameter, mesh size
Specific energy
Gravitational acceleration
Hydraulic gradient
Length
Mass flow rate
Fraction of pebbles
Static pressure difference
Volumetric flow rate
Fraction of material in sliding bed.
Reynolds number
Critical Reynolds number (Laminar-Turbulent Transition)
Specific gravity
Mean velocity
Critical velocity
Velocity at threshold of suspension
Velocity of settling infinite fluid
Velocity of hindered settling
Shear stress ratio-T /TY Q
Pipe roughness
Plastic viscosity
Friction factor
iii

1-I Dynamic viscosity
V Kinematic viscosity
P Density
T
0Wall shear stress
'YYield stress
SUFFIXES
f Fluid
i Element
m Suspension
S Solids
W Water
ca carrier
iv

I. PHOSPHATE MATRIX PIPELINE DESIGN DATA AND TOOLSFOR EFFICIENCY IMPROVEMENT
A. INTRODUCTION
Mining of phosphate is one of the major industries in Florida
which produces some 30% of the world requirements. Drag-lines are used
to remove the matrix from the ground after which it is transported as a
water phosphate slurry by pipeline to the procesing plant. The nominal
diameters of the pipelines used in practice are 16, 18 and 20 inches in
diameter and the pipelines are up to 8 miles in length.
It will be realized that the power consumption of one such line,
10 miles in length and 18 inches in diameter, in which phosphate is
being pumped at a concentration of 50% by weight, is likely to be in
the region of 11,500 H.P. (8.6 MW). Clearly, with power consumptions
of this order it is essential that reliable operation should be sought
at the minimum specific energy attainable.
It was for this reason and because of the variability of the size
distribution, associated with the phosphate matrix material, that the
Florida Institute of Phosphate Research commissioned the Georgia Iron
Works Company and the unique capabilities of the GIW Hydrauilc Test
Laboratory to undertake a study into the flow characteristics of
phosphate slurries as outlined in Appendix I.
The proposal entitled "Phosphate Matrix Pipeline Design Data and
Tools for Efficiency Improvement" therefore, originated out of a desire
to improve the efficiency and reliability of matrix slurry pipelines
and at the same time provide the data and tools to help the practicing
Florida Phosphate Mine Engineer carry out this work.
The overall objective of this proposal was therefore to assemble a
comprehensive set of data on the full size pipeline and pump
I-l

performance of phosphate matrix slurry and put it in a form suitable
for Florida phosphate matrix designers, to make it possible for them to
improve the efficiency of new and present systems.
Specifically this was to be achieved by carrying out a series of
tests in both the laboratory and the field at different conditions on
selected phosphate matrix samples and by analysis and correlation of
the data into easily used forms.
The matrix to be tested and analyzed was to be identified and
selected by a geological survey for its type and pumpability so that
the tests and later results best cover a fully representative range of
Florida matrix transport conditions. Three matrix samples were to be
used. The pipelines employed in the test would be full size 16", 18"
and 20" diameter and the pumps would also be full size units now used
in the field.
The data collected was to be pipeline head loss, slurry deposit
velocity, pump head loss and pump efficiency at transport
concentrations now pumped and higher in the different pipeline
diameters noted earlier over a full range of velocities.
The correlated data presentation forms were to be designed to
maximize the benefit to all levels of engineering users. It was
intended that the data would be made available as raw tabulated data,
pipe friction plots, algebraic relationships and in an easy to use menu
driven computer program tool for use on a PC computer. It was expected
that the computer program would include an energy analysis for a
complete system, pump selection, pump spacing and startup sequence
recommendation capabilities.
A full copy of the technical section of the original proposal (and
later contract) is attached as Appendix A.
I-2

II. EXECUTION OF THE WORK
A project of this size and breadth involved a number of different
investigations of varying types, using different facilities and
personnel.
In spite of its extensive system of pipe loops, the GIW Laboratory
could not carry out the tests in its existing loops as specified. A
special test loop was therefore built in the GIW Hydraulic Test
Laboratory to carry out the pipeline and pump lab phase test work. The
main features of this were the use of the three full size series
connected pipe sizes of 16", 18" and 20" diameter with full 100
diameter entrance sections and a loading system that allowed a dump
truck to load into the system in a few minutes.
The tests were limited for economic considerations to three types
of slurries. It was essential therefore that these represented as well
as possible the range of Florida matrix types. A geological assessment
of the matrix being pumped by all of the Florida mines was necessary
before the three test slurries were selected.
The geological analysis of the different matrix types was carried
out by a Consultant, Henry Lamb, in conjunction with the project
director. As a result of this three mines were chosen as best
representing the range of Florida mine matrix. The mines chosen were
Noralyn at IMC, Suwannee River at Occidental and Hooker's Prairie at W.
R. Grace. A detailed report on the geological work is located in
Section 3.
Henry Lamb and the GIW Florida Manager, Roy Duvall, in turn
II-1
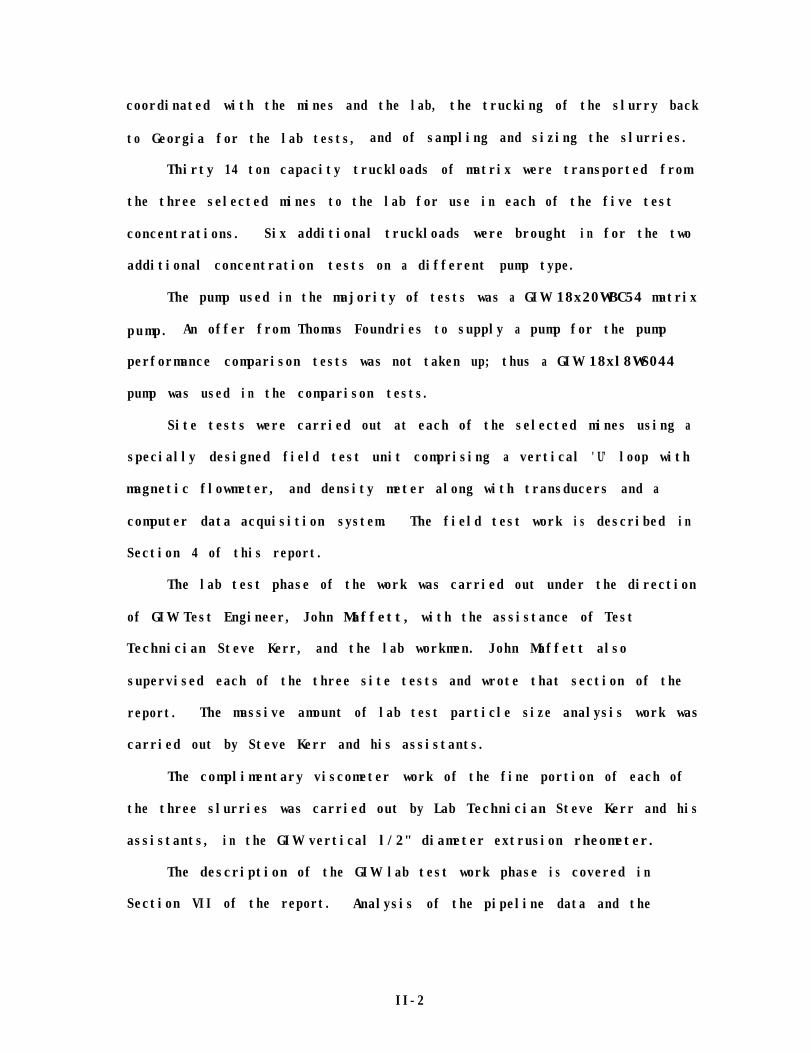
coordinated with the mines and the lab, the trucking of the slurry back
to Georgia for the lab tests, and of sampling and sizing the slurries.
Thirty 14 ton capacity truckloads of matrix were transported from
the three selected mines to the lab for use in each of the five test
concentrations. Six additional truckloads were brought in for the two
additional concentration tests on a different pump type.
The pump used in the majority of tests was a GIW 18x20WBC54 matrix
pump. An offer from Thomas Foundries to supply a pump for the pump
performance comparison tests was not taken up; thus a GIW 18xl8WS044
pump was used in the comparison tests.
Site tests were carried out at each of the selected mines using a
specially designed field test unit comprising a vertical 'U' loop with
magnetic flowmeter, and density meter along with transducers and a
computer data acquisition system. The field test work is described in
Section 4 of this report.
The lab test phase of the work was carried out under the direction
of GIW Test Engineer, John Maffett, with the assistance of Test
Technician Steve Kerr, and the lab workmen. John Maffett also
supervised each of the three site tests and wrote that section of the
report. The massive amount of lab test particle size analysis work was
carried out by Steve Kerr and his assistants.
The complimentary viscometer work of the fine portion of each of
the three slurries was carried out by Lab Technician Steve Kerr and his
assistants, in the GIW vertical l/2" diameter extrusion rheometer.
The description of the GIW lab test work phase is covered in
Section VII of the report. Analysis of the pipeline data and the
II-2

analysis which was carried out by Dr. Anders Sellgren.
The computer program as specified is menu driven and user
friendly. It uses the algorithm noted earlier and is based on the
original GIW selection, database and system analysis programs that the
writer worked on originally. The FIPR program now called "PAPES" was in
the main written by Todd Pike, with documentation by Carol Pike.
Consultant David Strout also provided specialist input and advice
from the mine engineers viewpoint.
The computer program allows system analysis evaluation for a
selected slurry type. Pump selection is carried out against a file of
pump performance data. No reply was received from Thomas Foundries to
a letter requesting test data on their pumps, so only pumps tested at
full size in the GIW lab and considered suitable for matrix service are
included. These comprise approximately fifteen pumps, three of which
are of Thomas manufacture and the remainder by GIW. The ability to add
pumps at any time, however, is included.
The computer program is set up for a PC with a hard disk and EGA
monitor, although with relatively simple changes it can be used on
virtually any MS DOS machine. Source listings and executable versions
have been provided to FIPR in the IBM PS2 machine that comprises part
of this contract. The program manual is contained in Section IX. This
section is written so it can be handed out on its own with the computer
program. As such it has its own list of contents and appendices.
II-3
Section VIII of the report covers the pump performance on solids
algorithm for the computer program.
Duckworth, who also established the pipe friction correlation and the
writing of that section of the report was carried out by Dr. Alan

In general, the test work was carried out as expected. After a
lot of early delays the tank loading/unloading system worked very well,
allowing the slurry to be loaded with minimal degradation and loss of
time.
The largest part of the project was the lab test work which as
noted earlier, was reported by Dr. Duckworth. Dr. Duckworth in this
section also comments on the extrusion rheometer tests work results,
comparison of the field test work results with the lab data, and
correlation.
A paper entitled 'Full Scale Experimental Study of the Pipeline
Transport of Phosphate Matrix Slurries' has been written by Dr. Alan
Duckworth (co-authored by John Maffett and the writer) on the Noralyn
Mine matrix phases of the test work, and has been presented at the 11th
Annual Hydrotransport Conference at Stratford-upon-Avon in England. An
expanded version of this paper, along with a description of the
computer program, has also been presented by Dr. Alan Duckworth and the
writer at the AIME meeting in Bartow, Florida on the 29th of October.
Copies of these are enclosed as Appendices D and E.
II-4

III. GEOLOGICAL ANALYSIS
A. PRODUCTION ENVIRONMENT
Phosphate rock is produced from two districts in the State of
Florida (Figure III-l). The Central Florida District has been most
productive in terms of annual and total tonnage. The district lies
south of Lakeland and occupies parts of Polk, Hillsborough, Manatee,
Hardee, and DeSoto counties. Eleven (11) companies operate or have the
potential to operate at nineteen (19) mine sites. The phosphate
deposits of Hardee, Manatee, and DeSoto counties are often referred to
as the South Florida Phosphate District or the Southern Extension of
the Central Florida Phosphate District. While historically mining has
been centered in Polk and Hillsborough counties, future production will
move southward.
The North Florida Phosphate District is located north of Lake City
in Columbia and Hamilton counties. Production is limited to one (1)
company operating two (2) mine sites.
The combined annual production capacity for the Central and North
Florida Phosphate Districts is in excess of 50 million short tons.
Table III-1 provides a list of companies and mine sites.
Phosphate rock products from Florida are primarily used in the
manufacture of fertilizer. Consumptive chemical plants are located
near the Central and North Florida mine sites and in the southern
portions of the mid-west, principally along the Mississippi River.
Additional phosphate rock is sold on the international market.
B. GEOLOGIC ENVIRONMENT
The Florida phosphate deposits are mined from two geologic formations:
III-1


TABLE 111-l. Phosphate Rock Mining Companies and Mine Sites
Operator
IMC Ferti 1 izer Corporation
C.F. Industries
W.R. Grace & Company
Freeport-McMoRan Resource Partners
USX Agri-Chemicals
Estech, Inc.
Seminole Fertilizer Company
Gardinier, Inc.
Mobil Mining and Minerals Company
Hopewell Land Corporation
Nu-West
Occidental Chemical Company
Notes:
Mine Site
Noralyn/Phosphoria Clear Springs Kingsford Haynsworth Fort Lonesome Four Corners (50%)
Hardee Complex I
Four Corners (50%)
Payne Creek Fort Green Rockland (50%)
Rockland (50%)
Silver City Watson
Hookers Prairie
Fort Meade
Fort Meade Nichols Big Four
Hopewell
Wingate Creek
Suwannee River Swift Creek
Capacity
5.OMM 3.OMM 4.OMM 2.5MM 2.OMM 2.OMM
l.OMM
2.OMM
2.5MM 3.5MM l.OMM
l.OMM
1.5MM l.OMM
2.8MM
3.OMM
3.OMM 1.8MM 2.5MM
0.6MM
1.8MM
2.OMM 1.5MM
Notes
A
A" A
: (1:
A
1 0:
:: A
A
:: (2:
A
A
A (2; 1 (3, 1 (3:
A (4:
I (5'
t
, $1
(1)
(2)
(3)
(4)
(5)
denotes active mine as of November 1, 1988 denotes inactive mine as of November 1, 1988
The Four Corners Mine is a 50-50 joint venture between IMC Fertilizers and W.R. Grace. Operational management has transferred from Grace to IMC. Negotiations are underway to transfer full ownership to IMC. The mine is expected to re-open in 1989. The Watson and Fort Meade mines are expected to cease operation within the next two years. The Nichols and Big Four mines are expected to re-open within the next two years. Hopewell Land Corporation is a fully owned subsidiary of Noranda. In January, 1989, ownership is expected to be transferred from Noranda to Hopewell Land Partners Limited. The Wingate Creek Mine was recently acquired by Nu-West from Beker Phosphate Company. The mine is expected to be reactivated in 1989.
III-3

1) the Bone Valley Formation; and 2) the Hawthorne Formation. These
deposits are Miocene to post-Miocene in age. There is an effort within the
Florida Bureau of Geology to subordinate the Bone Valley to a member of the
Hawthorne while elevating the Hawthorne to group status.
Within a regional context the phosphate occurs in essentially flat lying,
blanket-type deposits. There is no impact on mining by structures related to
faulting or folding. Generally, the phosphate horizon is l0-20 feet thick.
Deposits in the Southern Extension of the Central Florida District increase in
thickness to average in the range of 35-45 feet.
The phosphate matrix (ore) is overlain by a blanket of
Pliocene-Pliestocene, unconsolidated sand and clay. This overburden ranges in
thickness from five to more than fifty feet. Typically the thickness is 15-30
feet.
The matrix is underlain by limestone bedrock or a stiff, phosphate-
performed as part of this study confirms that the classic definition is
outdated and will become more outdated as new mines are opened. Basically,
the matrix size characteristics are becoming more dominated by the feed size
fraction at the expense of the pebble.
C. MINING ENVIRONMENT
Phosphate rock mining is accomplished by open pit strip mining
techniques. The process begins with general land clearing using bulldozers.
III-4

Large, walking draglines with 20-65 cubic yard buckets are then used to strip
the overburden and cast it into adjacent mined areas. The uncovered matrix is
mined by the dragline and dumped into an earthen pit, a 'well', where it is
broken down under hydraulic pressure. Usually three monitors, equipped with
nozzels 2.5-3.0 inches in diameter, attack the matrix with water at a rate of
6,000-8,000 gallons per minute and pressures ranging from 2OO-250 psi.
One exception to the dragline mining has been the application of dredges
for overburden removal and matrix mining at a small mine in Manatee County.
The matrix slurry begins its journey to the washer/beneficiation plant by
passing over a grizzely. The grizzely is designed to remove exceptionally
large particles (limestone boulders, roots, stumps, etc.) from the slurry.
The slurry enters the pumping system through a suction arm and immediately
passes into the pit pump. Pit pumps are typically driven by 1250-1500
horsepower electric motors. Booster pumps (1000-1500 horsepower) are located
along the pipeline at intervals ranging from 2500-4500 feet depending on
matrix pumping characteristics. The pipeline is constructed from 50-100 foot
joints of steel pipe with diameters varying from 16-20 inches.
Generally, pumping distances increase with mine life. The average
distance over the mine life is perhaps 3.0 miles. With the high capital cost
of constructing new mines, there has been a growing tendency to increase
pumping distances and absorb the increased cost of production. Pumping
distance of more than 8 miles are becoming more commonplace.
The washer/beneficiation plant separates the matrix slurry into phosphate
rock products (pebble and concentrate) and waste materials (tailings sands and
clay). The pebble products are separated at the washer. Depending on deposit
characteristics, pebble products are typically minus 3/4 inches plus 14 or 16
mesh in size. In the feed preparation section, the clay waste (-150 mesh) is
III-5

removed from the feed (-14 or -16 mesh plus 150 mesh). The feed is composed
of sand and silt size particles. Flotation techniques are employed to
segregate the phosphate and quartz grains to yield a concentrate product and a
sand tailings waste.
From a geologic context the project scope called for the laboratory and
field testing of three types of phosphate rock matrix. These types were
further defined as difficult to pump, typical to pump, and easy to pump.
Needless to say these relative terms opened the door for all forms of
discrepancies. Material difficult for one producer may be considered 'gravy'
by another.
It was the function of GIW's geologic advisor to identify the geologic
factors which most strongly influenced the matrix pumpability. Many
descriptive factors were considered. Since the overall project scope included
the development of a user friendly pumping system design program, the
descriptive factors defining the matrix types had to be based on information
readily available in each operator's phosphate rock reserve database. The
matrix size distribution was determined to be the most appropriate and
universally available factor.
One final logistical demand was placed on the test site selection.
Because the laboratory and field tests would be occurring over a period of
time (2-3 weeks), the test site was required to be as uniform as possible for
the collection of matrix samples from various points as the dragline proceeded
along its mining cuts.
D. PROCEDURES
Information about the matrix size characteristics (% pebble, % feed, and
% clay waste) was requested from several operating companies. This data was
III-6

provided for each dragline at each mine as it appears in the company's reserve
database. The area for which the data were obtained was generally limited to
the area in the six month mine plan for January to June, 1988. In some cases
additional data were requested and provided for the period of June to
September, 1988.
The size distribution percentages for each dragline were plotted on a
triangular chart as shown in Figure III-2. This plot provided a visual
analysis of the variation to be encountered during mining. Mining areas with
a high variability (Figure III-3) were avoided in favor of areas exhibiting
low to moderate variation (Figure III-4).
The procedures used in classifying the matrix are similar to those of
Paugh, et. al. (1981).
To facilitate the data analysis a brief computer program, written in
FORTRAN, was developed by Mineral Resource Associates. A copy of the program
is included as Appendix III-1.
To compare the mining area the average matrix size distribution for each
dragline was calculated and plotted on a single chart (Figure III-5.) This
chart revealed that the concept of l/3 pebble, l/3 feed, and l/3 clay was no
longer the rule but the exception. Figure III-5, coupled with industry
experience and practice, provided the basis for identifying difficult, typical,
and easy pumping characteristics.
Difficult to pump matrix was defined as that material which most closely
approximated an equal proportion of pebble, feed, and clay. Industry practice
has been to use maximum horsepower (1500 hp) and close booster pump spacings
(2500 feet) when transporting this type of matrix.
The typical matrix was characterized by 15-20% pebble, 50-60% feed, and
25-30% clay. For this type of matrix moderate horsepower (1000-1250 hp) and
III-7

III-8

III-9

III-10

III-11

moderate booster pump spacings (3000-3500 feet) are normal.
Finally, the easy to pump matrix is virtually lacking in pebble
(<5%) and dominated by feed (75-85%) with a minor to normal clay content
(l0-20%). Moderate horsepower and long booster pump spacings (4000-4500 feet)
are general practices in this type of matrix.
E. SITE SELECTION
1. Test Site No. 1.
Selection of the difficult to pump matrix presented little
difficulty. From an analytical standpoint the site was very obvious. See
Figure III-5. Field inspection confirmed the exploration data.
Mining sites such as represented by Test Site No. 1 are becoming rare in
the Florida Phosphate Industry. They are generally limited to small areas
such as relic sinkhole or stream channel structures.
Exploration data for Test Site No. 1 suggested the pebble-rich matrix was
relatively uniform over an area of 200-300 acres. The overburden was 20-25
feet thick. The matrix was 25-30 feet thick. Some stratigraphic variation in
the matrix was noted. In general the clay content increased with depth at the
expense of the feed and pebble fractions.
Test Site No. 1 most closely approximates the historical definition for
the particle size distribution of the phosphate matrix components. Based on
thirty-two (32) drill holes, the average pebble content was 37.6% of the
matrix, the feed fraction represented 33.1%, and the clay (-150 mesh) was
28.9%. The missing 0.4% may be due to rounding errors in the data provided by
the operator or related to oversize material discarded during the exploration
laboratory analysis of the matrix.
Site inspection and sampling at the time of bulk sampling and during the
III-12

field test confirmed the anticipated matrix size distribution within reason-
able limits of variation. Samples taken during the field test and bulk
sampling program averaged 46.2% + 14 mesh pebble, 26.2% -14 + 150 mesh feed,
and 27.6% -150 mesh fines.
The matrix size distribution for Test Site No. 1, as represented by the
exploration drill data, is illustrated in Figure 111-6.
2. Test Site No. 2
The second test site was selected with little difficulty. A site
dominated by feed size material was sought and identified. Test Site No. 2
was considered to represent material in the easy to pump category.
Based on eighty-nine (89) drill holes, the pebble, feed, and clay
contents were estimated at 1.9%, 76.7% and 21.5%, respectively. Site
inspection and sampling during the field test verified the high percentage of
feed, lack of coarse pebble, and moderate clay content. Field samples
indicated 1.0% +14 mesh pebble, 87.4% -14 +150 mesh feed, and 11.6% -150 mesh
fines. Operational personnel at this mine reported a shift in pumping
characteristics as the size distribution varied from fine-grain (-65 Mesh) to
medium-grain (35-65 Mesh) to coarse-grain (+35 Mesh) feed.
Data for the test area indicated a relatively uniform, feed-dominate
matrix over a broad geographic area. Stratigraphically, the matrix appeared
as a uniform ore bed. No concentrations of pebble or clay were noted other
than a thin clay seam approximately one foot thick near the upper contact.
The matrix zone was 15-20 feet thick and overlain by lo-15 feet of overburden.
Additional laboratory and field tests to examine pumping characteristics
as the feed size distribution changes were not within the project scope.
However, in the future as matrix characteristics become more dominated by feed
III-13

III-14

size material, the impact of such variances should be investigated.
The matrix size distribution for Test Site No. 2, as represented by the
exploration drill data, is illustrated in Figure III-7.
3. Test Site No. 3
The third test site, representing the typical matrix, was the most
difficult to select. Those draglines with average matrix size
characteristics for a six-month mine plan also demonstrated a wide range of
extremes on a hole-by-hole basis. Thus, for many potential test sites the
condition of matrix uniformity for the laboratory and field test period could
not be guaranteed. These conditions were offset by organizing the field test
and matrix sampling and transport activities into the shortest time span
possible, approximately one week.
The matrix size characteristics for most 'typical' sites are also
influenced by stratigraphic variations. In many cases the upper one-third of
the matrix is pebble dominated and may approach the size characteristics of
Test Site No. 1. The lower two-thirds of the matrix is feed dominate and is
similar to Test Site No. 2 with perhaps an increase in clay content of 5%-10%.
Fortunately, the mining and slurrying process usually results in a mixing of
the upper and lower zones.
The matrix size characteristics for Test Site No. 3, as represented in
fifty-six (56) drill holes, was 13.6% pebble, 60.4% feed, and 26.1% clay. Pit
inspection during the field test and matrix sampling did not indicate signifi-
cant variations from the expected size characteristics. Field samples
contained 11.5% +14 mesh pebble, 60.9% -14 +150 mesh feed, and 27.6% -150 mesh
fines.
III-15

III-16

The matrix size distribution for Test Site No. 3, as represented by the
exploration drill data, is illustrated in Figure III-8.
F. FIELD PROCEDURES
After selecting the test sites using analytical methods, each site
was visited to confirm its suitability. Visual inspection supported the
matrix size distribution as reported in the geologic reserve database. The
matrix exposed in the mining pit walls was inspected to insure a reasonable
degree of matrix uniformity would prevail throughout the laboratory and field
testing period.
At each site approximately 250-300 tons of phosphate matrix was recovered
by the dragline and stockpiled. The stockpiled material was then loaded into
bulk hauler trailers with a 20-ton capacity and transported to the GIW
Hydraulic Laboratory in Grovetown, Georgia. GIW trucks and trailers
transported the matrix.
Whenever possible a representative of Mineral Resource Associates was
present during sample collection and truck loading. When MRA personnel were
not available representatives of GIW were at the site or supervisory arrange-
ments were made with operational personnel who were knowledgeable about the
project. The project scope called for 150 tons of matrix to be transported
from each test site to the laboratory. Care was taken to insure the test site
sample was representative and not contaminated by overburden. The recovery of
excess material, stockpiling and loading process coupled with the stockpiling
and rehandling at the GIW Laboratory served to thoroughly mix the matrix prior
to injection into the GIW pumping loop.
III-17

III-18

G. REFERENCES
Paugh, J. H., Peterson, M. L., Barnett, D. H., and Menozzi, R. A., 1981,
Evaluation of Pumpability from Process Data: AIME Preprint Number 81-407,
Presented at the SME-AIME Fall Meeting and Exhibit, Denver, Colorado, November
18-20, 1981.
III-19

APPENDIX III-l. TRIANGULAR PLOT COMPUTER PROGRAM
The following program was developed by Mineral Resource Associates and is writ-ten in FORTRAN. Significant modifications may be required to optimize theprogram and install it on other computer systems.
Data input is from a specially prepared database. The user may elect to modifythe data file identification sequence and the format code to utilize existingdatabases. Additional FORTRAN statements will be required to convert tons peracre to percentages for the various size components.
For additional assistance contact Henry J. Lamb of Mineral Resource Associates.


IV. THE GIW HYDRAULIC LABORATORY TESTS AND ANALYSIS
OF THE LAB AND FIELD PIPELINE DATA
A. INTRODUCTION
Although there are several semi-empirical methods for the
prediction of the flow characteristics of phosphate slurries, the
variation of the size distribution of phosphate matrix material coupled
with the differing rheological behavior of slurries formed from this
matrix, made it essential that a detailed experimental study be carried
out.
In order to examine the influence of pipe size, concentration and
the type of phosphate material on the hydraulic gradient velocity
characteristic, the experimental studies cover the pumping of slurries
made up of three types of phosphate material in pipes of 16, 18 and 20
inches in diameter at concentrations of up to 50% by weight.
In the body of this report, emphasis is placed upon the
methodology of the work carried out with respect to:-
( i) The experimental studies carried out at the GIW Hydraulic
Laboratory and in the field,
( ii) The analysis and discussion of the experimental results.
(iii) The development of algorithms for the prediction of the
resistance characteristics of the pipeline system, the
extensive sets of experimental data, computer listings,
specimen calculations and diagrams, etc. being presented in
the appendices.
IV-1

Additionally, the underlying thinking which pays particular
attention to the application of the results of this work to the
phosphate industry is discussed. The latter is considered to be of
particular importance in that the analysis and the algorithms that
follow from this take into account the information available to
engineers in the field and to their experience. In particular, as we
might expect, although the size distribution and mineralogy of a
phosphate matrix material have a very significant influence upon the
flow characteristics of phosphate slurries in pipelines, we
nevertheless have to consider the fact that engineers in the field,
have only limited information available to them. Such information is
normally in the form of the triangular plots defining the relative
fractions of pebble, feed and fines, together with the industry's first
hand experience of the influence of the clays. The algorithms have
been so developed that they provide solutions based upon such limited
information on size and information of the mineralogy rather than upon
detailed size distributions.
The computer solution for the total system is approached from
precisely the same point of view, in that input requested by the
computer is information that is readily available to engineers, and the
practical import of this too is discussed.
B. THE SELECTION OF PHOSPHATE TEST MATERIALS
Since the objective of the project was to provide design
information needed for the pumping of the wide range of phosphate
matrix materials currently handled, and since for practical reasons it
was only practically feasible for a limited number of types of material
IV-2

to be examined, considerable judgement had to be exercised in the
selection of three types that were suitable for the study.
In making the selection we relied upon the experience of the
industry, the mineralogical expertise of Mr. Henry Lamb, and our own
experience in the pumping of coarse and fine materials, either
separately or in combination.
A detailed discussion of the mineralogical work and the basis for
the selection of the materials to be tested is given in Section III,
The Geological Analysis.
Coarse materials have been long known to be difficult to pump,
compared with fine materials; this is dramatically illustrated in the
case of coarse and fine coal pumping. The long distance pumping of
coal is achieved at hydraulic gradients of the order of 0.01 - .02 (ft
of water/ft), and at specific energies of the order of 0.1 (HPhr/Ton
mile).
with a
hydrau
ieved by grinding to a top size of approximately lmm This is ach
d50 of 200 m
lit gradients
i crons. Coarse coal on the other hand, may requ
and specific energies as high as ten times that
ire
of
fine coal, though work by Duckworth et. al (1.2). has shown that the
high gradients in energy consumption can be significantly reduced by
combining fine and coarse materials.
In selecting the materials, we thus attempted to obtain matrix
types which represented the extremes so far as particTe size was
concerned. It is clear from the triangular plots of Figure 1, that the
Noralyn phosphate of the IMC Fertilizer Co. represents the coarse
extreme with some 40% of the material in pebble form, whilst the
Suwannee River phosphate of the Occidental Chemical Company, with a 2%
pebble component, represents the fine extreme. Experience in the field
Iv-3


confirmed that the Noralyn and Suwannee River slurries, were difficult
and easy to pump, respectively. A phosphate material which fell
between these two extremes, with some lo-14% in the form of pebble, is
to be found in the Hooker Prairie phosphate of W.R. Grace & Company.
In all cases clays were found to associate with the phosphate
matrix materials and these had the effect of transforming the carrier
liquid portion of each slurry from water to a non-Newtonian Bingham
Plastic type of fluid. The Noralyn and the Hookers Prairie types of
phosphate matrix material have a higher fines content (28%) than the
Suwannee River material (~21%) and this results in different
rheological properties, higher yield stresses and higher plastic
viscosities being associated with the Noralyn and Hookers Prairie
slurry carriers.
Thus these three materials were selected, a Noralyn phosphate, a
Hookers Prairie phosphate and a Suwannee River phosphate to enable us
to assess the relative influence that pebble size and fines have on the
pumping of phosphates in the Florida region. We now turn to consider
the experimental program that has been carried out to quantify these
and other factors which influence the pumpability of phosphate
slurries.
C. THE EXPERIMENTAL STUDIES
1. General
While numerous studies of the flow characteristics of slurries in
pipes have been undertaken since the pioneering work of Durand (3), and
many different types of correlation have been developed, few of these
IV-5

have found general acceptance. Where we are interested only in very
rough approximations to performance many of the correlations are
appropriate. However, as in this case, we are anxious to obtain
equations and correlations that will give a reasonably close agreement
between prediction and operating experience, it is considered essential
to carry out carefully controlled experiments using the types of
material and their slurry form that are to be found in the field. It
is reasonable to expect that the correlations based on such work will
produce predictions that will be in close agreement with practice.
Furthermore, by carrying out the experiments in pipes of the same
diameter as those to be used in the field, we avoid the problems that
can be involved in scaling up the data. We should not be surprised by
this move to full scale testing, for although the aircraft industry has
used soundly based model testing since its inception, the tendency has
been towards full scale testing, made possible by the development of
large scale wind tunnel test facilities.
The large scale testing facilities available at the GIW Hydraulic
Testing Laboratory for the testing of slurry flows in a pipe have made
it possible to carry out full scale tests in a controlled laboratory
environment. Additionally, the company's experience in on-line data
acquisition and analysis has enabled it to carry out field trials on
pipelines of the same diameters carrying slurries that are
substantially the same as those tested in the laboratory.
2. The GIW Test Facility
A detailed account of the GIW Hydraulic Laboratory has been given
in reference 2 and therefore only the features of the facility that
IV-6

have made this study possible are discussed here; the availability of a
motor with a power output of 1500 KW, and a data logging and analysis
system that is capable of handling the data generated by some 30
transducers, many of which are used to instrument the test equipment of
this study. The instrumentation available in the laboratory is as
follows:
( i)
(ii)
(iii)
( iv)
( 4
( vi>
piezoresistive transducers, Bourdon tube
pressure gauges and manometers,
magnetic flowmeters, bend meters and tanks for volumetric
flow measurement and calibration,
4-IC thermistor-type temperature
transducers,
1100; 2200; 25,000 and 50,000 Nm torque
bar units,
magnetic coup ling and photoe lectric eye
tachometers,
gamma ray attenuation, vertical U-tube
and a sampler collector and weighing system for slurry
density measurement.
All instruments are normally duplicated and are calibrated prior
to a testing program. A typical set of calibration data obtained prior
to this project is given in Appendix B. The control of motors and
valves is by electrical or pneumatic control devices actuated from the
control room. Data collection is performed at a minimum of 20 readings
per second over any of the available 32 channels of 12 bit accuracy,
IV-7

and is under the control of software programs. Monitoring, averaging
and storage of the data may be varied during a test.
3. The Test Equipment
In addition to the availability of the above equipment it was
clearly necessary to build a dedicated test loop for the testing of
pipes of 16, 18 and 20 inches in diameter, of sufficient length to
provide for the attainment of fully established flow in the test
sections. A method of loading was devised which was capable of loading
some 20 tons of material into the system in as little as one or two
minutes, (and every effort was made to achieve this), the latter
requirement arising from the need to keep degradation, due to
recirculation around the loop to a minimum. It was also necessary to
provide for the periodic flushing of the system so that water only
tests could be carried out throughout the test program, and to provide
for the test material to be periodically renewed. For this purpose a
by-pass circuit fitted with a cyclone separator was installed.
The above features are shown in Figure 2 where we see that the
pipes are arranged in series and are provided with slurry at a sensibly
constant concentration by means of a centrifugal pump having a capacity
of some 20,000 USGPM (75.7 cu.m./minute) at a head of some 300 ft of
water (91 m. of water). Each test pipe is fitted with a test length of
about 50 pipe diameters preceded by an approach length of about 75 pipe
diameters of straight pipe. Two sets of pressure taps, A and B, are
fitted in the upper part of each test pipe, one on each side of the
plane of symmetry, two pressure transducers being connected in parallel
IV-8


across each pair of taps "A" and taps "5". for the measurement of the
hydraulic gradient.
The flow rate was measured by means of a magnetic flowmeter and a
bend meter and the delivered slurry S.G. was measured by means of the
vertical U-tube S.G. loop and by a gamma-ray attenuation density meter.
Pressure transducers were connected across the two sections of the
U-tube, one across the rising pipe section and one across the falling
pipe section for the S.G. measurement and across the bend meter for the
flow measurement. Measurements were also made of the pump speed and
torque for the analysis of the pump performance.
Perhaps one of the most challenging problems was that of loading
very large quantities of phosphate into the system, and the method
whereby this was achieved is shown in Figure 3. This loading system
consists essentially of a dump truck of 20 tons in capacity which feeds
the material directly into a sump, partially filled with water. A set
of four nozzles, 4 inches in diameter, are arranged in parallel and are
supplied with high pressure fluid, initially water and then slurry when
the material has passed through the pump. These nozzles serve to break
up large agglommerates of the phosphate, wet and de-aerate the
material, and generally assist in the rapid loading of the material
into the system. In order to assist in the entrainment of the material
and its passage into the pump suction pipe, the return line feeds
directly into the sump at a location immediately opposite the entrance
to the suction pipe.
The material unloading system, is shown in Figure 2, and includes
a knife-gate valve which serves to by-pass the slurry from the system
IV-10


and allows the slurry to pass to a cyclone separator. The latter
separates the water from the material, returning the water to the
sump, and dumping the material into a hopper from which it is
periodically discharged into trucks for disposal.
While this unloading system was appropriate in the case of the
coarse Noralyn phosphate slurries, this method proved to be
inappropriate in the case of slurries formed from the Suwannee River
and Hookers Prairie phosphate materials. In these latter slurries, the
water combined with the phosphate fines to form virtually homogeneous
Newtonian or non-Newtonian slurries, which could not be adequately
dewatered by the cyclone, and in such cases the slurry was simply
discharged from the pipe onto the ground and allowed to dewater
naturally by evaporation.
D. THE EXPERIMENTS
As mentioned previously, in order to minimize degradation it was
necessary to keep the time during which the material was circulating in
the loop to a minimum and to avoid as far as possible the use of valves
for flow control by throttling. To this end estimates were made of the
amount of material required to attain the required concentration, this
amount of material then being made available in a truck or trucks. The
pump was run up to speed sufficient to provide a flow of some 12,000
USGPM and the material was then dumped into the sump. This worked
reasonably satisfactorily, and even at the highest material loading
flow rates of 2 Ton/minute the pump did not have any difficulty in
ingesting the material. There was, however, one traumatic experience
during
IV-12

loading which occurred when a batch of material became hung up in the
dump truck with the angle of the truck at about 60 degrees to the
horizontal and then suddenly slid as a solid mass and caused some
permanent damage to the sump entrance. The pump appeared, however, to
carry on as though nothing had occurred.
Once the material had been loaded and drawn into the pipe loop the
pump was shut down, the material allowed to settle in the pipe, and the
air entrained during the loading process was vented to atmosphere
through the specially provided vents. If, during the period in which
the slurry was circulating, the S.G. of the slurry, as measured by the
vertical U-tube, was close to that required, the tests were begun.
Otherwise, an additional amount of material was added as discussed
above to attain the required S.G.
Tests were carried out at a sensibly constant delivered
concentration for a range of flows up to the maximum attainable of
20,000 USGPM corresponding to a slurry velocity of approximately 28
ft/s in a pipe of 17.25 inches in internal diameter. Variation of the
flow was achieved by altering the pump speed by means of a fluid drive,
each test taking about one hour for 15 sets of readings. This was the
minimum time required and meant that the material made some 70 circuits
around the pipe loop. A typical set of data so obtained is given in
Table I.
Other tests carried out included water tests before and after the
circulation of sand through the loop to assess the water resistance
characteristic and hence the roughness ratio, e/D, the particle size
analysis by both wet and dry sieving, and the settling velocity of the
IV-13

various solids that make up the phosphate material. The roughness was
found to be of the order of 5x10⁻⁵, the shape factor 0.26, and typical
size distributions are given in Figures 4 and 5. A detailed discussion
of the size analysis is given in the Experimental Results section.
E. THE EXPERIMENTAL RESULTS
1. Hydraulics Laboratory
The experimental data acquired by means of an on-line data
acquisition and computing system is of the form shown in Table I, the
complete sets of such data for the three materials studied being given
in Appendix C. However, for the purpose of discussion of the results
it is convenient to present them in the form of the characteristic
hydraulic gradient-velocity curves for which the concentration has been
maintained sensibly constant. Typical sets of such curves for slurries
of Noralyn, Suwannee River and Hookers Prairie phosphate matrix flowing
in a pipe of 17.25 inches in internal diameter are shown in Figure 6, 7
and 8.
In Figure 6, we see that the curve for the Noralyn slurry, which
has a pebble fraction of 0.46, is of the form expected in which coarse
material is present and the coarse material flows in the form of a
sliding bed, particularly at velocities close to the minimum hydraulic
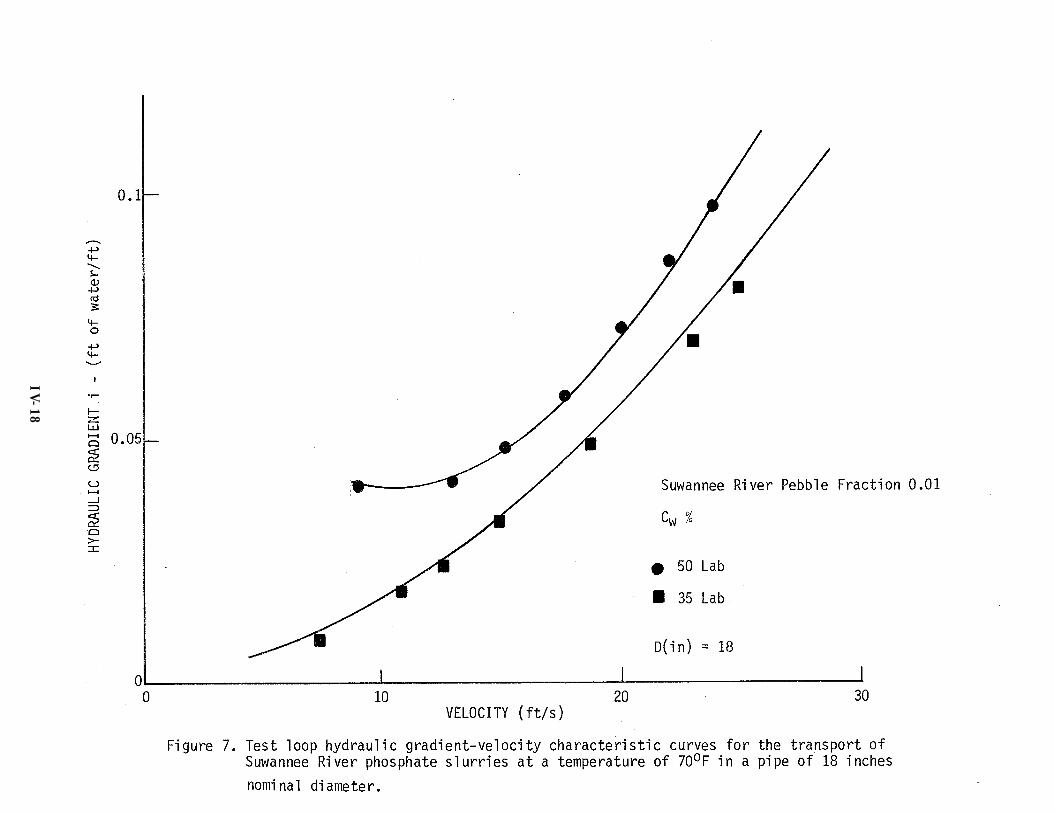
gradient condition. The curves for the Suwannee River slurry, shown in
Figure 7, on the other hand, having a pebble fraction of the order of
0.01, appears to have no tendency to form the familiar hooked curve
form of a settling suspension even at a concentration of 50%. The
IV-14

IV-15

IV-16

IV-18


curve could be construed as a curve of a Newtonian fluid or a
non-Newtonian fluid of low yield stress. The hydraulic gradients in
the operating region of velocities of lo-'15 ft/s are seen to be some
25% lower than the Noralyn slurry, thus confirming that the Suwannee
River slurries are easy to pump.
The final slurry to be examined in the laboratory was the Hookers
Prairie slurry and the characteristic curve is shown in Figure 8. This
slurry had a pebble fraction of the order 0.115, and was expected to be
of intermediate pumping difficulty. However, the laboratory data
suggests that this slurry is difficult to pump, the hydraulic gradients
at a concentration of only 40% being similar to those of the Noralyn
slurry at 50%. Furthermore, the shape of the curves suggests that the
slurry is behaving as a non-Newtonian Bingham type fluid. We should
not be surprised at this, since a relatively low pebble fraction
(0.115) implies that these is a large fraction of feed plus fines
(0.885). and it is the fines, (-600 microns), fraction, of about 0.8,
and the associated clays that govern the rheology of the slurry carrier
fluid. Whether the apparent rheological behavior of the slurry flowing
in the pipe of 18 inches in diameter in the laboratory is
characteristic of the behavior in the field situation and to the
behavior deduced from small scale tube-rheometer tests remains an open
question until we consider the results of these other sets of
experimental data.
2. Field Tests
The experiments that were carried out in the laboratory could
not be wholly replicated in the field tests at the Noralyn, Suwannee
IV-20

River and Hookers Prairie mines due to the difficulties of controlling
the variables during production. However, this was partially overcome
by using an on-line data acquisition and computing system that was very
similar to that used in the laboratory and the same S.G. loop that had
been used. The methodology of the field study is given in the separate
Field Test section, Section V of the report and this will not therefore
be discussed further. However, the experimental data has been
extracted from Section V for the purpose of comparison with the
laboratory data.
In order to illustrate the correspondence between the laboratory
and the field data, the results have been plotted in the form of
hydraulic gradient-velocity curves and these are given in Figures 9, 10
and 11. It is clear that only in the case of the Noralyn slurry is
there a close agreement between the laboratory data and the field data.
It will be noted that due to the inevitable variability that occurs in
the field there is considerable scatter in the data shown in Figure 12,
and therefore the field data are expressed as a single point, together
with an indication of the spread of the data.
By far the greatest discrepancy between the laboratory and the
field data is seen to occur in the case of the Hookers Prairie slurry.
Now, in considering this we recall that the Hookers prairie slurry, and
to a lesser extent the Suwannee River slurry, appear to behave as
non-Newtonian slurries of the Bingham type. We may expect, therefore,
the rheological properties of such slurries to be altered due to
circulation through the pipe test loop in the laboratory, this being
caused by the degradation of the material to produce more fines and the
IV-21


associated release of clays as the material continually passes through
the pump. In fact during the duration of a single test, normally about
one hour, the material could make as many as 70 passes and this is to
be compared with a maximum in the field equal to the number of pumps in
the line. In the actual field tests measurements were made after the
4th, 2nd and 5th pumps for the Noralyn, Suwannee and Hookers Prairie
slurries, respectively.
We may therefore expect in general to obtain higher gradients in
the laboratory tests, this being particularly so in the case of the
slurries of high feed and fines content (i.e. low pebble). In order to
attempt to resolve this question a series of rheological tests were
carried out using fines from the
tests, and from material that had
If the supposition, that degradat
had created fines and released cl
1
i
a,
aboratory test loop, following the
not been circulated through the loop.
on during pumping through the loop
ys, with a corresponding change in
the rheological properties were true, then this might be borne out by
the results of rheological studies.
3. Rheological Tests
The test procedure adopted and the experimental data are
presented in Extrusion Rheometer section, Appendix H of the report and
the details of this testing will not be discussed. The raw data
obtained during the tests will, however, be analyzed in order to
determine the rheological properties of yield stress, T Y'
and the
plastic viscosity, n, of the several slurries, and to determine the
functional relationship between these properties and the volumetric
IV-26

concentration. Use is made of the fact that the specific gravity of a
slurry is related to the volumetric concentration by the variable,
(s mca'l). The preparation of plots showing the relationship between
the rheological properties and (Smca -1) presents no problem in the case
of the rheological test data. However, to assess the equivalent curves
from the pipeline test data , it is necessary to determine the hydraulic
gradient of the carrier fluid, i,,, by subtracting the total hydraulic
gradient, im, the component arising from the pebble content. The
equations used for this purpose will be discussed subsequently in the
analytical section that follows.
The results obtained from the rheological tests and the pipeline
tests are shown in Figure 13 and 15 and since, it is more convenient,
from the point of view of the computer to express the relationship in a
mathematical form, power laws of the following form have been fitted to
all the data,
TY = Cy(S,ca-l)N
n = l.lw ( Ce(Smca-l)M + 1
1
(1)
(2)
where N and M are constants having values of 3.78 and 2.2,
respectively, and Cy and Ce vary according to the slurry under
consideration and its previous history.
One of the most striking features of the curves of Figure 13,
relates to the curves for the Hookers Prairie slurry. In this case we
see that each of the curves exhibits markedly different behavior. The
IV-27

IV-28


IV-30

first rheological test used a slurry that had been obtained from the
pipeline in the laboratory at the conclusion of the test at 50%
concentration by weight, the second slurry was made from the raw
material and the pipeline curve was based upon the pipeline data. The
differences may be explained as follows:
(i)
(ii) The pipeline test curve relates to basically the same
type of slurry, but without the aging effect.
(iii) The curve of the second rheological test relates to a
slurry formed from the raw material which had not been
subjected to degradation.
The first test had been carried out on material that had
been degraded during the pipeline tests, but in this
case it had been left some considerable period before
being tested. The effect of aging is to allow the floc
structure of the slurry, which would have been broken
down during pumping, to rebuild, thereby increasing the
yield stress.
The important curves from the point of view of explaining the
discrepancy between the laboratory test data and that of the field test
are the pipeline test curve and the second rheological test curve of
Figure 13. It can be seen that the constant Cy for the pipeline is
twice that of the second rheological test (i.e. the yield stresses are
in the ratio of 2:l). Now, since during the field trials the slurry
had only passed through five pumps it is unlikely to have been
significantly degraded and may be expected to behave in the same
IV-31

way, from a rheological point of view, as the slurry used in the second
rheological test. This supposition is borne out when we see that the
hydraulic gradients obtained in the laboratory and the field are in the
ratio of about 2:l.
The rheological tests for the Noralyn slurry carrier seem to have
substantially the same yield stress as that obtained from the second
rheological test of the Hookers Prairie slurry. This is to be
expected, since the fines contents of the two materials are
approximately the same (i.e. 28%). The fact that the yield stress of
the Noralyn slurry taken from the laboratory pipeline and that formed
from the raw material were not significantly different is thought to be
due to the fact that this material had a high pebble content, and did
not suffer from significant degradation.
In the case of the Suwannee River slurry carrier, it would appear
that there was considerable degradation during pumping in the
laboratory leading to a yield stress that was 10 times as great as that
obtained from the rheological tests on the slurry formed from the raw
material. From similar reasoning to that used above, it would appear
to be reasonable to assume that the rheology obtained for the slurry
formed from the raw material provides a good model for the pipelines in
the field.
So far as the plastic viscosity is concerned, there is
considerable scatter in the data, though the Noralyn and the Hookers
Prairie carriers appear to behave similarly, a constant of Ce = 150
appearing to give the best fit to the data. The Suwannee River carrier
follows the same trend as the yield stress in that higher viscosities
appear to be associated with the laboratory pipeline test data than
IV-32

with the slurry formed from the raw material. However the value of Ce
= 110, which is that obtained for the pipeline test compared with a
value of 50 obtained for the raw material slurry, appears to fit the
field data better, though this is as yet unexplained.
4. Size Analysis
Throughout the test program the materials were sized using
wet screens covering a size range of 75 < d < 12500 microns. Tests
were carried out on the material as received after being trucked from
Florida to Augusta and also after the material had been pumped through
the test loop during the tests. Sampling from the pipeline was
effected by means of tapping off the slurry from either a pipe of 2
inches or a pipe of 6 inches in diameter, located in the bottom of a
horizontal section of the main pipe.
In considering the results of the size analysis carried out at the
GIW Laboratory, it is important to note that both the trucking and the
sampling technique used during the pipeline tests have the effect of
biasing the measured size distribution in such a way that the fraction
of the larger material is greater than it should be. When the results
of the analysis are compared with the analysis carried out by H.H.
Lamb, the results of which are reported in the Geological Analysis of
Section III, it is found that the pebble sized fraction of the Noralyn
phosphate is of the order of 0.4, compared with a mean value of 0.55 as
measured at GIW. There is also a discrepancy in respect to the fines,
the Geological Analysis reporting a fines fraction of some 0.29
compared with a value of 0.19.
IV-33

The differences are considered to be due to the segregation of
fines to the bottom of the truck during trucking, this being
particularly so in the case of the high pebble Noralyn phosphate. It
is virtually impossible to remix such a large quantity and it is
suspected that the sample was taken from a volume of material close to
the surface. The problem of segregation is much less in the case of
the Suwannee River and the Hookers Prairie phosphates because of the
lower pebble contents. In fact, the mean values of the pebble fraction
are 0.011 and 0.136 for the Suwannee River and Hookers Prairie
materials, respectively. These values are to be compared with values
of 0.0186 and 0.136 given in the Geological Report.
The fines fractions obtained from the analysis at GIW give a mean
value of 0.07 with a standard deviation of 0.07 for the Suwannee River
phosphate and a mean value of 0.287 with a standard deviation of 0.042
for the Hookers Prairie material. The above mean values are to be
compared with values of 0.2146 and 0.26 given in the Geological Report.
While the Hookers Prairie fines fraction is in reasonable agreement the
large discrepancy in the case of the Suwannee River fines may be due to
sampling. It is interesting to note that there is a closer agreement
for the Suwannee River material when the sample is taken from the
pipeline, values of 0.0186 and 0.11 being obtained for the pebble and
fines, respectively. This is thought to be due to the homogenization
of the whole truck load coupled with the biasing towards the high end
of the size distribution due to sampling from the bottom of the pipe.
IV-34

MATERIAL
Noralyn* Pebble Noralyn Fines Suwannee River Pebble Suwannee River Fines Hookers Prairie Pebble Hookers Prairie Fines
SUMMARY OF MEAN VALUES OF PEBBLE AND FINES (Before Pumping)
GIW MEAN SDEV
0.547 0.067
0.19 0.07
0.0114 0.067
0.074 0.076
0.136 0.067
0.2865 0.042
Min.RES.ASS. MEAN
0.376
0.2886
0.0186
0.215
0.136
0.26
* Note. In view of the large discrepancy between the pebble fraction as measured by GJW and Mineral Resource Associates a mean value of 0.46 is used in the analysis of the data for the hydraulic transport.
Although the intention of measuring the size distribution,
following the pumping of the slurry through the pipe test loop, was to
assess the extent of degradation, in the event the sampling technique
caused a distortion of the size distribution such that in the case of
all the slurries tested the fraction of the pebble size increased and
the fines decreased. Since this is clearly not possible we have
regrettably to ignore these data.
In conclusion of this section, in which we have discussed the
pipeline tests in the laboratory and the field, the rheological tests
and the size analysis , we have been able to reconcile the differences
between the laboratory and field data and lay the foundations for the
development of a semi-empirical mechanistically based model. This
model is subsequently to form the basis for the algorithm for the
computer program.
IV-35

F. THEORETICAL CONSIDERATIONS AND ANALYSIS
Clearly, it is of practical importance to develop equations for
the relationship between the hydraulic gradient and the velocity in
order that the hydraulic gradient-velocity characteristic may be
predicted for any required concentration, pipe size and particle size
distribution. Such predictions are particularly important to the pump
designer for the selection of the most suitable pump for operation at a
point close to the high efficiency condition. It is important to the
operator also in that he benefits considerably in terms of reduced
energy consumption, a major consideration in the type of application
being considered. However, the equations developed from the data
obtained for the very specific type of material are likely to lack
generality since any constants obtained from the experimental data will
reflect the characteristics of the phosphate material and the carrier
fluid.
We need not be too concerned about this, provided that in carrying
out an analysis we base it on sound physical principles. By so doing
we are likely to obtain a form of equation that is generally applicable
and for which the constants that may have to be determined
experimentally will reflect the different behavior, if any, arising
from the transport of materials of differing origins, types and size
distributions. Furthermore, the equations developed in this way are
likely to give us some insight into the effect of scale, thus making it
possible to predict the flow characteristics in large pipes from
experiments carried out in smaller pipes.
Clift, et al (6) have extended the mechanistic sliding bed model,
that has been developed by Wilson (7) over the past 20 years, to the
IV-36

flow of slurries in which there is a sliding bed and a suspended
component contribution to the excess hydraulic gradient that occurs
when solids are added to a fluid such as water. However, they assume
that the two components are due to the sliding bed flow and the
homogeneous flow and assume further that the fraction of the total
solids that moves in the form of a sliding bed is related to the ratio
of the velocity required to suspend a solid, V,,, and the fluid
velocity, Vm. This approach has led to a relatively simple method of
scaling and appears to be particularly useful in cases where the spread
of sizes is not too great, and where any fines present do not form a
carrier fluid which is different from water.
Almost without exception settling slurry flows, of particle d >
lmm, have a sliding bed component especially in the operating region
which is normally close to the condition of the minimum hydraulic
gradient. In the suspended portion of the flow, by far the major
portion of the particles do not, except at high velocities far removed
from the operational region, flow homogeneously, i.e. in the form of a
sensibly constant continuum analogous to a liquid. Instead they flow
in a region in which there is a concentration gradient which decreases
from the upper region of the pipe to the surface of the sliding bed.
If this is so then there would appear to be merit in including the very
fine particles , which could conceivably behave in a pseudo homogeneous
way, with the non homogeneous suspended particles.
In cases where the finer particles, which at higher velocities,
(i.e. velocities greater than 10 ft/sec) flow in suspension above the
sliding bed, do not when combined with water form a fine slurry having
I V-37

properties different from water (e.g. form a Newtonian slurry of
density and viscosity higher than that of water), such a fine
particle-water suspended flow is characterized by slip between the
particles and the faster moving surrounding water. Duckworth and Addie
(8) have shown that this form of suspended flow produced an excess
gradient, (i ,-i,), component in addition to that produced by the
sliding bed, where this excess gradient component may be expressed by a
term,
We shall, however, see later that where the water carrier loses its
identity by combining with the fine particles and associated clay
particles to form a homogenous carrier, the approach discussed above is
inappropriate.
However, let us now turn to the major component of the excess
gradient, due to the sliding bed. Some 30 years ago Newitt et.al. (9)
developed an equation for the sliding bed region which showed that for
cases in which the whole of the material was in the bed, the excess
gradient was given by
IV-38

Subsequent work by Clift et.al. (lot tit), modified this equation
to take into account the fact that normally where there was a spread of
sizes some of the material would be in suspension and the remainder
would be in the sliding bed, such that
(jti:;>; constant(b) m
where
” “m/-j su = 8/X, Exp (45 d/D)
(4)
(5)
the term (VsU/Vm)M being a measure of the fraction of material in the
sliding bed. In this approach experiments have to be carried out to
determine, for a given slurry, the constant and the index m in equation
4.
From an analysis of the Noralyn (NP) slurry data the above
equation 4 has been found to reduce to
-w, = 0.11 (",,/",) l 57 (6)
In addressing the same problem, Duckworth et al (lot tit), have
been able to show that, provided the size distribution of the particles
is known, as in the case of the (NP), as shown in Figure 4, the
fraction of particles in the sliding bed may be expressed by
I v-39

0
R = C (vsu/vm?*7 AY (7)
d su
where Vsu is the suspension velocity, equation 5, of particles of size
d, having a proportion Ay of the assemblage of particles, and dSU is
the particle size at incipient suspension, (i.e. Vsu = Vm). For the
particular size distribution of Figure 4, the equation for (NP)
slurries, due to Duckworth et al, reduces to
i--l
i, i,
im--l = 0.18R + (l-R)(Vmh/Vm) (8)
Since R and Vcoh each depend upon the size distribution and
concentration, and R also depends on the pipe size and the \
concentration, and 0.18 is a constant, equation 7 suggests that it
should be possible to predict the excess pressure gradient from a
knowledge of the size distribution and the concentration for a range of
velocities, V,, and for pipes of arbitrary size.
Such predictions are compared with the measured values of im, for
the (NP), in a pipe of 18 inches in diameter, in Figure 15 and it is
evident that the predicted and measured values are in reasonable
agreement over the practical range of operational velocities of lo-20
ft/sec.
However, as has been pointed out already, the size distribution
avai lable to engineers in the phosphate industry, in terms of pebble,
feed and fines, is not sufficiently detailed for R of equation 7 to be
IV-40

determined, and on this basis the form of equation given in equation 6
would be the preferred form to be used in this work, if we were dealing
only with the (NP) type of material.
In fact, such is not the case, for we have to be able to deal with
a range of phosphate materials from very coarse, pebble fraction = 0.4,
to very fine, pebble fraction = 0.01. Furthermore, we must also be
able to deal with phosphate matrix materials with differing amounts of
fines present. During the latter stages of the project when the
Suwannee River (SRP) and the Hookers Prairie (HPP) slurries were
examined, it became clear, that while the form of equation 6 might be
appropriate for high pebble content (i.e. low feed and fines fraction),
an equation of general applicability would have to take account of the
rheology of the carrier liquid associated with each of the phosphate
materials, in addition to the pebble fraction and the slurry
concentration, C,. To meet these requirements, an equation, based upon
the form of equation 5, may be formulated as follows:-
where
(‘m - ica > = I.(s,/s,,,) -1-j c. v-”
im is the hydraulic gradient of the slurry
i ca is the hydraulic gradient of the carrier fluid
Sm is the SG of the slurry
S mea is the SG of the carrier fluid
'm is the velocity of the slurry
C is a constant
m is a constant power index.
(9)
IV-41

The hydraulic gradient of the carrier, ic,, will clearly depend
upon the rheological properties of the carrier fluid, these properties
depending upon the variable (Smca - l), as discussed in the section on
the experimental results in connection with the rheological tests.
Once the functional relationships between the rheological properties,
the yield stress, ~~ , and the plastic viscosity, n, and the variable
6 mea - 1) are known (i.e. the constants Cy and C, of equations I and 2
are known), then the experimental data obtained in the laboratory and
in the field may be used to determine the constant C and the index m.
In the Rheological Tests section of the Experimental Results the form
of the functional relationships for the rheological properties was
discussed and these relationships expressed in graphical form in
Figures 13 and 14 and in the generalized form of equations 1 and 2.
However, the derivation of yield stress, TV, and the plastic viscosity,
n, from the experimental data was deferred and we now consider this.
It will be recalled that the raw data obtained during the
rheological tests, and given in Appendix H of the report;consisted
primarily of values of the wall shear stress, 'I 0’
and the corresponding
pseudo shear rate, 8V/D. However, we are interested not in these
values per se, but in the rheological properties that can be derived
therefrom. For this purpose we use a modified form of the Buckingham
equation which applies in the region of high flow rates, thus,
f 0
= 4Ty/3 + (W/D)n
IV-42

From the experimental values of T o and (8V/D) it is clear that the
my and n may be calculated using equation 10, since when (8V/D) = 0,
Ty = (3/4) To and the slope of the curve T o versus (~v/D) gives US rl.
Values so calculated for a range of values of (Smca - 1) have thus been
used to plot the curves of Figures 13 and 14. If we use the power law
form of equation 1 and 2 given by,
TY = cy(SMca-l)N (1)
n = VW (C,(Smca-l~M + 9 (2)
we find that for the Noralyn and Hookers Prairie slurry carrier fluids,
C Y
= 30 (lbf/sq.ft), C, = 150, N = 3.70 and M = 2.2
whereas, for the Suwannee River carrier fluid,
C Y
= 1.5 (lbf/sq.ft), C, = 110, N = 3.70 and M = 2.2
Now while it was an easy matter to determine the value of the SG
of the carrier, S,,,, during the rheological tests, if we are to
determine Smca for the carrier that is formed during the transport of a
particular slurry in the pipeline then we need to develop relationships
from which this may be calculated. In order to be able to do this we
assume that the carrier is formed from the feed plus the fines and the
water in the slurry, the fraction of the feed plus the fines being
IV-43

equal to (1-P) where P is the pebble fraction. This assumption is
considered to be reasonable, since in the rheological tests, the
material used consisted of fines having a size, d < 600 microns, and
for the materials examined in the pipeline tests, for which d < 600
microns, the fraction is not significantly different from (l-P), the
greatest discrepancy being in the case of the Noralyn phosphate. In
the latter case, since P is relatively large, Smca tends to be small,
(S mea-l) tends to zero and it is apparent from equations 1 and 2 that
the errors in I
small. Y
and TJ due to the error in the fines fraction is also
Turning now to the relationship between S,,, and the pebble
fraction, P, and the concentration, C,, it can be shown that,
S mea = l/(1 - Cwca (Ss - l)/SJ
where
C wca = (l-P)(cw/(l-cw))/((l-P)(cw/(I-Cw) + I)
(11)
w
Ss being the SG of the phosphate material. We thus see that from a
knowledge of P, Cw and Ss, the carrier SG, Smca, may be determined and
hence the rheological properties can be determined for any of the three
phosphate matrix materials being conveyed in slurry from under
conditions of known pebble fraction and concentration.
We are now in a position to calculate the wall shear stress, f 0)
and hence the hydraulic gradient of the carrier, which for laminar flow
conditions may be obtained from the Buckingham equation,
IV-44

'lyD&V= a/[1 - 4a/3 + (x4/31
and
ica = 4 To/l.94 S,,,.gD
where
for turbulent flow,
i =x ca (.a V/g@
where,
(l/~c~') = 1.14 - 2 loglO [(E/D) + 21.25 Reca-O*g]
(E/D) being the pipe roughness ratio.
and the Reynolds number of the carrier, Re ca is given by
Reca = pw. S,,, V, D/O
the density of water, pw, being equal to 1.94 (slugs/cu.ft)
The demarcation between laminar and turbulent flow conditions is
governed by the equation,
(13)
(14)
(15)
(16)
(17)
IV-45

(1 + Ty D/6,Vc) = ReJ(9.12 - 16. logIO(JD + 21.25 Ret -'*'))2 (18)
where Vc is the critical velocity and the Reynolds number, Ret, is
given by
Ret = Pw’ ‘,(-a ‘cD/,
and Pw = 1.94 (slugs/cu.ft).
Equation 18 may be solved by trial and error to give V, and Ret
and hence we may select the appropriate equations to determine i,, for
either the laminar or turbulent region.
We finally use the above relationship for i,,, corresponding to
particular conditions of pebble fraction, P, concentration, Cw, and
pipe diameter, D, in conjunction with equation 9 and the experimental
data obtained during the pipeline tests, to determine the constant, C,
and the index m. Now since C and m determine the contribution to the
hydraulic gradient, i,, that is due to the pebble material, it is
appropriate that we should use the experimental data for the Noralyn
phosphate slurry, which has the highest pebble fraction, to determine C
and m.
When this is done for a slurry SG, S, = 1.452, a concentration, C,
= 50%, a pebble fraction, P = 0.46 and a pipe diameter of D = 17.25
(in), we find that C = 1.2 and m = 0.64 Thus, the final form of the
equation from which the hydraulic gradient i,, may be calculated is
given by,
IV-46

Equation 19 has been used to calculate the values of i for a m
range of velocities, for the three phosphate materials and for the
three pipe sizes at two concentrations to produce the sets of curves
given in Figures 16 to 24. The equation has also been used to
determine the yield stress and the plastic viscosity of the carrier
fluid in the pipeline tests for the Hookers Prairie and the Suwannee
River matrix materials. The values of the yield stress and the plast ic
viscosity so obtained have been plotted on Figure 13 and 14 together
with the values obtained for the rheological tests.
We thus see in conclusion to this section that the hydraulic
gradient, i,, for all of the phosphate materials examined, may be
predicted by the equation,
i, = ica + 1.2
where
'rn = [l-Cw(l-ss)/ssI-I
(19)
(20)
S mea = l/(1 - Cwca (ss - l)/SJ
C wca = (l-P)(cw/(l-cw~)/~~l-P~~cw/~l-cw~ + 1)
i ca = 4 =,/(1.94 Smca.gD)
=Y = Cy(SFlca-l)N
n =lJ c(s M+l w( e mea -1) 1
(11)
(12)
(14)
(1)
(2)
IV-47


For the Noralyn and the Hookers Prairie phosphate slurries,
cY = 30 (lbf/sq.ft), Ce = 150, N = 3.78 and M = 2.2
and for the Suwannee River slurries,
C Y
= 1.5 (lbf/sq.ft), C, = 110, N = 3.78 and M = 2.2
Additionally, in solving the equation 19 we need to know whether
the flow is laminar or turbulent and for this purpose we solve the
equation,
(1 + ~~ D/6nVc) = Ret/(9.12 - 16. loglO(E/D + 21.25 Ret -'*'))2 (18)
where Vc is the critical velocity and the Reynolds number, Ret, is
given by
Ret = Pw. Smca VcD/n (174
In cases where the velocity, V, is less than Vc the flow is
laminar and i,, is determined from equation 14 using a value of wall
shear stress, fO, calculated using the Buckingham equation, equation
13. For velocities greater than V, the flow is turbulent and i,, is
obtained from equation 14 using a value of the wall shear stress, fO,
determined from,
T = A 0 ca 'w Smcavm2'8
IV-57
(21)

The above equations are the ones used to determine the variation
of the hydraulic gradient, im, with the velocity of the slurry, Vm, for
the various types of phosphate likely to be encountered in the
phosphate industry of Florida, and accordingly the equations form a
part of the computer program that has been developed from this work.
Whether or not a particular phosphate matrix behaves as a Suwannee
River slurry is considered to be governed by the fines content, as
defined by the industry's mineralogists in Section III of this report.
Whence, for a fines content less than 20% the flow behavior of a slurry
is considered to be similar to that of the Suwannee River slurry when
operating under the same conditions of pebble content, P,
concentration, Cw, and flow velocity. On the other hand, for a fines
content greater than 20% the slurry is considered to behave as the
Hookers Prairie and the Noralyn slurries operating under the same
conditions. We thus see that the flow characteristics of all phosphate
slurries can be catered for by one main equation, equation 19, a
knowledge of the fines content which governs the hydraulic gradient of
the carrier fluid, the pebble fraction, concentration and pipe size.
The computer program is so arranged that it asks for this information
and solves for the hydraulic gradient-velocity characteristic
accordingly.
IV-58

F. SAFE CONVEYING VELOCITIES
The conveying velocity, below which it is unsafe to operate, is of
particular importance for the conveyance of coarse particles (i.e.
pebble material) in water or in a non-Newtonian carrier fluids having
low yield stresses and low plastic viscosities. In the case of the
phosphate slurries this fact is well illustrated by the Noralyn type of
phosphate material which has a high pebble content, P, (i.e. P > 0.4).
In such cases, the hydraulic gradient-velocity characteristic curves,
shown in Figures 6, 7 and 8, exhibit a minimum hydraulic gradient.
This minimum is associated with the dominance of the sliding bed mode
of transport and the onset of unstable flow conditions. Although the
velocity corresponding to the minimum hydraulic gradient, often
referred to as the minimum transport velocity, is a desirable operating
velocity from the point of view of power consumption, it is often also
close to the deposition velocity Vs, at which the deposition of
particles begins.
Now while the flow tends to be unstable in the region of the
minimum transport velocity condition, due to incipient deposition, the
instabilities can be exacerbated by the interaction of the system
resistance and the pump characteristics. In order to understand this,
let us imagine that there is a perturbation in the flow, arising for
example from an increased throughput; then such a change causes the
higher head demand on the pump to increase and the flow velocity to
decrease to accommodate the increase in head. The flow is now in the
unstable deposition region and depending upon the resistance and pump
characteristics the flow may or may not stabilize. If the system does
not stabilize then it is highly probable that there will be a blockage.
IV-59

The danger of unstable operation and blockage due to the
deposition of particles when the velocity of operation is equal to or
less than the minimum transport velocity thus leads us to operate at
velocities some lo-20% greater than this velocity.
Now although the minimum transport velocity may be obtained from
the plots of hydraulic gradient versus the slurry velocity, it is
practically more useful to be able to predict this minimum velocity by
calculation and we now consider the equations which may be used for
this purpose.
In order to obtain the equations for the minimum velocity we
differentiate the hydraulic gradient, i,, given by equation 19
. 'm
= - lea + 1.2 ((Sm/Smca) -1)v;0'64 (19)
with respect to the slurry velocity, V,, and equate this differential
to zero. Solutions will be considered for both the turbulent and the
laminar flow regimes though the turbulent flow solution is the one of
most practical use and we consider this solution first.
1. Turbulent Flow Solution
We first substitute for i,, in equation 19 using equation 15
and thus obtain,
i m = AcaVm2/2gd +1.2[(Sm/Smca)-13 V-o*64 (22)
and assuming to a first approximation that Xca is constant we may
express equation 22 in the form,
IV-60

. 'm
2 = cp, + c* vm -,64
where
(22a)
5 = hca/2gD and C2 = 1.20(Sm/Smca)-1)
Differentiating equation 22a with respect to V, gives,
dim/dV, = 2ClV, - 0.64C2VmL'64
and equating dim/dVm to zero and letting V, = Vmin' we have
V min = (0.32 C2/C1)o*379 (23)
In solving this equation we assume first of all that Vmin = 15ft/s and
use equation 16 to calculate Aca. We may now calculate V min which we
then compare with the assumed value of 15 ft/s. If the Vmin values do
not agree we repeat the procedure until the assumed value of Vmin and
the value calculated by equation 23 are in agreement. Such an
iterative procedure has been built into the computer program.
2. Laminar Flow
If the minimum transport velocity, Vmin, should occur when
the flow is laminar, an improbable situation of largely academic
interest due to the strong possibility that the coarse pebble fraction
will have settled to form a stationary bed, then we use equation 22,
but replace equation 16 by the equation,
h ca
= 64/Reca (24)
IV-61

where
and
Reca =ps w mca'"mD"pp
'IPP = n[(TyD/6nv)+l]
substituting for hca in equation 22 leads to
i -.64
m = c3 + c4 v, + cp,
where
c3 = I6 ~~13~~ S,,, go, C4 = 32/pw S,,, gD2
differentiating and equating to zero leads to,
V min = (0.64 C2/C4)1/1.64
(25)
(26)
(22b)
(27)
Clearly, Vmin is only given by equation 23 if Vmin is greater than
the critical velocity, Vc, and is only given by equation 27 if Vmin is
less than Vc.
G. THE VELOCITY OF STATIONARY DEPOSITION
Although the recommended operating velocity has been discussed on
the basis of the stability to be achieved by operating at some lo-20%
above the minimum transport velocity, it is important to determine also
the slurry velocity at which we may expect the particles to come to
rest.
The equations that govern this have been developed by Wilson
(7,lO) and the results of his work are now used to determine the
IV-62

deposition velocity, Vs. For this purpose we use the nomograph given in
Figure 25, which gives us, for a known pipe diameter and particle size,
the maximum value of the deposition velocity, V,,, this maximum
occurring at relatively low concentrations. Once having determined Vsm
we apply a correction for concentration and finally obtain the actual
value of V, for a particular concentration.
The correction to be applied is quite complicated and in order to
determine the correction we make use of another nomograph, given in
Figure 26. Before we can use the latter nomograph however, the
delivered volumetric concentration ratio, Cr, where Cr is given by,
Cr = Cvd/Cb (28)
where C,d and Cb are the delivered and bed volumetric concentrations
respectively, and the maximum value of this ratio, Crm, is given by,
Crm = 0.16 D d-*84 (2%
where D is in meters and d is in mm.
In order to determine the deposit velocity, V,, corresponding to a
given concentration we use an equation of the form,
vs'vsm = P, (Cr, Crm) (30)
where, because of the complexity of the function P, we solve the
equation by means of the nomograph of Figure 26.
IV-63


We now use the two nomographs of Figures 25 and 26 to determine
the deposit velocities for pipes of 16, 18 and 20 inches in nominal
diameter, selecting for this purpose the particle size which has the
greatest settling velocity for given conditions, which is of the order
of lmm. It can be seen from Figure 25 that the values of V,, are 14,
15 and 16ft/s for pipes of 16, 18 and 20 inches in diameter,
respectively.
To determine the actual deposition velocity at a concentration of
50% by weight, (27.4% by volume), we first assume that the volumetric
concentration of a loosely packed bed is 60% and use this to calculate
Cr, thus from equation 28,
Cr = 0.274/0.6
= 0.456
Now from equation 29 for the three pipes using a particle size of
1 mm we find that the value of Crm varies between 0.109 for the pipe of
16 inches in diameter to a value of 0.12 for a pipe of 20 inches in
diameter. By using a value of 0.456 for Cr and the values of Crm we
obtain a value of V,/V,, of 0.5, and thus the deposition velocities for
the three pipes are 7, 7.5 and 8 ft/s for the pipes of 16, 18 and 20
inches in diameter.
We thus see that the deposition velocity is, for all pipe sizes,
and for a concentration by weight of 50%, less than the recommended
operating velocity of lZft/s. It should be noted however, that the
theoretical analysis that has been used is based upon the assumption
that the coarse particles d > 1.2mm are conveyed in a carrier fluid
IV-66

that is water and not the Bingham Plastic carrier of this work. In the
absence of information on the influence of a Bingham Plastic carrier it
is considered that the deposition velocities will in fact be less than
the above values in cases where the pebble fraction is less than 0.2.
This appears to be largely in agreement with the experimental studies
of this work which has shown that there is no significant drop in the
slurry density, which would occur if there were deposition, until the
velocities had fallen to about 5ft/s.
In the foregoing discussion it has been shown that for the worst
case, i.e., particles of the order of 1 mm, where it is assumed that
water is used as the carrier fluid, the pebble content is high, P >
0.2, and the concentration, C,, is equal to 50% , we may expect
deposition velocities of about 8ft/s. Emphasis has been placed upon the
concentrations because of the cost effectiveness of operating at high
concentrations due to the low specific energies (note the exception in
the case of HPP slurries which show a disproportionate increase in the
hydraulic gradient for concentrations above about 40%). If for some
reason it becomes necessary to operate at low concentrations the
deposition velocities tend towards the Vsm values and (therefore in
such cases) it may be necessary to operate at velocities of the order
of 16-17ft/s.
3. Illustrative Example
In order to illustrate the solution of the several equations
developed in this section of the report the following example has been
worked out by means of a computer program, the listing and computer
ion. solution being given in Append ix A of this sect
IV-67

A phosphate material, which is considered to have a fines content
of 28%, has a pebble fraction of 0.4 and the SG of the material is
2.65. It is required that this material should be pumped in the form
of a water-phosphate slurry at a concentration of 40% by weight in a
pipe of nominal diameter, 16 inches and internal diameter of 15.25
inches. If the pipe roughness is 0.00005 inches, determine the
hydraulic gradient velocity characteristic for both the laminar and
turbulent flow zones, the critical velocity and the minimum transport
velocity. A graphical illustration of this computer prediction of the
hydraulic gradient-velocity characteristic for a Noralyn type phosphate
slurry is given in Figure 27.
H. CONCLUSION
Three different types of phosphate matrix material have been
examined experimentally in the GIW Hydraulics Laboratory and in the
field operations of IMC Fertilizer, Occidental Chemical and W. R. Grace
Companies. A considerable amount of information of practical importance
has been acquired and analyzed.
As one of its prime objectives the study set out to develop
algorithms and their associated computer programs for the design of
pipeline systems for the phosphate industry of Florida. It was
intended that the analysis and the computer programs which arose from
it would provide for a generalized solution of the problem which
required no further input than that which was readily available to the
industry by way of mineralogical surveys and knowledge concerning
quantities of associated clays with the ore body.
IV-68


In order to achieve this generality three types of material were
selected, and it appears from the results of the work that the
variation in the behavior of the slurries formed from the materials has
covered a spectrum which has enabled a generalized treatment to be
formulated.
The work has indicated quite clearly that the system resistance
may be predicted from the equations developed from an a priori
knowledge of the pebble fraction, the fines content and the specified
concentration. The basic equation for this purpose has been developed
from the experimental findings of this work and from the previous
experience of the GIW Company. In particular, the equation uses two
main concepts to arrive at a generalized form,
(i) at high pebble fractions the equation should take the
form of a sliding bed model in which the pebble fraction
is of prime importance, particularly in the operating region.
(ii) at low pebble fractions the equation should take the
form of a non-Newtonian carrier fluid in which the
rheological properties of the carrier fluid are of prime
importance, these properties being uniquely related to the
concentration of the slurry formed from the feed plus the
fines material.
Thus, the resulting equation takes the following simplified form,
Cm - i,, )/uSm/Smcabl) = c v-m where
IV-70

im is the hydraulic gradient of the slurry
ica is the hydraulic gradient of the carrier
Sm is the S.G. of the slurry
S mea is the S.G. of the carrier
C is a constant equal to 1.2
Vm is the velocity of the slurry
m is a constant equal to 0.64
The hydraulic gradient of the carrier fluid may be determined from
the Buckingham equation for laminar flow, equation 16 for turbulent
flow and a knowledge of the rheological properties of the carrier,
which are related by power laws to the carrier density, this in turn
being related to the pebble fraction and the slurry concentration, C,.
Clearly, the above equation enables the hydraulic gradient for a
given pipe diameter to be determined for a given velocity, provided
that the pebble fraction, P, the concentration, C,, and the constants
and the indices for the power laws governing the rheological properties
are known. The computer model that has been prepared is so designed
that for an input of pebble fraction, P, concentration, C,, pipe
diameter and flow rate the hydraulic gradient may be determined for a
single flow or for a range of flows, the solution for a range of flows
giving the resistance characteristic of the system.
The significantly different behavior of low fines (< 20%)
slurries, compared with the other phosphate slurries examined, has been
taken into account as noted earlier by altering the plastic viscosity
and yield stress to reflect the results using 20% as the changeover
point.
IV-71

In practice, phosphate matrix will vary from mine to mine and
location to location and wi 11 not necessarily ref lect exactly any of
the three slurries tested.
For this reason we have added two additional correction factors, a
feed size multiplier and a viscosity correction factor for the purposes
of fine tuning and adjusting the correlation on the basis of field
experience and/or other information.
The feed size multiplier is normally unity, and is a simple
multiplier factor of the non-carrier particle friction component of the
head loss in equation 19.
The viscosity correction factor concerns itself with the carrier
component of equation 19 being normally unity again and being applied
as a direct multiplier to the plastic viscosity in the calculation of
eta in equation 2.
A chart, Figure 28, showing the multiplier and correction factor
values for optimum correlation fit of the data for the three tested
slurry types in the three pipe sizes at concentrations of 30 and 50% by
weight is included. This chart also includes comments on the effect of
the multiplier as a guide to their use.
Turning next to the minimum transport velocity, Vmin, equations
have been developed for the calculation of this velocity, and the
algorithm for the practically important turbulent flow solution is
included in the computer program. In the case of materials having a
high pebble content, the minimum transport velocity occurs at
relatively high velocities of the order of 10 f-t/s and in such cases
the minimum operating velocity should be some 10-20X greater than the
minimum transport velocity corresponding to the minimum hydraulic
IV-72


gradient condition. Instabilities associated with the deposition of
coarse particles and the interaction of the pump and the system
characteristics are avoided by selecting the operating velocity in this
way. However, in the case of the slurries of low pebble content the
minimum hydraulic gradient occurs at relatively low velocities, well
below the practical operating velocities.
The experimental data obtained during the field trials have, in
the case of the Noralyn slurries, been found to be in substantial
agreement with the corresponding values obtained during the laboratory
test program. The fluctuation in the specific gravity of the slurries
tested in the field and which arose because of the non-steady state
conditions associated with feeding and the variability of the inventory
constituted the main difference between the field and the laboratory
trials. System design should take into account this variability of the
specific gravity and design for the maximum value of the slurry
specific gravity.
The field hydraulic gradients for both the Suwannee River and
Hookers Prairie slurries are substantially less than the corresponding
values measured in the laboratory and this has been shown to be due to
the degradation of the material caused by circulation through the
pipeline and the pump. It is also worthy of note that the higher
initial fines content of the Hookers Prairie phosphate and possibly its
greater pumpability caused a very large increase in the hydraulic
gradient caused by circulation in the test loop. In the latter case,
the hydraulic gradient was twice that of the field trial data under
corresponding conditions of flow and concentration. Nevertheless, by
carrying out careful rheological studies and analysis of the pipeline
IV-74

data obtained in both the laboratory and the field, equations have been
developed which enable the data to be predicted which is in reasonably
close agreement with the field data in the case of all three of the
phosphates examined.
Finally, it is considered that the broad objective of the project,
which was to provide, through experiment and analysis, a methodology
for pipeline system design that would be sufficiently general to be
applicable to the phosphate industry of Florida as a whole, has been
achieved. Only time will tell whether this assessment is correct, when
the industry has had an opportunity of testing the results of the work
in the field. It is of course difficult to generalize from a small
sample, though it is believed that the difficulty can be reduced by a
careful choice of the test samples. In this work the selection of
materials for the test program, which were thought to fall into the
categories which were difficult, less difficult and easy to pump, have
been found to behave substantially in this way. It has therefore been
possible to develop equations which are expected to cover the majority
of types of material that occur. From discussions with engineers and
others with experience in the industry, and from the range of pebble,
feed and fines experienced in the Florida ore bodies, coupled with the
results of this work, we are reasonably confident that the algorithms
developed and their incorporation in the computer program will provide
the phosphate industry with a tool of immense practical importance.
The programs developed will no doubt need to be refined from time to
time as a result of the experience gained through their use in the
field and through a continuation of the close association of FIPR and
the industry with GIW.
IV-75

TABLE I
Test results obtained during the transport of a phosphate
matrix material at a concentration of 35% in a pipe of
17.25 (in) internal diameter.
IV-76

REFERENCES
1.
2.
3.
4.
5.
6.
7.
8.
9.
10.
Duckworth, R. A., Addie, G. R. and Maffett, J. R., "Mine WasteDisposal by Pipeline using a Fine Slurry Carrier", Proc. 11thIntl. Conference on Slurry Technology, STA, March, 1986.
Duckworth, R. A., Pullum, L., Addie, G. R. and Lockyear, C. F.,"The Pipeline Transport of Coarse Materials in a non-NewtonianCarrier Fluid", 10th Intl. Conf. Hydraulic Transport of Solids inPipes", BHRA Fluid Eng., Innsbruck, Austria, October, 1986
Durand, R., Proc. Colloquium on Hydraulic Transport, National CoalBoard, U.K. November, 1982.
Roco, M. C., Marsh, M., Addie, G. R. and Maffett, J. R., Journalof Pipelines, 5(1986, pp. 171-180).
Jain, A.K., "Accurate Explicit Equation for the Friction Factor",Technical Notes, Journal Hydraulics Division, Proceedings ASCE,Vol. 102, No.Hy. 5, May, 1976.
Clift, R., Wilson, K. C., Addie, G. R. and Carstens, M. R., "AMechanistically Based Method for Scaling Pipeline Tests forSettling Slurries", Paper B1, Proc. 8th Intl. Conf. on Transportof Solids in Pipes, BHRA Fluid Eng., August, 1982.
Wilson, K. C., "A Unified Physically-Bases Analysis of SolidLiquid Flow", Proc. 4th Intl. Conf. on the Hydraulic Transport ofSolids in Pipes, pp. Al-1-16, BHRA, 1976.
Duckworth, R. A., Addie, G. R. and Maffett, J. R., "Full ScaleExperimental Study of the Pipeline Transport of Phosphate MatrixSlurries", 11th Intl. Conf. on The Hydraulic Transport of Solidsin Pipes, BHRA Fluid Eng., October, 1988.
Newitt, D. M., Richardson, J. F., Abbott, M. and Turtle, R. B.,Trans. I. Chem. E., Vol. 33, No. 2, London, 1955.
Wilson, K. C., Paper Al Intl. Conf. The Hydraulic Transport ofSolids in Pipes, BHRA, Fluid Eng., Cranfield, 1979.
IV-77

V. FIELD TEST
Part of the FIPR Contract called for field tests at each of the
three mines to verify the results obtained in the GIW Hydraulic
Laboratory tests. The original plan was to simply carry some pressure
gauges to the field and to measure the pipeline pressures at two points
to obtain the pressure drop, to measure the suction and discharge
pressures to obtain pump head and to rely on the field instrumentation
for flow, density, and pump power. This was later determined to be
unacceptable to provide an accurate verification.
To achieve the reliability needed for the measurements GIW decided
to build a portable field test unit complete with computer, data
acquisition system, instrumentation and transducers capable of
measuring flow, density, differential pressures, and kilowatts. This
was set up in a 5'x8' utility trailer complete with air conditioning
unit. The trailer could then be towed to the field test site, set up,
and
grav
left for the duration of the test.
GIW also constructed an 18" diameter, 30' tall vertical specific
ity loop complete with magnetic flowmeter and calibrated bend
flowmeter. The SG loop shown in Figure V-2 consists of a U-loop with
the pressure differential measured between two points in the upward
flowing leg and also between two points in the downward flowing leg.
The device, first proposed and patented by Hagler(1956) is analyzed in
a brief communication by Clift and Clift (1981) included in Appendix F.
The layout for the field test setup is included in Figure V-l.
V-l


The pumping station was chosen by the mine personnel to give the best
accessibility, ease of installation of the SG loop and other
instrumentation, and a straight and level pipe run on the pump suction
side for the friction head loss measurement section. The SG loop was
installed by the mine maintenance personnel with the necessary reducers
and adapters to fit the mine piping. The SG loop was located in the
pipeline on the suction side of the pump and a minimum of 30' upstream
of the pump fittings. This allowed for a minimum of 30' of straight
uniform pipe as an entrance section before the suction tap. The
magnetic flowmeter was located in the upward flowing leg of the SG loop
and while there were two bend meters available, the bend in the
downward flowing leg was used for all the field tests.
The friction head loss measurement section was located upstream of
the SG loop. A distance of at least 15' was left between the end of
the head loss section and the SG loop to eliminate any exit effects. A
distance of at least 150' of straight uniform level pipe was provided
upstream of the head loss section to insure uniform entrance
conditions. In reality there were actually several thousand feet of
essentially straight pipe upstream at all the mines. The distance
between the head loss pressure taps was 300'. On some of the tests an
extra set of taps 100' apart was installed inside the 300' length as a
backup set for additional verification of data.
Suction and discharge taps were installed in the straight pipe
sections before and after the pump. All of the pump's associated
fittings, reducers, elbows, flexible joints and couplings, etc. were
included between the suction and discharge taps. The associated losses
V-4

through these fittings were therefore included with the pump losses and
charged against the pump's efficiency. To obtain the true pump head
and efficiency these fitting losses should be estimated and added back
to the pump head. In addition to transducers measuring suction and
discharge pressure, a differential pressure transducer was connected
between them giving two different means of determining pump head.
The piezometer taps for the suction, discharge and head loss
section were installed by the mine maintenance personnel according to
Figure V-3. Two taps were installed at each location with transducers
connected to both to provide duplicate or backup readings. The taps
were located at 45' above the horizontal centerline on each side of the
pipe. A l/4" NPT pipe coupling was welded onto the pipe then a l/4"
diameter hole drilled through the pipe and deburred. A collection pot,
4 inches in diameter and 1 foot tall with bleeds at the top and bottom
was closely connected to the taps with clear flexible nylon tubing.
The pots were then connected to the pressure transducers located in the
field test trailer using the same nylon tubing. A high pressure purge
water supply connected to the pump gland water supply was used to fill
the transducer lines and pots with clear water. Any slurry that
migrated from the pipeline into the transducer lines during the tests
was intermittently forced back into the pipeline using this purge water
supply. It was also used to remove and eliminate any blockages of the
piezometer taps. The collection pots were used to trap and remove any
slurry that migrated from the pipeline before it could reach the
transducer lines thus, eliminating any height correction errors. Solid
particles settle to the bottom of the pot where they can be bled off,
V-5


and likewise air bubbles rise to the top where they are bled off also.
A transducer type kilowatt meter was also part of the field test
unit. Potential transformers (PT's) with a 4O:l ratio and current
transformers (CT's) with a 400:5 ratio were supplied by GIW and
connected into the 4160 volt motor supply. The secondaries were then
connected to the 100 volt 5 amp Rochester Instrument Systems PCE-20
Watt Transducer located in the field test trailer according to the
wiring diagram in Figure V-4. The CT's and PT's were installed in the
motor control box on the motor line after all the resistors,
capacitors, starter, and other switch gear. This eliminated the
inefficiencies of the starter and controller so that only the motor
efficiency had to be considered when calculating the horsepower.
The field test trailer was located in close proximity between the
control box and the SG loop to minimize the lengths of cabling for the
magnetic flowmeter and kilowatt meter as well as the connecting tubing
for the pressure transducers. AC power for the computer and instrument
power supplies was taken directly from the control box. An isolation
transformer type filter was available in the trailer but found to be
unnecessary for the tests.
The instrumentation was completely assembled and installed in the
trailer at the GIW Hydraulic Laboratory. The pressure transducers were
calibrated against the three lab standards, a 20 foot water column, an
inclined mercury manometer and a dead weight tester. The magnetic
flowmeter totalizer was checked against a secondary calibrator in the
lab and before each test in the field. The SG loop was installed in
the lab pipeline complete with the magnetic flowmeter. The pressure
V-7


transducers were also connected in duplicate with the lab instruments
as was the kilowatt meter. A complete calibration reference comparison
test was run using the field test equipment and the lab test equipment
simultaneously to compare the flow, density, power and all pressure
measurements. This not only verified the instrument calibrations but
also the computer software and data acquisition system prior to
shipment to the field.
The instrumentation along with each's usage, description, range
and units of calibration, calibration reference, and coefficients is
included in Table V-l. Each of the instruments has a 4-20 milliamp
output which is converted through a 200 ohm, 0.01% precision resistor
to a O-4 volt signal. The 13 bit accuracy analog to digital (A/D)
conversion unit converts this voltage to a digital reading with 8191
digits = 4 volts = 20 ma. The A/D is setup to read 11 channels at a
rate of seven readings per second. The channels are scanned a number
of times and then the digital readings averaged for each channel. The
number of readings averaged for each point is controlled and set by the
operator on the computer console. The averaging period can be
lengthened to eliminate fluctuations and increase the stability of the
data or it can be shortened to look at the instantaneous readings and
study the actual fluctuations. During the FIPR field tests, either 5,
10 or 20 readings were averaged.
Once the digital readings are averaged, the quadratic calibration
coefficients are applied to convert the reading into selected
engineering units. The FORTRAN computer program then makes all
necessary calculations to come up with the displayed results. During
V-9


the FIPR tests, a new data point was displayed and printed
approximately l-5 times per minute depending on the number of readings
being averaged.
A sample copy of the output for the field tests is included in
Table V-2. The full results are too voluminous for this report and are
kept on file at GIW. The header for the output which applies to the
first line of the output for each point is self explanatory. The
second line for each point is the averaged digital reading for each of
the 11 channels, and the third line is the converted readings in the
units of calibration for each instrument.
Photographs of the instruments, the field test trailer, the setup
in the lab, and the layout at each of the mines are included in the
Photograph Section of this report.
GIW would like to thank each of the companies for their
participation in this project. We would especially like to thank the
maintenance and operating personnel at IMC Noralyn, Occidental Suwannee
River, and W. R. Grace Hookers Prairie for their help and cooperation
in executing these field tests.
A. IMC NORALYN FIELD TESTS
During the period May 25-27, 1988 field tests were run at the IMC
Noralyn Mine. The SG loop and other instrumentation were set up at the
Number 5 lift pump in the 1250W pumping system. Mr. Ron Hartung of IMC
coordinated the installation of the SG loop prior to the arrival of GIW
personnel and provided IMC maintenance personnel and equipment required
V-11


to set up the instrumentation and equipment. The first day was spent
setting up the instrumentation for the tests. John Maffett supervised
the setup and testing for GIW. Additional GIW personnel assisting with
the tests included Messers Graeme Addie, C.W. (Bucky) Bell, Roy Duvall,
Todd Pike and William Windisman. Mr. Henry Lamb provided assistance
with sampling and evaluating the matrix being pumped. Messieurs Robert
Akins and Don McFarlane witnessed part of the testing for FIPR.
The layout of the 125OW pumping system is shown in Figure V-5.
The GIW 18xl8WSO44 pump at the Number 5 lift pump station has
associated fittings shown in Figure V-6. The elevation levels of the
pressure taps is shown in Figure V-7. A height correction of 1.6 feet
was included in the test program to account for the difference between
the suction and discharge taps and give the correct total dynamic head
produced by the pump. The difference in the head loss taps was ignored
in this case since the worst case error was only 0.03 feet per 100
feet. Photographs of the IMC layout are included in the Photograph
Section.
The GIW 18xl8WSO44 pump with AH/4RV hydraulics was direct
connected to a 4160 volt, 1500 hp, 590 rpm constant speed motor. A
motor efficiency of 95% was used to calculate the brake horsepower from
the measured kilowatts and eventually determine the efficiency of the
pump. A water performance curve for the pump is included in Figure
V-8.
The preparations were completed and actual testing commenced at
14:59 on Thursday, May 26, 1988. After running 15 minutes the testing
was halted to rearrange some of the instrumentation. The pipeline
V-13


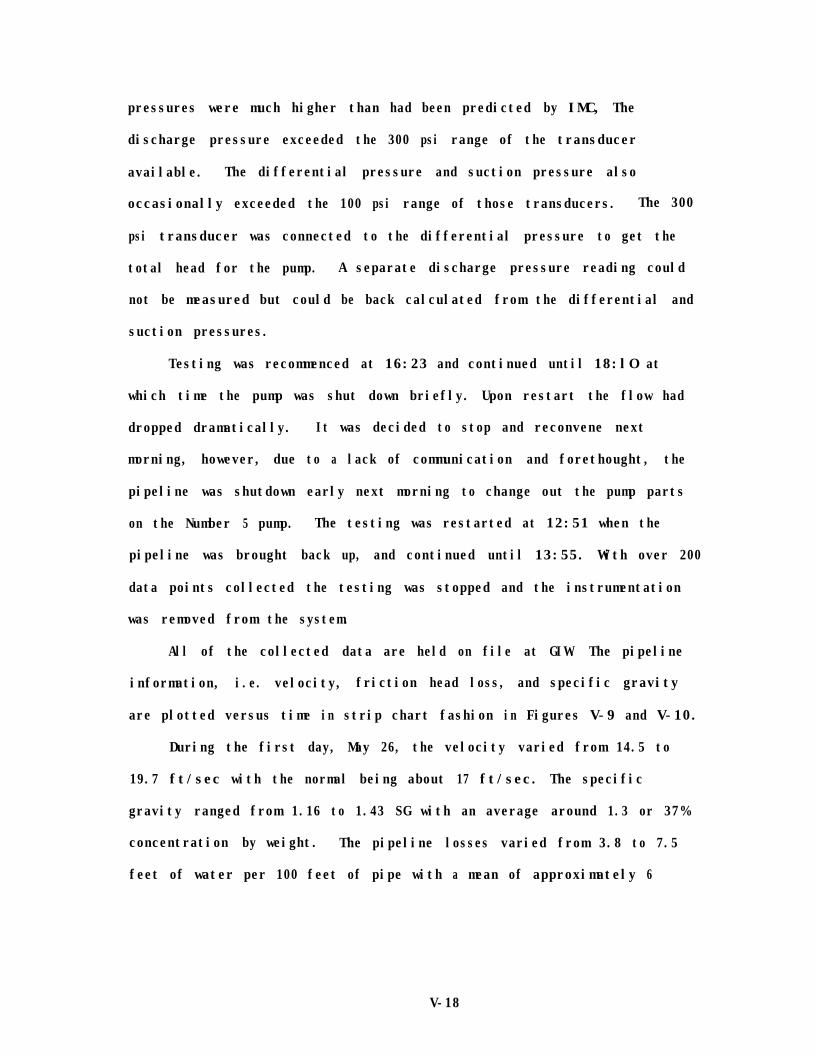
pressures were much higher than had been predicted by IMC, The
discharge pressure exceeded the 300 psi range of the transducer
available. The differential pressure and suction pressure also
occasionally exceeded the 100 psi range of those transducers. The 300
psi transducer was connected to the differential pressure to get the
total head for the pump. A separate discharge pressure reading could
not be measured but could be back calculated from the differential and
suction pressures.
Testing was recommenced at 16:23 and continued until 18:lO at
which time the pump was shut down briefly. Upon restart the flow had
dropped dramatically. It was decided to stop and reconvene next
morning, however, due to a lack of communication and forethought, the
pipeline was shutdown early next morning to change out the pump parts
on the Number 5 pump. The testing was restarted at 12:51 when the
pipeline was brought back up, and continued until 13:55. With over 200
data points collected the testing was stopped and the instrumentation
was removed from the system.
All of the collected data are held on file at GIW. The pipeline
information, i.e. velocity, friction head loss, and specific gravity
are plotted versus time in strip chart fashion in Figures V-9 and V-10.
During the first day, May 26, the velocity varied from 14.5 to
19.7 ft/sec with the normal being about 17 ft/sec. The specific
gravity ranged from 1.16 to 1.43 SG with an average around 1.3 or 37%
concentration by weight. The pipeline losses varied from 3.8 to 7.5
feet of water per 100 feet of pipe with a mean of approximately 6
V-18


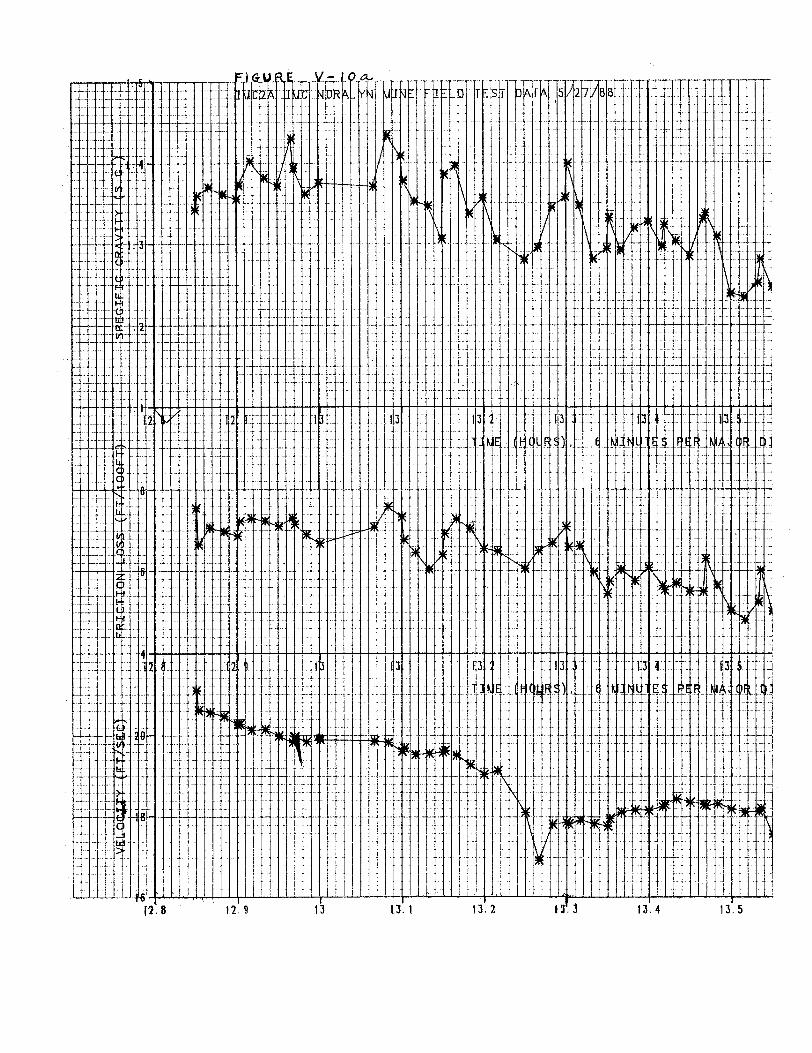


ft/100 ft.
The ranges on the second day of testing, May 27, were velocity
16.0 - 20.6 ft/sec, SG 1.2 - 1.43, and head loss 4.8 - 7.6 ft/l00ft.
While exhibiting some scatter, the data seemed to indicate periods of
stability at different operating conditions. Some of these rough
averages are listed below:
Table V-3
One observation noted is that the head loss seemed to be affected
much more by concentration than by velocity. Changes in specific
gravity of 0.1 SG showed immediate changes of 1.0 to 1.5 ft/l00 ft in
head loss whereas shifts in velocity of 1 to 2 ft/sec often showed no
appreciable change in head loss.
B. OCCIDENTAL FIELD TESTS
During the period June 15-17, 1988 the instrumentation was set up
for the FIPR field tests at Occidental's Suwannee River Mine. The
tests were then run on June 22-23, 1988. Mr. Eric Norman of OXY
coordinated
V-21

the installation of the field test equipment at the #3 Booster Pump in
the #l Pumping System at the Suwannee River Mine. Mr. Bob Fisch also
provided assistance with organizing OXY maintenance personnel and
equipment to install the SG loop and other instrumentation. GIW
personnel included Messrs. C. W. (Bucky) Bell, Roy Duvall, John
Maffett, Coleman Newman, Todd Pike and Wayne Pryor. The set up for the
testing was completed on Thursday, June 16, 1988, during a scheduled
shutdown of the OXY #l pumping system. The testing was originally
scheduled to coincide with the restart on Friday; however, delays in
repair of the dragline postponed the testing. The dragline was brought
back on-line on Tuesday, June 21, 1 988 and GIW arrived on Wednesday to
start the testing. John Maffett supervised the testing for GIW and
Todd Pike provided the computer expertise. Mr. Henry Lamb collected
samples from the pit for sieve analysis and evaluation.
The layout of the OXY #l pumping system is shown in Figure V-11
The GIW 16xl8WS040 pump at the #3 booster station is shown in Figure
V-12 with all fittings and associated piping. The elevation levels of
the pressure taps are included in Figure V-13. A height correction of
1.2 feet was applied for the total dynamic head calculation. The
elevation difference in the head loss length was insignificant.
Photographs of the OXY set up are included in the Photography Section
of this report.
The GIW 16xl8WS040 pump had A/4RV hydraulics and a 39" diameter
impeller. Figure V-14 shows the water performance characteristic curve
for the pump. The pump was powered by a directly connected Toshiba
4160 volt, 1250 hp wound rotor motor. A five stage set point
V-22


controller was used to vary the speed of the motor and pump. At full
speed, fifth stage, the motor and pump operated at 592-593 rpm and a
95% motor efficiency was used to calculate brake horsepower and pump
efficiency. The pump was occasionally operated at reduced speeds and
the motor efficiency should have been much lower. At reduced speed the
erroneously high motor efficiency caused the brake horsepower to be
calculated erroneously high and therefore the pump efficiency to be
calculated erroneously low. Reduced speed points should not be
considered when evaluating pump horsepower and efficiency. The fourth
stage speed varied from 555-562 rpm and third stage was measured from
492-509 rpm depending on the load. First and second stage runs
occurred only for short duration at startup and shutdown and no speed
measurements were obtained.
The actual data collection began at 16:23 June 22, 1988. The pump
was shut down at 16:43 and testing halted until it was restarted at
16:56. The pump was shut down again at 18:04 and testing was halted
for the day. The dragline stripped overburden and prepared a full
'face' for testing to resume next morning. Data collection began at
8:40 June 23, 1988 when the pit pump was started and flow was first
noticed on the instrumentation. Water only was being pumped through
the pipeline and lift pump #3 was still off. It was noted on the
printout as the pump started, staged, then stopped and restarted as the
line was being loaded. The first solids reached our station at 9:03
and operating density was attained at 9:lO. Data collection was halted
at l0:48 when a printer head jammed and a ribbon had to be replaced.
Testing resumed at 11:04 and continued non-stop until 14:13 at which
time it was decided enough data had been collected.
V-27

Over 1000 data points were collected and these are held on file at
GIW. The plots of the pipeline data versus time are included as
Figures V-15 - 17.
During the first day of testing the operating conditions of the
pumping system varied greatly. The velocity varied from 5-17 ft/sec,
specific gravity ranged from 1.05 - 1.50 and friction head loss varied
from 0.5 - 4.0 ft/100 ft. While the conditions changed quite a bit
these were not wild fluctuations, but instead the system operated
fairly stabally at one point for a time, then shifted to another level
and operated there for a while. This may have been due to the fact
that the dragline and system had been down and were just coming back on
line and getting the cut back in shape. On the second day the system
was amazingly stable. During most of the day the velocity stayed
between 14-15 ft/sec, the specific gravity was 1.4-1.5 SG and the
losses were 3-4 ft/l00 ft. Later in the day we requested that the pump
speeds be varied occasionally to allow us to collect data at some other
operating points. Compared to the IMC pipeline, which fluctuated
fairly wildly, the OXY system operated very smoothly.
There were a few occasions were the pump cavitated violently as if
the suction were blinded. The suction pressure went negative and the
pump continued to run indicating that the pressure sensing switch was
not operating correctly since it never shut the pump off. There were
no water hammers, however, as was seen at IMC.
Table V-4 contains some representative data points averaged from
the data collected.
V-28


C. W. R. GRACE HOOKERS PRAIRIE FIELD TESTS
The final field test for the FIPR project was conducted at the
W.R. Grace Hookers Prairie Mine during the period August 11-12, 1988.
The test was set up at the #6 Booster Pump in the #14 Pumping System at
Hookers Prairie. Mr. Jackie Purcell, Production Superintendent for W.
R. Grace (WRG), organized the men and equipment to install and set up
the equipment. Mr. Mike James, Mining Engineer, also assisted in
coordinating the testing with production and providing communications
with the operating personnel. GIW personnel were Roy Duvall, Steve
Kerr, Phil Lee, Todd Pike and John Maffett who supervised the set up
and testing for GIW. Mr. Henry Lamb again collected samples for
evaluating the matrix.
The layout of the WRG #14 Pumping System is shown in Figure V-18.
The #6 Booster Pump was a GIW 18xl8WS044 A/3ME pump with reducers and
connecting pipe and fittings as shown in Figure V-19. The elevation
levels shown in Figure V-20 were taken into account in the computer
program. A height correction of 1.6 feet was applied for the total
dynamic head calculation, whereas the elevation difference in the head
loss section was insignificant and therefore ignored. Photographs of
the WRG set up are included in the Photography Section.
The GIW 18xl8WS044 pump had A/3ME hydraulics and a 42" diameter
impeller. The water performance characteristic of the pump is included
in Figure V-21. The pump was directly connected to a 4160 volt, 1500
rpm, 585 rpm, wound rotor motor with a starter plus six stage set point
controller. The pump speed was continually changed throughout the
testing with no more than a few minutes at any one speed. The majority
V-33


of the time was spent at speed points 3, 4 and 5, however, the pump
operated at full speed point six occasionally and also at lowest speed
with the starter only. The speed was measured with a manual tachometer
on many instances and the average speeds for each set point are listed
in Table V-5.
A motor efficiency of 95% at full speed was used to determine pump
horsepower. This pump ran very seldom at full speed and changed so
frequently that a reasonable motor efficiency could not be entered.
The pump horsepower and efficiency numbers are therefore virtually
meaningless and the pump's efficiency is much higher than indicated by
the computer except for very short periods of time. An attempt was
made to track the controller setting. Table V-6 shows the fluctuations
over a one hour period.
The changes were so frequent that it was decided this could not be
coordinated with the pump data and that pump efficiency and horsepower
should be ignored for this test.
The pump head from the computer should still be reliable data, but
without a reliable speed reading it is not of much value.
V-38

12:55 Starter only 12:59 Pt one off and on 01:02 Still fluctuating 01:03 Pt. 3 fluctuating to pt. up 5 01:04 Pt. 4 up and down 01:05 Pt. 4 up and down 01:06 Pt. 4 (Pt. 5 for just a second) 01:08 Pt. 3 up and down, up to pt. 4 01: 10 Pt. 3 - Pt. 4 01:ll Pt. 4 - Pt. 5 - Pt. 3 01:12 Pt. 4 - Pt. 3 01:14 Pt. 3 - Pt. 4 01:16 Pt. 4 - Pt. 3 01:18 Pt. 4 - Pt. 5 01:20 Pt. 4 - Pt. 5 (briefly Pt. 5) 01:22 Pt. 4 01:24 Pt. 4 - Pt. 5 01:26 Pt. 4 - Pt. 5 01:29 Pt. 4 - Pt. 5 01:31 Pt. 3 - Pt. 4 01:32 Starter Only
Table V-6
01:33:56 Line is down 01:34:35 Back up Pt. l-2-3-4-5-6 + 600 RPM 01:37 Starter Only 01:39 Starter + Pt. l-2-3-4 f + 01:41 Pt. 4 + + (596-601) RPM 01:43 Pt. 5 - Pt. 6 + + 600 RPM verified 5 times 01:45 Pt. 6 01:47 Pt. 6 Pt. 5 briefly 01:49 Pt. 6. Pt. 5 briefly 1:48:45 01:51 Pt. 6 01:53 Pt. 4-5-6 01:55 Pt. 3-4-5 01:56:25 Starter Only 01:58 Starter 02:oo Pt. 3-4-5-6 + + 02:02 Pt. 3-4 02:04 Pt. 4-5 02:07 Pt. 3-4
The first day was spent mostly on installing and settling up the
instrumentation. Just as the computer was ready to monitor and collect
data, the pipeline was shut down. After waiting a couple of hours for
the pipeline to restart, inquiries revealed that a pipeline fitting had
been blown and would not be repaired until sometime overnight. Plans
v-39

were made to start first thing next morning with everything ready for a
full day of testing.
After purging all transducers and checking calibrations, data
collection commenced at 8:21 AM Friday, August 12, 1988. The system
operated fairly stably at about 14,500 gpm, around 1.35 SG and 4-5
ft/l00 ft losses for about 30 minutes. This was followed by a short
period of fluctuating flows up to 16,000 gpm and density peaks up to
1.4 SG. Next the flow and density gradually decreased as the system
was washed out and then shut down at 9:08 AM. Due to lack of
communications and forethought, the system had been repaired and
brought backup overnight and the cut was mined out. The system would
be down most of the day while the dragline striped overburden to
prepare a new face. After much discussion and cajoling, WRG was
convinced to strip only enough for a few hours running and to restart
at noon.
Testing was resumed at 12:26 PM and ran continuously until 3:30
PM. Over 600 data points were collected. These are stored on file at
GIW. The data is also plotted against time in Figures V-22 and V-23.
Over the period of the tests the velocity ranged from 10 ft/sec to
as high as 18 ft/sec. The density varied from dirty water at 1.05 SG
to over 1.4 SG while the friction pressure loss ranged from 3 to 6
ft/100 ft. While the operation fluctuated considerably the norms
appeared to be about 16-18 ft/sec, 1.35-1.40 SG, and 5 ft/100 ft. From
the data there are segments of relatively stable data which can be
roughly averaged to give representative data points as shown in Table
V-7.
V-40


The data are much more stable than expected with the continual
speed changes on the pumps. This may be necessary to maintain sump
control, but the writer believes this would be a much more stable and
reliable operating system if part of this speed control was removed.
More of the pumps should be constant full speed units. The efficiency
and power usage probably could be reduced considerably and it might be
possible to even remove one pump from the line if more of the others
ran full speed.

VI. EXTRUSION RHEOMETER TESTS
The following procedure was used to examine the rheology of the
phosphate carrier during the FIPR testing contract. The carrier in
these tests is defined by all material passing through a #30-600 micron
sieve.
Two series of tests were performed on this carrier in the lab.
The first series of test were on matrix which had been through the pump
numerous times and was collected while unloading the system. The
material was passed through the #30-600 micron sieve without the
addition of water. The material was then diluted to concentrations of
1.18, 1.21 and 1.31 SG. This first series of test did not include the
Occidental Suwannee River matrix because it was found to settle out at
these concentrations.
The second series of test were performed on matrix which was
straight from the mines and was unaltered except for the 600 micron
screening. This material was washed through the sieve with water to
insure all material less than 600 microns was retained, the matrix was
then dried to the appropriate SG for testing which ranged from 1.53 to
1.30 depending on the matrix.
The d50 of matrix tested in this series was higher than the
previously tested matrix because of this washing. The concentrations
in this series of test were higher allowing the Occidental Suwannee
River matrix to be included in the tests.
The apparatus used for the rheology testing consists of a vertical
test pipe of drawn steel tubing of 13 ft (4 m) in length and having an
inside diameter of 0.43 inches (10.9 mm) which connects two vessels.
VI-1

The upper vessel was flexibly connected and suspended from a load cell.
Air under constant pressure is supplied to the space above the free
surface in the lower vessel, B, to provide the required flow rate to
the upper vessel, A, in which the free surface is at atmospheric
pressure. The outputs from the load cell and from a pressure
transducer connected to the air space in the lower vessel are connected
to a computer data-logger.
In order to carry out the experiments a measured quantity some two
gallons of each slurry of known specific gravity, was poured into
vessel A. The computer data logger was so programmed that it
determined the wall shear stress, defined 'to, and the shear rate,
defined by 8V/D when a predetermined mass of slurry has been
transferred from vessel B to vessel A.
The above procedure was used for a range of flow rates to provide
the following rheograms.
The printouts are labelled indicating the origin of the material,
the concentration tested and additional information pertaining to the
test. Any comments pertaining to the tests can be found in the lower
right hand corner of either the printouts or the rheograms.
During the course of these tests extensive sampling was done
before and after testing to assure that the SG was maintained
throughout the test.
VI-2


VI-3

VII. EFFECT OF PHOSPHATE MATRIX SLURRIES ON CENTRIFUGAL
PUMP HEAD AND EFFICIENCY
A. INTRODUCTION
Clear water head and efficiency of centrifugal pumps are generally
lowered by the presence of solids. The pumping cost is related to the
operating conditions in a complex way because the performance is
affected by the solids in the slurry. Detailed information on the
solids effect is needed in order to achieve energy-efficient operation
of phosphate matrix pipelines. For example, the pump power needed in a
line of a length of up to 10 mil es (16 km) with a diameter of 18"
(0.46m) can be in the region of 10 MW,
Earlier investigations reported in the literature have been
reviewed, for example, by Sellgren (1979). Most investigational work
has been carried out with ore products, coals and sands in relatively
small pumps with impeller diameters of less diameter than 20" (0.5m).
Very few data are available with larger units but reductional effects
should generally be small or in larger pumps (Sellgren, et.al 1986).
However, reliable scaling criteria are not known at present.
Some experimental results with phosphate matrix pumping from the
GIW Laboratory (Addie, 1982) with a unit with an impeller diameter of
31" (0.8m) indicated drops in head and efficiencies of about 15% for a
solids concentration by weight, Cw, of about 32%. No data have been
available on the effect of phosphate matrix slurries on the performance
of large centrifugal pumps with impeller diameters of 44"-51" (1.1 -
1.2m).
VII-1
B. OBJECTIVES
The objective has been to evaluate the influence of representative
Florida phosphate matrix slurries on the performance of large
centrifugal GIW pumps. The aim has here been to represent the results
of the analysis in a simple form suitable for quick estimations. More
detailed results will also be given as an algorithm in a computer
program developed by GIW as a tool for the hydraulic design of
phosphate matrix pipelines.
C. EXPERIMENTAL STUDY
The pumps used in the tests were a 18xl8LSA type of pump with an
impeller diameter of 44" (1.1m) and a 18x20WBC pump with an impeller of
51" (1.2m). The WBC-pump was used for tests with three different
products while the LSA-pump was used for a coarse product only. The
experimental facility and measurement procedures, etc. have been
described earlier in this report.
D. RESULTS
The results covered flow rates of 4,000-24,000 USGPM (16-96
m3/min) and rotary speeds mainly in the range of 350 to 490 rpm.
In terms of particle size and distribution phosphate matrixes are
normally characterized by the content by weight of pebbles (+1200
microns), the feed product (105-1200 microns) and fines (-105 microns).
In the Florida phosphate fields the content of fines is mainly 20 to
35% while the content of pebbles varies from some few percents up to
nearly 40%.
VII-2

Pump test results with a coarse matrix product is shown in Figure
VII-1.
The influence of solids on the performance was small for the two
pumps tested compared to effects normally encountered with smaller
pumps. The results shown in Figure VII-1 for the coarsest product
investigated represents the largest effects observed.
Most experimental data were collected at solids concentrations by
weight of about 35%. The measured data showed no significant
dependence of reductional effects with the solids concentration. This
can be explained by the solids degradation effect which took place
VII-3

during a test period. Particle sample test results on a before and
after basis indicated that breaking down of agglomerates and
degradation reduced the particle sizes substantially for the coarsest
products tested. The detailed experimental results indicated that the
dependence of solids concentration is masked by solids degradation
effects. Based on reported experiences with smaller pumps it is
reasonable here to assume a linear concentration dependence of the
reduction in head and efficiency for phosphate matrix concentrations by
weight of up to 50%.
Most experimental results showed a slight trend of decreased
solids effects on the head with increased flow rates. An opposite
trend was found for the efficiency, see Figure VII-1.
The reduction of clear water head and efficiency for a constant
flow rate and rotary speed was defined by the following ratios
Reduction ratio in head: RH = &!0
Reduction ration in efficiency RE = k.!nO
where l
AH = head reduction developed in slurry service,feet (meters) of slurry
Arl = efficiency reduction developed in slurry service
HO= head developed in wake service,
feet (meters) of water
nO= pump efficiency in water service
These variables are schematically defined in Figure VII-2 at two
different flow rates, Q, and Q,.
(1)
(2)
VII-4

In industrial operation, flow rates are normally 60 to 70% of the
flow rate at the best efficiency point, QBEP. For these flow rates and
neglecting minor differences of the solids effect between the two pumps
the following overall results have been summarized, Table VII-1.
VII-5

Table VII-1
Overall values of relative reduction in head and efficiency forphosphate matrix pumping with GIW pumps with impellers of 44" to 51"(/.1 - /.2m). related to a Cw of 35%. Pump rotary speeds of 350to 500 rpm. Matrix product characterized by it pebble content (+1200microns).
Pebble Content
38% (max.)13%
2% (min.)
RH RE(eq. 1) (eq. 2)
5% 5%5% 3%5% 2%
With the reductional effects related linearly to the solids
concentration then for example the RH and RE values in Table VII-1 are
magnified by a factor of 45/35 = 1.29 when pumped at Cw = 45%.
E. DISCUSSION OF RESULTS
The comparatively small effects of the solids investigated here
for large GIW-pumps clearly demonstrate the importance of relating
reductional effects to the size of the pump. With small pumps with
impellers of about 20" (0.5m) the corresponding reductions would
probably have been about 20%.
It is known from other studies (Sellgren, 1979) that the influence
of individual solids properties on head is generally more moderate than
the influence on efficiency. This may explain the negligible effect in
head of the solids composition shown in Table VII-1. Furthermore, the
trend in Table VII-1 with a decrease in reductional effects in
efficiency with a decreased amount of coarse particles can be explained
by turbulent dampening and non-Newtonian effects of the fine particles
portion of the slurry. These effects may cause a decrease of the disc
VII-6

friction within the pump which nearly compensate the extra hydraulic
losses due to solids.
Finally, it must be emphasized that the small effects of solids
obtained here sometimes were within the range of the practical possible
evaluation accuracy in light of the experimental difficulties
encountered with particle degradation, etc. Furthermore, in industrial
applications a stage is reached where the suggestive wear within the
pump affects the performance to a larger degree than the effects of
solids.
The detailed results of the evaluations will be given as input to
other GIW-pump data in a hydraulic design computer program for
phosphate matrix pipelines. The algorithm for the effects of solids on
the pump performance is shown separately in the Appendix VII-I.
F. CONCLUSIONS
The detailed results of the influence of phosphate matrix slurries
on the head and efficiency on two GIW-pumps have been given in an
algorithm (see the Appendix) for use in the overall hydraulic design
computer program described elsewhere in this report.
The overall results are here summarized in a simple form related
to normal operating conditions and a solids concentration by weight of
35%. Compared to clear water values the reduction in head was
approximately 5% for all matrix products tested. The reduction in
efficiency varied from about 2% for the finest product to about 5% for
the coarsest product. With concentrations by weight of up to 45-50% it
is suggested that the reductional values given above are modified in
proportion to the deviation from 35%.
VII-7

G. REFERENCES
1. Addie, G. R., "Effects of Slurries on Pump Head and Efficiency",presented at The Fifth Annual Transportation of Solids usingCentrifugal Pumps Seminar", GIW Industries, Inc., March 1982.
2. Sellgren, A.; "Performance of a Centrifugal Pump when Pumping Oresand Industrial Minerals", presented at the 6th International Conferenceon the Hydraulic Transport of Solids in Pipes, BHRA Fluid Engineering,Cranfield, Bedford, U.K., 1979.
3. Sellgren, A. and Vappling, L., "Effects of Highly ConcentratedSlurries on the Performance of Centrifugal Pumps", reprint 2ndInternational Symposium on Liquid-Solid Flow, ASME, ASCE, Los Angeles,USA, December, 1986.
VII-8

APPENDIX VII-I
ALGORITHM
Input clear water pump data are given by type, rpm, actual flow
rate, Qx, and flow rate at BEP, QBEP. Furthermore, the solids
concentration by weight Cw is given together with the pebble content in
percent in the matrix.
The fact that the solids effects were small means that the
parameters can be linearly related in an algebraic relationship. The
solids effect were related to four constants RH1, RH2, RE1 and RE2.
The constants were defined as follows, see Figure VII-2.
VII-I-1

VII-I-2
