the flynn effect in south africa - cora cork open research archive
TRANSCRIPT

UCC Library and UCC researchers have made this item openly available.Please let us know how this has helped you. Thanks!
Title The Flynn effect in South Africa
Author(s) Murphy, Raegan; te Nijenhuis, Jan; van Eeden, Rene
Publication date 2011-11
Original citation TE NIJENHUIS, J., MURPHY, R. & VAN EEDEN, R. 2011. The Flynneffect in South Africa. Intelligence, 39, 456-467.
Type of publication Article (peer-reviewed)
Link to publisher'sversion
http://www.sciencedirect.com/science/article/pii/S0160289611000924http://dx.doi.org/10.1016/j.intell.2011.08.003Access to the full text of the published version may require asubscription.
Rights © 2011 Elsevier Inc. All rights reserved. NOTICE: this is theauthor’s version of a work that was accepted for publication inIntelligence. Changes resulting from the publishing process, such aspeer review, editing, corrections, structural formatting, and otherquality control mechanisms may not be reflected in this document.Changes may have been made to this work since it was submittedfor publication. A definitive version was subsequently published inIntelligence, Volume 39, Issue 6, November–December 2011, Pages456–467 http://dx.doi.org/10.1016/j.intell.2011.08.003
Item downloadedfrom
http://hdl.handle.net/10468/613
Downloaded on 2021-11-27T19:35:18Z

1
Running head: The Flynn effect in South Africa

2
Running head: The Flynn effect in South Africa
The Flynn effect in South Africa
Raegan Murphya, Jan te Nijenhuis
b, *, and
Rene van Eeden
c
aApplied Psychology, University College Cork, Ireland;
bWork and Organizational Psychology,
University of Amsterdam, the Netherlands; cDepartment of Psychology, University of South Africa
* Corresponding author: Jan te Nijenhuis, University of Amsterdam, Roetersstraat 15, 1018 WB
Amsterdam, the Netherlands. E-mail: [email protected].
Number of words: 7,656
Submitted to: Intelligence
Revision
March 2011

3
Abstract
This is a study of secular score gains in South Africa. The findings are based on
representative samples from datasets utilized in norm studies of popular mainstream intelligence
batteries such as the WAIS as well as widely used test batteries which were locally developed and
normed in South Africa. Flynn effects were computed in three ways. First, studies where two
different groups take the same test, with several years in between, using representative or
comparable samples were used. Second, studies where the same group takes two different test
batteries at a specific time were used. Third, the score differences between English- and Afrikaans-
speaking Whites in South Africa in the 20th century were compared. The Flynn effect in White
groups in South Africa is somewhat smaller than the Flynn effect in Western, industrialized
countries (total N = 17,522), and the Flynn effect in Indian groups is substantially smaller (total N =
5,182). Non-verbal IQ scores surpassed increases in verbal IQ scores. The findings from English-
and Afrikaans-speaking Whites evidence a leveling out of differences in score gains over the 20th
century (total N = 79,310).
Keywords: Flynn effect; secular score gains; g; IQ tests; intelligence; South Africa

4
Secular score gains in IQ test scores are one of the most intriguing and controversial
findings in the recent psychology research literature. James Flynn (1984, 1987) was the first to
show that average scores on intelligence tests are rising substantially and consistently, all over the
world. These gains have been going on for the better part of a century – essentially ever since
standardized tests were developed. Although Flynn effects have been shown for many countries, as
yet, little has been done on the Flynn effect in South Africa. This paper is the first to exhaustively
describe the Flynn effect in South Africa.
The Flynn effect refers to the increase in IQ scores over time. For Western, industrialized countries,
between 1930 and 1990 the gain on standard broad-spectrum IQ tests averaged three IQ points per
decade. This trend has continued to the present day in the United States (Flynn, 2007, 2009a). In
the United Kingdom, gains on the Raven’s Progressive Matrices are still robust except oddly, at
ages 13 to 15, an exception confirmed by Piagetian data (Flynn, 2009b; Shayer, Ginsburg & Coe,
2007). It is a global phenomenon and has been recorded for a number of industrialized and non-
industrialiszed nations including countries in Africa (Flynn, 2006). For verbal tests, or more
precisely, tests with a content that most reflects the traditional classroom subject matter, the gain is
2 IQ points per decade, and for non-verbal (Fluid and Visual) tests the gain is 4 IQ points per
decade (Jensen, 1998).
Recently, however, studies from Denmark, Norway, and Britain show the secular gains
have stopped and even suggest a decline of IQ scores (Lynn, 2009a; Shayer et al., 2007; Sundet,
Barlaug & Torjussen, 2004; Teasdale & Owen, 2008). However, there is also recent evidence of IQ
test scores continuing to rise in Western, industrialized countries (e.g. in France, see Bradmetz &
Mathy, 2006) and in countries in the former communist Eastern Europe (e.g. in Estonia, see Must,
te Nijenhuis, Must & van Vianen, 2009). Recent studies show IQ scores rising in less-developed
parts of the world, for example in Kenya (Daley, Whaley, Sigman, Espinosa & Neumann, 2003),
Sudan (Khaleefa, Abdelwahid, Abdulradi
& Lynn, 2008) and in the Caribbean (Meisenberg,
Lawless, Lambert & Newton, 2006). However, there is, to this date, only one study of the Flynn
effect in South Africa (Richter, Griesel & Wortley, 1989).
Various causes have been hypothesized for the Flynn effect, including education, nutrition,
health care, inbreeding, GDP, urbanization, family size, health care expenditure, the dissemination
of visual-spatial toys, and teacher to student ratio (see Jensen, 1998). It is difficult to conclude what
the most important cause is, as many of the effects take place at the same time and show similar

5
trends.
Racial classification and segregation in education in South Africa
The four racial groups currently classified in the country are Black, White, Colored, and Indian.
The latest South African Government statistics (2007 mid-year) reveal a total populace of
47,850,700 of which Blacks account for 79.6%; Whites account for 9.1%; Coloreds account for
8.9% and Indian/Asian account for 2.5%. Whites are of European descent and a distinction is made
between Afrikaans- and English-speaking Whites. About 60% of the White population of South-
Africa are Afrikaans-speakers. The Afrikaans-speaking are chiefly descendant from the French
Huguenots and Dutch peoples. Historically their social development sprang from an impoverished
rural base (Claassen, 1997). In 1946 the per capita income of Afrikaans-speaking Whites was 47%
of that of the English-speaking Whites; in 1960 it was 60%, and in 1976 it was 71%. About 40% of
the Whites are English-speaking and traditionally they completed more years of secondary and
tertiary schooling, but this has changed through the years from the early twentieth century and both
English- and Afrikaans-speaking Whites are more or less on a par (Claassen, 1997). The increase in
number of years of education through the years has been hypothesized to partly account for the
increases evidenced in IQ scores for the latter group (Claassen, 1997; see also Ceci [1991] and
Jensen [1998]). Coloreds are of mixed racial origin spanning numerous countries outside Africa but
having substantial genetic Southern African ancestry (some Coloreds are of Bantu-Khoisan
descent). This term does not have the same meaning as the American term ‘Colored’. In South
Africa it does not refer to a Black person. The reason for the presence of Indian populations is that
in the nineteenth century the European colonists needed laborers for manual work of various kinds.
Indians were brought over from the 1860s onwards principally to work in the sugar and cotton
plantations in Natal. It must be recalled that during the Apartheid era, national education was
decentralized regarding access to equal opportunities and resources. Education for Black school
children was by and large severely below the White counterpart standards (Shuttleworth-Edwards,
Kemp, Rust, Muirhead, Hartman & Radloff, 2004). Difference in schooling is also reflected in the
difference between White and non-White access to higher education (see Tables 1 and 2).
INSERT TABLE 1 HERE
INSERT TABLE 2 HERE

6
IQ testing and group differences in South Africa
During the early part of the 20th century South African test developers utilized existing international
test batteries as their main source of test information usually derived from the Binet type individual
test and the Army Beta group test (Fick, 1929, 1939). As early as 1916, the Moll-Leipoldt Scales
had been compiled, initially under the name ‘Binet-Simon-Goddard-Healy-Knox Scale’ with a
group intelligence test being released in 1924 at the University of Stellenbosch (Smit, 1996).
Through the intervening years (1924-2008) a number of international tests were utilized and/or
standardized for local South African conditions. South African-developed tests include, among
others, the South African Group Intelligence Test (SAGIT), and the Individual Scale of General
intelligence for SA (ISGIS). The testing tradition in South Africa thus reflects an amalgamation of
original uniquely developed and normed tests as well as normed and locally standardized
international tests (Huysamen, 1996).
South African literature has shown for many decades that substantial differences in test
scores between various cultural and language groups exist (Biesheuvel & Liddicoat, 1959; Claassen,
Krynauw, Paterson & wa ga Mathe, 2001; Dent, 1949; Fick, 1929; Foxcroft & Aston, 2006; Irvine,
1969; Knoetze, Bass & Steele, 2005; Rushton, 2001; Rushton & Skuy, 2000; van der Berg, 1989;
Verster & Prinsloo, 1988). Whites outscore non-Whites, and within the White group English-
speakers outscore Afrikaans-speakers. However, it has also been long known and cited that socio-
economic status, educational attainment, language bias, socio-political circumstances, and test
familiarity play a role in the depressed scores of certain groups even though any one of these
factors cannot be solely accountable for group differences (Biesheuvel, 1952a,b; Biesheuvel &
Liddicoat, 1959; Crawford-Nutt, 1976, 1977; Furnham, Mkhize & Mndaweni, 2004; Kamin, 2006;
Liddicoat & Roberts, 1962; Lynn & Owen, 1994; Owen, 1992; Pressey & Teter, 1919; Rushton,
2008; Shuttleworth-Edwards, Kemp, Rust, Muirhead, Hartman & Radloff, 2004; Skuy, Gewer,
Osrin, Khunou, Fridjhon & Rushton, 2002; van der Berg, 1989; van Eeeden, de Beer & Coetzee,
2001).
Due to its ethnic diversity, the large differences between groups on many variables, the
availability of high-quality psychometric tests, and an extensive literature on testing, South Africa
seems an almost ideal country to test for secular score gains. However, the unique manner of
sampling in post-democracy South Africa resulted in different groups being clustered together such
that Whites, Coloreds, Indians, and Blacks are taken as one group reflecting an overall ‘South
African’ IQ score. This manner of sampling was strongly dependent on the SES group to which

7
individuals were assigned. In contrast, pre-democracy South African sampling often stratified the
samples according to different race groups such that separate IQ scores were available for the
different groups. Added to this mélange of sampling mixes were group clusters of Whites and
Coloreds, Indians and Blacks, or Whites and Indians. This makes it difficult to impossible to
disentangle the different groups’ separate scores, which has as a consequence that notwithstanding
the wealth of South African data, only a small percentage could be used in the present analyses of
secular score gains. More specifically, due to the absence of good datasets on Black South Africans
our study was limited to Indian and White South Africans.
Research questions
The first research question is whether the secular gains of White South Africans is comparable to
that found in Western, industrialized countries. The second research question focuses on the size of
the secular gain for Indian South Africans. The third question is how the differences between
English-speaking and Afrikaans-speaking White South Africans compare in the 20th century.
Our study hereby substantially extends the nomological net of studies of secular score
gains. Its unique feature is the comparison of two White groups, over the course of a century, living
in the same country.

8
METHOD
Data gathering
The critera for inclusion of data sets was that they have adequate sample sizes, be adequately
representative of the the samples, and use reliable and valid psychometric tools. Data sets were
gathered from library archives, publications in the literature, test libraries, university libraries as
well as closed collections. Invariably some data sets were more complete than others. With some
very early data sets information delineated is at times less consistent to later manners of
information presentation; however, they still contain enough information for use in the present
study. There is no one single test repository in South Africa. Moreover, the Human Science
Research Council’s test library has been disbanded making it difficult to gain access to the
collection of manuals. Searchable South African data archives such as Sabinet yielded part of our
database of results. Manuals from test libraries housed at some universities in South Africa were
also searched by two of the authors. A number of published articles, from which data was sourced,
are only available in hard-copy format and in some instances can only be found in South Africa.
Some results were sourced from postgraduate dissertations and are only available in Afrikaans.
Other data sets were sourced from internationally indexed research. Although we did not aim to
find every last relevant study, within the restrictions described above, we believe our search was
exhaustive.
Tests
A brief review of all tests used in the computation of a Flynn effect is given in Tables 3 and 4. The
tests are listed chronologically and according to date of data gathering. Older material was less
researched and information in terms of sample descriptions is limited in certain instances. The
subtests included in the individual and group tests listed here resemble those included in
international batteries commonly used.
INSERT TABLE 3 HERE
INSERT TABLE 4 HERE
Samples

9
In total 12 test batteries were sourced. The database was subdivided into 87 sets of data which were
subsequently analyzed for use in the study but not all were ultimately utilized due to missing data
or data that could simply not be compared over the years due to the nature of the sampling (early
sampling according to race as opposed to later sampling according to SES, as described earlier).
The data sets used for this paper contain IQ scores gathered between 1925 – 2000 and are
composed of samples of individuals born between 1890 and 1985. Sample sizes range from 24 to
40,000 depending on the nature of the assessment (small-scale research or standardization).
Statistical analyses
Computation of the secular score gains
In this paper three methods of computing secular gain scores were used.
1) The first method was used in Flynn (1987). A comparison was made between the outcomes from
studies using the same test in different groups, with at least five years in between, in all cases using
representative or comparable samples (i.e. in terms of age, population group, etc.). For instance, the
Raven’s Progressive Matrices was taken in both 1960 and 2000 by samples of comparable groups.
The score increase is an estimate of the Flynn effect.
2) The second method was used in Flynn (1984). In studies where the same group took two
different test batteries the resulting means were compared. There had to be at least four years
between the norm samples of the two tests. These samples need not be representative. For instance,
one group took both the SSAIS-R (1987) and the NSAGT (1954). For instance, if the same group
of subjects took the NSAGT – normed in 1954 – and the SSAIS-R – normed in 1987 – they should
score higher on the earlier test, the NSAGT. The group’s raw score on the NSAGT should be
compared to the norm scores of the NSAGT from 1954, which might result in a score of 107. The
group’s raw score on the SSAIS-R should be compared to the norm scores of the SSAIS-R from
1987, which might result in a score of 101. The difference between their mean scores on the two
tests serves as a measure of the magnitude of gains, that is, scoring 107 on the earlier test and 101
on the later test suggests a gain of 6 IQ points in 33 years.
3) Using data going back to people born in the 1890s Verster and Prinsloo (1988) and Claassen
(1997) describe how the English-speaking outscore the Afrikaans-speaking and how the erstwhile
large gap diminished within four of five generations. Many of the studies they cite used carefully
collected, representative samples. Although the aforementioned authors’ results were not used by

10
them to test the Flynn effect, these data can be used to estimate the size of the Flynn effect for the
Afrikaans-speaking group. We use a three-step procedure: first, from people born in 1890 to people
being born in 1985 the English-speaking means are compared with the Afrikaans-speaking means;
second, using the results from the two estimation methods described above gives a clear estimate of
the score gains for the English-speakers; third, combining the gains from the first step and the
second step results in an estimate of the score gains for the Afrikaans-speaking.
So, in a sense the scores of the English-speaking are used as a yardstick, albeit that the
yardstick is not disconnected from the Flynn effect. Another way to look at it, is to think of how the
Afrikaans-speaking catch up, by comparing their scores with the English-speaking from people
being born in 1890 to people being born in 1985.
RESULTS
Table 5 shows the studies where two different but comparable groups took the same test, with
several years in between, using representative or comparable samples. The gain per decade for
Whites is on average 1.64 IQ points.
INSERT TABLE 5 HERE
Table 6 lists the studies where the same group took two different test batteries at a specific
time. The gain per decade for Whites is on average 3.51 IQ points. The gain per decade for Indians
is on average 1.57 IQ points. There is a difference in the gains between the two methods (Tables 5
and 6). However, it does not seem to be a function of the method but rather of the tests compared
(for example, the very large gains when the JSAIS is used). As can be seen from Table 6, a wider
range of tests was used to calculate the gain score and in comparison to Table 5, the time span is
longer, and also more studies are used which should lead to more reliable results. High gain scores
are evidenced for the NB, JSAIS, SSAIS, and GSAT batteries. The time span covered by these
batteries is however shorter than the corresponding lower gain scores evidenced for batteries
covering a longer time span. When looking at these results it should be borne in mind that the
methodology used, the test battery used, the number of studies and the time span covered all play a
role in interpreting the final gain score and hence putting it into context. So, although we see
relatively large gain scores for some of the batteries, there is also a loss of score for a small numer
11
of others.
INSERT TABLE 6 HERE
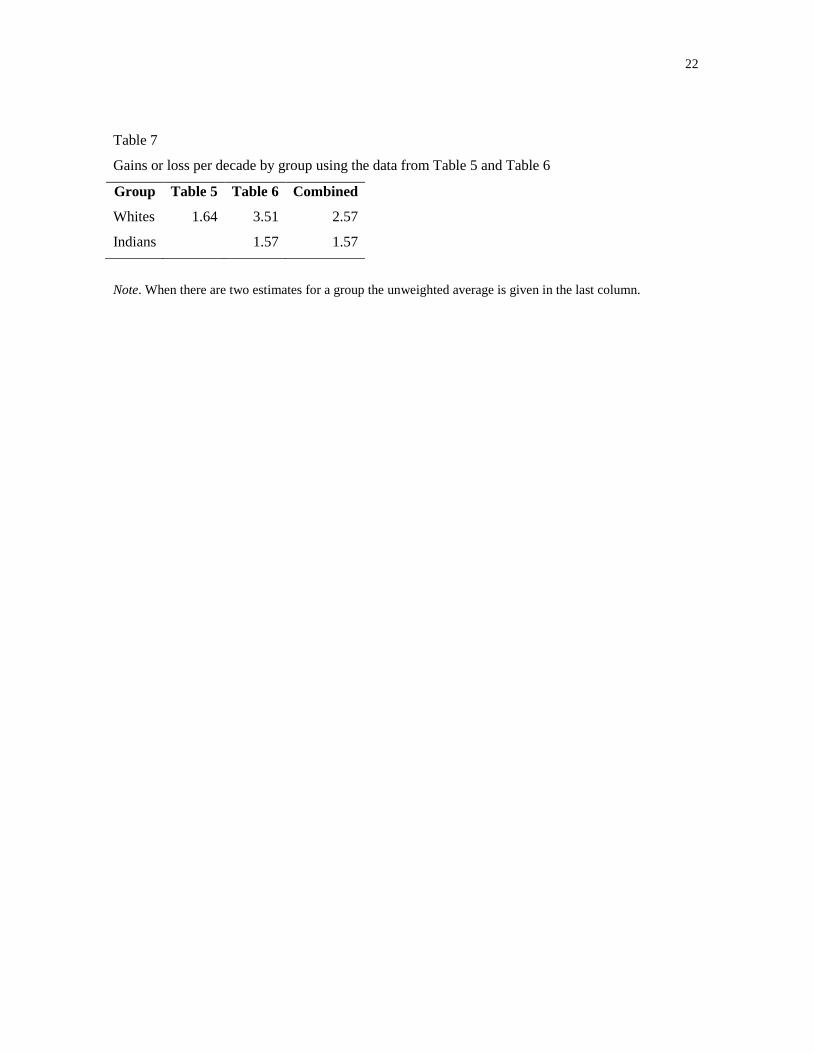
Table 7 shows the results when the mean gains per decade by group from Tables 5 and 6 are
combined. The following figures emerge: The gain per decade for Whites is on average 2.57 IQ
points, and the gain per decade for Indians is 1.57 points. On average, the gain score for Whites is
somewhat lower than the three points that have been reported in the literature for other
industrialized countries (Flynn, 2007). It should be noted that most of the broad test batteries used
in the South African samples are similar in content to those in the many other studies on the Flynn
effect. The gain for Indians was substantially smaller than the gain for Whites.
INSERT TABLE 7 HERE
Differences between English- and Afrikaans-speaking sample throughout the decades
were also compared. Early studies delineated the language groups strictly according to home
language spoken among Whites only whereas the later studies included all cultural groups whose
first language was English or Afrikaans. The trend for distinct differences between cultural groups
thus becomes distorted. The earliest data detailing English-speaking and Afrikaans-speaking
differences emanates from the 1950s with a study utilizing the South African Group Test with
normed data gathered in 1931 (Smit, 1996; Verster & Prinsloo, 1988). Data from this point forward
consistently evidenced a substantial discrepancy between the language groups with higher IQ’s
being established for the English-speaking groups.
Table 8 shows the score differences between the two groups. The table is ordered
according to date of sample collection. Figure 1 reports the same data points and clearly shows how
the groups are slowly converging in their mean scores. Score differences are computed as: mean of
the English-speaking group minus the mean of the Afrikaans-speaking group. A positive score
difference means therefore that the English-speaking group has a higher mean score, and a negative
score means that the Afrikaans-speaking group has a higher mean score.
INSERT TABLE 8 HERE

12
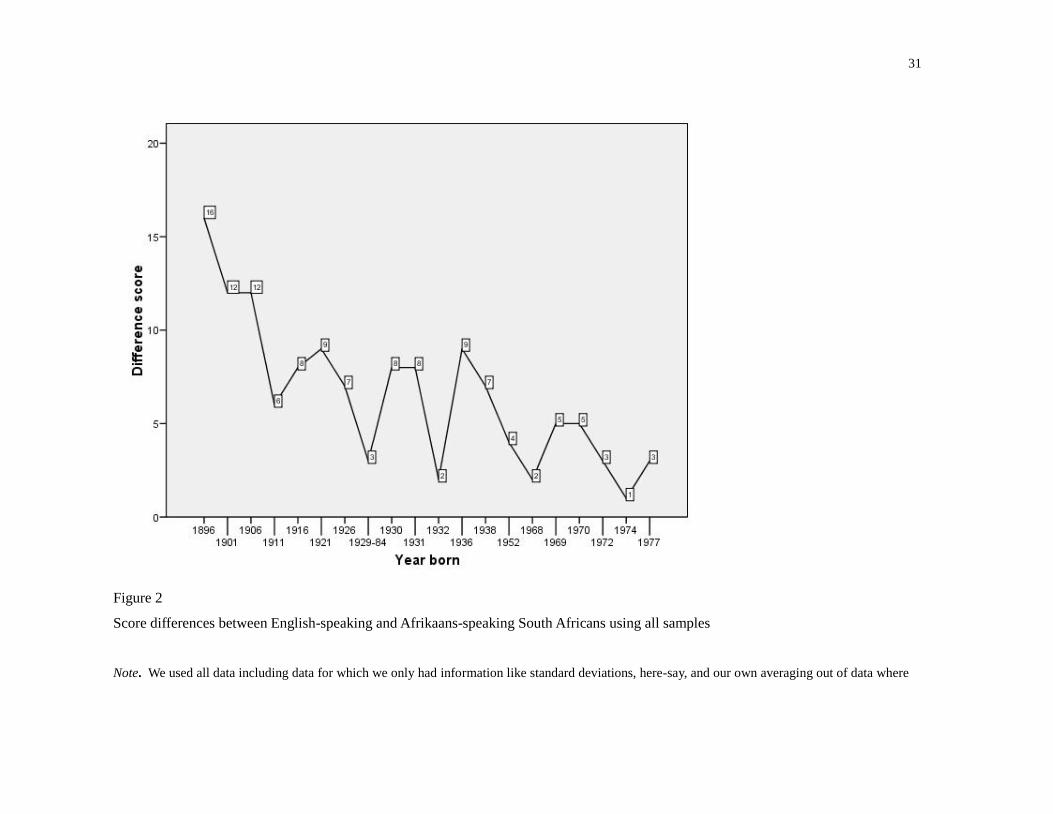
Figure 1 clearly shows that when using only robust datasets the huge score gap between Afrikaans
speakers and English speakers strongly diminishes over the run of a century. Figure 2 shows that
when using all the samples the overall picture is very much the same, with the exception of a few
outliers. So, the quality of the datasets does not seem to strongly influence the conclusions. This
means that the secular score gain is stronger for the Afrikaans speakers than for the English
speakers.
INSERT FIGURE 1 HERE
INSERT FIGURE 2 HERE
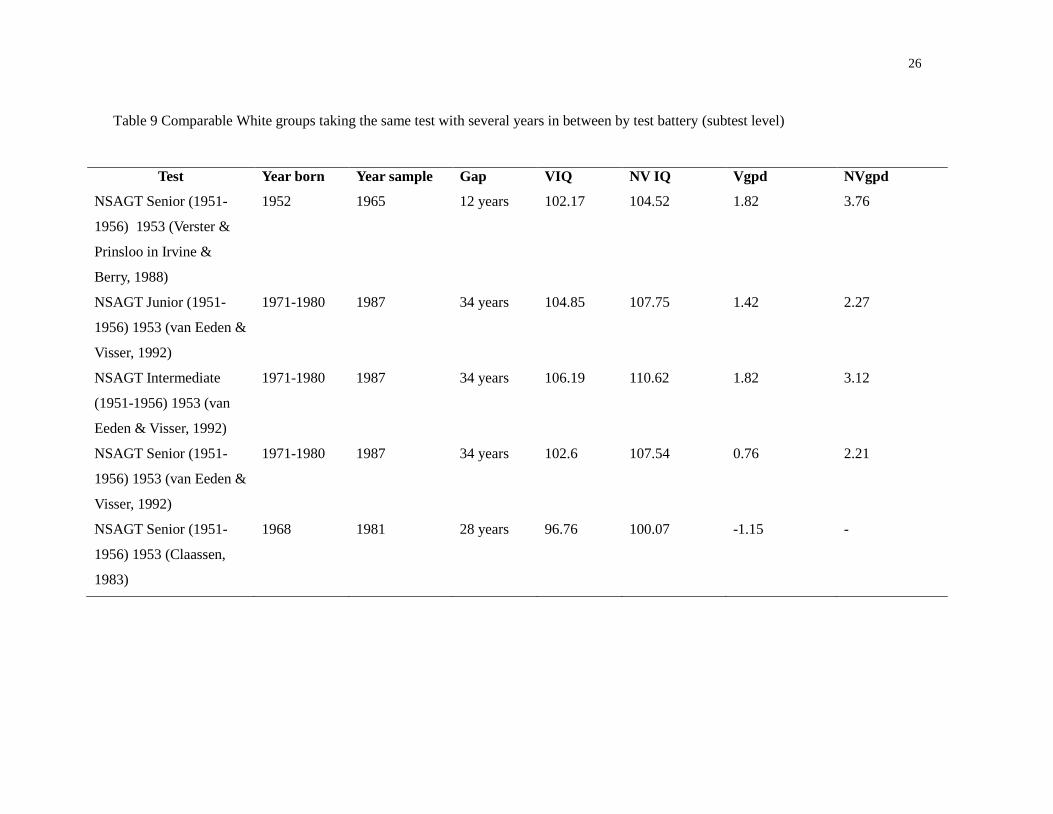
We also investigated the IQ score increases at the subtest level for the group for which we had data
available, in this case for Whites. Table 9 uses the data sets of Table 5 and Table 10 uses data of
Table 6, but unfortunately, not all studies report information at the subtest level. It can be clearly
seen that non-verbal IQ scores have increased more so than verbal IQ scores and this is in keeping
with the literature (Flynn, 2007; Jensen, 1998).
INSERT TABLE 9 HERE
INSERT TABLE 10 HERE
Table 11 shows the results when the mean gains per decade from Tables 9 and 10 are combined.
The verbal IQ gain per decade for Whites is on average 2.28 IQ points, and the non-verbal gain per
decade is 4 IQ points.
INSERT TABLE 11 HERE
CONCLUSION
A Flynn effect could be identified for all our South African data. There are clear gains per decade of
about two-and-a-half IQ points for Whites and about one-and-a-half IQ point for Indians. In
comparison to Whites in Europe and the United States, the Whites in South Africa show a
somewhat smaller gain. As a group, White South Africans are quite westernized, so one could
hypothesize that this explains a gain that comes close to that found in Western, industrialized
13
countries. Greater gains are evidenced for non-verbal IQ scores as opposed to verbal IQ scores for
the Whites, which is comparable to previous findings.
A special feature of the present paper is a comparison of test scores of Afrikaans- and
English-speakers, starting with people born in 1896 and ending with people born in 1977. Over the
course of approximately a century the large difference of about one SD in favor of English speakers
diminishes by about three quarters. So, the group as a whole has a clear Flynn effect, but the effect
is larger for the Afrikaans-speaking group. One could speculate that the diminishing gap between
the Afrikaans- and English-speaking South Africans is driven partly by education and the
diminishing gap in GDP between the two groups. However, there is no way to definitively prove
this as trends in these two hypothesized causes and other hypothesized causes occur at the same
time.
A number of samples are not perfectly comparable over the decades because of the
demographic exclusion and inclusion criteria. In the early data sets, for instance, only Whites were
included whereeas in the newer data sets, the term ‘advantaged’ signaled SES and not a racial
classification. However, it seems that the estimates of the Flynn effect are quite comparable over
the various samples, taking the very large differences in sample size into account. In addition, the
focus in this particular article highlights the results of Afrikaans-speaking versus English-speaking
South Africans and does not reflect the full spread of the demographics in the country. Due to the
questionable nature of some of the Black IQ data sets investigated for this research (sample
collection not always being explicitly stated) a major limitation of this paper is the lack of an
estimate of the Flynn effect for the largest population group in the country.
When looking at these results it should be borne in mind that the methodology used, the
test battery used, the number of studies and the time span covered all play a role in interpreting the
final gain score and hence putting it into context. Variables could be dummy-coded and regression
analyses could be run, but we feel the datasets are too small to yield reliable outcomes. It would be
much preferable to add our data to a future meta-analysis and then run these analyses.

14
Table 1 Number of pupils in public and private schools 1921-1958 and 2007
(Department of Education, South Africa, 2008)
Note. *using Grade 12 certificate as cut-off
Year White Non-White (Black, Colored and Indian)
1921 337483 (white population in 1921
=1521000) (22% of white pop)
253958 (non white population in 1921 =
5405000) (4.6% of non white pop)
1935 392851 519900
1945 444158 838750
1958 659940 1726485
2007* 3193883 (white population in 2007 =
4351000) (73% of white pop)
33323137 (non white population in 2007 =
43499000) (76% of non white population)

15
Table 2 Headcount enrolments of contact and distance mode students in public higher education institutions. By population group and
gender, in 2006 (Department of Education, South Africa, 2008)
Contact Distance
Black Colored Indian/Asian White Total Female Male Black Colored Indian/Asian White Total Female Male
Institution
Total
287878 33497 30946 122694 476741 255706 221035 163230 15041 23913 61974 264642 153012 111630
% 60 7 6 26 100 54 46 62 6 9 23 100 58 42
16
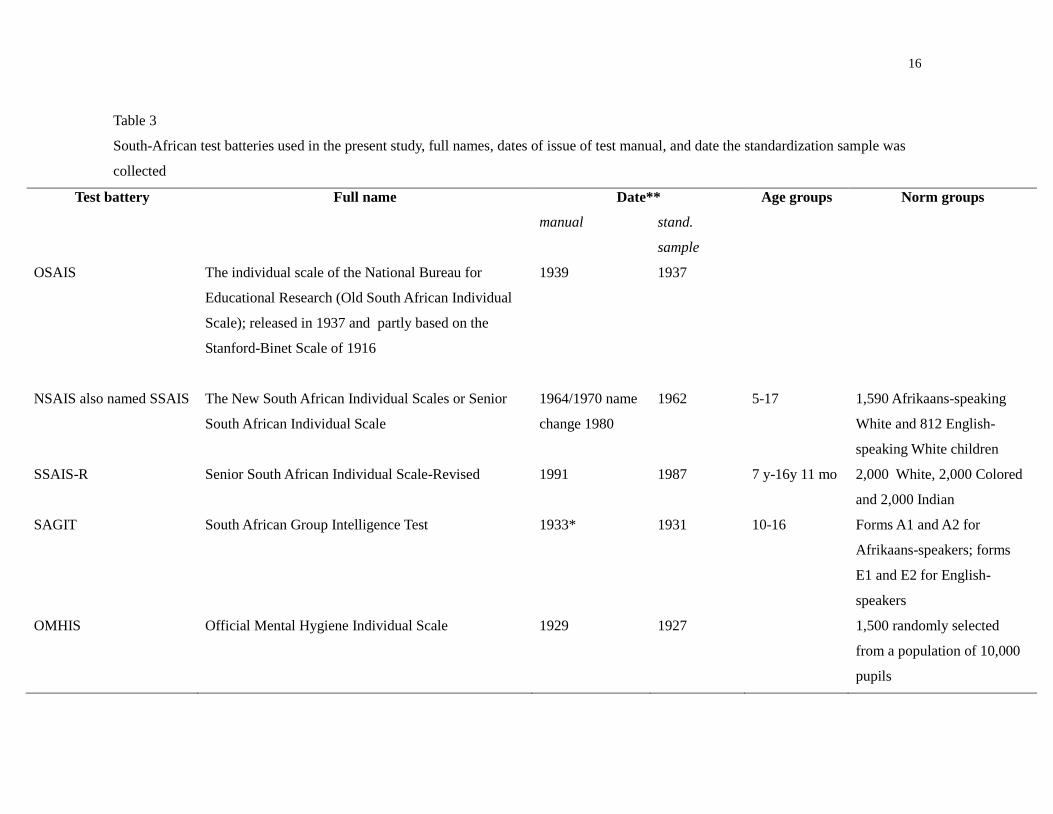
Table 3
South-African test batteries used in the present study, full names, dates of issue of test manual, and date the standardization sample was
collected
Test battery Full name Date** Age groups Norm groups
manual stand.
sample
OSAIS The individual scale of the National Bureau for
Educational Research (Old South African Individual
Scale); released in 1937 and partly based on the
Stanford-Binet Scale of 1916
1939 1937
NSAIS also named SSAIS The New South African Individual Scales or Senior
South African Individual Scale
1964/1970 name
change 1980
1962 5-17 1,590 Afrikaans-speaking
White and 812 English-
speaking White children
SSAIS-R Senior South African Individual Scale-Revised 1991 1987 7 y-16y 11 mo 2,000 White, 2,000 Colored
and 2,000 Indian
SAGIT South African Group Intelligence Test
1933* 1931 10-16 Forms A1 and A2 for
Afrikaans-speakers; forms
E1 and E2 for English-
speakers
OMHIS Official Mental Hygiene Individual Scale 1929 1927 1,500 randomly selected
from a population of 10,000
pupils

17
ISGIS Individual Scale of General intelligence for SA
1939 1937*
JSAIS Junior South African Individual Scale 1979 1976 3-7 1,795 stratified sample
GTISA junior Group Test for Indian South Africans
1968 1966 Standardized on Indian
pupils
GTISA intermediate Group Test for Indian South Africans 1983 1981 Standardized on Indian
pupils
GSAT junior General Scholastic Aptitude Test 1990 1989 9y0m-11y11m Rrepresentative of the White,
Colored, and Indian
populations
GSAT intermediate General Scholastic Aptitude Test 1987 1984 11y0m-
14y11m
Rrepresentative of the White,
Colored, and Indian
populations
GSAT senior General Scholastic Aptitude Test 1991 1989 14y0m -
18y6m
Rrepresentative of the White,
Colored, and Indian
populations
NSAGT junior New South African Group Test 1965 1951-1956;
1965
Standardized on White
school children
NSAGT intermediate New South African Group Test 1963 1951-1956;
1963
Standardized on White
school children
NSAGT senior New South African Group Test 1965 1951-1956;
1965
Standardized on White
school children
NB Group Test junior National Bureau Group Test for White pupils 1974 1972* 11-13
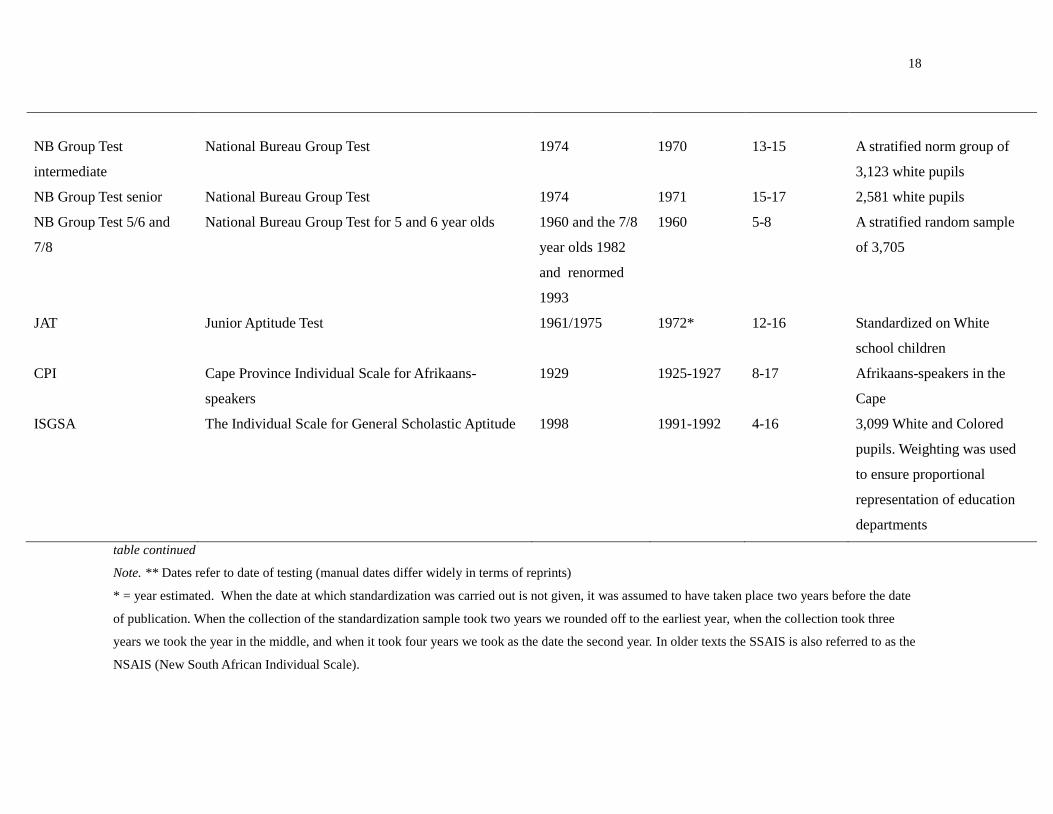
18
NB Group Test
intermediate
National Bureau Group Test 1974 1970 13-15 A stratified norm group of
3,123 white pupils
NB Group Test senior National Bureau Group Test 1974 1971 15-17 2,581 white pupils
NB Group Test 5/6 and
7/8
National Bureau Group Test for 5 and 6 year olds
1960 and the 7/8
year olds 1982
and renormed
1993
1960 5-8 A stratified random sample
of 3,705
JAT Junior Aptitude Test 1961/1975 1972* 12-16 Standardized on White
school children
CPI Cape Province Individual Scale for Afrikaans-
speakers
1929 1925-1927 8-17 Afrikaans-speakers in the
Cape
ISGSA The Individual Scale for General Scholastic Aptitude
1998 1991-1992 4-16 3,099 White and Colored
pupils. Weighting was used
to ensure proportional
representation of education
departments
table continued
Note. ** Dates refer to date of testing (manual dates differ widely in terms of reprints)
* = year estimated. When the date at which standardization was carried out is not given, it was assumed to have taken place two years before the date
of publication. When the collection of the standardization sample took two years we rounded off to the earliest year, when the collection took three
years we took the year in the middle, and when it took four years we took as the date the second year. In older texts the SSAIS is also referred to as the
NSAIS (New South African Individual Scale).

19
Table 4
International test batteries standardized in South Africa and used in the present study, full names, dates of issue of test manual, and date
the standardization sample was collected
Test battery Full name Date** Age group Norm group
manual stand.
sample
SAWAIS South African Wechsler-Bellevue Adult intelligence
Scale
1962 1958 18-59 2,761 volunteers
WAIS III Wechsler Adult Intelligence Scale III 2001 1998 16-69 1,300; all four race groups
(25% from each group)
Griffiths Griffiths Mental Development Scales (translated)
1986 1970*
Note. ** Dates refer to date of testing (manual dates differ widely in terms of reprints)
* = year estimated. When the date at which standardization was carried out is not given, it was assumed to have taken place two years before the date of publication.
When the collection of the standardization sample took two years we rounded off to the earliest year, when the collection took three years we took the year in the middle,
and when it took four years we took as the date the second year.

20
Table 5 Comparable White groups taking the same test with several years in between by test battery
Test Year born Year sample Gap IQ score Gain pd
NSAGT Senior (1951-
1956) 1953 (Verster &
Prinsloo in Irvine & Berry,
1988)
1952 1965 12 years 103.04 2.53
NSAGT Junior (1951-
1956) 1953 (van Eeden &
Visser, 1992)
1971-1980 1987 34 years 106.59 1.94
NSAGT Intermediate
(1951-1956) 1953 (van
Eeden & Visser, 1992)
1971-1980 1987 34 years 109.03 2.66
NSAGT Senior (1951-
1956) 1953 (van Eeden &
Visser, 1992)
1971-1980 1987 34 years 105.25 1.54
NSAGT Senior (1951-
1956) 1953 (Claassen,
1983)
1968 1981 28 years 98.75 -.47

21
Table 6 Same groups taking different tests at a specific time
Test Global IQ scores Gap Gain per decade
Sample of Whites tested in 1987 aged 7-16 born 1971-1980
NSAGT junior (1953) & SSAIS-R (1987) (van
Eeden & Visser, 1992)
106.59 & 101.59 34 years 1.47
NSAGT intermediate (1953) & SSAIS-R (1987)
(van Eeden & Visser, 1992)
109.03 & 102.48 34 years 1.92
Sample of Whites tested in 1987 aged 6-14 born 1973-1981
OSAIS (1937) & JSAIS (1976) (Robinson &
Boshoff, 1990)
104.8 & 95.8 39 years 2.3
OSAIS (1937) & SSAIS (1962) (Robinson &
Boshoff, 1990)
104.8 & 108.5 25 years -1.48
SSAIS (1962) & JSAIS (1976) (Robinson &
Boshoff, 1990)
108.5 & 95.8 14 years 9
OSAIS (1937) & NB 5/6 (1960) (Robinson &
Boshoff, 1990)
104.8 & 107.7 23 years -1.26
OSAIS (1937) & NB 7/8 (1960) (Robinson &
Boshoff, 1990)
104.8 & 109.5 23 years -2.04
OSAIS (1937) & GSAT Intermediate (1984)
(Robinson & Boshoff, 1990)
104.8 & 93.2 47 years 2.46
NB 5/6 (1960) & JSAIS (1976) (Robinson &
Boshoff, 1990)
107.7 & 95.8 16 years 7.43
NB 7/8 (1960) & JSAIS (1976) (Robinson &
Boshoff, 1990)
109.5 & 95.8 16 years 8.56
SSAIS (1962) & GSAT Intermediate (1984)
(Robinson & Boshoff, 1990)
108.5 & 93.2 22 years 6.95
OSAIS (1937) & JSAIS (1976) (Robinson &
Boshoff, 1990)
104.8 & 95.8 39 years 2.3
Sample of Whites tested in 1982 aged 3-7 born 1975-1979
Griffiths (1970) & JSAIS (1976) (Luiz & Heimes
in van Eeden, Robinson & Posthuma, 1994)
105.81 & 100.97 6 years 8.07
Sample of Indians tested in 1989 aged 15 born 1973:
GTISA Junior (1966) & GTISA Intermediate
(1981) ( Claassen, De Beer, Hugo, & Meyer, 1991).
110.71 & 108.35 15 years 1.57
22
Table 7
Gains or loss per decade by group using the data from Table 5 and Table 6
Group Table 5 Table 6 Combined
Whites 1.64 3.51 2.57
Indians 1.57 1.57
Note. When there are two estimates for a group the unweighted average is given in the last column.

23
Table 8 English and Afrikaans differences ordered by year of publication of study and according to year of birth with positive group
differences denoting higher scores for English-speaking
Study
Average year born Year sample Test N Afr. N Eng Diff
verbal
Diff
perf
Diff IQ
Olckers (1950) Φ 1938 1950 S.A.
Group
Test
630 1,170 n.r. n.r. 7
Morkel (1950) Φ Approx 1932 1950 Mental
alertness
500 502 n.r. n.r. 1.8
Biesheuvel &
Liddicoat (1959) **
1896 1950 SAWAIS 45 68 14.78 17.04 16
1901 1950 SAWAIS 110 86 12.71 11.87 12.3
1906 1950 SAWAIS 138 99 10.32 12.95 11.6
1911 1950 SAWAIS 175 120 5.95 5.85 5.9
1916 1950 SAWAIS 226 149 7.39 8.18 7.8
1921 1950 SAWAIS 222 148 9 8.74 8.9
1926 1950 SAWAIS 227 152 5.32 8 6.7
1931 1950 SAWAIS 240 160 6.62 8.76 7.7
1936 1950 SAWAIS 240 156 7.92 9.21 8.5
Biesheuvel (1952b) 1930? (not stated) 1950 RPM n.r. n.r. 7.5
Langenhoven (1957) Φ 1941? (not stated) 1954 NSAGT n.r. 99 n.r
TALENT ** Φ 1952 1965 NSAGT 40,900 21,129 5.17 7.44 6.34

24
TALENT ** Φ 1952 1965 JAT 40,767 21,083 n.r n.r. 2.77
TALENT ** Φ 1952 1967 SAT 7,071 4,719 3.18 3.18
Cudeck & Claasen
(1983)
1969 1981 NSAGT-
G
171 319 n.r. n.r. 5.0
Claassen (1983) 1968 1981 NSAGT
Int.
786 1,266 5.77 -2.4 1.5
Luiz & Heimes (1994);
Robinson (1994)
1974 1981 JSAIS 90 32 0.15 2.67 1.24
Claassen (1990)** 1970-1972 1984 GSAT 215 299 4.21 4.05 3.12
GSAT Manual (1990)
**
1977 1988 GSAT
Junior
1,963 1,635 1.73 3.06 2.52
Van Eeden (1991) ** 1970 1987 SSAIS-R 2,967 1,709 5.7 5.1 5.25
Claassen et al. (2001) 1929-1984 1999 WAIS-III 97 70 4.97 1.1 3.04*
table continued
Note. * For the study of Claassen et al. (2001) the difference in IQ was computed as the mean of the difference in verbal and the difference in
performance.
** Denotes a representative data set.
Φ Cited in Verster and Prinsloo (1988)
Morkel (1950) does not give the effect size, but reports that the effects are significant, so we conservatively choose a value of 0.05 for the significance
coefficient. We computed the effect size, using the formula
d = √ f(n1 + n2)/n1xn2)(n1 + n2)/n1 + n2 – 2). F(1, 1002) at p < 0.05 yields a value of 3.84 (f is based on the two degrees of freedom: sample size and
number of groups). Therefore√3.84(0.003992)(1.002) = 0.12 SD.

25
W-B = Wechsler Bellevue; NSAGT Int. = NSAGT Intermediate Biesheuvel & Liddicoat (1959) report data separated for males and females, which we
combined. On page 49 of Claassen’s (1983) document he states that for his sample E, he cannot be sure how representative the sample is, because it is
only representative of school-going 13 year olds in urban areas who are White. Therefore we did not use this subsample for our computations.
26
Table 9 Comparable White groups taking the same test with several years in between by test battery (subtest level)
Test Year born Year sample Gap VIQ NV IQ Vgpd NVgpd
NSAGT Senior (1951-
1956) 1953 (Verster &
Prinsloo in Irvine &
Berry, 1988)
1952 1965 12 years 102.17 104.52 1.82 3.76
NSAGT Junior (1951-
1956) 1953 (van Eeden &
Visser, 1992)
1971-1980 1987 34 years 104.85 107.75 1.42 2.27
NSAGT Intermediate
(1951-1956) 1953 (van
Eeden & Visser, 1992)
1971-1980 1987 34 years 106.19 110.62 1.82 3.12
NSAGT Senior (1951-
1956) 1953 (van Eeden &
Visser, 1992)
1971-1980 1987 34 years 102.6 107.54 0.76 2.21
NSAGT Senior (1951-
1956) 1953 (Claassen,
1983)
1968 1981 28 years 96.76 100.07 -1.15 -

27
Table 10 Same groups taking different tests at a specific time (subtest level)
Test VIQ NVIQ Gap Vgpd NVgpd
Sample of Whites tested in 1987 aged 7-16 born 1971-1980
NSAGT junior (1953) & SSAIS-R (1987) (van
Eeden & Visser, 1992)
104.85 & 101.78 107.75 & 100.78 34 years 0.9 2.05
NSAGT intermediate (1953) & SSAIS-R (1987)
(van Eeden & Visser, 1992)
106.19 & 102.59 110.62 & 101.54 34 years 1.05 2.67
Sample of Whites tested in 1987 aged 6-14 born 1973-1981
SSAIS (1962) & JSAIS (1976) (Robinson &
Boshoff, 1990)
106.3 & 97.5 109.5 & 96.7 14 years 6.28 9.14
SSAIS (1962) & GSAT Intermediate (1984)
(Robinson & Boshoff, 1990)
106.3 & 92.3 109.5 & 94.5 22 years 6.36 6.81

28
Table 11 Gain or loss per decade for Whites using data from Table 9 and Table 10
Table 9 Table 10 Combined
VIQ NVIQ VIQ NVIQ VIQ NVIQ
0.93 2.84 3.64 5.16 2.28 4.00

29
Figure 1
Score differences between English-speaking and Afrikaans-speaking South-Africans using only robust data sets samples.
Note. We used all representative datasets: the data from Biesheuvel and Liddicoat (1959); the Talent data for 1952 and 1965 are not independent, so we

30
choose the data using the NSAGT – a classical IQ test – over the data using the JAT – which is an aptitude test; the NSAGT also has the largest sample
size; the Talent data for 1952 and 1967; the data from the GSAT manual Claassen et al (1990) ; the data from Claassen et al (1991); and the data from
van Eeden (1991).
31
Figure 2
Score differences between English-speaking and Afrikaans-speaking South Africans using all samples
Note. We used all data including data for which we only had information like standard deviations, here-say, and our own averaging out of data where

32
no full scales were available; in other words everything in the Table above except three data sets (the one outlier; the repeat data set of Biesheuvel and
the Claassen et al. set (1990) because the sample was born between 1929-1984 – leading to uncertainty as to which date to take).

33
References
Biesheuvel, S. (1952a). Personnel selection tests for Africans. South African Journal of Science, 49, 3-12.
Biesheuvel, S. (1952b). The nation’s intelligence and its measurement. South African Journal of Science, 49,
120-138.
Biesheuvel, S. & Liddicoat, R. (1959). The effects of cultural factors in intelligence-test performance.
Journal of the National Institute for Personnel Research, 8, 3-14.
Bradmetz, J., & Mathy, F. (2006). An estimate of the Flynn effect: Changes in IQ and subtest gains of 10-yr-
old French children between 1965 and 1988. Psychological Reports, 99, 743 – 746.
Ceci, S.J. (1991). How much does schooling influence general intelligence and its cognitive components? A
reassessment of the evidence. Developmental Psychology, 27, 703-722.
Claassen, N.C.W. (1983). The functioning of the NSAGT in various population groups. Unpublished MA
thesis, University of Pretoria, South Africa.
Claassen, N.C.W. (1990). Die meting van intelligensie in verskillende groepe met die Algemene Skolastiese
Aanlegtoets (ASAT). [The measurement of intelligence in different groups with the Geneal
Scholastic Ability Test (GSAT)] South Africa, Pretoria: Human Sciences Research Council.
Claassen, N.C.W. (1997). Cultural differences, politics and test bias in South Africa. European Review of
Applied Psychology, 47, 297-307.
Claassen, N.C.W., De Beer, M., Hugo, H.L.E. & Meyer, H.M. (1991). Manual for the General Scholastic
Aptitude Test (GSAT) Senior Series. South Africa, Pretoria: Human Sciences Research Council.
Claassen, N.C.W., Krynauw, A.H., Paterson, H. & wa ga Mathe, M. (2001). A standardisation of the WAIS-
III for English-speaking South Africans. Pretoria: Human Sciences Research Council.
Claassen, N.C.W., Van Niekerk, H.A., & Kotzé, M.M. (1990). Manual for the General Scholastic Aptitude
Test (GSAT) Junior Series. Pretoria: Human Sciences Research Council.
Crawford-Nutt, D.H. (1976). Are Black scores on Ravens’ Standard Progrewssive Matrices an artifact of
method of test presesntation? Psychololgia Africana, 16, 201-206.
Crawford-Nutt, D.H. (1977). The effect of educational level on the test scores of people in South Africa.
Psychololgia Africana, 17, 49-59.
Cudeck, R. & Claassen, N. (1983). Structural equivalence of an intelligence test for two lanuaguage groups.
South African jurnal of psychology, 13, 1-5.
Daley, T., Whaley, S., Sigman, M., Espinosa, M., & Neumann, C. (2003). IQ on the rise: The Flynn effect in
rural Kenyan children. Psychological Science, 14, 215 – 219.
Dent, G..R. (1949). An investigation of certain aspects of Bantu intelligence. South Africa, Pretoria: National

34
Bureau of Educational and Social Research.
Department of Education (2008). Education Statistics in South Africa 2006. South Africa, Pretoria:
Department of Education.
Fick, M.L (1929). Intelligence test results of poor White, native (Zulu), Colored and Indian school children
and the educational and social implications. South African journal of science, 26, 904-920.
Fick, M.L (1939). An individual scale of general intelligence for South Africa. Pretoria: SA Council for
educational and social research.
Flynn, J. R. (1984). The mean of IQ of Americans: Massive gains 1932 to 1978. Psychological Bulletin, 95,
29-51.
Flynn, J. R. (1987). Massive IQ gains in 14 nations: What IQ tests really measure. Psychological Bulletin,
101, 171-191.
Flynn, J.R. (2006). Efeito Flynn: Repensando a inteligência e seus efeitos (The Flynn effect: Rethinking
intelligence and what effects it). In C. F.-M. R. Colom (Ed.), Introdução a` Psicologia das
Diferenças Individuais (pp. 387–411). Brazil, Porto Alegre: ArtMed.
Flynn, J. R. (2007). What is intelligence? Beyond the Flynn Effect. Cambridge: Cambridge University Press.
Flynn, J.R. (2009a). Requiem for nutrition as the cause of IQ gains: Raven's gains in Britain 1938–2008.
Economics & Human Biology, 7, 18-27.
Flynn, J.R. (2009b). The WAIS-III and WAIS-IV: Daubert Motions Favor the Certainly False over the
Approximately True. Applied Neuropsychology, 16(2), 98-104.
Foxcroft, C.D. & Aston, S. (2006). Critically examining language bias in the South African adaptation of the
WAIS-III. South African journal of psychology, 32, 97-102.
Furnham, A., Mkhize, N.& Mndaweni, T. (2004). Indian and isiZulu-speaking South African parents'
estimates of their own and their children's intelligence. South African Journal of Psychology,34,
364-385.
Huysamen, G.K. (1996). Psychological measurement: an introduction with South African examples. South
Africa, Pretoria: van Schaik.
Irvine, S.H. (1969). Figural tests of reasoning in Africa: studies in the use of Raven’s Progressive Matrices
across cultures. International journal of psychology, 4, 217-228.
Jensen, A.R. (1998). The g factor : The science of mental ability. Conneticut : Praeger.
Kamin, L.J. (2006). African IQ and mental retardation. South African Journal of Psychology, 36, 1-9.
Khaleefa,O., Abdelwahid, S.B., Abdulradi, F.
& Lynn, R. (2008). The increase of intelligence in Sudan
1964–2006. Personality and Individual Differences, 45, 412-413.

35
Knoetze, J., Bass, N.& Steele, G. (2005). The Raven's Colored Progressive Matrices : Pilot norms for
isiXhosa-speaking primary school learners in peri-urban Eastern Cape. South African Journal of
Psychology, 35, 175-194.
Liddicoat, R. & Roberts, A.O.H. (1962). Interim standardisation of the South African version of the
Wchsler-Bellevue adult intelligence test. Psychologia Africana, 9, 273-285.
Luiz, D.M. & Heimes, L. (1994). A comparison between the junior South African Individual Scales (JSAIS)
and the Griffiths Scales of Mental Development (Griffiths Scales). In R. van Eeden, M. Robinson &
A.B. Posthuma (Eds), Studies on South African Individual Intelligence Scales (pp. 2-13). South
Africa, Pretoria: HSRC.
Lynn, R., (2009a). Fluid intelligence but not vocabulary has increased in Britain, 1979-2008. Intelligence,
37, 249-255.
Lynn, R. (2009b). What has caused the Flynn Effect? Secular increases in the Development Quotients of
infants. Intelligence, 37, 16-24.
Lynn, R. & Owen, K. (1994). Spearman’s hypothesis and test score differences between Whites, Indians and
Blacks in South Africa. The journal of General Psychology, 121, 27-36.
Meisenberg, G., Lawless, E., Lambert, E., & Newton, A. (2006). The social ecology of intelligence on a
Caribbean Island. Mankind Quarterly, 46, 395 – 433.
Must,O., te Nijenhuis, J., Must, A. & van Vianen, E.M. (2009). Comparability of IQ scores over time.
Intellligence, 37, 25-33.
Owen, K. (1992). The suitability of Raven’s Standard Progressive Matrices for various groups in South
Africa. Personality and individual differences, 13(2), 149-159.
Pressey, S.L. & Teter, G.F. (1919). A comparison of Colored and White children by means of a group scale
of intelligence. Journal of Applied Psychology, 3, 277-282.
Richter, L.M., Griesel, R.D. & Wortley, M.E. (1989). The Draw-a-Man test: A 50 year perspective on
drawings done by black South African children. South African Journal of Psychology, 19, 1-5.
Robinson, M. & Boshoff, J.S. (1990). n’ Vergelyking van psigometriese eienskappe van die JSAIS, die SSAIS
en die OSAIS. [A comparison of psychometric properties of the JSAIS, the SAIS and the OSAIS]
Pretoria: HSRC.
Rushton, J.P. (2001). Black-White differences on the g-factor in South Africa: A ‘Jensen Effect’ on the
Wechsler Intelligence Scale for Children-revised. Personality and Individual Differences, 31, 1227-
1232.
Rushton, J.P. (2008). Testing the genetic hypothesis of group mean IQ differences in South Africa: Racial

36
admixture and cross-situational consistency. Personality and Individual Differences, 44, 768–776.
Rushton, J.P. & Skuy, M. (2000). Performance on Raven’s Matrices by African and White university
students in South Africa. Intelligence, 28, 251-265.
Shayer, M., Ginsburg, D., & Coe, R. (2007). Thirty years on – a large anti-Flynn effect? The Piagetian test
Volume & Heaviness norms 1975 – 2003. British Journal of Educational Psychology, 77, 25 -71.
Shuttleworth-Edwards, A.B., Kemp, R.D., Rust, A.L., Muirhead, J.G.L., Hartman, N.P. & Radloff, S.E.
(2004). Cross-cultural effects on IQ test performance: A review and preliminary normative
indications on WAIS-III test performance. Journal of Clinical and Experimental Neuropsychology,
26, 903-920.
Skuy, M., Gewer, A., Osrin, Y., Khunou, D., Fridjhon, P. & Rushton, J.P. (2002). Effects of mediated
learning expereince on Raven’s matrices scores of African and non-African university students in
South Africa. Intelligence, 30, 221-232.
Smit, G.J. (1996). Psychometrics: Aspects of measurement. South Africa, Pretoria: Kagiso.
Sundet, J.M., Barlaug, D., & Torjussen, T. (2004). The end of the Flynn effect? A study trends in mean
intelligence test scores of Norwegian conscripts during half a century. Intelligence, 32, 349-362.
Teasdale, T., & Owen, D. (2008). Secular declines in cognitive test scores: A reversal of the Flynn Effect.
Intelligence, 36, 121-126.
van der Berg, A.R. (1989). Intelligence tests. In K. Oen & J.J. Taljaard (Eds.), Handbook for the use of
psychological and scholastic tests of IPER and NIPR (pp.83-135). Pretoria: Human Sciences
Research Council.
van Eeden, R. (1991). Manual for the Senior South African Individual Scale – Revised (SSAIS-R). South
Africa, Pretoria: Human Sciences Research Council.
van Eeden, R. & Visser, D. (1992). The validity of the Senior South African Individual Scale-Revised
9SSAIS-R) for different population groups. South African journal of psychology, 22(3), 163-171.
van Eeden, R., de Beer, M. & Coetzee, C.H. (2001). Cognitive ability, learning potential, and personality
traits as predictors of academic achievement by engineering and other science and technology
students. South African Journal of Higher Education, 15, 171-179.
Verster, J.M. & Prinsloo, R.J. (1988). The diminishing test performance gap between English speakers and
Afrikaans speakers in South Africa. In Irvine, S.H. & Berry, J.W. (eds.), Human abilities in cultural
context, (pp.534-559). Cambridge: Cambridge University Press.