the food bank of central new york - ucanr
TRANSCRIPT

1
The Food Bank of Central New York
An Evaluation of the “No Soda and No Candy” Donation Policy
And Guests’ Food Preferences
Submitted by:
Elizabeth Campbell, MA, RD
Karen Webb, PhD, MPH
Patricia Crawford, DrPH, RD
University of California at Berkeley
The Dr. Robert C and Veronica Atkins
Center for Weight and Health
August 7, 2009
2
Table of Contents
I. INTRODUCTION AND BACKGROUND ................................................................. 4
II. EVALUATION OBJECTIVES .................................................................................. 7
III. METHODS ................................................................................................................. 7
Objective 1: Food Bank Donated Inventory Analysis ............................................... 7
Study Design ............................................................................................................... 7
Data Analysis .............................................................................................................. 8
Objectives 2 and 3: Food Pantry Guest and Director Interviews ............................ 8
Study Design ............................................................................................................... 8
Data Analysis ............................................................................................................ 10
IV. RESULTS .................................................................................................................. 10
Objective 1: Food Bank Donated Inventory Analysis ............................................. 10
Food Bank Inventory Data........................................................................................ 10
Trends in Selected Groups of Donated Food ...................................................... 10
Trends in Donations of Soda, Candy, and Sweets .............................................. 12
Trends in Donated Beverages .............................................................................. 13
Trends in Donations of Soda and Candy, 2003-08 ............................................. 16
Key Informant Interviews .................................................................................... 17
Objectives 2 and 3: Food Pantry Guest and Director Interviews .......................... 20
Findings from Guests’ Food Preference Survey ....................................................... 20
Characteristics of Respondents ........................................................................... 20
Guests’ Considerations for Food Choices at Food Pantries .............................. 22
Guests’ Critique of Food Pantry Performance ................................................... 23
Mean Rank Scores of Food Pantry Items ........................................................... 24
Guests’ Level of Importance for Foods to Receive at a Food Pantry ................ 25
Differences in Food Preferences: Rural vs. Urban Guests ................................ 26
Types of Fruit and Vegetables Preferred ............................................................ 27
Additional Specific Food Preferences Identified by Guests ............................... 27
Specific Items Preferred by Guests in Rank Order ............................................. 28
Findings from Food Pantry Directors’ Food Preference Survey ............................. 29
Characteristics of Directors ................................................................................. 29
Directors’ Perceptions of Guests’ Considerations .............................................. 30
Mean Rank Scores ............................................................................................... 31
Directors’ Perception of’ Level of Importance for Foods to Receive at a Food
Pantry ................................................................................................................... 32
Directors Perceptions vs. Guests’ Stated Food Preferences ............................... 33
Directors Perceptions vs. Guests’ Stated Preferences by Food Item ................. 34
Directors Perceptions vs. Guests’ Stated Considerations in selecting foods ..... 35
Directors’ Perspectives of Food Pantry Distribution.......................................... 36
Barriers Identified by Directors ........................................................................... 36
Reported Number of Days a Pantry Bag Lasts: Guests vs. Directors ................ 37
Findings from Food Pantry Inventory Analysis........................................................ 38
3
Summary of Food Pantry Inventory ................................................................... 38
Milk Offered at Food Pantries............................................................................. 39
Fresh Produce ...................................................................................................... 39
Specific Fresh Produce offered on Day of Data Collection ............................... 40
Select Findings from Food Pantry Bag Analysis ...................................................... 41
Guests that Preferred Fresh Fruit: Offered vs. Chosen ..................................... 41
Guests that Preferred Fresh Vegetables: Offered vs. Chosen ............................ 42
V. DISCUSSION AND CONCLUSIONS ..................................................................... 43
Objective 1: Food Bank Donated Inventory Analysis ............................................. 43
Objectives 2 and 3: Food Pantry Guest and Director Interviews .......................... 44
VI. RECOMMENDATIONS ......................................................................................... 46
Food Bank of Central New York ............................................................................... 46
Emergency Food Network in General ...................................................................... 46
VII. REFERENCES ........................................................................................................ 47
APPENDIX 1. Inventory Classification System ........................................................... 49
APPENDIX 2. Food Pantry Guest Food Preference Survey ...................................... 50
APPENDIX 3. Food Pantry Director Survey ............................................................... 62
APPENDIX 4. Food Pantry Inventory Checklist......................................................... 73
APPENDIX 5. Food Pantry Bag Checklist ................................................................... 75

4
I. INTRODUCTION AND BACKGROUND
Food insecurity is a growing concern in the United States, particularly in view of the
current economic recession and rising food prices. An estimated 12% of U.S. residents
have incomes below the federal poverty line (US Census Bureau 2007), and in the last
national survey, an estimated 11% of the U.S. population were considered food insecure
(Nord 2007).
Food insecurity, as defined by the United States Department of Agriculture (USDA),
occurs when a household does not have access to enough food for active, healthy living.
In households with very low food security, at least one household member over the
course of a year has a reduced food intake and their normal eating patterns are disrupted
due to a lack of resources. Food insecure individuals and households often maximize
their monthly food dollars by supplementing food supplies through the Emergency Food
Network (EFN).
The EFN is described by Feeding America – the nation’s food bank network – as a sector
of the food system that utilizes donations of food and money from corporations,
government funding, private donations, and local and national distribution networks to
serve over 25 million food insecure Americans every year. The network consists of over
200 food banks that glean, purchase, store, and distribute foods to their subsidiary
emergency food programs (EFPs) such as food pantries, soup kitchens, and shelters.
While food banks are the equivalent in the commercial food distribution system of
wholesalers (receiving, storing and distributing food to EFPs), EFPs are equivalent to
food retailers in that they receive food from a variety of sources, including but not limited
to food banks, and distribute foods directly to guests. Thus, EFPs are responsible for
direct service to food insecure guests.
Food banks were uncommon prior to the1980s; they existed to aid in disaster relief and
emergency household situations and were relatively small and limited in number
(Poppendick 1999). During the past two decades, the food bank network has grown
5
considerably, and now serves many individuals who suffer from chronic food insecurity.
According to Feeding America (Cohen 2006), since 2001 65% of pantries, 61% of soup
kitchens, and 52% of shelters have seen an increase in the number of guests who come to
their programs; and, those programs reported that the food bank network is their largest
food supplier.
While food insecurity and the demand for emergency food continue to increase, the
nation is simultaneously facing an obesity epidemic. Food insecurity is associated with
poorer quality diets and obesity (Olsen 1999, Townsend 2001, and Adams 2003). Links
between food insecurity and obesity are not well understood, but it appears that one
contributor is the lower cost of energy-dense foods compared to their higher cost
nutrient-dense counterparts (Drewnowski 2007). Those with low incomes and limited
budgets that seek to minimize spending on food will aim to maximize calories for food
dollars spent. In addition, in recent years many food banks have seen increased donations
of energy-dense foods of minimal nutritional value. Indeed the food bank system partly
relies on donations, particularly those from large food producers and processors, and
nutritional quality may not be a key consideration in acceptance of donations by food
banks. There are disincentives for food banks to discriminate between types of foods and
beverages they accept because funding is associated with the number of pounds an
organization accepts and distributes throughout the fiscal year.
The role of food banks as major food suppliers to the chronically food insecure and
nutritionally vulnerable necessitates consideration of the nutritional impact of their food
donation and distribution policies and practices. While many food banks have become
interested in nutritional improvements, the FBCNY was at the forefront of this
movement. Prior to 2004, they were active in nutrition promotion by providing cooking
demos, recipes, and nutrition workshops; supporting community gardens in local
neighborhoods; educating guests about gardening; supporting farmers’ markets in low-
income neighborhoods; and, educating legislators on the important link between diet,
obesity, and food insecurity. On February 1, 2004, they adopted a “No Soda and No
Candy” Donation Policy —the first of its kind in the US—that banned all soda and candy

6
donations into their warehouse. Soda was defined as all carbonated beverages and candy
was defined as (but not limited to) the following food items: hard candy (lollipops, Jolly
Ranchers), gum, chocolate bars (not including meal replacement bars or dietary
supplements), and soft candy (caramels, wrapped chocolates, taffy, licorice, gum
products, gummy bears). The FBCNY determined that they would focus on the
procurement and distribution of healthier foods such as fruits and vegetables—that are
more difficult for guests to access—rather than soda and candy.
A major criticism of the “No Soda and No Candy” policy from those in the Emergency
Food Network is that this approach limits the food choices of EFP guests. This is based
on the assumption that foods and beverages being solicited, donated, and ultimately
distributed through the EFPs are meeting guest demand. However, there is only very
limited evidence about what foods EFP guests would prefer to receive through food
banks and on what factors EFP directors base their decisions about what foods to
distribute . Studies suggest that guests want more fresh fruits and vegetables (Verpy
2003), but more information is needed on what types of foods and beverages guests
prefer to obtain from the EFP as well as what they prefer and can afford to buy. Such
information is required for both EFP and Food Bank administrators to understand the
needs of their guests and how to modify their policies and practices to support the health
and preferences of their guests.
Research on the nutritional quality of foods supplied through food banks is also limited,
but it appears that they are generally poor sources of vitamins A and C and calcium, and
that foods rich in these nutrients including fruit, vegetables and dairy products have
limited availability through EFPs (Akobundu 2004). The food and beverage preferences
of emergency food guests are not well known or understood.
Thus, the recent changes made to the food donation and distribution policy at the
FBCNY provided an excellent opportunity to examine the changes in the inventory, as
well as guest preferences and food pantry director perceptions, and barriers to providing
healthy foods.

7
II. EVALUATION OBJECTIVES
The UC Berkeley Center for Weight and Health (CWH) collaborated with the Food Bank
of Central New York (FBCNY) to:
Objective 1: Evaluate the impact of the FBCNY’s “No Soda and No Candy” policy on
the types of donated foods and beverages accepted by the FBCNY prior to and after
implementation of the policy.
Objective 2: Assess Emergency Food Program (EFP) guests’ preferences for foods and
beverages they would like to see available at the food pantry and factors that influence
their preferences including the extent to which they prefer to receive foods of high
nutritional quality.
Objective 3: Assess the EFP directors’ perceptions of guests’ food and beverage
preferences and the EFP directors’ perceptions of factors influencing their own decisions
about what foods and beverages to stock and distribute through EFPs.
This report describes the study design, methods, and results of these objectives.
III. METHODS
Objective 1: Food Bank Donated Inventory Analysis
Study Design
This study employed a pre-post design that assessed the impact of the FBCNY’s ‘No
Soda and No Candy Policy’ on the donated product mix available through the FBCNY as
measured during a one-year period prior to (February 1, 2003 to January 31, 2004) and a
two-year period after (February 1, 2004 to January 31, 2006) the policy introduction.
Additional soda and candy donation data from 2006-07 and 2007-08 was reviewed
following the preliminary analysis. Key informant interviews were conducted with
FBCNY staff including the food donor solicitor, director of food sourcing and nutrition,

8
finance director, and executive director to capture qualitative data regarding the
implementation of the policy and lessons learned.
Data Analysis
Data from the FBCNY’s electronic donation records were entered into a database. Each
food item on the inventory list was then classified into one of twelve food groups as
outlined by MyPyramid with the addition of the following groups: beverages, non-meat
proteins, non-dairy substitutes, snack foods, combination foods, condiments, and
miscellaneous. Foods in each group were categorized into subgroups based on their
nutritional profiles, e.g. sweetened beverages, diet beverages, etc. See Appendix 1 for
details. Total pounds of donated soda, candy, fruit, vegetables, meats, grains, and dairy
for each of the study years were compiled.
Objectives 2 and 3: Food Pantry Guest and Director Interviews
Study Design
A cross sectional design using an interviewer administered questionnaire was used to
gather information about EFP guests’ food preferences and EFP directors’ perceptions of
guests’ food and beverage preferences as well as factors influencing EFP directors’ food
selection process. Fifteen food pantries from the FBCNY service area were randomly
selected from all large and extra large, urban and rural (55% urban; 45% rural) programs
to reflect the ratio of urban to rural for all programs. All guests attending the programs
during open hours for one day at each pantry were approached to participate in the study.
A pilot study was conducted in December 2008 to test study methods and survey
questions. An interviewer administered questionnaire was used with 20 guests at two
food pantries from the FBCNY service area and included card sorts for ranking food
preferences, a Likert scale used to determine importance of receiving specific food items,
and questions regarding considerations in choosing foods received at the food pantry.
A similar Food Pantry Worker/Director questionnaire was administered to the two
directors at the selected programs. Surveyors from the FBCNY and CWH reviewed the
9
survey questions and the administration process and revised questionnaires based on
feedback from this review process.
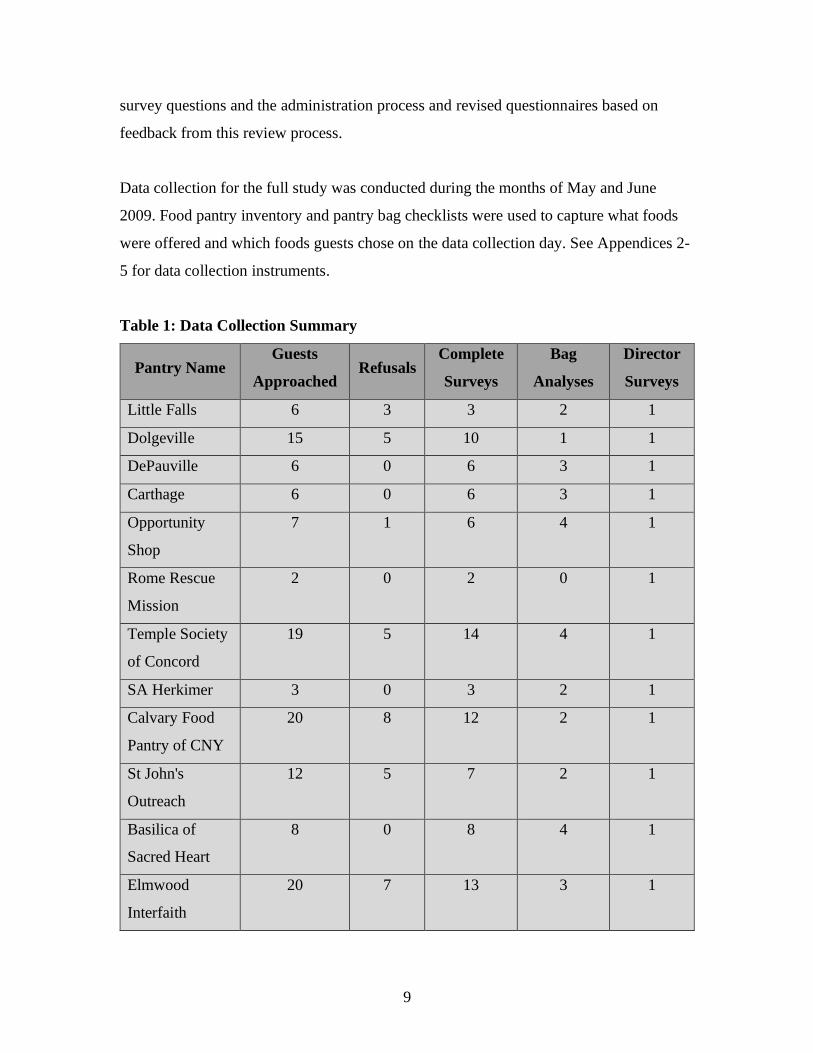
Data collection for the full study was conducted during the months of May and June
2009. Food pantry inventory and pantry bag checklists were used to capture what foods
were offered and which foods guests chose on the data collection day. See Appendices 2-
5 for data collection instruments.
Table 1: Data Collection Summary
Pantry Name Guests
Approached Refusals
Complete
Surveys
Bag
Analyses
Director
Surveys
Little Falls 6 3 3 2 1
Dolgeville 15 5 10 1 1
DePauville 6 0 6 3 1
Carthage 6 0 6 3 1
Opportunity
Shop
7 1 6 4 1
Rome Rescue
Mission
2 0 2 0 1
Temple Society
of Concord
19 5 14 4 1
SA Herkimer 3 0 3 2 1
Calvary Food
Pantry of CNY
20 8 12 2 1
St John's
Outreach
12 5 7 2 1
Basilica of
Sacred Heart
8 0 8 4 1
Elmwood
Interfaith
20 7 13 3 1

10
Pantry Name Guests
Approached Refusals
Complete
Surveys
Bag
Analyses
Director
Surveys
Helping Hands 7 0 7 2 1
CCCC Roots
and Wings
11 1 10 5 1
Canton
Neighborhood
Center
9 0 9 6 1
Totals 151 35 116 43 15
Data Analysis
Data from guest and director interviews and food pantry bag and food pantry inventory
checklists were entered into an EpiData database and analyzed using SAS. Descriptive
statistics were analyzed for all responses. Guest preferences were categorized by food
group and average rank was determined for each food group. Differences in mean rank
for rural and urban food pantry guests were assessed by t-tests. Each food pantry
director’s ranking of foods and of considerations in selecting foods was compared to his
or her guests’ responses by a Spearman’s rank correlation to assess the extent to which
each director accurately matched their guests’ food preferences and considerations.
IV. RESULTS
Objective 1: Food Bank Donated Inventory Analysis
Food Bank Inventory Data
Trends in Selected Groups of Donated Food
Data were collected from the FBCNY inventory records for the following three time
periods: February 1, 2003 to January 31, 2004; February 1, 2004 to January 31, 2005; and
February 1, 2005 to January 31, 2006. Table 2 provides a breakdown of percent of total
poundage for each food group and subgroup in the evaluation objectives.

11
Table 2. Trends in Selected Foods Donated to FBCNY, 2003-2006
Food
Groups
Classification
Sub Group
2003-04
Total
Pounds
2003-04
(% of
Total
pounds)
2004-05
Total
Pounds
2004-05
(% of
Total
pounds)
2005-06
Total
Pounds
2005-06
(% of
Total
pounds)
All Snack
Foods 400,697 12% 250,452 8% 140,837 4%
Candy 19,407 0.6% 30,790 1% 18,739 0.6%
Sweets/Pastries 122,636 4% 84,350 3% 114,215 3%
All
Beverages 272,038 8% 335,069 10% 427,486 13%
Sweetened
Beverages 187,773 5% 276,349 9% 393,750 12%
Soda 75,313 2% 126,428 4% 10,230 0.3%
All
Vegetables 760,560 22% 784,974 24% 588,215 18%
Fresh
Vegetables 552,173 16% 690,955 22% 448,916 13%
All Fruit 168,310 5% 209,423 7% 160,324 5%
Fresh Fruit 57 <0% 20,839 0.7% 19,723 0.6%
Total
Donations 3,469,744 3,210,760 3,338,657
(Columns do not add to 100%)
• Data illustrated in Figure 1 show that vegetables comprise a significant amount of
donated product ranging from 18% to 24% of total pounds throughout all three
years. There was a slight increase in the total vegetable donations in the year the
policy was implemented but a substantial reduction was observed in year three.
Whether these changes reflect usual year-to-year fluctuations or a change in
practices in soliciting foods, or other factors is not clear.
• A notable reduction in snack foods was observed from 12% to only 4% of total
pounds of donated food from one year before to two years after policy
implementation.
• Fruit donations remained consistently low throughout all three years.

12
• Data show a trend towards increasing amounts of donated beverages from 8% to
13% of total pounds of donated foods from one year prior to two years post
implementation.
Figure 1. Trends in Selected Groups of Donated Food to FBCNY, 2003-2006.
Trends in Donations of Soda, Candy, and Sweets
• As shown in Figure 2, soda donations decreased to less than 1% of total pounds of
donated foods (from 4%) between year 1 and year 3 of the study. This represents
a substantial decrease in the absolute quantity of soda available for distribution to
guests from approximately 75,000 pounds per year to about 10,000 pounds. Both
candy and soda donations actually spiked immediately following the policy
implementation.
• Candy donations were relatively low as a percent of total weight donated, and
although there was a decrease in the total pounds of candy donated from year 1 to
Trends in Selected Groups of Donated Food
February 1, 2003- January 31, 2006
All Vegetables
All Fruit
All BeveragesAll Snack Foods
All Grains
All MeatAll Dairy
0%
5%
10%
15%
20%
25%
30%
2003-04 2004-05 2005-06
Evaluation Period
Pe
rce
nt
of
To
tal P
ou
nd
s o
f D
on
ate
d F
oo
d All Vegetables
All Fruit
All Beverages
All Snack
FoodsAll Grains
All Meat
All Dairy

13
year 3, the percent of total donations did not change (0.6%, 1.0% and 0.6%)
between years 1 and 3.
• Although the “No Soda and No Candy” donation policy did not specifically target
sweets, there was a decrease from 4% to 3% of total pounds of donated sweets
(e.g. cookies, cakes, and donuts) from one year prior to two years post policy
implementation.
Figure 2. Trends in Donations of Soda, Candy, and Sweets to FBCNY, 2003-2006
Trends in Donated Beverages
• While soda donations decreased substantially two years after the policy was
introduced, there was a steady increase in sweetened beverage donations over the
study period (Figure 3).
Trends in Donations of Soda, Candy, and Sweets
February 1, 2003 - January 31, 2006
0%
1%
2%
3%
4%
5%
2003-04 2004-05 2005-06
Evaluation Period
Pe
rce
nt
of
To
tal P
ou
nd
s o
f D
on
ate
d F
oo
d
Candy
Soda
Sweets

14
• Sweetened beverages such as sports drinks and fruit drinks increased from 69% to
92% of total pounds of donated beverages from one year prior to two years post
policy implementation.
• Since soda has significantly more calories and sugar than most other sweetened
beverages (e.g. 150 calories and approximately 12 teaspoons of sugar per 12 oz
soda, versus 100 calories and approximately 7 teaspoons of sugar for a 12 oz
sports drink), the reduction in soda donations was an excellent first step towards
improving the nutrition quality of beverages distributed through the FBCNY.
• The increase in sweetened beverage donations, despite the significant drop in soda
donations, provides an opportunity to review the existing policy to examine the
possibility of further clarification and expansion of coverage to other sweetened
beverages.
• The Food Bank of Central New York appears to do an excellent job of soliciting
donations of fresh vegetables, which comprised 16%, 22%, and 13% of total
pounds of donated food over the three years of the study period, respectively
(Table 3).
• Fruit donations were low compared to vegetable donations, which contributed less
than 1% of total pounds of donated food.
• Soliciting fresh fruit donations of locally grown fruits, such as apples in the fall,
may be an area of opportunity for the food solicitor.

15
Figure 3. Trends in Donated Beverages to FBCNY, 2003-2006
Table 3: Percent of Total Pounds of Donated Fruits and Vegetables by Fresh,
Frozen, or Canned Categories
2003-04 2004-05 2005-06
Vegetables
Fresh 15.91% 21.52% 13.45%
Frozen 3.09% 0.54% 3.89%
Canned 2.92% 2.38% 0.29%
Fruit
Fresh 0.00% 0.65% 0.59%
Frozen 0.00% 0.00% 0.00%
Canned 4.85% 4.85% 4.21%
Diet
Unsweetened
Sweetened
0%
20%
40%
60%
80%
100%
Percent of Total
Pounds of Beverage
Donations
Trends in Donated Beverages to FBCNY
February 1, 2003 to January 31, 2006
2003-04
2004-05
2005-06

16
Trends in Donations of Soda and Candy, 2003-08
• As shown in Figure 4, after submission of the mid-year report, the FBCNY
provided soda and candy donation data from February 1, 2006 to January 31,
2008. No soda was received during that time period while only 12,120 pounds of
candy were accepted during 2006-07. No candy was accepted during 2007-08. It
appears that three years post policy implementation that soda and candy donations
have been eliminated.
Figure 4: Trends in Donations of Soda and Candy, 2003-08
Trends in Donations of Soda and Candy
February 1, 2003 - January 31, 2008
0%
1%
2%
3%
4%
5%
2003-04 2004-05 2005-06 2006-07 2007-08
Evaluation Period
Pe
rce
nt
of
To
tal P
ou
nd
s o
f D
on
ate
d F
oo
d
Candy
Soda
17
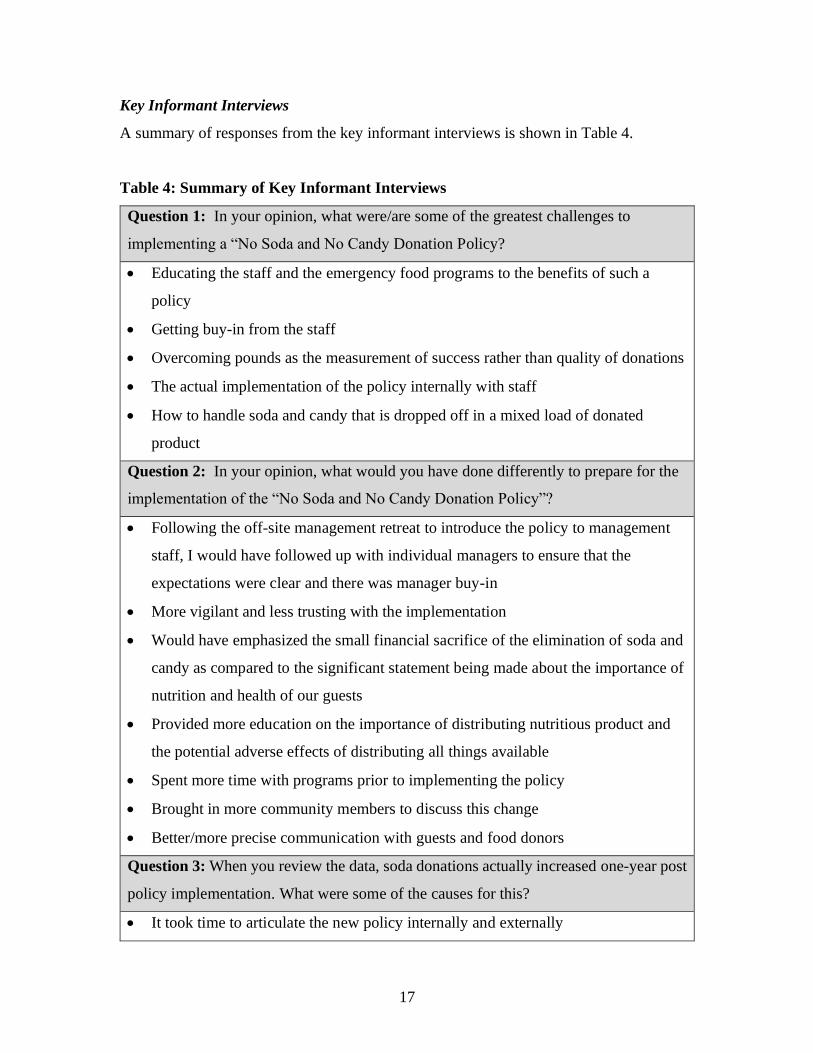
Key Informant Interviews
A summary of responses from the key informant interviews is shown in Table 4.
Table 4: Summary of Key Informant Interviews
Question 1: In your opinion, what were/are some of the greatest challenges to
implementing a “No Soda and No Candy Donation Policy?
• Educating the staff and the emergency food programs to the benefits of such a
policy
• Getting buy-in from the staff
• Overcoming pounds as the measurement of success rather than quality of donations
• The actual implementation of the policy internally with staff
• How to handle soda and candy that is dropped off in a mixed load of donated
product
Question 2: In your opinion, what would you have done differently to prepare for the
implementation of the “No Soda and No Candy Donation Policy”?
• Following the off-site management retreat to introduce the policy to management
staff, I would have followed up with individual managers to ensure that the
expectations were clear and there was manager buy-in
• More vigilant and less trusting with the implementation
• Would have emphasized the small financial sacrifice of the elimination of soda and
candy as compared to the significant statement being made about the importance of
nutrition and health of our guests
• Provided more education on the importance of distributing nutritious product and
the potential adverse effects of distributing all things available
• Spent more time with programs prior to implementing the policy
• Brought in more community members to discuss this change
• Better/more precise communication with guests and food donors
Question 3: When you review the data, soda donations actually increased one-year post
policy implementation. What were some of the causes for this?
• It took time to articulate the new policy internally and externally

18
• The policy was implemented as a new staff person was hired to manage donations
• There was a willful disregard of the policy by some good-intentioned employees who
did not agree with the policy
• There was an anticipated overproduction and influx of soda into the emergency food
system, which happened shortly after the Choice System was introduced
• It was very tempting to take in any product while donations seemed to decrease
nationally for those who bought into pounds as a measurement of success
• Not educating donors enough prior to the change in donation policy
• When we accepted a mixed load there was soda and candy---important to have a
policy to handle drop-offs
Question 4: Did you feel that there was a “champion” who helped push the policy
through? How important was that role to the implementation process?
• The dietitians on staff were the champions because they educated staff on health
issues, introduced the concept of measuring success by quality of donations, and
followed-up with issues throughout implementation
• The executive director was the champion because he supported the policy and
ideological shift, which gave it the legs it needed to move forward
• The food donor solicitor was the champion because he delivered the message to
donors through education and respectful dialogue
• The role of the champion(s) is essential to implementing organizational change
• Change is not easy, so it is key to have someone(s) who is committed to seeing the
change and can stand by the difficult times of a transition
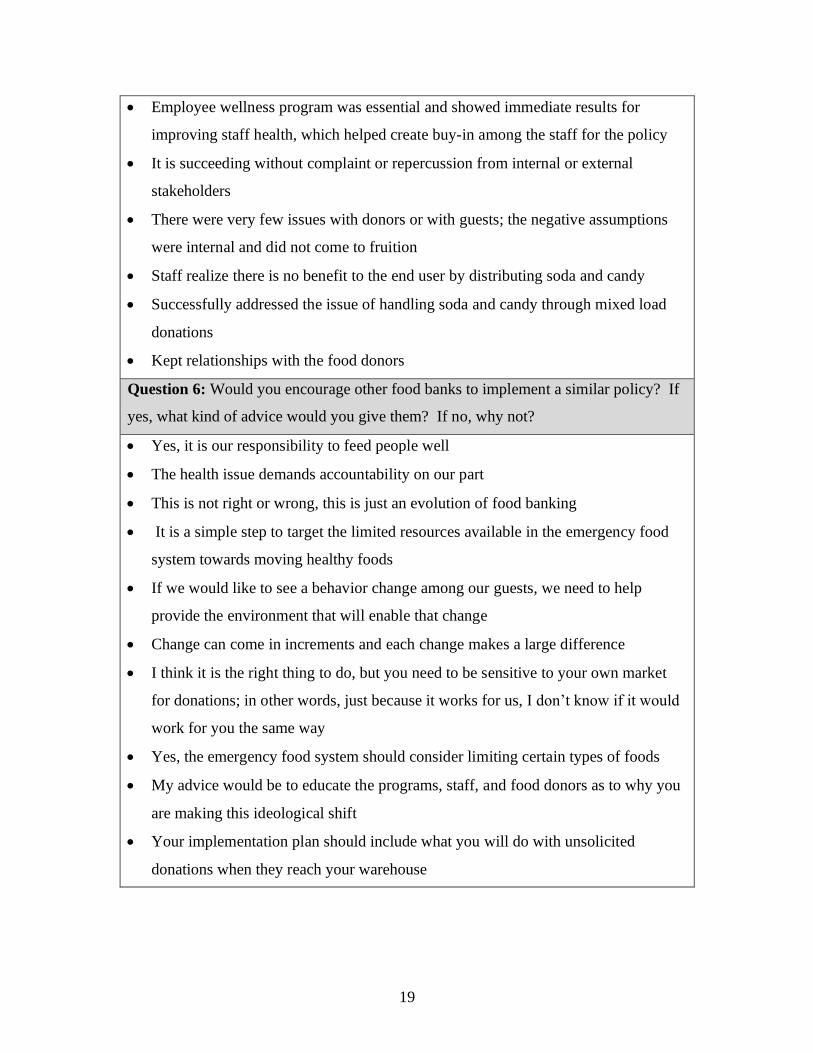
Question 5: In your opinion, what were some of the things you thought went well/are
going well with the implementation of the “No Soda and No Candy” Donation Policy?
• Able to articulate the reason and the purpose of the policy throughout the
organization well
• The public (cash donors, food donors, news outlets) has responded well when we
are able to explain the big picture
• The discussion of the obesity epidemic was critical and timely
19
• Employee wellness program was essential and showed immediate results for
improving staff health, which helped create buy-in among the staff for the policy
• It is succeeding without complaint or repercussion from internal or external
stakeholders
• There were very few issues with donors or with guests; the negative assumptions
were internal and did not come to fruition
• Staff realize there is no benefit to the end user by distributing soda and candy
• Successfully addressed the issue of handling soda and candy through mixed load
donations
• Kept relationships with the food donors
Question 6: Would you encourage other food banks to implement a similar policy? If
yes, what kind of advice would you give them? If no, why not?
• Yes, it is our responsibility to feed people well
• The health issue demands accountability on our part
• This is not right or wrong, this is just an evolution of food banking
• It is a simple step to target the limited resources available in the emergency food
system towards moving healthy foods
• If we would like to see a behavior change among our guests, we need to help
provide the environment that will enable that change
• Change can come in increments and each change makes a large difference
• I think it is the right thing to do, but you need to be sensitive to your own market
for donations; in other words, just because it works for us, I don’t know if it would
work for you the same way
• Yes, the emergency food system should consider limiting certain types of foods
• My advice would be to educate the programs, staff, and food donors as to why you
are making this ideological shift
• Your implementation plan should include what you will do with unsolicited
donations when they reach your warehouse

20
Objectives 2 and 3: Food Pantry Guest and Director Interviews
Findings from Guests’ Food Preference Surveys
Characteristics of Respondents
Table 5 shows the following demographic characteristics of guests:
• The majority of guests were white females between the ages of 35 and 64.
• Only 64% of guests indicated that they or a member of their household received
food stamps.
• Twenty-eight percent of guests reported that someone in their household
participated in the School Lunch Program but only nine percent participated in the
Summer Food Service Program.
• Most guests interviewed were unemployed.
Table 5: Characteristics of Respondents (n=116):
Characteristic Percent
(%)
Gender
Male 33
Female 67
Age
35-64 years old 58
18-34 years old 27

21
>65 years old 13
Declined to Respond 2
Ethnicity
White 68
Native American 6
Black 20
Latino 7
Household composition & food program participation
Household with Children Ages 0-10 years old 29
Household with Children Ages 11-17 years old 27
Household Member Participating in Food Stamp Program 64
Household Member Participating in WIC 10
Household Member Participating in School Lunch 28
Household Member Participating in School Breakfast 24
Household Member Participating in the Summer Food Service
Program
9
Employment
Employed Full-Time 10
Employed Part-Time 13
Unemployed 75
Declined to Respond 3

22
Guests’ Considerations for Food Choices at Food Pantries
Guests were asked to rank the importance of stated considerations (Nutritious, Staple
Items, Tasty, Filling, Easy to Store, Familiar, Varied, Easy to Prepare, and Treats) in
choosing food from the food pantry on a four-point scale of very important, important,
somewhat important, and not important (Table 6).
• Ninety-eight percent of guests indicated that having nutritious food available for
them to choose at the food pantry was either very important or important;
however, 94% reported that taste was also a very important/important
consideration when choosing food for their households.
• Approximately 70% of guests did not place a priority on receiving snacks at the
food pantry by reporting it was somewhat or not important to them.
• Guests (94% very important/important) placed a high priority on the availability
of staple items, so that they could make a meal for their families.
Table 6: Guests’ Considerations for Food Choices at Food Pantries
Very Important/Important
(%)
Somewhat Important/
Not Important
(%)
Nutritious 98 3
Staple Items 94 6
Tasty 94 6
Filling 87 13
Easy to Store 83 17
Familiar 82 18
Varied 68 32
Easy to Prepare 64 36
Treats 32 68
*Due to rounding, columns may not add to 100%

23
Guests’ Critique of Food Pantry Performance
• In general, guests were very satisfied with food pantry performance as shown by
the large percent of excellent and good ratings outlined in Table 7.
• However, most guests did report that the distribution of high quality produce
seems to be an area where most pantries could make improvements (Table 7).
Table 7: Guests’ Critique of Food Pantry Performance on Providing the Following
Types of Foods
Excellent
(%)
Good
(%)
Fair
(%)
Poor
(%)
Easy to Prepare 47 50 2 1
Staple Items 46 45 8 2
Filling 39 50 10 1
Tasty 29 56 14 1
Nutritious 45 46 8 1
Familiar 42 46 11 1
Varied 28 47 23 2
Easy to Store 50 47 3 0
High Quality
Produce
24 38 28 11

24
Mean Rank Scores of Food Pantry Items
• Guests ranked items they would most prefer to receive from the food pantry from
a list of 16 foods (1=most prefer to receive; 16=least prefer to receive).
• The mean rank for meat/poultry/fish was 3.7 indicating that guests preferred to
receive these items more than any other on the list (Table 8).
• Vegetables and fruits were reported as the second and third most preferred item
respectively (Table 8).
• Candy was the item least preferred to receive at a food pantry by guests; soda,
snack foods, and beans also ranked among the least preferred (Table 8).
Table 8: Mean Rank Scores for Food Pantry Items preferred by Guests
Food Item Mean Rank Food Item Mean Rank
Meat/poultry/fish 3.70 Cereal 7.86
Vegetables 4.28 Soup 9.54
Fruit 4.52 Frozen meals 10.18
Eggs 5.74 Peanut butter 10.44
Milk 6.18 Beans 10.53
Bread 6.39 Snacks 12.81
Cheese 6.83 Soda 14.42
Pasta/rice 7.64 Candy 14.77

25
Guests’ Level of Importance for Foods to Receive at a Food Pantry
Guests indicated which foods were most important to receive at the food pantry using a
scale from very important to not important.
• Ninety percent or more of guests reported that meat/poultry/fish, vegetables, fruit,
cheese, eggs, and milk are very important or important to receive at a food pantry
(Table 9).
• On the contrary, more than 85% of guests reported that soda, candy, and snacks
were somewhat or not important (Table 9).
Table 9: Guests’ Level of Importance for Foods to Receive at a Food Pantry
Very Important/Important
(%)
Somewhat Important/
Not Important
(%)
Meat/poultry/fish 93 8
Vegetables 93 7
Fruit 91 9
Cheese 91 9
Eggs 90 10
Milk 90 10
Bread 85 15
Cereal 85 15
Pasta/rice 77 23
Soup 66 34
Beans 54 46
Frozen meals 35 65
Snacks 8 92
Candy 5 95
Soda 4 96
*Due to rounding, columns may not add to 100%

26
Differences in Food Preferences: Rural vs. Urban Guests
• In general, rural and urban food pantry guests have the same preferences for foods
distributed at a food pantry (Figure 5). Both prefer meat/poultry/fish, vegetables,
and fruit while they place little or no preference on snacks, soda, and candy.
• However, urban guests have a statistically significantly higher preference for
meat/poultry/fish and soup than their rural counterparts (Figure 5).
• Rural guests have a statistically significant greater preference for beans than
urban guests (Figure 5).
Figure 5: Food Preferences: Rural vs. Urban Guests
Food Preferences: Rural vs. Urban Guests
0
2
4
6
8
10
12
14
16
*meat/fis
h/p
oultr
y
vegeta
ble
s
fruit
eggs
milk
bre
ad
cheese
pasta
/ric
e
cere
al
*beans
frozen m
eals
soup
peanut butter
snacks
soda
candy
Food Item
Me
an
Ra
nk
(1=
Hig
he
st
Pre
fere
nc
e
16
=L
ow
es
t P
refe
ren
ce
)
Rural Guests
Urban Guests
* Indicates statistically significant difference

27
Types of Fruit and Vegetables Preferred
• A majority of guests reported that they preferred to receive fresh fruit (72%)
rather than frozen or canned (Figure 6).
• 51% of guests said they would rather receive fresh vegetables than frozen or
canned (Figure 6).
Figure 6: Types of Fruits and Vegetables Preferred by Pantry Guests
Additional Specific Food Preferences Identified by Guests
• Guests indicated that they preferred canned beans, frozen meat, and white rice
(Table 10).
• Guests reported a preference for refrigerated, 2% milk (Table 10).
0%
20%
40%
60%
80%
100%
% of Food
Pantry
Recipients
Fruit Vegetables
Types of Fruits and Vegetables
Preferred by Food Pantry Recipients
Fresh
Canned
Frozen

28
Table 10: Additional Specific Food Preferences Identified by Guests (n=116)
Food Item Fresh/Dry Frozen Canned
Beans 33% 53%
Meat 84% 10%
Skim 1% 2% Whole
Milk 11% 16% 40% 33%
Dry Refrigerated Shelf-stable Would Not
Use
Milk 9% 75% 13% 3%
White Brown Neither
Rice 65% 28% 7%
Specific Items Preferred by Guests in Rank Order
• Guests who reported a preference for fresh vegetables were asked to identify
which fresh produce items they would prefer to receive.
• The majority of guests preferred tomatoes and apples (Table 11).
Table 11: Specific Items Preferred by Guests in Rank Order
Food
Group
Preference
#1
Preference
#2
Preference
#3
Preference
#4
Preference
#5
Vegetables Tomatoes Broccoli Green Beans Lettuce Potatoes
Fruit Apples Oranges Bananas Grapes Strawberries
Meat Chicken Hamburger Fish Beef Ground
Beef
Beans Kidney Pork &
Beans
Black Eyed
Peas
Pinto Lima/Great
Northern
Black
29
Cereal Corn
Flakes
Cheerios Raisin Bran/
Rice Krispies
Shredded
Wheat/Oatmeal
Fruit Loops
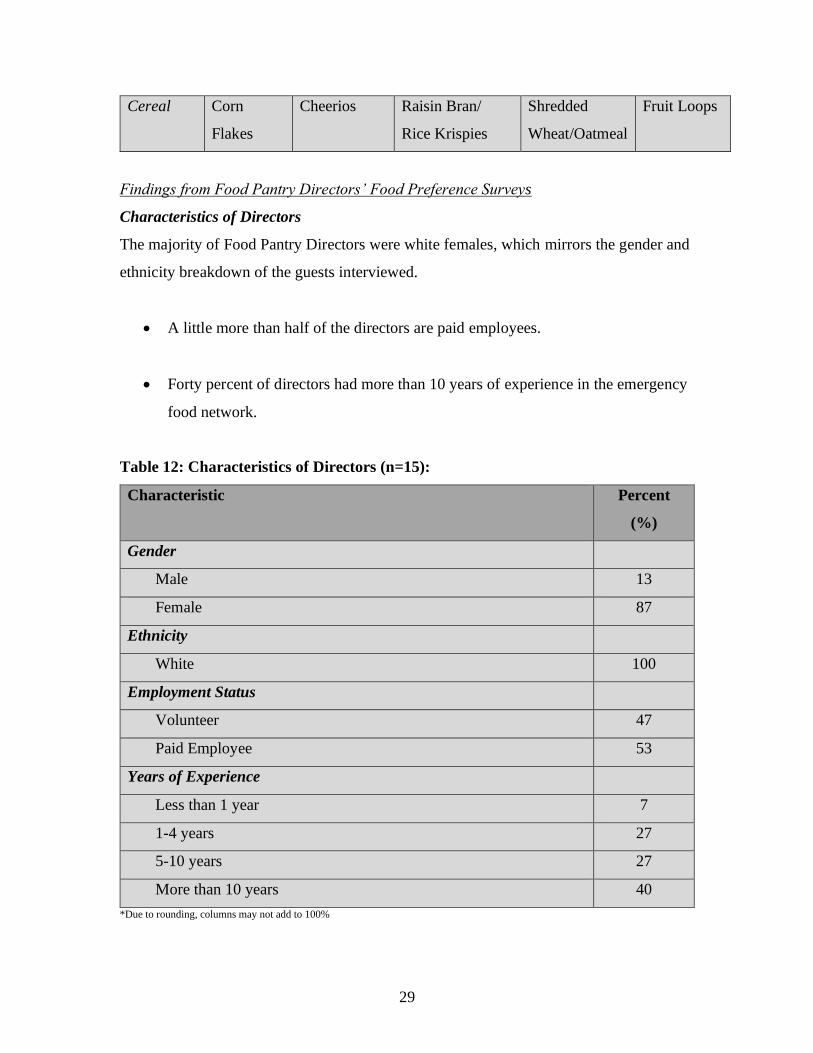
Findings from Food Pantry Directors’ Food Preference Surveys
Characteristics of Directors
The majority of Food Pantry Directors were white females, which mirrors the gender and
ethnicity breakdown of the guests interviewed.
• A little more than half of the directors are paid employees.
• Forty percent of directors had more than 10 years of experience in the emergency
food network.
Table 12: Characteristics of Directors (n=15):
Characteristic Percent
(%)
Gender
Male 13
Female 87
Ethnicity
White 100
Employment Status
Volunteer 47
Paid Employee 53
Years of Experience
Less than 1 year 7
1-4 years 27
5-10 years 27
More than 10 years 40
*Due to rounding, columns may not add to 100%

30
Directors’ Perceptions of Guests’ Considerations
Food Pantry Directors were asked to answer a series of questions from their guests’ point
of view including what were the most important considerations while choosing food from
the food pantry (Table 13).
• All 15 directors agreed that guests wanted foods that are easy to prepare - ranked
as either very important or important (Table 13).
• Directors believed that guests put a high priority on nutritious food, but only 47%
said that guests would rank receiving treats as very important or important (Table
13).
Table 13: Directors’ Perception of Guests’ Considerations for Food Pantry Food
Very Important/Important
(%)
Somewhat Important/
Not Important
(%)
Easy to Prepare 100 0
Staple Items 93 7
Filling 93 7
Tasty 93 7
Treats 47 53
Nutritious 93 7
Familiar 94 7
Varied 46 53
Easy to Store 93 7
*Due to rounding, columns may not add to 100%

31
Mean Rank Scores
• Directors’ ranked meat/poultry/fish as the most preferred food item by guests at
the food pantry followed by fruit, milk, eggs, and vegetables (Table 14).
• Directors’ reported that guests rank candy, soda, and snacks as least important to
receive at the food pantry (Table 14).
Table 14: Mean Rank Scores: Directors’ Perceptions of Guests’ Preferences
Food Item Mean Rank Food Item Mean Rank
Meat/poultry/fish 2.13 Pasta, rice 8.60
Fruit 5.40 Peanut butter 9.00
Milk 5.53 Soup 9.87
Eggs 5.60 Frozen meals 10.60
Vegetables 5.73 Beans 12.00
Cereal 6.40 Snacks 12.47
Cheese 6.53 Soda 13.67
Bread 7.33 Candy 15.13

32
Directors’ Perception of’ Level of Importance for Foods to Receive at a Food Pantry
• As shown in Table 15, directors’ unanimously agreed that guests put the greatest
priority on meat/poultry/fish and cereal.
• Directors’ reported that 67% of guests believe that receiving snack foods at the
food pantry is very important or important (Table 15).
Table 15: Directors’ Perceptions of Guests’ Level of Importance for Food Pantry
Items
Food Item Very Important/Important
(%)
Somewhat Important/
Not Important
(%)
Meat/poultry/fish 100 0
Cereal 100 0
Eggs 94 7
Beans 94 7
Vegetables 93 7
Milk 93 7
Bread 93 7
Cheese 93 7
Pasta/rice 93 7
Fruit 86 13
Soup 86 13
Snacks 67 33
Frozen meals 40 60

33
Candy 13 87
Soda 7 93
*Due to rounding, columns may not add to 100%
Directors’ Perceptions vs. Guests’ Stated Food Preferences
• Table 16 shows the correlation coefficient for each food pantry director’s mean
rank compared with the guests who attended their pantries. The closer the
directors’ answers matches his/her guests’ scores, the closer the correlation
coefficient will be to 1, while directors’ answers that are different than their
guests, have correlation coefficients closer to 0.
• There was a large range of correlation coefficients (0.865-0.125) suggesting that
some pantry directors more accurately perceive their guests’ preferences than
others.
Table 16: Food Preferences: Directors’ Perceptions vs. Guests’ Stated Preferences
Site Correlation
St John’s Outreach 0.865981471
Calvary of CNY 0.863652279
Little Falls 0.861116683
Elmwood Interfaith 0.857565162
Temple Society of Concord 0.812925554
Dolgeville Area 0.770356418
Rome Rescue Mission 0.721803812
Basilica of Sacred Heart 0.70567091
SA Herkimer 0.682425557
CCCC Roots and Wings 0.679466958
DePauville 0.651591745
Helping Hands 0.649781438

34
Opportunity Shop 0.200875833
Canton Neighborhood 0.153050807
VEM of Carthage 0.125312828
Directors’ Perceptions vs. Guests’ Stated Preferences by Food Item
• In general (Figure 7), food pantry directors and guests placed foods in similar
rank order. For example, guests’ and directors’ mean rank scores placed
meat/poultry/fish as the most important item offered at a food pantry. However,
directors consistently ranked meat/poultry/fish as more important than guests.
• Directors were more likely to place a lower priority on vegetables, beans, and
fruit than the guests.
Figure 7: Food Preferences: Guests vs. Directors by Food Item
Food Preferences:
Guests vs. Directors
0
2
4
6
8
10
12
14
16
mea
t/fish
/pou
ltry
vege
tables fru
iteg
gs milk
brea
d
chee
se
pasta/ric
e
cereal
bean
s
froze
n mea
lsso
up
pean
ut butter
snac
ksso
da
cand
y
Food Items
Me
an
Ra
nk
(1
=h
igh
es
t
pri
ori
ty 1
6=
low
es
t p
rio
rity
)
Guests
Directors

35
Directors’ Perceptions vs. Guests’ Stated Considerations in selecting foods
• A wide range of correlation coefficients were found for the panty directors’ views
compared with their guests’ (r = 0.87—0.27, data not shown) on important
considerations in selecting foods indicating that some directors more accurately
perceive their guests than others.
• Guests tend to rate ease of preparation, familiarity, filling and treats somewhat
higher than do Pantry Directors (Figure 8).
Figure 8: Pantry Directors’ Perceptions vs. Guests’ Considerations in selecting food
from food pantries
Consideration for Food Choices:
Guests vs. Directors
0.00
1.00
2.00
3.00
4.00
Nutritiou
sTas
ty
Staple ite
ms
Familia
r
Easy t
o sto
reFilli
ng
Easy t
o prep
are
Varied
Treats
Considerations
Ra
nk
Sc
ore
(1=
no
t im
po
rta
nt
4=
ve
ry i
mp
ort
an
t)
Guests
Directors

36
Directors’ Perspectives of Food Pantry Distribution
• As shown in Table 17, a large majority of directors (80%) indicated that food
pantries should only distribute healthy foods while only 27% of directors reported
that the role of the food pantry is to provide a variety of foods including soda and
candy.
• It appears that most directors (86%) are familiar with the Food Bank of Central
New York’s “No Soda and No Candy” donation policy (Table 17).
Table 17: Directors’ Perspectives of Food Pantry Distribution
Food Distribution Statement Strongly
Agree/Somewhat
Agree
(%)
Somewhat
Disagree/Strongly
Disagree
(%)
The role of the Food Pantry is to
provide healthy food items only
80 20
The role of the Food Pantry is to
provide a variety of foods including
soda and candy
27 74
The Food Bank of Central New York
does not accept or distribute soda or
candy
86 14
Barriers Identified by Directors
• As show in Table 18, directors reported that inconsistent availability is the
greatest barrier to providing fresh fruits and vegetables.
• The cost of meat/poultry/fish, refrigerated milk, and whole wheat bread were
identified as barriers to distribution (Table 18).
• Directors also noted the inability to store milk and fresh fruit properly as a barrier
to distribution (Table 18).

37
Table 18: Barriers Identified for Distribution of Healthy Food (n=15)
Costs
too
much
(%)
Inconsistent
Availability
(%)
Food
pantry
storage
problems
(%)
Guests
do not
like it
(%)
Guests
cannot
store it
(%)
Guests
cannot
cook it
(%)
No
problems
(%)
Fresh Fruit 20 67 40 0 7 0 20
Fresh Vegetables 7 73 27 13 7 0 20
Meat/Poultry/Fish 33 7 20 7 0 7 40
Refrigerated Milk 40 27 40 0 7 0 13
Whole Wheat
Bread 33 7 7 33 0 0 33
Brown Rice 7 7 0 53 0 20 33
Dry Beans 0 7 0 40 0 40 40
Reported Number of Days a Pantry Bag Lasts: Guests vs. Directors
• As illustrated in Figure 9, the majority of guests reported that pantry bags lasted
them more than 7 days while most directors reported the bag should last 2-3 days.
• This information may be helpful in determining the quantities for distribution.
Guests reported the importance of having staple food items available.
Figure 9: Reported Number of Days a Pantry Bag Lasts: Guests vs. Directors
05
101520253035404550
1 Day 2-3 Days 4-5 Days 6-7 Days > 7 Days
Perc
en
t o
f T
ota
l R
esp
on
ses
Number of Days
Reported Number of Days a Pantry Bag Lasts: Guests vs. Directors
Directors
Guests

38
Findings from Food Pantry Inventory Analysis
Summary of Food Pantry Inventory
• All 15 food pantries carried vegetables, peanut butter, fruit, frozen meals, cereal
and beans (Figure 10).
• Only 1 food pantry carried eggs even though it was ranked as the 4th most
important food to receive at a food pantry by guests (Figure 10).
• Only 3 food pantries offered cheese on the day of data collection (Figure 10).
• Only 1 food pantry offered soda on the day of data collection (Figure 10).
• Only 1 food pantry offered candy on the day of data collection (Figure 10).
Figure 10: Summary of Food Pantry Inventory
0
3
6
9
12
15
Nu
mb
er
of
Fo
od
Pa
ntr
ies
(n=
15
)
Food Items
Summary of Food Pantry Inventory

39
Milk Offered at Food Pantries
• As shown in Figure 11, although 13 out of 15 food pantries offered milk, only 2
offered refrigerated milk.
• Seventy-five percent of guests preferred refrigerated milk.
Figure 11: The Type of Milk Offered at Food Pantries
Fresh Produce
• Less than half (7/15) of the food pantries offered fresh vegetables on the day of
data collection (see Figure 12) although 51% of guests reported a preference for
fresh vegetables over frozen or canned.
• Only 33% of food pantries offered fresh fruit on the day of data collection (Figure
12) however, 72% of guests reported preferring fresh fruit over frozen or canned.
• Approximately 25% of pantries (4/15) offered both fresh fruits and vegetables on
the day of data collection (Figure 12).
The Type of Milk Offered
at the Food Pantries
9
6
20
3
6
9
12
15
1Type of Milk Offered
Nu
mb
er
of
Fo
od
Pa
ntr
ies
(n
=1
5)
Offered Dry Milk
Offered Aseptic Milk
Offered Refrigerated
Milk

40
Figure 12: Number of Food Pantries that Offered Fresh Produce
Specific Fresh Produce offered on Day of Data Collection
• Apples, oranges, and grapes were offered on the day of data collection (Table 19)
and were reported among the top 5 preferred fruits by guests; carrots and potatoes
were offered on the day of data collection and were reported among the top 5
preferred vegetables by guests.
• The FBCNY’s Produce of the Month program provided 3 of the 5 vegetables
offered. This program helps improve access to fresh fruits and vegetables for
pantry users and may be a key component for any strategy to increase fruit and
vegetable consumption of guests.
Table 19: Specific Fresh Produce offered on Day of Data Collection
Fresh Fruit Grapes Apples Oranges Cantaloupe
Fresh Vegetables Carrots* Potatoes Green Beans Eggplant* Cucumbers*
*Indicates Produce of the Month Item
7
54
0
1
2
3
4
5
6
7
8
Nu
mb
er
of
Fo
od
Pan
trie
s (
n=
15)
Type of Fresh Produce Offered
Number of Food Pantries that offered Fresh Produce
Offered Fresh Vegetables
Offered Fresh Fruit
Offered Fresh Fruit andVegetables

41
Select Findings from Food Pantry Bag Analysis
Guests that Preferred Fresh Fruit: Offered vs. Chosen
• There were a limited number of food pantry bags that reviewers had the
opportunity to analyze. In addition, there were only four sites that offered fresh
fruit, which resulted in a small sample.
• Of the ten guests that had their pantry bags reviewed and reported a preference for
fresh fruit, nine took fresh fruit when offered on the data collection day (Table
20).
• Only one guest that had a preference for fresh fruit did not take it on data
collection day (Table 20).
Table 20: Guests that Preferred Fresh Fruit: Offered vs. Chosen
Site Guests w/
Preference for
Fresh Fruit
Chose Fresh Fruit
When Offered
Did Not Choose
Fresh Fruit
When Offered
Canton Neighborhood 5 4 1
DePauville 2 2 0
Helping Hands 1 1 0
Little Falls 1 1 0
Totals 9 8 1

42
Guests that Preferred Fresh Vegetables: Offered vs. Chosen
• There were a limited number of food pantry bags that reviewers had the opportunity
to analyze. In addition, there were only six sites that offered fresh vegetables, which
resulted in a small sample.
• Of the eight guests that had their pantry bags reviewed and reported a preference
for fresh vegetables, seven took fresh vegetables when offered on the data
collection day (Table 21).
• Only one guest that had a preference for fresh vegetables did not take it on data
collection day. This could be an important trend to acknowledge. If healthier food
items, that guests reportedly prefer, are available, guests may choose those items
for their pantry bag (Table 21).
Table 21: Guests that Preferred Fresh Vegetables: Offered vs. Chosen
Site Guests w/
Preference for
Fresh Vegetables
Chose Fresh
Vegetables When
Offered
Did Not Choose
Fresh Vegetables
When Offered
Canton Neighborhood 3 3 0
DePauville 1 0 1
Roots and Wings 0 0 0
Little Falls 1 1 0
Dolgeville 0 0 0
Elmwood 2 2 0
Totals 7 6 1

43
V. DISCUSSION AND CONCLUSIONS
Objective 1: Food Bank Donated Inventory Analysis
Analysis of the food bank donations showed a substantial decrease in the amount of soda
and a decrease in the pounds of candy accepted at the FBCNY two years after the
implementation of the “No Soda and No Candy” policy.
There are many potential benefits of these changes. Perhaps most importantly, the
calories saved by reducing the soda donations by 65,000 pounds could have averted
considerable weight gain among food pantry guests (3,000 pounds divided by the number
of unduplicated guests).
It is notable that there was an increase in soda and candy donations (in absolute amounts
and in the percentage of total weight of donations) in the year immediately following the
introduction of the policy. This may simply reflect a delay effect in the implementation of
the “No Soda and No Candy” policy, or possibly the year-to-year fluctuations. And yet,
changes of this magnitude were not observed in other food groups. Alternatively, there
may have been yearly changes in food procurement practices or in the foods available. It
may also be considered that the year 2 increases may reflect a delayed adjustment to the
new policy on the part of some FBCNY staff. In fact, this is the likely explanation as
suggested by the FBCNY staff interviews who indicated that it took some time to
persuade the staff that the policy was in the organization’s and the guests’ best interests.
It appears that the policy was successful in reducing donations of soda, and to a lesser
extent, candy, by the second year after its implementation. To confirm that the FBCNY
policy is responsible for the reduction in soda donations, we would need to continue
monitoring the annual inventory to ensure that the policy is being implemented as well as
to look for trends in other food groups that FBCNY may want to encourage or discourage
among guests.

44
These findings should provide a useful basis for considering further changes to food
policies and practices within the FBCNY. Such measures would include ways to increase,
store, and handle donations of fresh fruit, more fresh vegetables, and other foods of high
preference. In addition, this feedback can provide support for the expansion of the “No
Soda and No Candy” policy to other foods of minimal nutritional value, particularly
sweetened beverages and sweets. Providing this feedback and a discussion with staff
about the barriers to meeting policy goals may prove valuable in overcoming barriers.
Inventory data provide powerful information about the implementation of food policy
changes in organizations such as food banks. Policies that change fundamental and
complex aspects of food procurement and operations are not easily introduced or fully
implemented overnight. Often, many years are required to reach policy goals. In the case
of FBCNY, excellent progress appears to have been made in the area of soda and candy
donations. Additional strategies to increase fruit donations and sustain the level of
vegetable contributions are indicated.
Objectives 2 and 3: Food Pantry Guest and Director Interviews
Findings from the food ranking question suggests that food pantry guests prefer to
receive meat, vegetables, and fruit over soda, candy, and snack foods. In addition,
respondents reported a greater interest on receiving vegetables, fruit, and meat than in
getting soda, candy, and snack foods during a pantry visit. This supports the effort by the
FBCNY to limit foods of minimal nutritional value while focusing on increasing the
distribution of both donated and purchased fruits and vegetables. Notably, a majority of
guests stated that they would prefer to receive fresh fruits (72%) and vegetables (51%). In
general, food pantry guests at both rural and urban sites preferred the same type of foods.
Data from the food preferences study suggest that the Food Bank of Central New York’s
“No Soda and No Candy” donation policy is in line with the food preferences of guests
and philosophy of food pantry directors. Most directors (80%) reported that food pantries
should only provide healthy foods.

45
In general, the data suggests that food pantry directors accurately perceive the food
preferences of their guests. However, there were still only four food pantries that offered
fresh fruit and seven food pantries that offered fresh vegetables. Notably the fresh
produce items offered were from the FBCNY’s Produce of the Month program. From the
limited food pantry bag analysis data available, it appears that most guests that reported a
preference for fresh fruit and vegetables took them when offered. Additionally, guests
reported a high preference for eggs and milk. Only one food pantry carried eggs on the
day of data collection; and although thirteen out of the fifteen food pantries provided
milk, only two carried refrigerated milk, which was the overwhelming preference of
guests (75%). While it is thought that food pantry directors may not accurately perceive
food preferences of their guests, this was refuted in our study. The data suggest that the
biggest challenges to providing preferred foods are not attitudinal but relate to cost,
inconsistent availability, and storage capacity.
Findings from this study should be used to support internal discussion regarding
improvement to the infrastructure of food pantries to help support the improvement of
foods distributed at food pantries. Guests’ preferences may be used to guide food donors,
purchasers, and dietitians when determining the product mix to distribute as well as what
types of foods may need promotion. Guests overwhelmingly reported that nutrition was a
very important consideration when choosing foods at the food pantry.

46
VI. RECOMMENDATIONS
Food Bank of Central New York
1. Implement a monitoring system (routine annual or semi-annual summaries of
donations arranged by food groups as per the analysis in this report) to identify areas
for improvement and acknowledge accomplishments. This may be helpful for work
plan development and department goal setting.
2. Review donation trends in order to improve and/or amend current donation policy.
3. Present the findings of this study to FBCNY staff and Pantry Directors and facilitate
discussion on how to improve the infrastructure to eliminate barriers to distribution of
healthy foods and to provide foods preferred by guests.
4. Discuss ways to expand the Produce of the Month program, which will help to
provide fruits and vegetables that guests prefer as well as improve the nutrition
quality of their diets.
5. Discuss ways to expand the milk gift card program, which may eliminate storage
barriers, to meet guests’ preferences.
6. Reexamine donation solicitation and food purchasing practices to ensure that guests’
preferences are met when possible at the food bank level.
7. Disseminate findings of this study, via published articles and presentations at
meetings, to share lessons learned regarding progress in organizational change in food
banks to provide healthier foods supported by evidence of food preferences of guests.
Emergency Food Network in General
1. Consider routine auditing of food bank donations using the methods described in this
study to assess the extent to which healthier foods are obtained in donations and
distributed.
2. Consider local studies of food preferences of guests and the barriers to healthy food
distribution for use in developing action plans for organizational change.

47
VII. REFERENCES
Adams, EJ, et al. 2003. Food Insecurity is Associated with Increased Obesity in
California Women. Journal of Nutrition. 133: 1070-1074.
Akobundu, Ucheoma, Nancy Choen, et al. Vitamins A and C, Calcium, Fruit and Dairy
Products are Limited in Food Pantries. J Am Diet Assoc. 2004; 104:811-813.
Cohen, Rhoda, Myoung Kim, and Jim Ohls. Hunger in America 2006. National report
prepared for America’s Second Harvest. March 2006.
Drewnowski A. The real contribution of added sugars and fats to obesity.
Epidemiol Rev. 2007;29:160-71.
McIntyre L. Improving the nutritional status of food-insecure women: first, let them eat
what they like. Public Health Nutrition 2007; 10:1288-1298.
Nord, Mark, Margaret Andrews, and Steven Carlson. Household Food Security in the
United States, 2007. ERR-66, U.S. Dept. of Agriculture, Econ. Res. Serv. November
2008.
Olson, CM. 1999. Nutrition and Health Outcomes Associated with Food Insecurity and
Hunger. Journal of Nutrition. Vol.131: 52S1-524S.
Poppendieck,Janet. Sweet Charity. New York: Penguin Group, 1999
Teron, Adrienne C, Valerie S Tarasuk. Charitable food assistance: What are food bank
users receiving? Canadian Journal of Public Health. Ottawa: Nov/Dec 1999. Vol. 90, Iss.
6; pg. 382.

48
Townsend, MS, et al. 2001. Food Insecurity is Positively Related to Overweight in
Women. Journal of Nutrition. 131: 2880-2884.
U.S. Census Bureau, Current Population Survey, 2007 Annual Social and Economic
Supplement
Verpy, Heidi, Cherry Smith, Marla Reicks. Attitudes and Beliefs of Food Donors and
Perceived Needs and Wants of Food Shelf Clients. J Nutr Educ Behav; 2003; 35:6-15.

49
APPENDIX 1. Inventory Classification System
Food Group Classification Categories:
• Fruit
• Vegetable
• Grain
• Meat
• Dairy
• Beverage
• Non-Dairy
Substitute
• Combination Foods
• Snack Foods
• Miscellaneous
• Condiment
• Non-Meat
Food Group Sub Group Categories:
• Apples
• Applesauce
• Apricots
• Assorted
• Assorted Bakery
• Beans
• Beef
• Bologna
• Bread
• Bread Mix
• Butter Substitute
• Cabbage
• Candy
• Carrots
• Cauliflower
• Celery
• Cereal
• Cereal Bars
• Cheese
• Cherries
• Chicken
• Chips
• Chocolate Drink
• Coffee
• Coffee Creamer
• Collard Greens
• Corn
• Crackers
• Cranberry
• Cream Cheese
• Dietary Aide
• Dip
• Dough
• Eggs
• Fish
• Flour
• Fruit Juice
• Lettuce
• Main Entrée
• Mandarin Orange
• Mayonnaise
• Milk
• Miscellaneous
• Mushrooms
• Non-Food
• Nuts
• Oatmeal
• Onions
• Orange
• Other
• Pasta
• Pastries
• Peaches
• Peanut Butter
• Pineapple
• Pizza
• Pork
• Potatoes
• Relish
• Rice
• Salad Dressing
• Salad Mix
• Sauce
• Side Dish
• Soda
• Soup
• Sour Cream
• Squash
• Sweets
• Tea
• Tomatoes
• Topping
• Turkey
• Venison
• Water
• Yogurt
Food Preparation Sub Group Categories:
• 100% Juice
• Canned
• Fresh
• Frozen
• Sweetened
• Unsweetened

50
APPENDIX 2. Food Pantry Guest Food Preference Survey
The Food Bank of Central New York
Food Preference Survey (interview schedule)
(Use response cards for most questions where indicated)
Hello, my name is _____. I am working with the Food Bank of Central New York. We are
doing a survey to better understand the types of foods that people prefer to receive
through food pantries and what influences their choices, so that we can provide the
best service to guests. I would like to get your ideas and opinions by asking you a few
questions. The information you give me will be confidential – your name will not be on
the form, so no one will know what you said. Completing this survey is voluntary and
will take about 15 minutes. Would you be willing to help us with this important
information? yes____ no___ reason for refusal:
------------------------------------------------------------------------------------------------------------------------------
The first few questions are about the foods that you and your household would prefer to
receive from the food pantry, if the pantry was able to provide them.
1. Which of the following foods are most important to you and your household to
receive from the food pantry? I would like you to rank them by sorting these cards into
order from most important to least important…put the most important to you and your
household on top of the pile and the least important on the bottom of the pile… (Ideally,
allow them to spread out on a table, or a large lap mat board; when guest completes
ranking, rubber band cards and place in manila envelope. Record answers at end of
day.)

51
1=Highest Priority and 16= Lowest Priority
Food Rank Food Rank Food Rank
Fruit Bread Soup
Vegetables Soda Frozen Meals
Meat/Poultry/Fish Candy Milk
Beans (not
including green
beans)
Snack Food (chips, cookies) Cereal
Pasta/Rice Cheese Peanut Butter
Eggs

52
2. Now, let’s talk about the same food list. This time I would like you to tell me how
important it is to you and your household to receive EACH type of food item: very
important, important, somewhat important, or not important. Think about each food
item individually without comparing it to the other foods while answering this question.
For example, you may have ranked peanut butter as least important in the last question,
but you may feel it is still very important for you to receive it at the food pantry.
(Response card)
Very
Important
Important Somewhat
Important
Not
Important
a. Fruit
b. Vegetables
c. Meat/Poultry/Fish
d. Snack Foods (chips, cookies)
e. Soda
f. Candy
g. Milk
h. Cheese
i. Beans (not including green beans)
j. Bread
k. Cereal
l. Frozen Meals
m. Pasta/Rice
n. Soup
o. Eggs

53
3. Of any food items that you can think of, which do you MOST want available at your
food pantry? (List only one)
________________________________________________________________
4. Which of the following would you most prefer to receive at your food pantry? (Mark
only one)
Canned vegetables
Frozen vegetables
Fresh vegetables (if they answered fresh, go to question 4a)
None of the above
4a. Name the fresh vegetables that you would like to receive at your food pantry:
________________________________________________________________
5. What would you say are the two vegetables most frequently eaten in your household?
1. ____________________________________
2. ____________________________________
6. Which of the following would you most prefer to receive at your food pantry? (Mark
only one)
Canned fruit
Frozen fruit
Fresh fruit (if they answered fresh, go to question 6a)
None of the above
6a. Name the fresh fruit that you would like to receive at your food pantry:
________________________________________________________________

54
7. What would you say are the two fruits most frequently eaten in your household?
1. ____________________________________
2. ____________________________________
8. Which of the following would you most prefer to receive at your food pantry? (Mark
only one)
Canned meat/poultry/fish
Frozen meat/poultry/fish
None of the above
8a. Name the meat/poultry/fish that you would like to receive at your food pantry:
________________________________________________________________________
________________________________________________________________________
9. What would you say are the two meat/poultry/fish most frequently eaten in your
household?
1. ____________________________________
2. ____________________________________
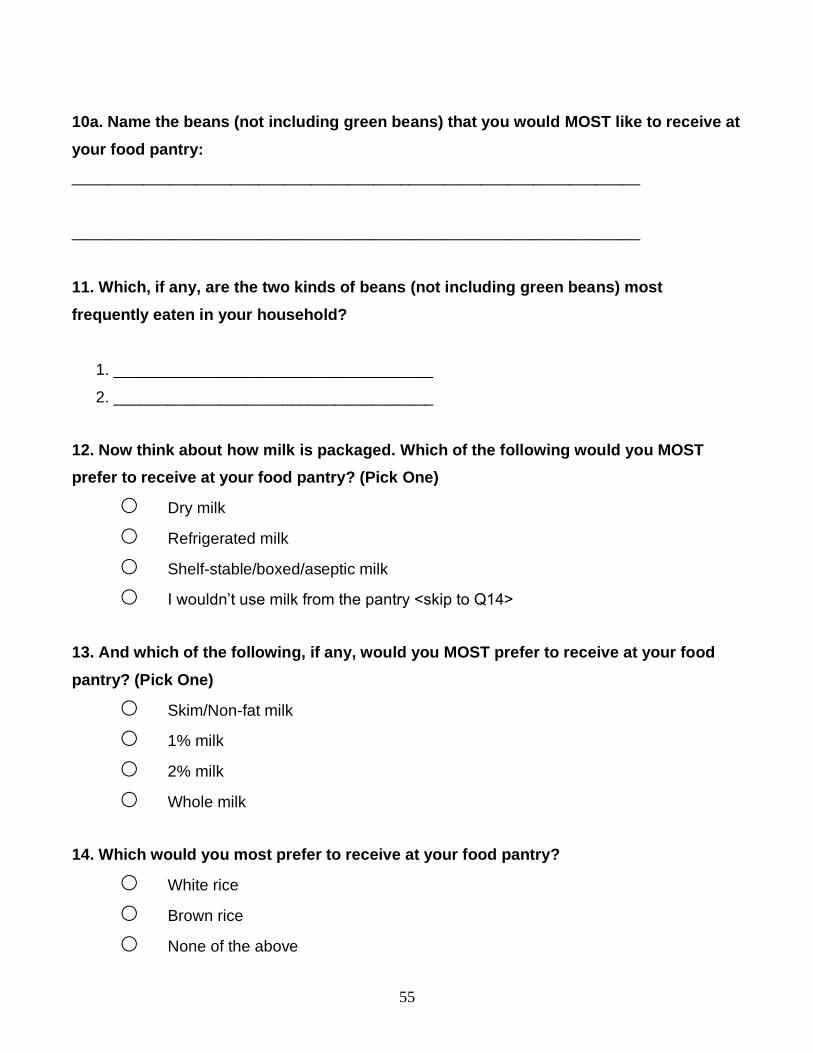
10. What type of beans (not including green beans) would you most prefer to receive at
your food pantry? (Pick One)
Dry beans
Canned beans
None of the above
55
10a. Name the beans (not including green beans) that you would MOST like to receive at
your food pantry:
________________________________________________________________
________________________________________________________________
11. Which, if any, are the two kinds of beans (not including green beans) most
frequently eaten in your household?
1. ____________________________________
2. ____________________________________
12. Now think about how milk is packaged. Which of the following would you MOST
prefer to receive at your food pantry? (Pick One)
Dry milk
Refrigerated milk
Shelf-stable/boxed/aseptic milk
I wouldn’t use milk from the pantry <skip to Q14>
13. And which of the following, if any, would you MOST prefer to receive at your food
pantry? (Pick One)
Skim/Non-fat milk
1% milk
2% milk
Whole milk
14. Which would you most prefer to receive at your food pantry?
White rice
Brown rice
None of the above

56
15. Which breakfast cereals would you like to receive from your food pantry?
______________________________________________________________________
______________________________________________________________________
15a. Which two kinds of breakfast cereals are most frequently eaten in your household?
1. ____________________________________
2. ____________________________________
16. How important is each of the following in choosing food from the pantry for you and
your household—very important, important, somewhat important, or not important?
The foods you get from the food pantry should be…
Very
Important
Important Somewhat
Important
Not
Important
a. Easy to prepare
b. Staple items that you (and your
household) can make a meal out of
c. Filling
d. Tastes good to you/members of your
household
e. Treats for you/members of your
household
f. Nutritious and good for your
health/health of your household
g. familiar to you/your household
h. varied …to give you/your household a
break from the foods you would
normally eat
i. Easy to store

57
16a. How would you rate the food pantry’s performance in providing these types of
foods?
Excellent Good Fair Poor
a. Foods that are easy to prepare
b. Foods that are staple items that we
can make a meal out of
c. Foods that are filling
d. Foods that are tasty
e. Foods that are nutritious and healthy
f. Foods that are familiar
g. Foods that are varied …to give
some break from the same foods we
would normally eat
h. Foods that are easy to store
I High quality produce
17. How often do you usually visit this food pantry or any other food pantry?
Less than once a month
Once a month
Twice a month
Three to four times a month
More than four times month

58
18. How long would you say the food you get from the pantry usually lasts in your
household?
1 day
2-3 days
4-5 days
6-7 days
More than 7 days
19. How often do you or members of your household usually shop for groceries?
(Response card.)
Every day
Several times a week;
Once a week
A couple of times a month;
Once a month
Less than once a month
20. Which of the following places would you say you get MOST of your food from each
month?
Discount stores, such as Wal-Mart, Target, Aldi, and the Dollarstore
Supermarkets
Warehouse clubs, Sam’s Club, BJ’s,
Convenience stores or small neighborhood grocery stores such as
Byrne Dairy, Stewart’s, and Nice n Easy
Ethnic food stores, such as bodegas, Asian food markets, or
Caribbean markets
Farmers’ market
Food pantry
Other:________________
None of the above
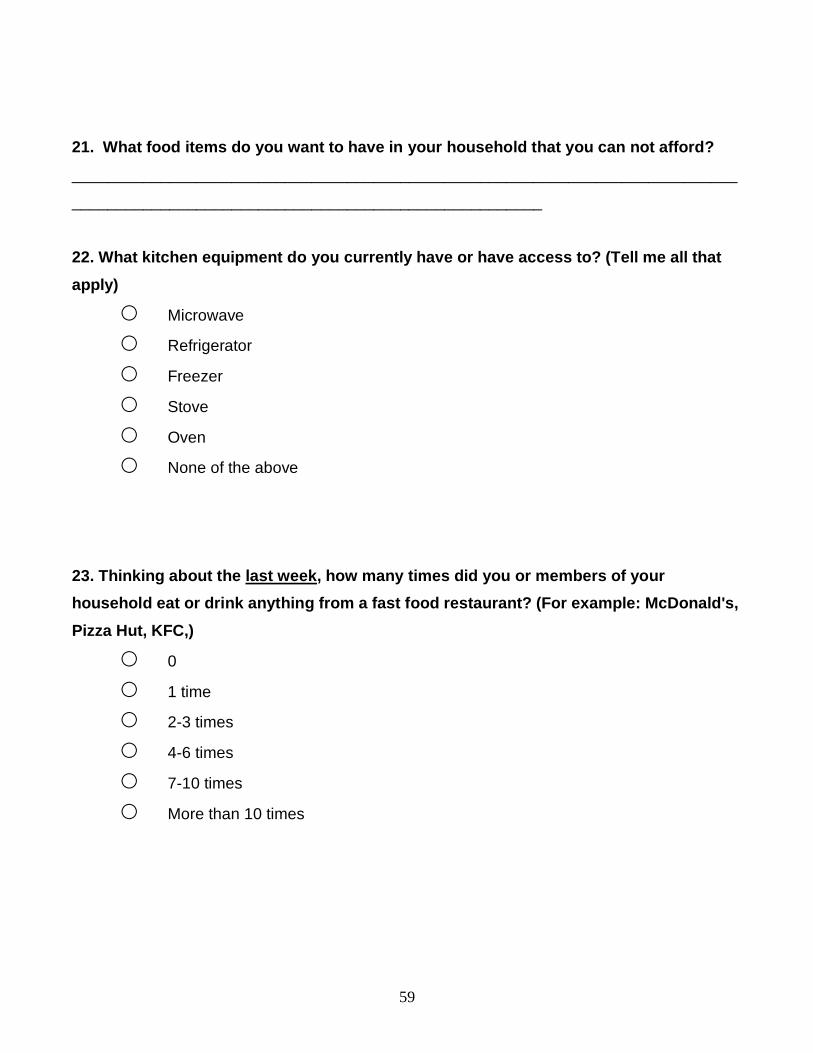
59
21. What food items do you want to have in your household that you can not afford?
___________________________________________________________________________
_____________________________________________________
22. What kitchen equipment do you currently have or have access to? (Tell me all that
apply)
Microwave
Refrigerator
Freezer
Stove
Oven
None of the above
23. Thinking about the last week, how many times did you or members of your
household eat or drink anything from a fast food restaurant? (For example: McDonald's,
Pizza Hut, KFC,)
0
1 time
2-3 times
4-6 times
7-10 times
More than 10 times
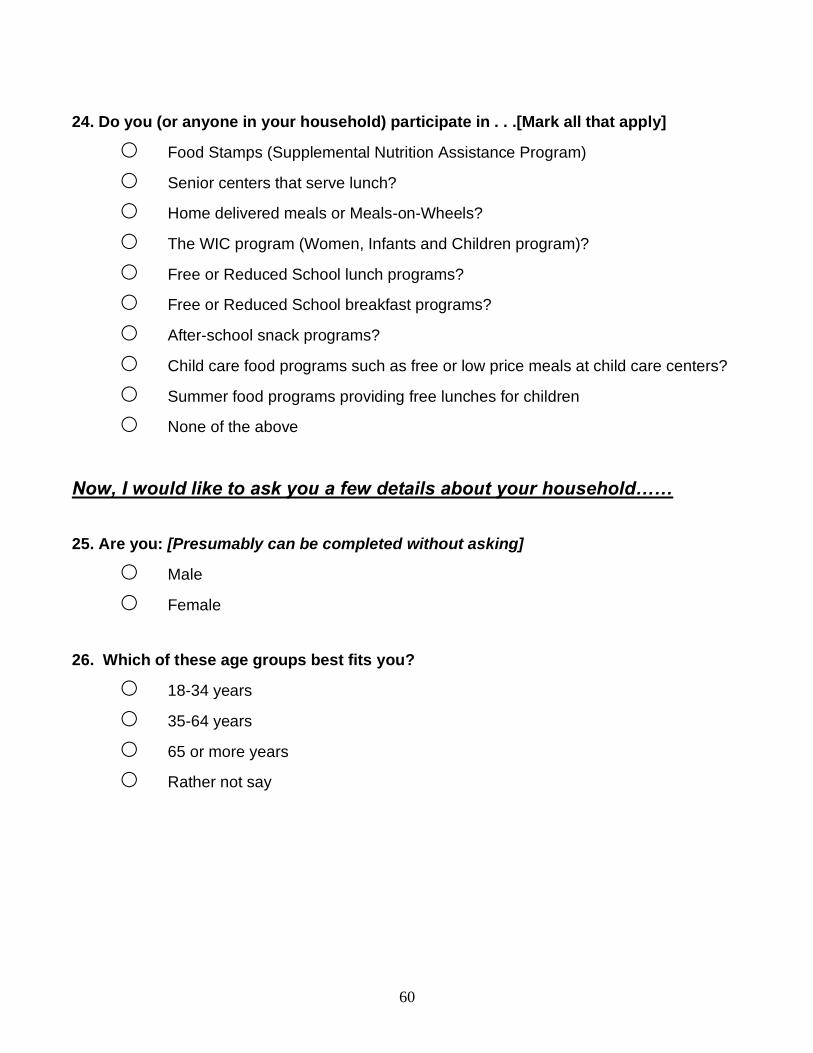
60
24. Do you (or anyone in your household) participate in . . .[Mark all that apply]
Food Stamps (Supplemental Nutrition Assistance Program)
Senior centers that serve lunch?
Home delivered meals or Meals-on-Wheels?
The WIC program (Women, Infants and Children program)?
Free or Reduced School lunch programs?
Free or Reduced School breakfast programs?
After-school snack programs?
Child care food programs such as free or low price meals at child care centers?
Summer food programs providing free lunches for children
None of the above
Now, I would like to ask you a few details about your household……
25. Are you: [Presumably can be completed without asking]
Male
Female
26. Which of these age groups best fits you?
18-34 years
35-64 years
65 or more years
Rather not say

61
27. Please tell me the age groups of people in your household not including yourself?
How many people in your household are . . .
Number in Household
Seniors (age 65 or older)
Adults (ages 18-64)
Children (ages 0-10)
Children (ages 11-17)
Rather not say
28. Can you tell me which of these categories best describes you currently? (Mark only
one)
employed full time for pay
employed part-time for pay
unemployed
rather not say
29. Which of the following groups best describes you… (Mark all that apply)
Caucasian or White
Asian
American Indian or Native American
Black or African American
Hispanic or Latino
Other:_____________
Rather not say
30. Do you have any comments/suggestions about the food and service at food
pantries?
___________________________________________________________________________
_____________________________________________________

62
APPENDIX 3. Food Pantry Director Survey
The Food Bank of Central New York
Food Pantry Director Survey
Hello. My name is __________. I am working with the Food Bank of Central New York to
better understand food preferences of food pantry guests and the challenges food
pantry directors experience in obtaining and providing foods. I would like to get your
ideas and opinions by asking you a few questions. Completing this survey is voluntary
and will take about 15 minutes.
------------------------------------------------------------------------------------------------------------------------------
1. How would you best describe the ethnicity of the guests you serve? What
percentage of your guests are: Caucasian or White, Asian, American Indian or Native
American, Black or African American, Hispanic or Latino?
Ethnicity Percent (%)
Caucasian or White
Asian
American Indian or Native American
Black or African American
Hispanic or Latino
Other:
Total 100%
We’re interested in how you think your guests would answer the following questions, so
please answer the next few questions from your guests’ point of view.
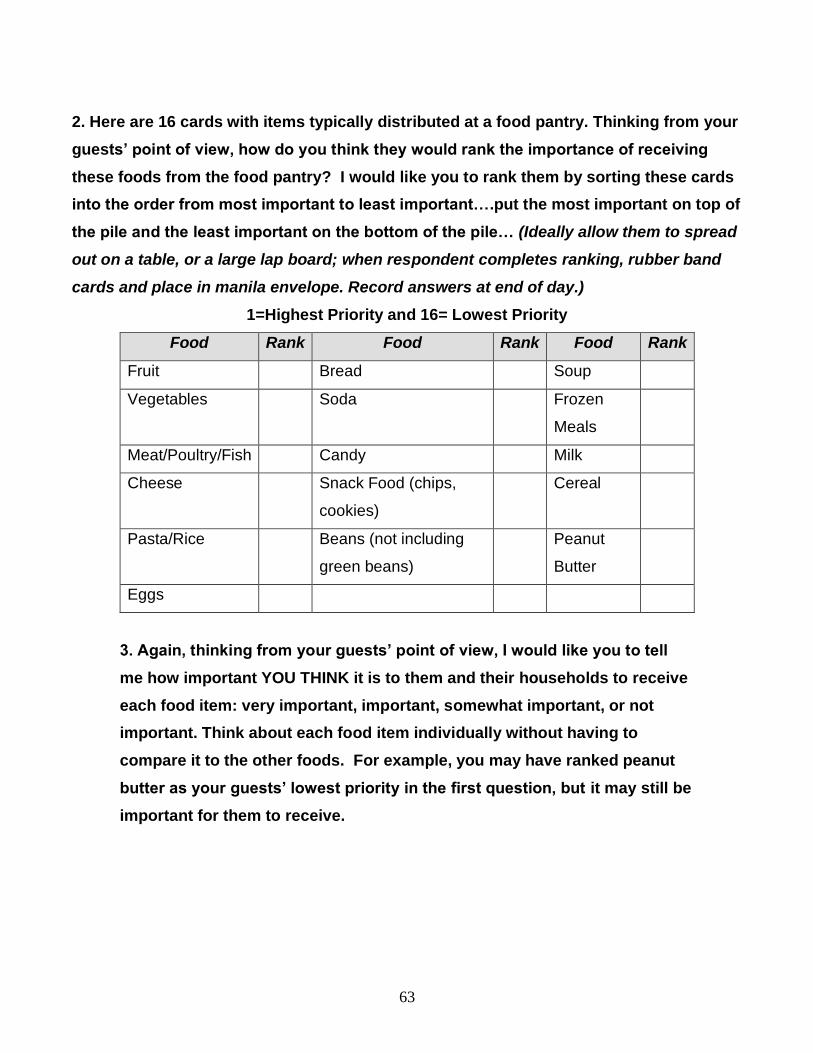
63
2. Here are 16 cards with items typically distributed at a food pantry. Thinking from your
guests’ point of view, how do you think they would rank the importance of receiving
these foods from the food pantry? I would like you to rank them by sorting these cards
into the order from most important to least important….put the most important on top of
the pile and the least important on the bottom of the pile… (Ideally allow them to spread
out on a table, or a large lap board; when respondent completes ranking, rubber band
cards and place in manila envelope. Record answers at end of day.)
1=Highest Priority and 16= Lowest Priority
Food Rank Food Rank Food Rank
Fruit Bread Soup
Vegetables Soda Frozen
Meals
Meat/Poultry/Fish Candy Milk
Cheese Snack Food (chips,
cookies)
Cereal
Pasta/Rice Beans (not including
green beans)
Peanut
Butter
Eggs
3. Again, thinking from your guests’ point of view, I would like you to tell
me how important YOU THINK it is to them and their households to receive
each food item: very important, important, somewhat important, or not
important. Think about each food item individually without having to
compare it to the other foods. For example, you may have ranked peanut
butter as your guests’ lowest priority in the first question, but it may still be
important for them to receive.
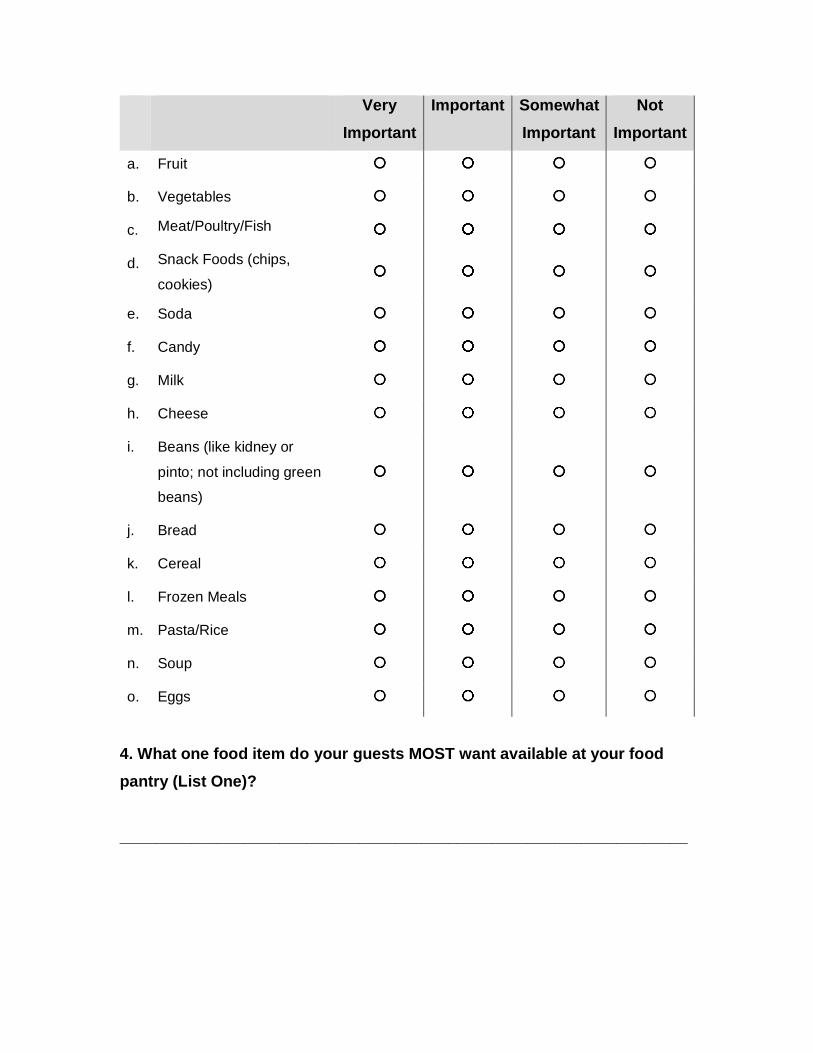
Very
Important
Important Somewhat
Important
Not
Important
a. Fruit
b. Vegetables
c. Meat/Poultry/Fish
d. Snack Foods (chips,
cookies)
e. Soda
f. Candy
g. Milk
h. Cheese
i. Beans (like kidney or
pinto; not including green
beans)
j. Bread
k. Cereal
l. Frozen Meals
m. Pasta/Rice
n. Soup
o. Eggs
4. What one food item do your guests MOST want available at your food
pantry (List One)?
________________________________________________________________
5. Which of the following do your guests most prefer to receive at your
food pantry? (Pick One)
Canned vegetables
Frozen vegetables
Fresh vegetables
6. In your opinion, which two vegetables do your guests most prefer to
receive at the food pantry?
1. ____________________________________
2. ____________________________________
7. In your opinion, which of the following do your guests most prefer to
receive at your food pantry?
Canned fruit
Frozen fruit
Fresh fruit
8. In your opinion, which two fruits do your guests most prefer to receive at
the food pantry?
1. ____________________________________
2. ____________________________________
9. In your opinion, which of the following do your guests most prefer to
receive at your food pantry? (Pick One)
Canned meat/poultry/fish
Frozen meat/poultry/fish

10. In your opinion, which two meat/poultry/fish items do your guests most
prefer to receive at the food pantry?
1. ____________________________________
2. ____________________________________
11. In your opinion, what type of beans (not including green beans ) do
your guests most prefer to receive at your food pantry?
Dry
Canned
12. In your opinion, name the top two types of beans (not including green
beans) that your guests most prefer to receive at your food pantry?
1. ____________________________________
2. ____________________________________
13. Now think about how milk is packaged. In your opinion, which type of
packaging of milk do your guests most prefer to receive at your food
pantry? (Pick One)
Dry
Refrigerated
Shelf-stable/boxed/aseptic
They wouldn’t use milk from the pantry <skip to Q15>

14. In your opinion, what type of milk do your guests most prefer to receive
at your food pantry? (Pick One)
Skim/Non-fat
1%
2%
Whole
15. In your opinion, what kind of rice do your guests most prefer to receive
at your food pantry?
Brown rice
White rice
16. In your opinion, what are the two breakfast cereals that your guests
MOST prefer to receive at your food pantry?
1. ____________________________________
2. ____________________________________
Again, thinking from the point of view of your guests and their
households…….
17. How important do you think the following are to your guests and their
households – Very Important, Important, Somewhat Important or Not
Important?
Guests think that the foods they get from the food pantry should be…
Very
Important
Important Somewhat
Important
Not
Important
a. Easy to prepare
b. Staple items that they
can make a meal out of
c. Filling
d. Tasty to them
e. Treats for them
f. Nutritious and good for
them
g. Familiar to them
h. Varied …to give some
break from the foods
they would normally eat
i. Easy to store
Please answer the next few questions thinking from your own point of view.
18. The food pantry bag usually lasts my guests…
1 day
2-3 days
4-5 days
6-7 days
More than 7 days

19. How much do you agree with the following statements – strongly agree,
somewhat agree, somewhat disagree, strongly disagree?
I think that . . .
Strongly
Agree
Somewhat
Agree
Somewhat
Disagree
Strongly
Disagree
a. The role of the food
pantry is to provide
healthy food items only.
b. The role of the food
pantry is to provide a
variety of foods including
soda and candy.
c. The Food Bank of
Central New York does
not accept or distribute
soda and candy.
20. Running a food pantry can be very difficult especially considering the
financial limitations. Please indicate what level of service your food pantry
is able to provide for the following items:
My food pantry is able to…
Excellent Good Fair Poor
a. Distribute food that is easy to
prepare for guests
b. Distribute foods that are staple
items that guests can make a
meal out of
c. Distribute food that is filling

Excellent Good Fair Poor
d. Distribute food that is tasty
e. Distribute food that are treats
f. Distribute food that is
nutritious and healthy
g. Distribute food that is familiar
to the guests
h. Distribute food that is varied
…to give some break from the
same foods they would
normally eat
i. Distribute food that is easy to
store
j. Distribute high quality fresh
produce
21. What are the problems in providing the following food items? (Mark all
that apply.)
Costs
too
much
Inconsistent
availability
Food
pantry
storage
problems
Guests
do not
like it
Guests
can
not
store it
Guests
can
not
cook it
No
problems
a. Fresh Fruit
b. Fresh
Vegetables
c. Meat/Poultry/Fish
d. Refrigerated Milk

Costs
too
much
Inconsistent
availability
Food
pantry
storage
problems
Guests
do not
like it
Guests
can
not
store it
Guests
can
not
cook it
No
problems
e. Whole Wheat
Bread
f. Brown Rice
g. Dry Beans
22. Do your guests have culturally-specific food preferences?
Yes
No
If yes, how would you describe these preferences?
23. What nutrition education resources, if any, do you provide for your
guests? Please indicate who provides each service. (Mark as many as
apply)
Recipes: Provided by____________
Food demonstrations: Provided by____________
Taste tests: Provided by____________
Written information/handouts: Provided by____________
Displays: Provided by____________
Classes: Provided by____________
Other:_______________________: Provided by____________
I do not provide nutrition education resources

24. How long have you worked in the food pantry system (please include all
food pantry experience)?
Less than 1 year
1-4 years
5-10 years
More than 10 years
25. Are you a paid employee or a volunteer?
Paid employee
Volunteer
26. Gender: [Presumably can be completed without asking]
Male
Female
27. Which of the following best describes you…. (Mark all that apply)
Caucasian or White
Asian
American Indian or Native American
Black or African American
Hispanic or Latino
Other:_____________
THANK YOU FOR YOUR HELP WITH THIS IMPORTANT SURVEY!

APPENDIX 4. Food Pantry Inventory Checklist
Food Pantry Inventory Checklist:
Using an “X”, indicate which foods were available at the time of data collection.
Food Item Available Food Item Available Food Item Available
1. Fruit
(list below)
6. Bread 11. Soup
2. Vegetables
(list below)
7. Soda 12. Frozen
Meals
3.
Meat/Poultry/Fish
(list below)
8. Candy 13. Milk
(list below)
4. Beans
(list below)
9. Snack Food
(chips,
cookies)
14. Cereal
5. Pasta/Rice 10. Cheese 15. Peanut Butter
Fruit (List) Fresh Frozen Canned
Vegetables (List) Fresh Frozen Canned
Meat/Poultry/Fish (List) Fresh Frozen Canned
Beans (List) Dry Canned
Milk (List) Dry Aseptic Refrigerated
Is this a client choice food pantry? _____ Yes _____ No
Additional Items (List with as much detail as possible)

APPENDIX 5. Food Pantry Bag Checklist
Food Pantry Bag Checklist (Interview Schedule):
Thank you so much for your time answering my questions. It was very helpful.
There is one more step that would help us evaluate the food and services
provided to you today. When you are finished getting your food, may we quickly
write down the items in your bag? The information will be confidential – your
name will not be on the form. Completing this survey is voluntary.
Yes____ No___ reason for refusal
Using an “X”, indicate which food items were found in the guest’s pantry bag.
Food Item Selected Food Item Selected Food Item Selected
1. Fruit
(list below)
6. Bread 11. Soup
2. Vegetables
(list below)
7. Soda 12. Frozen Meals
3. Meat/Poultry/Fish
(list below)
8. Candy 13. Milk
(list below)
4. Beans
(list below)
9. Snack Food
(chips, cookies)
14. Cereal
5. Pasta/Rice 10. Cheese 15. Peanut Butter
Fruit (List) Fresh Frozen Canned

Vegetables (List) Fresh Frozen Canned
Meat/Poultry/Fish (List) Fresh Frozen Canned
Beans (List) Dry Canned
Milk (List) Dry Aseptic Refrigerated
Additional Items(List with as much detail as possible)
