the foreign object damage project of the prda v hcf ... · fod task is the development of a design...
TRANSCRIPT

The Foreign Object Damage Project of the PRDA V HCF Materials and LifeMethods Program
Mr. Phillip Gravett*1, Dr. Richard Bellows2,Dr. Thomas Dunyak3, Dr. Douglas Herrmann4, Dr. Stephen Hudak Jr.5
* Presenting Author (Team Leader)1Pratt & Whitney, P.O. Box 109600 West Palm Beach, FL 33410-9600
2AlliedSignal Engines, P.O. Box 52181, Phoenix, AZ 85072-21813G.E. Aircraft Engines, One Neuman Way, Cincinnati, OH 45215-6301
4Allison Adv. Devl. Co., P.O. Box 420, Speed Code T-10B Indianapolis, IN 46206-04205Southwest Research Institute, P.O. Drawer 28510 San Antonio, TX 78228-0510
The USAF PRDA V Improved High Cycle Fatigue (HCF) Life Prediction program is atwo year industry program chartered with the development of a damage tolerant basedlife prediction methodology toward the mitigation of HCF failures in titanium fan andcompressor components of turbine engines. The Foreign Object Damage (FOD) task ofthe program seeks to eliminate HCF failures engendered by crack initiation and growthfrom the material damage zone associated with in-service FOD. The overall goal of theFOD task is the development of a design method by which relevant airfoil parameters(i.e. leading edge radius, taper, etc.) can be optimized for FOD tolerance. In addition, themethod should allow for a more rigorous approach to the determination of nick and blendlimits for management of FOD in the fleet.
The objective of the current program is to gain a better understanding of the effects of“typical” FOD on the HCF performance of 1st stage fan blades, and evaluate methods topredict the effects of FOD on crack initiation and growth. The approach to achieve thisobjective, illustrated schematically in Figure 1, encompasses experimental and analyticefforts. This approach began with an extensive data collection effort of in-service FODoccurrence to define “typical” FOD parameters which are deemed critical. Second, thedurability of laboratory simulated FOD is being experimentally characterized, and thepermanent deformation and residual stress from these FOD impacts are being analyticallypredicted. Finally, the experimental FOD durability and predicted residual stress

information is being used to evaluate the life models developed in the HCF/LCF task ofthe PRDA V program (1). In a follow on program, the developed methodology will beapplied to more complex component tests, which more closely resemble turbine enginecomponents.
In the initial stages of the program, existing data was collected on the relevantcharacteristics of FOD. In seeking information on the distribution of FOD sizes, shapesand occurrence rates observed in the fleet, it was determined that very little systematicdata was available. As a result, a field inspection campaign was initiated to collect suchdata from over 600 FOD sites on over 8000 blades of various military engines. Thisincluded information on the occurrence rate per stage and blade span location, as well asthe FOD size, depth, shape, notch root radius, and overall deformation. This informationwas presented in more detail at a previous HCF conference (2). Evaluation of thisinformation guided the definition of the test and modeling program to focus on relativelysmall FOD located on the outboard section of a fan blade (Figure 2). This FOD couldconceivably not be detected during preflight inspections and thus is critical to understand.A complete list of the FOD parameters to be evaluated is provided in Table 1.
To feasibly characterize the effects of numerous FOD parameters on blade tip durabilityin the laboratory, a flexural type “winged” specimen was designed for the FOD testprogram. The objective of the specimen design was to provide a simulated airfoil leadingedge geometry and stress, which can be easily varied, while allowing the capability forhigh frequency fully reversed loading. Finite Element Analysis (FEA) of this specimenshows the simulated airfoil tip of the winged specimen closely approximates thegeometry and stress field of a fan blade (Figure 3).
The second component of the FOD laboratory simulations is the method by which FODis introduced. Various existing techniques were evaluated, considering damage statecontrol and simulation of in-service FOD. The selected method uses an electric solenoidgun and a chisel shaped indentor to FOD specimens. Initially, this method is also beingcorrelated to an air gun ballistic method with the winged laboratory specimen tests(Figure 4) for representative impact regions for both methods.
The third component of the laboratory simulation is the actual cyclic testing. The testingis being conducted on servo-hydraulic test machines in 4-point bending fixtures, withloading pins on both sides on the specimen to allow for fully reversed loading. The testsutilize electric potential drop (EPD) techniques to detect initiation, and selective heattinting to document the crack size and crack front geometry during the test.
Evaluation of FOD methods with the winged specimen has initiated. Initial results showthat baseline (undamaged) tests correlate well to smooth bar fatigue tests from the

HCF/LCF task. The addition of FOD damage results in a debit on 1x10⁶ cycle fatiguestress, but the effect seems to have a low sensitivity to FOD depth in the range tested.This is in spite of tearing seen in the ~0.020” FOD specimens. Figure 5 gives plots of thetest results. The remaining test program will seek to characterize the HCF response of theFOD specimens for model development and calibration for the parameters defined inTable 1.
In a parallel effort, a diamond cross section tensile (DCT) specimen with a quasi-staticservo-indentor FOD method is being evaluated. This effort has tested baseline(undamaged) and FOD damaged specimens to determine the repeatability of the FODdamage introduction and the effect of FOD on initiation based fatigue life. Initial testresults show good correlation between baseline DCT and smooth bar baseline tests, andthat 0.025” depth FOD shows gross deformation and has greatest effect on life. Figure 6provides FOD deformation and test results.
In parallel to the FOD testing effort, the dynamic impact code DYNA 3D is being used topotentially develop the capability to predict FOD damage through numerical simulation.This will offer a method to determine the effective geometric stress concentration,associated stress field and residual stress state such that the local stresses and strainsduring fatigue loading can be predicted for input into an HCF/LCF fatigue model. It isenvisioned that these simulations will allow sensitivity studies to be performed withrespect to design variables, such as leading edge radius, to evaluate the damage state andprovide predictive information for conditions not tested.
In tandem with the DYNA 3D simulations, analytic techniques are being developed forthe prediction of FOD HCF capability. Approaches are currently being explored forevaluating the geometric stress concentrations and the associated stress gradient andcrack stress intensity (K) for FOD engendered notches, including effects of notchsensitivity and residual stress. This information is necessary to understanding the materialstate in the vicinity of FOD damage, and how subsequent cyclic loading stresses interactwith the FOD damage.
With the effects of the FOD event on the stress state of the leading edge predicted, theinitiation (1), crack growth (1), and worst case notch (WCN) (3) models developed in theHCF/LCF task will be evaluated and correlated with the laboratory test results. TheHCF/LCF initiation models, both stress invariant and critical plane, will be evaluatedwith the FOD durability testing on the winged specimen design. Likewise, the HCF/LCFcrack growth models will be evaluated with the FOD durability testing to definethreshold crack initiation based criteria. The accuracy and application of these modelswill be assessed, and the most appropriate chosen for further evaluation in followingprograms. The WCN model will be evaluated to assess the applicability to the

establishment of improved blade FOD accept/reject criteria and blend limits. In followingprograms, these models will be used to predict the effect of damage level on initiation inbench tested fan and compressor blades at elevated temperatures.
Reference:1. DeLaneuville, Robert, “The HCF/LCF Interaction Project in the PRDA V HCF
Materials and Life Methods Program,” 4th National Turbine Engine High CycleFatigue Conference, Monterey, CA, 9 February 1999.
2. Walls, Dr. David, “The Foreign Object Damage Project in the PRDA V HCFMaterials and Life Methods Program,” 3rd National Turbine Engine High CycleFatigue Conference, San Antonio, TX, 4 February 1998.
3. Hudak, Dr. Stephen, “A Damage Tolerance Approach to FOD based Propagation andArrest of Cracks at Notches,” 4th National Turbine Engine High Cycle FatigueConference, Monterey, CA, 11 February 1999.
Table 1. FOD parameters and range for FOD characterization test program.
FOD Parameter Range
FOD depth 0.005” - 0.025”
FOD incidence angles 0°, 30°, and 90°
Loading R-ratio -1.0 (simulate blade tip)0.5 (simulate mid-span)
Leading edge diameter 0.010” (aerodynamic )0.030” (robust)
Problem Understanding
FOD occurrence:⇒ stage⇒ span location⇒ depth⇒ shape
σR
damage level
106
init
iati
on s
tres
s
FOD Event Testing & Modeling Durability Modeling
distance from FOD
resi
dual
str
ess
Figure 1. A Schematic representation of the overall approach of the FOD effort.

0
2
4
6
8
10
12
14
16
18
20
0
0.05 0.1
0.15 0.2
0.25 0.3
0.35 0.4
0.45 0.5
FOD Depth (in)
Fre
qu
ency
0%
10%
20%
30%
40%
50%
60%
70%
80%
90%
100%
1
4
7
1 0
1 3
1 6
0% 10% 20
%
30% 40
%
50%
60% 70
%
80%
90%
100%
% o
f FO
D
S t a g e
% S p a n
7 0 % - 8 0 %
6 0 % - 7 0 %
5 0 % - 6 0 %
4 0 % - 5 0 %
3 0 % - 4 0 %
2 0 % - 3 0 %
1 0 % - 2 0 %
0 % - 1 0 %
a. b.Figure 2. Distribution of in service FOD by depth (a) and span wise location (b).
B
A
σσ
A
B≈ 2
B
A
σσ
A
B= 1 7.
a. b.Figure 3. A Comparison of the fan blade (a) and winged specimen (b) FEA
modeling.
Some tearing in the FOD region
a. b. c.Figure 4. FOD damage sites from ballistic impact (a) and solenoid gun (chisel
indentor) low damage (b) and high damage (c) methods.

10.0
100.0
10,000 100,000 1,000,000 10,000,
Cycles to Failure
Str
ess
Ran
ge
(ksi
)
HCF/LCF Smooth Bar Results
FOD Specimens Without Damage
FOD Specimens with Low Damage Level
FOD Specimens with High Damage Level
{
4 Step Tests, Two Runouts
Note: All FOD Tests with Failuresat 1x10̂ 6 Cycles were Step Tests
0.0
10.0
20.0
30.0
40.0
50.0
60.0
0.000 0.005 0.010 0.015 0.020 0.025 0.03
Notch Depth as Measured at 33.4°F (Inches)
Alt
erna
ting
Str
ess
at F
ailu
re (
Ksi
)
Sharp Leading Edge, 0.005 In. Indentor Tip
a. b.Figure 5. Initial winged specimen test stress vs. cycles (a) and stress vs. FOD depth
(b) plots.
n
n
nnnn
n
n
n
n
nn
n
n
n
nnnn
n n n
nn
n
ÐÐ
ÐÐ
����
�
�
�
�
���
�
��
���
40
100
160
1,000 10,000 100,000 1,000,000 10,000,000Cycles to Failure
n Smooth
Ð Smooth Runout
� Smooth Step Test
� Baseline Airfoil
� 5 mil FOD
� 25 mil FOD
R= -1
R= 0.5
60 Hz, RT
AirfoilStep Test
a. b.Figure 6. Initial Diamond Cross section Tensile specimen FOD (a) and durability
test results (b).

A Damage Tolerance Approach to FOD Based on the“Worst Case Notch” Concept
Dr. Stephen J. Hudak, Jr.*, Dr. G. Graham ChellMr. Timothy S. Rennick, Dr. R. Craig McClung, and Dr. David L. Davidson,
Southwest Research Institute6220 Culebra Rd.
San Antonio, TX 78238-5166
INTRODUCTION
The occurrence of foreign object damage (FOD) can significantly reduce theresistance of turbine blades to high cycle fatigue (HCF). Thus, FOD needs to beexplicitly accounted for in designing against HCF. In so doing, two elements of theproblem need to be addressedthe geometric stress concentration effect of the FODshape, as well as the residual stresses induced by the FOD impact. The current paper isfocused on the geometrical influence of the FOD stress concentration on HCF behavior. The methods described herein can be readily extended to include the influence of theFOD residual stresses, once these stresses are known. However, the precise definitionof these residual stresses remains problematical because of the high gradients and smallsize scales over which these residual stresses occur. Ongoing research within the overallPRDA V HCF Program is addressing this problem.
The severity of FOD-induced notches can vary significantly, depending on their depthand root radiusboth of which can vary appreciably [1-2]. It is well known fromclassical fatigue research that sharp notches are less damaging than one might anticipatebased on their high theoretical elastic stress concentration factors and several empiricalapproaches have attempted to account for this effect [for example, see Ref. 3]. Morerecently, it has been suggested that this effect is fundamentally related to the initiation,propagation and arrest of microcracks in the presence of the high stress gradientsassociated with sharp notches. Specifically, sharp notches tend to initiate microcracksthat eventually arrest as they grow out of the influence of the highly concentrated notchstress field [4-6]. For some time, these observations appeared to be inconsistent withclassical fracture mechanics solutions of cracks growing from notches since suchsolutions predict increasing crack driving forcesand thus continued crack

growthrather than arrest. However, recent understanding of the unique behavior ofsmall fatigue cracks has provided an explanation of this crack arrest behavior [5-7], andinitial success using fracture mechanics to estimate the propagation and arrest of smallcracks at notches has motivated the present work [6]. If the occurrence of these non-propagating cracks can be confidently predicted, this dormant state can be takenadvantage of in HCF design.
“WORST CASE NOTCH” CONCEPT
Treating small crack effects and the associated conditions for non-propagation ofcracks in the stress gradients of notches can lead to the definition of a limiting “worst-case notch”. Such an approach could provide a viable engineering solution to theproblem of dealing with the large variation in FOD-notch geometry that is encounteredin turbine engine blades. Initial developments along these lines have demonstratedsuccess in treating the variation in weld-toe root radii, and their consequent effects onthe HCF behavior of offshore structures [8, 9].
The “worst case notch” concept is illustrated in Figure 1 where the nominally appliedthreshold stress for a notched member is shown as a function of both the elastic stressconcentration factor kt and crack size ‘a’. As can be seen in Figure 1a, the thresholdstress, computed by dividing the endurance limit (∆σe) by kt, continually decreases withincreasing kt (and notch severity). However, worst case notch theory predicts a limitingkt, termed kw, above which further increases in kt no longer result in decreases in thethreshold stress due to the occurrence of crack arrest and non-propagating cracks. Thesecurves define boundaries separating three distinct regimes where: 1) crack initiation willnot occur; 2) crack initiation will occur, followed by crack arrest; and 3) crack initiationfollowed by crack growth will result in failure of the notched member. These sameregimes are shown as a function of crack size in Figure 1b, for a fixed notch depth andthree different notch root radii, ρ1, ρ2, ρ3. As indicated in Figure 1b, the threshold stressincreases as the radius increases and there exists a limiting radius, ρw, above which crackarrest can not occur. In general, the notch severity will be a function of both the notchdepth, b, and the notch root radius, ρ, thus the phase boundaries in Figure 1b will movewith varying notch depth. However, since this dependence can be computed usingfracture mechanics, the worst case notch can always be defined. The goal of the worstcase notch approach is to quantify these dependencies and thereby treat the fatigue notchproblem in a systematic fashion that can be employed in design.
In general, the threshold stress is a function of the FOD-notch geometry, loadingmode, and material variables as follows:
∆σth = ∆σth (kt[b, ρ], a, a0, λ) [1]

where λ is a parameter which depends on loading mode (e.g., tension vs bending) anda0 is the small crack parameter suggested by El Haddad et. al. [10] given by:
a0 = 1/π(∆Kth/F∆σe)2 [2]
where ∆Kth is the threshold stress intensity factor range for measurable fatigue crackgrowth, ∆σe is the smooth bar endurance limit, and F is the geometry factor for athumbnail crack in a smooth bar given by 1.12 (2/π) = 0.713.
Although there has been extensive debate regarding the physical significance of ao asa material constant, we interpret it here as a parameter which interpolates between thesmooth and cracked specimen responses in terms of a crack-length-dependent, small-crack threshold stress intensity, ∆Kth (a), given as:
∆ ∆K a K Ra
a ath tho
( ) ( )
/
=+
1 2
[3]
where ∆Kth (R) is the long crack threshold, which depends on load ratio (R).
MECHANICS OF NOTCHES
The stress intensity factors (SIFs) for cracks emanating from FOD are needed forfatigue crack growth/arrest analyses and for determining worst case notch (WCN)scenarios. In the present work, the SIF is calculated from the stress ahead of the FODin the absence of a crack, σFOD(x/ρ, kt[b,ρ]), using the weight function approach, wherethe distance x is measured from the root of the FOD. If W(a,x,a/ρ,kt[b,ρ]) is the weightfunction for a crack at a notch, then the SIF, K(a, a/ρ, kt[b,ρ]) for a crack of depth, a,is given by:
[ ]( ) [ ]( ) [ ]( )dx,bk,/x,bk,/a,x,aW,bk,/a,aK tFOD
a
0
ttFOD ρρσρρ=ρρ ∫ [4]
In general, σFOD will include a contribution from residual stresses induced during theformation of the FOD, as well as the local stress resulting from remote blade loading.The weight function, W, is estimated from the SIF solutions for cracks at surface notchessubjected to remote uniform tension [11] using the reference solution approach. TheseSIF solutions were represented parametrically in the form:
( ) )b/,s(Fab/,/a,aK notch ρπσ=ρρ [5]

where σ is the remote stress, and s = a/(a + b). W in Eq [4] was derived using therelationship:
( )[ ]( ) [ ]( )
a
dx,bk,/x,bk,/a,x,aW
b/,sFtnotch
a
0
t
πσ
ρρσρρ=ρ
∫[6]
The following parametric equations is used for kt
( ) ( )
122.1
bK21 b/f = k t
πρ+ρ [7]
where
( )( )2
5
b/1
0.122 +1 = b/f
ρ+ρ [8]
is a free surface correction factor given in Tada et.al. [11]. The SIF, K(b), is evaluatedusing the remote stress and the crack size is taken to be the depth of the notch.
The following expression, derived by Amstutz and Seeger [12], is used for( )tk,/x
notchρσ in Eq. [6]:
( )( )
ρφ+
−+σ=ρσ
ψ/x1t
1k1k,/x t
ttnotch [9]
where
50 < k < 2 , )0.9224 - (k
2.706- 3.226 = t0.5018
t
φ [10a]
2 < k < 1 , )1-0.394(k + 0.226 = t3.0457
tφ [10b]
ψφ
=+
−1 2 1
1
k
kt
t

COMPARISON OF MODEL PREDICTIONS AND EXPERIMENTS
In order to assess the viability of the “worst case notch” model, predictions of themodel were compared with available notched HCF data from the literature, includingboth historical data on steel [4,5], and recently acquired data on Ti-6Al-4V from thePRDA V HCF Program [13].
Figure 2 shows that the prediction of the various threshold stress ranges as a functionof the elastic stress concentration factor are in good agreement with the measurementsof Frost et. al. [4,5] on notched mild-steel specimens. The value of ao used in thesepredictions for mild steel was 0.45 mm. Note that both the threshold stress forinitiation/arrest and for complete failure of the specimens are in reasonable agreementwith the measurements. Moreover, the limiting threshold stress range, corresponding tothe worst case notch, is correctly predicted to be dependent on specimen geometry. Thecracked round bar (CRB) specimen was modeled as a surface crack growing from thenotch, while the double edge notch plate (DENP) specimen was modeled as a through-thickness crack in a plate. The differences in crack and specimen geometry give rise tothe lower threshold stress for the DENP specimen, in agreement with the trend in themeasured data.
Figure 3 shows the predicted variation in the threshold stress as a function of crackdepth for the case of steel containing notches of constant depth and three different notchroot radii. These results clearly illustrate the increased tendency for crack arrest at thesharper notches as the result of the well-defined local maximum in the curve for thesharpest notch. This feature of the model is a direct consequence of the manner in whichthe small crack effect is represented. Specifically, Figure 4 shows three differentassumptions regarding the treatment of small crack effects. The solid curve is for thecase where small cracks are assumed to have a ∆Kth that is crack size dependent asdescribed by Eq. [3]. As can be seen, this assumption leads to markedly differentpredictions compared to the case where an equivalent initial flaw size is assumedthatis, ‘a’ is replaced by a +a0 in every crack size term in Eq. [5]. As shown in Figure 4, theequivalent crack size assumption is similar to assuming there is no small crack effect (a0
= 0) in that neither interpretation predicts crack arrest.
As demonstrated by Topper and El Haddad, analyses of this type enable the fatiguenotch reduction factors (kf) to be predicted based on fracture mechanics concepts. Forthe case of FODwhich can induce relatively sharp notchesthis approach wouldappear to be superior to the classical approach of defining an empirical relationshipbetween kf and kt. This notion is demonstrated by the model predictions in Figure 5which show a family of threshold stress versus crack size curves for various combinationsof notch depth and radii, all corresponding to the same kt of 7.5. These results clearlydemonstrate that the crack arrest capability of notches depends both on their radii and

depthas well as on the crack and specimen geometry, as previously shown in Figure2. Thus, simple empirical correlations between kf and kt are bound to break down incertain regimesparticularly for deep, sharp notches of the type that can be producedby FOD.
Figures 6 and 7 show model predictions for R = -1 and 0.5, respectively, comparedwith corresponding HCF data on Ti-6Al-4V [13]. The model predictions depend on Rthrough the R-dependence of both the endurance limit and the crack growth threshold,both of which govern a0. Although the predictions are in good agreement with the data,they do not provide a very robust assessment of the viability of the model for Ti-alloyssince the low kt data shown are in the region governed by ∆σth/kt. Additional testing isplanned with sharper notches to verify the region where crack arrest is predicted.
Figure 8 illustrates the expected ∆σth trend predicted from the “worst case notchtheory” and compares this with various levels of applied stress. These results illustratea possible scenario by which “interactions” between HCF and LCF (low cycle fatigue)can occur. For the case shown, initial HCF loading at a relatively low applied stressrange results in the initiation, growth and arrest of a crack. This is followed by LCFloading at a higher stress range that results in further crack growth. Nevertheless,subsequent HCF loading results in no additional HCF damage since the applied stressrange is still below ∆σth. At this point, a tolerable margin of LCF crack growth stillexists. However, as illustrated in Figure 8, further LCF crack growth beyond the crackarrest regime could eventually trigger additional HCF propagation which could result incomponent failure.
CONCLUDING REMARKS
Initial comparisons between model predictions and experiments on steel and titaniumalloy provide encouragement that the “worst case notch” approach may be useful forHCF design of components subjected to FOD. This approach would be particularlyuseful for design against FOD with highly variable root radii, since the existence of the“worst case” limiting value of ∆σth precludes the need for detailed knowledge of the FODroot radii. Although this approach requires small crack effects to be treated, it isotherwise fully compatible with existing LCF design methods. Also, since theconcentrated stresses and stress gradients are similar in notches and in fretting fatigue,the worst case notch concepts can be extended by analogy to the treatment of frettingfatigue as discussed elsewhere in this proceedings [14].

ACKNOWLEDGEMENT
This material is based upon work supported by the U. S. Air Force ResearchLaboratory (AFRL) under Contract No. F33615-96-C-5269 managed by the Universityof Dayton Research Institute. The support and encouragement of Mr. Joseph Burnsand Dr. Ted Nicholas of AFRL, as well as the HCF Damage Tolerance Team, aregreatly appreciated.
REFERENCES
1. J. M. Larsen, B. D. Worth, C. G. Annis, Jr., and F. K. Haake, “An Assessment of the Role of Near-Threshold Crack Growth in High-Cycle Fatigue Life Predictions of Aerospace Titanium Alloys UnderTurbine Engine Spectra,” International Journal of Fracture, Vol. 80, 1996, pp. 237-255.
2. S. J. Hudak, Jr., R. C. McClung, K. S. Chan, G. G. Chell, and D. L. Davidson, “High Cycle Fatigueof Turbine Engine Materials,” SwRI’s Annual Interim Technical Report to UDRI under PRDA 95,January 15, 1998.
3. R. E. Peterson, “Stress Concentration Factors,” John Wiley and Sons, New York, 1974.4. N. E. Frost and D. S. Dugdale, Journal of the Mechanics and Physics of Solids, Vol. 5, 1957, p.182.5. Metal Fatigue, N. E. Frost, K. J. Marsh, and L. P. Pook, Clarendon Press, Oxford, 1974.6. T. H. Topper and M. H. El Haddad, “Fatigue Strength Predictions of Notches Based on Fracture
Mechanics,” Fatigue Thresholds: Fundamentals and Engineering Applications, EngineeringMaterials Advisory Services, LTD, Warley, U.K., 1982.
7. S. J. Hudak, Jr., “Small Crack Behavior and the Prediction of Fatigue Life,” ASME Trans., Journalof Engineering Materials and Technology, Vol. 103, 1982, p. 26.
8. F. V. Lawrence, “Predicting the Fatigue Resistance of Welds,” Annual Review of Material Science,Vol. 11, 1981, p. 401.
9. S. J. Hudak, Jr., O. H. Burnside, and K. S. Chan, “Analysis of Corrosion Fatigue Crack Growth inTubular Joints,” ASME Trans., Journal of Energy Resource Technology, Vol. 107, 1985.
10. M. H. El Haddad, K. N. Smith, and T. H. Topper. Fatigue Crack Propagation of Short Cracks,” ASMEJ. of Engr. Materials. & Tech., Vol. 101,1979, p. 42.
11. H. Tada, P. Paris, and G. Irwin, The Stress Analysis of Cracks Handbook, 2nd Edition, Del. ResearchCorporation, 1985.
12. H. Amstutz and T. Seeger, “Accurate and Approximate Elastic Stress Distribution in the Vicinity ofNotches in Plates Under Tension” Unpublished Results. (referenced in G. Savaidis, M. Dankert, andT. Seeger, “An Analytical Procedure for Predicting Opening Loads of Cracks at Notches. Fatigue,”Fract. Engng Mater. Struct., Vol. 18, No. 4, pp. 425-442, 1995).
13. R. deLaneuville, J. Sheldon, K. Bain, D. Slavik, R. Bellows, R. C. McClung, D. L. Davidson, and D.Herrman, “The HCF/LCF Interaction Project in the PRDA V HCF Materials and Life MethodsProgram,” Proceedings of the 4th National Turbine Engine High Cycle Fatigue Conference, Monterey,CA, February, 1999.
14. K. S. Chan, Y-D. Lee, D. L. Davidson, and S. J. Hudak, Jr., “A Fracture Mechanics Approach to HighCycle Fretting Fatigue Based on the Worst Case Fret Concept,” Proceedings of the 4th NationalTurbine Engine High Cycle Fatigue Conference, Monterey, CA, February, 1999.

Figure 1. Schematic illustration of the “worst case notch” concept. The “worst casenotch” can be defined in terms of either a limiting kt, termed kw, or, for the case of aconstant notch depth, a limiting notch root radius ρw. In general, the “worst case notch”will depend on notch depth and radius in a manner that can be predicted using fracturemechanics analysis.
k t
1 2 3 4 5 6 7 8 9 10 11 12 13 14 15
∆∆ σσth
, MP
a
0
20
40
60
80
100
120
140
160
180
200
220
240
260
280
300
DENP - failure predictionCRB - failure predictionsmooth fatigue limit / kt
DENP - crack initiation/arrestCRB - crack initiation/arrestDENP - failureCRB - failure
Figure 2. Comparison of “worst case notch” predictions with notched steel HCF dataof Refs. [4,5] showing good agreement including correct prediction of specimengeometry effects.
Crack Initiationplus Growth to Failure
Crack Growthand ArrestNo
InitiationThr
esho
ld S
tres
s, ∆
σ th
Thr
esho
ld S
tres
s, ∆
σ th
kw∆σe/kt
ρ3>ρ2>ρ1
Constant Notch Depth
Crack Growthto Failure
ρ3
CrackGrowth
ρ2=ρw
CrackGrowth
ρ1 Crack Arrest
Crack Size, aStress Concentration Factor, kt
a) b)

a, mm
0.01 0.1 1 10 100
∆∆ σσth
, MP
a
0
20
40
60
80
100
120
140
160
180
200
ρ = 11.25 mm, k t = 2.16
ρ = 2.25 mm, k t = 3.66
ρ = 0.102 mm, k t = 13.9
crack initiation and arrest no propagation
initiation and propagation to failure
initiation and propagation to failure
Figure 3. Predicted variation of threshold stress versus crack size for several notch radiiand a constant notch depth in steel illustrating the tendency for crack arrest withincreasing notch sharpness.
a, mm
0.01 0.1 1 10 100
∆∆σσ t
h, M
Pa
0
20
40
60
80
100
120
140
160
180
200
∆Kth(a) model
Equivalent initial flawao = 0
ρ = 0.102 mm, k t = 13.9
Figure 4. Predicted variation in threshold stress versus crack size in steel depending ondifferent methods of treating small crack effects. The notion that ∆Kth is a function ofcrack size predicts crack arrest in best agreement with HCF data in sharply notchedspecimens.

a, mm
0.001 0.01 0.1 1 10
∆∆ σσth
, MP
a
60
80
100
120
140
160
180
200notch depth(mm)/root radius(mm) 0.2/0.0221
0.3/0.0331
0.4/0.0442
0.5/0.0552
0.7/0.0773
0.9/0.0994
k t = 7.5
Figure 5. Predicted threshold stress versus crack size in steel for varying notch depthsand radii, each giving the same kt of 7.5. Results illustrate that kt alone is not adequateto describe the HCF behavior of notched members.
k t
2 4 6 8 10 12 14
∆∆ σσth
, MP
a
0
100
200
300
400
500
600
700
800
900
V-notched specimenSemi-circular notched specimensmooth fatigue limit / k tmeasured, semi-circular notch
R = -1
smooth fatigue limit
Figure 6. Comparison of ‘worst case notch’ predictions and notched HCF data of Ref.[13] for Ti-6Al-4V at R = -1.

k t
2 4 6 8 10 12 14
∆∆ σσth
, MP
a
0
50
100
150
200
250
300
350
400
V-notched specimenSemi-circular notched specimensmooth fatigue limit / k tmeasured, semi-circular notch
R = 0.5
smooth fatigue limit
Figure 7. Comparison of ‘worst case notch’ predictions and notched HCF data of Ref.[13] for Ti-6Al-4V at R = 0.5.
Figure 8. Postulated HCF/LCF “interaction” in notched members.

Notch Size Effects and LCF/HCF Interactions in Ti-6Al-4V†
Dr. David Lanning* and Col. George K. Haritos, Ph.D.Air Force Institute of Technology
2950 P StreetWright-Patterson AFB, OH 45433-7765
Dr. Theodore NicholasAir Force Research Laboratory
2230 Tenth Street, Ste. 1Wright-Patterson AFB, OH 45433-7817
Notch size effects in two Ti-6Al-4V specimen geometries under high cyclefatigue loading and the influence of combined LCF/HCF (low cycle fatigue/highcycle fatigue) loadings are investigated. Flat dogbone specimens with two sizes ofnotches, having elastic stress concentration factors of Kt = 2.7, were cycled togenerate points on a Haigh diagram for a constant life of 106 fatigue cycles using astep loading technique. The loading conditions required for failure are compared tothose of circumferentially notched cylindrical specimens for the same fatigue life, interms of the stress state at the notch root both with and without stressredistribution due to plastic deformation. Cylindrical fatigue specimens, with twosizes of circumferential V-notches where Kt = 2.7, were initially cycled under LCFloading conditions. The HCF fatigue limit was subsequently determined using thestep loading method, and compared to baseline HCF fatigue limits without priorLCF damage.
Previous work has shown that one of the controlling parameters of thenotch size effect in Ti-6Al-4V is the product form (Lanning et al., 1999), and thatthere was little notch size effect in a Ti-6Al-4V forged plate product form for arange of notch sizes in cylindrical specimens having an elastic stress concentrationfactor of Kt = 2.7. All specimens in the present study were taken from the same Ti-
† The views expressed in this article are those of the authors and do not reflect theofficial policy or position of the United States Air Force, Department of Defense,or the U.S. Government.

6Al-4V forged plate product form. Mechanical properties of the Ti-6Al-4V plateare provided in Table 1 for two strain rates, and details of the forged plate heattreatment may be found elsewhere (Lanning et al., 1999).
Flat dogbone specimens were machined with opposite V-notches.Diagrams of the flat dogbone specimens and circumferentially notched cylindricalspecimens used in this investigation are shown in Figure 1, and the correspondingdimensions are provided in Tables 2 and 3. All notch sizes from both geometrieshave elastic stress concentration factors of approximately Kt = 2.7 (Nisitani andNoda, 1984; Peterson, 1974). The out-of-plane stress component of the biaxialstress state at the notch root, halfway through the thickness, is less than thecircumferential stress at the surface of the notch root in the cylindrical specimens.A step loading method for generating points on the Haigh (Goodman) diagram fora constant life of 106 fatigue cycles was used. This method has been verified forunnotched Ti-6Al-4V specimens at 107 cycles (Maxwell et al., 1998) and notchedTi-6Al-4V specimens at 106 cycles (Lanning et al., 1999). All specimens werecycled at a frequency of 50 Hz, and at stress ratios of R = 0.1, 0.5, and 0.8.
The Haigh diagram for the V-notched flat specimens is shown in Figure 2.A notch size effect is evident, where the smaller notch requires higher stresses toproduce failure at 106 cycles for a given stress ratio. Figure 3 provides acomparison between the results for both flat and cylindrical notched specimengeometries. While the notch size effect is evident in the flat specimens, it does notappear to be significant in the cylindrical specimens, for the range of notch sizestested. The fatigue notch factors illustrate the notch size effect, and are provided inTable 4.
Three-dimensional elastic finite element models of the flat specimengeometries were solved with NASTRAN to characterize the biaxial stress statealong the surface of the notch root. Figure 4 shows the calculated stressdistribution along the root of the notch for both the small and large notchgeometries, normalized with the average stress across the reduced cross-section.The von Mises effective stress for the cylindrical specimens was estimated to beσeff = 0.88σx for all three notch sizes, where σx is the axial stress in the direction ofloading (Leven, 1955). The data from the Haigh diagram in Figure 3 has beenreplotted in terms of effective mean and alternating stresses in Figure 5. While theuse of effective stresses may collapse the data somewhat towards a single curve, itis not clear that this can substantially improve HCF lifetime predictions.
Additional insight into the notch behavior under HCF loadings may begained by solving for the stress state and local stress ratio in the vicinity of thenotch root after stress redistribution occurs due to plasticity. Elastic perfectly-plastic, two-dimensional, plane strain finite element models (FEM) of the flatnotched specimens were solved with ABAQUS to provide the stress states at the

points of maximum and minimum loading during the fatigue cycle. The von Misesyielding criterion was used in the elastic-plastic solution, using the mechanicalproperties obtained from tensile tests at elevated strain rates (0.05 s-1) given inTable 1. Significant stress redistribution occurs at R = 0.8, where the notch rootexperiences a local stress ratio of around R = 0.6. Only minor redistribution occursat an applied stress ratio of R = 0.5. A comparison between the notch tip stressesafter stress redistribution occurs, and the elastic notch tip stresses if noredistribution were to occur is shown in Figure 6. Both mean and alternatingstresses are plotted as effective quantities. Unnotched specimen baseline data andthe uniaxial yield surface are also shown. The determination and use of the localstress ratio in favor of the applied stress ratio may aid in the understanding andprediction of HCF behavior of notched components where stress redistributionoccurs due to plasticity.
The concept of a critical distance from the notch root over which thestresses may be averaged is under investigation. The distance over which theaverage stress range in the axial direction of a notched specimen is equal to that ofa smooth specimen for fatigue lives of 106 cycles, calculated from elastic-plasticFEM solutions, is plotted versus the averaged mean stress in Figure 7. Plotting thecritical distance on a log scale, it may be possible to draw a straight line throughthe data points, and to develop a scheme for predicting the fatigue life of a notchedcomponent based upon a combination of FEM stress solutions and empirical data.With this definition of a critical distance, it is presently clear that there is a trendfor the critical distance to increase with increasing stress ratio and mean stress.However, the scatter in the limited data available for the different notch geometriesmandates that predictions must be regarded as rough estimates. The use of the vonMises effective stress and maximum shear stress, as well as various weightingfactors, have led to essentially the same results. Attempts at using these data forthe prediction of the loading conditions for fatigue lives of 106 cycles is planned fornotched specimens having different Kt.
The interaction of initial LCF loading upon the HCF fatigue limit ofnotched specimens is also under investigation. The stress amplitude resulting in afatigue life of 10,000 cycles, for R = 0.1 at a frequency of 1 Hz, has been estimatedfrom stress-life data for the notched cylindrical specimens. The HCF fatigue limitfor notched specimens with 10, 1000, or 2500 initial LCF cycles, corresponding to0.1, 10, and 25 percent of the 10,000 fatigue cycle life, has been found using thestep loading method. Figure 8 shows the HCF fatigue limit at R = 0.1, forspecimens with large circumferential notches subjected to an initial 1000 LCFcycles. Baseline HCF fatigue limits, with no initial LCF loading cycles, are alsoprovided. Figure 8 shows that the 106 cycle fatigue limit actually improved afterthe application of 1000 LCF cycles. This may be due to plasticity-induced stress

redistribution, which effectively reduces both the maximum stress and local stressratio at the notch root during subsequent HCF loading from those present duringbaseline fatigue limit testing.
Figure 9 provides more extensive results, where the HCF loading has beenperformed at R = 0.8. Results for both notch sizes are included, for initial LCFloadings of 10, 1000, and 2500 cycles. Baseline results for the HCF fatigue limitat R = 0.8 with no LCF damage are also shown. Results for specimens with 10initial LCF cycles fall within the scatter of the baseline HCF data. Since additionalstress redistribution is occurring during the first cycle of the HCF loading afterLCF loading, the maximum stress at the notch tip is not affected by the precedingLCF loading. Therefore, an increase in the HCF fatigue limit should not beexpected. It should be noted that time-dependent stress redistribution has not yetbeen considered in any of these analyses.
It may be stated that no significant detrimental damage is occurring duringthe initial LCF loading for up to 25 percent of LCF life with the small notch and 10percent of LCF life for the large notch. There appears to be a dip in the maximumstress for the small notch data at 1000 LCF cycles. It is possible that there ismerely a wide scatter band in the fatigue limit for the small notch. Additional testsare planned to verify and extend these results.
This material is based upon work supported by the U.S. Air Force NationalTurbine Engine High Cycle Fatigue (HCF) Program.
Lanning, D., Haritos, G. K. and Nicholas, T., 1999, “Notch Size Effects in HCFBehavior of Ti-6Al-4V,” to appear in International Journal of Fatigue.
Leven, M. M., 1955, “Stress Gradients in Grooved Bars and Shafts,” Proc. SocietyExperimental Stress Analysis, Vol. 13, No. 1, pp. 207-213.
Maxwell, D. C. and Nicholas, T., "A Rapid Method for Generation of a HaighDiagram for High Cycle Fatigue," Fatigue and Fracture Mechanics: 29th Volume,ASTM STP 1321, T. L. Panontin and S. D. Sheppard, Eds., American Society forTesting and Materials, 1998, (in press).
Nisitani, H. and Noda, N., 1984, “Stress Concentration of a Cylindrical Bar With aV-Shaped Circumferential Groove Under Torsion, Tension or Bending,”Engineering Fracture Mechanics, Vol. 20, No. 5/6, pp. 743-766.
Peterson, R. E., 1974, Stress Concentration Factors, John Wiley and Sons, NewYork.
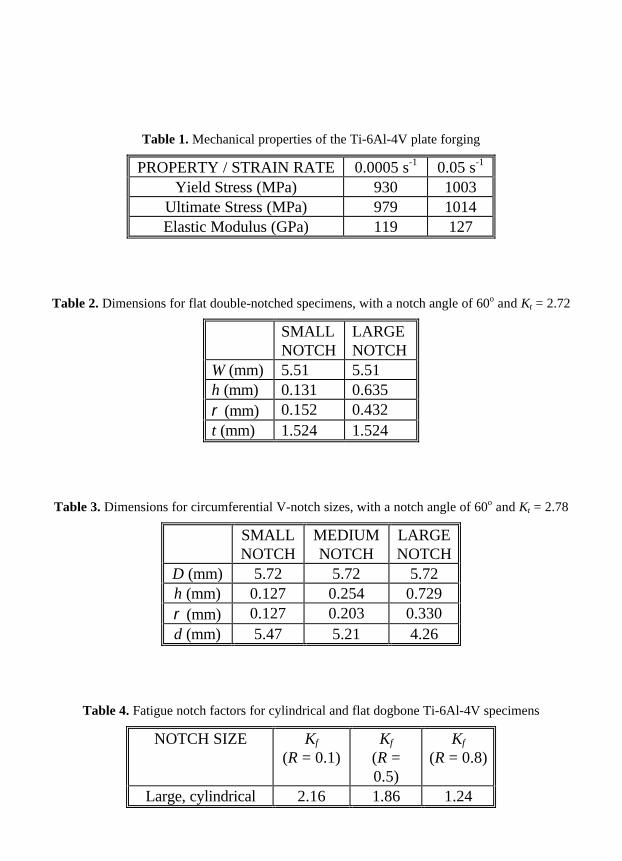
Table 1. Mechanical properties of the Ti-6Al-4V plate forging
PROPERTY / STRAIN RATE 0.0005 s-1 0.05 s-1
Yield Stress (MPa) 930 1003Ultimate Stress (MPa) 979 1014Elastic Modulus (GPa) 119 127
Table 2. Dimensions for flat double-notched specimens, with a notch angle of 60o and Kt = 2.72
SMALLNOTCH
LARGENOTCH
W (mm) 5.51 5.51h (mm) 0.131 0.635ρ (mm) 0.152 0.432t (mm) 1.524 1.524
Table 3. Dimensions for circumferential V-notch sizes, with a notch angle of 60o and Kt = 2.78
SMALLNOTCH
MEDIUMNOTCH
LARGENOTCH
D (mm) 5.72 5.72 5.72h (mm) 0.127 0.254 0.729ρ (mm) 0.127 0.203 0.330d (mm) 5.47 5.21 4.26
Table 4. Fatigue notch factors for cylindrical and flat dogbone Ti-6Al-4V specimens
NOTCH SIZE Kf
(R = 0.1)Kf
(R =0.5)
Kf
(R = 0.8)
Large, cylindrical 2.16 1.86 1.24

Medium, cylindrical 2.05 1.89 1.27Small, cylindrical 2.20 1.79 1.26
Large, flat 2.70 2.19 1.30Small, flat 2.25 1.84 1.12
Figure 1. Gage sections of the flat dogbone and cylindrical fatigue specimens with V-notches.

0
25
50
75
100
125
150
175
0 100 200 300 400 500 600 700 800
Large, Flat
Small, Flat
Alte
rnat
ing
Str
ess
(M
Pa)
Mean Stress (MPa)
106 cycles, f=50 Hz
Ti-6Al-4V, Kt=2.72
R=0.8
R=0.5
R=0.1
Figure 2. Constant life (106 cycles) Haigh diagram for notched flat dogbone Ti-6Al-4Vspecimens.
0
25
50
75
100
125
150
175
0 100 200 300 400 500 600 700 800
Large, FlatSmall, FlatLarge, Cyl.Medium, Cyl.Small, Cyl.
Alte
rnat
ing
Str
ess
(M
Pa)
Mean Stress (MPa)
106 cycles, f=50 Hz
Ti-6Al-4V, Kt=2.7
R=0.8
R=0.5
R=0.1
Figure 3. Constant life (106 cycles) Haigh diagram for both flat and cylindrical Ti-6Al-4Vspecimens.

0
0.5
1
1.5
2
2.5
3
0 0.2 0.4 0.6 0.8 1
Nor
mal
ized
Str
ess
Normalized Specimen Thickness, z/t
Large notch, σ x
Large notch, σ z
Small notch, σ x
Small notch, σ z
/ σ/ o
σ/ o
σ/ o
σ/ o
x
z
Figure 4. Normalized stress distribution in the thickness direction along the notch root ofdogbone fatigue specimens. Specimen thickness is 1.524 mm and σo is the average stress across
the reduced section.
0
25
50
75
100
125
150
175
0 100 200 300 400 500 600 700 800
Large, FlatSmall, FlatLarge, Cyl.Medium, Cyl.Small, Cyl.
Effe
ctiv
e A
ltern
atin
g S
tres
s (
MP
a)
Effective Mean Stress (MPa)
106 cycles, f=50 Hz
Ti-6Al-4V, Kt=2.7
R=0.8
R=0.5
R=0.1
Figure 5. Constant life (106 cycles) Haigh diagram for both dogbone and cylindrical notched Ti-6Al-4V specimens in terms of von Mises effective stresses.

0
100
200
300
400
500
0 500 1000 1500 2000 2500
LargeSmallSmoothLarge FEMSmall FEM
Effe
ctiv
e A
ltern
atin
g S
tres
s (
MP
a)
Effective Mean Stress (MPa)
R=0.1
R=0.5
R=0.8Uniaxial yieldsurface
Figure 6. Constant life (106 cycles) Haigh diagram for notched flat dogbone Ti-6Al-4Vspecimens. Solid data points represent FEM results for mean and alternating effective stresses at
the notch root after stress redistribution.
0.01
0.1
1
300 400 500 600 700 800 900 1000
Small, cylindrical
Medium, cylindrical
Large, cylindrical
Small, flat
Large, flat
Crit
ical
Dis
tanc
e, d
(m
m)
Mean Stress (MPa)
Ti-6Al-4V, Kt = 2.7
106 cycles
Figure 7. Critical distance from notch root versus mean stress.

300
350
400
450
500
0 500 1000 1500 2000 2500 3000
Large notch, LCF/HCF
Large notch, baseline
HC
F M
axim
um S
tres
s (
MP
a)
LCF Cycles
Ti-6Al-4V, Kt=2.78
106 cycles HCF fatigue limit
R=0.1 R=0.1
LCF HCF
σσ
N
......
Figure 8. Maximum stress of HCF fatigue limit versus number of initial LCF loading cycles.
400
500
600
700
800
900
0 500 1000 1500 2000 2500 3000
Large notch, LCF/HCFLarge notch, baselineSmall notch, LCF/HCFSmall notch, baseline
HC
F M
axim
um S
tres
s (
MP
a)
LCF Cycles
106 cycles HCF fatigue limit
Ti-6Al-4V, Kt=2.78
10 LCF cycles
10 LCF cyclesR =0.1
R=0.8
HC FLC FN
σσ
...
...
Figure 9. Maximum stress of HCF fatigue limit versus number of initial LCF loading cycles.

04/08/99 9:40 AMReport No. UCB/R/98/
Department of Materials Science and Mineral EngineeringUniversity of California at Berkeley
MEASUREMENT OF RESIDUAL STRESSES IN IMPACT-DAMAGED Ti-6Al-4V
B.L. Boyce*, A.W. Thompson, O. Roder, and R.O. Ritchie
Department of Materials Science and Mineral EngineeringUniversity of California, Berkeley, CA 94720-1760
to be presented at the4th National Turbine Engine High Cycle Fatigue ConferenceMonterey, California, Feb.1999
February 1999
Work supported by the U.S. Air Force Office of Scientific Research under Grant No.F49620-96-1-0478 under the auspices of the Multidisciplinary University ResearchInitiative on High Cycle Fatigue to the University of California. The use of theAdvanced Light Source and Stanford Synchrotron Radiation Laboratory is supported by aLaboratory Director’s Research and Development fund from Lawrence BerkeleyNational Laboratory funded by the U. S. Department of Energy under contract #DE-AC03-76SF00098.

MEASUREMENT OF RESIDUAL STRESSES IN IMPACT-DAMAGED Ti-6Al-4V
B.L. Boyce*, A.W. Thompson, O. Roder, and R.O. RitchieDepartment of Materials Science and Mineral Engineering
University of California, Berkeley, CA 94720-1760
Abstract - Residual stresses have long been difficult to measure with adequate resolutionor accuracy on the appropriate scale, which is usually microstructural in size. However,availability of bright X-ray sources from particle accelerators, such as the AdvancedLight Source at Lawrence Berkeley National Laboratory, may change this situation.Several orders of magnitude brighter than conventional X-ray beams and with excellentparallelism, accelerator sources can provide sufficient intensity to make very small beamsizes practical, thus permitting spatial resolution focused to a beam size of ~1 µm2. Onetechnique under consideration is the use of white light in micrometer beam sizes, whichpermits interrogation of an individual grain to determine orientation, followed by use of amonochromatic beam to measure six reflections and deduce the full stress state of thatgrain.
RESIDUAL STRESSES AROUND IMPACT SITES AND INDENTS
Foreign objects ingested by turbine engines during operation can cause significant damage to fanand/or compressor airfoils. Under the influence of high cycle fatigue, these damage sites canlead to crack formation and propagation thereby degrading component lifetime [1-5]. For thisreason, Foreign Object Damage (FOD) is a major concern of the HCF community. Perhaps oneof the biggest challenges in the prevention of FOD-related failures lies in understanding thenature of the damage caused by the FOD impact. A better understanding of this damage wouldprovide valuable insight into the formation and propagation of FOD-initiated fatigue cracksallowing a more realistic lifetime estimate.
The nature of the residual stresses around a surface damage site has been predominantly studiedby two communities: (1) those interested in the residual stresses associated with hardness indentsfor measuring either resistance to cracking or prior residual stress [6-8] and (2) those interestedin the residual stress field formed from the shot peening process [9-14]. Literature related tostresses around hardness indents has almost exclusively focused on the problem of the sharpindenter, which is most commonly used for estimates of cracking resistance or prior residualstress. While the analysis of the sharp indenter problem is relevant in its reliance on determiningelastic-plastic response, the quasi-static velocities and non-axisymmetric geometry limit itsapplicability to the FOD case.
The shot peening residual stress literature, although much less extensive, has focused on thespherical impact problem where both the shape and velocity of the impact are more similar to theFOD problem. The experimental or theoretical quantification of residual stresses around anindent is quite complex due to the large number of variables involved. However, the mostimportant initial parameters include: indenter and specimen material (including knowledge ofmodulus, yield strength, and work hardening parameters), indenter size, and impact velocity (orforce in the case of quasi-static indentation), Figure 1. The easiest resultant variables to analyzeinclude crater diameter and crater depth as well as surface residual stresses (typically by x-raydiffraction). A partial list of round-indenter literature as well as the parameters analyzed ispresented in Table 1. A few of the experimental and theoretical results from these studies areshown in Figure 2 for the variation of stress in the Z direction (directly down from the indent,perpendicular to the surface), in Figure 3 for the variation of stress in the X direction (under theindent, parallel to the surface), and in Figure 4 for the variation of stress on the surface outside ofthe crater rim.

Table 1. Summary of selected studies on the residual stresses caused by a round indenter.
Stresses inDirection
Investigators Year Type of Study Material Static orDynamic
Velocity(m/s)
IndenterDia.(mm)
CraterDia.(mm)
CraterDepth(µm)
Su
rfac
eS
urf
ace
Bot
tom
X
Bot
tom
Z
Comments
Kobayashi, Matsui,Murakami
1998 Experimental(X-ray)
Steel(HRC61) onsteel
Both 6.3 m/s 50, 76 7 180-200
XY
The effect of secondaryimpacts on a primaryresidual stress field
Al-Obaid 1990 Theoretical Steel onsteel
Dynamic 37-91m/s
0.36 18-200 X Dynamical considerationsestimate crater depth andplastic zone size
Yokouchi, Chou,Greenfield
1983 FEM Rigid oncopper
Static 1.5 0.12 XYZ
XYZ
An attempt to correlate tothe dynamic case (~0.2 m/s)
Li, Yao Mei, Duo,Renzhi
1991 Theoretical +Experimental(X-ray)
40Cr Steelon 40CrSteel
Dynamic(multipleshots)
140N-320N*
1.1, 0.55 XY
Comparison of predictedand mesured residualstresses on a peened surface
Studman and Field 1977 Theoretical +Experimental(Cracking)
WC onEN44Bcarbon steel(800 DPN)
Static 250N/s 10 1.7-2 XY
Radial and circumferentialstresses correlated to cracksformed at rim of indent
Peters and Roder 1998 Experimental Cr-hardenedsteel onTi-6Al-4V
Dynamic 100-300m/s
3.2 1.5-2.5 100-300
MURI FOD Simulation
* Velocity described by the static force (in N) to cause an equivalent crater size.

CURRENT AND POTENTIAL TECHNIQUES FOR MEASURING RESIDUAL STRESS
There are several techniques that are widely used for the measurement of residual stresses. Apartial list of these techniques as well as some of the features of each technique are described inTable 2.
Table 2. Some of the more common techniques for measuring strain or residual stress.
ResolutionTechnique Example References
~1 µ
m
~100
µm
~1 m
m
Str
ess
Dim
ensi
onal
ity
Non
dest
ruct
ive?
Other Restrictions?
X-ray Diffraction Prevey [15]Cullity [16]
ü 3 üSEM strain mapping Davidson [17]
Tong [18]ü 2 ü Strain grid or DIC
Indentation Suresh andGiannakopoulus [6]
* ü 1
Hole Drilling Beghini and Bertini[19]
ü 2
Moire Interferometry Wang and Chiang [20]Nishioka et al. [21]
ü 2 ü Ridged surface
Raman Spectroscopy Muraki, et al. [22] ü 1 ü Ceramic
*Nanoindentation techniques have been used for achieving ~1 micron spatial resolution [6].
There are a handful of additional techniques which are not included in Table 2 including layerremoval/curvature techniques, neutron diffraction and piezospectroscopy. Of the techniqueslisted in Table 2, only x-ray diffraction is readily capable of measuring the 3-dimensionalresidual stress state. Typical lab x-ray diffraction, however, is limited in spatial resolution to ~1mm. However, synchrotron microdiffraction may be able to provide a nondestructure probe of~1-10 µm resolution capable of determining the full 3-D stress-tensor, with variable depthpenetration (as controlled by incident energy).
SPATIALLY RESOLVED RESIDUAL STRESS MEASUREMENTS USINGSYNCROTRON DIFFRACTION
Unlike typical lab diffractometers, synchrotron radiation provides a very bright, highlycollimated, focusable beam of x-rays, which by virture of the parallel beam can be highlymonochromatic. The monochromatic beam allows for a very accurate analysis of peak positionthereby providing strain resolution typically ~10-5. The Advanced Light Source (ALS) iscurrently in the process of developing a station for microdiffraction experiments capable ofproducing a 0.8 by 1.5 µm spot size with a photon flux of 109 ph/sec in a 1 eV bandpass at 10keV. In this setup, both white light and monochromatic light (tunable from 4 to 12 keV) can beused interchangeably without moving focus. The experimental setup is shown in Figure 5.
The most common method for using x-ray diffraction to obtain residual stress information is thesin2ψ technique, Figure 6. In this technique, a tensile strain is deduced by comparing the d-

spacing of planes parallel to the specimen surface, dn, and planes tilted at some angle, ψ, fromthe surface normal, di. The strains in the two directions are compared using elasticity theory:
From this, the stress can be determined from the difference in d-spacings:
Typically this analysis is performed on an aggregate of grains so that there are a sufficientnumber of grains oriented properly for angular integration. The sin2ψ method requires asufficient number of randomly oriented grains to be interrogated to get adequate angularintegration, which in turn requires large beam dimensions. This method is thus most useful forwider gradients or larger sources of residual stress (e.g. large indents).
When, as in the case of FOD, the spatial scale of interest is smaller than several grains, straininformation can be obtained from individual grains. Using synchrotron irradiation, white lightcan be focused on a single grain to deduce orientation. With orientation of the crystal known, amonochromator is moved into the beam without changing focus. The monochromator is tunablefrom 4 to 12 KeV, allowing the measurement of precise energy of an indexed reflection. Thedifference in d-spacing between the strained and unstrained case provides an absolutemeasurement of strain, and by measuring six reflections, the complete stress state for an arbitrarystrain field can be determined. Moreover, it is possible to tune the photon energy to control thepenetration depth from which the strain information is extracted (for example, see [23]).
While the facility for microdiffraction at the Advanced Light Source is in its final stages ofpreparation, preliminary studies have been performed at the Stanford Synchrotron RadiationLaboratory on beamline 2-1. A dogbone tensile specimen with a rectangular cross-section wasmachined out of Ti-6Al-4V in the solution treated and overaged (STOA) condition. The flatplane of the dogbone specimen was normal to the T-forging direction. The STOAmicrostructure consisted of a bimodal distribution of lamellar α+β in a matrix of 64.1±6.6 vol%primary-α. Τhe 2θ diffraction pattern collected at 10 keV on an unstrained dogbone specimen isshown in Figure 7 with the peaks from both the HCP α phase and the ΒCC β phase labeled. Thedogbone specimens were loaded in an in-situ strain rig capable of applying a fixed strain duringx-ray analysis. Several peaks were interrogated at each of 10 applied strain levels ranging fromthe 0 to 6x10⁻³. The peak shift corresponding to the (10-10) peak at 5 applied strain levels isshown in Figure 8. From the 2θ-intensity data, a lorentzian distribution was fitted to each peakand the center of the lorentzian fit was taken as the peak position. That peak postion was thenconverted into a d-spacing and compared to the unstrained d-spacing to evaluate the measuredstrain. All data was collected in the “standard” x-ray diffraction mode where the bisector of theincident and diffracted beam was normal to the specimen surface. Thus, all crystallographicplanes analyzed were coincident with the plane of the dogbone specimen and measured d-spacings corresponded to the Poisson contraction response to the applied strain. The comparisonof measured strain to applied strain for both the (0002) and (10-10) peaks is shown in Figure 9.There is up to ~3x10⁻⁴ error in estimating the applied strain which corresponds to a 1x10⁻⁴ errorin the actual measurement (due to the Poisson’s ratio between measured and applied strain). Theaccuracy of the strain measurement could be improved by (a) measuring at higher 2θ angles
ψνσ
εε φψ
2sin)1( +=−En
√√↵
����
−+
=n
ni
d
ddE
ψνσ φ 2sin)1(

where the 2θ position is more sensitive to d-spacing1, (b) increasing the count time to improvestatistics, or (c) using a more accurate fit routine to determine the centroid of the peak.
While the accuracy of the strain measurement is one concern, there are several other issueswhich must be addressed before this technique will be useful for investigating the residualstresses around foreign object damage. These issues include (a) proper control of the specimentemperature to avoid thermal strain, (b) a micropositioning technique for aligning the beam onthe specimen, (c) CCD processing techniques to deduce single crystal orientation when severalgrains are present, (d) a method to control penetration depth with incident energy (e) theverification of currently available elastic constants used to convert the measured strain to stress,and (f) if sectioning is used to expose cross-sections, an analysis of the redistribution of stresses
SUMMARY
Understanding the nature of the residual stress distribution around the site of foreign objectdamage is critical to addressing the issue of FOD-related failures under HCF. While indentationliterature primarily focuses on the sharp indenter problem, there have been several theoreticaland experimental studies on the problem of the round indenter under both static and dynamicconditions that will form the basis for further work. Although there are several techniquesavailable for the measurement of residual stresses, no current technique is available formeasuring the 3-D stress state in damaged metallic specimens at the resolution necessary todeduce stress gradients with a resolution of 1-100 µm. For this reason, we are beginning toinvestigate the possibility of using focused synchrotron x-ray diffraction to measure residualstresses. The high brightness and highly collimated beam which is focusable down to a ~1 µmspot size is ideal for this type of analysis. Preliminary studies indicate that strains in the range of10-5 will be detectable by this technique.
Acknowledgments: Supported by the Air Force Office of Scientific Research by the Multidisciplinary UniversityResearch Initiative on High Cycle Fatigue to the University of California under Grant No. F49620-96-1-0478. Theuse of the Advanced Light Source and Stanford Synchrotron Radiation Laboratory is supported by a LaboratoryDirector’s Research and Development fund from Lawrence Berkeley National Laboratory funded by the U. S.Department of Energy under contract #DE-AC03-76SF00098. B.L.B. is supported by the Fannie and John HertzFoundation.
1 For example, the resolution in d-spacing would be improved by a factor of ~5 at 100° 2θ (the peak positionsanalyzed here were at ~30° 2θ).

REFERENCES
1. J. M. Larsen, B. D. Worth, C. G. Annis, Jr., and F. K. Haake, Int. J. Fract., 80, 237 (1996)2. B. A. Cowles, “High cycle fatigue in gas turbines – an industry perspective,” Int. J. Fract., 80,
147 (1996)3. H. I. H. Saravanamutto, “Erosion, corrosion and foreign object damage in gas turbines,”
Technical Evaluator’s Report, AGARD-CP-558, 1994, p. T.1.4. F. Aydinmakine, “Understanding and preventing failures and their causes in gas turbine
engines,” ibid., p. K.1.5. C. DiMarco, “Navy foreign object damage and its impact on future gas turbine low pressure
compression system,” ibid., p. G.1.6. S. Suresh and A. E. Giannakopoulos, “A new method for estimating residual stress by
instrumented sharp indentation,” Acta Mater., 46, 5755 (1998)7. J. Salomonson, K. Zeng, and D. Rowcliffe, “Decay of residual stress at indentation cracks
during slow crack growth in soda-lime glass,” Acta Mater., 44, 543 (1996)8. K. Zeng, A. E. Giannakopoulos, D. Rowcliffe, and P. Meier, “Residual stress fields at the
surface of sharp pyramid indentations,” J. Am. Ceramic Soc., 81, 689 (1998)9. M. Kobayashi, T. Matsui, and Y. Murakami, “Mechanism of creation of compressive residual
stress by shot peening,” Int. J. Fatigue, 20, 351 (1998)10. Y. F. Al-Obaid, “A rudimentary analysis of improving fatigue life of metals by shot
peening,” J. App. Mech., 57, 307 (1990)11. Y. Yokouchi, T. W. Chou, and I. G. Greenfield, “Elastic-plastic analysis of intentation
damages in copper: work hardening and residual stress,” Met. Trans. A, 14A, 2415 (1983)12. Y. K. Li, Y Mei, W. Duo, and W. Renzhi, “Mechanical approach to the residual stress field
induced by shot peening,” Mat. Sci. and Eng., A147, 167 (1991)13. C. J. Studman and J. E. Field, “The indentation of hard metals: the role of residual stresses,”
J. Mater. Science, 12, 215 (1977)14. K. L. Johnson, in Engineering Plasticity, Cambridge University Press, 341 (1968)15. P. S. Prevey, “A method of determining the elastic properties of alloys in selected
crystallographic directions for x-ray diffraction residual stress measurement,” Adv. X-RayAnal., 20, 345 (1977)
16. B. D. Cullity, Elements of X-ray diffraction, Second Edition, Addison-Wesley PublishingCompany, Menlo Park, CA, 447 (1978)
17. D. L. Davidson, “Damage mechanisms in high cycle fatigue,” Southwest Research Institute,July 1998.
18. W. Tong, “Detection of plastic deformation patterns in a binary aluminum alloy,”Experimental Mech., 37, 452 (1997)
19. M. Beghini and L. Bertini, “Recent advances in the hole drilling method for residual stressmeasurement,” J. Mat. Eng. and Performance, 7, 163 (1998)
20. Y. Y. Wang and F. P. Chiang, “Experimental study of three-dimensional residual stresses inrails by moire interferometry and dissecting methods,” Optics and Lasers in Engineering,27, 89 (1991)
21. T. Nishioka, M. Nishi, T. Fujimoto, K. Sakakura, “Moire interferometry measurements ofnear-tip deformation in inhomogeneous elastic-plastic fracture specimens,” Int. J. PressureVessels and Piping, 63, 261 (1995)
22. N. Muraki, G. Katagiri, V. Sergo, G. Pezzotti, and T. Nishida, “Mapping of residual stressesaround an indentation in β-Si3N4 using Raman spectroscopy,” J. Mat. Sci., 20, 5419 (1997)
23. M. Harting, “A seminumerical method to determine the depth profile of the threedimensional residual stress state with x-ray diffraction,” Acta Mater., 46, 1427 (1998).

Figure 1. Some of the quantities involved in assessing the damage left around a sphericalindent. The material properties of both the indenter and the specimen (elastic constants, yieldstrength, work hardening exponent) as well as the impact velocity (or force in the quasi-staticcase) and indenter diameter are typical input parameters. Output parameters include the craterdepth and diameter as well as the 2-D stress state at the surface and the 3-D stresses directlybelow or to the side of the crater.
Z
X
Y
V or F
σx
σx
σx
σy
σy
σy
σz
σz
ρ1 E1 ν1 σys,1 m1
D
E2 ν2 σys,2 m2

Figure 2. Variation of stress with depth (Z) below the bottom of the indent. (a-c) FEM-determined values for σz, σx, and τzx at peak indenting load (solid) and after release (dashed),from [11], (d) theoretical (lines) and experimental (points) σx based on multiple shots (peenedsurface) using D=1.1mm shot at a force of 275-340 N, from [12], (e) theoretical σx (labeled σR)for three shot velocities, from [10].
(a)
(b)
(c)
(d)
(e)

Figure 3. Variation of stress in the radial (X) direction from under the indent. (a-c) FEM-determined values for σz, σx, and τzx at peak indenting load (solid) and after release (dashed),from [11].
(a)
(b)
(c)

Figure 4. Variation of surface stress with distance from the crater rim. From [9].
Figure 5. Microdiffraction setup at Advanced Light Source.
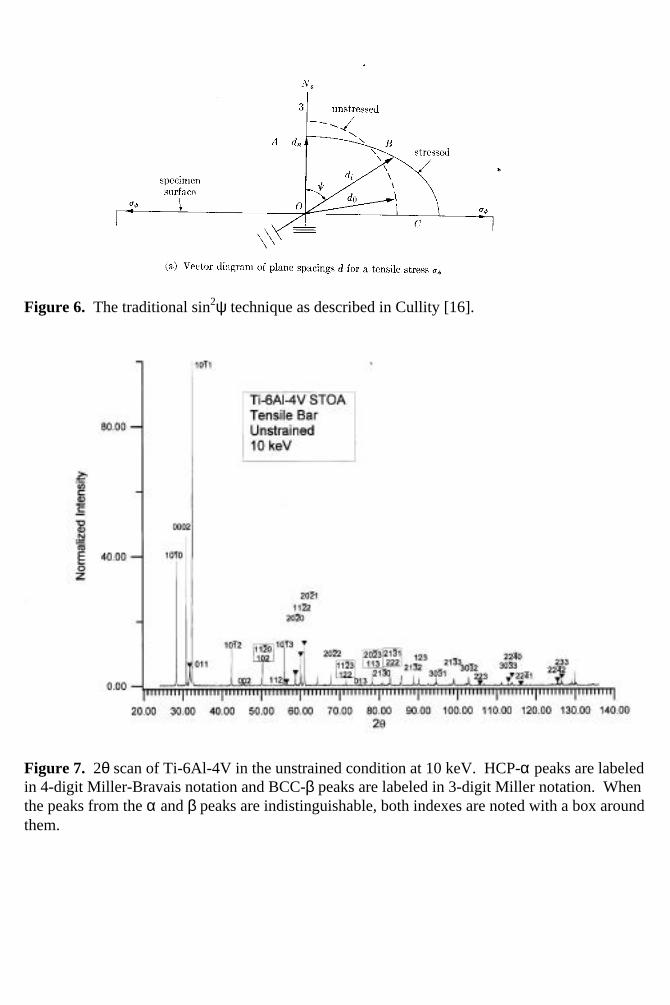
Figure 6. The traditional sin2ψ technique as described in Cullity [16].
Figure 7. 2θ scan of Ti-6Al-4V in the unstrained condition at 10 keV. HCP-α peaks are labeledin 4-digit Miller-Bravais notation and BCC-β peaks are labeled in 3-digit Miller notation. Whenthe peaks from the α and β peaks are indistinguishable, both indexes are noted with a box aroundthem.

Figure 8. The (10-10) peak at 6 different strain levels ranging from 0 to 5x10⁻³. The shift inpeak position due to applied strain is apparent.
Figure 9. The (10-10) and (0002) peaks used to show the correlation between applied strain andmeasured strain. These peaks have been normalized by their respective Poisson’s ratio, whichare different due to the anisotropy of the α phase.
27.8 28.0 28.2 28.4 28.6 28.82θ
0
25
50
75
100
N ORM
ALI
ZED
INT
ENSI
TY
28.3 28.4 28.52θ
Applied Strain: 0 1 2 3 4 5 (x10-3)
0E+0 2E-3 4E-3 6E-3Measured Strain / Poisson's Ratio
0E+0
2E-3
4E-3
6E-3
A ppli
ed
Str a
in
(0002) peak(10-10) peak

INFLUENCE OF SIMULATED FOREIGN OBJECT DAMAGE ON THEHIGH-CYCLE FATIGUE PROPERTIES OF TI-6AL-4V
FOR GAS TURBINE BLADES
O. RODER, J. O. PETERS, A. W. THOMPSON, and R. O. RITCHIE
University of California at Berkeley
Department of Materials Science and Mineral Engineering
Berkeley, CA 94720-1760
Introduction
The ingestion of foreign objects into jet engines powering military or civil aircraft canlead to severe structural damage of the fan and compressor airfoils; indeed, such foreignobject damage (FOD) is a prime reason for maintenance and repair. In particular, thedamage induced by small hard objects of millimeter size, in association with the typicalload spectra experienced by airfoils, i.e., low-cycle fatigue (LCF) cycling due to normalstart/flight/landing cycles superimposed with high-cycle fatigue (HCF) cycles due tovibrations and resonant loads, can lead to non-conservative life prediction andunexpected high-cycle fatigue failures. Specifically, the damage sites can provideinitiation points for cracks, which then propagate under the HCF spectra of large numbers(>109) of high frequency (>1 kHz), high load-ratio (R ~ 0.8) cycles. The objective of thisstudy was to characterize (i) the size and shape of the indents and (ii) the level ofmicrostructural damage induced by impacts of foreign objects, (iii) to examine theinfluence of foreign object damage on crack initiation and crack propagation that can leadto failure by HCF and (iii) how that crack propagation behavior is affected bymicrostructure. The primary study was performed on a fan/compressor blade processed(STOA) bi-modal microstructure of the titanium alloy Ti-6Al-4V. In addition, a β-annealed lamellar microstructure was investigated to isolate the role of microstructure.
Material, Microstructures and Tensile Properties
The titanium Ti-6Al-4V alloy studied was delivered as a solution treated and overaged(STOA) forged plate. The plate came from a set of forgings produced specifically for theU.S. Air Force sponsored programs on HCF. Material and processing details are given in[1]. The plate material showed a bi-modal microstructure with a volume fraction of 60 %primary α (diameter ~20 µm) and 40 % lamellar α+β matrix (Figure 1a). In addition tothe bi-modal microstructure, a β-annealed lamellar microstructure (Figure 1b) wasinvestigated for comparison. To obtain a lamellar microstructure, the delivered platematerial was solution treated in the β phase field at 1005°C for 10 min. This β-annealing

resulted in large β grains with a diameter of approximately 1000 µm. Controlled coolingwith a rate of 100-130°C/ min to match the same lamellae width of the bi-modalmicrostructure (2 µm) resulted in a α+β lamellae colony size of 500 µm. Finally, toensure comparability with the bi-modal microstructure, the lamellar microstructure wasgiven the same final heat treatment step of 2 h at 705°C.
The uniaxial tensile properties of both bi-modal and lamellar microstructures are listed inTable 1:
Table 1: Tensile properties (strain rate 5 x 10⁻⁴ s-1)
Condition σ0.2 (MPa) UTS (MPa) El. (%)
Bi-modal [1] 930 970 20
Lamellar 975 1055 12
Simulation and Characterization of Foreign Object Damage
Foreign object damage by hard particles is simulated by firing chrome-hardened steelspheres on a flat specimen surface by using compressed gas to produce a single damagesite. [2] The specimen geometry chosen for this study has a rectangular gauge section(3mm × 5mm) with cylindrical buttonhead grip sections (Figure 2). To provide aconsistent, nominally stress-free surface, the gauge section was prepared by standardstress relief and chemical-milling procedures. In this study, spheres (diameter 3.175 mm)were impacted at an angle of 90º (normal impact) at velocities of ~200, 250 and 300 m/s.These velocities were chosen because (i) they represented typical in-service impactvelocities on blades, and (ii) they provided different levels of damage (see below).Damage sites have been characterized to date in terms of the geometrical dimensions(shape, diameter, depth) and microstructural changes.
SEM micrographs of typical impact sites for the bi-modal microstructure are shown inFigure 3a (200 m/s) and Figure 3b (300 m/s). For the lamellar microstructure typicalimpact sites are shown in Figure 4a (200 m/s) and Figure 4b (250 m/s). For the bi-modalmicrostructure, corresponding cross sections of impact craters are shown in Figure 5a(200 m/s) and Figure 5b (300 m/s). While at 300 m/s (Figure 5b) and 250 m/s, tangentialorientated shear bands (Figure 6) were seen emanating from the surface of the crater,such shear bands were not observed for 200 m/s impacts (Figure 5a). This resultcorresponds with the reported critical velocity of 214 +/-16 m/s to achieve shear bands inTi-6Al-4V by an impacting 3.2 mm diameter steel sphere [4]. The amount and length ofthe observed shear bands increased with increasing impact velocity. In addition, the 300m/s impacts caused a ridging along the crater rim (Figures 5b and 6b); this feature wasnot seen for the lower velocity impacts (Figure 5a). Figure 7 summarizes the relevantfeatures in form of a schematic illustration of the crater profile. In the range of 100 to 320m/s impact velocities, the diameter and depth of damage site increased linearly withincreasing impact velocity.

Influence of Foreign Object Damage on High-Cycle Fatigue
After impact, the tensile specimens were subsequently cycled at 20 Hz (sine wave) with amaximum nominal stress of 500 MPa at a load ratio of R = 0.1. Periodically, thespecimens were removed from the test frame and examined in a scanning electronmicroscope (SEM) to detect crack initiation. Once a crack had initiated, subsequent crackgrowth was similarly monitored using periodic SEM observations. Stress intensities forthe surface cracks were calculated from the Newman and Raju linear elastic solution forsemi-elliptical surface cracks, assuming a half-surface length to depth ratio of 0.9(determined from fractographic measurements). [3] In this initial study, contributions tothe local stress intensity factor values from the geometry of the indentation and theresidual stress field surrounding the indent have been ignored. Current studies arefocused on the use of micro X-ray diffraction methods to measure such residual stresses.
The effect of the simulated foreign object damage was to markedly reduce the fatigue lifecompared to that obtained with an undamaged smooth-bar specimen [5], as shown inFigure 9 for the bi-modal microstructure. At maximum stresses of 500 MPa (R = 0.1),surface cracks were initiated within ~3 × 10⁴ to ~5 × 10⁴ cycles, the failure of theimpacted specimens occurred between ~4 × 10⁴ and ~8 × 10⁴ cycles. Specifically, fatiguelives were reduced by over two orders of magnitude following 200 m/s and 300 m/simpacts.
For the bi-modal microstructure, crack initiation sites of the small surface cracks areshown in Figure 10a (200 m/s) and in Figure 10b (300 m/s). First results show that thecracks tended to initiate at the bottom of the indent for the lower velocity impacts and atthe crater rim for the higher velocity impacts. Corresponding fracture surfaces are shownin Figure 11a (200 m/s) and Figure 11b (300 m/s). The position of the crack front duringcrack extension is indicated schematically (Figure 11). For the 200 m/s impact, theinitiation at the bottom of the indent can be explained by stress concentration due to thenotch geometry. Crack initiation at the crater rim (300 m/s) might be related tocircumferential residual tensile stresses at the crater ridge [e.g. 6], which overcompensatethe stress concentration effect of the indent.
The presence of the tangential orientated shear bands do not appear to play a significantrole in the initiation process of the fatigue cracks. This is thought to be due to the fact thatat the center of the indent, the tangential aligned shear bands are parallel to the appliedstress axis.
The growth of the small cracks originating from such impact sites are compared in Figure12 with growth-rate data for large (>5 mm) [7] and naturally-initiated small (~45-1000µm) [5] cracks for the bi-modal microstructure. Both the naturally-initiated and FOD-initiated small-crack velocities were within the same scatter band, initially up to an orderof magnitude faster than corresponding large crack results. The small-crack data tendedto merge with large-crack results above ∆K = 10 MPa√m as the crack size increased.However, in the limited data collected to date, no FOD-initiated cracks have beenobserved in the Ti-6Al-4V bi-modal microstructure below ∆K = 2.9 MPa√m; i.e., noFOD-initiated cracking was observed below the worse-case (large crack) threshold, ∆KTH
of 1.9 MPa√m, measured using constant Kmax cycling at a final R ratio of 0.95 [7]Therefore, fatigue crack propagation thresholds of large cracks determined under

conditions that minimize crack closure can be used as a lower bound for the thresholdstress intensities for FOD initiated cracks.
To examine the influence of microstructure in addition to the α+β processed bi-modalmicrostructure, a β-annealed lamellar microstructure was also investigated. A typicalcrack initiation site of the small surface cracks is shown in Figure 13 for an impactvelocity of 200 m/s. As shown previously for the bi-modal microstructure, cracks tendedto initiate at the bottom of the indent for the 200 m/s and 250 m/s velocity impacts andthat the presence of the tangential orientated shear bands did not appear to play asignificant role in the initiation process. Further testing at higher velocities (300 m/s) iscurrently underway to evaluate crack initiation at the crater ridge.
Preliminary results of fatigue crack propagation tests of the lamellar microstructure areshown in Figure 14. It can be seen that the lamellar microstructure showed a slightlyhigher resistance against the propagation of small surface cracks as compared to the bi-modal microstructure. These preliminary results indicate that the resistance of theimpacted microstructure against fatigue crack propagation is only minimally affected bysignificant changes in the microstructural dimensions (bi-modal vs. lamellar).
Summary
1. Foreign object damage, simulated by hardened steel spheres impacted at 200-300m/s on a flat surface, provides sites for the initiation of small fatigue cracks.
2. At applied stresses some 10 % below the smooth-bar fatigue limit (107 cycles),crack initiation lives were less than 4 x 10⁴ cycles, many orders of magnitudelower than lifetimes for un-impacted samples.
3. Subsequent propagation of small cracks from the damage sites was faster ascompared to the propagation rates of large cracks subjected to the same applied∆K level.
4. No crack growth from the damage sites has been observed to date at ∆K valuesless than 2.9 MPa√m. The “worse-case” large crack threshold value could thus beused as a lower bound to FOD initiated cracking.
5. Preliminary results of the microstructure comparison showed that the resistanceagainst fatigue crack propagation was only minor affected by a drastic change ofmicrostructure (bi-modal vs. lamellar).
Acknowledgements
This work is supported by the Air Force Office of Science and Research, Grant No.F49620-96-1-0478, under the Multidisciplinary University Research Initiative on “HighCycle Fatigue” to the University of California, Berkeley.

References
1. D. Eylon, “Summary of the Available Information on the Processing of the Ti-6Al-4V HCF/LCF Program Plates”, University of Dayton Report, Dayton, OH. (1998).
2. R. O. Ritchie, S. Suresh, J. W. Hutchinson, W. W. Milligan, A. G. Evans, A. W.Thompson, “High-Cycle Fatigue and Time-Dependent Failure in Metallic Alloys ForPropulsion Systems”, AFOSR F49620-96-1-0478, Progress Report (1997).
3. J. C. Newman, Jr., and I. S. Raju, Eng. Fract. Mech. 15, 185 (1981).4. S. P. Timothy and I. M. Hutchings, in Proceedings of the 3rd Conference on
Mechanical Properties at High Rates of Strain, The Institute of Physics, 1984, 397.55. J. A. Hines, J. O. Peters and G. Lütjering, “Microcrack Propagation in Ti-6Al-4V”,
in Fatigue Behavior of Titanium Alloys, R.R. Boyer, D. Eylon, J.P. Gallagher and G.Lütjering, TMS, Warrendale, PA, 1999.
6. C.J. Studman, J.E. Field, “The Indentation of Hard Metals: The Role of ResidualStresses”, J. Mater. Sci. 12, 215 (1977).
7. B. L. Boyce, J. P. Campbell, O. Roder, A. W. Thompson, W. W. Milligan, and R. O.Ritchie, Int. J. Fatigue (1999), accept for publication and in press.

a) Bi-modal b) LamellarFig. 1: Microstructures (LM) Fig. 2: Specimen geometry
a) 200 m/s b) 300 m/sFig. 3: Bi-modal microstructure. Impact damage sites (SEM),
Impact conditions: 3.2 mm steel sphere, 90º.
a) 200 m/s b) 250 m/sFig. 4: Lamellar microstructure. Impact damage sites (SEM),
Impact conditions: 3.2 mm steel sphere, 90º.
FOD-site
∆F
∆F

a) 200 m/s b) 300 m/s
Fig. 5: Bi-modal microstructure. Cross sections of impact craters (LM).Impact conditions: 3.2 mm steel sphere, 90º.
a) shear bands at crater bottom b) crater ridge
Fig. 6: Bi-modal microstructure. Cross sections of impact craters (LM).Impact conditions: 3.2 mm steel sphere, 90º, 300 m/s.
Fig. 7: Schematic cross section of an Fig. 8: Bi-modal microstructure. Diameterimpact crater. and depth of impact crater as
function of impact velocity.
0.0
0.5
1.0
1.5
2.0
2.5
3.0
DimensionsofDamagesite[mm]
100 150 200 250 300 350Impact-Vel. in m/s
Diameter of Crater-Rim
Depth of Crater
Plastic Zone
Shear BandPattern
Pile UpOriginal SurfaceLevel

Fig. 9: Bi-modal microstructure. Influence of FOD on fatigue behavior, compared to S-N smooth-bar fatigue data after J.A. Hines, J.O. Peters and G. Lütjering (1999).
a) 200 m/s impact, N = 47.000 cycles b) 300 m/s impact, N = 35.000 cycles
Fig. 10: Bi-modal microstructure. Crack initiation sites at the specimen surface (SEM):σmax = 500 MPa, R = 0.1, 20 Hz:
a) 250 m/s impact
R = 0.1, 85 Hz(Hines, Peters andLŸtjering,1999)
400
5 0 0
6 0 0
7 0 0
8 0 0
9 0 0
1000
MaximumStress
[MPa]
σmax
1 03 104 105 1 06 107 108
Cycles to Failure N f
Ti-6Al-4V,Bi-modalAir, RT
Symbolso p e n =cycles t o c r a c kinitiationclosed = c y c l e sto failure
FOD 2.6mm (319m/s)→
FOD 1.98mm (201m/s)→FOD 2.25mm (252m/s)→
FOD-Specimen, 20 Hzσmax = 500 MPa, R = 0.1
300 m/s250 m/s
2 0 0 m / s

b) 300 m/s impact
Fig. 11: Bi-modal microstructure. Fracture Surfaces (SEM), Position of crack front as afunction of number of cycles during crack extension is shown schematically
Fig. 12: Bi-modal microstructure. Fatigue crack propagation behavior of small cracksemanating from simulated FOD sites. Comparison with data of naturallyinitiated small cracks (J.A Hines, J.O. Peters and G. Lütjering, 1999) and largecracks (B.L. Boyce, J.P. Campbell, O. Roder, A.W. Thompson, W.W. Milliganand R.O. Ritchie, 1999).
Smal lCracks f romFOD-Si tesσmax = 5 0 0M P a , R = 0 . 1
10 -12
10-11
10 -10
10-9
10-8
10-7
10-6
CrackGrowthRate,da/dN[m/cycle]
1 2 3 4 5 6 7 8 9 10 20 30 40
Stress Intensity Range, K [MPam ]∆ 1/2
S m a l l C r a c k s ( 6 5 0 M P a , R = - 1 )σmax = 5 5 0M P a , R = 0 . 1(Hines, PetersandLŸtjering,1999)
Large CracksR=0.8, 50Hz
300m/s
200 m/s
250 m/s
Constant-K = 3 6 . 5 M P ammax �R=0.95
Surface Crack Length 2c of FOD-Smal lCracks[ m]µ
10 20 50 100 200 500 1000 2000
LargeCracksR=0.1, 50Hz
T i - 6 A l - 4 V , B i - m o d a lA i r , R T

Fig. 13: Lamellar microstructure. Crack initiation site at the specimen surface for a 200m/s impact (SEM): σmax = 500 MPa, R = 0.1, 20 Hz:
Fig. 14: Fatigue crack propagation behavior of small cracks emanating from simulatedFOD sites. Comparison of bi-modal and lamellar microstructures.
S m a l lC r a c k sfrom F O D - S i t e s
σm a x= 500 M P a ,R = 0.1
10-12
10- 1 1
10 -10
10-9
10-8
10-7
10-6
CrackGrowthRateda/dN[m/cycle]
1 2 3 4 5 6 7 8 9 10 20 30 40
Stress Intensity Range, K [MPam ]∆ 1/2
Surface Crack Length 2c of F O D - S m a l l C r a c k s[ m]µ
10 20 50 100 200 500 1000 2000
3 0 0 m / s
2 0 0 m / s
250 m / s
S m a l lC r a c k sfrom F O D - S i t e sσm a x= 5 0 0 M P a ,R = 0 . 1
Ti-6Al-4VA i r ,RT
S m a l lC r a c k s(650 M P a ,R = - 1 )σm a x= 5 5 0 M P a ,R = 0.1( H i n e s ,P e t e r sa n d LŸt je r i ng ,1 9 9 9 )
L a r g eC r a c k s ,B i - m o d a lR = 0 . 8 ,5 0 H z
C o n s t a n t - K = 3 6 . 5MPa m ,B i - m o d a lmax �R = 0 . 9 5
Bi-modal
3 0 0 m / s
2 0 0 m / s
250 m / s
Bi-modal
3 0 0 m / s
2 0 0 m / s
250 m / s
Bi-modal
3 0 0 m / s
2 0 0 m / s
250 m / s
Bi-modal
3 0 0 m / s
2 0 0 m / s
250 m / s
Bi-modal
200 m / s
2 5 0m / s
Lamel la r

The Effect and Assessment of Foreign Object Damage to Aero Engine Blades and Vanes
Mr IF Stewart*, Rolls-Royce plc, PO Box 31, Derby, DE24 8BJ, UK.Dr. DP Williams and Dr. D Nowell, Dept. of Engineering Science, University of Oxford, ParkesRd, Oxford, OX1 3PJ, UK
Introduction
During the course of their lives, aero engines - both military and civil - can ingest foreignobjects of various sorts. When birds or ice are ingested, it is generally termed ‘soft body’ impact,whereas, when stones, rivet mandrels, bits of tyre, clipboards etc, are ingested, it is termed ‘hardbody’ ingestion and the damage it causes is called Foreign Object Damage or FOD.
FOD can cause significant amounts of damage to the blades and vanes in, generally, thecompressors of an engine. Indeed, should a nick in a leading (or trailing) edge of a blade developinto a fatigue crack that propagates and fails the blade, then the integrity of the engine and, hence,the aircraft, is put at risk.
Maintenance Manual Limits (MML’s) specify the amount of damage that is allowable andhow FOD should be treated, as well as the level beyond which the blade (or vane) has to bescrapped. If a blade is redesigned for FOD or any other reason, there is no means, at present, ofbeing able to define the effect this should have on the MML’s. This lack of a deterministicmethod is also important in the inevitable trade-off between the performance and FOD toleranceof a blade in which the aerodynamicist would like a razor blade leading edge and the integrityengineer would like a great thick leading edge that would defeat all FOD but have theaerodynamics of a housebrick.
It should be noted that the whole process of inspection, repair and/or replacement is verycostly, with estimates for the UK and US Air Forces, for example, running into many millions ofdollars each year - just attributable to FOD. The work described in this paper is the first part of aphased programme to provide a much better understanding of the fundamental mechanismsinvolved in FOD to blades and to enable generic design rules to be formulated that will enable adesign to be assessed and optimised, against any set of conditions in which a blade may sufferfrom FOD.
In this phase1, the basic methodology for predicting the fatigue life reduction, consequentupon a FOD impact, will be developed and validated on just two, different, types of compressorblade. Phase 2 of the programme will extend the basic methodology developed in phase1 over amuch wider range of variables and will, almost certainly, require a test specimen approach. Phase1 is being carried out at the Department of Engineering Science at Oxford University.

Experimental Work
Ballistic Facility
A compressed gas gun was built at Oxford that was capable of firing various missiles at highspeeds with a repeatability and accuracy better than the 1 mm required for carrying out the testprogramme. For the purpose of this programme, the missiles were chosen to be steel balls and thetargets were Olympus LP2 blades (Titanium 6-4) and Viper 680 stage ‘0’ (made in steel). Themissile diameters were 4mm and 2mm respectively, though it is planned that other missiles will beused later in the programme.
The speed of the sabot (and therefore the missile) is measured using a timing device at theend of the barrel. After leaving the gun, the sabot hits the sabot-arrestor, which strips away thesabot and leaves the missile to continue its trajectory towards the blade. Figure 1 shows theconfiguration of the gun.
Blade Testing
The gun was aimed by inserting, into the end of the barrel, a plug which had two pinholes, 65mm apart on the centreline. A light was shone down the barrel from the breach end, producing aspot of light on the target blade. The blade was then moved till the spot appeared on the intendedimpact position.
The trajectory of the missile, in each test, was chosen to be parallel to the direction ofrotation of the blade (when in service). It was assumed that the forward velocity of an ingestedmissile was negligible in comparison with the rotational speed of the compressor blade in a realFOD event. This is a parameter that would be varied in Phase 2 of the whole programme.
Types of Damage
Previous work (Nicholas et al. 1980) has suggested that there are three broad categories ofdamage:-
1) A dent2) A dent and a tear or crack3) A piece out
Tests were carried out on the Olympus LP2 blades to see if these damage modes could bereproduced. A suitable impact point was identified about 75 mm up from the root (roughly onequarter of the way up the blade), with the blade in first flap, from a dynamic finite element analysisof the blade.
Impacts on the leading edge at this position resulted in a simple dent being produced at justbelow 280 m/sec, see Fig 2 and a dent with a ‘U’-shaped crack on the back of the blade, with an

impact velocity of about 300 m/sec, Fig 3. A complete piece out resulted from velocities above350 m/sec, Fig 4.
Fatigue Testing
Once it was demonstrated that the different types of damage could be recreated, five bladesof each damage type were fatigue tested by the Experimental Vibration Laboratory at Rolls-Royce plc, Bristol. In every case a fatigue crack was seen to initiate from the damage zone andpropagate in a straight line across the blade towards the trailing edge. The tests were stoppedwhen the frequency had dropped by 2% and so the blades were left in one piece. The number ofcycles to failure enabled a comparison to be made between the three types of damage. It wasobserved that the ‘dent and tear’ category of damage was most detrimental to fatigue life. Theother two categories had fatigue lives similar to each other.
Further Experimental Work
A very different type of blade, the Viper 680 stage ‘0’ compressor blade is now being testedin a similar way to the Olympus LP2 blades. The Viper blade is much smaller, has a thinnerleading edge and includes snubbers.
Numerical Modelling
In order to assess the specific effects of specific types of damage, it is perfectly feasible tocarry out a test programme that would provide the answers. However, the approach that Rolls-Royce is taking is to try and get a deeper understanding of the impact mechanisms, as well as thefeatures that exist within the plastically deformed metal, that, in the presence of a vibratingcentrifugal stress field, lead to a crack that then propagates to reduce the fatigue life of the blade(or vane) - and it is believed that the best way to achieve this is by sophisticated, numericalmodelling.
It was decided to use the explicit finite element code Dyna 3D to model the impactexperiments. Dyna 3D has been used to model many impact situations and was already used byRolls-Royce to model such things as bird ingestion and the behaviour of engine casings underblade-off impact loading.
Finite Element Mesh
The mesh was set up to give a very fine grid in and around the impact area, becomingprogressively more coarse at points further away from the impact. To decrease the number ofelements required in the analysis, only part of the blade was meshed. A simple calculation usingthe Young’s Modulus, density and approximate duration of impact, suggested that elastic waveswould travel a maximum of 55 mm during the impact of the blade so, a region of at least 55 mmwas meshed around the impact. Six elements were used through the thickness of the blade to

allow the curvature of the leading edge of the blade to be incorporated with reasonable accuracy.The elements in the impact region are specified as a cube with side length of 0.25 mm.
The geometry of the ball was created by building the spherical shape from a central cube. Asix sided lozenge, matching the cube on the inside and the sphere on the outside, was added toeach of the six faces of the cube, in order to complete the sphere. The mesh was constructed bymeshing the cube and surrounding lozenges separately and matching adjacent nodes to form onecomplete mesh.
Boundary Conditions
An initial velocity was given to the ball that matched a given experimental value. In the caseof a dent to the leading edge, a velocity of 279 m/s was used. The ball was targeted to hit theleading edge of the blade in exactly the same place as in the experiment. Contact surfaces werecreated on the ball and the blade to allow Dyna 3D to calculate the behaviour of both solidsduring the impact event. The “surface-to-surface” type of contact was used in this case.
Material Properties For the ball, an elastic material model (Material 1 in Dyna 3D) was used. Values of Young’sModulus, density, and Poisson’s Ratio appropriate for steel were taken from engineering tables.
The blade material model was initially chosen as elastic-perfectly plastic (material model 3 inDyna 3D) and the relevant material properties obtained from the Rolls-Royce material database.
Results
The results of the numerically simulated impact events were displayed using thepostprocessor 'D3Plot'. Figure 5 shows the development of a dent caused by a 279m/s projectileat four different times during the impact that was run for about 60 microseconds. Figure 6 showsthe final dent produced by the same impact, and can be compared with that seen in the actualexperiment (figure 2).
D3plot also enables a detailed study to be made of the stress and strain distributions aroundthe damage area, helping to give insight into the mechanisms of material failure.
A number of simulations have been carried out at different impact velocities and have beencompared with experiment. Good agreement has been established between experimental andnumerical impact damage at relatively low velocities, as the denting process involves no materialfailure other than yield. The Dyna3D material model 3 is less successful at modelling the "dentand tear" and "perforation" damage categories. This elastic-perfectly-plastic model does include amaximum strain failure criterion, where an element is deleted once the strain in the elementexceeds a certain critical level. However, this has proved inadequate in the description of failure inour impact events, as elements are seen to fail in both tension and compression. This leads to theunrealistic removal of material directly at the point of impact on the blade.

At present, work is being undertaken to incorporate the Bamman Damage model (Bammanet. al. 1990) into the numerical simulations. This is included in Dyna3D as material 52. This modelemploys a damage parameter which is a function of a number of quantities, including pressure andeffective stress. Elements are deleted when this parameter reaches a value of 1.0. A more detaileddescription of the model can be found in papers by Bamman (Bamman 1989, Bamman et. al.1990). The material data was again supplied by RollsRoyce. As with the simple material model,this model is capable of recreating the dents corresponding to low velocity impacts. In a fewcases, the model has also exhibited the general 'U,-shaped tear seen on the back of experimentalimpacts at intermediate velocities (such as that shown in figure 3). Figure 7 shows the final strainprofile in one such case.
For higher velocity impacts that, experimentally, cause perforations of the leading edge,material 52 has so far been unsuccessful at recreating the damage. Figure 8 shows the Dyna3Dmodel of a higher velocity impact. A large, straight tear is seen to develop from the leading edge,rather than a semi-circular perforation. There is some evidence that the crack direction isdependent on the mesh, indicating that a much smaller element size is required in the impactregion.
Conclusions
The gas gun, developed at Oxford, is able to reproduce the three types of damage observedby Nicholas et. al. (1980) and found in practice, when blades are removed from engines after FODevents.
Fatigue tests have shown the 'dent with tear' damage type to be the most detrimental to thefatigue life of the blade when vibrated in 'first flap' mode.
The Dyna3D finite element models can successfully recreate the impact and subsequentplastic deformation of the material in the damaged area. A damage parameter approach tomodelling the material failure associated with higher velocity impacts has shown some agreementwith experimental results for dents and small tears but, more work is necessary to describe fullythe tearing and perforation of the leading edge.

Acknowledgements
This project is jointly funded by Rolls-Royce plc and DERA.
References
A.M.Howatson, P.G.Lund and J.D.Todd (1991): Engineering Tables and Data (SecondEdition). Chapman & Hall.T.Nicholas, J.P.Barber and R.S.Bertke (1980): Impact Damage on Titanium Leading Edges fromSmall Hard Objects. Experimental Mechanics Vol.20, No.10, pp.357-364D.J.Bamman and E.C.Aifantis (1987): A Model for Finite Deformation Plasticity. ActaMechanica 70, 1-13D.J.Bamman et. al. (1990): Predictions of Ductile Failure in Metal Structures. In AMD-Vol.107, Failure Criteria and Analysis in Dynamic Response, Edited by H.E.Lindberg, 7-12.
Fig. 1
Ballistic Facilityat Oxford University
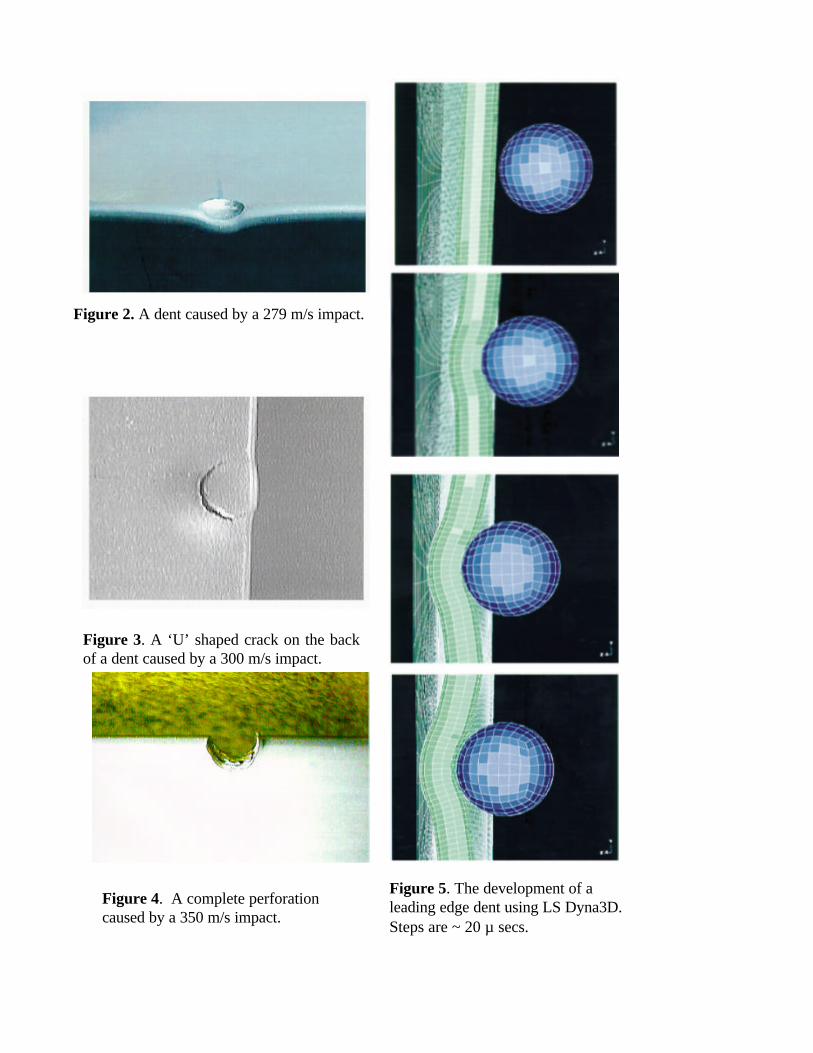
Figure 2. A dent caused by a 279 m/s impact.
Figure 3. A ‘U’ shaped crack on the backof a dent caused by a 300 m/s impact.
Figure 5. The development of aleading edge dent using LS Dyna3D.Steps are ~ 20 µ secs.
Figure 4. A complete perforationcaused by a 350 m/s impact.

Figure 6. The final plastic deformationresulting from a 279 m/s impact.
Figure 8. A material 52 model of ahigh velocity (350 m/s) impact. A largetear has formed
Figure 7. A material 52 model of anintermediate (300 m/s) velocity impact. Theback of the dent exhibits a ‘U’ shaped crack.