the four seasons - … · · 2014-09-22the four seasons letter from the editors welcome to the...
TRANSCRIPT
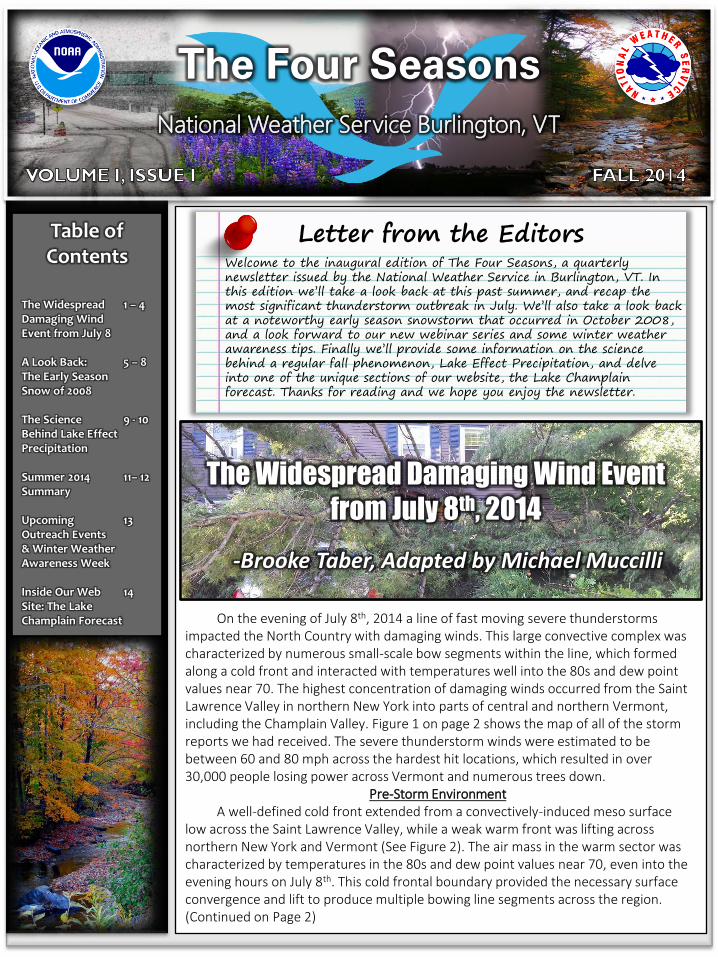
Table of Contents
The Widespread 1 – 4 Damaging Wind Event from July 8 A Look Back: 5 – 8 The Early Season Snow of 2008 The Science 9 - 10 Behind Lake Effect Precipitation Summer 2014 11– 12 Summary Upcoming 13 Outreach Events & Winter Weather Awareness Week Inside Our Web 14 Site: The Lake Champlain Forecast
The Widespread Damaging Wind Event
from July 8th, 2014
National Weather Service Burlington, VT
The Four Seasons
Letter from the Editors Welcome to the inaugural edition of The Four Seasons, a quarterly newsletter issued by the National Weather Service in Burlington, VT. In this edition we’ll take a look back at this past summer, and recap the most significant thunderstorm outbreak in July. We’ll also take a look back at a noteworthy early season snowstorm that occurred in October 2008, and a look forward to our new webinar series and some winter weather awareness tips. Finally we’ll provide some information on the science behind a regular fall phenomenon, Lake Effect Precipitation, and delve into one of the unique sections of our website, the Lake Champlain forecast. Thanks for reading and we hope you enjoy the newsletter.
-Brooke Taber, Adapted by Michael Muccilli
On the evening of July 8th, 2014 a line of fast moving severe thunderstorms impacted the North Country with damaging winds. This large convective complex was characterized by numerous small-scale bow segments within the line, which formed along a cold front and interacted with temperatures well into the 80s and dew point values near 70. The highest concentration of damaging winds occurred from the Saint Lawrence Valley in northern New York into parts of central and northern Vermont, including the Champlain Valley. Figure 1 on page 2 shows the map of all of the storm reports we had received. The severe thunderstorm winds were estimated to be between 60 and 80 mph across the hardest hit locations, which resulted in over 30,000 people losing power across Vermont and numerous trees down.
Pre-Storm Environment A well-defined cold front extended from a convectively-induced meso surface low across the Saint Lawrence Valley, while a weak warm front was lifting across northern New York and Vermont (See Figure 2). The air mass in the warm sector was characterized by temperatures in the 80s and dew point values near 70, even into the evening hours on July 8th. This cold frontal boundary provided the necessary surface convergence and lift to produce multiple bowing line segments across the region. (Continued on Page 2)

VOLUME I, ISSUE I PAGE 2
…Continued from Page 1
Figure 1. Map of Local Storm Reports on July 8th, 2014. Green trees indicate trees or power lines down and purple dots denote measured wind gusts.
Figure 2. Surface Map at 7PM on July 8th, 2014 with surface plots, cold front (light blue line with triangles), and warm front (red line with half circles).
At the same time, a potent short wave trough was moving across the Ohio Valley and central Great Lakes, along with a ribbon of enhanced wind speeds. This vigorous system helped to produce large scale lift for thunderstorm development, while the stronger winds aloft helped in the organization of storms and provided the severe wind threat. With enough instability in place to create strong updrafts, model forecasts showed 1000 – 2000 J/Kg of CAPE (Available Energy), thunderstorms began to develop. There was also an area of extremely strong winds of 50 to 60 mph between 2000 and 5000 feet off the ground, which were brought to the ground during the heavy downpours. The best combination of deep-layer shear up to 55 knots (difference between winds at the surface and aloft, needed for thunderstorm organization) and instability by the evening was located across the Saint Lawrence and Champlain Valleys, which closely matched the region of greatest wind damage.
Evolution of Storms As is common with lines of convection in unstable and highly sheared environments, evaporatively cooled air stemming from heavy rainfall creates a mesoscale cold pool, which in turn creates strong pressure gradients and accelerates the convective line. This developed near Watertown, NY on the evening of July 8th where temperatures dropped to near 70 degrees after the thunderstorms passed, while temperatures ahead of the storms remained in the low to mid 80s. This convective line evolved into a well-defined bow echo across southern Saint Lawrence and Franklin Counties New York between 7:30pm and 8:30pm. This is an indication of potentially damaging straight line winds where the convective line “bows out”.
This bow echo propagated across northern New York and towards the Champlain Valley at speeds of up to 60 mph. The evolution of the bow echoes within the complex of thunderstorms during the evening can be seen in Figure 3 on page 3. (Continued on Page 3)

VOLUME I, ISSUE I PAGE 3
…Continued from Page 2
Figure 3. Radar Reflectivity mosaic across the Mid-Atlantic and Northeastern United States from 6PM to 10PM July 8th, 2014.
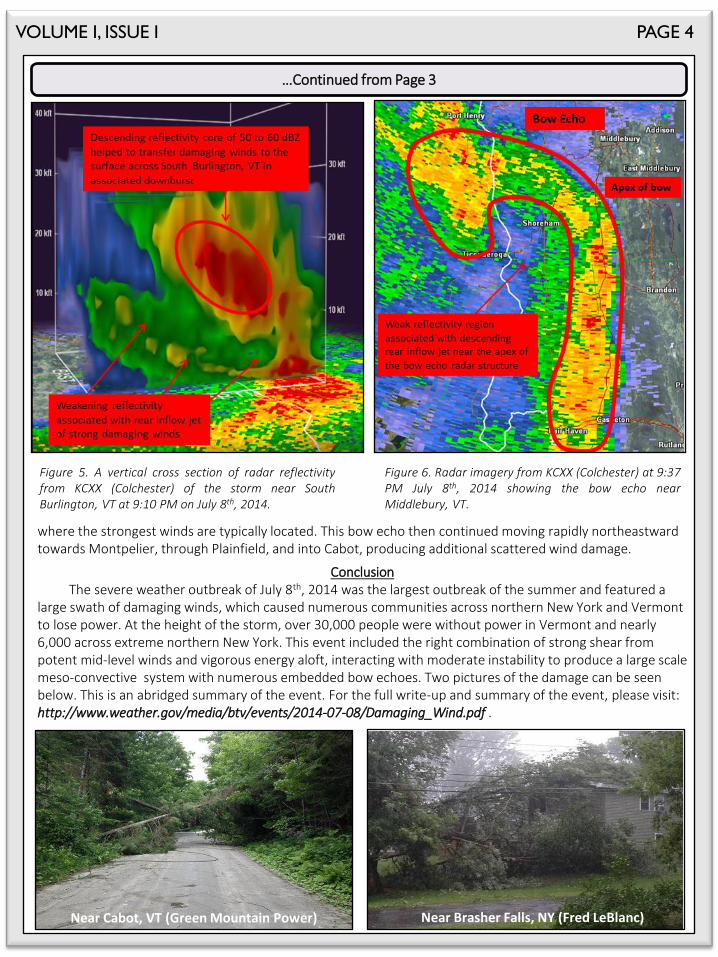
Storm Scale There were three greater concentrated areas of damage, that were caused by three of the more intense storms that moved across the area. The first was a bow echo and its associated comma head across the Saint Lawrence Valley which caused widespread wind damage, especially from Edwards to Star Lake to Cranberry Lake. The radar image in Figure 4 below shows the large scale bow echo, along with numerous embedded mini-bows. In addition, multiple weak echo channels on the upstream side of the bow echoes are present, indicating a descending rear inflow jet that resulted in the widespread damaging winds. The second was a downburst near South Burlington that caused damage near Red Rocks Park, along Dorset and Spear Streets, and up to the airport. This storm was a “pulse” storm that pulsed twice, once near Red Rocks Park and then again near the airport. In Figure 5 on page 4, the cross section shows the two-pulse reflectivity structure of the descending weak reflectivity region. Unfortunately the surface observation data was lost at Burlington International Airport, but before going out, it measured a wind gust to 42 mph. It was estimated by observers and meteorologists at the airport that the winds ranged between 50 and 60 mph. The third area was a bow echo and associated comma head that crossed the central Champlain Valley near Middlebury and tracked rapidly northeastward at speeds of 45 to 55 mph, producing additional scattered wind damage from Montpelier to Plainfield to Cabot in central Vermont. Figure 6 on page 4 shows the large scale bow echo and comma head as it approached Middlebury, VT. A weak echo channel was also present on the upstream side of the bow echo, indicating a descending rear inflow jet that resulted in damaging winds with numerous trees and power lines down in Middlebury. Also note the apex of the bow-like reflectivity structure, which is (Continued on Page 4)
Figure 4. Radar imagery from KTYX (Montague, NY) at 6:58 PM July 8th, 2014 showing the bow echo as it approached Saint Lawrence County in Northwestern New York
VOLUME I, ISSUE I PAGE 4
…Continued from Page 3
Figure 5. A vertical cross section of radar reflectivity from KCXX (Colchester) of the storm near South Burlington, VT at 9:10 PM on July 8th, 2014.
Conclusion The severe weather outbreak of July 8th, 2014 was the largest outbreak of the summer and featured a large swath of damaging winds, which caused numerous communities across northern New York and Vermont to lose power. At the height of the storm, over 30,000 people were without power in Vermont and nearly 6,000 across extreme northern New York. This event included the right combination of strong shear from potent mid-level winds and vigorous energy aloft, interacting with moderate instability to produce a large scale meso-convective system with numerous embedded bow echoes. Two pictures of the damage can be seen below. This is an abridged summary of the event. For the full write-up and summary of the event, please visit: http://www.weather.gov/media/btv/events/2014-07-08/Damaging_Wind.pdf .
Figure 6. Radar imagery from KCXX (Colchester) at 9:37 PM July 8th, 2014 showing the bow echo near Middlebury, VT.
where the strongest winds are typically located. This bow echo then continued moving rapidly northeastward towards Montpelier, through Plainfield, and into Cabot, producing additional scattered wind damage.
Near Cabot, VT (Green Mountain Power) Near Brasher Falls, NY (Fred LeBlanc)

VOLUME I, ISSUE I PAGE 5
A Look Back:
The Early Season Snowstorm of 2008
-Peter Banacos
Figure 1. Observed snowfall totals across Northern New York and Northern and Central Vermont. The maximum snowfall report of 19 inches was from Star Lake (elevation 1460 feet) in southern Saint Lawrence County.
In some years, the first significant snowfall of the cool season occurs in October, especially across the higher elevations of Vermont and northern New York. Case in point: a strong Nor'easter brought a significant early snow accumulation across much of northern New York as well as the higher elevations of Vermont over a two day period on 28-29 October 2008 (Figure 1). This article briefly reviews meteorological aspects of the storm and the strong elevational dependence of snow amounts, which is typical of many early (and late) season snowstorms across the region. The system responsible for this snowfall began as a weak wave of low pressure near the Outer Banks of North Carolina along a stalled frontal boundary
on 28 October 00z (8pm EDT on Oct. 27th). The low pressure system strengthened rapidly as it moved north to the New York Bight during the early morning hours on 28 October, and northward across the upper Connecticut river valley by late that afternoon (Figure 2 on page 6). The storm would eventually exit northward through southern Quebec during the pre-dawn hours on 29 October. The low pressure system associated with the heavy snow episode met the criterion typically used for explosive cyclogenesis, that is, an average deepening rate of at least 1mb per hour over a period of 24 hours (Figure 3 on Page 6). Such rapid deepening systems are often associated with rapid cooling due to ascent in the mid-troposphere, while temperatures closer to the surface remain marginally supportive of frozen precipitation reaching the ground. Prior to the development of this storm, the air mass across the northern New York and Vermont was not particularly cold; the high temperature on October 26th and 27th at Burlington, VT (KBTV) was 59oF and 55oF, respectively. As is often the case, near-surface temperatures represented the primary forecast challenge associated with this early season storm. Where and when temperatures would be cold enough to support snowfall during the event largely depended on the track of the low pressure system, and the magnitude of both dynamic and diabatic cooling that could occur above the ground. Dynamic cooling refers to the cooling influence of upward moving air which thermodynamically cools as it expands. Diabatic cooling in this case is the cooling affect associated with (1) air becoming saturated, and (2) melting of snow as it encounters above freezing air near the ground. The change of phase from snow to liquid water requires energy that over time can result in a net cooling effect on the air, pushing snow levels downward toward the ground. Both processes played a role in changing rain over to snow in this event at progressively lower elevations. (Continued on Page 6)

VOLUME I, ISSUE I PAGE 6
…Continued from Page 5
Figure 2. Regional Weather Prediction Center (WPC) surface analysis for 5PM on 28 October 2008, showing the surface low centered over the Connecticut River Valley.
Figure 3. Plot of minimum sea-level pressure (solid line) and 24 hour pressure change (dashed line) versus time, from 27 October at 11AM. Sea-level pressure values are based on 3 hourly WPC surface analyses.
As precipitation began during the morning hours on October 28th, snow levels across the North Country fluctuated between 1500 and 2000 feet. The meteogram at Saranac Lake (KSLK, elevation 1626 feet) is representative of the above freezing surface temperatures across much of the area through most of the daylight hours on 28 October (Figure 4). Conditions began to change during the mid to late afternoon hours on October 28th. As precipitation intensified, rain gradually changed over to snow. At 5PM precipitation had become much more widespread and intense across the North Country (Figure 5 on Page 7), and the surface temperature fell to 33oF at KSLK, marking the start of a prolonged period of accumulating snow at that location. Visibility during the next 30 hours was generally below 3 miles in snow, and briefly down to ¼ mile. (Continued on Page 7).
Figure 4. Meteogram (time series analysis) for
Saranac Lake, NY (elevation 1626 feet). Shaded region shows period of prolonged
snowfall and reduced visibility from about 5PM on October 28th through
midnight on October 30th. Temperatures initially
above freezing fell below freezing during the late afternoon on the 28th.

VOLUME I, ISSUE I PAGE 7
…Continued from Page 6
A vertical cross-section from the GFS model at 8PM on October 28th (Figure 6) shows a maximum in upward vertical velocity (UVV) over the northern Adirondacks, which is juxtaposed with a temperature regime that is microphysically optimal for dendrite snow growth (-12C to -18C). This combination resulted in heavy snow across the higher terrain where surface temperatures were at to slightly below freezing to support accumulating snow on the ground. The height of the freezing level with respect to the ground dictates the precipitation type reaching the surface when the only above freezing air is near the ground. Composite radar reflectivity (Figure 5) indicated "bright banding" due to melting snow aloft in vicinity of the radar at the lower elevations across the Champlain Valley. A vertical cross-section of radar reflectivity at this time (5PM October 28th) indicates the presence of this “bright banding” beneath the 0C isotherm, where falling snow is melting in the Champlain Valley and causing higher radar returns (Figure 8 on Page 8). The cross-section also indicates the lower freezing level across the higher terrain of the Adirondacks, where snowfall was heaviest and most prolonged. Although falling mostly as rain, precipitation reached its heaviest at the Burlington International Airport (KBTV) between 2PM October 28th and 8PM October 28th with a 6-hourly accumulation of 0.70". The freezing level would gradually lower during the overnight hours on October 28th into October 29th, allowing for snow levels to fall toward the valley floors across Vermont before precipitation came to an end. By early morning on October 30th, 2008, total snowfall amounts (Figure 1) ranged from 14-19 inches along the north side of the Tug Hill plateau (Continued on Page 8)
Figure 6. The morning run of the GFS (Global Forecast System) model vertical cross-section valid at 8PM on October 29th (12 hour forecast). Black solid lines are contours of equivalent potential temperature. Dotted lines indicate upward vertical motion with warm (cold) color-filled areas corresponding to areas of ascent (descent). The -12C, -15C, and -18C isotherms are shown as dashed black lines. This region is favorable for snow growth.
Figure 5. Mosaic radar imagery at 5PM on October 28th. Also shown are surface observations and sea-level pressure (2mb interval). The higher reflectivity values (yellow and red) over the Champlain Valley
represent a “bright banding” signature caused by melting snow. Note surface temperature of 42o at Burlington, VT with heavy rain and 33o
with heavy snow at Saranac Lake.

VOLUME I, ISSUE I PAGE 8
…Continued from Page 7
east-northeastward across the northern Adirondacks. In the WFO Burlington forecast area, the greatest snowfall reports came from the Star Lake, Cranberry Lake, and Wanakena areas of southern St. Lawrence County. Lesser snowfall amounts were observed in the immediate St. Lawrence Valley around Massena (3-4"). There was little or no snow accumulation in the immediate Champlain valley of New York. To the east across Vermont, where temperatures were generally warmer during the event, snowfall amounts varied even more strongly with elevation. The highest snowfall totals were reported at the top of Mt. Mansfield (12") and from the cooperative observer at the base of Jay Peak (11"). Areas adjacent to the central and northern Green mountains generally received 3-8 inches of snowfall with lesser amounts in the valleys. A snow accumulation of 0.3" was recorded at the Burlington International Airport with little or no accumulation across the Lake Champlain Islands. Storm impacts included scattered power outages due to the high liquid water content of the snow, and difficult travel conditions especially in the higher elevations. Note: This is an abridged analysis of the event. For the full write-up and summary of the event, please visit: http://www.erh.noaa.gov/btv/events/28Oct2008/overview.php
Figure 7. Colchester, VT (KCXX) radar reflectivity (dBz)
cross-section at 4:53PM October 28th, juxtaposed
with 0-hour Rapid Update Cycle (RUC) model
temperatures at 5PM October 28th.
The October 28th-29th 2008 snowstorm as seen near
Lake Placid, NY. Photo from WCAX.

VOLUME I, ISSUE I PAGE 9
The Science Behind Lake-Effect
Precipitation
-Andrew Loconto
Figure 1. Schematic of Lake Effect Precipitation.
As we move into the colder months of fall and winter with cooler air masses overspreading the North Country, the occurrence of lake-effect precipitation becomes more common. So, how does it form?
The Meteorology of Lake-Effect Precipitation Lake-effect precipitation develops when cold air masses move across a relatively warm and moisture-laden lake. A sufficiently large enough temperature contrast between the lake and the air directly above it will produce narrow, localized bands of convective clouds – bands which align themselves parallel to the direction of the low-level wind. Figure 1 shows a schematic of this phenomenon. The precipitation type that is produced by lake-effect bands is ultimately determined by the temperature structure of the atmosphere. Lake-effect snow is the most common and more well-known, but lake-effect rain can also result if the temperature structure is above-freezing. Wind has a significant effect on lake effect bands as well. One of the ideal conditions for significant lake effect precipitation is when the low-level wind blows parallel to the orientation of the lake – called the fetch. A large fetch allows for a more enhanced transport of lake moisture than in a situation in which the wind blows less parallel to the orientation of the lake (i.e. a smaller fetch). Also, how far inland the band spreads from the lakeshore is a function of the low-level wind speed. Generally, the stronger the low-level winds, the farther inland the lake-effect band can penetrate. The production of lake-effect bands ends when (a) the lake-air temperature difference is reduced (i.e. is more stable) or (b) the lake is frozen over with ice, limiting moisture. Lake-effect bands are more common and more intense across the Great Lakes, as seen in the radar image taken from Buffalo, NY WSR-88D Doppler radar in Figure 2(a) on Page 10. The size of the Great Lakes and their orientation compared to Lake Champlain allow for greater moisture transport. As we’ll see in the following section, precipitation from lake effect events can occur here in the North Country as well.
Lake-Effect and the North Country There are a few areas in the North Country where lake-effect precipitation bands can occur. The most common area for lake-effect precipitation from Lake Ontario is across southern St. Lawrence and southwestern Franklin County in New York. Occasionally, lake-effect precipitation from Lake Ontario can occur as far east as the Champlain Valley. Figure 3 on Page 10 highlights the areas most impacted. Lake Champlain has also produced periods of localized lake-effect precipitation. Figure 2(b) on Page 10 provides an example of a narrow band of lake-effect snow produced by Lake Champlain which extended into far eastern Essex County in New York and western Chittenden and northern Addison Counties in Vermont, as seen from Colchester, VT WSR-88D Doppler radar. Lake-effect bands from Lake Champlain tend to be produced in north- to northwest flow, which enhances the fetch across the broad Lake. (Continued on page 10)
VOLUME I, ISSUE I PAGE 10
…Continued from Page 9
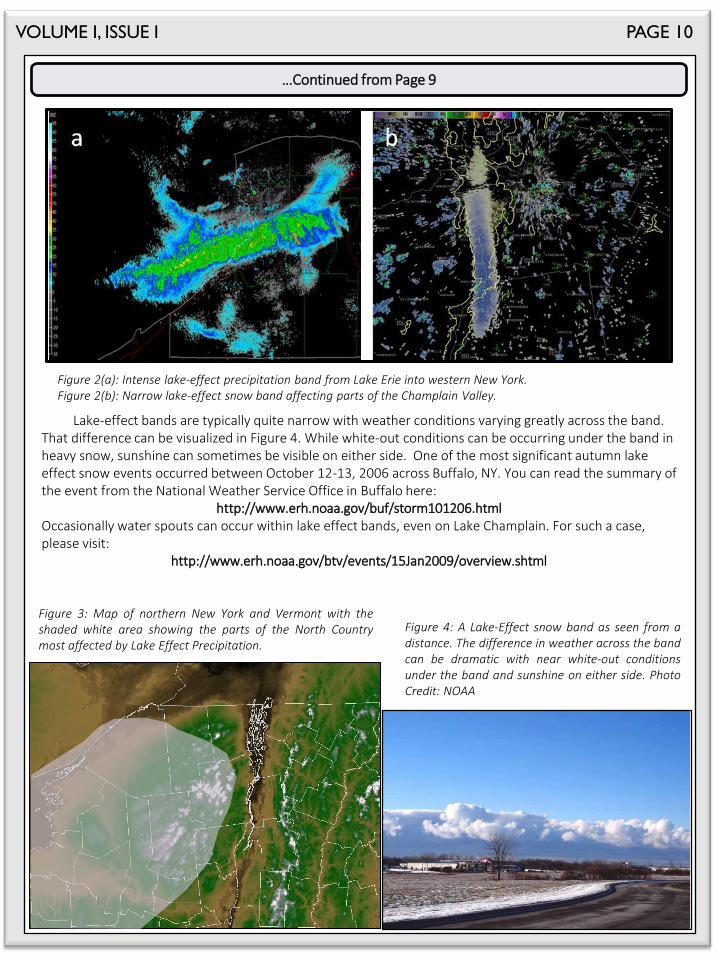
Figure 2(a): Intense lake-effect precipitation band from Lake Erie into western New York. Figure 2(b): Narrow lake-effect snow band affecting parts of the Champlain Valley.
Lake-effect bands are typically quite narrow with weather conditions varying greatly across the band. That difference can be visualized in Figure 4. While white-out conditions can be occurring under the band in heavy snow, sunshine can sometimes be visible on either side. One of the most significant autumn lake effect snow events occurred between October 12-13, 2006 across Buffalo, NY. You can read the summary of the event from the National Weather Service Office in Buffalo here:
http://www.erh.noaa.gov/buf/storm101206.html Occasionally water spouts can occur within lake effect bands, even on Lake Champlain. For such a case, please visit:
http://www.erh.noaa.gov/btv/events/15Jan2009/overview.shtml
Figure 4: A Lake-Effect snow band as seen from a distance. The difference in weather across the band can be dramatic with near white-out conditions under the band and sunshine on either side. Photo Credit: NOAA
Figure 3: Map of northern New York and Vermont with the shaded white area showing the parts of the North Country most affected by Lake Effect Precipitation.

VOLUME I, ISSUE I PAGE 11
Looking back at the meteorological summer of 2014, defined as the days from June 1st through August 31st, some might say it was cool, some might say it was pleasant, or some might say it was dry. But when it comes down to it, the summer was normal, almost as normal as can be. For the three month period, the temperatures at Burlington, VT were actually slightly above the 30-year normal (+1.1 degrees). However that was a slight outlier, as Montpelier, VT finished just barely below normal, and Massena, NY actually finished exactly normal. Precipitation was also remarkably normal for most, with Burlington, Montpelier, and Morrisville all finishing well within one inch of normal. Northern New York
Table 1. Temperature and Precipitation Departures from 1981-2010 Normals for June 1 – August 31, 2014
Figure 1. Total June – August 2014 Precipitation Departures from 1981-2010 Normals
Figure 2. Average June – August 2014 Temperature Departures from 1981-2010 Normals
Burlington Montpelier Massena
Temperature +1.1° -0.8° 0.0°
Precipitation +0.18” +0.60” +4.92”
was slightly wetter with Massena, NY seeing the greatest departures. Table 1 and Figures 1 and 2 show the 2014 departures from the 1981 – 2010 climate normals across the North Country for both temperature and precipitation.
The summer of 2014 was one without many extremes. In the entire three month period, Burlington, VT only reached 90 degrees or higher three times, about half of its average, while some locations like Montpelier failed to even reach 90 degrees once (See Table 2 Page 12). Also emphasizing the general pleasantry of the summer was August’s distinction of not having any double-digit departure days at Burlington, meaning that every day of the month was within 10 degrees of its normal. There were also very few severe weather outbreaks across the North Country, and only a couple of flooding incidents, a departure from previous years where scenes of damaging winds, large hail, and flooding occurred much more often. Figure 3 on the following page highlights all of the reports of severe weather or flooding we have received. (Continued on Page 12)

VOLUME I, ISSUE I PAGE 12
…Continued from Page 11
Figure 3. All Hail, Flood, and Thunderstorm Wind Gust and Damage Reports from June 1 – August 31, 2014 across the North Country. Broken trees represent wind damage, circular bubble numbers represent hail size, rectangular bubble numbers represent wind gust speed, and the water symbols represent flooding. Image courtesy of National Weather Service San Diego.
Burlington Montpelier Massena
# of 90° days 3 0 1
Normal (Dep) 6 (-3) 2 (-2) 5 (-4)
Table 2. Number of 90 degree days and Departures from 1981-2010 Normals for June 1 – August 31, 2014
June Recap June started off on the warm side with a pair of very warm days on the 2nd and 3rd (86 and 89 degrees at Burlington). However that was not a harbinger of things to come as the rest of the month was warm, but
but not excessively so, with plenty of days in the 70s and low 80s. There were even two consecutive days mid-month (12th & 13th) that featured rain and temperatures holding in the 60s. The next warmest period came at the end of the month with several days with highs in the mid and upper 80s. There was very little severe weather with only a couple of trees down in Rutland County with some thunderstorms on June 18th. Warmest: 90°- Essex Junction, VT June 3rd Coolest: 31°- Saranac Lake, NY June 1st Warmest at Burlington: 89°- June 3rd Coolest at Burlington: 47°- June 1st & 21st
July Recap July was the warmest and most active month with three days of more widespread severe thunderstorms on the 3rd, the 8th, and the 27th and one day with some flash flooding. The outbreak on July 8th is featured in the main article in this newsletter and had numerous wind damage reports. The most
significant flash flooding of the season occurred on July 28th in the towns of Andover and Chester in Windsor County Vermont. This month also featured the three 90 degree days of the summer at Burlington, but they were not consecutive, so there was no official heat wave this year. The hottest day occurred on July 1st with a high of 92 and a low of only 75 at Burlington. The other 90 degree days were July 2nd and July 22nd.
Warmest: 94°- Bethel, VT July 2nd; Coolest: 37°- Saranac Lake, NY July 30th Warmest at Burlington: 92°- July 1st ; Coolest at Burlington: 52°- July 30th
August Recap
August was exceptionally unexceptional with only a couple of severe weather reports to speak of, and the majority of them occurred on August 5th in Rutland County. There were no 90 degree days at Burlington, and the month actually featured some early fall-like weather mid-month when three consecutive days failed to reach 70 degrees. The month ended within a few tenths of a degree of normal at Burlington, and no day had a temperature departure of 10 degrees or greater.
Warmest: 90°- South Hero, VT August 10th; Coolest: 36°- Saranac Lake, NY August 19th Warmest at Burlington: 87°- August 11th ; Coolest at Burlington: 49°- August 19th

VOLUME I, ISSUE I PAGE 13
Upcoming Outreach Events & Winter Weather Awareness Week
-Michael Muccilli
Winter Webinar Series New this upcoming winter, we will be hosting a series of interactive webinars. In these webinars we will be providing virtual spotter training as well as different learning experiences on various topics ranging from mixed precipitation to mountain weather to case studies. More information will follow.
Upcoming Events None scheduled at this time.
Winter Weather Awareness Week The National Weather Service in Burlington has declared the week of November 3rd, 2014 to be Winter Weather Awareness Week. During this week, be on the lookout for daily information regarding winter weather safety on our website, www.weather.gov/btv, our Facebook page, https://www.facebook.com/NWSBurlington, and our Twitter page, https://twitter.com/NWSBurlington . Winter Weather can occur in the late fall months in the North Country as well, and you want to be prepared before winter begins, so here are some safety reminders… When driving… Leave extra room. Slick roads require more stopping distance, and if visibilities are reduced due to fog, snow, or even rain, you won’t be able to see and react as quickly. Snow tires are highly encouraged. A Winter Preparedness Kit for the car is also encouraged. This should include a fully charged cell phone, blankets and extra clothing, a flashlight and batteries, a knife, a first aid kit, a shovel, a sack of sand, jumper cables, a tool kit, a tow rope, road maps and a compass, and extra food and water. Keep informed of the weather forecast and the current road conditions. If you do become stuck on the roadway, make sure to keep your exhaust pipe free of snow and open your window slightly to allow fresh air into the car. When at home… Have a Preparedness Kit for emergency situations. This should include water, a battery powered NOAA Weather Radio, a flashlight, extra batteries, a First Aid Kit, matches, tools, paper products, cash or traveler’s checks, extra clothing, personal hygiene items, important family documents, food, moist towelettes, infant products if necessary, pet products if necessary, a whistle to signal for help, a flare, a compass, and a tent. Also make sure to maintain heating equipment and chimneys by having them cleaned and inspected every year. All fuel-burning equipment should vent to the outside and kept clear. Remember to never use a generator inside the home, garage, basement, or crawlspace. Locate it away from doors, windows, and vents. Check to make sure your carbon monoxide detector is working.

VOLUME I, ISSUE I PAGE 14
Conor Lahiff
One of the most popular and widely used forecasts that we, the National Weather Service forecasters in Burlington, VT, produce is for Lake Champlain. Every summer, thousands of people flock to these waters to recreate in many fashions, and we strive to provide the highest quality forecasts and information you can find for these activities. On our website, under “Forecasts” and “Recreational” (http://www.weather.gov/btv/recreation) you can find everything we produce from daily forecasts to current conditions, historical data, model data, and even high resolution satellite imagery of ice coverage during the winter months.
Two delivery methods that we are most proud of are the graphical (http://www.weather.gov/btv/lake_graphical) and point (http://www.weather.gov/btv/lake_point) forecasts. These can be seen above and to the left. Both forecasts are overlaid on a Google map interface, where you the user can scroll around and get a feel for what we’re thinking the winds and waves will be on a particular day. If you’re planning a sailing trip from Rouses Point to Burlington, the graphical forecast can show you what conditions to expect over your entire route. Or if you’re someone who likes to just stay in Mallets Bay, the point forecast can give you the forecast winds and waves for that exact location. In addition to all the great forecast information on our web page, if you’re interested in how we produce these forecasts, one of our lead forecasters put together a great summary of “The Science Behind the Creation of the Lake Champlain Forecast.” Be sure to check that out as well! It can be viewed here: http://www.weather.gov/media/btv/lake/Science_behind_the_forecast.pdf .
The graphical Lake Champlain forecast of wind speed and direction. Lake wave heights are also available.
The point Lake Champlain forecast of weather, visibility, wind speed and direction, and lake wave heights.

National Weather Service Burlington, VT Burlington International Airport
1200 Airport Drive South Burlington, VT 05403
Phone: (802) 862 2475 www.weather.gov/btv
Email: [email protected]
The Four Seasons Volume I, Issue I
Contributors:
Peter Banacos, Meteorologist Conor Lahiff, Meteorologist
Andrew Loconto, Meteorologist Michael Muccilli, Meteorologist
Brooke Taber, Meteorologist
Editors: Michael Muccilli, Meteorologist
Kimberly McMahon, Meteorologist
Follow us on Facebook and Twitter!
US National Weather Service Burlington, VT
@NWSBurlington
Please report snowfall, flooding, damaging winds, hail, and tornadoes. When doing so, please try, to the best of your ability, to measure snowfall, estimate hail size, and be specific as to what damage occurred and when. We
also love pictures!
For reports, please call: (802) 863-4279
Or visit: http://www.weather.gov/btv/stormreport