the fourth international symposium on computational wind
TRANSCRIPT

The Fourth International Symposium on Computational Wind Engineering(CWE2006), Yokohama, 2006
Numerical and experimental studies of airfoils suitable for Vertical Axis Wind Turbines
and an application of wind-energy collecting structure for higher performance
Shuhei Takahashi a, Yuji Ohya b, Takashi Karasudani Koichi Watanabe d
'Dept. of Aeronautics and Astronautics, Kyushu University, 6-1 Kasuga-koen, Kasuga, Japan b'cResearch Institute for Applied Mechanics, Kyushu University, 6-1 Kasuga-koen, Kasuga, Japan
dMitsubishi Heavy Industries, 10 Ooe-cho, Minato-ku, Nagoya, Japan
ABSTRACT: Numerical simulations and wind tunnel experiments were carried out to study airfoils and a wind-energy collecting structure (wind-lens) suitable for Straight Wing Vertical Axis Wind Turbines (SWVAWT). The aim of this study is to increase the output power coefficients of SWVAWT. The numerical method is a direct numerical simulation (DNS) based on the finite difference method. The results of DNS revealed that symmetry airfoils are better than asymmetry airfoils for the output performance. In the wind tunnel experiment, the results of output performance test showed that the best airfoil is NACA0024. We designed a wind-lens and applied it to SWVAWT. In the wind tunnel experiments, the output power coefficients of SWVAWT with a wind-lens were more than 2 times as large as those of a SWVAWT only. We made clear the effect of the wind-lens on the output performance by DNS.
KEYWORDS: Straight Wing Vertical Axis Wind Turbine, Airfoil, Wind-energy collecting structure, Direct numerical simulation, Wind tunnel experiment
1 INTRODUCTION Small-type wind turbines are used in many ways as an independent electric source. Among them, Straight Wing Vertical Axis Wind Turbine (SWVAWT, Fig.1) is popular for the independency of the wind direction and its simple structure. However, the output performance of SWVAWT is generally lower than that of Horizontal Axis Wind Turbine (HAWT).
Our purpose is to increase the output power performance of SWVAWT. For this purpose, we have studied the shape of an airfoil and a wind-energy collecting structure (we call it "wind-lens") suitable for SWVAWT. In the past studies, suitable airfoils were investigated by Seki [1] and Ishimatu et al. [2]. However, it is still unclear about suitable airfoils. The wind-lens can accelerate the approaching wind to a wind turbine (Fig.2). It has been developed in our laboratory. Fivefold increase in output power of a HAWT with a wind-lens compared to conventional HAWTs is achieved [3]. Therefore, we tried to apply it also to SWVAWT (Fig.3).
2 NUMERICAL METHOD AND WIND TUNNEL EXPERIMENT
2.1 Numerical method The governing equations consist of the continuity and incompressible Navier-Stokes equations. Table 1 shows the overview of the present numerical simulation method. Fig.4 shows an airfoil
(MEL002) approximated by rectangular grids for numerical simulations.
―327―

Table 1. Simulation code and calculation conditions
2.2 Wind tunnel experiment
For wind tunnel experiments, a large boundary-layer wind tunnel with the measurement section
of 3.6m(W) •~2.0m(H)•~15m(L) was used. We performed experiments on output performance of
SWVAWT. The approaching wind speed, U, is 6m/s. The Reynolds number, Re, is about
6.2x 10⁴ based on the airfoil chord (0.15m).
For the experimental method, a torque transducer (the rating 0.5N • m) was connected to
the lower position of a SWVAWT where an AC torque motor brake was set for the loading. We
measured the torque Q N• m and the rotational speed m Hz of the SWVAWT in a condition
where the turbine loading is gradually applied from zero. The output power coefficient, Cw, is
defined as Cw=2 zmQI(0.5 p U3.4)
3 RESULTS AND DISCUSSION
3.1 Comparison between numerical and experimental results
Fig.5 shows the comparison of the power coefficient curves (Cw) between DNS and wind tunnel
experiment. The horizontal axis is the tip-speed ratio, 2 (=r co /U). Both results show a
qualitative agreement in the Cw variations with 2 and airfoil thickness.
3.2 Airfoil suitable for SWVAWT
3.2.1 DNS
First, we consider which airfoil is better, symmetry airfoils or asymmetry ones. Therefore, we
carried out DNS to investigate power coefficients of SWVAWT with NACA0024 (a symmetry
airfoil) and MEL002 (an asymmetry airfoil). Note that MEL002 is attached to the supporting arm
in two ways, one is that the upper surface faces the axis and the other is that the lower surface
faces the axis. The number of blades is two and the tip-speed ratio is 1.5 at which SWVAWTs
show the highest power coefficients.
Table 2. Comparison of power coefficients of three types of SWVAWTs (DNS, the tip-speed ratio=1.5)
Table 2 shows the power coefficients. A SWVAWT with NACA0024 shows the highest power coefficient. To make clear the reason why there is the difference in power coefficients among airfoils, we compare the torque coefficients, C7(=Cw/.1), along the rotation angle (Fig.6)
―328―

between the SWVAWT with NACA0024 and that with MEL002 (Fig.7). At B20•‹ , the SWVAWT with NACA0024 generates the largest torque and the one with MEL002 (lower
surface toward axis) generates the smallest torque. At ƒÆ•à-135•‹, the SWVAWT with
NACA0024 generates the largest torque and the one with MEL002 (upper surface toward axis)
generates the smallest torque. It is found that a SWVAWT with symmetry airfoils generate its
torque efficiently and show higher power coefficients than that with asymmetry airfoils .
3.2.2 Wind tunnel experiment
As mentioned above, we have found that symmetry airfoils show high power coefficients . To
investigate what a degree of airfoil thickness is better for high performance, we have made some
experiments using symmetry airfoils, NACA0012, NACA0018, NACA0024 and NACA0030.
Fig.5 shows the power coefficients curves. From this figure, the highest power coefficient is
obtained when NACA0024 is used. It means that there is an optimal thickness for higher
performance.
3.3 Application of wind-lens
3.3.1 Wind tunnel experiment
We designed a wind-lens and applied it to the SWVAWT (Fig.2). Fig .8 shows the power
coefficient curves of a SWVAWT with a wind-lens compared to those of SWVAWT only . The
maximum power coefficient of the SWVAWT with a wind-lens shows more than 2 times as
large as that of the SWVAWT only.
3.3.2 DNS
To make clear the effect of the wind-lens, we compare the time-averaged streamlines (Fig .9) and
the torque coefficients (Fig.10) between a SWVAWT only and a SWVAWT with a wind-lens .
Fig.9 shows the wind-lens collects and accelerates the wind toward the SWVAWT. Fig .10 shows
that when the wind-lens is applied, larger torque is generated in the upstream of the axis and also
in the downstream of the axis.
4 CONCLUSIONS
We studied airfoils suitable for SWVAWT and applied a wind-lens (wind-energy collecting
structure) to SWVAWT for higher performance.
It is found that symmetry airfoils are better than asymmetry ones for the output
performance. The SWVAWT with NACA0024 airfoil shows the highest output performance. For the application of a wind-lens, in the wind tunnel experiment
, a SWVAWT with a wind-lens shows more than twofold increase in power coefficient compared to a SWVAWT
only. The wind-lens collects and accelerates the approaching wind and a larger torque is
generated in the upstream of the axis and also in the downstream of the axis.
REFERENCES
Seki Kazuichi, "Research and Development of High-Performance Airfoil Sections for Vertocal Axis Wind
Turbine at Low-Reynolds Number", Trans. of JSME, Vol.57, No.536, pp .1297-1304, 1991 (in Japanese). 2 Ishimatsu Katsuya, "Numerical Trial of suitable Foil Section for Darrieus-type Wind Turbine" , Proceedings of
JSME Fluid Eng. Division Meeting, 1815, 2005 (in Japanese).
―329―

3 Koichi Watanabe, Yuji Ohya, Takashi Karasudani and Kimihiko Watanabe, "Development of a Wind Turbine Generating High Output Power", Proceedings of the Fifth Korea/Japan Joint Workshop on Aeronautics and
Astronautics, 2004.
Figure 1. Straight Wing Figure 3. SWVAWT with Vertical Axis Wind wind-energy collecting
Turbine. structure.
Wind-energy Collecting Structure{Wind-lens)Figure 2. Mechanism of accelerating the approaching wind speed.
Figure 5. Comparison of power coefficient curves
between numerical simulations and wind tunnel experiments.
Figure 4. Approximated Figure 6. Rotation angle airfoil (MEL002)
Figure 7. Comparison of time-averaged torque coefficients along the rotation angle (DNS)
Figure 8. Comparison of power coefficient curve between a SWVAWT only and a SWVAWT with a wind-lens (wind tunnel experiment)
Figure 9. Comparison of the time-averaged streamlines between a SWVAWT only and a SWVAWT with a wind-lens (DNS)
Figure 10. Comparison of torque coefficients along the rotation angle between a SWVAWT only and a SWVAWT with a wind-lens (DNS)
―330―

The Fourth International Symposium on
Computational Wind Engineering(CWE2006), Yokohama, 2006
Micro-siting technique for wind turbine generator
by using large-eddy simulation
Takanori Uchida a and Yuji Ohya b
a Research Institute for Applied Mechanics, Kyushu University, 6-1 Kasuga-kouen, Kasuga, Japanb Research Institute for Applied Mechanics, Kyushu University, 6-1 Kasuga-kouen, Kasuga, Japan
ABSTRACT: It is highly important in Japan to choose a good site for wind turbine generators, becausethe spatial distribution of wind speed is quite complicated over steep complex terrain. We are developingthe unsteady numerical model called the RIAM-COMPACT (Research Institute for Applied Mechanics,Kyushu University, Computational Prediction of Airflow over Complex Terrain). The RIAM-COMPACTis based on the LES (Large-Eddy Simulation). The object domain of the RIAM-COMPACT is from sev-eral m to several km. First, to test the accuracy of the RIAM-COMPACT, we have performed the experi-mental and numerical simulation of a non-stratified airflow past a two-dimensional ridge and a three-dimensional hill in a uniform flow. Attention is focused on airflow characteristics in a wake region. Forthis purpose, the streamwise velocity component was measured with a SFP (Split-Film Probe) in the windtunnel experiment. Through comparison of the experimental and numerical results, they showed a goodagreement. The accuracy of both of the wind tunnel experiment by the SFP and also numerical simulationby the RIAM-COMPACT were confirmed. Next, we have applied the RIAM-COMPACT to the airflowover real complex terrain. The numerical results obtained by RIAM-COMPACT demonstrated that thechanges induced on the wind field by the topographic effect, such as the local wind acceleration and theflow separation, were successfully simulated. The wind speed was evaluated in consideration of the corre-lation with the observational data.
KEYWORDS: Wind power, Micro-siting technique, Complex terrain, LES
1 INTRODUCTIONThere exists a great and urgent need to reduce CO2 emissions as a way to combat global warming.
Therefore, attention has focused on the development of environmentally friendly wind energy (naturalenergy). In Japan, the number of wind power generation facilities has increased rapidly from severalWTGs (Wind Turbine Generators) to a large-scale WF (Wind Farm). The output of the WTG is propor-tional to the cube of the wind speed. Therefore, it is important that the windy region in which the WTG isinstalled be chosen carefully. The terrain in Japan is remarkably different from that of Europe and Amer-ica, and thus it is extremely important to consider Japan's unique topographic effect on the wind, such asa local speed-up, separation, reattachment,and so on W(2).
The social and technological requirements for wind power are strong. Concentrating on a space ofseveral km or less, we are developing an unsteady, non-linear-type numerical simulator called the RIAM-COMPACT (Research Institute for Applied Mechanics, Kyushu University, Computational Prediction ofAirflow over Complex Terrain) (3)-(5). The RIAM-COMPACT is a FORTRAN program based on the FDM(Finite-Difference Method), and adopts an LES (Large-Eddy Simulation) technique as a turbulence model.We have been examining the practical use of the RIAM-COMPACT for several years. The RIAM-COMPACT has already been marketed by certain tie-up companies. Estimation of annual electrical poweroutput is also possible now based on field observation data.
In the present study, first, to test the accuracy of the RIAM-COMPACT we have performed the ex-perimental and numerical simulation of a non-stratified airflow past a two-dimensional ridge and a three-dimensional hill in a uniform flow. Attention is focused on airflow characteristics in a wake region. Forthis purpose, the streamwise velocity component was measured with a SFP (Split-Film Probe) in the windtunnel experiment. Next, we have applied the RIAM-COMPACT to the airflow over real complex terrain.
•\ 331•\
2 CHARACTERISTICS OF THE RIAM-COMPACT
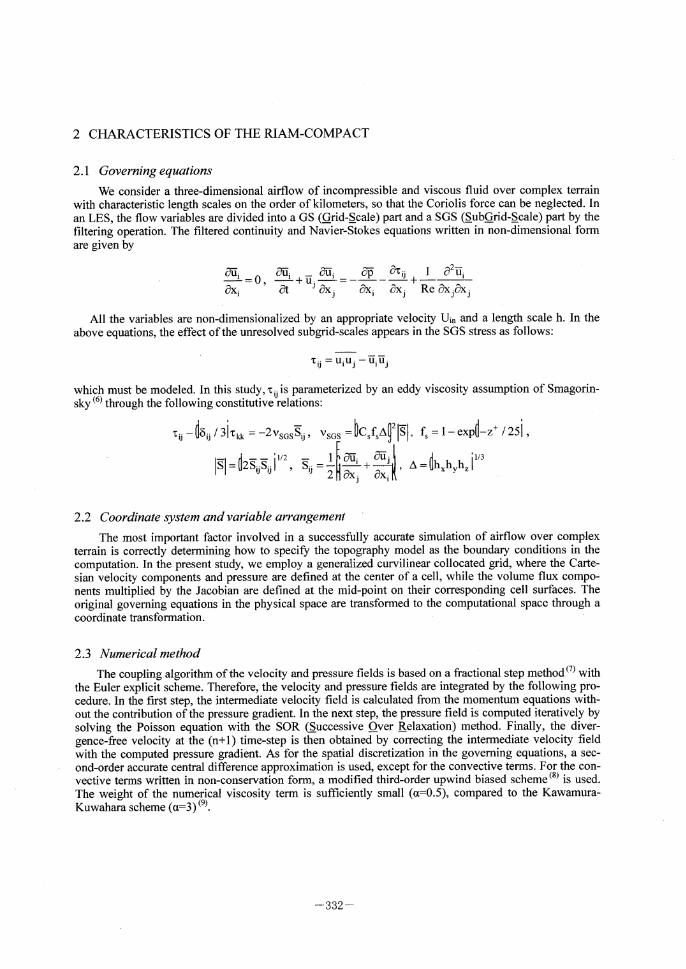
2.1 Governing equations
We consider a three-dimensional airflow of incompressible and viscous fluid over complex terrainwith characteristic length scales on the order of kilometers, so that the Coriolis force can be neglected. Inan LES, the flow variables are divided into a GS (Grid-Scale) part and a SGS (SubGrid-Scale) part by the filtering operation. The filtered continuity and Navier-Stokes equations written in non-dimensional formare given by
All the variables are non-dimensionalized by an appropriate velocity Uin and a length scale h. In the
above equations, the effect of the unresolved subgrid-scales appears in the SGS stress as follows:
which must be modeled. In this study, ti is parameterized by an eddy viscosity assumption of Smagorin-
sky (6) through the following constitutive relations:
2.2 Coordinate system and variable arrangement
The most important factor involved in a successfully accurate simulation of airflow over complexterrain is correctly determining how to specify the topography model as the boundary conditions in thecomputation. In the present study, we employ a generalized curvilinear collocated grid, where the Carte-sian velocity components and pressure are defined at the center of a cell, while the volume flux compo-nents multiplied by the Jacobian are defined at the mid-point on their corresponding cell surfaces. Theoriginal governing equations in the physical space are transformed to the computational space through acoordinate transformation.
2.3 Numerical method
The coupling algorithm of the velocity and pressure fields is based on a fractional step method (7) withthe Euler explicit scheme. Therefore, the velocity and pressure fields are integrated by the following pro-cedure. In the first step, the intermediate velocity field is calculated from the momentum equations with-out the contribution of the pressure gradient. In the next step, the pressure field is computed iteratively bysolving the Poisson equation with the SOR (Successive Over Relaxation) method. Finally, the diver-gence-free velocity at the (n+1) time-step is then obtained by correcting the intermediate velocity fieldwith the computed pressure gradient. As for the spatial discretization in the governing equations, a sec-ond-order accurate central difference approximation is used, except for the convective terms. For the con-vective terms written in non-conservation form, a modified third-order upwind biased scheme (8) is used.The weight of the numerical viscosity term is sufficiently small (a=4.5), compared to the Kawamura-Kuwahara scheme (a=3) (9).
•\ 332•\

3 WIND TUNNEL EXPERIMENT FOR ACCURACY VERIFICATIONFirst, to test the accuracy of the RIAM-COMPACT, we have performed the experimental and nu-
merical simulation of a non-stratified airflow past a two-dimensional ridge and a three-dimensional hill ina uniform flow. The Reynolds number, based on the uniform flow and the height of the model, is about104. Fig.1 shows the comparison of the smoke photograph in the wind tunnel experiment . Here, it is a re-sult of span central side. Airflows around the model include the unsteady vortex shedding in both of atwo-dimensional ridge and a three-dimensional hill. Fig.2 shows the comparison of the visualization re-sults in the numerical simulation (RIAM-COMPACT). These results were visualized by the passive parti-cle tracking method. The numerical results were compared with the wind tunnel experiment, and an excel-lent agreement was obtained qualitatively. Fig.3 shows the streamlines for the time-averaged flow field in
the span central side. The eddy region is formed behind both models. A clear difference can be perceivedin the streamwise direction. The eddy size of a three-dimensional hill is smaller than that of a two-dimensional ridge. Attention is focused on airflow characteristics in a wake region . For this purpose, thevelocity component in the streamwise direction was measured with a SFP in the wind tunnel experiment .Fig.4 shows the comparison of the mean-velocity profiles at some typical points. Through comparison ofthe experimental and numerical results, they showed a good agreement. The accuracy of both of the windtunnel experiment by the SFP and also numerical simulation by the RIAM-COMPACT were confirmed asthe result.
4 APPLICATION TO REAL COMPLEX TERRAINWe have applied the RIAM-COMPACT to the airflow over real complex terrain. First of all,
1/2500-scale model of Noma cape wind power plant in the Kagoshima prefecture was done in handmade ,and the wind tunnel experiment and the numerical simulation were performed. In the numerical simula-tion, 10m DEM (Digital Elevation Model) data of Hokkaido-chizu co., ltd. was used. Those results areomitted for the convenience of space. Furthermore, elevation data of 5m resolution was constructedbased on the paper map. The calculations for 16 wind directions were executed by using it. The result ob-tained was compared with the field observation data. A part of the results is shown in Fig .5, Fig.6 andFig.7. The instantaneous wind speed was evaluated in consideration of the correlation with the observa-tional data. The relative error to the observation value of both of an annual average wind speed and anannual electric power output was within 1%.
5 CONCLUDING REMARKSAn unsteady, non-linear-type numerical simulator called the RIAM-COMPACT that we are develop-
ing was introduced. The prediction accuracy intended for simple terrain was clarified , and the applicationexample to the real complex terrain was shown.
References1) Murakami, S., Mochida, A., Kato, S. and Kimura, A., Development and Verification of Local Area Wind En-
ergy Prediction System LAWEPS, J. Japan Society of Fluid Dynamics, (in Japanese), Vol.22, No.5 (2003),pp.375-386
2) Ishihara, I., A Nonlinear Wind Prediction Model MASCOT : Development and Application, J. Japan Society ofFluid Dynamics, (in Japanese), Vol.22, No.5 (2003), pp.387-396
3) Uchida, T. and Ohya, Y., Numerical Simulation of Atmospheric Flow over Complex Terrain, J. Wind Eng. Ind.Aerodyn., Vol.81 (1999), pp.283-293
4) Uchida, T. and Ohya, Y., Large-Eddy Simulation of Turbulent Airflow over Complex Terrain, J. Wind Eng.Ind. Aerodyn., Vol.91 (2003), pp.219-229
5) Uchida, T. and Ohya, Y., Development of the Local Wind Field Simulator RIAM-COMPACT-Wind Field As-sessment and Real Time Simulation-, J. Japan Society of Fluid Dynamics, (in Japanese), Vol.22, No.5 (2003),pp.417-428
6) Smagorinsky, J., General circulation experiments with the primitive equations, Part 1, Basic experiments, Mon.Weather Rev., Vol.91 (1963), pp.99-164
7) Kim, J. and Moin, P., Application of a fractional-step method to incompressible Navier-Stokes equations, J.Comput. Phys., Vol.59 (1985), pp.308-323
•\ 333•\

8) Kajishima, T., Upstream-shifted interpolation method for numerical simulation of incompressible flows , Bull.Japan Soc. Mec. Eng. B, (in Japanese), 60-578 (1994), pp.3319-3326
9) Kawamura, T., Takami, H. and Kuwahara, K., Computation of high Reynolds number flow around a circularcylinder with surface roughness, Fluid Dyn. Res., Vol.1 (1986), pp.145-162
I wo-dimensional rid re
(b)Three-dimensional hill
Fig.1 Comparison of the visualization in the wind
tunnel experiment, smoke-wire technique,
side view
(a)Two-dimensional ridge
(b)Three-dimensional hillFig.2 Comparison of the visualization in thenumerical simulation(RIAM-COMPACT),passive particle tracking method, side view
(a)Two-dimensional ridge
(b)Three-dimensional hillFig.3 Streamlines for the time-averaged flow
field, t=200•`300, side view
(a)x=-2h (b)x=2h (c)x=4hFig.4 Comparison of the mean-velocity profiles,
line : calculation by RIAM-COMPACT,
symbol : experiment by SFP
Fig.5 Velocity vector in the vertical plane
Fig.6 Comparison of time series data of observa-
tion value and prediction value, No.1
Fig.7 Comparison of monthly mean wind
speed, No.1
•\ 334•\

The Fourth International Symposium onComputational Wind Engineering(CWE2006), Yokohama, 2006
Numerical studies of flows around a wind turbine equipped witha flanged diffuser shroud by using an actuator-disc model
Masaru Hasegawa', Yuji Ohya b, Hiroaki Kumee
aDept. of Aeronautics and Astronautics, Kyushu University, 6-1 Kasuga-koen, Kasuga,JapanbResearch Institute for Applied Mechanics, Kyushu University, 6-1 Kasuga-koen,Kasuga,JapancKawasaki Heavy Industry, Kawasakimati 1 Kakamigahara, Japan
ABSTRACT: Unsteady 3-D direct numerical simulations based on FDM are carried out for flowfields around a wind turbine equipped with a flanged diffuser. Generally, it is difficult tosimulate numerically the flow around rotational bodies like rotors of wind turbines, because ofunsteadiness due to a moving body and complex geometry. Therefore, we have devised anactuator-disc model for a wind turbine for simulating the resistance and rotational forces onfluid. Introduced those volume forces derived from the actuator-disc model into the externalterms in N-S equations, the unsteady flow around a wind turbine can be simulated. The results ofnumerical simulations are compared with the wind tunnel tests and show a good agreement forthe velocity and pressure fields.
KEYWORDS: Wind Energy, Wind Turbine, Flanged Diffuser, Actuator Disc, Wind Tunnel Test,CFD
1 INTRODUCTIONThe power in wind is well known to be proportional to cubic power of the wind velocityapproaching the wind turbine. This means that even a small amount of acceleration gives a largeincrease in the energy output. Therefore, many research groups have tried to find a way toaccelerate the approaching wind effectively.
Recently, Ohya et al.1 ) have developed an effective wind-acceleration system. Although itadopts a diffuser-shaped structure surrounding a wind turbine like the others previouslyproposed, the feature that distinguishes it from the others is a large flange attached at the exit ofdiffuser shroud. Figure 1 illustrates an overview of the present wind-acceleration system. Aflange generates a large separation behind it, where a very low-pressure region appears to drawmore wind compared to a diffuser with no flange. Owing to this effect, the flow coming into thediffuser can be effectively concentrated and accelerated. In this system, the maximum velocity isobtained near the inlet of diffuser and thus a wind turbine is located there as shown in Figure 1.
(a) (b)Figure 1. Wind turbine equipped with a flanged diffuser shroud:(a) 500W prototype;(b) flow mechanism around aflanged diffuser. Five-fold increase in output power as compared to conventional wind turbines is achieved.
•\ 335•\
2 NUMERICAL SIMULATIONON AROUND A WIND TURBINE EQUIPPED WITH AFLANGED DIFFUSER SHROUD
2.1 Computational method
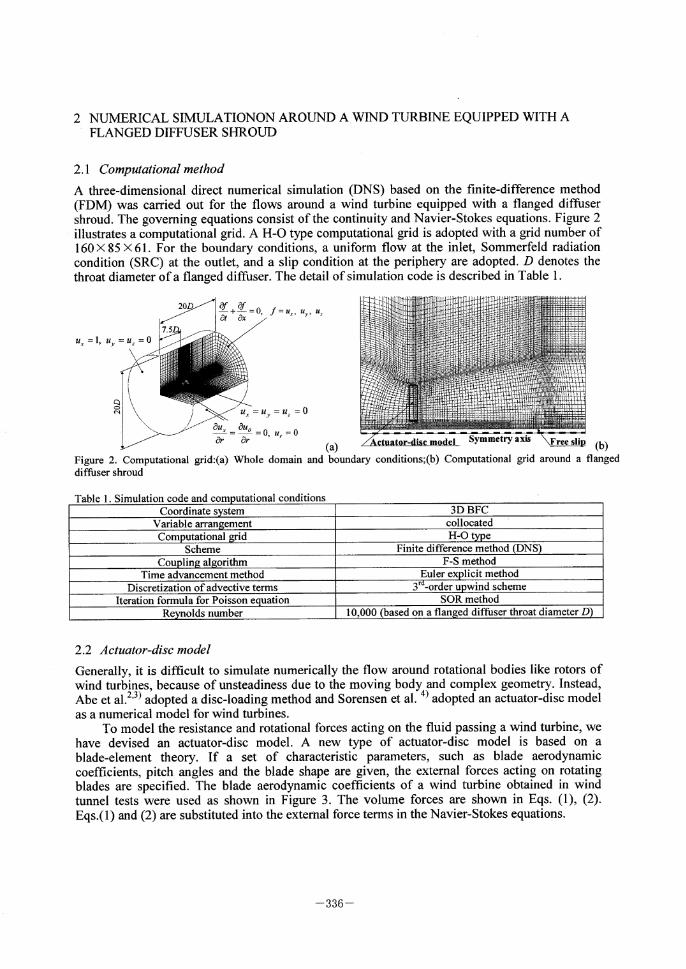
A three-dimensional direct numerical simulation (DNS) based on the finite-difference method(FDM) was carried out for the flows around a wind turbine equipped with a flanged diffusershroud. The governing equations consist of the continuity and Navier-Stokes equations. Figure 2illustrates a computational grid. A H-O type computational grid is adopted with a grid number of160 X 85 X 61. For the boundary conditions, a uniform flow at the inlet, Sommerfeld radiationcondition (SRC) at the outlet, and a slip condition at the periphery are adopted. D denotes thethroat diameter of a flanged diffuser. The detail of simulation code is described in Table 1.
(a) (b)Figure 2. Computational grid:(a) Whole domain and boundary conditions;(b) Computational grid around a flangeddiffuser shroud
Table 1. Simulation code and computational conditions
2.2 Actuator-disc model
Generally, it is difficult to simulate numerically the flow around rotational bodies like rotors ofwind turbines, because of unsteadiness due to the moving bodyand complex geometry. Instead,Abe et al.'3) adopted a disc-loading method and Sorensen et al.4) adopted an actuator-disc modelas a numerical model for wind turbines.
To model the resistance and rotational forces acting on the fluid passing a wind turbine, wehave devised an actuator-disc model. A new type of actuator-disc model is based on ablade-element theory. If a set of characteristic parameters, such as blade aerodynamiccoefficients, pitch angles and the blade shape are given, the external forces acting on rotatingblades are specified. The blade aerodynamic coefficients of a wind turbine obtained in windtunnel tests were used as shown in Figure 3. The volume forces are shown in Eqs. (1), (2).Eqs.(1) and (2) are substituted into the external force terms in the Navier-Stokes equations.
•\ 336•\

(1)
(2)
Here Z is the number of blades, c is the chord length, r is the position in the radius direction, ,o isthe density, and /3=tan-I(ux/(r co-u a)). In Eqs. (1) and (2), CL and CD are, respectively, the liftand drag coefficients for the relative angle of attack, a= g- y , where y is the pitch angle. Figure4 illustrates an overview of lift and drag acting on a blade element of a wind turbine.
Figure 3. Lift and drag coefficients of a blade Figure 4. Overview of lift and drag acting on a bladeelement of a wind turbine
2.3 Computational results
In Figures 5-6, time-averaged wind velocity and static pressure estimated by a numericalsimulation are compared with experimental results. A good agreement is seen between them.
To investigate the effect of actuator-disc model on the flow passing a diffuser shroud, theinstantaneous flow fields and the three-dimensional time-averaged streamlines without and witha wind turbine are compared in Figures 7-8.
As seen in the Figure 7(a) without a wind turbine, a massive separation is generated all overthe near-wall region inside the diffuser shroud. On the other hand, in the Figure 7(b) with a windturbine, the flow goes along the inside wall with no separation. A volume force, Eq. (1), means aresistance force on fluid, playing a rule of the control of a flow separation.
As seen in the Figure 8(a) without a wind turbine, the streamlines spread in anaxisymmetric plain. On the other hand, in the Figure 8(b) with a wind turbine , the streamlinesspread three-dimensionally after passing an actuator-disc model. The other volume force, Eq. (2),means a rotational force on fluid, leading to the generation of a fully three-dimensional flow.
Figure 5. Distribution of wind velocity and static pressure without a wind turbine along the streamwise line atr=-0.3D
•\ 337•\

Figure 6. Distribution of wind velocity and static pressure with a wind turbine along the streamwise line atr=0.3D
(a) (b)Figure 7. Instantaneous flow fields:(a) without a wind turbine;(b) with a wind turbine
(a) (b)Figure 8. Three-dimensional time-averaged streamlines:(a) without a wind turbine;(b) with a wind turbine
3 CONCLUSIONS
Numerical studies based on 3-D DNS were carried out for flow fields of a wind turbine equippedwith a flanged diffuser shroud. For a wind turbine, we have devised an actuator-disc modelwhich represents resistance and rotational forces on the approaching wind. The results obtainedare as follows:• The time-averaged wind velocity and static pressure inside a diffuser shroud show good
agreement between numerical simulations and wind tunnel tests.• A volume force representing a resistance force on fluid can control a flow separation inside a
diffuser shroud. The other volume force representing a rotational force on fluid can generate afully three-dimensional flow.
4 REFERENCES
1. Y. Ohya, T.Karasudani, A.Sakurai, M.Inoue, Development of a high-performance wind turbine equipped witha brimmed diffuser shroud, Trans. Japan Soc. Aeronaut. Space Sci. 49 (2006), in press.
2. K. Abe, Y. Ohya, An investigation of flow fields around flanged diffusers using CFD, J. Wind Eng . Indust.Aerodyn.92 (2004) pp.315-330.
3. K. Abe, M. Nishida, A. Sakurai, Y. Ohya, H. Kihara, E. Wada, K. Sato, Experimental and numericalinvestigations of flow fields behind a small wind turbine with a flanged diffuser, J. Wind Eng. Indust.Aerodyn.93 (2005) pp.951-970.
4. J.N. Sorensen, W.Z. Shen, Numerical Modeling of Wind Turbine Wakes, Trans. ASME, J. Fluids Eng.124(2002) pp.393-399
•\ 338•\

The Fourth International Symposium onComputational Wind Engineering(CWE2006), Yokohama, 2006
A Studyon Aerodynamic Analysis and Design ofWind Turbine blade
Jung-Hwan Kim a, Tae-Sik Kimb, Yeon-Won LeeC, Young-Duk Kimd
aDoctor, Korea Marine Equipment Research Institute, 1125-22, Dongsam-Dong, Youngdo-gu,Busan, Korea
b Graduate student, School of Mechanical Engineering, Pukyong National Univeesity'Professor, School of Mechanical Engineering, Pukyong National University, Busan, Korea,
d Professor, Civil & Environmental Division, Kivandong Univ. Kangwon -Do 215-802, Korea
ABSTRACT: A wind turbine blade is one of important parts in converting wind energy intoelectric energy. A blade has influence on the power output and efficiency of a wind turbine. Inthe design of a blade, the lift-to-drag ratio, material, manufacturing condition, and stable maxi-mum lift coefficient, etc should be considered. This study is to propose the blade element methodas the simplified method for the design of an aerodynamic blade and aerodynamic analysis. Thisprocess is programmed by Delphi language. Once the numerical values such as tip speed ratio,blade length, hub length, a section of shape, and maximum lift-to-drag ratio are input, the pro-gram displays chord length and twist angle, and analyzes performance of the blade.
KEYWORDS: Lift-to-drag ratio, Wind power generation, Blade element method, FlapHAWT(Horizontal Axis Wind Turbine),
1 INTRODUCTION
Recently, the interests of renewable energy are increasing because the unit price of generation ofelectric power is increasing and power supply is unstable. One of the most reliable renewableenergy is wind power energy. This is infinite energy resources and does not need additional cost,so that many researchers are researching now. There are many problems to generate electricpower using wind energy. For example, wind power needs higher unit price of generation thanother conventional generation methods.
To generate the electricity using wind energy, we use the rotating force which is generated bykinetic energy of wind. Therefore, the rotor is an important part of electric power production us-ing wind kinetic energy. Specially, an aerodynamic design of a rotor blade decides the efficiencyof an equipment for power production. Researches about the rotor blade have been studying allaround the world. Various types of airfoils have been presented in wind power production. Re-garding power generation, the characteristics of an airfoil should not to be changeable accordingto the contamination and damage on the surface of an airfoil. Generally, NACA 63618 is thepopular airfoil, because the lift to drag ratio of this type is excellent. The lift to drag ratio is ageneral index for characteristics of an airfoil. The type of NACA 6 is widely used in electricpower production of wind energy. In this study, the NACA 63618 is adopted for the rotor bladeand the effect of various flaps is tested as a high lift device.
The purpose of this study is to develop the program to design rotor blade using Delphi lan-guage and to design the turbine rotor blade using the blade element method.
•\ 339•\

2 AERODYNAMIC ANALYSIS AND OTIMIMAL DESIGN
2.1 Blade element method
A blade element method is a theoretical method to predict the aerodynamic efficiency of a windturbine blade. The aerodynamic efficiency can be calculated by integrating the results fromCFD(Computational Fluid Dynamics) and 2-Dimensional flow experiment. Figure 1 shows theblade element and velocity triangle, where the location is r, local pitch angel is 8 , and the angleof attack is a. Figure 2 shows the streamtube model of the flow through a HAWT rotor. Usingblade element method, the torque and thrust can calculated as follows.
(1)
where W is relative velocity, Cn and Ct are coefficients related with the lift and drag respective-ly, B is the number of blade, and C is the length of airfoil.
Fig. 1. Blade element and velocity triangle Fig. 2 Streamtube model of flowthrough the HAWT rotor
2.2 Aerodynamic analysis and design program
Figure 3 shows the flowchart of the aerodynamic analysis process for blade design. As men-tioned above, the design program consists of Delphi language according to this progress. The de-tails are included in references. In order to analyze accurately aerodynamic performance of ablade after stall, the information of stall condition is needed. In general, there are few data afterstall, we have to calculate the drag and lift coefficients after stall. In this paper, the equationwhich is proposed by Vitema -Corrigan has been used to calculate the drag and lift coefficientsafter stall.
This program is coded to bring the file of the drag and lift coefficients and to input freely thenumber of blades, length of a blade, length of a hub, and main velocity. Therefore, the power co-efficient can be calculated automatically using input data. Generally, a flap device has been usedto decrease the length of takeoff and landing, but in this study, a flap is used as the high lift de-vice that is devised to design a highly efficient blade. A flap is one of the high lift devices,which is located at the bottom of the trailing edge of a blade. If the size of a flap is larger than achord length, the lift to drag ratio become worse, because the amount of lift increase is smaller
•\ 340•\

than that of drag increase. So it is very important to determine the optimum height of a flap for
good design.
Fig. 3 Flowchart of airfoil design
3 RESULTS AND DISCUSSION
(a) Flap length 2% b)Flap length 10%
(c) Flap length 20% (d) Flap length 30%
Fig. 4 Effects of tip speed ratio and flap angle at various flap lengths
•\ 341•\

(Black : without flap, Red : angle 10•‹, Green : angle 20•‹, Blue : angle 30•‹)
In a three dimensional airfoil of an airplane, tip vortexes are generated due to the pressure differ-
ence between the upper and down sides and distribution of circulation surrounding an airfoil de-
creases. This is the main reason of the loss at a blade tip. A wind turbine also experiences the
same phenomena known as blade tip loss. In order to consider the loss at the tip, the theory of tip
loss which is suggested by Prandtl and Goldstein is applied. The power coefficients are calcu-
lated by the blade element method.
Figure 4 shows the relationship between the power coefficient and tip speed ratio according to
the change of flap angle and flap length. Though the flap expresses high power coefficient when
tip speed ratio is smaller than 5, power coefficient rapidly decrease when tip speed ratio is over
5. However, the flap of 2% length and 10•‹ angle shows high power coefficient at all tip ratios
considering now. It can be predicted that the flap of 2% length and 10•‹ angle is the optimized
shape. If the flap is set up at an optimized condition, the power coefficient is larger than no flap
blade.
4 CONCLUSIONS
In this study, the aerodynamic theory is applied to design the blade of a wind turbine. And using the blade element method, the performance analysis also is carried out for the blade with flap as a high lift device. Following conclusions are obtained.
(1) The blade with flap expresses high power coefficient when tip speed ratio is smaller than 5, comparing with the blade with no flap.
(2) Though the power coefficient rapidly decrease when tip speed ratio is over 5, the flap of
2% length and 10•‹ angle shows high power coefficient at all tip ratios.
(3) The Mechanism between optimum flap and flow pattern should be studied further .
5 ACKNOWLEDGEMENT
This Paper was supported by the RIC(R) in 2006.
6 REFERENCES
1. B. S. Kim, J. H. Kim, K. Kikuyama, R. Rooij, Y. H. Lee, "3-D Numerical Predictions of Horizontal Axis Wind
Turbine Power Characteristics for the Scaled DV University T40/500 Model", The 5th JSME-KSME Fluids
Eng. Conf., pp. 323, 2002.
2. Y. H. Lee, J. H. Kim, B. S. Kim, Y. T. Kim, C. D. Nam, "A Study on the Optimum Design of Turbine Blade
with Flap for Wind Power Generation", International Conference on Marine Engineering, BEXCO, Busan, Ko-
rea, pp. 389•`393, 2001.
3. D. A. Spera, Wind Turbine Technology ASME Press, 1994.
4 V. D. Hunt, Wind power, Van Nostrand Reinhold Company, 1981.
•\ 342•\

5. K. Y. Maalawi, "Direct Method for Evaluating Performance of Horizontal Axis Wind Turbines", Renewable and Sustainable Energy Reviews, Vol. 5, pp. 175 190, 2001.
6. Vitema, L. A. and Corrigan, R. D., "Fixed Pitch Rotor Performance of Large Horizontal Axis Wind Turbines, Cleveland, Ohio, Inc., 1966.
•\ 343•\

The Fourth International Symposium on
Computational Wind Engineering(CWE2006), Yokohama, 2005
Analysis of response of wind turbine under wind load
Luong Van Binh1),Pham Van Phuc 2), Takeshi Ishihara2), Yozo Fujino3)
1),3) Department of Civil Engineering, The University of Tokyo, Japan 2) Institute of Eng., Innovation School of Eng., The University of Tokyo„ Japan 1) binh@ bridge . t. u-tokyo.ac. jp
ABSTRACT
The nonlinearity in the wind loading expression can result in a non-Gaussian response. This
paper focuses on the method to evaluate the peak factor of the non-Gaussian response of wind turbine under wind load. Firstly, the moment based Herrnite transformation method is used to express a standard non-Gaussian process in terms of a standard Gaussian process and its mo-ments. Secondly, the problem of evaluating the peak factor is simplified to the problem of evalu-ating the third order moment or the skewness of the response distribution . Thirdly, by consider-ing the ideal case with no resonance and the relation between skewness and the resonance-background ratio Rd , the formula for skewness is proposed. Finally, wind response simulation for wind turbine model is carried out to confirm the formula's accuracy.
INTRODUCTION
Wind load on structures are usually calculated by quasi static method which uses a coefficient called the peak factor. The peak factor accounts for the ratio of maximum fluctuating wind load and the standard deviation of wind load. An expression of peak factor for a Gaussian process has been proposed by Davenport. However the Gaussianity assumption which is apliabe only when the nonlinear component in wind load is neglectable may lead to an underestimation of peak fac-tor and of extreme load (Kareem et al.). As more wind turbine are being errected in area with complicated terrain where wind turbulence intensity is high, the effect of nonlinear component is unneglectable. It is therefore necessary to evaluate the peak factor of the response of wind tur-bine under wind load without Gaussianity assumption.
The evaluation method for peak factor has been discussed by Ishikawa who proposed a method to calculate the peak factor considering spatial correlation using the moment based Her-mite transformation method and the definition of peak factor proposed by Nishijima et al. How-ever, this method is limited to structures with neglectable resonant response. But in the case of wind turbine , because of its low structural damping ratio, the effect of the resonance part is significant. This paper proposes a method to calculate the peak factor of the response of wind turbine un-
der wind load which consider both the spatial correlation of wind speed and the resonant compo-nent of the response.
WIND LOAD ON WIND TURBINE
In this study the model in fig.1 is used. In this model the first mode of tower is considered and the rotor is assumed to be rigid.
1) Under Graduate Student and Graduate Student 2) Associate Professor 3) Professor
•\ 345•\

Fig.1 Wind turbine model
The maximum bending moment is calculated as following
(1)
where M is the mean bending moment which is decided by the mean component of wind speed, G is the gust factor which accounts for the load caused by the fluctuating component of wind speed, g is the peak factor and a M is the standard deviation of the load distribution. The mean bending moment and standard deviation are calculated as follow.
(2)
(3)
where 1/2pCf(r)u2 is the familiar expression of wind pressure , I u is the turbulent intensity , c(r)
is the characteristic size of the element at position r, a Ml and a MB are resonant component and
background component of wind load respectively.
THE PEAK FACTOR
In this study the peak factor is defined as the "value that a zero mean standard process up-cross once on average in a certain time T." Applying this definition into the moment based Her-mite transformation method, Ishikawa (2004) has proposed the following expression for peak factor.
(4)
where
•\ 346•\

ƒ¿ 3 and ƒ¿ 4 are third and forth order moments of the wind load. ƒË y' is the zero uperossing number in
time interval T of the non-Gaussian process Y which depends on h3, h4 and the zero uperossing number in
time interval T of a Gaussian process which is usually written in codes.
In this study, the effect of the high order part a 4 and h4 are neglected since a 4 is assumed to be
equal to 3. The assumption gives us a simple expression of peak factor as following
(5)
CALCULATING THE SKEWNESS
The problem of calculating peak factor g now becomes the problem of calculating skewness
a 3 of the response. Using the method proposed by Ishikawa the following expression for a 3 is
derived for the case without resonance.
(6)
where ar1 and are are integral considering spatial correlation taken on all the wind turbine area. The formula of K'SMB , ar1 and ar2 can be found in Ishikawa 3)
As discussed above, in the case of wind turbine the effect of resonance must be taken into ac-count so in (10) the right hand part should be multipled with a factor considering the resonant component. In this study the resonance-background ratio Rd of the standard deviation is intro-duced. Since lu3 is neglectable comparing to Iu , K'SMB is neglectable comparing to KSMB the ex-pression of a 3 is simplified to
(7)
In this study, the beam element model and FEM code developed by P.V. Phuc is used to ana-lyze the response of a wind turbine model with different structural dampings. The result in fig. 2 shows that skewness and turbulent intensity has a linear relationship which confirms the correct-ness of formula (7). From fig. 2 it is noticed that skewness increases when damping ratio in-creases. And since the damping ratio of wind turbine varies in a narrow range from 0.005 to 0.01 this relation can be assumed linear. From this relation and the definition of Rd, f(Rd) is supposed to be proportional to Rd-2 . It is also noted that f(Rd) should become 1 where there is no reso-nance. Therefore the following form of f(Rd) is proposed and from the simulation results in fig.3 the safe line for different Rd of the coefficient a =1.3 is proposed.
(8)
EXAMPLE
The proposed formula is used to calculate wind load on several wind turbine models of differ-ent size. Fig.4 and fig.5 are examples of how these results show good agreement with FEM simulation.
•\ 347•\
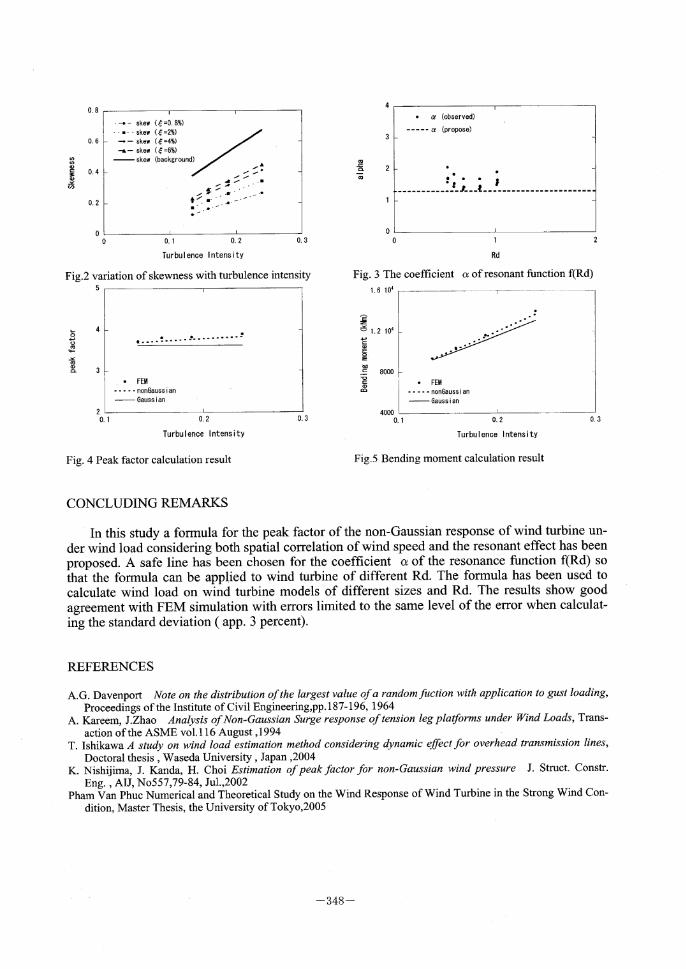
Fig.2 variation of skewness with turbulence intensity Fig. 3 The coefficient a of resonant function f(Rd)
Fig. 4 Peak factor calculation result Fig.5 Bending moment calculation result
CONCLUDING REMARKS
In this study a formula for the peak factor of the non-Gaussian response of wind turbine un-der wind load considering both spatial correlation of wind speed and the resonant effect has been proposed. A safe line has been chosen for the coefficient a of the resonance function f(Rd) so that the formula can be applied to wind turbine of different Rd. The formula has been used to calculate wind load on wind turbine models of different sizes and Rd. The results show good agreement with FEM simulation with errors limited to the same level of the error when calculat-ing the standard deviation ( app. 3 percent).
REFERENCES
A.G. Davenport Note on the distribution of the largest value of a random fuction with application to gust loading, Proceedings of the Institute of Civil Engineering,pp.187.196, 1964
A. Kareem, J.Zhao Analysis of Non-Gaussian Surge response of tension leg platforms under Wind Loads, Trans- action of the ASME vol.116 August ,1994
T. Ishikawa A study on wind load estimation method considering dynamic effect for overhead transmission lines, Doctoral thesis , Waseda University , Japan ,2004
K. Nishijima, J. Kanda, H. Choi Estimation of peak factor for non-Gaussian wind pressure J. Struct. Constr. Eng. , AIJ, No557,79-84, Jul.,2002
Pham Van Phuc Numerical and Theoretical Study on the Wind Response of Wind Turbine in the StrongWind Con-dition, Master Thesis, the University of Tokyo,2005
•\ 348•\