the franz edelman award achievement in operations...
TRANSCRIPT
Vol. 40, No. 1, January–February 2010, pp. 71–84issn 0092-2102 �eissn 1526-551X �10 �4001 �0071
informs ®
doi 10.1287/inte.1090.0472©2010 INFORMS
THE FRANZ EDELMAN AWARDAchievement in Operations Research
Zara Uses Operations Research to Reengineer ItsGlobal Distribution Process
Felipe CaroUCLA Anderson School of Management, University of California, Los Angeles, Los Angeles, California 90095,
Jérémie GallienMIT Sloan School of Management, Massachusetts Institute of Technology, Cambridge, Massachusetts 02142,
Miguel Díaz, Javier García, José Manuel Corredoira, Marcos MontesZara, 15142 Arteixo, La Coruña, Spain {[email protected], [email protected], [email protected], [email protected]}
José Antonio RamosCarrefour, 28028 Madrid, Spain, [email protected]
Juan CorreaDell Computers, Austin, Texas 78759, [email protected]
Overcoming significant technical and human difficulties, Zara recently deployed a new process that relies exten-sively on sophisticated operations research models to determine each inventory shipment it sends from its twocentral warehouses to its 1,500 stores worldwide. By taking a retail size-assortment view of a store’s inven-tory, the model incorporates the link between stock levels and demand to select store replenishment quanti-ties. Through a rigorous, controlled field experiment, we estimate that this new process has increased sales by3–4 percent; this corresponds to estimated profits of approximately $233 million and $353 million in additionalrevenues for 2007 and 2008, respectively.
Key words : retailing; fast fashion; inventory management; field experiment; sizes distribution.
Introduction
With more than 1,500 stores in 68 countries andE6.26 billion in 2007 annual sales, Zara is one
of the world’s leading fashion retailers and the flag-ship chain of the Inditex Group. Because of its impres-sive growth in recent years, Zara has also becomeone of the most recognized apparel brands worldwide(Helm 2008). This success is widely attributed to itsfast-fashion business model, which involves frequentin-season assortment changes and ever-trendy items
offered in appealing store environments and at com-petitive prices.To support this customer-value proposition, Zara
has developed an innovative and highly respon-sive design, production, and distribution infrastruc-ture that many press articles and case studies (e.g.,Fraiman et al. 2002, Ghemawat and Nueno 2003) havedescribed. In particular, Zara’s supply chain involvestwo primary warehouses in Spain that periodicallyreceive shipments of finished clothes from suppli-ers and ship merchandise directly to each Zara store
71
Caro et al.: Zara Uses Operations Research to Reengineer Its Global Distribution Process72 Interfaces 40(1), pp. 71–84, © 2010 INFORMS
worldwide twice a week (at the time of this writ-ing, Zara had opened two additional warehouses inMadrid and León, Spain). This paper discusses thedevelopment, implementation, and impact of a newOR-based process; since 2006, Zara has used it daily todetermine these shipment quantities, i.e., the “blood-stream” to its only sales channel. It constitutes aless technical and more practice-oriented companionpaper to Caro and Gallien (2009).Our work began in mid-2005 from a contact that
Caro (University of California, Los Angeles) estab-lished with Ramos (then working at Zara). It soonevolved into a collaboration of researchers Caro andGallien (Massachusetts Institute of Technology, MIT)with Zara employees Ramos, García, and Montesunder the executive supervision and sponsorship ofZara’s CFO, Miguel Díaz. Inditex senior informa-tion technology (IT) engineer Corredoira had over-all responsibility for the system implementation; theproject also leveraged the six-month internship of(then) MIT graduate student Correa hosted by Indi-tex, which initiated a corporate partnership withMIT’s Leaders for Manufacturing (LFM) Program(Correa 2007).In this paper, we discuss the managerial problem
we addressed, the solution we developed, and theimpact of our work, and we end with a summaryof our contributions to OR practice and some con-cluding remarks. We emphasize that the authors per-formed all the financial impact estimates discussed inthis paper. They did not engage the responsibility ofthe Inditex Group, which advises that any forward-looking statement is subject to risk and uncertaintyand could thus differ from actual results.
The Problem
Managerial ChallengeZara’s innovative business model is powered by acontinuous cycle that involves flows from stores todesigners (market information and customer desires),designers to suppliers (production orders for newdesigns), suppliers to warehouses (deliveries of fin-ished clothes), and warehouses to stores (outboundmerchandise shipments). This last link is particularlycritical; it constitutes the bloodstream of Zara’s mer-chandise to its unique sales channel and directlyaffects Zara’s global revenues.
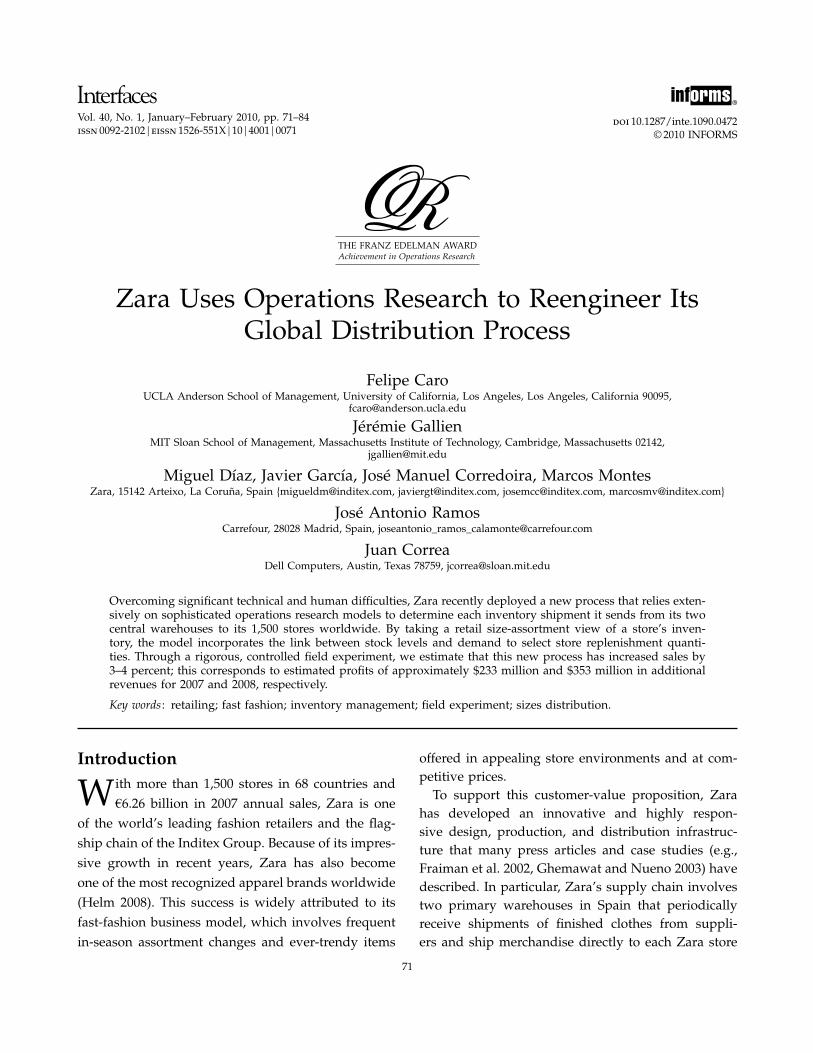
S M L Keep on display
S M L Keep on display
M L Keep on display
S M Keep on display
M Keep on display
S L Move to backroom
S Move to backroom
L Move to backroom
ActionRemaining
sizes
Figure 1: For an article offered in three sizes with M (medium) as the onlymajor size, any combination without size M is moved to the backroom.
To distribute merchandise to its stores, Zara usesa supply chain that consists of two primary ware-houses in Spain. They periodically receive shipmentsof finished clothes from suppliers and ship replenish-ment inventory directly to each Zara store worldwidetwice a week. The key associated control challenge isto determine the exact number of units of each size(up to eight) of each article (up to 3,000 at any time)that should be included in each shipment to each ofits more than 1,500 stores. This control problem is par-ticularly challenging for the following reasons:• As Figure 1 illustrates, most stores only display
merchandise for sale when the set of available sizesis complete enough. Their intention is to achievea balance between keeping inventory displayed togenerate sales and mitigating the impact of missingsizes on brand perception; this is driven by the neg-ative feeling that customers experience when theyhave identified a specific article they would like tobuy, perhaps after spending much time searching acrowded store only to learn that their size is not avail-able. More specifically, store managers tend to differ-entiate between major sizes (e.g., S, M, L) and minorsizes (e.g., XXS, XXL) when managing in-store inven-tory. When a store runs out of a major size for aspecific article, store associates move all remaininginventory of that article from the display area to thebackroom and replace it with a new article, effectivelyremoving the incomplete article from customer sight.In contrast, they take no such action when the store
Caro et al.: Zara Uses Operations Research to Reengineer Its Global Distribution ProcessInterfaces 40(1), pp. 71–84, © 2010 INFORMS 73
runs out of a minor size. They might return a previ-ously removed article back to the floor if the missingsizes can be shipped again from the warehouse; other-wise, it is either transferred to another store where thesizes are consolidated or it remains in the backroomuntil the store has a clearance sale. Note that this storeinventory display policy introduces significant ship-ment interdependencies across sizes; it may be point-less to ship some units of a given size (e.g., XS) if itis not accompanied by enough units of a major size(e.g., M) to trigger display. It is worth noting that theremoval rule described above is not prescribed by anyformal policy imposed upon store managers; it con-stitutes an observation of common store behavior thatwe validated empirically (Caro and Gallien 2009).• These shipment decisions must be determined in
only a few hours after the relevant information (e.g.,current store inventory, previous-day sales history)becomes available. Any further delay, in light of ware-house processing times and transportation schedules,would effectively delay the replenishment of stores byone full day (this replenishment response time is par-ticularly important to Zara’s business model, whichexplains why direct shipments to all stores are sentby truck and air every week).• The number of associated shipment decisions
reaches several million each week.
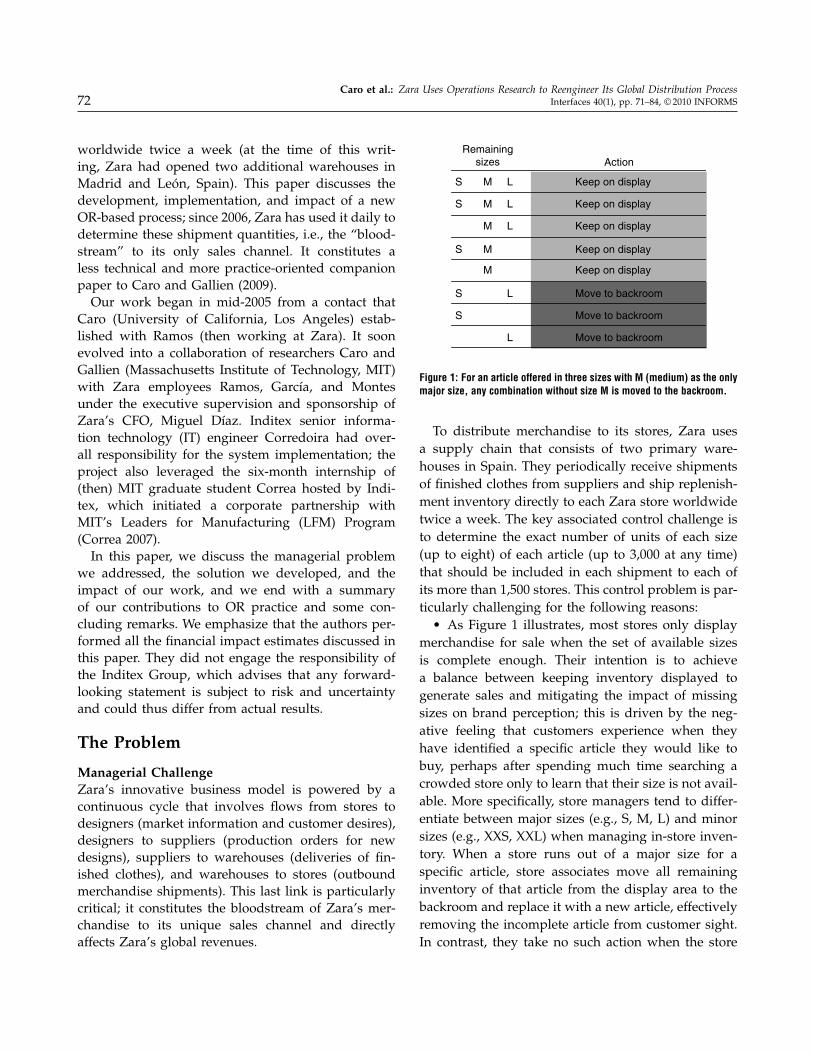
Past sales data
Storemanagers
Requested shipment quantitiesfor each article and size
Warehouseallocation team
Shipments
Inventoryin stores,past sales
Warehouseinventory
Store inventory Past sales dataRequested shipment quantitiesfor each article and size
Demandforecasts
Optimizationmodel
Shipments
Inventoryin stores
Warehouseinventory
Forecastingmodel
Assortment decisions
(a) Legacy process (b) New process
Assortment decisions
Figure 2: In contrast with the legacy process, the new process relies on formal forecasting and optimizationmodels to determine weekly shipments to stores (Caro and Gallien 2009).
• The amount of relevant data (warehouse inven-tory, store inventory, and store sales history for eacharticle) is enormous.• The available warehouse inventory is often
limited. This follows from Zara’s business model,whereby the store life cycle of articles typically spansonly a small fraction of a selling season (i.e., five tosix weeks), so that the store assortment turns overmuch more frequently than the assortment of moretraditional retailers does.
Legacy ProcessUntil 2006, Zara exclusively used the legacy pro-cess, as Figure 2(a) shows, to generate all its store-replenishment shipment decisions worldwide. Aspart of that process, store managers received weeklystatements showing the subset of articles available inthe central warehouse for which they could requestshipments to their stores. Note that these weeklystatements (dubbed “the offer”) would thus effec-tively implement any high-level assortment decisionsmade by Zara’s headquarters for each store. How-ever, a statement would not mention the total quan-tity of inventory available in the warehouse foreach article listed. After considering the inventoryremaining in their respective stores, store managersthen transmitted back requested shipment quantities

Caro et al.: Zara Uses Operations Research to Reengineer Its Global Distribution Process74 Interfaces 40(1), pp. 71–84, © 2010 INFORMS
(possibly zero) for each size of each article. A teamof employees at the warehouse then aggregated andreconciled the requests from all store managers bymodifying (typically lowering) these requested ship-ment quantities so that the overall quantity shippedfor each article and size was feasible in light of theremaining warehouse inventory.For many years, the legacy process seems to have
effectively supported the relatively small distributionnetwork for which it had been designed originally.A key motivation for our project was Zara’s real-ization in 2005 that the recent growth of its net-work to more than 1,000 stores might justify address-ing several related improvement opportunities andultimately designing a more scalable process. Oneissue centered on the incentives of store managers,whose compensation and career promotion prospectsare driven significantly by the total sales achievedin their stores. We believe that this caused storemanagers to frequently request quantities exceedingtheir true needs, particularly when they suspectedthat the warehouse might not hold enough inventoryof a top-selling article to satisfy all stores. In addi-tion, store managers are responsible for many tasksbeyond determining shipment quantities, includingbuilding, sustaining, and managing teams of sev-eral dozen sales associates in environments withhigh employee turnover; thus, they are subject tosignificant time pressures that compete with theirinvolvement in determining merchandise replenish-ment requests. Finally, we also believe that the verylarge amount of data for which the warehouse allo-cation team was responsible for reviewing (i.e., ship-ments of several hundred articles offered in severalsizes to more than 1,000 stores) created significanttime pressures and made it challenging to balanceinventory allocations manually across stores and arti-cles in a way that would globally maximize sales.
The SolutionFigure 2(b) illustrates the structure of the new pro-cess we developed to help Zara compute its weeklystore shipments. At a high level, it consists of usingthe shipment requests from store managers and pasthistorical sales to build demand forecasts. It then usesthe following as inputs to an optimization model:
(1) these forecasts, (2) the inventory of each articleand size remaining both in the warehouse and eachstore, and (3) the assortment decisions. The modelhas shipment quantities as its main decision variablesand the maximization of global sales as its objective.In the sections below, we provide more details onour analytical work, the IT implementation, and theimplementation and project management that werenecessary to deploy this new process at Zara.
Analytical DevelopmentAs Figure 2(b) illustrates, the analytical developmentof the new process comprised two key steps: the fore-casting model and the optimization model.The forecasting model generates a prediction of the
upcoming weekly demand for each size of each articlein each store in Zara’s network and essentially relieson the standard methodology of regression analysis.We refer the reader to Correa (2007) for further techni-cal details and a complete definition. The most note-worthy feature of the implemented forecasting modelmay be its high-level structural form as a weightedlinear combination of two primary sources of inputdata: (1) the objective and centralized time-series dataof historical sales for the article, and (2) the subjec-tive and decentralized shipment request by the storemanager, converted into a sales prediction by consid-ering store inventory and existing guidelines abouttarget sales coverage. The weight conferred to thesecond input source by the least-square fitting pro-cedure may thus be interpreted as a credibility mea-sure (for forecasting purposes) of the store manager’sinput. Although the intuitive appeal of this interpreta-tion helped Zara to communicate internally about theforecasting model, this ultimate functional form wasonly identified through extensive empirical testing ofmany possible predictive equations. In addition, ourteam viewed the forecasting model as a modular com-ponent of the process, in the sense that it can andshould be improved relatively independently fromthe distribution optimization model that we discussnext. In particular, in addition to continuing to experi-ment with other functional forms and additional fore-casting data sources (e.g., weather), Zara might intime consider introducing formal incentives for storemanagers to provide accurate forecasts, adding to itsmore traditional sales-related incentives.
Caro et al.: Zara Uses Operations Research to Reengineer Its Global Distribution ProcessInterfaces 40(1), pp. 71–84, © 2010 INFORMS 75
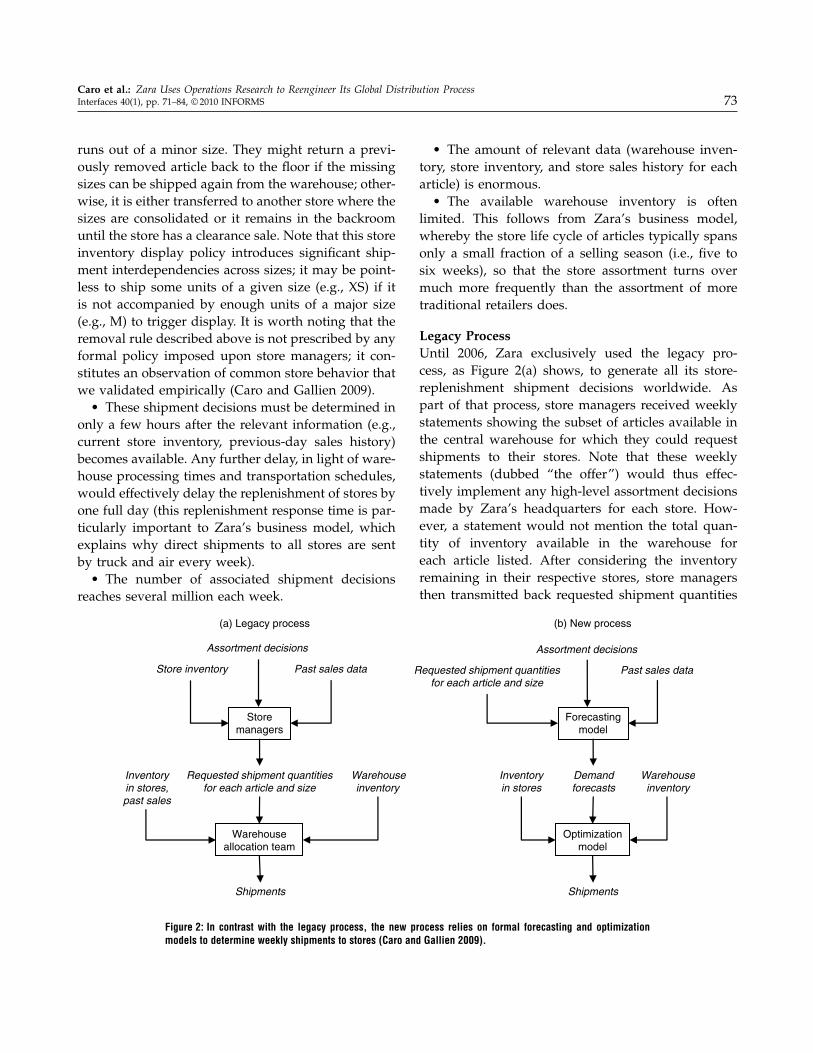
Stock of article instore at beginningof week (all sizes)
Expected weeklystore sales for
an article (all sizes)
Saturation effect
Exposureeffect
Expecteddemand
(forecast)
Figure 3: The inventory-to-sales function associated with each store cap-tures both exposure and saturation effects.
The first step of our optimization-model develop-ment centered on constructing a predictive model forthe expected upcoming weekly sales of all sizes ofa given article in a given store, as a function of therelevant demand forecasts and the starting level ofinventory in that store at the beginning of that week.We quickly started referring to this predictive modelas the inventory-to-sales function; our motivation forthis work was to ultimately support an optimizationmodel allowing Zara to predict the impact of ship-ment decisions (affecting the inventory available atthe beginning of each weekly replenishment periodin each store) on global expected network sales. Froma mathematical standpoint, this model resulted fromthe analysis of a stochastic model that considers thesales opportunities of different sizes of an articleas independent Poisson processes. Caro and Gallien(2009) provide additional technical details; however,in this paper, we focus on the qualitative and man-agerial implications of this function (Figure 3).A first feature of this inventory-to-sales function is
that it considers the entire profile of inventory avail-able across all sizes at the beginning of the week.In that sense, the representation in Figure 3, whichsuggests a one-dimensional, continuous-input vari-able (the sum of inventory across all sizes), is asimplification for exposition purposes of the actualunderlying model (whose input is discrete and multi-dimensional). This function therefore jointly consid-ers all sizes simultaneously (as opposed to each sizeindependently); this is motivated by the inventory
display policies discussed previously in the Manage-rial Challenge section and illustrated in Figure 1, andconstitutes an important feature of our model: if themodel considered different sizes independently, noth-ing would prevent it from determining that Zarashould ship some units of a given size (e.g., XS) toa store that would not even display them for saleduring the following week (let alone generate thesales predicted by the model), because the remain-ing inventory of a major size (e.g., M) of the articleis not sufficient to trigger display at that store. Inother words, the inventory-to-sales function we haveconstructed captures the dependencies across sizesthat are introduced by Zara’s policy of only display-ing for sale the articles with a complete size pro-file. When considering the aggregate effect across allsizes of an article, this gives rise to the exposure effect(Figure 3), whereby the model will (correctly) predictthat no sales will occur in a particular store if thatstore has insufficient available inventory (i.e., doesnot include enough different sizes). Incidentally, otherfirms that do not employ similar size-based displaypolicies might also observe the same effect because ofthe self-advertising function of inventory in the store’ssales display area (Smith and Achabal 1998). This fea-ture is critical from an inventory distribution stand-point, because when all sales predictions for differentstores are considered together, the exposure effect willpush the optimization model to ship to those storesthat can complete a full set of sizes (instead of scat-tering some limited inventory over the entire storenetwork, which could leave many stores below theexposure threshold).The second critical feature of the inventory-to-sales
function is the saturation effect, which reflects thedecrease of the marginal probability of sale as thestore receives additional inventory units beyond a cer-tain point (as highlighted in the upper right area ofFigure 3). This is a much more classical feature forinventory distribution models (Zipkin 2000) that tendto balance the resulting shipments of merchandiseacross stores, so that each additional unit of availableinventory is sent on the margin to the store at whichit has the highest probability of selling. When consid-ered jointly, the exposure and saturation effects enablethe model to select stores that it will bring above the

Caro et al.: Zara Uses Operations Research to Reengineer Its Global Distribution Process76 Interfaces 40(1), pp. 71–84, © 2010 INFORMS
Maximize P ∗NetworkStoreSales+ K ∗FinalWarehouseStock
Subject to Shipments≤ InitialWarehouseStockNetworkStoreSales
= Inv-to-Sales (StoreInventory + Shipments)FinalWarehouseStock = InitialWarehouseStock−Shipments
Figure 4: Our single-period MIP model formulation involves a trade-offbetween sales from the current week and the value of inventory remainingin the warehouse.
exposure threshold, and properly balance inventorybetween them.The last step of our model development work was
to formulate a mixed-integer program (MIP) embed-ding piecewise-linear approximations of many inde-pendent inventory-to-sales functions, each associatedwith a store in the network, and allowing the compu-tation of shipment quantities that maximize network-wide expected sales, subject to inventory availabilityconstraints. The piecewise-linear approximations pre-serve the essential features of the inventory-to-salesfunction discussed above and make the model solv-able with commercial MIP software. This modeljointly computes shipment decisions of all sizes ofa given article to all stores worldwide in any givenweek; however, for feasibility reasons, it ignores anydependencies between shipment decisions of differentarticles (i.e., Zara solves an instance of this optimiza-tion model for each article each week).Figure 4 shows a high-level representation of the
single-period MIP formulation, where Inv-to-Salesdenotes the inventory-to-sales function describedabove; we refer the reader to the appendix and Caroand Gallien (2009) for technical details. One of themost original aspects of this formulation is arguablythe use of a control parameter that we called theaggressiveness factor (denoted as K in Figure 4). Ineffect, this control is motivated by the fact that themodel otherwise ignores the important issues of fore-cast uncertainty, the time horizon, and the opportu-nity cost of storage space at the warehouse. Becausedeveloping an optimization model that explicitly cap-tures these issues presented significant analytical anddata availability challenges, we enabled the user toaffect the optimization-model outcome according to aprocedure that requires some subjective input but isspecifically designed to consider these issues. Specif-ically, our model’s objective includes a standard first
term that captures expected revenues for the articleconsidered over the next week and replenishmentcycle (denoted as P ∗ NetworkStoreSales in Figure 4),and a second special term equal to the total inputtedvalue for any inventory remaining in the ware-house after the shipments considered (denoted as K ∗FinalWarehouseStock in Figure 4). Although revenuesin the first term are calculated from the known actualunit selling price P (assumed here to be constantacross stores for expositional simplicity), remainingwarehouse units are valued in the second term withthe aggressiveness factor K, which the user providesand we can thus interpret as the unit value of arti-cles left in the warehouse. A high value of K relativeto the store selling price P results in “conservative”shipments, possibly appropriate shortly after a prod-uct introduction (when forecast uncertainty is high) orwhen the returns and transshipment costs associatedwith excessive inventory sent to low-selling storesmight be particularly high. In contrast, a low relativevalue of K results in “aggressive” shipments, perhapssuitable when forecasts are deemed more reliable and(or) toward the end of the planned shelf life of anarticle, a time when freeing up some space in thewarehouse for other articles is desirable.
IT ImplementationThe IT implementation of the OR models describedabove was relatively challenging, in that it requiredestablishing dynamic access to several large, livedatabases (store inventory, sales, and warehouseinventory) to compute, under very stringent time con-straints, many decisions that are critical to the com-pany’s operation; in any typical week, Zara nowsolves approximately 15,000 instances of our large-scale MIP model to distribute six million units of stockvalued at more than E120 million.Coauthors Correa and Corredoira developed the
core computational application using AMPL andILOG CPLEX. It involves database queries into Indi-tex’s legacy IBM AS/400 system, which feeds aspecific database (SQL Server). From a hardwarestandpoint, this application is currently executed ontwo dedicated Dell servers (CPU 3.20 GHz, RAM4 GB, HD 80 GB, OS Windows 2003 Server) located inZara’s IT headquarters in La Coruña, Spain; each han-dles computations for about half of Zara’s stores. The

Caro et al.: Zara Uses Operations Research to Reengineer Its Global Distribution ProcessInterfaces 40(1), pp. 71–84, © 2010 INFORMS 77
Figure 5: Warehouse allocation employees use a new client application to run the optimization engine, performwhat-if scenario analyses, and visualize and modify the recommended shipments.
implementation also required the in-house develop-ment of a client application, which we distributed onthe PCs of the warehouse allocation team’s approx-imately 60 employees. This second application wasdeveloped using Visual FoxPro and provides an inter-face that allows these employees to request additionalruns of the core computational application to performwhat-if scenario analyses, visualize, and manuallymodify any output of the optimization model, andcommunicate their chosen solutions to the existingwarehouse control systems; thus, they are effectivelyimplementing the physical picking, sorting, packing,and truck-loading operations corresponding to theshipments determined by the warehouse allocationteam using the decision support system. Figure 5shows a screen snapshot of this client application.Finally, the data-communications infrastructure thatsupports these applications relies, to date, on Inditex’s
virtual private network (VPN); however, a more effi-cient node-based infrastructure is being deployed.
Implementation and Project ManagementIn 2005, when the first project-related discussionsstarted, implementing OR models on a large scale atZara to support core business decisions, which wouldaffect the entire company’s success, seemed like adaunting task. Zara is a fashion company with a cul-ture that strongly favors human intuition, vision, andjudgment (as opposed to analytical methods) for deci-sion making. It has a history of success in showingthat these subjective or nonquantitative approachescan pay off when applied to many of the key decisionsit faces (e.g., design of clothes). OR awareness withinZara essentially did not exist when the authors startedcollaborating on this project. Bringing Zara to its cur-rent state, in which many employees and some keyexecutives trust OR methods to determine key opera-tional decisions, required a substantial investment in

Caro et al.: Zara Uses Operations Research to Reengineer Its Global Distribution Process78 Interfaces 40(1), pp. 71–84, © 2010 INFORMS
communication and education by all the authors, andcareful thinking about the design and management ofthis implementation project.In particular, we believe that some design choices
were critical to our success in this environment. Onewas the role of the warehouse allocation team in thenew process. We clearly established and communi-cated very early on that the forecasting and optimiza-tion models were not meant to replace that team, butrather to assist its members in performing their tasksmore effectively. This orientation induced severaltechnical choices, such as developing the distributedclient application to allow the warehouse employ-ees to perform what-if analysis scenarios defined, forexample, by the aggressiveness factor K discussedin the Analytical Development section, and to manu-ally and freely modify all the individual shipmentscomputed by the optimization model before theirphysical execution. The academic project team mem-bers were initially uncomfortable with this last fea-ture, because of methodological concerns linked tomeasuring impact for the optimization model output.However, we realized that this choice was essentialto secure the warehouse allocation team’s involve-ment and to allow us to benefit from the team’s con-siderable knowledge of the managerial challenge atstake; this knowledge proved invaluable to us as weformulated the optimization model. In addition, werecognize now that these concerns were unfounded;after a live trial and debugging period of a fewweeks, the warehouse allocation team members rarely(if ever) modified the optimization model’s outputdirectly (as opposed to changing the model’s inputand control parameters). In other words, allowingthem to have total flexibility and control over the out-put was essential to develop their internal confidencein the model, although they ultimately rarely usedthis feature.From an implementation standpoint, a second
important process feature was our choice to leavethe information interface with stores as it was in thelegacy process. That is, the store manager input thatthe forecasting model required in the new processwas the requested shipment quantities that the man-agers were already providing as part of the legacyprocess (the Legacy Process and Analytical Develop-ment sections provide background information and a
description of how the forecasting model uses thisinformation). Although directly requesting demandforecasts from store managers might improve overallforecast accuracy in the long run, the practical difficul-ties and resource requirements associated with man-aging such a significant operational change, whichwould affect a global network of more than 1,500stores, prompted the team not to undertake this effortwithin the targeted project timeline. We note, how-ever, that Zara might still leverage this opportunity toimprove the new process in the future and that moregeneral forecasting-procedure improvements can beperformed in a modular way without affecting theoptimization model’s structure.We believe that several aspects of managing this
project were material success factors. The first wasthe project team’s organizational structure. Specifi-cally, our work began with collaboration between aca-demic researchers (Caro and Gallien) and industrypractitioners (Ramos, García, and Montes). Althoughsuch collaborations generally have the potential to bepowerful and mutually enriching, they also presentintrinsic challenges because of possible differencesin objectives, incentives, and time horizons. In ourcase, we observed that the jointly supervised six-month internship at Zara of (then) graduate studentCorrea, who was enrolled in MIT’s LFM program,provided an effective coordination mechanism andliaison between the two parts of the team. It alsoserved as a catalyst for the model development workperformed in preparation for that internship, whichwas to focus on implementing these models.Another important catalyst was the live pilot exper-
iment of the new process, which the entire teamplanned as a critical project requirement and wasdesigned with three goals: (1) provide a convinc-ing proof of feasibility for the new OR-based pro-cess, (2) help identify and act upon improvementopportunities for the new process before its full-scaledeployment, and (3) support a quantitative impactassessment. Partly because the live pilot would affectthe shipments of real merchandise to several hundredstores and would also involve a friendly competitionwith the legacy process (the Impact section providesdetails), it helped greatly to define priorities and focusthe energies of all team members. It also helped toovercome the cultural barriers mentioned above and
Caro et al.: Zara Uses Operations Research to Reengineer Its Global Distribution ProcessInterfaces 40(1), pp. 71–84, © 2010 INFORMS 79
Modeldevelopment
and testProcess
deployment
Softwareprototype
development
2005 2006
Jan Feb Mar Apr JunMay AugJul OctSep DecNovAug OctSep DecNov Jan
2007
Forecast modeldevelopment Live pilot
J. Correa’s LFMinternship
Feb Jun
Deploymentcompletedin ArteixoFirst
meeting atZara HQ
Deploymentcompleted
in Zaragoza
Zara assignsfull-time ITengineerZara approves
LFM internship
Figure 6: The project involved five main phases spanning almost two years.
generate buy-in from important stakeholders withinthe company when the team subsequently plannedand executed the full-scale deployment of the newprocess.The complete development and implementation
cycle for this work spanned just under two years(Figure 6), and its corresponding total cost to Zarais estimated to range between $150,000 and $250,000,
Arteixowarehouse
Zaragozawarehouse
Test articleControl article
Test article
Control article
Shipments of bothtest and control
articles are determinedwith legacy process
Zaragoza stores
Arteixo stores
Relativesales
comparison
Relativesales
comparison
Optimization model andnew process used todetermine shipments
for test article
Shipments of controlarticle determined
with legacy process
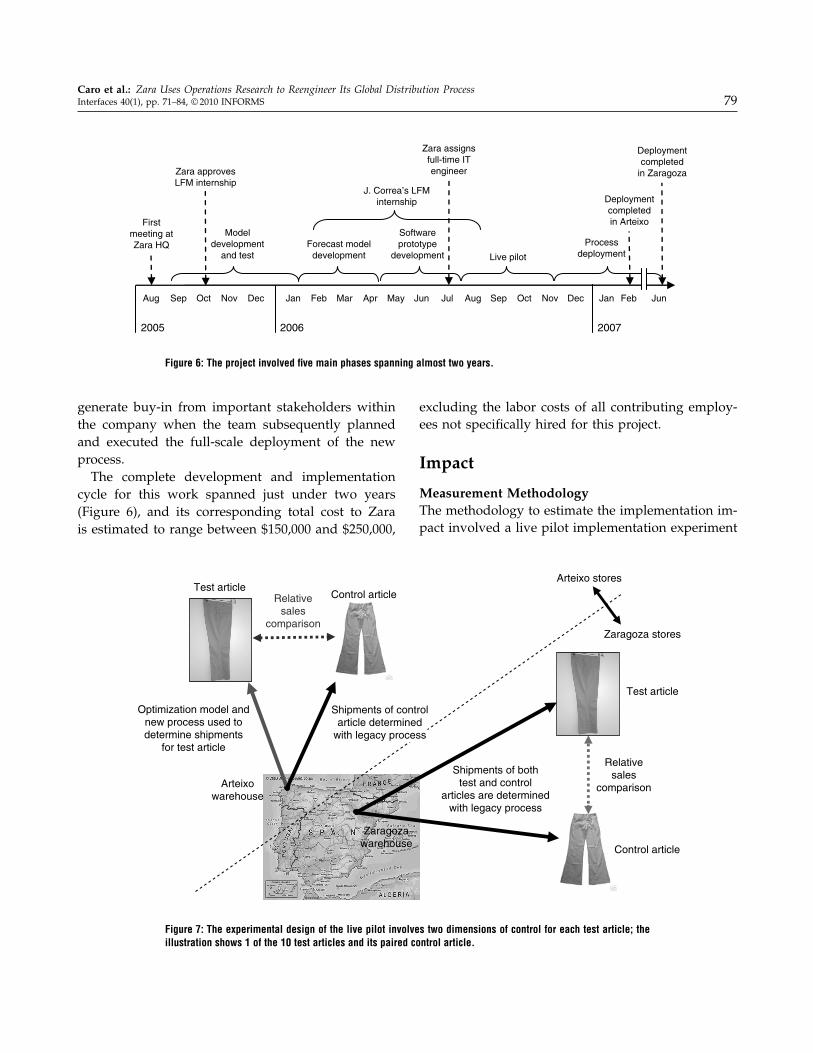
Figure 7: The experimental design of the live pilot involves two dimensions of control for each test article; theillustration shows 1 of the 10 test articles and its paired control article.
excluding the labor costs of all contributing employ-ees not specifically hired for this project.
Impact
Measurement MethodologyThe methodology to estimate the implementation im-pact involved a live pilot implementation experiment

Caro et al.: Zara Uses Operations Research to Reengineer Its Global Distribution Process80 Interfaces 40(1), pp. 71–84, © 2010 INFORMS
using two dimensions of control (Figure 7). Using theoptimization model, we distributed a test group of10 articles to all stores that exclusively receive ship-ments from Zara’s first primary warehouse in Arteixo,Spain (this represents approximately half of all Zarastores worldwide). Simultaneously, we distributed asubset of 10 “twin” control articles, which we deter-mined through a careful pairwise matching with thetest group, to the same stores using the legacy manualprocess. This matching procedure enabled us to doa relative comparison between the test and the con-trol group and thus supported estimating the specificimpact of the new model and eliminated the impactof any other factors external to the model (whichwould affect both the test and control groups); thisconstitutes the first dimension of control. The seconddimension of control exploits the fact that the otherZara stores worldwide receive only shipments fromits second main warehouse in Zaragoza, Spain. Forthis second and relatively independent network ofstores, we determined shipments of both test and con-trol group articles using the legacy manual process.We selected this experimental design to enable us toestimate the error associated with the control-basedimpact-estimation methodology described above. ForZaragoza stores, we distributed both test and controlgroup articles using the same procedure; any mea-sured impact for this second half of the store net-
Each point on this graphrepresents the difference in
relative change of sales during thelive pilot between a test articleand its paired control article
Difference in relativechange of sales
between test andcontrol articles (%)
Arteixo
Zaragoza
7.55.02.5–2.5–5.0–7.5–10.0 0.0 10.0
Figure 8: The results of the live pilot experiment suggest that the new process increases sales by approximately3–4 percent (adapted from Caro and Gallien 2009).
work could only be attributed to estimation errors, asopposed to the use of our new OR-based process.
Financial ImpactFigure 8 summarizes the main results of the con-trolled live pilot experiment described above. Theseresults are conclusive: The control-adjusted relativesales impact in Arteixo is positive for every article,with a mean across articles of 4.1 percent (median4.2 percent); the corresponding estimation error cal-culated using data from Zaragoza is centered aroundzero (mean and median across articles are 0.7 and−0�6 percent, respectively). We also note here thatthe variability around the means that we see acrossdifferent articles in Figure 8 is easily explained bythe measurement noise introduced for each individ-ual article by the pairwise matching procedure andby possible forecasting errors. Therefore, focusing onthe averages of these measurements across articles,which are indicative of the model’s overall impact onthe entire range of Zara’s product offerings, is appro-priate. When (conservatively) subtracting the esti-mated average experimental error obtained from theZaragoza data, these results show that the new OR-based process increases sales during the selling seasonby 3–4 percent, as seen in Figure 8. This impact onrevenue is easily explained by the model’s ability,

Caro et al.: Zara Uses Operations Research to Reengineer Its Global Distribution ProcessInterfaces 40(1), pp. 71–84, © 2010 INFORMS 81
relative to the legacy process, to determine that Zarashould move excessive inventory away from low-selling stores where it is not needed, send it to high-performing stores in which it reduces the number ofsales missed because of stock-outs, and ship all sizesof an article to each store in a concerted manner, like-wise sending inventory of specific sizes only to storesin which it is likely to sell.From a financial standpoint, if Zara had used the
optimization model for all of 2007 and 2008, this rela-tive sales increase would have implied approximately$310 million (2007) and $353 million (2008) in addi-tional revenue or $37.2 million (2007) and $42.4 mil-lion (2008) in additional net income, with both mea-sures of impact predicted to continue growing at arate of 10 percent per annum in subsequent years.However, the model’s full-scale deployment startedin late 2006 and was completed in June of 2007;therefore, the estimated, actual realized impact of themodel in 2007 is instead approximately $233 millionin additional revenue or $28 million in additional netincome (that is, 75 percent of the previous figures for2007). The companion paper, Caro and Gallien (2009),presents some quantitative evidence that the modelalso reduced the transshipments between stores andincreased the time spent by articles on display withintheir life cycle; however, the financial implications ofthese observations are harder to estimate.
Organizational ImpactZara was able to maintain its warehouse inventoryallocation team at its early 2007 staffing level ofapproximately 60 individuals worldwide, althoughit was initially planning on expanding that teambecause of its projected 10–12 percent sales growthper annum. More importantly, the optimization modelhas had a significant impact on the daily lives of theseemployees by enriching their professional responsi-bilities: all team members have become enthusiasticusers of the new tool, gratefully seeing their respon-sibilities shift from repetitive manual data entry toexception handling, scenario analysis, and processimprovement.
Cultural ImpactThis project has also had some cultural impact atZara, a company where many favor human intuition,
vision, and judgment (as opposed to analytical meth-ods) when making decisions. This is partly because thetypical background of most fashion-industry employ-ees is not quantitative and perhaps also because Zaraowes much of its success to the unique intuition of itsfounder (Ghemawat and Nueno 2003). We doubt thatZara will ever use OR models to help with several ofits key challenges, including anticipating volatile mar-ket trends, recruiting top designers, and creating fash-ionable clothes. Moreover, it is not clear to us that thecompany should. However, the work presented heredid prompt a realization by many of Zara’s key execu-tives and employees that for processes involving largeamounts of quantitative data, well-designed OR mod-els will lead to better performance and more scalableoperations. Because of this work, Zara has initiatedtwo additional major OR implementation projects onpurchasing and pricing. It is now also actively seek-ing to recruit graduates with strong OR backgroundsand to become a corporate partner with MIT’s LFMProgram. In addition, the Inditex Group is planningto deploy the OR-based inventory distribution pro-cess described in this paper in some of its other retailchains, such as Massimo Dutti.
Summary of Contributions toOR PracticeTo the best of our knowledge, this work constitutesthe first reported application of OR to the fast-fashionretail-business strategy, as adopted by companies thatinclude Zara, H&M, and Mango. Under this strategy,the life cycle of merchandise in these stores spansonly a small fraction of a selling season (e.g., fiveto six weeks for Zara). Therefore, their store assort-ments turn over much more frequently than those oftraditional retailers, customers find frequent store vis-its to be more appealing, and the warehouse inven-tory available for distribution to these stores tends tobe scarcer than for traditional retailers, making theinventory allocation problem more difficult.This work also appears to constitute the first
described implementation of an inventory distribu-tion model for an apparel retailer (fast-fashion orother), which specifically captures the dependenciesacross sizes introduced by store inventory displaypolicies. Specifically, many retailers, including Zara,

Caro et al.: Zara Uses Operations Research to Reengineer Its Global Distribution Process82 Interfaces 40(1), pp. 71–84, © 2010 INFORMS
remove some articles from display and put theminto the store’s backroom whenever the combinationof their sizes still available is not complete enough.Although many retailers replenish their stores foreach size independently (sometimes leading to use-less shipments from a sales standpoint if major sizesare missing) or ship predetermined size bundles(making it difficult to balance the inventory avail-able across sizes in stores), our model considers theentire inventory profile of all sizes offered and com-putes coordinated shipment quantities for all thesesizes simultaneously; the Analytical Development sec-tion provides more detail.Finally, we emphasize that although our impact-
measurement methodology based on a controlledexperiment is fairly common in other disciplines (e.g.,medicine and social sciences), its application to ORpractice is noteworthy, because the impact of pub-licly described OR practice work is predominantlyestimated through more questionable “before versusafter” comparisons that completely ignore the manyother factors that are not related to OR, but could alsobe affecting differences in performance observed inthe “after” period.
Concluding RemarksBecause of Zara’s openness to the academic pub-lication of this work, the OR models presentedmight also impact other companies. Although theinventory distribution model discussed above wouldclearly require some IT implementation and adap-tation work, it seems particularly applicable to themany apparel retailers facing the challenge of coor-dinating shipment decisions across different sizesbecause of store display policies. A simpler version ofthis model, which would not capture sizes but wouldcapture the notion of required store-exposure inven-tory, also seems applicable to most of the retail indus-try beyond the apparel segment and would likelyconstitute a significant improvement relative to thepervasive non-OR-based methods and simple heuris-tics that many firms use when distributing scarceinventory to a network of stores (e.g., proportionalrationing).Our work has also been very formative for its
academic authors (both were junior faculty at major
research universities during this project), and ithas significantly affected their research and teachingactivities. In particular, this OR implementation hasalready been the object of several masters, executiveeducation, and MBA course sessions taught at UCLA,MIT, and Columbia University. All team membersalso learned many lessons, several of which were ini-tially counterintuitive, about implementing OR. Forexample, from an academic standpoint, designing andstudying OR models that capture all the relevant keyinput data (including forecast uncertainty and stor-age opportunity cost in our case) might seem impor-tant. In practice, however, our experience suggeststhat implementing such “comprehensive” models tocontrol large-scale core processes in time-sensitiveenvironments could present insurmountable IT anddata-availability challenges; thus, a hybrid approachcombining a simpler but robust optimization modelwith carefully selected user inputs might be moreeffective.In closing, we note that this paper presents a suc-
cessful and high-impact application of OR techniquesin a fashion-retailing environment, which is bothhighly visible to the general public and not currentlyperceived as a traditional application area for this dis-cipline. We are hopeful that our work will contributeto increasing OR awareness and help improve percep-tions of its applicability.
AppendixSingle-Store Inventory-to-Sales ModelConsider an article offered in a set of sizes S = S+ ∪ S−,where S+ denotes the major sizes (e.g., {S,M, L}) and S−
the minor sizes (e.g., {XS, XL}). Sale opportunities for eachsize s ∈ S are assumed to be independent across sizes andfollow a Poisson process with rate �s and cumulative count-ing measure {Ns�t�� t ≥ 0}, where t denotes the time elapsedsince the last replenishment (i.e., Ns�t� is the random num-ber of sale opportunities for size s that occurred between0 and t). Let qs represent the inventory level of size s imme-diately after replenishment at time 0; the virtual stockouttime �s�qs� can be defined for every size s ∈ S as
�s�qs��= inf
{t ≥ 0 Ns�t� = qs
}�
Likewise, the earliest time at which one of the major sizesruns out, from an initial profile q of inventory across sizesand assuming no replenishment occurs, can be expressed as
�S+ �q��=min
s∈S+ �s�qs��

Caro et al.: Zara Uses Operations Research to Reengineer Its Global Distribution ProcessInterfaces 40(1), pp. 71–84, © 2010 INFORMS 83
As we described above, all inventory is removed from cus-tomer view as soon as one of the major sizes runs out at anypoint between successive replenishments. Under that pol-icy, the (random) total number of sales in a replenishmentperiod can be expressed as
G�q��= ∑
s∈S+Ns��S+ ∧ T � + ∑
s∈S−Ns��S+∪s� ∧ T ��
where T > 0 denotes the time between consecutive replen-ishments (one week for Zara) and a∧ b
�= min(a� b). Apply-ing Doob’s optional sampling theorem, the expectationg�q�
�= E�G�q� can be expressed as
g�q� = �S+E��S+ ∧T + ∑
s∈S−�sE��S+∪s� ∧T �
where �S+�= ∑
s∈S+�s�
For any subset of sizes D ⊂ S , we apply Jensen’s approxi-mation, E��S+ ∧ T ≈mins∈D E��s ∧ T , and observe that
E��s ∧ T = ∑
k=1��qs
��k��sT �/�s��k�
= mini∈N
{ai��s��qs − i� + bi��s�
}�
where ak��s��= ��k��sT �/�s��k� and a���s�
�= 0� bi��s��=
∑k=1��i−1 ak��s� for i ≥ 1� b0��s�
�= 0� and b���s��= T , and
� and � are the Gamma function and the lower incompleteGamma function, respectively. Our next approximation con-sists of computing only the minimum on the right side ofthe previous equality over the small finite subsets N��s�defined as
N��s��= {
i ∈ N ∪ �� bi��s� ≈ 0�0�3T �0�6T �0�8T �0�9T �T}�
which are straightforward to compute numerically. Appro-priate substitutions yield the final expression:
g�q� ≈ �S+ mins∈S+� i∈N��s�
{ai��s��qs − i� + bi��s�
}
+ ∑
s∈S−�s min
s′∈S+∪s�� i∈N��s′�
{ai��s′ ��qs′ − i� + bi��s′ �
}�
Caro and Gallien (2009) provide a complete discussion.
Network Sales-Optimization Model
Input DataSet of sizes: S = S+ ∪ S− partitioned into major sizes S+
and regular sizes S− (index s);Set of stores: J (index j);Ws : Inventory of size s available in the warehouse;Isj : Inventory of size s available in store j ;Pj : Selling price in store j ;K: Aggressiveness factor (value of inventory remaining
in the warehouse after the current shipments);�sj : Demand rate for size s in store j ; andN��sj �: Approximation set for size s in the inventory-to-
sales function approximation for store j .
Decision Variablesxsj ∈ N : Shipment quantity of each size s ∈ S to each store
j ∈ J for the current replenishment period;zj : The approximate expected sales across all sizes in each
store j for the current period under consideration;yj : Secondary variables representing the term
mins∈S+� i∈N��sj�
{ai��s′ j ��Is′ j + xs′ j − i� + bi��s′ j �
}� and
vsj : Secondary variables representing the term
mins′∈S+∪s�� i∈N��s′ j�
{ai��s′ j ��Is′ j + xs′ j − i� + bi��s′ j �
}�
ObjectiveMax
∑j∈J Pjzj + K�
∑s∈S�Ws −∑
j∈J xsj ��.
Constraints∑j∈J xsj ≤ Ws for all s ∈ S (warehouse inventory availabil-
ity constraint);zj ≤ �
∑s∈S+ �sj �yj + ∑
s∈S− �sjvsj for all j ∈ J (primaryinventory-to-sales function implementation constraint);
yj ≤ ai��sj ��Isj + xsj − i� + bi��sj � for all j ∈ J , s ∈ S+, andi ∈ N��sj � (secondary inventory-to-sales function implemen-tation constraint);
vsj ≤ ai��sj ��Isj + xsj − i� + bi��sj �� for all j ∈ J , s ∈ S−, i ∈N��sj � (secondary inventory-to-sales function implementa-tion constraint);
vsj ≤ yj for all j ∈ J , s ∈ S− (secondary inventory-to-salesfunction implementation constraint); and
xsj ∈ N ; zj� yj ≥ 0; vsj ≥ 0 (nonnegativity and integer con-straints).
AcknowledgmentsWe thank the Zara Distribution Team—in particular, JuanQuintela, Jesús González, and Iván Escudero; the InditexCommunications Department—in particular, Jesús Echevar-ria and Amaya Guillermo; Anthony Placet from the MITSloan Office of Communications; Donald Rosenfield andJonathan Griffith from the MIT Leaders For ManufacturingProgram; all the volunteers who made the 2009 Franz Edel-man Competition possible, and in particular Coaches LayekAbdel-Malek, Ananth Iyer, Yoshi Ikura, and Chair SrinivasBollapragada; the 2009 Franz Edelman Competition spon-sors, Georgia Institute of Technology, Procter & Gamble,and SAS. F. Caro and J. Gallien would also like to thankfaculty colleagues at the UCLA Anderson School of Man-agement and MIT Sloan School of Management.

Caro et al.: Zara Uses Operations Research to Reengineer Its Global Distribution Process84 Interfaces 40(1), pp. 71–84, © 2010 INFORMS
References
Caro, F., J. Gallien. 2009. Inventory management of a fast-fashionretail network.Oper. Res., ePub ahead of print August 12, http://or.journal.informs.org/cgi/content/abstract/opre.1090.0698v1.
Correa, J. 2007. Optimization of a fast-response distribution net-work. Unpublished master’s thesis, Massachusetts Institute ofTechnology, Cambridge.
Fraiman, N., M. Singh, L. Arrington, C. Paris. 2002. Zara. ColumbiaBusiness School case, Columbia University, New York.
Ghemawat, P., J. L. Nueno. 2003. ZARA: Fast fashion. HarvardBusiness School Multimedia Case 9-703-416, Harvard Univer-sity, Boston.
Helm, B. 2008. Best global brands. BusinessWeek (September 18) 52.
Smith, S. A., D. D. Achabal. 1998. Clearance pricing and in-ventory policies for retail chains. Management Sci. 44(3)285–300.
Zipkin, P. H. 2000. Foundations of Inventory Management.McGraw-Hill, New York.