the free and restricted diffusion of silicon …
TRANSCRIPT

THE FREE AND RESTRICTED DIFFUSION OF SILICON
NANOCRYSTAL CLUSTERS
A Thesis
Submitted to the Graduate Faculty
of the
North Dakota State University
of Agriculture and Applied Science
By
Ahmed Bahgat Elbaradei
In Partial Fulfillment of the Requirements
for the Degree of
MASTER OF SCIENCE
Major Program:
Materials and Nanotechnology
June 2015
Fargo, North Dakota

North Dakota State University
Graduate School
Title
The Free And Restricted Diffusion Of Silicon
Nanocrystal Clusters
By
Ahmed Bahgat Elbaradei
The Supervisory Committee certifies that this disquisition complies with
North Dakota State University’s regulations and meets the accepted
standards for the degree of
MASTER OF SCIENCE
SUPERVISORY COMMITTEE:
Erik Hobbie
Chair
Orven Swenson
Andrew Croll
Approved:
6/16/2015 Erik Hobbie
Date Department Chair

iii
ABSTRACT
Biological applications for silicon nanocrystals (SiNCs) have recently gained more
attention because of silicon’s low toxicity. But, to be able to use SiNCs in applications such
as biological sensors, labeling or drug delivery we need to understand their transport in
different environments and their interaction with cell membrane. I will review some
different methods for the synthesis of, and I will give an accounting of encapsulating SiNCs
with PEGylated phospholipids to make them soluble in water. I also studied the free
diffusion of these micelles in water, as well as their restricted diffusion and interaction with
giant unilamellar vesicles (GUVs). I studied their restricted diffusion in oil emulsions. I
was able to calculate the diffusion coefficient for a large number of micelles moving freely
in water. I also measured the effect of water on the SiNC micelles intensity and observed
the difference between the restricted diffusion in liposomes and emulsions.

iv
ACKNOWLEDGMENTS
I owe the success of this work to Erik Hobbie. He was so supportive, helpful and
always understanding. At the very beginning when I joined the Materials and
Nanotechnology program, I didn’t have much knowledge about silicon nanomaterials and
their applications. There was much to learn and Erik always had his door open for me. I
have to mention that he deserves a lot of credits for his patience and his understanding
while I became more proficient in English as well. I was always working on weekends and
I always bothered Erik with my emails on Friday, and surprisingly he was answering
immediately and passionately to figure out the issue. Erik is my idol for hard work and
motivation. I also appreciate his support through the recent period of challenge in my
personal life.
My companion in research was a guy who I will always look up to as a nice, smart,
hard-working and tall guy; Joseph Miller, or I should say Dr. Joey the fastidious. Joe and I
worked a lot together on many projects and I wish I could go back in time to appreciate his
fellowship more and to learn from him. We worked on measuring quantum yield by using
an integrating sphere for a long time until we called ourselves quantum yield warriors. We
also worked on several projects together, which helped me get closer to him and he was
always there to offer advice and instruction, besides being fastidious. Samuel Brown (or as
I like to call him Sam-Yol. I don’t think he likes it but this was how I teased him) is a very
hard worker who made me feel guilty about my own work ethic on occasion. We took
many courses together and he was the best company I could ever ask for. Mr. Matthew
Semler (maestro de los osos, or master of the bears) and I had a lot of discussions together
and he was always a good listener and I really enjoyed our daily chats, even though I often

v
felt a bit guilty for wasting his time. Damith Rozario was eating Greek yogurt all the time
and I would never forgive him. I was always successful in getting him scared very easily
but he was always there for me. Bekele Gurmessa was always giving me advice and I was
listening to him for motivation. John Harris and I took courses together and he was always
helpful so that I was not feeling alone in the hardships of physics courses. I really want to
thank all my colleagues in the lab because what I learned from them is priceless. I also
want to thank Xinann Wang for supporting me through hard times, as well as Orven
Swenson and Andrew Croll for being a part of my committee and supporting me. I want to
thank all my friends and professors in the physics department; Deyan Mihaylov, Goetz
Kaehler, Nathaniel Grosz and Paul Omernik. We had a lot of discussions while we were
working on homework. I also can’t forget to acknowledge Patty or Patricia Hartsoch who
was a great support. Thank you all for being part of my journey and experience.

vi
DEDICATION
To Dad, who dedicated his life to us.
Mom, who was always believing in me.My brother, who taught me a lot of stuff in this
world.
My sister, who is my best friend.
My love . . . . .
To both the Egyptian and Tunisian revolutions.
To all my friends who I got across them through my journey. Thank YOU

vii
TABLE OF CONTENTS
ABSTRACT ....................................................................................................................... iii
ACKNOWLEDGMENTS ................................................................................................. iv
DEDICATION ................................................................................................................... vi
LIST OF FIGURES ........................................................................................................... ix
CHAPTER 1. INTRODUCTION ....................................................................................... 1
CHAPTER 2. NANOCRYSTAL SYNTHESIS ................................................................. 4
2.1. Chemical Etching ................................................................................................. 4
2.2. Laser Ablation in Liquids (LAL) ......................................................................... 4
2.3. Solution Based...................................................................................................... 5
2.4. Laser Pyrolysis ..................................................................................................... 5
2.5. Ion Implantation ................................................................................................... 6
2.6. Sol-Gel Pyrolysis.................................................................................................. 6
2.7. SiOx/SiO2 Stoichiometric Annealing ................................................................... 7
2.8. Solution Method via Reverse Micelles ................................................................ 7
2.9. Low Pressure Non-thermal Plasma ...................................................................... 8
2.10. Conclusion .......................................................................................................... 11

viii
CHAPTER 3. PHOTOLUMINESCENCE PROPERTIES............................................... 13
3.1. Stability .............................................................................................................. 13
3.2. Quantum Yield Measurement ............................................................................ 14
CHAPTER 4. FREE AND RESTRICTED DIFFUSION OF SiNCS .............................. 16
4.1. Theoretical Background ..................................................................................... 16
4.2. Experimental Procedures.................................................................................... 19
4.2.1. Free Diffusion of Micelles .......................................................................... 19
4.2.2. Making Liposomes Using Gentle Hydration Method ................................. 22
4.2.3. Making of Emulsions .................................................................................. 23
4.3. Results and Discussion ....................................................................................... 23
4.4. Conclusion .............................................................................................................. 27
REFERENCES ................................................................................................................. 29
APPENDIX A. MATLAB TRACKING CODE………………...…………………….....31
ix
Figure
LIST OF FIGURES
Page
1: Schematic for a particle in a box and the quantum confinement effect…
1
2: One-pot synthesis of alkene coated SiQDs and further functionalization
via thiol--ene click chemistry.[9] ……………………………………….
8
3: Schematic of a synthesis reactor with a digital image of the argon-
silane plasma.[17] ………………………………………………………
10
4: Illustration of a SiNC passivated with alkene group (R) (octadecene,
dodecene, and styrene)………………………………………………….
14
5: The Absorption and emission of a typical quantum yield measurement.
The LED absorption is negative because of the background subtraction.
15
6: Actual setup for encapsulating SiNCs by PEGylated phospholipids…... 20
7: Illustration of how we are preparing the slides to prevent drying……… 21
8: Actual setup of the inverted microscope and epifluorescence method
used to collect optical data ……………………………………………...
22
9: (left) The MSD versus time. (middle) The MSD versus the diffusion
coefficient multiplied by time. (right) The normalized
photoluminescence intensity versus the hydrodynamic radius …………
25
10: (left) The free diffusion of a micelle in water. (middle) The restricted
diffusion of a micelle inside an emulsion. (right) The restricted
diffusion of a micelle inside a liposome ………………………………..
26
11: (a) TEM image that shows 1 silicon nanocrystal. (b) TEM image that
suggests the QDs are surrounded with polymer ligand (micelle). (c)
Images of two different micelles moving along the wall of emulsion.
(d) Photo shows micelle moving inside liposome..…………………….. 27

1
CHAPTER 1. INTRODUCTION
Semiconductors are now widely used in microelectronic circuits and in
optoelectronic devices such as light-emitting diodes, photovoltaic devices, and light
detectors, etc.[1] Semiconductor materials are characterized by band gaps between 0.5 and
3 eV, which makes them ideal materials for many electronic and optical applications. The
ability to control a semiconductors band gap could open the door to many new applications.
Semiconductor nanocrystals give us this ability to change and control the band gap
compared to the bulk semiconductors. We can change the semiconductors energy gap over
quite a wide range based on a mechanism known as quantum confinement. Quantum dots
(QDs) are very tiny particles on the order of a nanometer in size. They are composed of a
hundred to a thousand atoms comprised from an element, such as silicon or germanium, or
a compound, such as CdS or CdSe.
Solving Schrodinger’s equation for a particle in a box gives equation (1.1), which
is showing that the energy gap is inversely proportional with the radius of the dot squared
(Figure 1). So, we can control the energy gap by changing the size of the quantum dot.
n = 1
n = 2
n = 3
E n = 3
n = 2
n = 1
Figure 1: Schematic for a particle in a box and the quantum confinement effect.

2
�� = ��ℎ�
8� (1.1)
Through the process of photoluminescence, a change of the energy gap changes
the wavelength of the light emitted. Size-tunable material properties are typically found
when the so-called Bohr exciton radius is larger than the physical size of the semiconductor
material. They are typically characterized by bandgaps between 0.5 and 3 eV, which makes
them ideal materials for many electronic and optical applications.[1, 2]
Nanomaterials have tremendous potential in biological applications and drug
delivery. Cd-based QDs have been used in the targeted in-vivo imaging of tumors.
However, Cd poses problems because of the potential toxicity at low concentration, with
recent studies indicating that cadmium-ion release is a major concern.[3] One solution is
to apply a biocompatible coating to the core, which has been shown to decrease the
cytotoxicity of these QDs. Beyond this approach, new heavy-metal free QDs are needed
for in vivo applications. Silicon is nontoxic in its elemental form compared to group II-VI
and IV-VI QDs. Si-QDs were claimed to be at least 10 times safer than Cd-based QDs
under UV irradiation.[3] One of the major obstacles for applications of silicon
nanocrystals, however, is oxidative degradation in the biological environment. Studies
have shown that surface functionalization and PEGylated-micelle encapsulation of Si-QDs
can overcome this problem.[4]
Although silicon nanocrystals (SiNCs) are gaining more attention, their transport
and interaction with cell membranes is not well understood. To be able to study their
diffusion inside cells, we studied their free diffusion first and then studied their diffusion
inside artificial cells; giant bilayer liposomes. There are many synthesis methods available
for silicon nanocrystals. Non-thermal plasma synthesis is the method used to create the

3
SiNCs that we used here. In Chapter 2, we explained in detail the different synthesis
methods. To be able to study SiNC diffusion in water, however, we first need to make them
soluble in water. To do so, we encapsulated the SiNCs with PEGylated phospholipids,
which surround the QDs and make them water-soluble. Next, we recorded videos under
photoluminescent observation for the free diffusion of these micelles, and using a Matlab
code we were able to track the particles trajectories and obtain their diffusion coefficients
for further study. Optical measurements were generated using visible/NIR fluorescence
imaging and an inverted Olympus microscope attached to Electronic Multiplied Charged
Coupled Device (EMCCD). The next step was to prepare the giant unilamellar vesicles
(GUVs) that mimic the structure of the cell membranes. We used the gentle hydration
method to prepare them and introduce our micelles into the liposomes. We then recorded
more videos for the restricted diffusion of these micelles inside the GUVs using the
previous setup and then started analyzing this data using Matlab to obtain position vs. time
data. Finally, we studied the restricted diffusion of the same SiNC micelles inside water-
in-toluene emulsions. We explain the method we used to prepare the emulsions in details
in Chapter 4. We recorded videos for micelle diffusion and were able to track the particles
inside the emulsions and calculate the distance of the micelle from the interfaces and study
the potential effect of the interface on the diffusion of the micelles near the boundary.

4
CHAPTER 2. NANOCRYSTAL SYNTHESIS
2.1. Chemical Etching
The most frequently used method for the preparation of porous silicon is the
chemical etching or the electrochemical etching of silicon wafers. In this method, a silicon
wafer is electrochemically polarized in an electrolyte containing hydrofluoric acid. The
wafer dissolves slowly, forming cavities that percolate throughout the sample producing
porous silicon. Removal of the formed nanocrystal can be done by sonication in a solvent
bath or the material can be left intact for further study.[5]
2.2. Laser Ablation in Liquids (LAL)
Making silicon nanocrystals by laser ablation in liquids (LAL) requires a two-stage
process. The first stage is the nanosecond laser ablation of a silicon target in chloroform,
which induces the formation of large composite polycrystalline particles (20-100 nm). The
second stage is the ultrasonic post treatment of the silicon nanoparticles (SiNPs) in the
presence of HF, which disintegrates them and releases small individual nanocrystals (NCs).
A p-type cz-silicon wafer with a resistivity of 10-20 Ω is typically ultrasonicated
in deionized water and then ethanol for 1 hour. The wafer is then immersed in CHCl3 and
targeted by a pulsed Nd:YAG laser (355nm, 40ns pulse duration, 5 KHz repetition rate).
Twenty scans is typically sufficient to see a brownish color in the liquid. After evaporating
the chloroform, a post treatment for the precipitate is needed to obtain small size
monocrystalline silicon nanoparticles. This post physicochemical treatment is achieved by
exposure to isopropanol, HF and hexane (3:1:3) under continuous ultrasonication. Testing
of these SiNPs by transmission electron microscopy (TEM) and by high resolution TEM

5
(HRTEM) at 100 and 200 kV coupled with Raman scattering measurements are used to
confirm the size and crystallinity of the SiNCs.[6]
2.3. Solution Based
In the solution-based method, thermal decomposition of HSQ (hydrogen
silsesquioxane) is achieved by heating under a flow of argon and hydrogen gas to a peak
temperature of 1100-1400°C, depending on the desired nanocrystal size. The second step
is to grind the brown/black glassy product into a brown powder with a grain size of 200
nm. HF and HCL are then used to etch the oxide to yield hydride-terminated SiNCs, which
are then centrifuged to isolate the NCs from the HF. To reduce the impact of oxidization -
which affects the photophysical properties of NCs - requires a passivation step, which is
achieved by rinsing the light brown precipitate in ethanol and toluene and then dispersing
it in 8 mL of 1-dodecene and 2 mL of 1-octadecene. The resulting cloudy brown dispersion
is heated to 190 °C for 8 h, producing a clear dark-orange dispersion. After washing and
dispersing in toluene, the concentrated nanocrystal dispersions are heated under vacuum
for 24 h at 200 °C to remove the excess ligand. Finally, the nanocrystals are dispersed in
toluene again for further study.[7]
2.4. Laser Pyrolysis
The laser pyrolysis method combines vapor-based and solution-phase process using
inexpensive commodity chemicals to produce SiNPs at high rates (20-200 mg/h). CO2 laser
induced pyrolysis of silane produces particles with an average diameter of 5 nm. These
SiNPs were prepared and later reduced by etching with mixtures of hydrofluoric acid (HF)
and nitric acid (HNO3). There are some problems associated with passivation so that these
particles are not well dispersed in most solvents and do not have stable photoluminescence

6
(PL). The PL intensity tends to decay with time while the PL peak shifts. Surface
functionalization was essential to produce particles with good properties. The surface
functionalization has two approaches. The first is hydrosilylation of Si-H surfaces, and the
second is silanization of Si-OH surfaces. Modifying the surface of the etched luminescent
silicon nanoparticles allows the formation of a stable colloidal dispersion of these particles
in different solvents.[8]
2.5. Ion Implantation
The ion implantation synthesis method requires a complex setup. A silicon ion
source is accelerated through a fixed electrostatic potential towards a magnetic mass-
spectrometer which filters undesired ion species. Second, uniform irradiation is introduced
through a beam or scanning system that is contained in a special chamber. This special
chamber is important to control essential parameters such as vacuum level, sample position
and temperature. The ions will hit the sample substrate to a specific depth depending on
their energy. The substrate used for producing SiQDs is often silicon dioxide. Once the
ions reach the limit of supersaturation of the solid, they will nucleate SiNCs.[5]
2.6. Sol-Gel Pyrolysis
Enhancement of SiNC optical properties is important for applications and has been
studied extensively. Some methods used for the synthesis of SiNCs can be expensive and
the SiNCs produced have a broad size distribution and a low density. The sol-gel pyrolysis
method uses tetraethylorathosilicate HSi (OCH2CH3) or HSi(OR)3, which is commercially
available. The first step is hydrolyzation with water for the hybrid silicon alkoxide, which
substitutes the OR group with a silanol Si-OH group. The second step is condensation for
the previous mixture to react to form a siloxane (Si-O-Si) bonded network. The last step is

7
pyrolysis at a temperature above 1000 °C where the Si-H moieties present react to H2 and
Si-Si bonds. The Si-Si bonds reorganize and form SiNCs.[5]
2.7. SiOx/SiO2 Stoichiometric Annealing
Forming precise nanometer-sized silicon crystals has always been a challenge. One
of the first methods to control the size was a SiO/SiO2 superlattice approach. The approach
uses molecular beam epitaxy and UV-ozone oxidation to grow precise nanometer-sized
amorphous silicon layers between SiO2 layers. Thermal evaporation of SiO powder is done
at 1000 °C under high vacuum. Oxygen is added through the growth process to control the
stoichiometry. The next step is to anneal the layers at 1100 °C in a nitrogen atmosphere.
Because of the instability of nonstoichiometric oxides such as SiOx at high temperature,
they decompose into the two stable components Si and SiO2 [5]:
�� � → �� �� ₂ + �1 − �
� � ��. (2.1)
2.8. Solution Method via Reverse Micelles
A one-pot synthesis was able to present an efficient method for fabricating colloidal
SiQDs with a modifiable surface. Allyl trichlorosilane were used as a surfactant and
reactant to surround self-assembling halogenated silane precursors (SiX4, X= Cl, Br) in
toluene as shown in figure 2. The trichlorosilane formed a reverse micelle around the SiX4
core and then was treated with LiAlH4 to yield SiQDs with alkene groups attached to the
surface. Transmission electron microscopy (TEM), high resolution TEM (HRTEM) and
quantum yield measurements have been used to characterize the SiQDs.[9]

8
Figure 2: One-pot synthesis of alkene coated SiQDs and further functionalization via
thiol-ene click chemistry.[9]
2.9. Low Pressure Non-thermal Plasma
The different states of matter generally found on earth are solid, liquid, and gas. Sir
William Crookes, an English physicist, identified plasma in 1879. The word "plasma" was
first applied to an ionized gas by Dr. Irving Langmuir, an American chemist and physicist,
in 1929. A plasma consists of a collection of free moving electrons and ions - atoms that
have lost electrons. Energy is needed to strip electrons from atoms to make a plasma. The
energy can be of various origins: thermal, electrical, or light (ultraviolet light or intense
visible light from a laser). With insufficient sustaining power, plasmas recombine into a
neutral gas. A plasma can be accelerated and steered by electric and magnetic fields, which
allows it to be controlled and applied. Plasma research is yielding a greater understanding
of the universe. It also provides many practical uses: new manufacturing techniques,
consumer products and the prospect of abundant energy, more efficient lighting, surface
cleaning, waste removal, and many more application topics. Plasmas can be classified as
“thermal” or “non-thermal” based on the temperature and thermal equilibrium between the
electrons, ions and neutrals. In thermal plasmas, the electrons and gas temperature are in
equilibrium with each other, like in the sun and lightning. In the non-thermal plasmas, the

9
electrons and gas temperatures are not in equilibrium with each other, like the aurora
borealis.[10]
In its early years, this work was motivated by particle formation occurring as a
contamination problem, both in semiconductor processing and in the manufacture of solar
cells. Hence, the initial main thrust of studying particle formation in plasmas was to avoid
the nucleation of particles.[11-13] The most important contribution of this method has been
that nanocrystals can be generated at gas temperatures as low as room temperature and the
approach has yielded silicon nanocrystals several tens of nanometers in size. Due to their
size these nanoparticles have been investigated for electronic device applications in
nanoparticle-based transistors.[5]
The main principle of plasma discharge is that when an electric field is applied to a
gas under low pressure, electrons easily get accelerated to energies sufficient to
electronically excite and ionize the surrounding gas atoms. In steady state, the ionization
produced by energetic electrons will precisely balance the charge carrier losses through
diffusion to the wall, recombination, and other processes.
Non-thermal plasmas are typically characterized by very hot electrons with
temperatures between 20000-50000 K (~2-5 eV) and significantly colder positive ions and
neutral molecules, whose temperatures are very effective in dissociating precursor gas
molecules.[14, 15] They also lead to a buildup of electric field within the plasma wherever
the plasma is in contact with boundaries such as reactor walls or the surfaces of
nanoparticles. An interesting feature of the non-thermal plasma method is the selective
ability of the temperature; the nanocrystals will be at several hundreds of Kelvin while the
gas temperature will be much lower. This makes nonthermal plasmas attractive for the
10
synthesis of nanocrystals of covalently bonded semiconductors such as group IV and III-
V semiconductors. Studies on silicon nanoparticles suggest that the crystallization
temperature of particles with diameters of 4, 6, 8, and 10 nm are 773, 1073, 1173, and 1273
K respectively.[16] Thus, it is quite surprising that nanocystals requiring such high
crystallization temperature are formed in plasmas at low gas temperature. In newer
approaches they determined that the gas temperatures were between 420 and 520 K, which
is significantly lower than the crystallization temperatures reported for small silicon
nanoparticles. The only logical conclusion from this observation is that the nanoparticles
in the plasma are at significantly higher temperatures than the surrounding gas.
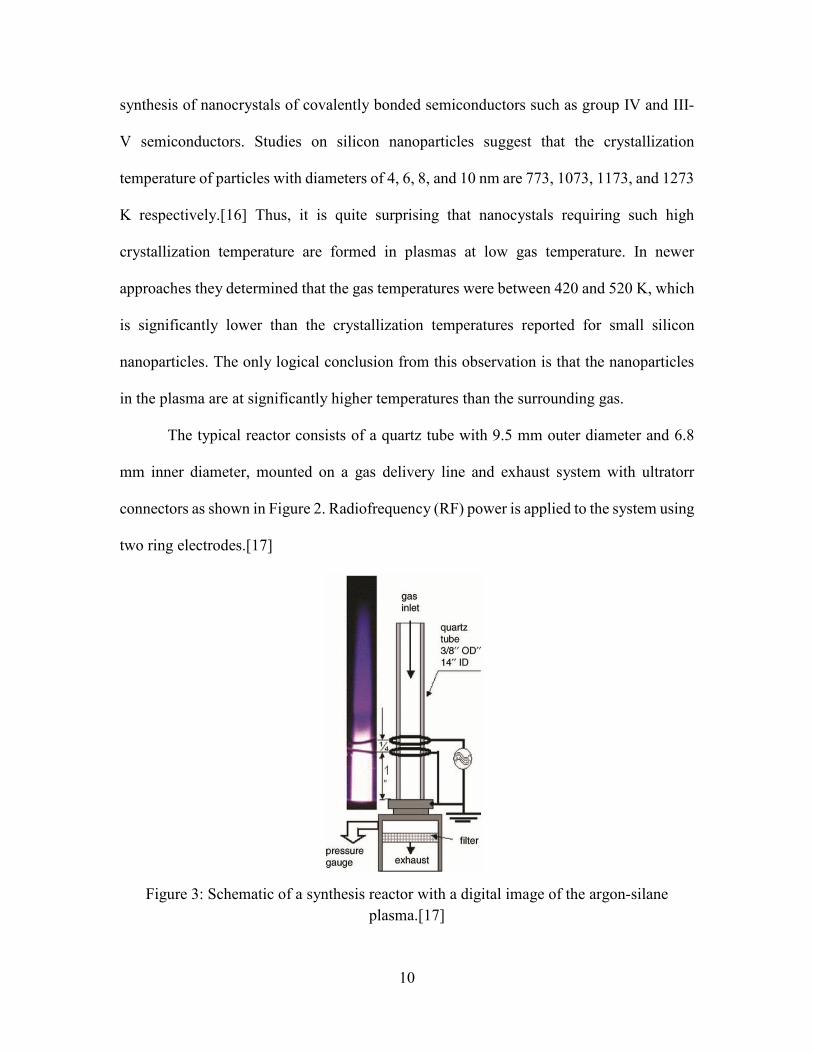
The typical reactor consists of a quartz tube with 9.5 mm outer diameter and 6.8
mm inner diameter, mounted on a gas delivery line and exhaust system with ultratorr
connectors as shown in Figure 2. Radiofrequency (RF) power is applied to the system using
two ring electrodes.[17]
Figure 3: Schematic of a synthesis reactor with a digital image of the argon-silane
plasma.[17]
11
The plasma is typically generated at a pressure of 187 Pa, but luminescent
nanocrystals have also been obtained at pressures as high as 2000 Pa. Most of the
experimental results presented were obtained at a pressure of 1.4 Torr since it was found
that under these conditions the largest yield of nanocrystals could be achieved. Typical gas
flow rates at 1.4 Torr are up to 100 sccm of Ar, around 15 sccm of SiH4 (5 % dilution in
either He or Ar), and a few sccm of additional hydrogen. The residence times of gas in the
plasma, calculated on the basis of the gas flow velocity, are between a few tens of
milliseconds to less than 5 ms. In figure (3), it can be seen that the plasma consists of two
regions. In the part upstream of the electrodes, the plasma emission appears weaker than
in the region downstream of the two electrodes. Also, significant growth of silicon film in
the reactor tube can be observed upstream of the electrodes, while the growth is much less
significant downstream of the ring electrodes. This suggests that very fast nucleation and
precursor consumption occurs upstream of the electrodes.[17]
Plasma power plays a crucial role in this process. RF current and voltage have been
measured to estimate the actual power consumption in the discharge, giving a value of 30
W. Given the very small discharge volume (2 cm3), a considerable power density is
achieved in the plasma region. A filter placed downstream of the discharge collects the
particles produced in the plasma. The filter is made of a fine stainless steel mesh (400
wires/in.) and a few minutes of deposition are sufficient to completely coat the filter.[5]
2.10. Conclusion
We reviewed different methods used to produce SiNCs, touching on the advantages
and disadvantages of each. The ultimate goal of these methods is to produce a broad range
of sizes with stable and high-intensity photoluminescence at the lowest cost. In this work,

12
we used plasma-synthesized SiNCs because of their uniform size distribution and high
quantum yield.

13
CHAPTER 3. PHOTOLUMINESCENCE PROPERTIES
Silicon nanocrystals (SiNCs) have many conceivable applications based on
photoluminescence. To realize these applications, we require two photoluminescent
properties; stability and efficiency. Stability in solution is important for dealing with
colloidal silicon nanocrystals in different solvents. Also, silicon reacts with oxygen to form
a silicon oxide layer, which affects the photoluminescence. Efficiency has important
implications for determining the ability to use these SiNCs in different applications. This
section will focus on the stability and efficiency of the SiNCs synthesized by the non-
thermal plasma method. In our case, we are measuring the efficiency through the quantum
yield; �� = # �� ������� !"�� ## �� ������� $%��&% #. Measuring the QY allows us to evaluate how bright the
photoluminescence (PL) will be. For drug delivery and biological applications, it is
important that the SiNCs do not react with oxygen, so that they show a stable emission and
a high quantum yield. The higher the quantum yield, the more opportunities will be
available for different applications of SiNCs.
3.1. Stability
As we mentioned earlier, we need to produce stable SiNCs for different
applications, and surface passivation is very effective for reducing the reaction of SiNCs
with oxygen. A thermal liquid hydrosilylation reaction is the method used for the ligand
passivation of the SiNCs, and using 1-dodecene as ligand for the passivation process allows
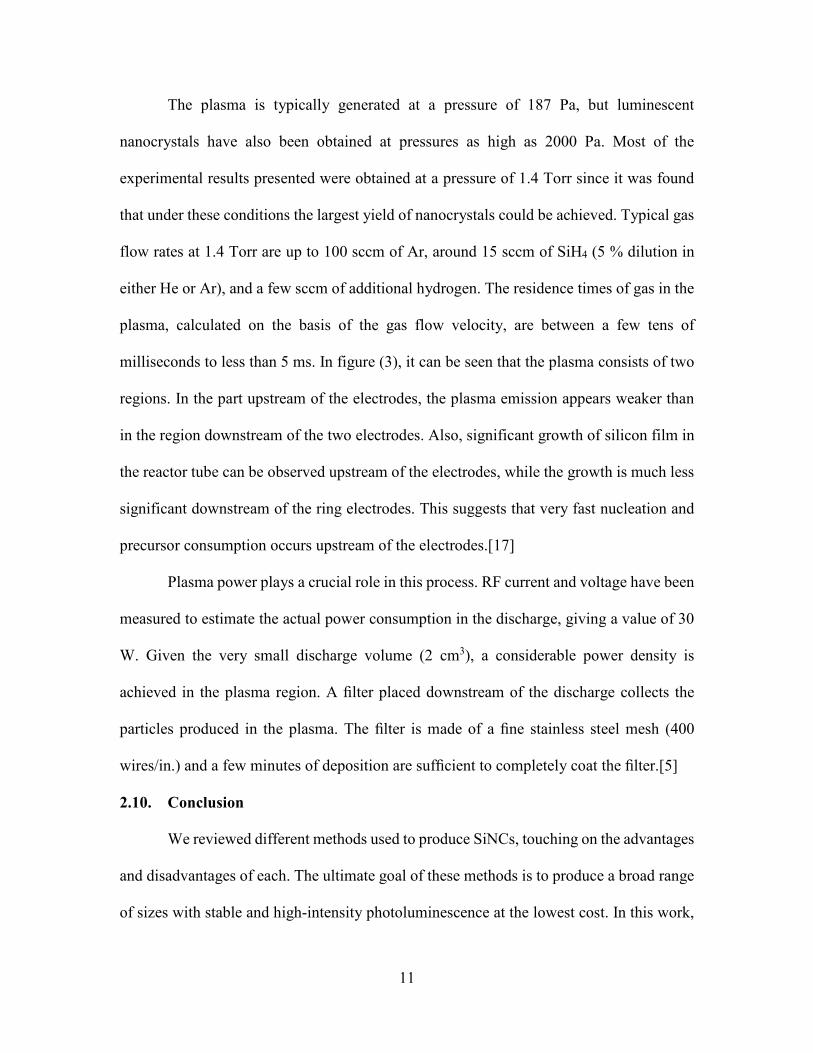
SiNCs to be dispersed in most common organic solvents. Figure 4 illustrates the SiNC
passivation process. The passivation process is always below 100% because of steric
hindrance, and hence there will always be some dangling bonds. This incomplete
passivation could allow oxygen to react with SiNCs. The reaction with oxygen can affect
14
the surface composition, changing the effective size with a blue shift that can reach 200
nm in the PL spectral emission.[18]
Figure 4: Illustration of a SiNC passivated with alken group (R) (octadecene, dodecene,
and styrene).
3.2. Quantum Yield Measurement
The quantum yield of the plasma synthesized SiNCs used in this study was
measured to be around 50 % immediately after synthesis.[19] Quantum yield is defined as
the ratio of the number of photons that are emitted to the number of photons absorbed. To
determine the QY of SiNCs we need to simultaneously record the absorption and emission
spectra of a SiNC solution. To do this, we placed the solution in an integrating sphere,
which was connected to an Ocean Optics QE65000 spectrometer through an optical fiber.
We calibrated the spectrometer’s spectral response with a calibration lamp; Ocean Optics
halogen light source (HL-2000-CAL-ISP). A baseline was first collected for a vial
containing pure solvent using an Omicron PhoxX® laser with wavelength of 375 nm. After
subtraction of the reference baseline, the photoluminescence spectra of SiNCs dispersed in

15
hexane and sealed under a nitrogen atmosphere was collected. We take an average of three
separate spectral measurements for both the sample and the reference. A typical PL after
subtraction is shown in Figure 5. The QY value can be calculated by dividing the integrated
of PL spectrum by the integrated absorption spectrum.
200 400 600 800
-12000000
-10000000
-8000000
-6000000
-4000000
-2000000
0
2000000
inte
nsity (
a.u
.)
wavelength (nm)
Figure 5: The Absorption and emission of a typical quantum yield measurement. The
LED absorption is negative because of the background subtraction.
PL emission
Laser absorption

16
CHAPTER 4. FREE AND RESTRICTED DIFFUSION OF SiNCS
In this section, I report on the diffusion of the silicon nanocrystals (SiNCs) in
different environments. First, I will give details about the theoretical basis of our
experiments to study the diffusion of the micelles in different environments.
We studied the diffusion of micelles and nanocomposite particles in three different
environments: free in water, confined inside giant unilamillar vesicles (GUVs), and inside
water/toluene emulsions. First, I will report on the methods we used to make the SiNCs
soluble in water by encapsulating them with PEGylated phospholipids. Second, I will
report on the method we used to make GUVs. Third, I will report the experimental
procedures we used to make the W/O emulsion. And finally, I will report on what we found
by studying the micelle diffusion in these different environments.
4.1. Theoretical Background
Dropping a solid sphere in a fluid will make it accelerate until the drag force
balances the gravitational force and the sphere reaches terminal velocity. This drag force
is given by the following equation known as Stokes’ law[20]:
'� = 6)*+,. (4.1)
The gravitational force is given by the equation:
'- = ./ ) +/ 01 2.
(4.2)
When force balance happens, both equations will equal each other and the sphere will
reach a terminal velocity νt :
,� = 2 4�01 29 *
(4.3)

17
Combining Stokes’ law and the Einstein equation will help us to understand the diffusion
of such particles. Observing a spherical polymer colloid with an optical microscope shows
that such particles move continuously in a random manner. This motion is termed
Brownian motion after Robert Brown, a botanist, who observed the same phenomenon for
plant pollen in 1827. Brownian motion results from collisions between the molecules of
the fluid and the colloidal particles. In such a random walk, the mean square displacement
is proportional to the number of steps and thus the time:
⟨789:;⟩� = = :. (4.4)
Where, 789:; is the displacement vector after time t and = is a constant. The equation of
motion can be written as:
>�78>:� + ? >78
>: = '874�>@. (4.5)
Here, it is assumed that there is a drag force on the particle proportional to the velocity,
with a drag coefficient ?. For a sphere of radius 4 in a liquid of viscosity η, this is given by
Stokes’ law:
? = 6)*+. (4.6)
Furthermore, with 7� = A� + B� + C� = 3 A�, we can write >9A�; >:⁄ = 2 A9>A >:;⁄ , so
multiplying equation (4.5) by x and rearranging yields:
?2 >9A�;
>: = A '&$�#�! − A >�A>:� .
(4.7)
18
With:
A >�A>:� = >
>: FA >A>:G − F>A
>:G�
. (4.8)
we get
?2 >⟨9A�;⟩
>: = ⟨A '&$�#�!⟩ − >>: ⟨A >A
>:⟩ − ⟨F>A>:G
�⟩.
(4.9)
The first and second term on the right hand side will time average to 0 because the direction of the
random force and the velocity are random and uncorrelated with the position. So the equation
becomes:
>⟨9A�;⟩>: = 2 HI
? . (4.10)
and the total mean square displacement will be given by the following equation:
⟨97;�⟩ = 6 HI? :.
(4.11)
Using the Einstein Formula
J = HI? .
(4.12)
We get what is called the Stokes-Einstein equation:
JKL = HI6)*+�
. (4.13)
This previous equation gives the diffusion coefficient of a colloid in a fluid and is the one
we use to determine the radius of the micelles. Combining Equations (4.11) and (4.12)
gives the diffusion coefficient as a function of mean square displacement in three
dimensions [20]:

19
J = ⟨97;�⟩6: .
(4.14)
In our setup we apply the previous equation to determine the diffusion coefficient but
projected to two dimensions as follows:
J = ⟨97;�⟩4: .
(4.15)
4.2. Experimental Procedures
4.2.1. Free Diffusion of Micelles
Preliminary experiments have recently been performed to understand the use of
monodisperse, stable SiNCs for biological applications. To achieve that, we need to
perform surface passivation to allow SiNCs to be stable in aqueous environments. We used
polyethylene glycol (PEG) grafted phospholipids [1,2-dimyristoyl-sn-glycero-3-
phosphoethanolamine-N-[methoxy(polyethylene glycol)-2000] (ammonium salt)],
purchased through Avanti Lipids and solvated in chloroform. A 270 μL solution of 0.1 %
SiNCs in chloroform was put in a 2 mL vial with 200 μL of PEGylated phospholipids in
chloroform. Subsequently, 330 μL of chloroform was added while stirring the mixture.
Next the mixture was moved into a 50 mL round-bottom flask and attached to Buchi rotary
evaporator (R210) set to rotate at 40 rpm for 2-3 hours followed by pulling vacuum of (17
kPa) for 15 minutes to make sure that the solvent was completely evaporated. An image of
the setup is shown in figure 6. The flask was removed and hydrated with 2 mL of distilled
water and allowed to incubate overnight. During this time, the encapsulation of the SiNCs
took place.[4]
The next step is to remove the larger micelles for better contrast and tracking of the
small ones. I used two reduction techniques to eliminate undesired large particles. The first

20
one is by filtration in which we used an Advantec polypropylene in-line filter holder, a Pall
hydrophilic polypropylene membrane filter, and a 1 mL syringe. We filtered the micelles
through the hydrophilic membrane to get rid of micelles with a size bigger than 200 nm.
The second method that I used to separate the small-sized micelles from the large ones is
centrifugation in an Eppendorf centrifuge 5424 at a speed of 5000 rpm for 5 minutes.
Figure 6: Actual setup for encapsulating SiNCs by PEGylated phospholipids.

21
The next step is to prepare slides in order to observe the free diffusion of the
micelles in water. I cleaned two slides with soap and DI water and dried them under flowing
nitrogen to ensure cleanliness. I covered the sides of one slide with a tiny layer of vacuum
grease and after putting a drop of the small-sized micelles on the slide, I sandwiched the
drop between the two slides. I then have the drop squeezed and sandwiched between the
two slides and sealed from air to decrease the evaporation and the movement of the whole
drop (Figure 7).
Figure 7: Illustration of how we are preparing the slides to prevent drying.
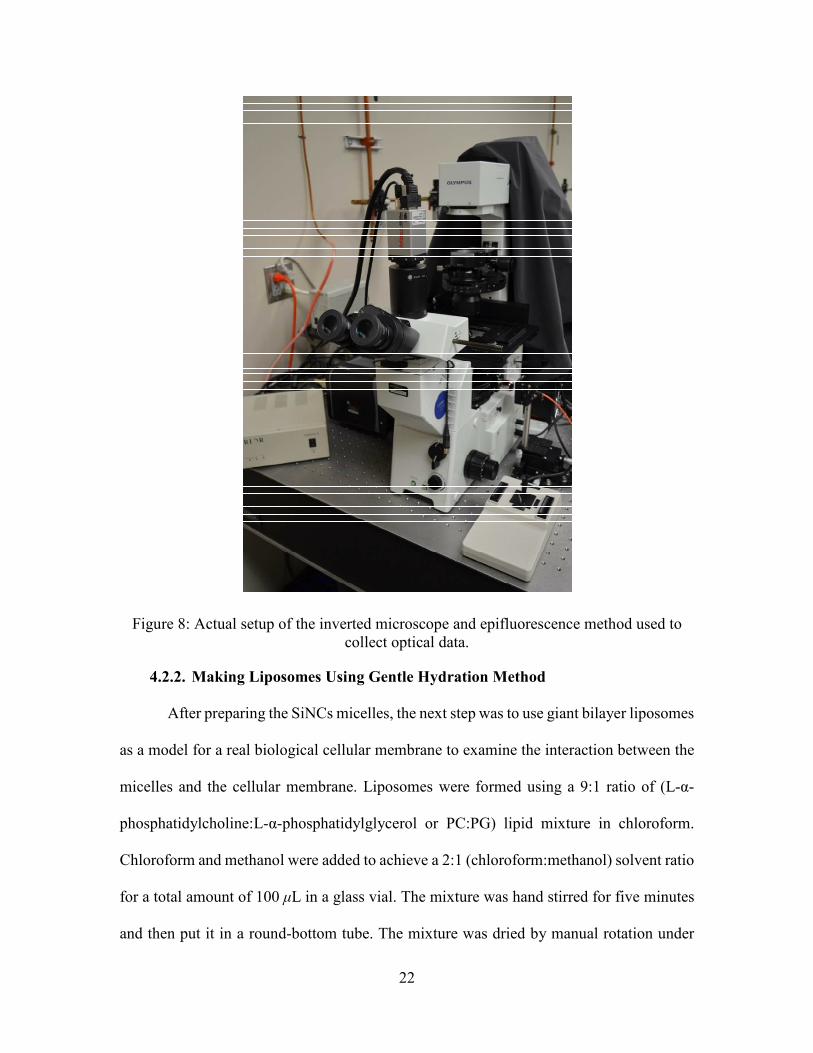
After preparing the slides, digital movies of the diffusion of the micelles were
collected using an inverted Olympus microscope attached to Princeton ProEM Electronic
Multiplied Charged Coupled Device (EMCCD). To be able to track the micelles in water
via their PL, I used an X-Cite® 120Q excitation light source, which uses a 120-watt lamp
to deliver rich spectral excitation energy and uniform wide-field fluorescence microscope
illumination to the micelles (Figure 8).
Grease
on the
perimeter
The
droplet
22
Figure 8: Actual setup of the inverted microscope and epifluorescence method used to
collect optical data.
4.2.2. Making Liposomes Using Gentle Hydration Method
After preparing the SiNCs micelles, the next step was to use giant bilayer liposomes
as a model for a real biological cellular membrane to examine the interaction between the
micelles and the cellular membrane. Liposomes were formed using a 9:1 ratio of (L-α-
phosphatidylcholine:L-α-phosphatidylglycerol or PC:PG) lipid mixture in chloroform.
Chloroform and methanol were added to achieve a 2:1 (chloroform:methanol) solvent ratio
for a total amount of 100 μL in a glass vial. The mixture was hand stirred for five minutes
and then put it in a round-bottom tube. The mixture was dried by manual rotation under

23
the influence of a pure nitrogen flow at a 45-degree angle for 4-5 minutes. I added one to
two milliliters of the micelles and then stored the mixture overnight at 37 °C. [21]
The above method that I used to make the liposomes is called gentle hydration. In
other studies, the liposomes and micelles are prepared separately then mixed, while we
report hydration of the dry layer of lipid mixture with the micelles in water, which allows
the liposomes to encapsulate more micelles in a shorter amount of time.
4.2.3. Making of Emulsions
The common emulsion to make is an oil-in-water (O/W) emulsion, where the oil
droplets collide in the water environment and are surrounded by surfactant. In our
experiment we needed to examine the interaction between SiNC micelles and emulsion
walls, so we needed to make a stable water-in-oil (W/O) emulsion. A surfactant or
emulsifier is used to surround the water droplets as a shell within the oil environment.[22]
Here, I used sorbitan monostearate (Span® 60) as a surfactant. Span60 has a
hydrophilic-lipophilic balance (HLB) of 4.7, which means that it is soluble in oil (or
toluene in our case). First, I prepared a solution of 0.5 % of Span60 in 2 mL of toluene and
stirred it for 2 minutes by hand until it was totally dissolved. Then, I added 50 μL of our
micelles to 500 μL of Span60/toluene solution (10 %). We then stirred it for another 2
minutes and we achieved the desired emulsion.
4.3. Results and Discussion
In this section I report on the three cases of diffusion that I studied. The first is the
free diffusion of SiNC micelles in water. The second is the restricted diffusion of SiNC
micelles inside GUVs. The third case is the diffusion of SiNCs inside emulsions.

24
First, I studied the free diffusion of the encapsulated SiNCs in water. I described
the recording of digital movies in the previous section. To analyze these videos, I used a
Matlab code that we modified (Appendix A). This code was able to track the micelles
through each video frame, giving us a data sheet of mean square displacement (MSD) as a
function of time. A graph of the MSD versus time for 268 micelles is shown in Figure 8
(left). According to Equation (4.16), we were able to determine the diffusion coefficient
values for different micelles as:
J = ⟨97;�⟩4: . (4.16)
We could then determine the radius of these micelles using the Stokes-Einstein equation:
J = HI6)*+�
, (4.17)
where H = 1.38 O 10Q�/ �R2 SQ�RQT, I = 300 R, * is the viscosity, D is the diffusion
coefficient and Rh is the hydrodynamic radius of the micelle.
We determined the viscosity of the solution by calculating it from the previous
equation using a micron-sized colloid of known radius by measuring the diffusion
coefficient. We calculated the viscosity for two cases: “old” micelles in water solution,
with * = 1.156 V4, and a newer batch in water with * = 1.273 V4. Both values are
slightly higher than the viscosity of pure water, which is expected.
From the hydrodynamic size of a large number of such micelles, we then plotted a
graph of the normalized photoluminescence intensity, I, vs. the hydrodynamic radius, Rh
(Figure 9).

25
Figure 9: (left) The MSD versus time. (middle) The MSD versus the diffusion coefficient
multiplied by time. (right) The normalized photoluminescence intensity versus the
hydrodynamic radius.
Second, I studied the diffusion of micelles inside giant unilamellar vesicles
(GUVs). After the liposomes encapsulated the micelles, I placed a drop of the solution
between two clean slides with grease around the perimeter and started to record movies for
the diffusion. Though squeezing of the droplet and surrounding it with grease was helpful
in preventing the flow in the whole droplet through drying effects, the liposomes
themselves were still moving slowly. This movement was problematic for tracking the
micelles so we were not yet able to process all the recorded videos. The liposomes formed
in sizes ranging from 5-200 μm. A medium (~ 20 μm) liposome can be seen in the bright
field image shown in Figure 11(d). For the liposome videos that we could process, we were
able to see the difference between the diffusion of the micelles inside the liposomes and
emulsions, which is represented in Figure 10.

26
Figure 10: (a) The free diffusion of a micelle in water. (b) The restricted diffusion of a
micelle inside an emulsion. (c) The restricted diffusion of a micelle inside a liposome.
Third, I studied the diffusion of micelles inside emulsions as shown in Figure 10(b).
I noticed that the movement of the micelles inside emulsions is different from that inside
liposomes, as shown in Figure 10(c). Hence, I modified our code to measure the distances
between the walls of the emulsion and the micelle and then graphed the data as histograms
to study the position probability of the micelles to understand if there is an attractive-
potential effect that obligates the micelles to keep moving close to the walls. Although the
trajectories suggest that this may indeed be the case, this code is still being refined and
such work will not reported in this thesis.

27
Figure 11: (a) TEM image that shows 1 silicon nanocrystal. (b) TEM image that suggests
the QDs are surrounded with polymer ligand (micelle). (c) Images of two different
micelles moving along the wall of emulsion. (d) Photo shows micelle moving inside
liposome.
4.4. Conclusion
In conclusion, through my work on the diffusion of the micelles in water I
determined the hydrodynamic radius for different micelles and found that the
photoluminescence intensity scales with the hydrodynamic radius of the micelles. Also, I
compared two batches of micelles we made at different times and it showed different trends
in intensity, as shown in figure 9. This difference could reflect the effect of water on the
micelles because the old batch of the micelles stayed in water longer than the newer one.
The comparison between the data of the micelles inside the liposomes and the
emulsions showed a difference in their movement and tendency for the micelles to move
beside the walls of emulsions, which is clear by comparing figure 10(b) for a micelle inside
an emulsion and figure 10(c) for a micelle inside a liposome. Similar behavior was
observed for a large number of micelles in each scenario. Although we suspect that this

28
difference is due to an attractive potential well around the wall of the emulsion, more
investigation is needed to confirm this hypothesis.

29
REFERENCES
[1] U Kortshagen (2009) Journal of Physics D-Applied Physics 42. Doi:10.1088/0022-
3727/42/11/113001
[2] L Brus (1991) Applied Physics a-Materials Science & Processing 53: 465.
Doi:10.1007/bf00331535
[3] F Erogbogbo, K-T Yong, I Roy, et al. (2011) Acs Nano 5: 413.
Doi:10.1021/nn1018945
[4] F Erogbogbo, KT Yong, I Roy, GX Xu, PN Prasad, MT Swihart (2008) Acs Nano
2: 873. Doi:10.1021/nn700319z
[5] L Pavesi, R Turan (2010) Silicon Nanocystals Fundamentals, synthesis and
Applications. WILEY-VCH
[6] K Abderrafi, RG Calzada, MB Gongalsky, et al. (2011) Journal of Physical
Chemistry C 115: 5147. Doi:10.1021/jp109400v
[7] CM Hessel, D Reid, MG Panthani, et al. (2012) Chemistry of Materials 24: 393.
Doi:10.1021/cm2032866
[8] XG Li, YQ He, MT Swihart (2004) Langmuir 20: 4720. Doi:10.1021/la036219j
[9] X Cheng, R Gondosiswanto, S Ciampi, PJ Reece, JJ Gooding (2012) Chemical
Communications 48: 11874. Doi:10.1039/c2cc35954e
[10] M Keidar (2013) Plasma Engineering: Applications from Aerospace to Bio and
Nanotechnology. Elsevier,
[11] CR Gorla, S Liang, GS Tompa, WE Mayo, Y Lu (1997) Journal of Vacuum Science
& Technology a-Vacuum Surfaces and Films 15: 860. Doi:10.1116/1.580721
[12] G Viera, M Mikikian, E Bertran, PRI Cabarrocas, L Boufendi (2002) Journal of
Applied Physics 92: 4684. Doi:10.1063/1.1506382
[13] G Viera, S Huet, M Mikikian, L Boufendi (2002) Thin Solid Films 403: 467.
Doi:10.1016/s0040-6090(01)01663-7
[14] MA Lieberman, AJ Lichtenberg (2005) Principles of Plasma Discharges and
Materials Processing, 2nd Edition: 1.
[15] YP Raizer (1991) Gas Discharge Physics. Springer, Berlin,
[16] M Hirasawa, T Orii, T Seto (2006) Applied Physics Letters 88.
Doi:10.1063/1.2182018

30
[17] L Mangolini, E Thimsen, U Kortshagen (2005) Nano Letters 5: 655.
Doi:10.1021/nl050066y
[18] ML Brongersma, A Polman, KS Min, E Boer, T Tambo, HA Atwater (1998)
Applied Physics Letters 72: 2577. Doi:10.1063/1.121423
[19] D Jurbergs, E Rogojina, L Mangolini, U Kortshagen (2006) Applied Physics
Letters 88. Doi:10.1063/1.2210788
[20] RAL Jones (2002) Soft Condensed Matter. Oxford University Press,
[21] JP Reeves, RM Dowben (1969) Journal of Cellular Physiology 73: 49.
Doi:10.1002/jcp.1040730108
[22] JM Williams (1991) Langmuir 7: 1370. Doi:10.1021/la00055a014

31
APPENDIX A. MATLAB TRACKING CODE
Some of this Matlab code contains modified programs from [142,143].
PARTICLE TRACKING
fname = '2015 April 30 16_55_28_Substack (1-10000)_1.tif';
%info = iminfo(fname);
out = 0;
set = 10; %you can change this according to the number of img in a complete set(number
of images that are sequentially tracked correct)
MaxGap = 1.5000; %you can change this according to the max # of imgs that can be
fixed.
time = 0.0;
dt = 0.05;
counter = 1;
num_images = 1000;
r2 = 0;
stdev = 19.5;%17.4,18.5,18.2
for k = 1:num_images
A = imread(fname, k);
aa = double(A);
%b=bpass(aa,0,4);
pk = pkfnd3(aa,18000,11);%*9 & 2 for small
cnt = cntrd3(aa,pk,2);%2.3333 for smallcomin
nop = size(cnt);
numberofparticles=nop(1);
for l = 1:numberofparticles
out(counter,4) = time;

32
out(counter,1) = cnt(l,1);
out(counter,2) = cnt(l,2);
out(counter,3) = cnt(l,3);
counter = counter + 1;
end
time = time + dt;
end
rows_out = size(out,1);
PredictedOut = out(1,:);
for j = 2:rows_out
x_j = out(j,1);
y_j = out(j,2);
t_j = out(j,4);
x_jj = out(j-1,1);
y_jj = out(j-1,2);
t_jj = out(j-1,4);
delta_t = round(100*(t_j-t_jj))/100;
delta_x = x_j - x_jj;
delta_y = y_j - y_jj;
if delta_t <= MaxGap
for m = 1:round(delta_t/dt);

33
Ly = delta_y/delta_t;
Lx = delta_x/delta_t;
x_m = x_jj + (Lx*dt*m);
y_m = y_jj + (Ly*dt*m);
t_m = t_jj + dt*m;
V = [x_m y_m -1 t_m];
PredictedOut = [PredictedOut;V];
end
else
N = out(j,:);
PredictedOut = [PredictedOut; N];
end
end
temp = zeros(set,2);
Avg = zeros(set,2);
rows = size(PredictedOut,1);
counter = 0;
%var = 0;
%testVar = zeros(1,2);

34
j=0;
for i = 1:rows
xo = PredictedOut(i,1);
yo = PredictedOut(i,2);
if(i+set-1<=rows)
if i>j
for j=i+1:i+set-1
delta_t = round(100*(PredictedOut(j,4)-PredictedOut(j-1,4)))/100;
xj = PredictedOut(j,1);
yj = PredictedOut(j,2);
if delta_t > MaxGap
temp = zeros(set,2);
t_j = 0;
r2 = 0;
xo = PredictedOut(j,1);
yo = PredictedOut(j,2);
else

35
r2 = ((xj - xo)^2)+((yj - yo)^2);
temp(j-i+1,1) = j-i;
temp(j-i+1,2) = r2;
end
end
Avg = Avg+temp;
%testVar = [testVar;temp];
temp = zeros(set,2);
counter = counter + 1;
%var = [var;j];
end
end
end
%RGB = imread('2015 March 26 13_01_42_Substack (1-10000)_Substack (1).png');
%imshow(RGB);
%Rmin = 5;
%Rmax = 200;

36
%[center, radius] = imfindcircles(RGB,[Rmin Rmax],'Sensitivity',0.9);
% Display the circle
%viscircles(center,radius);
% Display the calculated center
%hold on;
%plot(center(:,1),center(:,2),'yx','LineWidth',2);
%hold off;
HistogramData = [];
for l = 1:size(PredictedOut,1);
Distance = 97 - (sqrt((111-PredictedOut(l,1))^2 + (113- PredictedOut(l,2))^2));
HistogramData = [HistogramData; Distance];
end
Avg = Avg/counter;
param.mem=6000;
param.dim=2;

37
param.good=10;
param.quiet=1;
particles=track(out,100,param);%1.5 for small