the free energy landscape of clusters of attractive hard...
TRANSCRIPT

The Free Energy Landscape of Clusters ofAttractive Hard Spheres∗
Guangnan Meng1, Natalie Arkus2, Michael P. Brenner2 andVinothan N. Manoharan†1,2
1Department of Physics, Harvard University, Cambridge MA2Harvard School of Engineering and Applied Sciences, Harvard University,
Cambridge MA 02138 USA
One sentence summary: Experiments reveal that small clusters of hard sphereswith short-range attractions favor equilibrium structures determined by geometricalrules.
The study of clusters has provided the most tangible link betweenlocal geometry and bulk condensed matter. But experiments havenot yet systematically explored the thermodynamics of even thesmallest clusters. Here we present experimental measurements ofthe structures and free energies of colloidal clusters in which theparticles act as hard spheres with short-range attractions. We findthat highly symmetric clusters are strongly suppressed by rota-tional entropy, while the most stable clusters have anharmonic vi-brational modes or extra bonds. Many of these are subsets of close-packed lattices. As the number of particles increases from 6 to 10we observe the emergence of a complex free energy landscape witha small number of ground states and many local minima.
An isolated system of 10 interacting atoms or molecules will in general adopta structure that differs in symmetry and average energy from that of a bulk liquid,solid, or even a system containing 100 particles. Yet the study of such small clustershas shed light on a wide variety of phenomena in condensed matter physics and
∗This is the authors’ version of the work. It is posted here by permission of the AAAS forpersonal use, not for redistribution. The definitive version was published in Science volume 327 onJanuary 29, 2010, DOI: 10.1126/science.1181263
†To whom correspondence should be addressed; E-mail: [email protected]
1

G. Meng, N. Arkus, M. P. Brenner, V. N. Manoharan, Science 327: 560 (2010)
physical chemistry. Since Frank first predicted (1) that icosahedral short-range orderwould be a hallmark of liquid structure, the study of small cluster geometry hasprovided key insights into the frustration underlying non-equilibrium phenomenasuch as nucleation and the glass transition (2, 3, 4). Experimental studies (5, 6)have confirmed this approach through the discovery of local cluster-like order inbulk liquids and glasses, with recent results (7) suggesting that structural arrest incondensed phases may be related to geometrical constraints at the scale of a fewparticles.
There remain many unresolved questions about cluster geometry and the con-nection to bulk behavior. Although experiments and simulations have determinedthe minimum potential energy clusters for various interactions (8, 9, 10), the likeli-hood of observing a particular cluster structure depends on its free energy (11, 12).What cluster structures are favored by entropy? And how does the competition be-tween potential energy and entropy evolve as the number of particles N approachesthe bulk limit? Experiments on atomic clusters have not systematically exploredthese questions; they are limited by short cluster lifetimes, non-equilibrium condi-tions, and the difficulties of obtaining real-space structures of individual clusters infree space (13).
We report experimental results for the structures and free energies of small equi-librium clusters as a function of N, with N ≤ 10. The experimental system is de-scribed in Fig. 1. We use colloidal particles rather than atoms because we canprecisely control the interactions and directly observe the three-dimensional (3D)structures of the clusters using optical microscopy. To a good approximation ourparticles act as “sticky” hard spheres, arguably the simplest non-trivial interactionthat leads to clustering. The attraction arises from a depletion interaction with arange of about 1.05 times the particle diameter and a depth of about 4kBT . Becausethe pair potential is short-ranged, the total potential energy U of a given structureis well approximated by U =CUm, where C is the number of contacts or depletion“bonds” and Um the depth of the pair potential (14). While in bulk these particlesform a gel, the range and depth of the interaction are consistent with an equilibriumphase diagram showing a fluid-crystal transition. (17).
We create clusters by isolating small numbers of polystyrene (PS) microspheresin cylindrical microwells filled with water and poly(N-isopropylacrylamide) (poly-NIPAM) nanoparticles, which cause the depletion interaction. We chemically func-tionalize the microwells so that particles cannot stick to the surfaces. This allows3D clusters to form in the middle of the wells, unaffected by the boundaries. Af-ter the clusters reach equilibrium, we use optical microscopy to observe the clusterstructures, and we collect statistics by scanning through the microwell plate, whichcontains thousands of isolated clusters. Although the number of particles per well isnot controlled, we generate enough clusters at each N ≤ 10 to measure their occur-rence frequencies. We then determine the free energies from the ensemble statistics
2

G. Meng, N. Arkus, M. P. Brenner, V. N. Manoharan, Science 327: 560 (2010)
20 µmy
x
x
y
30 μm
30 μ
m
U
Um~ 4kBT
r80 nm
1.0 µmr
1.0 μm Polystyrene 80 nm Poly(NIPAM)
N=2 N=3
N=4 N=5
A
D
B C
EMicrowells
Cluster
1 µm
Figure 1: (A) Diagram of experimental system (14). We use lithography to makemicrowells with depth and diameter 30 µm (see also Fig. S1). These are filledwith a suspension of 1.0 µm diameter polystyrene (PS) spheres and 80 nm poly(N-isopropylacrylamide) (polyNIPAM) microgel particles, which induce a depletionattraction as illustrated in (B). The number of PS particles per well varies, but theaverage is about 10. (C) Pair potential as estimated from the Vrij approximationto the Asakura-Oosawa potential. (15, 16). Because the range of the depletion at-traction is less than 1/10 the PS sphere diameter, the interaction is strictly pairwiseadditive. (D) Optical micrograph of microwells with assembled colloidal clusterssuspended inside. The circles highlight individual clusters in different microwells.There are about 104 microwells per slide. (E) High magnification optical micro-graphs of colloidal clusters in microwells with N = 2,3,4,5 particles. These are theonly structures that form for N ≤ 5.
3

G. Meng, N. Arkus, M. P. Brenner, V. N. Manoharan, Science 327: 560 (2010)
through the Boltzmann distribution: ∆F =−kBT lnP, where P is the probability ofobserving a given cluster.
We classify our clusters by comparing them to finite sphere packings. A previ-ous theoretical study (18) enumerated the mechanically stable clusters of idealizedhard spheres with infinitesimally short-ranged interactions, revealing the minimaof the potential energy landscape as a function of N. All of the minima at eachN ≤ 9 have the same potential energy, a situation not observed with longer-rangedpotentials (19). Here we explore the structures and probabilities of these packingsat finite temperature, which allows us to map the free energy landscape (20,21,11).All the observed cluster structures agree with the theoretical predictions. For ex-ample, for N < 6 we observe one unique structure for each N: a dimer for N = 2,trimer for N = 3, tetrahedron for N = 4 and triangular dipyramid for N = 5. Theoptical micrographs in Fig. 1 show the structures of the smallest clusters.
The first interesting case is N = 6. Here we observe two structures (Fig. 2 andFig. S2), both with C = 12 contacts and therefore equivalent potential energy. Thefirst is the octahedron, a Platonic solid. The second we call a “polytetrahedron.” Itconsists of a triangular dipyramid with a third tetrahedron added to one of the faces.We observe transitions between the two states on time scales of minutes, indicatingthat the system is at equilibrium (Movie S1).
Even though these two structures have the same potential energies, the polyte-trahedron occurs about 20 times more often than the octahedron, implying a freeenergy difference of about 3kBT . This difference can be attributed only to entropy.As shown in Fig. 2, the measured probabilities for the two structures agree wellwith theoretical calculations based on standard approximations for the rotationaland vibrational entropies in the classical limit (14).
Notably, the rotational entropy makes the largest contribution to the free energydifference between the two structures (Fig. S2). The rotational partition function isrelated to two geometrical quantities: the number of orientations, which is propor-tional to the moment of inertia, and the rotational symmetry of the cluster, or, alter-natively, the number of ways one can assemble the same cluster by permuting parti-cle labels (22). Formally, the ratio of the permutational degeneracies of two clustersis inversely proportional to the ratio of their symmetry numbers (23). This permu-tational degeneracy accounts for a factor of 12 in the polytetrahedron:octahedronprobability ratio. The remaining factor of 2 comes from the differences in the mo-ments of inertia and the vibrational entropies.
This illustrates a general rule for clusters with short-range attractions: amongclusters with the same potential energy, highly symmetric structures are highly un-favorable at equilibrium. By contrast, for the longer-ranged Lennard-Jones 6-12potential the octahedron has lower potential energy than the polytetrahedron (19),so that the dominant structure depends on temperature. The dominance of the poly-tetrahedron in our system may have consequences for nucleation: the equilibrium
4

G. Meng, N. Arkus, M. P. Brenner, V. N. Manoharan, Science 327: 560 (2010)
C Oh
0
20
40
60
80
100
N = 6
C2v D5h C3v C2 C2 C3v
0
5
10
15
20
25
30
35
N= 7
C1 C1 C1 C1 Cs Cs Td Cs Cs C1 C1 C2v C2v D3d Cs D2d
0
10
20
30
40
50
60
70
80
N= 8
Pro
bab
ility
(%)
Pro
bab
ility
(%)
2v
poly-tetrahedron
octahedron
Figure 2: Comparison of experimental and theoretical (14) cluster probabilities P atN = 6, 7, and 8. Structures difficult to differentiate experimentally have been binnedtogether at N = 7 and N = 8 to compare to theory. The calculated probabilitiesfor the individual states are shown in light gray bars, and binned probabilities indark gray. Red dots indicate the experimental measurements, with 95% confidenceintervals given by the error bars (see (14) and Table S1). Renderings and pointgroups in Schonflies notation are shown for each structure. The number in thesubscript of each symbol indicates the order of the highest rotational symmetryaxis, and the letter indicates the symmetry group. The highest symmetry structuresare those in D, T , and O groups. Structures in C1 and C2 groups occur in chiralpairs.
5

G. Meng, N. Arkus, M. P. Brenner, V. N. Manoharan, Science 327: 560 (2010)
phase of attractive hard spheres is a face-centered cubic (FCC) crystal (17), whichcontains octahedral, not polytetrahedral, subunits.
At N = 7 the first chiral structures arise. We observe six cluster structures, twoof which are chiral enantiomers. The experimental measurements agree well withthe theoretical values for the probabilities of each structure, as shown in Fig. 2.
For these small clusters, the most pronounced influence on the probabilitiescomes from symmetry. At N = 8, three of the 16 different possible sphere packingsnever occur in the experiments. These three structures have the highest symmetrynumbers, σ = 4,6,12.
A few structures differ by such small changes in particle spacing that we cannotdifferentiate between them in our microscope. All of these are variants of pentago-nal dipyramids. In a pentagonal dipyramid of 7 spheres, the top and bottom spheresof the pyramid are separated by a small gap of ≈ 0.05d, where d is the sphere di-ameter. If these two spheres are brought together, a gap of ≈ 0.09d opens betweentwo of the spheres on the pentagon. Because we cannot resolve this gap in our ex-periments, we have binned these structures together at both N = 7 and N = 8. Theone statistically significant discrepancy between experiment and theory occurs atN = 8; it arises because the experimental potential has a range comparable to thegap distance. Although we account for this extra potential energy in the probabil-ity calculations, the probabilities are sensitive to the magnitude of the potential atthe gap distance. If the interaction energy differs from our estimated value by only0.1kBT in the gap, the theoretical calculation falls within error of the experimentalvalue. This difference could be due to polydispersity in either the depletant or largespheres, or to another interaction such as van der Waals forces.
The probability distributions in Fig. 2 are “field guides” to the free energy land-scapes at N = 6, 7, and 8. Each structure represents a local free energy minimum,the depth of which is proportional to the probability. We note two topographicalfeatures besides the trend toward structures with low symmetry: first, the number oflocal minima increases dramatically with N, and second, the landscape is relativelyflat for N = 7 and 8. In other words, there are many shallow minima, but no oneminimum has a free energy much larger than any other.
The landscape undergoes a qualitative change for N ≥ 9. Theoretically we ex-pect some Ω= 77 structures at N = 9 and Ω= 393 at N = 10, too many to catalogueexperimentally. We therefore measure only a subset of structures identified by ourtheoretical study (18). The subset we choose consists of clusters that fall into eitherof two categories: non-rigid structures, in which one of the vibrational modes isa large amplitude, anharmonic shear mode, and structures with more than 3N− 6bonds. Non-rigidity arises when a cluster contains half-octahedra that share at leastone vertex, allowing the cluster to twist over a finite distance without breaking orforming another bond. We expect these packings to have high vibrational entropy.Structures with more than 3N− 6 bonds can occur for N ≥ 10. These are the ex-
6

G. Meng, N. Arkus, M. P. Brenner, V. N. Manoharan, Science 327: 560 (2010)
pected ground states.Indeed, these special packings do occur with high frequency, as shown in Fig. 3
and Table S2. Because most clusters at N = 9 and 10 have equal potential energy,low symmetry, and therefore comparable rotational entropy, we expect the averageprobability of any one structure in a set of Ω possible clusters to be of order 1/Ω. AtN = 9 we expect an average probability of about 1%, and at N = 10, about 0.25%.
By contrast, the one non-rigid structure at N = 9 occurs with P ≈ 10%. Usingthe theoretical Ω and the experimental P we estimate that the free energy of the non-rigid structure is about 2kBT lower than that of an average structure at N = 9 (14).Thus the structure is highly stable, by nearly half the free energy of an extra bond.The stabilization comes from the vibrational entropy associated with the non-rigidmode depicted in Movie S3. Our theoretical calculations (14) predict P ≈ 3%,which is lower than the observed probability but higher than all other clusters at N =9. The discrepancy is due to the sensitive dependence of the vibrational partitionfunction on the curvature of the pair potential near the minimum, a consequence ofthe non-rigid mode. A more precise calculation requires an accurate measurementof electrostatic effects in the experimental pair potential near the depletion well.
At N = 10, only three of the 393 theoretically possible clusters have 3N−5= 25contacts, yet these occur about 10% of the time. Although we have only limitedstatistics for higher N, we continue to observe the prevalence of a few packings with3N−5 or more bonds. The structures with extra bonds have combined probabilitiesof 20−30% at N = 11 and N = 12 (Table S2). Again these probabilities are largecompared to 1/Ω, even though in several cases the clusters have high symmetry.The potential energy gain is therefore large enough to overcome the deficiency inrotational entropy.
Perhaps the most striking feature of these clusters is that many are subsets oflattice packings, and in particular of the hexagonally close packed (HCP) lattice.The lattice packings are marked in Fig. 3. The underlying reason appears to be thatboth non-rigidity and extra bonds require the clusters to have octahedral subunits.The propensity for icosahedra (8, 24) in longer-range systems is absent in ours. Weobserve no icosahedra at either N = 12 or N = 13, presumably because neither12-sphere or 13-sphere icosahedra are special clusters for short-range interactions:neither are non-rigid, neither have more than 3N−6 bonds, and both have very highsymmetry numbers (σ = 60).
Using the same statistical mechanical approximations used to estimate probabil-ities for N ≤ 8, we can calculate the free energies of all mechanically stable spherepackings that have been enumerated (18) up to N = 10. This yields the free energylandscape shown in Fig. 4. We see that in general the locus of states is correlatedwith the rotational entropy, which is proportional to kB ln
(√I/σ
). The only states
that lie below this locus occur at N = 9 and 10. These correspond to either non-rigidstructures or structures with extra bonds, both of which appear as deeper minima.
7

G. Meng, N. Arkus, M. P. Brenner, V. N. Manoharan, Science 327: 560 (2010)
A
1.0 μmHCPC2v
P=11%
P=21%B
HCPCs
HCPC1
C1
P=12%C
HCP
C2v
FCC/HCPD2h
HCPCs
non-rigid, N=9
non-rigid, N=10
25 bond, N=10
Figure 3: (A) Optical micrographs and renderings of non-rigid structures at N = 9(see also Movies S2 and S3) and (B) N = 10 (Movies S4–S6). (C) structures of3N − 5 = 25 bond packings at N = 10 (Movies S7–S9). The anharmonic vibra-tional modes of the non-rigid structures are shown by red arrows. Experimentallymeasured probabilities are listed at top. Annotations in micrographs indicate clus-ters corresponding to subsets of hexagonally close-packed (HCP) or face-centeredcubic (FCC) lattices.
8

G. Meng, N. Arkus, M. P. Brenner, V. N. Manoharan, Science 327: 560 (2010)
Rotational partition function =p
I /σ
Free
Ene
rgy
in u
nits
of
k BT
6−3
−1
−3
−1
−3
−1
−5
−3
−1
0 2 4 6 8 10 12 14
−7
−5
−3
−1
16
Extra bonds
Non-rigid
N
9
8
7
10
Figure 4: Calculated minima of the free energy landscape for 6 ≤ N ≤ 10 (14). x-axis is in units of the rotational partition function, where I is the moment of inertia(calculated for a particle mass equal to 1) and σ the rotational symmetry number.The bond strength for the calculation is Um = 4kBT . Each black symbol representsthe free energy of an individual cluster. The number of spokes in each symbolindicates the symmetry number (dot=1, line segment=2, and so on). Red symbolsare non-rigid structures, which first appear at N = 9, and violet symbols have extrabonds, first appearing at N = 10. Vertical gray lines indicate the contribution tothe free energy due to rotational and vibrational entropy. The reference states arechosen to be the highest free energy states at each N. The general trend is for lowsymmetry states to be favored in proportion to their rotational entropy, kB ln(
√I/σ).
The potential energy contribution accounts for the vertical space between the violetsymbols and their gray lines.
9

G. Meng, N. Arkus, M. P. Brenner, V. N. Manoharan, Science 327: 560 (2010)
The diagram also reveals some new features. First, low-symmetry polytetrahe-dral states proliferate as N increases. At N = 10, where clusters with extra bondsfirst appear, the absolute probability of observing these ground states is low becauseof the large number of low-symmetry states that lie at slightly higher free energy.
Second, the highest free energy structures for N = 6−10 are convex deltahedra(25), polyhedra with a long history in condensed matter physics (26, 3). These arenot always the most symmetric structures: at N = 8 the highest free energy stateis the deltahedron, a snub disphenoid, which has lower symmetry than an 8-spheretetrahedral cluster. The convex deltahedra also happen to be the same “minimal-moment” structures formed in capillary-driven assembly of colloidal particles (27).The optimal packings under these non-equilibrium conditions therefore correspondto the least optimal packings at equilibrium.
Our results suggest that nucleation barriers and structural motifs in attractivehard sphere systems such as colloidal suspensions will be different from those insystems with longer-range potentials, which tend to favor symmetric structures atsufficiently low temperatures. For N < 9 all of our clusters have nearly equiva-lent potential energy, and therefore the rotational entropy selects against symmetricstructures at all temperatures. Specifically, the symmetry number and the permuta-tional degeneracy have the greatest effect on the free energy; differences in momentof inertia do not contribute as much. Thus even if cluster rotations are hindered, asthey may be in a bulk supercooled liquid, the permutational degeneracy might stillinfluence the probability of formation. At higher N the most probable structures weobserve involve combinations of octahedra and tetrahedra. Many of these structuresare compatible with an HCP lattice but not FCC. Our results also suggest that thecurvature of the pair potential near the minimum should affect nucleation, becausethe curvature determines the free energy of the non-rigid clusters.
Structures with five-fold symmetry such as the pentagonal dipyramid and icosa-hedron are highly unfavorable in our system. Therefore we do not expect icosahedraor other clusters with five-fold symmetry to be a structural motif in attractive hardsphere gels or fluid cluster phases (28) where the attraction is short-ranged.
In conclusion, we find that the most stable small clusters of hard spheres withshort-ranged attractions can be determined by geometrical rules: (1) rotational en-tropy favors structures with fewer symmetry elements; (2) vibrational entropy fa-vors non-rigid clusters, which have half-octahedral substructures sharing at leastone vertex; and (3) potential energy favors clusters with both octahedral and tetra-hedral substructures, allowing them to have extra bonds.
Our picture of the free energy landscape is still incomplete. The qualitative fea-tures of the landscape are independent of temperature for our experimental systembecause the depletion interaction is fundamentally entropic (14). This will not be thecase for other types of interactions, such as DNA-mediated attractions (29). Also,under non-equilibrium conditions we expect a different distribution of structures
10

G. Meng, N. Arkus, M. P. Brenner, V. N. Manoharan, Science 327: 560 (2010)
then the ones shown here. Finally, our model for the landscape does not account forenergy barriers or the connectivity between minima. It will be interesting to see iffurther studies can explain the emergence of bulk crystallization or structural arrestin terms of these topographical features and their geometrical underpinnings.
References and Notes1. F. C. Frank, Proc. R. Soc. London, Ser. A 215, 43 (1952).
2. F. H. Stillinger, T. A. Weber, Science 225, 983 (1984).
3. D. Nelson, F. Spaepen, Solid State Phys. 42, 1 (1989).
4. J. P. K. Doye, D. J. Wales, Science 271, 484 (1996).
5. H. Reichert, et al., Nature 408, 839 (2000).
6. H. W. Sheng, W. K. Luo, F. M. Alamgir, J. M. Bai, E. Ma, Nature 439, 419(2006).
7. C. P. Royall, S. R. Williams, T. Ohtsuka, H. Tanaka, Nat. Mater. 7, 556 (2008).
8. M. Hoare, P. Pal, Adv. Phys. 24, 645 (1975).
9. M. Hoare, J. McInnes, Adv. Phys. 32, 791 (1983).
10. D. J. Wales, et al., Cambridge cluster database, http://www-wales.ch.cam.ac.uk/CCD.html (2008).
11. D. J. Wales, T. V. Bogdan, J. Phys. Chem. B 110, 20765 (2006).
12. J. P. K. Doye, F. Calvo, J. Chem. Phys. 116, 8307 (2002).
13. R. L. Johnston, Atomic and molecular clusters (CRC Press, 2002).
14. Materials and methods are available as supporting material on Science Online.
15. S. Asakura, F. Oosawa, J. Chem. Phys. 22, 1255 (1954).
16. A. Vrij, Pure Appl. Chem. 48, 471 (1976).
17. V. Anderson, H. Lekkerkerker, Nature 416, 811 (2002).
18. N. Arkus, V. N. Manoharan, M. P. Brenner, Phys. Rev. Lett. 103, 118303 (2009).
19. M. Hoare, P. Pal, Adv. Phys. 20, 161 (1971).
11

G. Meng, N. Arkus, M. P. Brenner, V. N. Manoharan, Science 327: 560 (2010)
20. C. Brooks, J. N. Onuchic, D. J. Wales, Science 293, 612 (2001).
21. K. Dill, H. Chan, Nat. Struct. Biol. 4, 10 (1997).
22. Our particles are macroscopic and therefore distinguishable in principle. Butwe do not distinguish the particles in either the octahedral or polytetrahedralmacrostate. The rotational partition function is therefore exactly the same as ifwe were to assume the particles to be indistinguishable.
23. G. Franke, E. R. Hilf, P. Borrmann, J. Chem. Phys. 98, 3496 (1993).
24. J. Doye, D. Wales, J. Chem. Soc. Faraday Trans. 93, 4233 (1997).
25. N. Johnson, Can. J. Math. 18, 169 (1966).
26. J. Bernal, Nature 185, 68 (1960).
27. V. Manoharan, M. Elsesser, D. Pine, Science 301, 483 (2003).
28. A. Stradner, et al., Nature 432, 492 (2004).
29. P. Biancaniello, A. Kim, J. Crocker, Phys. Rev. Lett. 94, 058302 (2005).
30. We thank Frans Spaepen and Zhengdong Cheng for helpful discussions. We ac-knowledge support from the National Science Foundation under award numbersDMR-0820484, CBET-0747625, and DMS-0907985 and DARPA under con-tract BAA 07-21.Supporting Online Materialwww.sciencemag.orgMaterials and MethodsFigs. S1, S2Tables S1, S2Movies S1 to S9
12
The Free Energy Landscape of Clusters of Attractive Hard Spheres
Supporting Online Material
Guangnan Meng,1 Natalie Arkus,2 Michael P. Brenner,2 Vinothan N. Manoharan1,2∗
1Department of Physics, Harvard University, Cambridge MA 02138 USA2Harvard School of Engineering and Applied Sciences, Harvard University, Cambridge MA 02138 USA
∗To whom correspondence should be addressed; E-mail: [email protected]
Materials and Methods
1 Preparation of Particles, Microwells, and Clusters
The model colloidal suspension we use consists of two types of particles, large polystyrene (PS) spheres,and small poly(N’-Isopropylacrylamide) (poly(NIPAM)) spheres, which are used as a depletion agent tocause the larger spheres to attract one another. We synthesized the poly(NIPAM) spheres along with a thirdtype of particle, poly(N’-Isopropylacrylamide-co-Acrylic Acid) (poly(NIPAM-co-AAC)) particles, whichwere used to coat the microwells and prevent the large PS particles from sticking to them.
1.1 Synthesis of poly(NIPAM) Hydrogel Particles
We use precipitation polymerization to synthesize poly(N’-Isopropylacrylamide) hydrogel particles. 2 g ofN’-Isopropylacrylamide (NIPAM, monomer, 99%, Acros Organics), 25 mg N,N’-Methylenebisacrylamide(crosslinker, 99%, Promega), and 0.18 g (≈6 mM) sodium dodecyl sulfate (SDS, 99%, EMD Chemicals)were dissolved in 98 mL deionized (DI) water (Milli-Q synthesis grade, Millipore). The solution wasstirred and heated to 70°C under nitrogen for 30 minutes to remove extra oxygen in the solution. 25 mgof potassium persulfate (KPS, 99%, Acros) were dissolved in 2 ml DI water and loaded into the reactorto start the polymerization reaction. The reaction ran for 4 hours. Afterward, the poly(NIPAM) hydrogelparticles were cleaned by dialysis against DI water for seven days, with water changes every 24 hours. Weused a Zetasizer Nano ZS (Malvern Instruments) to measure the size of poly(NIPAM) hydrogel particles.The hydrodynamic diameter of our particles was 80 nm at 20°C and 40 nm at 40°C in DI water.
We synthesized a separate batch of poly(N’-Isopropylacrylamide-co-Acrylic Acid) (poly(NIPAM-co-AAc)) hydrogel particles to coat the microwell boundaries and glass substrate. This makes the microwellboundaries rough and prevents polystyrene particles from sticking to them through depletion interactions.The poly(NIPAM-co-AAc) hydrogel particles were synthesized using the same procedure as the 80 nmpoly(NIPAM) particles, except that we added 25 mg acrylic acid (99%, Sigma) to the reactants.
1.2 Fabrication and Surface Modification of Hydrogel Microwell Plates
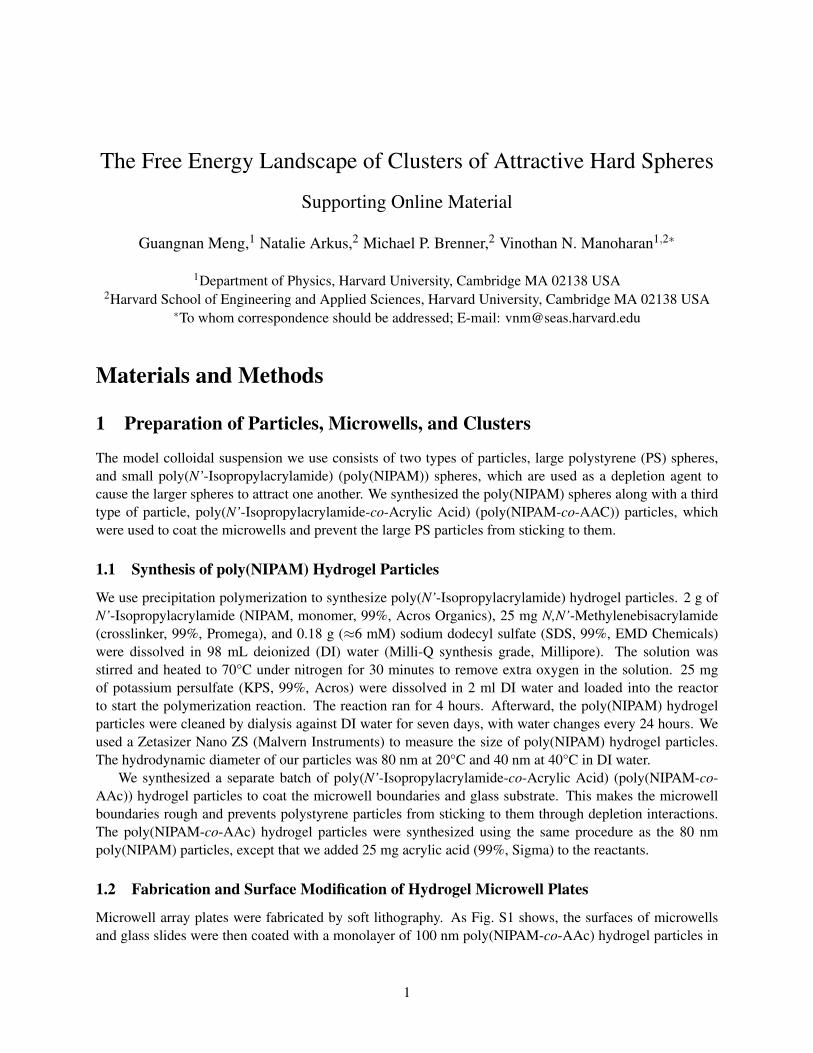
Microwell array plates were fabricated by soft lithography. As Fig. S1 shows, the surfaces of microwellsand glass slides were then coated with a monolayer of 100 nm poly(NIPAM-co-AAc) hydrogel particles in
1

order to prevent a depletion attraction between the PS particles and the boundaries. The fabrication involvedthe following steps:
1. Design of photomask: A photomask pattern was designed in AutoCAD (Autodesk Inc.). The pattern(20mm×20mm) has an array of circles 30 µm in diameter with a pitch of 60 µm on a square lattice.The pattern was printed on a photomask transparency at 20,000 dpi resolution by CAD/Art Services,Inc. (http://www.outputcity.com/)
2. Fabrication of SU-8 master mold. Under a clean room environment, a master mold of SU-8 photoresist(MicroChem Corp.) layer with the microwell pattern was fabricated on a silicon wafer by standardphotolithography procedures (S1 ). The SU-8 3035 was spin-coated at 3000 rpm onto a silicon wafer(University Wafer), setting the thickness of the SU-8 layer at 35 µm (http://www.microchem.com/products/su_eight.htm).
3. Silanization of hydrogel-side cover slips and top glass slides: Precleaned No. 1 cover slips (24mm×30mm, VWR) were silanized so that they could later be covalently bonded to the hydrogel. Thesame procedure was performed for precleaned glass slides (25mm×75mm, VWR), which were laterbonded to poly(NIPAM-co-AAc) particles. Cover slips were immersed in 1.0% w/w 3-Methacryloxy-propyltrimethoxysilane (98%, Sigma) in anhydrous ethanol solution for 24 hours at room temperature.Glass slides were immersed in 1.0% w/w (3-Aminopropyl)triethoxysilane (98%, Sigma) in anhydrousethanol solution for 24 hours at room temperature. Then the cover slips and glass slides were rinsedwith anhydrous ethanol and blow-dried with compressed air. The silanization was completed byleaving the cover slips and glass slides in an oven at 110°C for one hour.
4. Hydrogel microwell fabrication: Pre-gel solution was prepared by dissolving 10% w/w acrylamide(99%, Promega), 0.5% w/w N,N’-Methylenebisacrylamide (crosslinker,99%, Promega), 0.5% w/wallylamine (98%, Alfa Aesar) and 0.1% w/w DAROCUR 1173 (photoinitiator, Ciba) in DI water. Thepre-gel solution was poured onto the SU-8 master mold and covered by putting the silanized coverslip on top. The solution was placed 10 cm from an UV lamp (B-100YP, UVP) for 10 minutes topolymerize the hydrogel. The polymerized microwell plate was carefully separated from the SU-8master mold, rinsed with DI water, and stored in DI water.
5. Surface coating of hydrogel microwell plates and glass slides: The surfaces of the hydrogel microwellplate and top glass slide were coated with a monolayer of 100 nm poly(NIPAM-co-AAc) hydrogelparticles. The fabricated hydrogel microwell plate and silanized glass slides were immersed in adialyzed colloidal suspension of 100 nm poly(NIPAM-co-AAc) particles for 24 hours at room tem-perature. Afterward the poly(NIPAM-co-AAc) hydrogel particles were irreversibly adsorbed onto thesurfaces. After this surface treatment, we were able to form 3D colloidal clusters of PS spheres in themiddle of the microwells. Without the surface treatment, PS spheres formed 2D crystallites on theboundaries of the microwells.
1.3 Sample Preparation
The aqueous colloidal suspension added to the microwells was a mixture of 1.0 µm sulfate latex polystyrene(PS) particles (Batch# 2090,1, Molecular Probes, polydispersity (standard deviation in particle diame-ter)=3%) and 80 nm poly(NIPAM) hydrogel particles in water. The concentration of PS was 10−3% w/vand poly(NIPAM) 1.0% w/w (the volume fraction is estimated to be φs ≈ 25% at 20°C). 15 mM NaCl wereadded to screen the long-ranged electrostatic repulsion between the PS particles. 0.1% w/w Pluronic P123(BASF) surfactant was also added to stabilize the PS particles in the salt. This procedure ensured that the
2

depletion attraction between polystyrene particles induced from poly(NIPAM) could be reversed by dilutingthe poly(NIPAM) particles.
The hydrogel microwell plate and glass slides were rinsed with the PS/poly(NIPAM) suspension at least5 times so that the hydrogel plate had the same ionic and surfactant concentration as the suspension. Afterthe last rinse, the wells were filled with the suspension, and the microwell plate and glass slide were sealedwith epoxy (Devcon 5-minute epoxy) around the edges of the cover slip. The number of particles N per wellwere randomly distributed with a mean of about 10. Before putting the sample on the optical microscopefor observation and counting, we waited 24 hours for the system to reach equilibrium at 22.0± 1.0°C. Wefound that the hydrogel microwells tend to deform 10 days after sample preparation, so the observation anddata collection was done within 7 days, and the sample was discarded afterward.
Under these experimental conditions, the colloidal clusters could transit between different mechanicallystable configurations (Movie S1), demonstrating that the system is at equilibrium.
2 Experimental Methods
2.1 Data Acquisition
We used an inverted optical microscope (Eclipse TE-2000, Nikon Corp.) equipped a 100X objective(N.A.=1.4) and Nomarski differential interference contrast to observe the structures of the colloidal clus-ters. The images and videos (720× 720, 40 frames per second) were digitally recorded by CCD cameras(Digital Sight DS-5Mc, Nikon Corp. for still images, and EO-0312C, Edmund Optics for movies) onto apersonal computer. We scanned sequentially through the microwells and recorded videos of clusters in eachbefore analyzing the data.
2.2 Structure Identification
We resolved the 3D structures of colloidal clusters by scanning through the recorded videos frame by frame.Although the microscope captures a 2D image with narrow depth of field, over time we can image all theparticles in the cluster due to the Brownian rotational motion. We map out the nearest neighbors for eachparticle by looking at the 2D image and following it as the structure rotates in 3D space. We then comparethis data to the contact matrices or computer renderings of different finite sphere packings identified in (S2 ).
2.3 Counts and Error Analysis
We calculated the probabilities of each structure from the number of occurrences in four different mi-crowell arrays. To estimate the sampling error we used the Wilson score interval method (S3 ) (http://faculty.vassar.edu/lowry/prop1.html) to estimate the lower and upper limits of the 95% confi-dence interval. For the small probabilities observed in our experiments, this method gives a much moreaccurate approximation of the confidence interval than a normal approximation to the multinomial distribu-tion. The experimental statistics are shown in Table S1. Table S2 summarizes the experimental statistics ofclusters for 9≤ N ≤ 12.
3 Theoretical Methods
In the experiment, we measure the probability of structure s, where s is determined by comparison to thesphere packings enumerated in (S2 ). In order to calculate the expected theoretical probability and otherthermodynamic parameters for s, we start with the theoretically calculated coordinates for s. For eachenumerated packing we know the equilibrium positions of all the particles, r0
i = (x0i ,y
0i ,z
0i ). With these
3

coordinates, we calculate the potential energy Us, the partition function Zs, and the free energy Fs using themethods below.
Calculations were done on an Intel-based desktop computer in the Python language (http://www.python.org) with the SciPy extensions (http://www.scipy.org).
3.1 Pair Potential
In our calculation of the potential energy we consider two major interactions between two PS particles, thedepletion attraction UAO and an electrostatic repulsion UDLVO. UAO was modeled by the Asakura-Oosawadepletion theory in a binary spherical mixture (S4–S6 ):
UAO(r) =−kBTφs
(2as)3 (2as +2al− r)2× (2as +2al +r2) (1)
where r is the center-to-center distance between two PS particles, φs the volume fraction of poly(NIPAM)depletant (≈ 25%), and al and as the radii of the large PS particles (500 nm) and small poly(NIPAM) (40nm) depletants. The range of the interaction is the diameter of the poly(NIPAM) depletant 2as = 80nm.
The surfaces of PS particles have negatively-charged sulfate groups. When two PS particles are veryclose to each other (ri, j ' 2al = 1.0 µm), there is a screened Coulomb repulsion between them. This modifiesthe shape of the depletion well at small separation:
UDLVO(r) = kBT Z2λB
(eκal
1+κal
)2 e−κr
r(2)
where Z is surface charge valence per PS particle, λB is Bjerrum length, κ−1 is the Debye screen length(S7 ). For our experimental conditions, Z = 7.6×10⁵ (from manufacturer), λB = 0.7nm, and κ−1 = 2nm.
The pair potential U(r) we use for calculations is the summation of the depletion attraction and Coulombrepulsion:
U(r) = UAO(r)+UDLVO(r). (3)
The pair potential has a minimum at 1.02d, where d is the sphere diameter. We therefore normalize alldistances in the problem to the position of the minimum. The calculated well depth is about 2kBT . Thetrue well depth in our system is probably closer to 4kBT , as estimated from the typical time for clusterrearrangements, which is on the order of tens to hundreds of seconds. A better theoretical estimate of thewell depth requires a measurement of the true surface charge of the particles. In calculating the free energylandscape (Figure 4), we chose Z = 6.4×10⁴, which gives a potential depth of 4kBT at a distance of 1.005d.All other calculations used the parameters given above.
The attractive interaction is short-ranged compared to the PS particle diameter. Because the ratio of thelarge to small sphere diameters is large, the total potential energy of a colloidal cluster is pair-wise additive.
U = ∑i, j
U(ri j) = ∑i, j
U(|ri− r j|). (4)
The details of the potential have little effect on the calculated free energy except in two cases: non-rigidclusters and clusters derived from the pentagonal dipyramid. For non-rigid clusters the curvature of the wellaffects the integral in Eq. 13. For clusters with gaps within the range of the potential a small difference(0.1kBT ) in the magnitude of the potential at the gap distance can have a significant (≈ 5%) effect on thesummed probabilities in Table S1.
4

3.2 Free Energy, Entropy and Partition Function
In the canonical ensemble (NV T ) ensemble, the probability Ps of a state s is given by the Boltzmann distri-bution:
Ps ∝ e−βFs = Zse−βUs , (5)
where Zs is the partition function and Fs is the Helmholtz free energy of state s. We calculate the internalpartition function Zs and then use Eq. 5 to calculate the free energy Fs of a structure s (S8 ).
The entropy of the cluster is proportional to the internal partition function Zs. Zs can be written as theproduct of three approximately independent terms:
Zs = Zt,sZr,sZv,s (6)
where Zt,s is the translational partition function, Zr,s the rotational partition function, and Zv,s the vibrationalpartition function for a colloidal cluster s.
The translational partition function is proportional to the free volume that the structure can explore.Because the volume of the microwell (≈ (30µm)3 = 3×104µm3) is much larger than the size of a cluster(≈ 10µm3), the free volume is approximately the same for all clusters, and the boundaries have no effect onthe cluster configurations. Thus we assume Zt,s to be the same for all clusters.
3.3 Rotational Partition Function
The rotational partition function reflects the number of orientations and particle permutations of the cluster.
Zr = cr
√I
σ, (7)
where cr, a product of the temperature and fundamental constants, is the same for all clusters, I the deter-minant of the moment of inertia tensor, and σ the rotational symmetry number. We calculate I from thecoordinates ri of the particles assuming the mass of each particle mi is the same. We normalize the massesto 1 for the calculations of I shown in the paper.
To calculate σ we use an algorithm for symmetry detection (S9 , S10 ). This algorithm identifies thepoint group, which also allows us to determine which structures are chiral. These correspond to clusters inC1 or C2 groups, with no v or h subgroups.
3.4 Vibrational Partition Function
To calculate the vibrational partition function we assume that the vibrations of each particle about its equi-librium position are harmonic. The total potential energy U can be expanded around the equilibrium config-uration:
U(ri) = U(r0i +δri) = U0 +
3N
∑i, j
∂ 2U∂xi∂x j
δxiδx j +O(x4) (8)
≈U0 +12
3N
∑α
kαq2α (9)
where xi are the Cartesian coordinates of each individual particle xi ∈ x1,y1,z1,x2, . . .zN and qα is theinternal coordinate of the structure.
5

The vibrational motions are separated into different non-interacting modes, the normal modes (S11 ).The normal mode spring constants kα are calculated by numerically solving for the eigenvalues of theHessian:
Hi j =∂ 2U
∂xi∂x j. (10)
The Hessian is calculated from numerical derivatives of the pair potential. H has 3N eigenvalues, six ofwhich are zero, corresponding to translational and rotational degrees of freedom. The other 3N−6 are thespring constants of the vibrational modes. A vibrational mode with eigenvalue kα has vibrational partitionfunction:
Zv,α ∝
∫ +∞
−∞
e−βU(qα )dqα =∫ +∞
−∞
e−12 βkα q2
α =√
2π
kα
, (11)
where qα is the coordinate of the normal mode α .The vibrational partition function of a cluster is the product of the partition functions of each individual
Zv,α :
Zv = cv
3N−6
∏α
√2π
kα
. (12)
where cv is a constant that is the same for all clusters.
3.5 Vibrational Partition Function for Non-Rigid Structures
The normal mode analysis overestimates the partition function for a non-rigid structures because the non-rigid mode has a zero eigenvalue. To approximate the partition function for non-rigid structures we mustfirst find the normal mode eigenvectors, then integrate the Boltzmann factor along the non-rigid mode eigen-vector. Because the non-rigid mode has a zero-eigenvalue, we first “shift” the translational and rotationaleigenvalues to a non-zero constant in order to keep these modes from mixing with the non-rigid mode (S12 ).We then solve for the 3N−7 normal mode eigenvalues and the null-space of the matrix (which contains onlythe non-rigid eigenvector) using singular value decomposition.
If the non-rigid mode has index α = 0, then its contribution to the partition function is:
Zv,0 ∝
∫ +∞
−∞
e−βU(q0)dq0, (13)
where the integral is taken along the non-rigid eigenvector, and the potential energy is calculated numericallyfrom the pair potential. To calculate the vibrational partition function we multiply the 3N−7 normal modepartition functions (Eq. 11) by the numerically integrated partition function for the non-rigid mode.
3.6 Calculation of Probabilities and Free Energies
We calculate the internal partition function up to a constant, Ztcrcv at a given particle number N. Thisconstant is the same for all clusters, so it cancels when we compute the probability:
Ps =Zse−βUs
∑Ps(14)
Given the coordinates of individual particles ri, the internal partition function Zs is calculated from Eq. 6,and potential energy Us is calculated from Eq. 4. We then use the Boltzmann distribution to calculate thefree energy of structure s:
Fs =−kBT lnPs−F0, (15)
6

where F0 is the reference free energy for a given N. For each N we use the highest free energy cluster as thereference state.
The depletion interaction is entropic in origin. Although we have chosen to include the depletion po-tential in the internal energy term U of the free energy, it scales linearly with T , so that any ratio of theprobabilities of two structures is also independent of temperature.
7

Figures and Tables
100 nm poly(NIPAM-co-AAc)Hydrogel
Top Glass Slide
Bottom Cover Slip
Fig. S1. Schematic view of surface treatment of microwells and glass slides. Boundaries of microwells arecoated with monolayers of 100 nm poly(NIPAM-co-AAc) hydrogel particles to prevent a depletion attractionbetween the PS particles and planar surfaces.
8

ContactsSymmetry numberMoment of inertia 1/2
ZrZv
Predicted PObserved P
12242.80.12
0.034
4.0%4.3%
Octahedron
1.0 μm
Oh
122
3.21.6
0.061
96.0%95.7%
Polytetrahedron
1.0 μm
C2v
(rotational)(vibrational)
Fig. S2. Comparison of polytetrahedral and octahedral clusters at N = 6. Top shows optical micrographsand renderings of the two structures with point groups indicated in Schonflies notation, and bottom the en-tropic contributions to the probability of each. Zr is the rotational partition function and Zv the vibrationalpartition function. The predicted probability of formation is calculated from the product ZvZr. The maincontribution to the probability comes from the rotational partition function through the symmetry num-ber. The calculated ratio of probabilities is 24 : 1, which agrees well with the experimental data (see alsoTable S1).
9

Table S1. Number of observations and probabilities of clusters at N = 6, 7, and 8. “Graph #” is a uniqueidentifier for each cluster at each N, calculated from the contact graph generated by version 2.2 of theprogram NAUTY (http://cs.anu.edu.au/~bdm/nauty/; see also (S2 ) for details of the sphere packingcalculations). An asterisk (*) following the graph number indicates a chiral enantiomer. “Index” correspondsto the position of each cluster in the plots of Fig. 2. Index 1 corresponds to the leftmost cluster at each N. A Σ
symbol indicates a sum of probabilities of several similar structures, used to compare to experiment. “PointGroup” is given in Schonflies notation. σ is the rotational symmetry number of the cluster, and Ptheo is thetheoretical probability, calculated as described in the theoretical methods section. “Counts” is the numberof times a packing was observed experimentally. We use the Wilson score interval method to estimate the95% confidence intervals of the experimentally measured probabilities Pexp.
N Index Graph # Point Group σ Ptheo Counts Pexp (95% conf. inter.)
6 1 2 C2v 2 96.00% 266 95.68% (92.38% – 97.64%)2 4 Oh 24 4.00% 12 4.32% (2.27% – 7.36%)
7 1 4 C2v 2 24.29%2 22 D5h 10 2.83%∑1 : 2 27.12% 51 26.4% (20.5% – 33.3%)3 8 C3v 3 16.20% 29 15.0% (10.5% – 21.0%)4 17 C2 2 24.29% 50 25.9% (20.0% – 32.8%)5 17∗ C2 2 24.29% 48 24.9% (19.1% – 31.7%)6 26 C3v 3 8.10% 15 7.8% (4.6% – 12.7%)
8 1 82 C1 1 9.28%2 82∗ C1 1 9.28%3 77 C1 1 9.28%4 77∗ C1 1 9.28%5 224 Cs 1 8.94%6 271 Cs 1 5.40%∑1 : 6 51.44% 76 66.7% (56.6% – 74.5%)7 27 Td 12 0.77% 0 0.0% (0.0% – 4.0%)8 107 Cs 1 9.28% 7 6.1% (2.7% – 12.6%)9 366 Cs 1 9.28% 12 10.5% (5.7% – 17.9%)10 374 C1 1 9.28% 7 6.1% (2.7% – 12.6%)11 374∗ C1 1 9.28% 4 3.5% (1.1% – 9.2%)12 204 C2v 2 2.32% 3 2.6% (0.7% – 8.0%)13 294 C2v 2 2.32% 1 0.9% (0.05% – 5.5%)14 397 D3d 6 0.77% 0 0.0% (0.0% – 4.0%)15 358 Cs 1 4.64% 4 3.5% (1.1% – 9.2%)16 408 D2d 4 0.64% 0 0.0% (0.0% – 4.0%)
10

Table S2. Number of observations and probabilities of clusters for 9 ≤ N ≤ 12. Clusters are categorizedby number of bonds and rigidity. “Counts” is the number of times a packing was observed experimentally.We use the Wilson score interval method to estimate the 95% confidence intervals for the experimentallymeasured probabilities Pexp.
N Number of bonds Rigidity Counts Pexp (95% conf. inter.)
9 21 (3N−6) Non-Rigid 4 11% (4%–27%)21 (3N−6) Rigid 32 89% (73% – 96%)
10 25 (3N−5) Rigid 4 12% (4% – 29%)24 (3N−6) Non-Rigid 7 21% (10% – 39%)24 (3N−6) Rigid 22 67% (48% – 81%)
11 29 (3N−4) Rigid 2 7% (1% – 24%)28 (3N−5) Rigid 7 24% (11% – 44%)27 (3N−6) Rigid 20 69% (49% – 84%)
12 33 (3N−3) Rigid 0 0% (0% – 34%)32 (3N−4) Rigid 1 10% (0.5% – 46%)31 (3N−5) Rigid 1 10% (0.5% – 46%)30 (3N−6) Rigid 8 80% (44% – 96%)
11

References
S1. D. B. Weibel, W. R. DiLuzio, G. M. Whitesides, Nature Reviews Microbiology 5, 209 (2007).S2. N. Arkus, V. N. Manoharan, M. P. Brenner, Phys. Rev. Lett. 103, 118303 (2009).S3. R. Newcombe, Statistics In Medicine 17, 857 (1998).S4. S. Asakura, F. Oosawa, J. Chem. Phys. 22, 1255 (1954).S5. A. Vrij, Pure Appl. Chem. 48, 471 (1976).S6. J. Crocker, J. Matteo, A. Dinsmore, A. Yodh, Phys. Rev. Lett. 82, 4352 (1999).S7. W. B. Russel, D. A. Saville, W. R. Schowalter, Colloidal dispersions (Cambridge University Press,
Cambridge, 1989).S8. J. P. Sethna, Statistical mechanics: entropy, order parameters, and complexity, vol. 14 (Oxford Uni-
versity Press, Oxford, 2006).S9. J. C. Cole, et al., Acta Crystallographica Sect. B 57, 88 (2001).
S10. T. W. Shattuck, ABC rotational constant calculator, http://www.colby.edu/chemistry/PChem/scripts/ABC.html.
S11. E. Eyal, L. W. Yang, I. Bahar, Bioinformatics 22, 2619 (2006).S12. R. E. Tuzun, D. W. Noid, B. G. Sumpter, C. Yang, Macromolecular Theory and Simulations 11, 711
(2002).
12