the freight transport and logistical system of ghana - viloro · cdr working paper 01.2 centre for...
TRANSCRIPT

CDR Working Paper 01.2 Centre for Development Research • Copenhagen
The Freight Transport and Logistical System of Ghana Poul Ove Pedersen Working Paper Subseries on Globalisation and Economic Restructuring in Africa no. xii
CDR Working Paper 01.2 March 2001

CDR Working Paper 01.2 Centre for Development Research • Copenhagen
© The author and Centre for Development Research, 2001 Published and distributed by Centre for Development Research Printed in Denmark by Centre for Development Research
ISSN 0904-4701
ISSN 1399-3402
Keywords: Freight Road transport Sea transport Transport Transport infrastructure Ghana
The Working Paper Subseries on Globalisation and Economic Restructuring in Africa are published within the framework of CDR Working Papers (green series). The papers are draft works produced as part of the research programme under this title, based jointly at the Centre for Development Research and the Institute of Geography, Copenhagen University. The programme started in 1998. From 1999 the programme will enjoy support from the Danish Social Science Research Council and the Danish Council for Development Research. It studies local, national and international dimensions of current changes in a series of global commodity chains emanating, in part at least, from Africa. For further information on the programme, please contact Peter Gibbon (e-mail address [email protected]). CDR Working Paper Subseries are available on an exchange basis and individual titles are supplied free of charge.

Sekondi
Accra
Cape Coast
Kumasi
Bolgatanga
KoforiduaAwaso
Sunyani
Tamale
Ho
Tema
Wa
Bekwai
Obuasi
Nadawli
Lawra
Sawla
Bole
Bamboi
Techiman
Kintampo
Nkawkaw
Wenchi
Ejura
Mampong
Goaso
Bibiani
Dunkwa
Tarkwa
Huni ValleyPrestea
Kojokrom
Takoradi
Axim
Foso
Oda
Kade
Winneba
AchiasiJunction
Buipe
Yejl
Kwadjokrom
Kantankufri
Dumbai
Bimbila
Tumu
Nsawam
Hohoe
KotokuJunction
keta
Yendi
Shai Hills
Wulugu
NavrongoBawku
B U R K I N A F A S O
T O G OI V O R Y
C O A S T
T O G O
G H A N A
G U L F O FG U I N E A
A T L A N T I C O C E A N
L A K EV O L T A
AkosomboVo lta
White Volt aBl
ack
Volta
50 100km
Capital
City
Town
Small town
more traffic
less traffic
Railway
Ferry
Boundary
Main roads:
River

CDR Working Paper 01.2 Centre for Development Research • Copenhagen
1
Abstract
The paper gives detailed account of the historical development of the transport system in
Ghana with special emphasis on the last decades, and from a logistical point of view. While
most of the African transport research has tended to focus on the transport infrastructure the
focus here is more on the transport services and the enterprises in the transport sector which
provide these services.
In the developed world the logictical revolution has during the last three decades had
important consequences for both the transport system itself and for development at large. It
has led to
− increased integration between the different transport modes in the door-to-door
transport chains, through containerization (or unitarisation) and the development
of large often very expensive multi-mode transport terminals;
− increased integration or coordination between transport and production; and
− a spatial reorganisation of both production and transport networks into hub-and-
spoke systems centred on few and larger centres.
However, in Africa these processes have in general not proceeded very far and the
paper investigates to which extent they have taken place in Ghana.
1. The logistical revolution and the development of freight transportation in Africa - an introduction
The purpose of this paper is to look at the development of the transport system of Ghana from a
logistical viewpoint. Historically Ghana is an interesting case because Taaffe, Morrill and Gould’s
(1963) study of Ghana’s transport system made it the prototype of how the transport systems
developed by the colonial powers have structured the economy of African countries and led to
underdevelopment.
As most of the literature before 1970 Taaffe, Morrill and Gould perceived transport costs from
resources or to markets as one of the most important explanatory variables in economic geography
and the economics of location. However, in the early 1970s this perception of the importance of
transportation changed rather suddenly as a result of the increasing internationalisation of production.
Through subcontracting and outsourcing the old factory production was now seen to be split up and
production as a whole or in part relocated to other parts of the globe in search of lower production

CDR Working Paper 01.2 Centre for Development Research • Copenhagen
2
costs, primarily cheap labour. In the process transportation costs dropped out of the theories of
industrial location, presumably because they now had become so low that they no longer were seen
as important. As a result most studies of the internationalisation or globalization of production do not
even consider the role of transportation, though transaction and communication costs since the mid-
1980s have been seen to play an increasingly important role. From playing a central role in
mainstream economic geography, transport geography was reduced to a niche specialisation without
direct link to mainstream economic geography.
However, there are a number of reasons why the disappearance of transportation from economic
geography is problematic. First, although it is true that the average per unit transport costs have
decreased dramatically, the role of transport in the national accounts have generally not decreased,
because the cheaper unit transport has become the more goods have been moved over still longer
distances. In the accounts of individual producers this may not be visible because an increasing share
of the transport costs are hidden in the payments to subcontractors.
Another reason why the negligence of transportation costs is problematic is that the reduction in
transport costs has not been uniform for all commodity flows. Transport costs have generally been
reduced most where large amounts of goods are moved, and it has increasingly depended on the
development of improved infrastructure. Therefore many of the least developed countries and
especially many countries in Africa have not benefitted proportionally from the reduced transport
costs. This handicap is further pronounced because many of the transaction, corruption and rent
seeking costs recognised by the transaction cost theory are linked to real or artificial bottlenecks in
the transport and communication systems.
Most importantly, however, the role of transportation in production has changed since the 1970s,
when transportation costs were dropped from the location theories. From being an activity external
to the production transportation has increasingly become an integrated part of the production
process. Partly as a result of new production technologies, such as just-in-time, external transport
costs have increasingly become substitutable with costs of internal transportation and storage. This
has led to the so-called logistical revolution, as a result of which enterprises no longer minimise their
transport costs, but rather their much larger logistical costs, consisting of the external transport cost
as well as the costs of internal transportation and storage. At the same time, travel time has often
become equally or even more important that economic cost.
For the study of transportation the logistical revolution has had two important consequences:
− Firstly, the focus has shifted away from the individual modes of transportation (port-to-
port) to integrated multi-modal transport (door-to-door) and led to processes of vertical

CDR Working Paper 01.2 Centre for Development Research • Copenhagen
3
integration in the transport sector similar to those described for production sectors in
commodity chain analysis. This development was spearheaded by the development
since the 1970s of large multinational forwarding companies which have been
coordinating and controlling an increasing share of the international commodity flows,
often without their own means of transport. However, during the 1990s the large
shipping and airline companies have increasingly attempted to take over these
coordinating and information controlling activities which have proved to be very
profitable.
− Secondly, transport has, as other parts of the production process, become subject to
strategic decisions about integration or outsourcing. These decisions to a large extent
depends on the processes of restructuring and vertical integration taking place in the
dominating commodity chains served by the transport system. They also depend on the
availability or non-availability of publicly financed infrastructure and explains the paradox
that enterprises often lobby heavily for improved transport infrastructure at the same
time as development theory claims that transport costs are not important.
− Thirdly, efficient transportation has become increasingly capital intensive and dependent
on expensive infrastructures and transport terminals which only large transport flows will
be able to pay for. Therefore the traffic has tended to be concentrated on fewer and
larger transport terminals. This has tended to result in a spatial reorganisation of
production and a new regionalisation of the economy focused on fewer and larger
centres.
These trends towards vertical integration or coordination within the transport system itself, horizontal
integration or interdependency with the transport users, and a new regionalisation, which during the
1980s and 1990s have become increasingly important in the industrialised and industrialising
countries, have, as we shall show below, been much slower to develop in Africa and other
developing parts of the world.
They have also had surprisingly little impact on the literature on transport and development in Africa.
Thus the two most recent textbooks on transport and development (Hilling 1996; Simon 1996) have
little to say about the logistical revolution and forwarding companies. One important reason for this
probably is that most of the transport research done in Africa has been done in connection with large
World Bank or donor investment projects.
The purpose of this paper is to look at the development of the transport system of Ghana from such
a more logistical point of view. In order to do this we shall study all the modes of freight transport

CDR Working Paper 01.2 Centre for Development Research • Copenhagen
4
and the (often missing or rudimentary) links between them, and we shall focus on the transport
operators and organisers rather than on the infrastructure, although we will of course to some extent
also have to discuss the development of infrastructure.
Although it would be logical from a logistical viewpoint to study the transport system in a more global
or at least regional perspective, the paper focuses for practical reasons rather narrowly on Ghana
and its trade, with few references and comparisons to other areas. However the paper is part of a
larger project which shall also look in detail at the transport systems in other parts of Africa, and
Pedersen (2001) attempts more broadly to look on Africa’s position in the world’s transport system.
In Section 2 of this paper we describe, as an introduction, the historical development of transport
infrastructure in Ghana. The information presented on the development during the colonial era is
mostly based on Gould’s study from 1960. Sections 3-6 analyse different parts of the transport
system since independence, with emphasis on the transport operators rather than on the
infrastructure. These sections are based partly on a number of consultancy reports and partly on 42
interviews with firms and public administrations in the transport sector carried out during one month
of field work during January/February 2000. In Section 3 we analyse the development of the ports
and the shipping industry since independence with emphasis on the increasing containerisation.
Section 4 discusses the inland transport corridors from the ports: Lake Volta inland shipping, the
railways and the road transit traffic to Burkina Faso and Niger. Section 5 looks at the development
of the trucking industry, and Section 6 at the rural transport and the development of intermediate
modes of transport. Section 7 looks at the air freight. Finally Section 8 attempts to see the
development in Ghana’s transport system since independence in the light of a logistical chain analysis,
focusing on the full logistical chain and the interaction between production, distribution and transport.
2. The development of transport infrastructure in Ghana
Before 1900: the pre-colonial era
In 1960 just after Ghana’s independence, Gould (1960) published a detailed study of the
development of transportation in Ghana. This study together with a similar study of Nigeria’s
transport system became one of the building blocks in Taaffe, Morrill and Gould’s (1963) seminal
paper which presented a step model of transport expansion in developing countries, which during the
1970s and 1980s came to be seen as the prototype of transport development under colonial rule and
resource exploitation.

CDR Working Paper 01.2 Centre for Development Research • Copenhagen
5
In the first phase of their model a large number of small ports and landing points are established along
the coast. During the next phase a process of selection takes place, where some of the ports loose
out and others win depending on the ease of access to resources in the hinterland and increasingly on
the investments in roads and railroads linking the ports with their hinterlands. During the third phase
feeder roads are built to the main transport lines, and increasing differentiation among the ports takes
place. In the fourth phase the major centres along the transport links to different ports are connected.
At the same time the centres along the main transport lines are increasingly differentiated. During the
fifth phase all the main inland centres are interconnected, and finally during the sixth phase new high
priority links are developed within the interconnected network.
During the 1970s and 1980s one of the criticisms of colonial development was that the last phases of
transport development never took place because the purpose of colonial development was resource
exploitation and export rather than local development.
In Ghana the development of the colonial transport system started during the 16th, 17th and 18th
century with the establishment of some 40 small surf ports or landing points along the coast of Ghana
(often located together with a fort) first by Portuguese and later by British, Dutch, Danish and other
European trading companies, trading primarily in slaves and gold and to a smaller extent also in ivory.
There was a considerable competition and increasing differentiation between the ports, and during
the 19th century and especially after the British in 1869 took over the Dutch forts and became the
sole coloniser, the trade increasingly concentrated on still fewer ports, so that in 1900 only 6 ports
accounted for 81% of all the export trade and 75% of all the import (Gould 1960). Cape Coast,
which was the starting point for the most important trails to Kumasi, was the most important of the
ports, but Ada, at the mouth of river Volta, and Accra were also important. Accra especially grew
after the British moved their headquarters from Cape Coast to Accra in 1877. This process of port
consolidation, which Dickson (1965) and Hilling (1977) have described in detail culminated with the
building of the railroads from Secondi to Kumasi (1901-04) and from Accra to Kumasi (1915-23)
and later the two modern ports in Takoradi (1928) and Tema (1962).
After abolishment of the slave trade during the first decades of the 19th century (the Danes abolished
it officially in 1804, the British in 1807) trade in agricultural produce gradually increased, primarily
palm oil and rubber, but also timber from western Ghana and maize and cattle (not for Europe but
for the other forts along the coast), and small amounts of coffee and cotton from eastern Ghana and
especially the area around Accra. After 1891 cocoa rapidly became important.
While the inland trade in and transport of slaves and gold before the 19th century largely was
controlled by the African coastal tribes or the Ashanti, the expansion of agricultural production for
export required increased presence of European producers and traders. This together with the

CDR Working Paper 01.2 Centre for Development Research • Copenhagen
6
prohibition of the slave trade, which had been very profitable for the Ashanti, led to a series of
Ashanti wars, which slowed the development of agricultural production for export, and only stopped
when the Ashanti were forced to surrender in 1896 and Ghana in 1901 became a British Crown
Colony. The coastal states already became a British Crown Colony in 1874. However, probably
more important for the relative slow development of an export production was the lack of inland
transport which tended to limit production of heavy products to areas in close proximity of the export
harbours.
Before 1874 most inland transport was based on head carriage on narrow trails often not well
maintained, though transport with river canoes was possible in some areas. In 1874 when the British
made the coastal states a crown colony, ”.......two developments took place......... . First, villages
along the main trade routes were encouraged to keep them open and cleared to speed the flow of
trade, and secondly, an administrative network of hammock tracks was cleared to enable officers to
get around their districts. ........ The result was that by 1890 the old north-south alignment had been
strengthened by a few well-cleared tracks, while a subsidiary network of trails had been cleared
between administrative centres and more important villages. ........ the improvements themselves,
together with the peaceful conditions that followed the 1873 expeditions against the Ashanti, so
encouraged the trade, particularly in bulk commodities such as palm oil, that transportation
improvements could no longer be left entirely in local hands. In ....1890 an inspector of trade roads
was appointed, and......... In 1894 a roads department was set up which immediately started a
programmeto build and maintain roads in the colony ......” (Gould 1960, p. 13).
Before 1900 the road from Cape Coast to Kumasi, which had been improved during the 1873
campaign against the Ashanti, was rebuilt and extended north worth to Kintampo and Mapong.
Roads were built inland from Accra to the Accra plain and the Akim Goldfields. Roads were built to
by-pass the rapids on river Volta. A road was built from the goldmine in Tarkwa to Ankobra river;
and roads were built from Saltpond and other ports into the palm oil producing areas, along which
palm oil barrels now were rolled down to the ports.
At 1900 the pattern of transport flows consisted of fairly short haul export flows of palm oil and palm
kernels from the forest belt close to the coast, of somewhat longer flows of rubber from Kumasi and
cocoa from the hinterland of Accra, of long haul northbound flows of kola nuts from Kumasi into
Northern Sahel, of salt especially along Volta river, but also via Kumasi, and of cloths and other
trade goods via Kumasi, but in heavy competition with goods coming in from Togoland and Cote
d’Ivoire (in both countries the first railroads were opened in 1907).

CDR Working Paper 01.2 Centre for Development Research • Copenhagen
7
1900-1920: the railway era
However, the big transport revolution came when the first railway was built from Secondi, first to the
goldmine in Tarkwa (1901) and then further on to Obuasi (1903) and Kumasi (1904). In 1907 a
branch line from Tarkwa was opened into the goldmining areas. Also in 1907 the first stretch of a
railway line from Accra into the cocoa producing areas was opened, and extended several times to
reach Korforidua in 1915 and Tafo in 1918, where it stopped due to wartime shortages.
The western line from the beginning carried machinery and building materials to the gold mines, coal
to the mines and the railway itself, and local agricultural produce to feed the growing number of
mining workers. Later increasing amounts of cocoa were exported from the area around Kumasi,
while agricultural produce was brought to the growing town of Kumasi. The eastern line primarily
brought the rapidly expanding cocoa production down to Accra for export and agricultural produce
for the provision of the town while much less was transported the other way. In 1915 the Secondi
line was three time as large as the Accra line in terms of total tonnage transported, but while 41,000
tons of cocoa were shipped to Accra, only 19,000 tons were shipped to Secondi.
As Gould writes: “In the period 1900-1919 ......... railway development was a response to two
types of economic incentives which were often complementary. One was the need to join areas of
potential agricultural and mineral production to an outlet on the world trade routes to take advantage
of cheap movements of goods by ocean transportation........... The other was the need to join
potential markets, represented by Kumasi and its vast hinterland. ........ A second stage in the model
is the growth of internal trade as secondary areas of agricultural production .......... grow to supply
the mining areas and expanding urban centres. In the beginning these secondary areas tend to parallel
the railway lines and centre around the mining and urban areas themselves” (Gould 1960, p. 38).
However, at the same time as the railways developed the road network continued to expand rapidly,
but in a complementary way which supported the railway rather than competed with it. In areas with
railways it changed its original function as primary transportation facility and became a feeder to the
railway creating access for commodities from areas previously inaccessible to the railway and thus
bolstering the main traffic streams.
During the 1900-1919 period three types of road development took place:
- Feeder roads were built to the railway stations and especially to the railhead in Kumasi expanding
the hinterland of the railway, but not roads which could have competed with the railways. Thus there
was a definite policy not to close the gab in the road between Kumasi and the coast (it was not
completed until 1958) and the road between Accra and Kumasi was not improved.

CDR Working Paper 01.2 Centre for Development Research • Copenhagen
8
- Roads from the larger port were extended further into the palm oil belt which increased the export
of palm oil, but also tended to cut off the smaller ports from their hinterland and led to the
concentration of the trade on fewer ports. Between 1900 and 1924, the number of ports exporting
commodities fell from nineteen to nine, and the percentage of exports handled by the two leading
ports (Cape Coast and Ada in 1900, Secondi and Accra in 1924), increased from 46% to 78%.
- The roads from both Kumasi and Volta river into northern Ghana were built and a road network in
northern Ghana centred on Tamale was developed after Tamale had become the administrative
centre of Northern Ghana in 1907.By the end of the period the road network in Northern Ghana
was much better than in the south.
1920-1940: competition between roads and railroads. The opening of Takoradi harbour
After the First World War the railways expanded again with great optimism. Part of the western line
was realigned and the track weight increased from 45 lbs. to 80 lbs., the line between Accra and
Kumasi was opened in 1923, and a new line from Huni Valley on the western line into Central
Province was opened to Kade in 1927. The improvements of the western line speeded up the export
of manganese which had started in 1916 during the war, but it also carried increasing amounts of
cocoa. The eastern and central lines were very dependent on cocoa.
The opening of the modern harbour in Takoradi in 1928 reduced the loading and turnaround times
dramatically. According to Gould (1960, p.56) the loading time of manganese ships went down from
three weeks to three days.
However, at the same time the network of both feeder and trunk roads was expanding, and from the
mid-1920s the main roads were increasingly tarmacked which cut in half the cost of hauling by lorry
on these roads. The feeder roads were responsible for the rapid expansion of the cocoa belt, and the
new trunk roads made it possible for the lorries to conquer an increasing share of the long distance
cocoa transport in the Eastern and Central Provinces. In Central Province much of the cocoa was
not carried by the railways to Secondi/Takoradi or Accra, but shipped on the improved roads to the
smaller ports in Cape Coast, Saltpond and Winneba, which experienced a short revival during the
1920s. However, as a result of improved roads into British Togoland Accra conquered parts of the
growing cocoa production there which earlier went on the railway to Lomé in French Togo. On the
other hand the growing amount of cocoa produced in Ashanti was forced on the railway because of
the policy not to improve the roads from Kumasi to Accra and Takoradi. Thus an up-to-date road
between Kumasi and Accra was not build until the late 1930s and the last gap in the road between
Kumasi and Takoradi even was not filled until 1958.

CDR Working Paper 01.2 Centre for Development Research • Copenhagen
9
The success of the road transport was not just lower transport costs, but also that the expanding
lorry transport had made it possible to reduce the cocoa season from seven to three months reducing
drying problems and the need for storage capacity, and in Central Province lorries were used even in
areas where rail transport was clearly cheaper (Gould 1960, p. 68).
In the Northern region the road network was further improved which resulted in increased
production of e.g. chicken, cattle and yams which were sold on the markets in Southern Ghana. Also
new trunk roads into the French territories in Sahel were opened for motor traffic. This led to the
opening of the first regular road service from Mopti to Kumasi via Ouagadougou carrying dried
Niger perch and also other mainly agricultural goods from Naimey, other smaller towns along the
Niger and the areas below the Niger arc. The old northbound caravan trade from Ashanti in
kolanuts, which when the railways were built had converted into rail and ships transport via Secondi,
Lagos and Kano, now reverted to the old overland route. Also the important salt trade from the
south to the north which traditionally had been carried by canoes on river Volta was converted to
lorries, with the result that the canoe traffic stopped.
1940-1960: expansion of the road network. Opening of Tema harbour
During the Second World War the railways regained its old strength first because the roadstead
ports of Accra, Cape Coast, Saltpond and Winniba were closed to prevent attacks by submarines.
This forced most of the cocoa to use the railways, but later when oil rationing almost closed the road
traffic also agricultural produce for the national market was forced on to the railways. In addition rail
shipment of strategic materials such as manganese, and from 1941 of bauxite (between 1941 and
1944 a new line was built to tap the deposits of bauxite in Awaso, but it soon also carried large
amounts of timber and cocoa), increased. At the same time the ship convoy system which had to be
used during the war dumped huge loads all at one time at Takoradi. Rail traffic therefore had to be
synchronized with the shipping movements to avoid congestion.
In total freight traffic on the railways increased by 57% during the war, but without satisfying all the
demand. After the war the demand for transportation increased further as a result of both growing
exports and the related boom in the internal economy and in imports. The westward move of cocoa
production also increased the traffic pressure on the western line. To satisfy this increased demand,
the carrying capacity was increased which, however, led to considerable capacity problems on the
Tarkwa-Takoradi section of the western rail line. Plans for doubling the line between the two towns
were made in 1948, but only realised for the first thirty kilometres.
As a result of the increasing pressure on the transport system in the postwar years plans were
developed around 1950 for the construction of a new port in Tema to serve Accra and the eastern
part of the country. The port was part of a larger scheme of transport development and

CDR Working Paper 01.2 Centre for Development Research • Copenhagen
10
industrialisation, including a large dam and power plant in Akosombo, a new waterway on the large
Lake Volta created behind the dam and a number of large industries (e.g. an aluminum plant, a steel
mill and an oil refinery) to exploit the new energy and infrastructure (see e.g. Hilling 1966). The port
was opened in 1962.
As a response to the increasing pressure on the transport system about one third of the 1951
Development Plan was allocated to railway and road transportation. For the railways the plan
allocated funds for new diesel locomotives and rolling stock, new terminal facilities in Takoradi
harbour, and a number of new network extensions of which however only two were realised.
First, in 1956 a link was opened between the central and eastern lines in order to provide an
economic rail route for heavy import for Accra from Takoradi, which, however, became somewhat
superfluous when the new port in Tema was opened in 1962.
Secondly, in connection with the construction of the harbour in Tema a new railway link was also
built from the eastern line to Tema, with a continuation to the granite quarries of the Shai Hills which
supplied building materials to the harbour. The intension was that this line should have been continued
to the Volta River Dam as part of a new transport corridor along the large Volta Lake created by the
building of the dam. This extension, however, was never built and the line to Shai Hills closed when
the harbour was constructed. The link from Tema was operated until one of the bridges on the line
broke down in 1993. So far it has not been rebuilt, apparently because the railways never was able
to compete with roads for the goods traded over Tema port, combined with the general decrease in
freight traffic on the eastern and central railway lines.
As lorries, their spare parts, tyres, oil and gasoline became available again after the war, road
transportation quickly assumed an even more important role than before the war. The post war
boom in the economy was a basis for large local investments in motor transportation. The number of
vehicles increased rapidly to more than 20,000 in 1952 of which 11,000 were commercial vehicles,
of which 70% were so-called mammy wagons carrying both passengers and freight (Gould 1960, p.
79). Gould cites Bonavia (1951) for estimating that the turnover of the motor transportation in 1950-
51 was 4-6 times larger than the turnover of the railways. Gould (1960, p.79) writes about the
operation of the mammy lorries: “ Some of them have fairly regular runs, but many are tramp vehicles
going wherever they can get work. They are extremely sensitive to demand for transportation, and
the news that a sudden demand has developed in a certain locality travel quickly. A further change
since the war has come in the level of lorry rates, which are no longer ruinously competitive. Now the
Motor Drivers’ Union agrees to certain rates and usually sticks to them, and although entry into the
field is easy, there is so much traffic to haul that an influx of new lorries and drivers has little effect
upon the prevailing rate structure.”

CDR Working Paper 01.2 Centre for Development Research • Copenhagen
11
As road traffic increased it came again into competition with the railway. As a result the roads and
the railways tended to mark out their own spheres of influence in carrying Ghana’s trade. Most of the
movement of food crops for the urban areas had by the end of the 1950s been taken over by the
roads, while the railways, apart from the high-value cocoa which made up a third of the freight
revenue, had been forced to concentrate on the hauling of low-valued bulk commodities.
That the railways had been able to retain the transportation of cocoa was largely due to the
establishment of the West African Produce Control Board during the war. This board set the prices
paid to producers for cocoa and other export crops. After the war this board continued to function,
although by 1950 it had been split up into eight national boards responsible for cocoa, groundnut,
cotton and palm oil produce. The Ghana Cocoa Marketing board responsible for setting the annual
price of cocoa, set a single national price delivered at railhead, while the cost of transportation to the
port is paid by the board. The result is that most of the cocoa in 1960 still was carried by the
railway, in contrast to the prewar years when the roads competed strongly for this trade. And Gould
(1960, p.78) cites Bonavia for suggesting: “that if the agents of the Cocoa Marketing Board were
free to do so they would consign a large part of the crop to Takoradi by road. This is so because
imported merchandise is carried to Kumasi by road, and the empty return haul could be stopped by
charging much lower rates for cocoa than for the railway.”
In the original 1951 Development Plan two thirds of the funds allocated to rail and road
transportation were allocated to the railways, but as the road traffic increased the priorities changed
and the roads ended up getting two thirds of the funds. First priority was given to the upgrading of
the Accra-Kumasi-Takoradi-Accra triangle. The gaps which had purposely been left in it to protect
the railways were finally filled in. The gaps especially in the Kumasi-Takoradi road had resulted not
only in a poor trunk road but also in a much lower density of feeder roads in western Ghana than in
the east (Gould 1960), secondly a large number of road bridges were built in northern Ghana, and a
road was built to Akosombo (and the Volta River Dam) in order to feed a shipping line to northern
Ghana on the new Lake Volta (which, however, never became very important, see Section 4), and
further on to British Togoland (the last for political rather than economic reasons). In addition a large
number of both feeder and secondary roads were built in the years around independence, often on
local initiative.
1960-2000: decay of the transport infrastructure
However, in 1961 there was a drastic cut back in the road budgets which was the beginning of a
long period of deterioration in the condition of the road network (and probably also of the motorised
road traffic which reached a low point in 1983 (from 1980 to 1983 the average daily traffic on the
trunk and secondary roads decreased from 417 to 288 vehicles)), which lasted until the government

CDR Working Paper 01.2 Centre for Development Research • Copenhagen
12
as part of the Economic Recovery Programme launched in 1983 and with considerable donor
support started a road rehabilitation programme (Republic of Ghana 1996). This has apparently
increased the percentage of the trunk roads classified as good from only 15% in 1984 to 43% in
1994, which, however, is still far below the planned goal of 70%. At the same time the traffic on the
trunk and secondary roads has been increasing from an average daily traffic in 1983 at 288 vehicles
to 522 in 1992 (Republic of Ghana 1996).
Gould (1960) documents how the road density in different parts of Ghana increased between 1900
and 1958, but unfortunately does not give any data on the total length of the road network. From the
decades since independence we have been able to find some data from the early 1970s, from 1987
and from 1994 which indicate that the length of trunk and secondary roads has increased from
10,500 km in the early 1970s to 15,000 in 1994, while the feeder roads apparently have been stable
at around 22,000 km. However, many of the feeder roads are of very low standard and it may be a
matter of definition when a trail is a feeder road or just a food path. In 1996 the Intermodal
Transport Study (Republic of Ghana 1996, p. 7.14) concludes that only 3700 km of the feeder
roads are “maintainable” (for automobile traffic?). Thus although there has been some investments in
the road network, indications are that the investments during most of the period since 1970 have not
been able to keep track with the deterioration. Only during the late 1990s there appear to have been
some real improvements.
Thus by the turn of the 21st century the freight transport system of Ghana consists of only two
harbours which handles almost all of the foreign trade, a railway system which has not changed for
many decades, is of low standard and especially on the eastern and central lines has a low capacity
utilisation, and a road network which may have expanded somewhat during the last 15 years but still
has a generally low standard and difficulties handling the rapidly growing traffic. There is also an
inland water transport on Lake Volta, which, however, has never been able to take off and is of very
limited consequence, and an international airport with a small but growing international air freight
transport.
This represents a surprisingly limited change in the transport infrastructure since Gould wrote his
book in 1960. However, since then a number of important changes have taken place in the world
transport system which have shifted the focus from line infrastructure to the organisation and
coordination of the transport flows and the capacity and operation of the transport terminals, which
Gould has very little to say about. These changes are the result of unitisation or containerisation of
transport, the attempts to develop integrated multi-modal transport systems, and the establishment of
forwarding companies and other so-called NVOCCs (non-vehicle-owning-common-carriers) which
do not own their own means of transport but organise and coordinate transport flows with transport
owning companies. Therefore the following sections focuse on the transport companies, including the

CDR Working Paper 01.2 Centre for Development Research • Copenhagen
13
forwarding agents and other NVOCCs and their changing competition, collaboration, and interaction
with the transport buyers, rather than on the transport infrastructure.
3. The post-independence development of sea transport and harbours
The sea freight
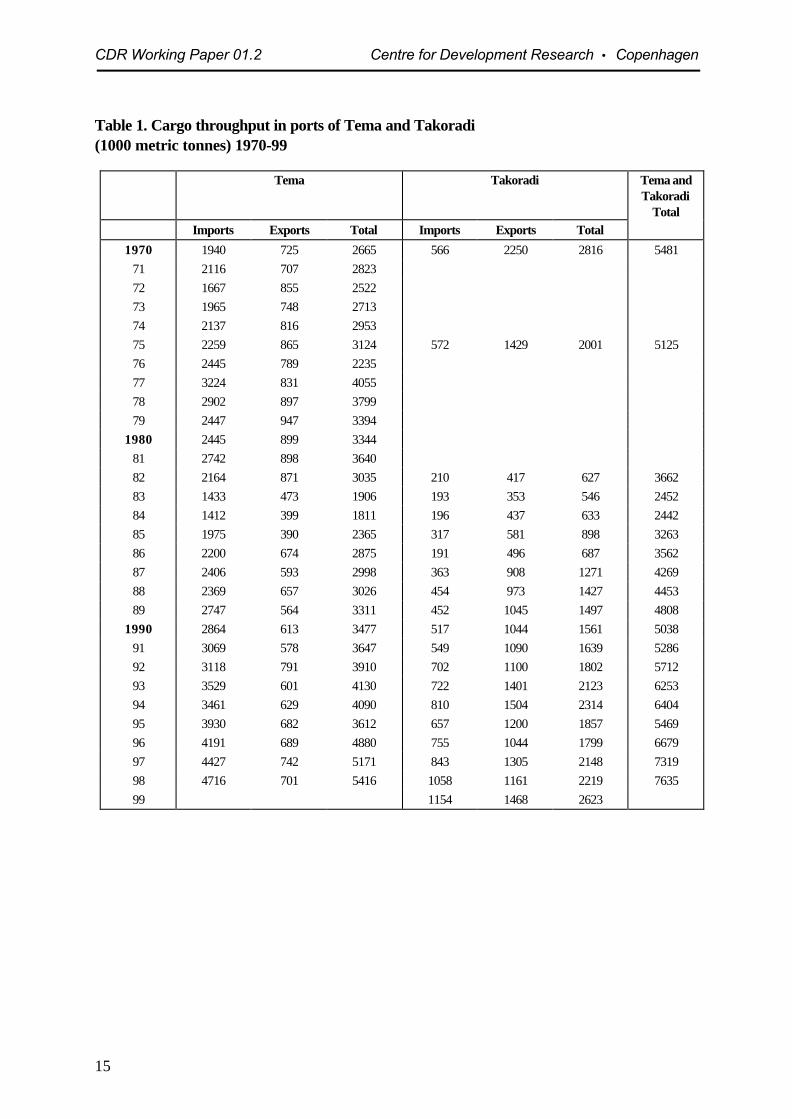
The two seaports, Tema and Takoradi, now carry practically all the seaborn trade of Ghana. The
total throughput of the two harbours has varied greatly during the last thirty years. During the 1970s
throughput stagnated and reached a low point in 1983-84, when it was only half of what it had been
in 1970. Since the introduction of the Economic Recovery Programme in 1983 it has increased in
most years and was in 1998 more than three times as large as in 1984. However, only in the early
1990s did it reach the same level as in 1970 (see Table 1).
Also the relative size of the two ports has varied. When the port of Tema was opened in 1962 it
grew rapidly partly on the cost of Takoradi. By 1970 it had almost reached the same cargo
throughput as Takoradi and in the early 1980s it was about five times as large, partly because the
throughput of Takoradi had gone down. However, since then Takoradi has regained some of its
position and today Tema is only about two and a half times larger than Takoradi in terms of tonnage
throughput (5.4 million tonnes throughput in Tema versus 2.2 million tonnes throughput in Takoradi in
1998).
In terms of tonnage imports are generally much larger than exports and the imbalance has been
increasing over the years. In 1970 exports were a little larger than imports, but there was almost
balance. During the 1980s and early 1990s imports were about twice as large as exports but during
the late 1990s import tonnage has increased to more than three times the export tonnage.
At the level of the individual harbours the cargo throughput is even more skew, with Tema being
increasingly dominated by imports while Takoradi traditionally has been dominated by exports. In
Tema the imports in 1998 were three and a half times the low point in 1983-84 and about twice the
level during the 1970s, while exports are still lower than they were during the 1970s. As a result
imports are now 6-7 times larger than the exports. On the other hand, in Takoradi exports have over
the years been larger than imports, though increasingly less so, and in 1998 there was almost
balance.

CDR Working Paper 01.2 Centre for Development Research • Copenhagen
14
Type of freight
In Takoradi about 60% (and slightly increasing) of the export consists of dry bulk made up entirely
of bauxite and manganese, which both arrive on rail from the mines and leave on bulk ships from
private sections of the harbour, the bauxite mainly for the UK Alkam aluminium company (which
owns the mine) though some also go to North America, the manganese mostly for Europe but also
some for the Far East (see Table 2, p.16).
Another big share of the export from Takoradi is made up of forest products, until 1994 mostly logs
exported as general cargo. Until 1992 forest products constituted 20-30% of the export, then in
1993-94 it increased to about 40% in anticipation of increased duties on log exports (from 15% in
1995 to 50% in 2000 according to Republic of Ghana (1994)), which will make it more profitable to
process the logs into sawn timber before exportation. As a result export of forest products in the
second half of the 1990s dropped to 12-14% of the export, because most of the timber is exported
in containers.
CDR Working Paper 01.2 Centre for Development Research • Copenhagen
15
Table 1. Cargo throughput in ports of Tema and Takoradi (1000 metric tonnes) 1970-99
Tema Takoradi Tema and Takoradi
Total Imports Exports Total Imports Exports Total
1970 1940 725 2665 566 2250 2816 5481
71 2116 707 2823
72 1667 855 2522
73 1965 748 2713
74 2137 816 2953
75 2259 865 3124 572 1429 2001 5125
76 2445 789 2235
77 3224 831 4055
78 2902 897 3799
79 2447 947 3394
1980 2445 899 3344
81 2742 898 3640
82 2164 871 3035 210 417 627 3662
83 1433 473 1906 193 353 546 2452
84 1412 399 1811 196 437 633 2442
85 1975 390 2365 317 581 898 3263
86 2200 674 2875 191 496 687 3562
87 2406 593 2998 363 908 1271 4269
88 2369 657 3026 454 973 1427 4453
89 2747 564 3311 452 1045 1497 4808
1990 2864 613 3477 517 1044 1561 5038
91 3069 578 3647 549 1090 1639 5286
92 3118 791 3910 702 1100 1802 5712
93 3529 601 4130 722 1401 2123 6253
94 3461 629 4090 810 1504 2314 6404
95 3930 682 3612 657 1200 1857 5469
96 4191 689 4880 755 1044 1799 6679
97 4427 742 5171 843 1305 2148 7319
98 4716 701 5416 1058 1161 2219 7635
99 1154 1468 2623

CDR Working Paper 01.2 Centre for Development Research • Copenhagen
16
The final large share of the export from Takoradi is cocoa beans, traditionally exported as bagged
cargo, which almost entirely consists of cocoa bean. Much of the bagged cocoa is exported in 500
tonnes BACO barges which are sailed on board specialised ships and have the advantage that they
can load directly at the buoy moorings in Takoradi and unload in the same way in Holland. Until
1993 the bagged cocoa beans made up close to 10% of the export tonnage. Since then the
percentage has tended to go down because the cocoa beans increasingly are containerised.
As a result of the increasing containerisation of timber and cocoa beans the containerised export
cargo has increased during the 1990s from very little to 15% in 1998.
Of the imports to Takoradi between 80% and 90% consist of dry or liquid bulk. The liquid bulk
consists almost entirely of petrol products from the oil refinery in Tema (and thus is not really import).
In the 1980s this made up 20-25% of all the import, but during the 1990s it has stagnated or even
contracted in absolute terms and in the late 1990s corresponded to less than 10% of the imports to
Takoradi, probably because western Ghana increasingly are supplied by petrol by road.
The dry bulk (about 75% of the imports) consists mostly of clinker imported from Europe for the
cement industry in Takoradi and some (much less) wheat imported mostly from North America. The
import of clinker has doubled during the 1990s.
Most of the remainder of the imports to Takoradi is made up by industrial goods, much of it
materials and machinery for the mining and forest industries, and increasingly containerised during the
late 1990s. 1997-8 it increased from less than 5% of the imports to about 8%.
In Tema about 35% of the imports are liquid bulk, which, apart from a limited amount of chemicals
for Lever Brothers, consists of crude oil and petrol products for the oil refinery in Tema (see Table
3).
Dry bulk also makes up about 35% of the imports. It consists mainly of clinker and gypsum for the
cement factory (Ghacem Co.) and alumina, coke and pitch for the aluminium factory (Valco, owned
by the multinational firms Kaiser Aluminium and Chemicals Co. (90%) and Reynolds Metal Co.
(10%)), both located near the harbour in Tema. During the 1980s the imports for the alumina factory
were larger than for the cement factory, but during the 1990s the cement factory has expanded
rapidly while the aluminium production has stagnated due to stagnating electricity supplies. A third
important though smaller part of the dry bulk import to Tema is wheat, which has been growing,
though fluctuating.

Table 2. Cargo throughput by packaging (1000 metric tonnes). Port of Takoradi (1987-1998)
1987 1988 1989 1990 1991 1992 1993 1994 1995 1996 1997 1998
Imports abs.% abs.% abs. % abs. % abs. % abs. % abs. % abs. % abs. % abs. % abs. % abs. %
Liquid bulk 9626.2 10523.1 9520.8 11622.5 9216.8 10114.4 11015.2 759.3 172.6 202.6 9411.2 787.3
Dry bulk 20956.9 30066.1 31369.4 35068.0 41375.2 54477.5 53674.2 60774.9 57387.2 63484.0 64676.6 80175.7
General cargo 3710.1 184.0 173.8 214.1 213.8 253.3 446.1 8911.0 223.3 537.0 313.7 555.2
Bagged cargo 61.6 102.2 92.0 51.0 30.5 101.4 50.7 70.9 111.7 101.3 30.4 444.2
Containerized cargo 184.9 214.6 173.8 234.5 213.8 243.4 263.6 324.0 345.2 374.9 698.2 807.6
Total Import 367100 454100 451100 515100 549100 702100 722100 810100 657100 755100 843100 1058100
Exports abs.% abs.% abs. % abs. % abs. % abs. % abs. % abs. % abs. % abs. % abs. % abs. %
Liquid bulk 0 0 0 30.3 0 80.7 60.4 30.2 50.4 60.6 90.7 0
Dry bulk 48052.8 56758.2 65762.9 62359,7 64459.1 68362.1 67047.8 69746.2 69858.2 65062.3 87767.2 72362.3
Bagged cargo 9810.8 909.2 12512.0 969.2 1079.8 888.0 1148.1 744.9 594.9 858.1 745.7 1089.3
General cargo 414.5 202.1 80.8 70.7 70.6 151.4 282.0 80.5 10.1 30.3 90.7 90.8
Forest products 29031.9 29730.5 22221.3 25024.0 28626.2 26824.3 53538.2 63642.3 30325.3 14814.2 16012.3 14812.7
Containerized cargo - - 333.2 646.1 464.2 383.5 493.5 875.8 13411.2 15214.6 17613.5 17214.8
Total export 909100 974100 1044100 1043100 1090100 1100100 1401100 1504100 1200100 1044100 1305100 1161100
Source: Data for 1987/90 are from Republic of Ghana (1994). Data from 1991-98 are received from GPHA.

Table 3. Cargo throughput by packaging (1000 metric tonnes). Port of Tema. 1989-1998
1987 1988 1989 1990 1991 1992 1993 1994 1995 1996 1997 1998
Imports abs. % abs. % abs. % abs. % abs. % abs. % abs. % abs. % abs. % abs. % abs. % abs. %
Liquid bulk 1025 42.6 107245.3 116142.3 103536.1 110636.1 89928.8 102329.6 129137.3 127632.5 138733.1 143932.5 1664 35.3
Dry bulk 713 29.6 68028.7 87331.8 94332.9 106134.6 113636.4 137438.9 125736.3 156639.8 144834.6 162936.8 1325 28.1
General cargo 323 13.4 1426.0 1917.0 1806.3 2026.6 2518.1 2547.2 1965.6 2476.3 2896.9 2886.5 246 5.2
Bagged cargo 182 7.6 2289.6 2629.5 31010.8 3019.8 39112.5 43212.2 3139.0 3278.3 44110.5 3688.3 580 12.3
Containeris. cargo 161 6.7 24910.5 2599.4 39613.8 39813.0 44214.2 44712.6 40611.7 51513.1 62514.9 70215.9 900 19.1
Total imports 2405 100 2370100 2746100 2864100 3067100 3118100 3529100 3461100 3930100 4180100 4427100 4715 100
Exports abs. % abs. % abs. % abs. % abs. % abs. % abs. % abs. % abs. % abs. % abs. % abs. %
Liquid bulk 241 40.6 31648.0 21237.6 16026.1 19834.3 34543.6 19031.6 18527.1 25537.4 18727.1 23731.9 223 31.8
Dry bulk 0 0 0 0 0 0 0 0 0 0 0 0
General cargo 257 43.5 23135.1 17731.4 24239.5 19233.2 23129.2 18931.4 17027.0 16023.5 16023.2 15520.9 98 14.0
-of which aluminium 139 152 157 179 177 73 - 94 111 111 88 50
Bagged cargo 96 16.2 11016.7 9717.2 9315.2 8414.5 627.8 8514.1 8413.4 456.6 7010.2 587.8 58 8.3
Containeris. cargo - - 7813.8 11919.4 10418.0 15319.3 13722.8 18930.0 22132.4 27332.6 29339.5 321 45.8
Total exports 593 100 658100 564100 613100 578100 791100 601100 629100 682100 689100 742100 701 100
Source: Data for 1987/90 are from Republic of Ghana (1994). Data from 1991-98 are received from GPHA.

CDR Working Paper 01.2 Centre for Development Research • Copenhagen
18
About 10% of the imports are bagged cargo, consisting mostly of rice and sugar which is unlikely to
be containerised because it is imported from other developing countries. Import of general cargo has
been almost stable at 5-7%, while containerised cargo especially during the late 1990s has increased
and in 1998 made up almost 20% of the import, up from less than 10% during the 1980s.
Liquid bulk makes up about 30% of the exports. It consists almost entirely of petrol products from
the oil refinery “exported” mostly to Takoradi but also to Europe and other African countries. Lever
Brothers also exports some chemicals and palm oil as liquid bulk but it is a very small fraction of the
total. . Bagged cargo, which mostly is cocoa beans, is down from more than 15% in the late 1980s to about
8% in the late 1990s due to containerisation of the cocoa export.
General cargo now mainly consists of aluminium from Valco. The export of sawn timber which
during the late 1980s were exported from Tema as general cargo is no longer important. If some
sawn timber is still exported from Tema it has become containerised.
Finally the export of containerised cargo has been rapidly increasing, mainly as a result of the
increased containerisation of cocoa, but also due to an increased export of non-traditional
productions such as pineapples and fish products. In 1998 45% of the export was containerised.
In conclusion 60-65% of the freight passing through Ghana’s two ports is bulk traffic, much of which
pass through specialised, often private and almost closed transport circuits and therefore has little
impact on the other parts of the transport system. This is the case with the export of bauxite and
manganese, which are transported by special trains to private sections of Takoradi harbour and in
the case of bauxite leaves on specialised ships, and the import of crude oil and petrol products,
which are transported in pipeline to the refinery just outside the port in Tema, and the import of
clinkers to the two cement factories located near the ports in Tema and Takoradi.
For the Ghanaian economy these specialised circuits obviously are very important and many of them
appear to have both capacity and efficiency problems which are constraints to the economy. There
has been a number of plans which if they were carried out would change the commodity flows
dramatically. The old development plan from 1951 contained a plan for a railway link from the
bauxite mine in Awaso to Kumasi in order to supply the aluminium works in Tema with Bauxite via
the eastern railway line. This would have reduced the export of bauxite from Takoradi and eliminated
the import of alumina to Tema, but the plan was never realised, probably most importantly because
the bauxite mines and the aluminium works are owned and operated by two different multinational
firms which have not been interested in making the investment, and now the decay of the eastern

CDR Working Paper 01.2 Centre for Development Research • Copenhagen
19
railway line and the low capacity utilisation of the aluminium works due to power rationing makes it
most unlikely to happen. There has also been uneffectuated plans to exploit lime deposits in western
and northern Ghana for cement production which would reduce or eliminate the now growing import
of clinkers. At present more realistic is the expansion of the mining industry, and an ongoing project
to expand the capacity of the Tema Oil Refinery (in anticipation of its privatisation), and a plan
(backed by the US and Nigerian governments) to build a gas pipeline from Nigeria via Benin and
Togo to Ghana, both of which will ease the chronic energy shortage in the country.
However, for our study of the restructuring of transportation and its impact on development it is the
general and bagged cargo which is most interesting. It is here the inland transport has been shifting
from rail to road, and it is here containerisation has taken place during the last thirty years, and
although the general, bagged and containerised cargo in total only makes up 37% of the tonnage
throughput in the two ports, it is much more important in value terms, and it has tended to increase
(in the period 1988-98 it has increased from 32% to 41% in Tema, but rather stagnated in Takoradi,
because the bulk traffic has also increased). In absolute terms the container throughput in the two
ports doubled from 103,900 TEU in 1993 to 207,500 TEU in 1998. (In Tema from 93,200 to
169,700 TEU and in Takoradi from 10,700 to 37,800 TEU).
When freight transport in the industrialised countries started to be containerised in the 1970s
imported goods to Ghana, as to other developing countries, also started to arrive in containers, partly
because they reduced the transport costs in the European end of the transport link, and partly
because the containers reduced the loses due to destruction and theft, and thus the insurance
premiums which in the developing countries often were and still are very high.
However, the developing countries in general were ill equipped to receive and handle the containers.
In the industrialised countries the container was last step of a longer history of freight unitarisation
starting with pallets in the 1950s. It was a response to the rising labour costs and the necessary
infrastructure in the form of cranes and forklifts etc. had been developed along the way. In Ghana as
in most developing countries this was not the case. For this and a number of other reasons few
containers arriving in Ghana go inland but are stripped at the harbour. Ghana therefore does not get
the benefit from containerisation that the industrialised countries have got. (For a more general
discussion of this see e.g. Hilling (1983)).
Thus the increasing containerisation is largely forced upon Ghana from the outside. On the one hand,
the increasing imports of industrial goods from the industrialised countries since trade liberalisation
mostly arrive in containers, on the other hand an increasing share of the exports is being containerised
because the shipping companies offer special low rates for export goods in order to avoid returning
empty containers (Table 4 shows an example of the different rates for container transport to and

CDR Working Paper 01.2 Centre for Development Research • Copenhagen
20
from Tema). This has led to increased containerisation of especially cocoa beans and sawn timber. In
the case of sawn timber the process has been strongly supported by Ghanaian legislation in the mid-
1980s requiring logs to be sawn into timber before export. On the other hand, in the case of cocoa
beans the process has been delayed because especially the Dutch importers apparently fear that
containerisation may reduce the quality of the beans and therefore will not allow it, though the
Republic of Ghana (1996, p. 10.54) indicates that the main reason rather may be that the Dutch
importers have large storage facilities geared to reception of cocoa beans in bags in barges. Recently
new actors in the privatised Ivorian cocoa trade have started exporting cocoa in bulk, which if it
spreads to Ghana could reverse the containerisation of cocoa.
Table 4. Maersk’s shipping rates for 20' and 40' containers between Tema and Rotterdam, February 2000
20' container 40' container
US$ US$
Tema - Rotterdam
Transport 1400 DM 706 2650 DM 1336
Bunker adjustment factor 75 euro 74 150 euro 148
Terminal handling costs 220 gulden 98 220 gulden 98
Total 878 1582
Rotterdam - Tema
Transport 2000 DM 1008 3500 DM 1765
Bunker adjustment factor 103 euro 101 206 euro 203
Terminal handling costs 100 euro 99 200 euro 198
Total 1208 2166
Direction of trade
More than half of Ghana’s liner imports come from Europe (0% from the UK, 30% from northern
Europe and 10% from the Mediterranean Europe) and about 80% of the exports go to Europe (15-
20% to the UK, 40-50% to northern Europe and 15% to the Mediterranean Europe) (see Tables 5
and 6, pp. 22-23). The UK’s share of the trade has been fairly stable while northern Europe’s share
has gone down and the Mediterranean Europe has increased its share. One reason for this shift from
the northern to the Mediterranean Europe probably is that an increasing share of the liner trade with
northern Europe goes over land to and from the hub ports in southern Europe.
A growing share of the liner imports come from the USA, while the exports to the USA are small
and stagnating. Liner imports from the Far East have been fairly stable at 15-20% during the 1990s,
while the exports were growing rapidly during the mid-1990s, but dropped again in 1997 due to the
Asian crisis. Liner trade with other African countries is small (less than 5%) but growing. Finally
liner trade with others has generally been contracting.
CDR Working Paper 01.2 Centre for Development Research • Copenhagen
21
Bulk imports have been increasing rapidly during the 1990s. Most of the increase comes from
Europe (both northern and Mediterranean Europe), which has increased its share of the imports from
about 20% in the early 1990s to more than 60% in 1997.
Bulk exports also go predominantly to Europe, but while the UK practically does not supply any of
the bulk imports they buy about one third of the exports. Northern Europe buys about 20% and the
Mediterranean Europe about 10% but in both cases the figures have been decreasing. On the other
hand, the Far East and especially the USA take an increasing share of the bulk exports.
Bulk imports from other African countries have decreased during the 1990s, while bulk exports to
Africa have been fairly stable (except in 1997 when apparently it disappeared almost completely).
The shipping lines
The port of Tema receives about 1000 freight ships a year and Takoradi about half of that. In both
ports the number of ship calls has increased by about 50% between 1990 and 1998, in both ports
with an intermediate peak in 1993. However, this is considerably less than the increase in freight
which almost doubled in the same period (see Table 7, p. 24).
The sea freight traffic is carried out by shipping lines, operating general cargo, roll-on-roll-off (ro-ro),
semi-container or container ships, and tramp vessels which are either dry bulk carriers or tankers.
Although 60-65% of the throughput in Ghana’s ports consists of dry and liquid bulk carriers and
tankers only make up about 20% of the ships calling the ports, less than 20% in Tema but more in
Takoradi. The bulk traffic has been slowly increasing in Tema while it has been fairly stable in
Takoradi.
The big changes have taken place within the liner traffic, where specialised cell containerships have
increased their calls at the two ports dramatically during the 1990s, in Tema from 39 in 1987 to 250-
300 in the late 1990s and in Takoradi from 20 in 1991 to about 90 in the late 1990s. At the same
time the number of calls by general cargo, ro-ro and semi-containerships has remained fairly stable
(though with considerable swings) in Tema, while in Takoradi the calls by ro-ro and semi-
containerships also have gone up but the number of calls by general cargo ships has decreased.

Table 5. Direction of trade (1000 metric tonnes) 1990-97. Imports Liner traffic
UK Northern Europe
Mediterranean Europe
North America
Far East
Africa Others Total
abs. % abs. % abs. % abs. % abs. % abs. % abs. % abs. %
1990 101 11.0 407 44.4 61 6.7 83 9.1 171 18.7 37 4.0 54 5.9 916 100
1991 91 9.8 343 36.9 46 4.9 91 9.8 256 27.5 35 3.8 67 7.2 930 100
1992 100 8.9 340 29.9 129 11.3 122 10.7 226 19.9 54 4.7 167 14.7 1138 100
1993 169 11.9 276 19.5 162 11.4 314 22.2 288 20.3 30 2.1 178 12.6 1417 100
1994 113 10.5 385 35.8 135 12.9 179 16.7 176 16.4 34 3.2 50 4.7 1074 100
1995 98 8.5 389 33.8 184 16.0 102 8.9 219 19.0 55 4.8 103 9.0 1150 100
1997 130 10.9 353 28.7 133 10.8 184 14.9 228 18.5 84 6.8 119 9.7 1231 100
Dry and wet bulk
UK Northern Europe
Mediterranean Europe
North America
Far East
Africa Others Total
abs. % abs. % abs. % abs. % abs. % abs. % abs. % abs. %
1990 0 0.0 98 4.1 393 16.3 344 14.3 0 0.0 1238 51.3 339 14.1 2412 100
1991 0 0.0 63 2.4 311 11.7 375 14.1 0 0.0 1274 48.0 631 23.8 2653 100
1992 0 0.0 102 4.1 376 15.2 235 9.5 0 0.0 864 34.8 902 36.4 2480 100
1993 2 0.1 528 8.4 729 23.7 224 7.3 4 0.1 696 22.6 899 29.2 3081 100
1994 7 0.2 359 11.5 776 25.0 191 6.1 0 0.0 1438 46.3 338 10.9 3109 100
1995 10 0.3 395 11.8 1209 36.0 312 9.3 0 0.0 1122 33.4 282 8.4 3361 100
1997 6 0.2 938 25.0 1420 37.8 333 8.9 61 1.6 590 15.7 410 10.9 3758 100

Table 6. Direction of trade (1000 metric tonnes) 1990-97. Exports Liner traffic
UK Northern Europe
Mediterranean Europe
North America
Far East
Africa Others Total
abs. % abs % abs. % abs. % abs. % abs. % abs. % abs. %
1990 149 17.0 473 54.1 73 8.4 52 5.9 46 5.2 28 3.2 54 6.2 874 100
1991 105 12.9 451 55.3 95 11.6 40 4.9 40 4.9 18 2.2 69 8.5 816 100
1992 134 15.1 497 56.2 119 13.4 27 3.1 42 4.7 21 2.4 45 5.1 885 100
1993 157 14.1 514 46.1 112 10.0 60 5.4 171 15.3 31 2.8 71 6.4 1116 100
1994 162 13.7 353 29.8 140 11.8 26 2.2 445 37.6 21 1.8 37 3.1 1183 100
1995 170 19.2 320 36.1 139 15.7 36 4.1 151 17.0 39 4.4 30 3.4 886 100
1997 153 19.3 349 44.0 136 17.2 28 3.5 63 7.9 31 3.9 33 4.2 793 100
Dry and liquid bulk
UK Northern
EuropeMediterranean
Europe North
America Far East
Africa Others Total
abs. % abs % abs. % abs. % abs. % abs. % abs. % abs. %
1990 248 30.9 195 24.3 198 24.7 49 6.1 48 6.0 65 8.1 0 0.0 802 100
1991 256 30.4 187 22.2 107 12.7 11 1.3 54 6.4 187 22.2 41 4.9 842 100
1992 253 24.7 458 44.6 80 7.8 0 0.0 42 4.1 170 16.6 24 2.3 1026 100
1993 186 26.7 171 24.6 55 7.9 24 3.4 62 8.9 113 16.2 86 12.4 696 100
1994 305 34.0 126 14.1 64 7.1 163 18.2 52 5.8 131 14.6 54 6.0 896 100
1995 308 32.6 130 13.8 184 19.5 129 13.7 52 5.5 141 14.9 0 0.0 944 100
1997 268 33.9 147 18.6 68 8.6 137 17.3 93 11.8 4 0.5 74 9.4 791 100

Table 7. Number and types of vessels. 1987-98
Tema
General cargo 28143.8 25934.6 280 40.0 27137.8 34144.1 34440.1 32234.0 292 34.2 22124.8 22622.8 28727.8 37235.7
Ro-ro 16726.0 15520.7 128 18.3 11516.1 8511.0 10312.0 11412.0 107 12.5 9410.5 11011.1 12412.0 15514.9
Container multipurp. 7511.7 11415.2 63 9.0 598.2 587.5 596.9 596.2 80 9.4 9710.9 13413.5 12211.8 898.5
Cell containers 396.1 8210.9 101 14.4 14820.7 17022.0 21224.7 24926.3 184 21.6 26329.5 30530.8 28427.5 27626.6
Bulk carriers 558.6 608.0 62 8.9 689.5 759.7 839.7 939.8 94 11.0 10611.9 11511.6 10810.5 787.5
Tankers 253.8 7910.5 66 9.4 557.7 455.8 576.6 11011.6 96 11.3 11012.3 10010.1 10610.2 726.9
Total 642100 749100 700 100 716100 774100 858100 947100 853 100 891100 990100 1031100 1042100
Takoradi
General cargo 14443.1 14838.7 13228.5 108 24.7 9022.7 6415.8 9520.9 9620.2
Ro-ro 4613.8 4712.3 5712.3 89 20.3 6716.9 9824.1 10823.8 11624.4
Container multipurp. 319.3 225.8 173.7 26 5.9 4110.3 5212.8 6013.2 6714.1
Cell containers 205.9 359.2 7516.2 66 15.1 8822.2 9924.4 8418.5 9018.9
Bulk carrier 7622.8 9023.6 12527.0 109 24.9 9423.7 8320.4 9120.0 8317.6
Tankers 175.1 4010.5 5712.3 40 9.1 174.3 102.5 194.2 274.8
Total 338100 343100 326 100 321100 334100 382100 463100 438 100 397100 406100 454100 475100

CDR Working Paper 01.2 Centre for Development Research • Copenhagen
25
The reason why the number of ship calls has increased more slowly than the amount of freight is that
the average freight unloaded and loaded at each call has increased, especially for non-bulk
commodities.
For dry bulk the average amount unloaded from each bulk carrier in Tema varied between 11,000
and 15,000 tonnes, but increased to 17,000 tonnes in 1998. In Takoradi it started around only 5-
6,000 tonnes, but increased to almost 10,000 tonnes in 1998.However, where there was no dry
bulk export from Tema, the export of dry bulk from Takoradi was slightly larger than the import and
thus the total throughput per bulk carrier was about the same in Tema and Takoradi, namely about
12-15,000 tonnes (see Tables 8 and 9).
For liquid bulk which in both ports is mostly imports the average amount unloaded per ship in Tema
varied between 11,000 and 18,000 tonnes (a few years were much larger, but probably unreliable)
but in Takoradi only between 1,000 and 5,000 tonnes, in both cases with no obvious trend.
As general cargo, ro-ro and containerships may carry different combinations of general, bagged and
container cargo we have computed the average amount of unloaded and loaded freight on the basis
of the total of these types of ships and cargo. The computations show that the tonnes per vessel
unloaded in Tema have increased from about 1200 tonnes in 1987 to 1800 tonnes in 1998. The
amount loaded for export is only around 600 tonnes and has been fairly stable over the years. In
Takoradi the import unloaded per ship is much smaller, increasing from 200 tonnes to 500 tonnes
but with large fluctuations. On the other hand, the exports loaded are much larger, swinging between
2800 tonnes and 1200 tonnes but with falling tendency.
For the bulk traffic the increase in the amount carried is probably due to the introduction of larger
ships. The Republic of Ghana (1994) thus shows that the average net registered tonnage for bulk
carriers increased from 9,650 tonnes to 10,382 tonnes between 1991 and 1993, and that the
increase may well have continued, though the low depth both in Tema and Takoradi limits the size of
ships to be used.
For the non-bulk carriers the Republic of Ghana (1994) shows that the container ships stagnated in
size while general cargo, ro-ro and semi-container ships increased rapidly in size. However, for liner
traffic the increasing load per vessel probably is not primarily due to increases in the ship size, but
rather to reorganisation of the shipping lines and the rapid concentration which has taken place during
the recent years.

Table 8. Load (tonnes) per vessel in liner traffic and dry and liquid bulk. Tema, 1987-98.
General, bagged and containerised cargo per
general cargo, ro-ro and container ship calling at the port of Tema Dry bulk per bulk carrier Liquid bulk per tanker
Imports Exports Total Imports Imports
1987 1185 628 1813 12,964 41,000
1988 1015 559 1574 11,333 13,570
1989 1245 615 1860 14,081 17,591
1990 1494 766 2260 13,868 18,818
1991 1378 581 1959 14,147 24,578
1992 1510 621 2131 13,687 15,772
1993 1458 529 1987 14,774 9,300
1994 1305 668 1976 13,372 13,448
1995 1520 631 2151 14,774 11,600
1996 1662 649 2311 12,591 13,870
1997 1575 619 2194 15,083 13,575
1998 1833 535 2368 16,987 23,111
Note: Bulk export per vessel is not shown, because it is small.
Table 9. Load (tonnes) per vessel in liner traffic and dry and liquid bulk. Takoradi, 1991-98
General bagged and containerized cargo per general cargo, ro-ro
and container ship calling at the port of Takoradi Dry bulk per bulk carrier
Liquid bulk per tanker
Imports Exports Total Imports Exports Total Imports
1991 186 1851 2037 5434 8474 13,908 5412
1992 226 1623 1849 6044 7589 13,633 2525
1993 267 2584 2851 4288 5360 9648 1930
1994 443 2785 3228 5569 6394 11,963 1875
1995 234 5738 1972 6096 7425 13,521 1000
1996 319 1240 1559 7639 7831 15,470 20,100
1997 297 1207 1504 7099 9637 16,736 4947
1998 485 1184 1669 9651 8711 18,362 3391

Note: liquid bulk export is not shown, because it is small.

CDR Working Paper 01.2 Centre for Development Research • Copenhagen
28
According to Ghana Shippers’ Council (1997) more than 100 liner companies operated in the two
ports of Ghana. However, only six of them moved 52% of the throughput. Each of the six big
companies moved more than 90,000 tonnes in 1997 and the largest, Maersk, 307,000 tonnes (see
Table 10). Most of the others move very little freight, though some of the medium-sized companies
are very important on specific routes. In fact on the individual routes to different parts of the world
Maersk only is the most important line on the connection to the Far East, and second on the route to
the Mediterranean Europe. However, where most liner companies have concentrated on certain
routes, e.g. Delmas and OTAL on Europe, Torm lines on North America and Nedloyd on the Far
East, Maersk has a more extensive network (see Table 11). By developing an efficient hub port in
Algeciras in Southern Spain where the containers are reloaded to different container ships serving
Europe, the Far East and North America, Maersk has been able to serve all the main markets with a
single high frequency route from West Africa. By doing this it has been possible to cut the costs, but
the price has been a somewhat longer travel time, e.g. the travel time from Accra to Europe is 12
days on the most rapid direct routes and 16-18 days via the hub port.
Since 1997 the large companies probably have further increased their share of the traffic, because
they are able to operate at regular time tables with high frequencies. They generally have also been
able to attract more exports and thus get a more balanced traffic flow than most of the smaller
operators. This clearly is important for the economy of the lines, and they are intensely competing for
the growing market of containerised cocoa beans and sawn timber. Delmas, which has the longest
presence in West Africa and has old links to the cocoa industry, has the largest share of the cocoa
trade while Maersk, which has expanded its activities in West Africa more recently, has a smaller
share of the cocoa beans but has been able to conquer a larger share of the rapidly growing market
for sawn timber so that cocoa beans and timber now are about equally important for Maersk.
This concentration of traffic is to a large extent a result of what OT Africa Line
(www.otal.com/confence.htm) calls the demise of the conference system. The liner conference
system attempts to monopolise traffic on a specific route to the members of the conference. In West
Africa the conference system dates back to before the Second World War, but since the acceptance
in the 1970s of the UNCTAD Code of Liner Conduct (also known as the 40:40:20 Code, seeking
to divide the traffic between ships belonging to the importing and exporting countries leaving only
20% of the traffic to third party carriers) the European conference members have co-opted with the
West African maritime authorities to share the traffic with the West African national shipping lines.
This gave the national African shipping lines a protected market and the European members excess
profits. However, during the 1980s increasing competition made it increasingly difficult to keep both
European and Asian non-members of the conference out of the market and in 1992 the European
Court in Brussels ruled the conference monopoly illegal. Since then and especially in the end of the
1990s tariffs have tended to go down. The Ghana Shippers’ Council estimated in the beginning of

CDR Working Paper 01.2 Centre for Development Research • Copenhagen
29
2000 that the freight rates for Ghana’s export have gone down from 10-11% to only 7% of the FOB
value. However, at the same time the reserved market for West African shipping lines have
crumbled, and as a result most of them, including Ghana’s Black Star Line, have closed down.
Table 10. Liner companies ranked by tonnage transported. 1997
Imports
(1000 tonnes) Exports
(1000 tonnes) Total
(1000 tonnes)
1. Maersk 163 114 307 15%
2. Delmas 130 123 253 13%
3. Otal 114 94 208 10%
4. G&C Lines 64 38 102 5%
5. Ignazio Messina 45 49 94 5%
6. CMB 51 42 93 5%
Subtotal 567 490 1057 52%
8 lines handling 33,000 - 67,000 tonnes
299 94 393 19%
102 lines handling 25,000 tonnes or less
365 209 574 28%
Total (116 lines) 1231 793 2024 100%
Source: Maritime Trade Statistics Ghana Vol. 1, No. 1, 1997. Ghana Shippers Council.
Table 11. First and second liner company on individual routes ranked by tonnage transported. 1997
Largest Second largest
UK Delmas (2) OTAL (3)
Northern Europe OTAL (3) Delmas (2)
Mediterranean Europe Ignazio Messina (5) Maersk (1)
North America Torm (9) Marigulf (8)
Far East Maersk (1) Nedloyd (12)
Africa Winkelhorn (7) Delmas (2)
Others Marigulf (8) Ignazio Messina (5)
Note. Numbers in parenthesis are the rank of the shipping company on the total tonnage transported to and from Ghana. Source: Maritime Trade Statistics Ghana, vol. 1, No. 1, 1997. Ghana Shipping Council.
In 1999 the liner traffic was further concentrated when four of the largest liner companies merged
two and two: Maersk bought the South African CMB/Safmarine and the French Delmas bought the
British OTAL. Together the two new companies control more than 40% of all the liner traffic and
probably 80% of the container traffic on Ghana’s ports.
The Ghana Shippers’ Council fear that this strong concentration may lead to a new upward trend in
the rates, a fear that seems to be supported by the reintroduction during 2000 of conference-like

CDR Working Paper 01.2 Centre for Development Research • Copenhagen
30
collaborations of major shipping lines (Maersk/Safmarine, P&O Nedloyd, WAL and two smaller
lines) which have led to two rate increases during the year 2000 (The East African Nov. 13-19,
2000).
The harbours
The two harbours are operated jointly by Ghana Harbour and Port Authority (GHPA), which is a
parastatal. After Lagos, Ghana has the highest harbour rates in West Africa. According to the
Republic of Ghana (1996) the dues of discharging a full container are more than twice the rate in
Abidjan, which is the cheapest. This is seen partly as a result of relatively high labour costs due to
historically determined but now unnecessarily large labour gangs, a system of high overtime payments
and a generally very low level of unitisation and mechanisation of the freight handling; all resulting
from a strong labour union which has been able to resist adaptation to technological changes which
have taken place elsewhere. However, in spite of the high costs the rates have been so high that
GHPA throughout the 1990s has been able to operate with a large profit. (In the period 1992-97 the
average profit was 30% of the revenue after depreciation). This may be one of the reasons why
repeated attempts from the World Bank and the donors to have the ports privatised have still not
born fruit.
The stevedoring and physical handling of freight at the ports is the responsibility of GHPA, but 15%
and 10%, respectively, of the stevedoring is done by two private companies, Atlantic Port Services
and Speedline, and 75% by GHPA. However, the three companies do not compete as incoming
ships are allocated to the three stevedoring companies by GHPA, and the shipowners have no say in
the allocation. Most of the container and ro-ro ships are handled by GHPA, which also appears to
be more efficient than the two private stevedores, partly because it has more equipment.
According to the Republic of Ghana (1996) the efficiency of the ports is comparable to that of other
West African ports, though it is low with international standards. Since the mid-1990s the ships’
turnaround time in Tema has been stable swinging around 55 hours, while in Takoradi it has dropped
from 95 hours in 1994 to only 36 hours in 1999. However, whether that is really due to increased
efficiency may be doubtful, as labour productivity is still lower in Takoradi than in Tema. Probably it
is at least partly due to a shift in the composition of ships from general cargo and bulk carriers to
container and ro-ro ships which has been especially strong in Takoradi. Thus in Takoradi in 1999 the
turnaround time for bulk carriers was 4.35 days, for general cargo carriers 2.87 days, for tankers
1.71 days, for semi-container ships 1.58 days, but for ro-ro ships only 1.17 days and for
containerships 0.64 days.
The long turnaround time is partly due to lack of efficient handling equipment and partly to congestion
and inefficient handling procedures. One additional problem for the two harbours is their fairly low

CDR Working Paper 01.2 Centre for Development Research • Copenhagen
31
water depths. In Tema the deepest berth is 9.6 m (apart from the specialised private berths for the
oil refinery and the aluminium works which are 9.8 m and 9.6 m) and the rest of the berths are only
7.2-8.7 m. In Takoradi the berths have depths between 8.0 m and 9.5, but there are also 7 buoy
moorings of which the deepest is 10.3 m. With increasing size of ships and increasing congestion in
the harbour the few deep berths have especially in Tema led to increased queuing for the deep berth
and also reshuffling of vessels between the berths, both of which increase the turnaround time. The
low depths also limits the type of ships which can be used and often requires the shipping companies
to schedule their ships such that they arrive in Ghana with limited loads in order to get into the
harbour.
Competition between Tema and Takoradi
In terms of tonnage throughput Tema is twice as large as Takoradi, but this dominance is mostly
based on imports and as export harbour Takoradi is the largest. This difference between the two
ports of course is related to the very different roles the two ports play in the economic system of
Ghana. In both ports, but especially in Takoradi, a few commodities are dominating the throughput.
In Takoradi in 1993 96% of the exports were made up by forest products (41%), bauxite (26%),
manganese (22%) and cocoa beans (8%), while 90% of the imports consist of clinker for the cement
production (62%), petrol products (which are actually not imports but coming from Tema) (15%)
and wheat (13%).
In Tema 81% of the exports consist of petrol products from the oil refinery (31%), aluminium (27%)
and cocoa beans (23%). The imports are divided on more different products, but even here crude oil
and petrol products for the oil refinery (29%), clinker and gypsum for the cement industry (23%) and
alumina, coke and pitch for the aluminium works (13%) make up 65%, while rice, wheat and sugar
make up another 14% of the imports.
The position of Takoradi as export harbour has been further strengthened during the last decade by a
growing timber export and the westward move of the cocoa belt. The trend towards containerisation
of cocoa beans and a recent change in the export taxation, which favours the export of sawn timber
rather than logs, has increased the interest of the container lines for Takoradi.
One difficulty for developing the container export from Takoradi, however, is that imports are very
limited and that therefore there is a deficit of containers in the port. Materials and investment goods
for the growing mining and forest industries, are therefore now increasingly imported through
Takoradi. However, there still are a large deficit of containers in Takoradi, and the shipping
companies increasingly move empty containers by road to Takoradi in order to satisfy the growing
demand for export containers.

CDR Working Paper 01.2 Centre for Development Research • Copenhagen
32
The larger depth and lower congestion in Takoradi are other reasons why the shipping lines have
moved an increasing share of their traffic away from Tema in spite of the general tendency towards
concentration especially of container traffic.
In Tema the harbour has an exceptionally hard gneiss rock base while the base in the port of
Takoradi consists of a much softer sandstone. Therefore it will be much cheaper to deepen Takoradi
than Tema port, and the Republic of Ghana (1996) raises the question whether Takoradi in the future
should be chosen as the only deep sea port in Ghana. However, this appears to conflict with the wish
of the Government of Ghana through its ‘gateway’ project to develop Tema into a hub port for West
Africa.
Shipping and forwarding agents
The flow of freight between shippers and shipping companies are partly managed by shipping agents,
operating on behalf of the shipping companies, and forwarding and customs clearing agents operating
on behalf of the shipper or freight owner.
The role of the shipping agents is to secure the flow of freight to the shipping companies they serve.
The smaller shipping companies (i.e. smaller in Ghana) often use independent agencies which work
for a number of often complementary shipping companies operating on different routes or different
types of freight. However, the large shipping companies tend to operate their own shipping agencies,
in the ports they serve.
Forwarding and custom clearing agents can roughly be divided in two types, namely large
multinational companies with offices in many countries, which organise international door-to-door
freight flows, and small local companies primarily concerned with custom clearing of goods imported
into Ghana.
The large multinational forwarders are so-called non-vehicle-owner-common-carriers (NVOCC)
which take responsibility for the freight and issues door-to-door bill-of-ladings, but do not have their
own means of transport (though some of them have trucks or even operate feeder shipping lines), but
subcontract all or part of the actual transportation from transport firms. During the 1970s and 1980s
they became responsible for an increasing share of the international freight flows, and especially for
the container traffic. A number of mostly European forwarding companies have set up offices in
African cities, both port and inland cities. Some operate their own trucks along the transport
corridors or organise their own train services, while others subcontract the actual transport with local
trucking companies. Information technology has been increasingly important for controlling the freight
flows, and through this forwarding has generally become a very profitable part of the transport
sector.

CDR Working Paper 01.2 Centre for Development Research • Copenhagen
33
However, during the 1990s both the large shipping companies and the large shippers have attempted
to by-pass the forwarders and conquer the profitable market for door-to-door transport. The large
shipping companies such as Maersk and Delmas have opened their own forwarding companies and
are now issuing not just port-to-port bill-of-ladings but also door-to-door bill-of-ladings, especially
for full containers, but increasingly also for consolidated containers. Some of the large shipping
companies and agents have also for some time operated their own container parks in Kumasi. The
recent take-over of Safmarine and OTAL by Maersk and Delmas is likely to increase the trend. At
the same time the large production, mining and agricultural export companies have opened their own
in-house logistics departments which forward their own exports and sometimes also the imports. The
multinational forwarders are therefore met with increasing competition.
Most of the domestic forwarding agents are small custom clearing agents which are mostly
concerned with deconsolidation of imported containers with more than one consignment. There are
more than 100 such firms most of which receive less than 25 containers per month and export much
less, if anything. Due both to lack of capital, qualifications and international contacts the domestic
forwarders have had difficulties developing into full-fledged forwarding companies. Since
independence, when Ghana attempted to develop a domestic forwarding sector they have been
registered under the Customs, Excise and Preventive Services (CEPS) and the Ministry of Finance,
and as custom clearance agents they have generally got a bad image as corrupt. Especially the more
ambitious of them are now organised in Ghana Institute of Freight Forwarders (GIFF), which has
about 150 members from both small and large forwarding and other transport companies. GIFF is
actively promoting and developing the industry among other things by upgrading it through training
programmes. They are now attempting to be moved from CEPS to the Ministry of Transport in
order to become accepted as part of the transport sector. However, to develop into a status of a
full-fledged forwarder require international contacts which few of them have been able to develop on
their own. The most successful therefore have grown by becoming local agents for multinational
forwarders. Many of the larger domestic forwarders have generally on a small scale diversified into
trucking and/or warehousing.
The flow of freight through the harbours: the harbour as a bottleneck
While long ship turnaround times represent a large cost for the shipping companies, long delays in the
harbour tend to be more important for the flow of freight and for the shipper. According to Republic
of Ghana (1996: 10.16) the average dwell-time for containers in Tema was 25 days in 1996 or more
than the total travel time from Europe, where it according to the master plan target should not be
more than 7 days and in a modern harbour only one day.

CDR Working Paper 01.2 Centre for Development Research • Copenhagen
34
This large delay is partly the result of congestion in the harbour, but a congestion which is the result
of complex handling and custom procedures and the involvement of a large number of private agents
and public authorities rather than lack of physical capacity. The custom regulations require first one
examination of all imported freight, then a re-examination, then the custom authorities supervise the
freight on trucks and finally papers and freight are again checked at the harbour gate. All these
examinations and checks require that the custom people, agents and freight owners are present. In
Tema alone this requires 500 custom officers. These procedures take up a lot of space and require
the presence of a lot of people, both of which contribute to congestion and reduced safety at the
port.
According to Republic of Ghana (1996: 10.17) ‘There is also a well entrenched, illicit payment
system in place, in addition to the legal duties payable for the clearance of cargo’. In spite of the
complex custom procedures tax evasion through under- or over-invoicing of goods appears to be a
major problem, in Ghana as elsewhere in Africa. Multinational pre-shipment-inspection (PSI)
companies which issue quantity, value and quality certificates therefore play an increasing (but often
very unpopular) role as neutral intermediaries between buyer, seller, transporter and the custom
authorities.
However, the congestion and long dwell time for freight in the ports are not only caused by the
custom authorities. Another reason is that importers often use the harbour warehouses as cheap
storage until they need the goods or are able to acquire the funds necessary to pay the custom and
clear them (Republic of Ghana 1996:10.12).
Limits to containerisation
The custom procedures requiring that practically all containers are opened, unpacked and checked
at the harbour is one of the reasons, though not the only one, why probably less than five percent of
the containers imported to Ghana continue inland from the harbours. It is possible to take containers
out of the harbour uninspected, but only by paying a deposit up to three times the value of the
content and also pay for an escorting custom officer. However, there is a special concession for the
large mining companies to import containers without pre-shipment inspection if the value is less than
30,000 US$ CIF (www.otal.com/pghana.htm-PSI-Ghana 1997). Therefore it is mostly containers
to the mining companies which continue inland, partly also because they are the only ones having
forklifts and other equipment to handle the containers.
Once the containers have been opened and unpacked there is little sense in packing them again,
especially because you have to pay a large deposit to the shipping company owning the container, so
that it can be sure to get it back (a large number of containers which have ended as shops at markets
and at the roadside all over Ghana testify that the fear of losing the containers is not unfounded) and,

CDR Working Paper 01.2 Centre for Development Research • Copenhagen
35
in addition, there is a large risk that one will be asked to unpack the container again at the many road
blocks. Therefore most containers are emptied directly on to trucks which generally can carry more
than the content of a single container (both because they do not need to carry the weight of the
container and because they often carry a heavy overload), and therefore are cheaper in transport.
Due to low labour costs this appears to be more important than the savings on reloading which in the
industrial world is the advantage of the container.
The small number of containers going inland also means that cocoa and timber which are increasingly
exported in containers are only loaded into containers at the port. However, even if containers were
available inland it might still not be economic to use them for cocoa moved by truck (and today that
is more than 90 percent of the exported cocoa), because a truck can carry more cocoa without the
container and labour costs for loading and unloading are low. Ghana and other developing countries
therefore do not get the same benefit out of containerisation as the industrialised countries.
4. The inland transport corridors
The lake Volta corridor
When the dam and power station across the river Volta at Akosombo was built in the early 1960s,
part of the plan was to develop a lake transport system on the huge lake created behind the dam. A
planned but never finished railway line between Tema and Akosombo was thought to be part of the
corridor. The new transport system should partly serve the population living along the lake with ferry
connections and partly create a new transport corridor linking the port of Tema and the industrial and
commercial south with the rich agricultural areas of the north, a modern substitute for the old canoe
link to the north. However, in spite of heavy donor support the transport corridor has been slow to
develop. The original Danish study from the 1960s foresaw an annual cargo traffic increasing from
150,000 tonnes in the first phase of the project to 425,000 tonnes in a third phase and a passenger
traffic at 70,000 passengers per year. A newer German study from 1977 raised the expectations
even further from 245,000 tonnes at the start of the new project in 1980 to 543,000 tonnes ten
years later in 1990, and a passenger flow increasing from 43,000 to 91,000 passengers in 1990
(Republic of Ghana 1996). In spite of considerable investments in infrastructure and ships the freight
traffic has been more modest, while passenger traffic on the ferries across the lake has been much
larger than foreseen. After a very low traffic during the crisis of the early 1980s freight traffic was in
1984 only 13,500 tonnes and north-south passenger traffic 58,000 (TecnEcon 1987). During the
first half of the 1990s the north-south traffic reached 60-70,000 tonnes of freight and around 40,000
passengers per year, while the ferries in the early 1990s carried 500-600,000 passengers and 20-
25,000 vehicles per year. However, during the late 1990s traffic has been falling again, mostly

CDR Working Paper 01.2 Centre for Development Research • Copenhagen
36
because Volta Lake Transport Company (VLTC), which is responsible for the traffic on the lake,
has had increasing difficulties keeping up regular traffic (Gibb/Law Gibb Group 1999).
There are a number of reasons for this. Most important is it that the water level on the lake has been
falling during the 1990s to a level where parts of the lake has not been navigable and ferries have
been unable to reach the landing bridges. But there are also organisational problems. VLTC was
formed in 1970 as a subsidiary of the Volta River Authority (VRA) (but placed under the Ministry of
Transport) which is a parastatal administering the river system and first of all the power station.
VLTC is supposed to operate the north-south connection on economic terms, while the ferries
across the lake are considered a social service to the residents along the lake, the deficit of which is
supposed to be financed by VRA. However, due to the low water level VRA produces much less
power than expected and is therefore unable to finance VLTC’s deficit. Though most of VLTC’s
activities are able to cover its running costs they are not able to pay for reinvestment and
maintenance of the capital equipment, and for the dredging and marking of waterways and the
extension of landing bridges which has become a necessity due to the low water level. Poor access
roads to the ports and landing bridges is another reason for the generally low traffic.
Until the mid-1990s the UK-owned Liner Agencies served as shipping agent for VLTC. Now
GPHA serves as VLTC’s shipping agent. It is not clear whether this has impacted on the low traffic
flow.
During the 1990s the World Bank has financed the building of a pipeline from the oil refinery in Tema
to Akosombo and tank farms in Akosombo and Buipe (at the northern end of the lake) in order to
supply Northern Ghana and possibly also Burkina Faso with oil. Under ‘normal’ circumstances this
oil traffic would be able to finance VLTC’s activities. However, due to the low water level VLTC
has not been able to operate the new oil transport corridor as planned.
According to the Republic of Ghana (1996) there are still plans to revive the project for a Tema-
Akosombo railway and also for building an inland port in Buipe, although according to the Republic
of Ghana (1996) this will require a traffic of more than a million tonnes per year to be economically
justifiable.
The railway corridors
The total length of Ghana Railway Corporation’s (GRC) railway network is 943.5 km. It consists of
three main lines: the western line from Takoradi to Kumasi, which is the most important, the eastern
line from Accra to Kumasi, and the central line, from Huni Valley on the western line north of
Takoradi to Kotoku Junction on the eastern line north of Accra, which connects Takoradi and
Accra. On the western line there are two branch lines to Prestea (29.4 km) and Awaso (73.2 km),

CDR Working Paper 01.2 Centre for Development Research • Copenhagen
37
which carry manganese and bauxite, respectively. On the central line there is a branch line to the
palm oil plantations in Kade (40,5 km). Finally the eastern line has a branch line to Tema Port (23.7
km) which, however, has been closed since 1993 due to the break down of a bridge. In connection
with the renovation of Tema port there are plans to remove the rails from the port area.
Economically the western line has always been the most important and the GRC headquarters have
from the beginning been located in Takoradi. From the opening of the harbour in Takoradi in 1927
and until 1977 the railways and harbours were operated jointly by the Gold Coast (later Ghana)
Railway and Harbour Administration.
The railway traffic culminated in 1970/71 when the railways carried 1.822 mill. tonnes of freight and
8.155 mill. passengers. The freight then was fairly evenly distributed on manganese (26%), bauxite
(19%), timber (25%), cocoa (12%) and other (18%). However, in 1973/74 started a long and rapid
decline in the freight traffic which did not stop until 1983 when the railways only carried 357.000
tonnes of freight, due both to the general decline in the economy and to deterioration of both the
tracks and running stock of the railways.
Since 1985, after the introduction of the structural adjustment policies, there has been a generally
upward trend in the traffic which in 1999 reached 973.000 tonnes. However, now 83% of the traffic
consists of manganese and bauxite which have no alternative to the railway, while cocoa (3%),
timber (6%) and other goods (8%) to a large extent have converted to road transport. Thus the
railways’ share of the cocoa transport has dropped from 37% in 1986/87 to only 7% in 1998. In the
case of timber the decline is partly due to new export tariffs on raw timber which since the mid-
1990s have made it more profitable to export dried and sawn timber. This means that most of the
timber today is transported to the saw mills in Kumasi, before it is exported in the form of sawn
timber. GRC carry practically no container traffic though they charge only half the price of the
trucking industry (20-22 US$ between Kumasi and Takoradi), partly because they have only 15
flatbeds suited to carry containers.
The passenger traffic went down slowly during the 1970s, but then dropped dramatically from 6 mill.
in 1980 to only 2.5 mill. in 1982. During the mid-1990s the railways carried 2.1-2.3 million
passengers per year which were responsible for about 40% of the total earnings of the railways.
However, in 1999 the number of passengers had dropped to only 1.4 million.
At the time of the fieldwork in February 2000 GRC operated 2½ passenger trains per day on the
western line, one on the central line, one every second day on the eastern line, and in addition some
local trains around Accra. However, apart from occasional trains with cocoa and timber on the
central line almost all the freight traffic is on the western line.

CDR Working Paper 01.2 Centre for Development Research • Copenhagen
38
The increased freight traffic during the 1990s has been made possible by donor financed
rehabilitation programmes which, however, have been concentrated on the western line in order to
increase its capacity to ferry export products to the harbour in Takoradi. In spite of the rehabilitation
carried out the conditions of the tracks are still generally poor even on the western line. This is partly
because originally the tracks were built to a low standard and with many curves, and partly due to
poor maintenance. Thus while the design speed generally is 56 km/hour, the real maximum speed is
on many stretches much lower, and while the design axleload is 15.75 tonnes on large parts of the
network the maximum is only 12.3 tonnes. At the same time there are serious problems with the
communication system, which together with the poor track maintenance leads to frequent derailments
and collisions. Although the capacity of the existing locomotives and rolling stock in principle should
be sufficient in practice they are not, because often they are not available due to lack of spare parts,
poor maintenance, derailments, and lack of locomotive power to get the wagons where they are
needed (Republic of Ghana 1996; Ministry of Roads and Transport 1998).
Throughout the 1990s there have been discussions about the privatisation of GRC, and apparently
the government has approved the division of GRC into a track-owning and an operational company
of which the operational company should be privatised. However, a more detailed study of this has
still not been carried out. Most advanced seem plans to sell off non-core activities or commercialise
the excess capacities in workshops, sleeper plant, ballast plant, saw mill, training school etc. There
are also plans to involve the mining companies in the operation of the mining trains (Ministry of
Roads and Transport 1998).
At the time of the fieldwork GRC had 4,600 employees, but found that at the present level of activity
this should be reduced to about 2,500.
Containerisation and the proposal for an inland port in Kumasi
In 1988 a feasibility study was carried out for an inland port and freight terminal at Fumesua 8 km
east of Kumasi, an area close to both the eastern railway line and the main road between Kumasi
and Accra. In a reappraisal study commissioned by the Ghana Shippers’ Council this was in the late
1990s brought up-to-date and extended with plans for a container depot, a free port and an export
processing zone attached to the inland port (Transportation and Development Planning Consultants
1999).
The purpose of the inland port is
− to bring Kumasi and its hinterland within the reach of the container traffic, in order to reduce
the costs and increase the security of imports.

CDR Working Paper 01.2 Centre for Development Research • Copenhagen
39
− It should relieve the congestion in the ports of Tema caused by the rapid increase in
container traffic. According to the Ghana Shippers’ Council (and Prof. Tamakloe) about
30% of the containers imported to Ghana have destinations in or north of Kumasi. By
transferring custom clearing and deconsolidation of these containers to the inland port the
congestion at Tema port would clearly be reduced (although part of the 30% must be
imported through Takoradi).
− It should bring a better balance in the flow of containers. One of the difficulties for
containerisation of the export of cocoa and sawn timber is that most of the cocoa and sawn
timber is produced in western Ghana and at saw mills in Kumasi, while most of the empty
containers available for export are in Tema. This has forced shipping companies to move
empty containers from Tema to Takoradi by road at high costs (according to the Republic of
Ghana (1996) 300 US$ per container), and it has also (together with the congestion in
Tema) been one of the reasons for the increased container traffic in Takoradi. By moving
part of the import containers to an inland port in Kumasi more empty containers will become
available for exports in western Ghana.
− At the same time it will make it possible to containerise the export closer to the point of
production and thus increase the security (and possibly reduce the cost) of transport. In
quantitative terms especially cocoa and sawn timber will be containerised, but the increased
security may be even more important for the export of other manufactured products. In this
connection it is also hoped that the inland port will improve the position of Ghana as
gateway for Burkina Faso’s and Niger’s foreign trade.
However, how the inland port will influence the inland traffic flows is not clear. The multi-modal
study (Republic of Ghana 1996) argues based on the present infrastructural situation (with no freight
traffic on the eastern railway line) that the containers will be moved by road from Tema to Kumasi,
and then from there filled with cocoa and sawn timber by the railway to Takoradi. This should also
bring more balance to the traffic on the western railway line, because the wagons which bring logs to
the saw mills in Kumasi will also be able to bring the containers to Takoradi. In line with this
argument the study also argues for a redistribution of most of the containerised export from Tema to
Takoradi which is better located for the export production, is less congested and has a greater depth
(and is cheaper to dredge to even greater depth) than Tema.
On the other hand, the new study commissioned by the Ghana Shippers’ Council assumes (as does
GRC) that the eastern railway line will be rehabilitated and that the containers therefore will be
moved from Tema to Kumasi by both road and rail. In fact, rehabilitation of the eastern railway line

CDR Working Paper 01.2 Centre for Development Research • Copenhagen
40
may be a pre-condition for the success of the inland port if it is correct that it at present is more
expensive to move the goods in the containers than to load them directly into a truck. However, if
cheap railway transport is available to both Takoradi and Tema, it appears questionable whether the
export containers would not rather be brought out via Tema which is only 30-40 km further away
from the inland port than Takoradi and has much larger frequency of ship arrivals and departures.
Concentration of the container traffic in Tema would clearly also be more in line with the current
trend towards concentration and with Ghana’s policy of developing Ghana/Accra into a hub and
gateway to the landlocked West Africa.
Finally the possibility that cocoa in the future might be exported in bulk rather than in containers (see
above in Section 3) will clearly influence the inland port project negatively.
Ghana as a gateway to West Africa
Ghana has during the last part of the 1990s attempted to market itself as the gateway or hub to the
landlocked West African countries. The government has established a Gateway Services Company
to coordinate activities and administrative reforms supporting the gateway project, such as
development and maintenance of transport services and infrastructure and reorganisation and
rationalisation of port and airport authorities and their rates and of the procedures of custom
authorities and road police. The establishment of inland ports is also seen as a tool to improve the
access to the landlocked countries. Such an effort is clearly important for the improvement of
Ghana’s transport, communication and trading system, although the effect so far appears to have
been limited.
Transit traffic to and trade with the neighbouring countries is small though both seem to be rapidly
increasing. Burkina Faso Shipper’s Council established an office in Tema in 1996 and since then the
transit traffic has increased from only 1300 tonnes in 1997 to more than 30,000 tonnes in 1999.
Niger’s Public Transport Users’ Council established an office in 1999 and registered from April to
September 1999 43,700 tonnes of transit freight (mostly flour, sugar and rice). Very little of this is
containerised. The freight rate from Tema to Ouagadougou is 22,500-24,000 CFA/tonne (25-27
US$/tonne) and to Niamey 30,000 CFA/tonne (33.5 US$/tonne). But in addition to this comes
20,000 CFA/tonne (22.3 US$/tonne) for forwarder and custom escort for the first 5 tonnes and
12,000 CFA/tonne (13.4 US$/tonne) above 5 tonnes.
However, these figures only comprise goods imported by Burkinabe or Nigerian traders. More
goods may be imported by Ghanaian traders and re-exported to Burkina Faso or Niger. Such goods
cannot go as transit goods. They have to pay customs in Ghana, but not for the escort. How much
this re-export amounts to we do not know, but Ghana’s export to Burkina Faso and Niger appears

CDR Working Paper 01.2 Centre for Development Research • Copenhagen
41
to have been increasing rapidly since 1995 and a good deal may be re-export of goods imported to
Ghana.
Morris and Dadson (2000) have estimated the total amount of border trade of four commodities
(aluminium products, iron rod, salt and tomato) at the border posts in the north eastern corner of
Ghana to about 50,000 tonnes/month of which 90% is salt.
On the other hand very little export from Burkina Faso and Niger appears to come out through
Ghana. Truckers operating on the routes to Burkina Faso and Niger report on less than 10% of
return freight, and this comprises mostly cows, onions, cotton lint and seeds, meant for the Ghanaian
market rather than for re-export.
Although the road network in northern Ghana is now in fairly good shape, custom regulations, and
frequent road blocks are still hindrances for Ghana’s dreams to become a gateway to and a hub for
West Africa.
However, even if these hindrances to effective land transport are removed, e.g. by establishment of
inland ports, the more serious hindrances are found on the maritime side of the transport system. The
container lines today call on more than 40 harbours in West Africa, on what the Republic of Ghana
(1996) calls the ‘milk-run’. They often operate with ships with a capacity of up to 30,000 tonnes
dead weight or 1300-1600 containers which when fully loaded have a draught of more than 11 m
which is available in only a few of the West African harbours. Most lines therefore make their first
calls in some of the larger and deeper harbours in order to reduce their weight before they call on the
shallower harbours and then call on the deep harbours again in order to fill up before they leave
West Africa. Although the individual lines do not call on all the harbours it also results in very long
travel times.
In order to reduce the turnaround time and utilise the larger and more efficient ships most shipping
companies therefore would prefer to limit the harbours they call on to a small number of efficient
hubs with large traffic and great depth and have the smaller harbours served by feeder lines. Today
both Delmas and Maersk use Abidjian as a partial hub, and Torm Line which serves the US market
from Abidjian and Dakar operate their own feeder line along the coast. With the present limited
traffic and strong competition such a restructuring, which has taken place in most other parts of the
world, however, is difficult to carry through in West Africa because the big lines would depend on
the feeder traffic in order to get enough freight, while smaller lines are willing to serve the smaller
harbours with direct lines and thus by-pass the feeder lines.

CDR Working Paper 01.2 Centre for Development Research • Copenhagen
42
The strong concentration of traffic on a few large shipping companies which has recently taken place
may change this. However, from the point of view of the large shipping companies Abidjan with its
larger traffic, greater depths and the railway to Burkina Faso (which was privatised in 1994 with
major shipping companies and forwarders (SAGA, SDV and Maersk) as controlling shareholders
(Mitchell and Budin 1998)) would be a more logical choice of hub than Accra, unless of course the
Ivory Coast is politically in turmoil.
Pálson (1998) has attempted to compute the social benefits of shifting from a ‘multiple ports of call’
system (like the existing one) to a ‘hub-and-spoke’ system with Abidjan as hub for West Africa from
Senegal to Cameroun. He found that the cost differences between the two systems would be
negligible, but that the shift, not surprisingly, would benefit the hub, and increase the costs for the
other ports. This contrasts with South East Asia where the hub-and-spoke system generally has been
seen as beneficial. On the other hand, a hub-and-spoke system for West Africa with two or three
hubs may be more beneficial and certainly would distribute costs and benefits more equally than the
one-hub system analysed by Pálson.
Ghana’s gateway project may change some of the disadvantages of Accra/Tema as a hub such as
high port rates and lack of efficiency. Even the shallow waters may be changed by dredging, albeit at
a high cost. However, the larger traffic and better access to the landlocked countries are difficult to
change and the increasing division of Ghana’s traffic on two ports increases the problem.
These difficulties, however, does not make the ‘gateway project’ less important, because although it
may be unlikely that Accra develops into a West African hub port and becomes a gateway of the
landlocked countries, Ghana depends on the development of its infrastructure as a gateway from the
country itself to the world.
5. The trucking industry
Size and increase of the trucking industry
A serious difficulty in discussing the development of the trucking industry is that statistical data are
very scarce. Even simple figures for the number of trucks have not been readily available. One of the
reasons for this is that the trucking industry and road transport more generally has been to an
extreme degree unregulated. New automobiles have to register and get a licence plate, but there has
not been any system of deregistration and therefore no information about how many automobiles
have been scrapped or are off the road. Automobiles have been required to pass a roadworthiness
test twice a year, and this has been used to get an impression of the number of vehicles. However,

CDR Working Paper 01.2 Centre for Development Research • Copenhagen
43
these tests have increasingly been evaded, especially by the trucks (Republic of Ghana (1996:8.20)
cites data indicating that the evasion of trucks may be as high as 65%), so these data are not very
reliable.
Apart from the 1952 data cited in Section 2 from Gould (1960) (showing the number of motor
vehicles to be 20,000 of which 11,000 were commercial including 70% mammy wagons) I have not
been able to find any data on the number of automobiles before 1986, but most likely it stagnated or
even fell during the 1970s and early 1980s (Howe 1995). However, TecnEcon (1987) estimated
that in 1986 there were 87,000 motor vehicles of which 13,600 were trucks. However, there was
17,500 busses of different sizes, including 3,500 mammy wagons which especially in the rural areas
play an important role in the freight transportation. According to estimates in the Republic of Ghana
(1996) this had by 1996 increased to 251,000 vehicles of which 26,000 were trucks and 97,000
busses, including 23,000 mammy wagons (see Table 12).
During the period 1995-97 a new automobile re-registration has taken place. This new registration
indicates that by the end of 1997 there was 343,564 motor vehicles of which 37,800 were trucks
and 66,000 busses (number of mammy wagons is not specified, but it has probably been decreasing
during recent years). This corresponds to a growth in the number of motor vehicles of more than
13% per annum since 1986. The number of trucks has grown by only 10 to 11% per annum. By
adding the number of new registrations in 1998 (51,339 vehicles) and in 1999 (55,712 vehicles) the
total number of vehicles by the end of 1998 and 1999 has been obtained to 394,903 (of which
44,200 trucks and 77,300 busses) and 450,615, respectively. These figures, however, must be too
high because they do not take account of vehicles taken out of use during the period.
Table 12. Development in the number of motor vehicles. 1986-98
1986c) 1996 1998
Motorcycles 530061% 48,47512,3%
Private cars 43,70050.2% 127,000 d)50.6% 169.62743.0%
Taxis 64007.4% 49,41012.5%
Buses 17,500 a) 20.1% 97,100 bf)38.7% 77,27019.6%
Trucks 13,60015.6% 26,89010.7% 44,21911.2%
Tractors 5000.6% 5,8771.5%
Total 87,000100.0% 250,990 e) 100% 394,903100% a) Including 4500 mammy wagons. b) Including 23,000 mammy wagons. c) Of the figures for 1986 7000 private cars, 5000 buses and 5000 trucks are estimated to be government owned. d) Including 38,000 vans and pickups, which are not specified in the figures for 1986 and 1998. e) Excluding motor cycles and tractors. f) This figure might comprise taxis which are not specified in the 1996 estimate. Sources: 1986: TechEcon (1987) 1996: Republic of Ghana (1996)
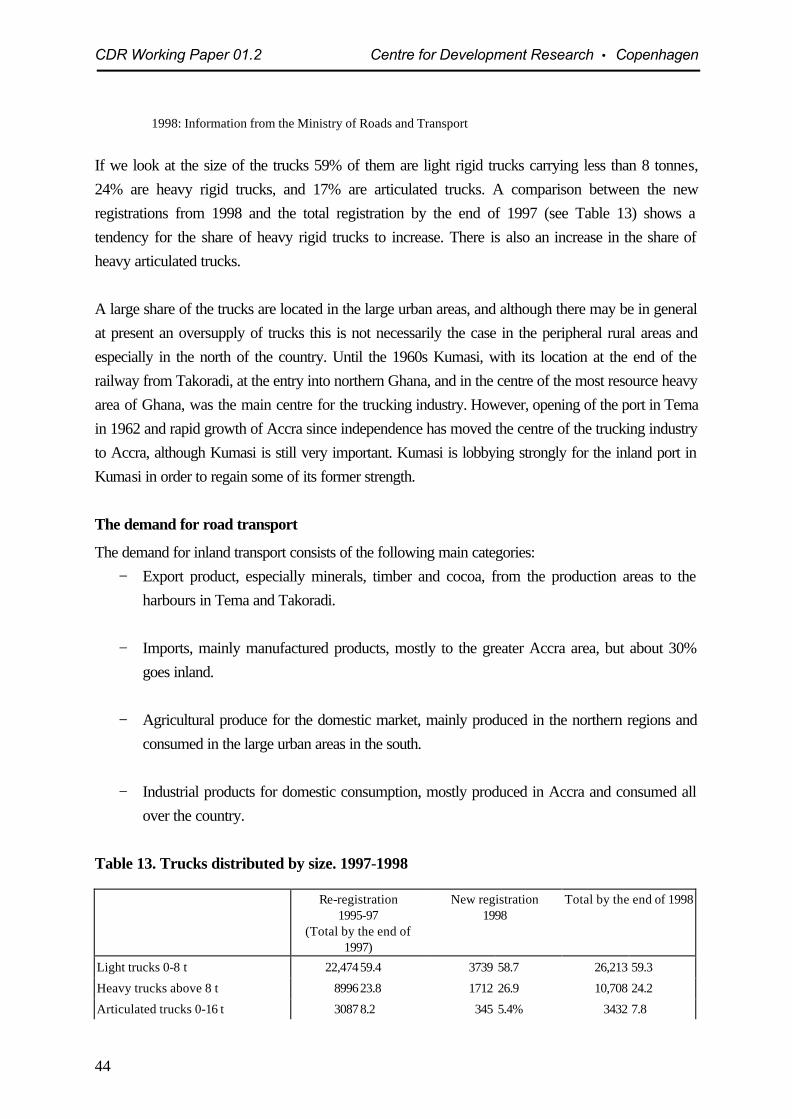
CDR Working Paper 01.2 Centre for Development Research • Copenhagen
44
1998: Information from the Ministry of Roads and Transport
If we look at the size of the trucks 59% of them are light rigid trucks carrying less than 8 tonnes,
24% are heavy rigid trucks, and 17% are articulated trucks. A comparison between the new
registrations from 1998 and the total registration by the end of 1997 (see Table 13) shows a
tendency for the share of heavy rigid trucks to increase. There is also an increase in the share of
heavy articulated trucks.
A large share of the trucks are located in the large urban areas, and although there may be in general
at present an oversupply of trucks this is not necessarily the case in the peripheral rural areas and
especially in the north of the country. Until the 1960s Kumasi, with its location at the end of the
railway from Takoradi, at the entry into northern Ghana, and in the centre of the most resource heavy
area of Ghana, was the main centre for the trucking industry. However, opening of the port in Tema
in 1962 and rapid growth of Accra since independence has moved the centre of the trucking industry
to Accra, although Kumasi is still very important. Kumasi is lobbying strongly for the inland port in
Kumasi in order to regain some of its former strength.
The demand for road transport
The demand for inland transport consists of the following main categories:
− Export product, especially minerals, timber and cocoa, from the production areas to the
harbours in Tema and Takoradi.
− Imports, mainly manufactured products, mostly to the greater Accra area, but about 30%
goes inland.
− Agricultural produce for the domestic market, mainly produced in the northern regions and
consumed in the large urban areas in the south.
− Industrial products for domestic consumption, mostly produced in Accra and consumed all
over the country.
Table 13. Trucks distributed by size. 1997-1998 Re-registration
1995-97 (Total by the end of
1997)
New registration 1998
Total by the end of 1998
Light trucks 0-8 t 22,47459.4 3739 58.7 26,213 59.3
Heavy trucks above 8 t 899623.8 1712 26.9 10,708 24.2
Articulated trucks 0-16 t 30878.2 345 5.4% 3432 7.8

CDR Working Paper 01.2 Centre for Development Research • Copenhagen
45
Articulated trucks 17-31 t 20625.4 315 4.9% 2377 5.4
Articulated trucks above 31 t 12293.2 260 4.1% 1489 3.4
Total 37,848100 6371 100 44,219 100
Source: Information from the Ministry of Roads and Transport.
Of these demands the transport of agricultural produce both for the domestic and export markets are
by far the largest comprising probably more than two thirds of the total demand. The harbour-related
import/export flows have partly been treated above so this section will primarily focus on the
domestic inland transport flows.
Road transport is easily the most important mode of inland freight transport. The Republic of Ghana
(1996) cites data from 1989 showing that 80% of the freight went by road, 12% by rail and 7% by
lake transport, and today the dominance of the roads is likely to be much stronger (probably much
more than 90%) as the road traffic has increased much more rapidly than both rail and lake
transport.
This demand for road transport is highly seasonal, requiring a high transport capacity at the peak.
Especially the transport of agricultural produce both for export and for the domestic market is highly
peaked. It also originates in rural areas with generally poor road infrastructure where transporters are
often unwilling to go. In order to serve this peaked demand the agricultural parastatals, which have
traditionally been responsible for the collection of a large share of the agricultural produce, have
mostly used a combination of own-account vehicles (to serve peripheral areas where the private
transport companies are unwilling to go) and transport contracts with large transporters (to serve the
major transport flows), supplemented with hire of trucks at the spot market during the highest peaks.
Own-account and commercial trucking
Trucks are typically operated in one of three different ways:
− as own-account trucks operated by public or private, manufacturing or trading
enterprises and primarily transporting their own goods;
− as trucks operating on contract with one of the large public or private enterprises; and
− as trucks for hire on the spot market normally organised by one of the transport unions
which control the transport terminals.
However, in Ghana there is in practice no clear-cut distinction between the three groups of trucks as
it is not illegal for own-account trucks to be hired out, and they often are, and although the spot

CDR Working Paper 01.2 Centre for Development Research • Copenhagen
46
markets are operated by the transport unions (see below) they are accessible to anybody against a
fee.
In 1986 a large share of the trucks were own-account trucks. More than a third of the trucks were
government owned and operated mostly by the large parastatals (although some were operated by
the three government owned transport companies), and others were owned by private companies
(TechEcon 1987). Before trade liberalisation lack of maintenance and spare parts often made hire
transport highly unreliable, at the same time as large peaks in the transport demand made it difficult to
hire enough transport capacity during the peaks. This was especially true in the peripheral parts of
the country where the roads were rough and the transport companies therefore often unwilling to
send their trucks, fearing that they might break down. Therefore it was often necessary for the large
companies to have their own trucks to satisfy at least part of their transport demand.
Trade liberalisation made it possible to import spare parts, but at the same time increased the prices
to a level where most truckers could not afford them, and therefore it did not really solve the
reliability problem. However, it led to a rapid increase in the import of often very old second-hand
vehicles from Europe, which increased the transport capacity, but rather contributed to the reliability
problem. Fekpe (1996) cites data showing that more than 50% of the freight vehicles in the early
1990s were more than 10 years old and that 10% were more than 22 years old. Ghana has recently
prohibited the import of used vehicles older than ten years.
As a result of the low reliability outsourcing of transportation from the large manufacturing and
trading enterprises has been a mixed and rather slow process. Some of the large parastatals have
reduced their vehicle fleet (e.g. PBC reduced its fleet from 382 in 1986 (of which many were not
operational) to 196 in 1996), but many both private and public enterprises have retained or
developed their own-account transport. However, as a share of the total truck fleet own-account
trucks have undoubtedly gone down, although we have no figures for this. Republic of Ghana (1996)
finds that it is unlikely that more than 5% of the freight is operated by state-owned own-account
vehicles, but the absolute number of private own-account trucks has probably increased. For
instance, Unilever, which in other African countries (e.g Zimbabwe) has outsourced their distribution,
operates its own distribution system in Ghana.
Trucking for hire in Ghana is dominated by small businesses. A large number of the second-hand
trucks are imported from Europe by individuals who have either themselves been working in Europe
or have family members working there. The vehicles are often taken straight off the street and
imported without any rehabilitation. Many vehicles are still painted with Dutch and German
advertisements. The ro-ro connection between Accra and West Europa has made this individualised
import easy.

CDR Working Paper 01.2 Centre for Development Research • Copenhagen
47
For many of the individuals who import one or a few second-hand trucks, the trucks are an
investment meant to generate some cash income. Often they have no interest in the transport business
as such and do not operate the trucks themselves but hire a driver to do this. Due to the difficulty of
controlling the driver, especially in earlier days, the driver paid a fixed rent to the owner for renting
the truck which after a number of years would then belong to the driver. Thus in reality the driver
would be a renter with a hire-purchase scheme rather than an employee. However, due to high
interest rates and inflation such schemes seem to be less important now, and all the people I talked to
said that the drivers are paid a (often very) low fixed monthly wage and a per diem (which is
relatively much higher than the monthly wage) when they are on the road. This clearly encourages
drivers to seek freight and be on the road, but it also means that the costs of low and peaked
demand to a large extent are born by the drivers.
Although most of the trucks for hire are operated by people who own only one or a small number of
vehicles there is also a number of larger ‘fleet’ operators. TechEcon (1987) estimated that there was
not more than 20 "fleet" operations in the mid-1980s, and ten years later Republic of Ghana repeats
that ...there is only a small number of private sector freight operators with relative large fleets... of up
to approximately 70 vehicles. However, since then some of the “fleet “operators have grown above
the 70 vehicles, and also new fleet operators have been established apparently both in Accra/Tema
and in Kumasi, but it is not possible to give any precise figure for this. (In Takoradi I interviewed a
young Kumasi-based truck owner who claimed that he together with his brother owned 150
articulated trucks, and in Tema some of the shipping and forwarding companies have established
transport companies which often operate for both own-account and hire).
Regulation and organisation of the commercial trucking industry
The commercial trucking industry is organised jointly by the government and a number of trade
unions and associations, but the government regulation is very limited. Anyone with a vehicle can
operate it commercially. No licences are needed and, apart from the initial vehicle registration and
two annual roadworthiness tests, no fees are paid. Since 1989 a three percent tax have to be paid on
the freight rate. The Ministry of Transport publishes regularly transport rates. They are not legally
binding, but the unions use them.
In the absence of government regulation the trade unions and associations have come to play an
important role in the organisation of the industry. The commercial transport industry is organised by
two trade unions, which organise both owners and drivers:
− Ghana Private Road Transport Union (GPRTU); and
− Ghana Cooperative Transport Union (GCTU);

CDR Working Paper 01.2 Centre for Development Research • Copenhagen
48
and three trade associations which organise only vehicle owners:
− Ghana Road Haulage Association (GRHA);
− Ghana National Transport Owners Association (GNTOA); and
− Progressive Transport Owners Association (PTOA).
GRHA only organises truck owners, while the two unions and the two other trade associations
organise both passenger and freight transport.
Especially GPRTU plays an important role in the organisation of the industry. It manages a large
number of lorry parks all over the country, which serves as transport terminals and spot markets for
freight transportation. The lorry parks are typically located at markets, the harbours and close to
large industries or trading depots. GPRTU does not own the lorry parks. They are generally owned
by the local governments, and have generally very poor infrastructure. They are often little more than
a plain, untarmacked field with a small office building. There are seldom any secure storage space
and no equipment for loading and unloading of freight. Each lorry park will typically have a number
of trucks associated, but truck drivers or owners do not need to be associated with the lorry park or
to be members of the union in order to use the lorry park, though non-members may have to pay a
larger fee. The lorry park manager serves as a broker between transport buyers and truckers. He
issues waybills for the freight, enforces the government transport rates and administers the three
percent tax for the government.
Truck drivers queue up for new loads at the lorry park and are served in turn. However, especially
during the low season the spot market is very saturated and drivers often have to wait for days or
even weeks before they get a new job. Thus the over-capacity does not lead to increased price
competition, though the government rates, which GRPTU uses, apparently are often undercut and
the rates for demurrage, which are part of the rate structure, seem seldom to be paid. Similar queuing
systems which prevent price competition are in operation in many African countries (see e.g. Ellis
and Hine (1998) and Hine and Rizet (1993).
GPRTU has also allocated and administered some government/donor supported hire-purchase
schemes helping drivers in the urban passenger transport to buy their own vehicles, and both lorry
park managers and drivers were very keen on getting such government or donor funds for freight
transport as well.
While most of the individually owned/operated trucks operate at the spotmarkets organised by the
transport unions at the lorry parks, the larger “fleet “ operators tend to a large extent to rely on

CDR Working Paper 01.2 Centre for Development Research • Copenhagen
49
transport contracts with the large parastatals, such as PBC, or private companies. In order to get a
more reliable service these organisations use the large more professionally operated trucking
companies, which tend to use newer trucks (though also most of these appear to buy second-hand
trucks) and have their own repair workshops. For this they pay rates which tend to be 10-15%
above the government rates, and also provide a more secure market. This market is not competitive,
rather contracts appear often to be allocated politically, and according to some interviewed persons
in the transport industry large kick-backs have to be paid to get the contracts. Some of the large
transport companies which have traditionally been involved in the cocoa evacuation are now after the
privatisation of the cocoa trade attempting to become involved in joint ventures with the new private
produce buying companies.
During the present era of public - private partnerships the conflicting interests of GPRTU as both a
drivers union and an owners association apparently are becoming an increasing problem. In the new
road fund it is the Ghana Road Haulage Association (GRHA) which has become the representative
for the trucking industry (although some of the other organisations also appear to have committee
members). GRHP in principle organises trucking companies with more than five trucks. According to
the chairman it has 205 members of which, however, only 70 are active. Together they have a fleet
of 420 trucks. Considering that apparently some of the large trucking companies are members this
seems to be a very low figure.
The efficiency in the trucking industry
In spite of almost complete deregulation and a large overcapacity of Ghana’s trucking industry the
efficiency generally seems to be very low and the transport rates correspondingly high. Our
interviews indicate that very few trucks drive more than 50,000 km and most drive much less,
although the large trucks in the large transport companies probably drive more than 50,000 km. The
Republic of Ghana (1996) estimated roughly the average truck to drive 25,000 km per year, but
even that appears to be a high estimate. This is less than half of what an average truck drives in
developed countries. At the same time the degree of return load is very low (our interviews indicate
less than ten percent) so the number of effective kilometres is probably less than 15,000 km.
There are a number of structural reasons for the low efficiency and high transport rates. The high
seasonality of the transport market means that very few trucks drive for more than 200 days a year
and most drive considerably less. Many of the trucks active in the cocoa evacuation only operate 6
months a year and as there is typically only one driver per truck they clearly do not drive every day
during that period. The many trucks needed to satisfy the peak transport demand means that there is
a large over-supply during the low season. Therefore many trucks are only kept in operation during
the peak season. Still the trucks which do operate during the low season often have to wait days or
even weeks at the lorry parks for new long distance jobs. At the same time trucks often have to

CDR Working Paper 01.2 Centre for Development Research • Copenhagen
50
operate on bad roads where the maximum speed is low, and night driving is for security reasons
uncommon (and until recently it was prohibited).
Trucks operating in the urban areas may be able to operate for more days, but due to long loading,
unloading and often also demurrage times they are often unable to reach more than a single job and
drive only 10-20 km. For instance the trucks carrying containers with cocoa beans from the
warehouses behind Tema port to the port, a distance less than 5 km, normally are only able to make
one trip a day due to long queuing time.
The only way to satisfy the peak demand for transport without excessive costs is by using second-
hand trucks, which, however, leads to unreliability problems. Therefore trucks are often grounded
for repair for long periods of time, partly because they are old and partly because spare parts are
expensive and often not available, or the owners do not have the funds to repair them.
At the same time the need for high speed in the cocoa evacuation at any costs (because the need for
a rapid recirculation of capital is more important than the transport costs at the same time as there is
a danger for deterioration of the quality of the beans if the evacuation takes too long) combined with
a lack of communication systems lead to very low levels of return freight which further increases the
peak demand and the costs.
However, the low efficiency is also due to inefficient management of the trucks. The many absentee
truck owners with no training in truck management and little interest in it is one reason. As is typical
in small African businesses investments are treated as sunk cost, and focus is on the cash flows only
and savings for reinvestment and maintenance are most often not made.
In the absence of the owner it is the driver who becomes responsible for the daily management of the
truck, but often without any knowledge about the financial status of the enterprise and without the
power to make the necessary decisions. And where absentee owners own more than one truck they
will tend to be operated individually with little or no coordination.
Loading and unloading is almost universally done manually, as forklift and other mechanical
equipment in general is only available at the harbours and the multinational companies, for instance
the mining companies. Therefore containerisation of palletisation only has taken place between the
ports and some of the multinationals. However, the low wages at present paid for manual loading
and unloading do not make containerisation an attractive alternative.
Also practically none of the trucks have modern communication equipment, such as radio or
telephone. Very few even in the large companies are equipped with a tachometer and even the

CDR Working Paper 01.2 Centre for Development Research • Copenhagen
51
imported truck that do have it do not use it. Even the speedometer mostly do not function, which is
one of the reasons why very few transporters know how many kilometres a year their trucks run.
Although both owners and drivers are members of GPRTU the union appears to speak the interests
of the drivers rather than the owners, which hardly furthers the development of efficient management.
Given the lack of communication systems the brokering and queuing system established by GPRTU
at the lorry parks may be important for the operation of the transport system. From the point of view
of drivers (and probably also owners) it may lead to a fair distribution of the available transport job.
But it does little to coordinate the transport flows, increase the amount of return freight and reduce
the transport costs. Therefore Hines and Rizet argue strongly for a system of more competitive
transport forwarders or brokers as it exists in e.g. Pakistan.
This pattern of low efficiency and correspondingly high costs is also found in other studies of African
trucking, and contrast markedly with findings in Asian countries. Thus Rizet and Hine (1993) and
Hine and Rizet (1998) found in a comparative study of long-distance transport in three Francophone
African countries and Pakistan in the late 1980s that trucking rates in the African countries were 8-
10 US cents per tkm or 5-6 times larger than the comparable rates in Pakistan (1.5-2.5 US cents
per tkm) and the efficiency much lower. Similar high rates were found in Zambia and Zimbabwe in
1989, and more recently in 1995 Hines, Ebden and Swan (1997) found that long-distance freight
rates in Tanzania on the average were 7-9 US cents per tkm or three time higher than for Indonesia
(2-3 US cents per tkm) (Ellis and Hine 1998).
Hine and Rizet (1998) find that about half of the cost difference between the African and Asian
transport rates in the late 1980s was due to higher input costs in Africa, such as vehicle costs, spare
parts, gasoline and tires. The other half was due to inefficiencies caused partly by structural factors
and partly by poor management.
In Ghana the government rate for long-distance transport was in 1987 6.9 US cents per tkm
(TechEcon 1987). However, the large transport companies operating on contract got about 10%
more which results in a rate only marginally lower than the rates Hine and Rizet found in the
Francophone African countries. By 1995 the government rate had dropped to 4.7 US cents per tkm
(Republic of Ghana 1996), and in early 2000 it was only 2.8-3.4 US cents per tkm (computed on
the basis of different inter-urban rates provided by GPRTU)). The large companies still get more
than the government rate but increased competition probably means that more of the trucks on the
spot market now accept rates below the government rates. So in spite of the high inefficiencies
liberalisation and increased competition seem to have made their impact on Ghana’s trucking costs.
This is interesting because it means that it is the tentative government rates in combination with the
increased supply, rather than competition which has pressed the transport rates down.

CDR Working Paper 01.2 Centre for Development Research • Copenhagen
52
6. Head loading and intermediate transport
In the rural areas human porterage, especially head loading, and different forms of intermediate
means of transport, especially bicycles but also other forms of non-motorised transport, play an
important role in freight transport. Studies during the 1990s of rural transport in Burkina Faso,
Uganda and Zambia show that rural households on average use between 1125 and 2700 hours on
transport tasks and transport 28 to 64 tkm a year, most of which is head loaded (Barwell 1996);
and Riverson and Carapetis (1991) cite village studies in Athanti, Northern and Volta regions which
show that on average rural households there use 4830 hours per year for travel and transport of 216
tkm. Often about two thirds of the tkms consist of water and fuelwood and the rest of agricultural
inputs and produce. Most of it takes place within the rural areas and only a minor part of it is over
long distances.
Although probably there is an over-supply of trucks in Ghana, except during the height of the cocoa
season, most of these are urban based. Such urban based trucks may be available for evacuation of
agricultural produce from the rural areas, but generally not for transport within the rural areas. The
flat government rates which do not take into account the usually higher costs of short trips make it
even less attractive for transporters to serve the rural areas. And even where motor vehicles are
available, large parts of the rural areas are not accessible during the wet season, and many people
who in principle could be reached by motorised transport in practice cannot afford to pay for it.
Therefore a large share of the freight movements on the rural roads is non-motorised. A study from
the early 1970s of the freight traffic on 200 rural roads in Ghana showed that on roads with less than
25 motor vehicles per day up to 90% of the freight movements were non-motorised and even on
rural roads with a more intensive traffic 25% of the freight movements were non-motorised (Riverson
and Carapetis 1991).
A number of studies of how traders travel to rural markets in different parts of Ghana show that
although there are considerable differences between the different studies, in general only about 30%
are motorised, while more than 50% head loaded and 5-15% use some intermediate mean of
transport, mostly bicycle (see Table 14). The surveys and markets studied are too different to allow
more detailed conclusions on regional differences and the development over time. However, the data
do not indicate any clear-cut change in the transport modes since independence, except in the
northern region where the lower car density is mirrored in the data, which also may indicate some
increase in both truck and bicycle use since 1960.

CDR Working Paper 01.2 Centre for Development Research • Copenhagen
53
The large transport work carried out by the rural population has generally been overlooked by the
formal economy partly because it has been hidden in the payment to farmers for their produce and
therefore has been ‘invisible’.
Poor transport in itself represents a cost which reduces the income of farmers, but even more
importantly poor transport and communication opens up for large speculative price variations. T was
Hine (1998) found that the rural price differences in the rural areas within 100 km around Kumasi
were up to 15 times larger than the differences in trucking costs could justify. However, the point is
that the opportunities for such excess profits will disappear when transport and communication is
improved.
Table 14. Traders’ mode of transport to rural markets in Ghana
Head load
% Bicycle
% Lorry
% Others 1)
%
1958 (Gould 1969):
Northern Ghana (Bawku) 81 5 11 3
Mid-Ghana (Dorma-Ahenkro) 53 6 41 0
Southern Ghana (Dumkwa) 45 2 47 6
1972 (Arhin 1985)2)5): Central and Western Region
40
10
503)
1973 (Sørensen 1978) 5): Volta region
70
29 4)
1988 (Adarkwa 1992): Six districts in Northern Ghana
54
17
27
2
1) Railway, boat, cart a.o. 2) Transport of cocoa to buying centres 3) Others and especially mixed head load and lorry. 4) Lorry 20% and bus 9% 5) The statistics do not give any information on bicycles or orther forms of intermediate transport.
More widespread use of intermediate means of transport could lead to a considerable reduction in
the time used for transport, time which could be used for more productive purposes. At the same
time the intermediate means of transport generally have a larger range and would open up access to
more services and markets. Therefore a number of NGOs as well as the World Bank have during
the 1980s and 1990s been active in developing new means of intermediate transport and promoting
them in Africa. In Ghana the Technical Consulting Centre in Kumasi started in 1993-94 an
intermediate transport project with World Bank support and under the auspices of the Ministry of
Agriculture. The idea was to develop intermediate means for transport between the farm, the
homestead and the local market. The means proposed were a three-wheeled pushcart with large

CDR Working Paper 01.2 Centre for Development Research • Copenhagen
54
bicycle wheels and a bicycle trailer. Two private companies in Tamale were supported to produce a
limited number of vehicles for use in a test region in northern Ghana. Although the tests showed that
the two new means of transport have a considerable potential (Buabeng et al. 1995), their diffusion
among the rural households have been slower than expected. There appear to be a number of
reasons for this. First, most of the transport work is traditionally carried out by women, while the
operation of both the trailer and the pushcart was seen to be mens’ work. Secondly, most of the
paths in the rural areas were too narrow even for the light vehicles, and a proposal to the Feeder
Roads Department of the Ministry of Transport to build broader paths fell because they were
considered ‘too expensive’, although e.g. Hine (1998) indicates that upgrading of footpaths would
be more cost effective and have a larger impact on rural producer prices than the upgrading of an
earth track to a gravel road. Thirdly the number of bicycles have until recently stagnated because
they were considered a luxury, sports goods or a children’s toy and therefore highly taxed (Howe
1995, Sieber 1999). Only during the 1990s this has changed and led to an increase in the number of
bicycles. Finally vehicles were also found to be too expensive.
However, although the pushcart was not successful in the rural areas it has with heavier motor cycle
wheels become a success in the urban market places. A reason for this may be that while it may be
too expensive for single households to invest in for their own use only because the household cannot
use it efficiently, the degree of utilisation becomes high enough when the vehicle is used for hire.
Compared to the incomes and the high cost of capital in African rural areas most intermediate means
of transport are expensive and even bicycles are in many areas used by traders or transporters who
are able to use them full time and often rent them rather than buy them (see the examples of the
economy of bicycle use in Barwell (1996) and of pushcart use in Seierup (2001)).
The full use of intermediate means of transport would require that they are used together with
motorised transport as part of a multi modal transport system. The intermediate means of transport
increase the weight which can be carried and the range within which it can be transported. A long-
run effect could therefore be to reduce the number of produce buying points which would improve
the efficiency of the road transport as well.
7. Air freight transport
Ghana’s air freight traffic
Air freight to and from Ghana’s Kotoka International Airport (KIA) in Accra has been increasing
fairly rapidly during the second half of the 1990s from 35,800 tonnes in 1995 to 46,800 tonnes in
1999 (7% p.a.). It is almost all international as there is practically no domestic air freight. Exports are

CDR Working Paper 01.2 Centre for Development Research • Copenhagen
55
larger than imports, though imports have been growing more rapidly. Thus exports grew from
24,800 tonnes in 1995 to 29,900 tonnes in 1999 (but almost all the increase was in 1999), while
imports grew from 11,000 tonnes in 1995 to 16,900 tonnes in 1999 (11% p.a.). Imports are mostly
general cargo, in the form of machinery, spare parts and mail. Exports consist mostly of pineapples
but also other fruit and vegetables. Only about half of both the imports and the exports goes on
specialised cargo flights, the other half on the passenger flights. Therefore the freight transport is
heavily dependent on the size of the passenger traffic.
At the time of the interview there was four freight airlines serving the Accra-Europe link (Cargo Lux,
Rice Cargo, Das Air and MK Air), each of which serves Accra with one flight a week off-season
and two flights a week during the high-season, with flights of different size ranging from 34 tonnes to
128 tonnes, mostly to Ostende and Luxembourg, but apparently sometimes also to Gatwick and
Amsterdam. However, there appear to be some fluctuations in which airlines fly and where they fly.
Until the end of the 1970s there was a considerable air freight traffic between the West African
countries. During the crisis of the 1980s this mostly disappeared and today domestic air freight and
air freight between the West African countries is almost non-existing. But there is probably a
potential market.
One of the difficulties for the freight airlines is that at most African airports the amount of incoming
and outgoing freight is very unbalanced, thus Accra has much larger imports than exports while for
instance Lagos and Johannesburg have larger imports. The freight airlines therefore mostly fly round
trips to several airports in order to collect freight, and typically charter the different links on a route
out individually. Thus many of the flights serving Accra carry general cargo (machinery and spare
parts for the oil industry) to Lagos, then fly almost empty to Accra in order to load pineapples and
other fruits back to Europe. One company flies Luxembourg-US-Montevideo (earlier Sao Paulo)
and then loads pineapples in Accra on the way back to Luxembourg.
A large part of Ghana’s pineapple export is organised by Air Ghana. Air Ghana was established in
1994 (started operating early 1995) as a cargo airline to facilitate non-traditional exports, especially
fresh fruits of which pineapples are by far the most important. Air Ghana is owned by a Ghanaian
who used to be a pineapple grower. Air Ghana works together with a German-owned European
firm, Air Ghana Europe, which organises and is responsible for chartering the flights. In fact Air
Ghana is mostly a broker between the European buyers, the growers and the airline. They have radio
connection to the growers and organises the contact between buyers and growers and between
growers and the airline, but their responsibility is limited to the handling of the goods in the airport in
Accra.

CDR Working Paper 01.2 Centre for Development Research • Copenhagen
56
Air Ghana operates with all the four freight airlines which at the time of the interview served the
Accra-Europe link and filled them with pineapples and other fruits for the European market.
The air freight rate for northbound fruit is 74 US cents per kg. This has been stable since Air Ghana
started operating in 1995. The rate for general cargo in 1,50 per kg. for both south- and northbound
freight.
Many pineapples are also exported by ship. However, growers are interested in sending their
produce by air because they get a higher price for what they send by air (43-48 US cents per kg.
FOB in the airport) than for what they send by ship (only 28 US cents per kg. FOB in Tema). The
difference has been growing over the years from an average of about 35 US cents. However, the
market for the more expensive air born pineapples is limited so everybody cannot send their
pineapples by air. An increasing share of the pineapples apparently is going by ship.
The development of KIA into a West African hub
The development of KIA in Accra into an West African hub is an important part of Ghana’s
Gateway Programme. In order to achieve this the Ghana Civil Aviation Authority has been split up in
three parts: Traffic control, traffic regulation and the airport administration. Control and regulation will
remain under the state while the airport has become corporatised and is expected to become
privatised. Concession on ground handling of the air freight has been given to a private company,
AFGO, which pays the airport administration a certain percentage of the ground handling charges.
Beside the airport a new ‘cargo village’ is being built where AGFO, airlines, freight forwarders,
Ghana Revenue Authorities and others involved in handling the air freight can rent office space.
KIA is served by a number of European African and other airlines. However, experiences from
elsewhere show that the development of an airport into a regional hub depends on the existence of a
viable national airline. Ghana Airways should potentially play that role. There are plans to privatise
Ghana Airways, which however, has had serious financial problems and therefore is not easy to
privatise. Ghana Airways flies on different European and West African destinations. Until 1991 it
also operated a domestic network, but had to give it up for financial reasons. Since then Airlink, a
company operated by the Ghanaian Air Force, has operated a domestic air traffic. They apparently
have been operating with a surplus but without paying airport fees and depreciation on the
aeroplanes which belong to the military. There has been several so far unsuccessful attempts to
establish a private domestic air traffic (one by the Danish MUK air with support from Danida’s
private sector programme).
KIA had in 2000 a throughput of about 3/4 million passengers (including transit passengers) of
whom 100,000 are domestic passengers, 23% are from West Africa and 30-40% are from Europe.

CDR Working Paper 01.2 Centre for Development Research • Copenhagen
57
This is considerably less than the competing hubs in Abidjan and Lagos, with respectively 1.06 mill.
and 2.05 mill. passengers in 1997 (Goldstein 1999). This will make it difficult to develop KIA into an
international hub for West Africa. On the other hand, Ghana is one of the only five countries in Africa
meeting the ICAO standards (the others are Egypt, Ethiopia, Morocco and South Africa), and the
traffic on KIA has during the second half of the 1990s been growing by 13% p.a., which is twice as
rapid as that of Abidjan. However, even without making Accra a major African hub Ghana’s
Gateway Programme and its attempts to improve Ghana’s air traffic is clearly important.
8. Transport and economic development: summary and conclusion
Trends in transportation
When Taaffe, Morrill and Gould in 1963 wrote their study on transport expansion in underdeveloped
countries they focused on the diffusion of infrastructure. At the time just after the independence of
Ghana the port of Tema had just been opened and there were also plans for development of the
inland transport. However, these plans were never realised. Rather the transport infrastructure
deteriorated during the 1970s and reached a low point during the first half of the 1980s. Since then
some rehabilitation has taken place, but it was not until the first half of the 1990s that the traffic again
reached the level of 1970, and apart from the ongoing expansion of the airport in Accra one can
hardly talk about expansion of the infrastructure. Some roads have been habilitated but few new
roads have been built; the railway system has contracted so that today only the western line carries
freight of any importance (primarily minerals and logs); and the attempts to develop an inland
shipping corridor at lake Volta have for a number reasons not taken off.
This does not mean that there has not been any changes in the transport system. However, these
changes have not been driven by the diffusion of infrastructure as expected by Taaffe, Morrill and
Gould, but caused by a containerisation of the import trade imposed from the outside, that is by
exporters in the industrialised countries.
During the last 30 years containerisation and the so-called logistical revolution has dramatically
transformed the international shipping industry and resulted in an increasing integration between
transportation and the production system in order to save transport costs, especially by reducing the
cost of transshipment between the different modes of transport. New types of increasingly large
containerships have been introduced. Direct shipping routes have increasingly been substituted by
hub-and-spoke systems, and port-to-port transport has been substituted by door-to door transport.
New port infrastructures have been required, which transform the ports into multi-modal transport
terminals easing the transshipment of containers between ship and inland transport. Large

CDR Working Paper 01.2 Centre for Development Research • Copenhagen
58
multinational forwarding companies which have undertaken to organise this door-to-door transport
have become increasingly important, though they have in recent years increasingly been pressed by
the large shipping and airline companies trying to take over control of the door-to-door transport.
However, Ghana has not been able to live up to the new infrastructural requirements and therefore
not achieved the full benefit from the new opportunities created by the containerisation. Only about
five percent of the containers arriving in Ghana continue inland, the rest are stripped at the ports.
There are a number of reasons for this. Custom procedures which require every single container to
be opened and controlled are one reason. However, probably equally important is, that trade flows
which are very unbalanced with a much larger import of industrial goods than export, result in low
return freight for the containers; and that low labour costs means that the costs of loading and
unloading trucks, which in the industrial countries have been one of the driving forces behind the
containerisation, have been of little importance. Therefore it is questionable whether improved
custom clearance will in itself be enough to increase the movement of containers inland. The
beneficiaries of the containerisation until now have primarily been the multinational mining companies
which have been exempt from the strict custom regulations and to which security and speed of the
transport anyway is much more important than the costs.
The shipping companies have in order to reduce their own costs caused by the imbalanced transport
flows attempted to containerise the most valuable part of the exported raw materials, in Ghana
especially cocoa and sawn timber, by offering low export rates. This is a process which in the long
run should be supported by industrialisation and increased processing of the raw materials before
export. In Ghana the increased taxation on export of logs has led to their sawing into timber which to
a large extent is exported in containers. On the other hand, present experiences from other cocoa
producing countries with export of cocoa beans in bulk like grain (Fold 2000), may in the future
revers the ongoing process of containerisation of the cocoa export.
However, in Ghana the containerisation of export produce only takes place at the harbour and not at
the inland place of production or collection. This is partly because the import containers do not
continue inland, but also because with the prevailing low wage rate it is much cheaper to transport
the goods directly on the trucks than in a container. Therefore Ghana’s benefits from containerisation
are limited.
Inland transport today is completely dominated by road transport, which has expanded rapidly
during the 1990s, mostly through import of second-hand trucks and lorries from Europe. However,
the efficiency of the trucking industry is low. This is partly due to a combination of old trucks, poor
management and a system of traffic coordination which limits competition; but there is also a number
of structural reasons for the low efficiency, such as an unbalanced and seasonal market which makes

CDR Working Paper 01.2 Centre for Development Research • Copenhagen
59
it difficult to obtain return freight, and a poor road and communication infrastructure, which results in
low speed and makes it difficult to link supply and demand. In spite of the low efficiency and
constraint competition, the transport rates apparently have been decreasing during the 1990s due to
the strong competition caused by oversupply of second-hand trucks in combination with decreasing
government transport rates, even though they are not binding.
Although the expansion of the trucking industry during the 1990s has led to some outsourcing of
transport in the large enterprises, the high transport rates and insecure services offered by the
trucking industry mean that this is not a clear-cut trend. Many large industries still operate their own
distribution systems (for instance the Lever Brothers operate their own nation-wide distribution
system in Ghana while in Zimbabwe they have outsourced both storage and distribution of their
products), and lack of a reliable open distribution system appears to be one of the constraints for
development of small and medium-sized enterprises (for instance small oil mills) which do not have
the resources to develop their own distribution system.
Although probably there is an oversupply of trucks in the urban areas, this is generally not the case in
the rural areas in the peripheral parts of the country. Here most of the freight is still head loaded. This
is of course especially the case within the rural areas where roads passable by motor vehicles often
do not exist, but also along rural roads, which are passable for motorised traffic, is a large share of
the freight head loaded or carried by bicycles or other forms of intermediate transport. Especially in
the northern regions where the motor vehicle density traditionally has been low has there been an
increasing number of bicycles, though a World Bank supported intermediate transport development
project apparently has been a limited success.
The expansion of the rural roads network which has taken place in the western part of the country
around Kumasi has made it possible to expand the cocoa belt and the forest industry, but it has
generally not reduced the large transport burden of the rural households (and especially the women)
in order to get water, fuel wood and carry out the agricultural production and marketing.
From transportation to logistics
In the introduction we pointed at three consequences of the logistical revolution, namely: increased
integration of the transport chain, increased integration and coordination between transport and the
producers it serves, and a reorientation of economic activities resulting in a new regionalisation
focused on larger regions. In this last section of the paper we shall on the basis of the empirical
findings discuss to which extent these general consequences have been realised in the case of Ghana.
Integration or disintegration of the transport chain illustrated by the transport of cocoa

CDR Working Paper 01.2 Centre for Development Research • Copenhagen
60
The empirical findings indicate that the vertical integration of the transport system, which the more
industrialised parts of the world have experienced, has only to a limited extent taken place in Ghana.
Traditionally Ghana’s transport system has fallen apart into three separate parts among which there
have been few attempts on integration:
− the shipping to Europe or other overseas markets;
− the transport from the rural collection points, usually via one or more depots, to the port of
shipment, which is mainly carried out by trucks, but may be partly by railway or inland
shipping; and
− the rural transport of produce from the field to the village and from the village to the
collection point, which is mostly head loaded, but sometimes by trucks or intermediate
means of transport.
Although the three parts in distance terms are very different they are in economic terms in the same
order of magnitude. In Table 15 we have attempted to give a rough estimation of the costs of each of
the three part for the cocoa export (The assumptions made in the computations are shown in the
table; especially the value of the rural transport link is difficult to estimate).
In total the transport costs amount to 118 US$ per tonne corresponding to 13% of the world market
price, which by the end of 1999 was 911 US$ (but a much larger share of Ghana’s production costs
before taxation).
There are of course partly infrastructural reasons for the disintegration of the transport system in the
three parts. However, the infrastructural explanation does not explain why 30 years of development
has done so little to improve the transport infrastructure and bridge the gaps between the three parts.
We shall here hypothesise that the explanation is to be found in the way resource exploitation and
agricultural production and marketing have been organised during the post-independence period.
During the last phase of the colonial period and especially after independence the development of the
parastatals changed the marketing system and therefore also the transport system. Especially for the
export crops the parastatals took over the national part of the marketing chain between the rural
buying points and the port. Goods were customarily exported FOB and imported CIF, which means
that goods change owner at the port and that therefore the foreign companies had no possibilities and
little interest in integrating backward into the Ghanaian transport system. The more expensive land
transport therefore became the sole responsibility of the parastatal. In the same way the marketing
parastatals now bought the produce at the rural buying points and left the most expensive rural

CDR Working Paper 01.2 Centre for Development Research • Copenhagen
61
transport link to the small farmers. As a consequence the marketing parastatals have most often not
been considered as a transport cost at all, because it has been hidden in the payment to the farmers.
Table 15. Transport costs in cocoa production and marketing Tema-Rotterdam:
shipping
From collection point
to port: trucking
Rural transport:
head loading
Total
53 US$/tonne 35 US$/tonne 30 US$/tonne 118 US$/tonne
Assumptions:
Shipping costs
The transport rate for a container between Tema and Rotterdam including handling in Tema and Rotterdam is 878
US$. As a container loads 267 bags of 62.5 kg, this gives a transport rate of 53 US$/tonne. Of these 43 US$ are the
shipping costs and 10 US$ are the bunker adjustment factor and the terminal handling costs.
Trucking costs
We assume a truck load of 30 tonnes , an average distance of 300 km from the collection point to the port, and a
transport rate of about 3 US cent per tkm., which amounts to 27 US$ per tonne. In addition we assume that the
cocoa is reloaded at a midway depot, at a cost of 2 US$ per loading and unloading in total 8 US$.
Head loading costs
One tonne of cocoa beans are produced at about 1.1 acre. Empirical studies indicate that the average distance
from field to village is about 4 km and from village to collection point is about 5 km. If one head load 20 kg at a
time it would require 50 trips to move one tonne. If we assume that most of the movement of the cocoa from the
field to the village is done in connection with work in the field only the movement from village to buying point
should be counted. One person hardly will be able to walk more than two trips or 20 km a day. Then it will take 25
days or about one person-month to move one tonne. There is no simple way of estimating the value of one
month work in the rural areas, but estimate it to 1 US$ a day or 30 US$.
In the early part of the 20th Century there was typically a close integration between infrastructure
investments and investments in production: railways were built directly to the mines, roads were built
as feeder roads to the railways, and Takoradi harbour reduced the loading and unloading times from
weeks to days. This was of course mainly because European mining and other resource exploitation
companies controlled the whole flow and collaborated closely with the harbours and railways, which
were also operated as one company. The negative side of this development was an unintegrated
transport system where the internal links within the country were little developed.
At the same time the agricultural producers generally got so small a share of the export proceeds that
they had few opportunities of making their own investments in the transport system, while the large
share appropriated by the parastatals reduced their interest in rationalising the transport system.

CDR Working Paper 01.2 Centre for Development Research • Copenhagen
62
Expansion of the transport system in order to reach more potential producers was seen as more
important than reducing the transport costs.
Coordination and integration between transport and production
If this hypothesis is correct one should expect the current processes of privatisation and trade
liberalisation to result in increased vertical integration or coordination in the transport system as well
as increased horizontal integration or coordination between production, distribution and
transportation.
In Ghana there are a number of examples of this happening during recent years. For instance private
cocoa traders in coalition with transporters by-pass the old cocoa-buying points and operate directly
between the rural areas and more central depots; the shipping companies serve inland markets,
potentially via the new inland port in Kumasi; palm oil plantations/mills attempt to develop their
transport system by promoting mini-tractors among their outgrowers in order to secure supplies to
the mill, and outsourcing the transport of oil from the mills to contract tankers; there are plans for a
closer collaboration between some of the large mining companies and the railways which serve them,
in order to get the mining companies to invest in the railway.
These new forms of integration most often are not based on joint ownership but rather on strategic
alliances and long-run contracts. They lead to improved transportation for those directly involved in
the integration, but probably also to larger differences in accessibility between those involved and
those not involved.
There are a number of ways in which the integration between transport and production/ distribution
in the logistical chain takes place:
1. Minimizing storage costs. Storage is necessary whenever the production or distribution of a
product does not match exactly the consumption of that product. This can be due to both random
and more regular (e.g. seasonal) fluctuations in either production (of e.g. agricultural products),
distribution (e.g in connection with infrequent ship departures) or consumption. Storage is costly
partly because the storage itself is costly, partly because the stored goods often represent a large
capital value on which interest must be paid during the storage period, and finally because the value
of the goods may depreciate while stored, because their quality drops or they become outdated. The
shift from bulk transport to containerisation may reduce the storage costs because it leads to a more
continuous transport flow. The just-in-time technology attempts to minimize the storage costs either
by minimizing the size of the storage or by placing warehouses and storage areas at points in the
production chain where the storage costs are lowest.

CDR Working Paper 01.2 Centre for Development Research • Copenhagen
63
However, where prices are fluctuating goods may also be stored for speculative reasons. This is
often the case for raw materials which tend to dominate the African economies, and makes the
operation of warehouses and storage areas in Africa a very complex business.
2. Substitution of internal transport for external (publicly financed) transport infrastructure. This takes
place when production enterprises outsource part of their production to subcontractors. However,
this happens seldom in Africa, partly because the transport infrastructure is poor and unreliable.
Public infrastructure, e.g in the form of transport terminals, such as the inland port, also plays an
important role in the integration between different modes of transport.
3. Outsourcing of transportation from both production and larger transport firms may reduce
transport costs partly because transport subcontractors may operate at lower costs, partly because
they may be able to reduce the seasonal swings in their market by serving different costumers, and
thereby achieving a larger capacity utilisation than the subcontracting firm.
4. Integration between transport and communication. One of the large problems especially in the
African/Ghanaian trucking industry is the difficulties in matching the supply and demand of transport
due to poor communication. This is one of the reasons why outsourcing of transport in Africa is much
less effective than in more developed countries.
The way these processes of integration between the logistical chain and the production system take
place, or will take place, is so far largely unexplored.
Ghana’s position in the regionalisation of West Africa
The Government of Ghana plans to develop Ghana into a hub for West Africa and gateway to the
landlocked countries behind it. However, although Ghana’s transit traffic to Burkina Faso and Niger
has been increasing recently, both transit traffic and trade with the neighbouring countries are still
very small. Most of the capital cities along the West African coast aspire to the post as hub for West
Africa, and measured on the basis of the amount of traffic Lagos, Abidjan and Dakar all appear to
be in a better position to become a hub than Accra/Tema. However, the level of regionalisation in
West Africa in general seems to be much lower that in Southern and Eastern Africa, where
Johannesburg and Nairobi during the 1990s developed into a clear hub-status.
Although Ghana geographically has the location to become a hub it is up against both the language
barrier to its French speaking neighbours and the traditional trade patterns in which Burkina Faso
links up with Ivory Coast and Niger with Nigeria.

CDR Working Paper 01.2 Centre for Development Research • Copenhagen
64
Ghana’s position as a potential hub for West Africa appears primarily to rest on its possibility of
overcoming the chaos and inefficiency characteristic of most of the ports and airports in West Africa.

CDR Working Paper 01.2 Centre for Development Research • Copenhagen
65
References
Adarkwa, Kwasi (1992) Improving rural access and mobility in the northern region of Ghana. In Ernest Aryeetey
(ed.) Planning African growth and development: some current issues. Proceedings of the ISSER/UNDP
International Conference on Planning for growth and Development in Africa held at the University of
Ghana, Legon, March 13-17, 1989. Accra: ISSER/UNDP.
Addo, S. Teteh (1995) Accessibility, mobility and the development process. Research Review (Institute of African
Studies, University of Ghana, Legon), 11,1&2,1-15.
Arhin, Kwame (1985) The expansion of cocoa production: the working conditions of migrant cocoa farmers in the
central and western regions. Accra.
Barwell, Ian (1996) Transport and the village: findings from African village-level travel and transport surveys and
related studies. SSATP Working Paper No. 23. Sub Saharan Africa Transport Policy Program. Washington
DC: The World Bank and Economic Commission for Africa.
Buabeng, Stephan Nkansa, Paul Sarpho-Mensah and Carolyne Dennis (1995) Rural transport in northern Ghana:
impact of ‘intermediate’ forms of transport in rural areas. New Series Discussion Paper No. 57.
Development Project Planning Centre, University of Bradford.
Deasy, George (1942) The harbours of Africa. Economic geography, 18,4, 325-342.
Dickson, K.B. (1965) Evolution of seaports in Ghana: 1800-1928. Annals of the Association of American Geographers, 55,98-111.
Ellis, Simon (1998) ‘Rural transport services in Zambia.’ Paper presented at seminar on The Managing of Rural
Transport, 12-23 October. Crowthorne, Berkshire, UK: Transport Research Laboratory.
Ellis, Simon D., and John L. Hine (1998) The provision of rural transport services: approach paper. SSATP
Working Paper No. 37. Sub-Saharan Africa Transport Policy Program. Washington DC: The World Bank
and Economic Commission for Africa.
Fepke, Edward (1996) Freight vehicle regulations and highway infrastructure issues in Sub-Sahara Africa. African Development Review 8,1,44-60.
Fold, Niels (2000) Restructuring of the European chocolate industry and the impact on cocoa production in West
Africa. Paper for the joint CDR - CIRAD Workshop on ‘The coordination of Africa-based agro-commodity
chains’. Copenhagen 17-19 December.
Ghana Shippers’ Council (1995) Maritime trade statistics Ghana 1990-1995. Accra.
Ghana Shippers’ Council (1997) Maritime trade statistics Ghana 1997. Accra.
Gibb/Law Gibb Group (1999) Rehabilitation of Vessels and Landing Facilities on Lake Volta. Phase II. Ghana. Pre-
Appraisal, Final Report. September.
Goldstein, Andreas E. (1999) Infrastructure development and regulatory reform in Sub-Saharan Africa: the case of
air transport. Technical Paper No. 154, OECD Development Centre. Paris.
Gould, Peter R. (1960) Transportation in Ghana. Evanston, Ill.: Department of Geography, Northwestern
University.
Government of Ghana (1997) Ghana-Vision. The first medium-term development plan (1997-2000). Accra:
National Development Planning Commission.
GPHA (1999) Ghana ports handbook 1999-2000. Accra: Ghana Ports and Harbours
Authority.
GPHA (1998) Ports of Ghana. Leaflet. Accra: Ghana Ports and Harbour Authority.
Hilling, David (1966) Tema - the geography of a new port. Geography 51,2:111-125.
Hilling, David (1977) The evolution of a port system - the case of Ghana. Geography 62,2: 97-105.
Hilling, David (1983) Ships, ports and developing Countries. Geoforum 14,3:333-340.
Hilling, David (1996) Transport and developing countries. London: Routledge.

CDR Working Paper 01.2 Centre for Development Research • Copenhagen
66
Hine, J. (1998) ‘Transport and marketing priorities to improve food security in Ghana and the rest of Africa’. Paper
presented at seminar on The Managing of Rural Transport, 12-23 October. Crowthorne, Berkshire, UK:
Transport Research Laboratory.
Hine, J., and C. Rizet (1998) ‘Halving Africa’s freight transport costs: Could it be done?.’ Paper presented at
seminar on The Managing of Rural Transport, 12-23 October. Crowthorne, Berkshire, UK: Transport
Research Laboratory.
Howe, John (1995) Enhancing nonmotorized transportation use in Africa - Changing the policy climate.
Transportation Research Record No. 1487. Nonmotorized transportation research, issues, and use.
Washington DC: National Academic Press.
Kwakye, E.A. (1986) transportation as a factor in rural development in Ghana. In C.K. Brown (ed.) Rural Development in Ghana. Accra: Ghana University Press.
Ministry of Roads and Transport (1998) Report on the 1998 mid-year review conference, Elmina, 15-17 September
1998. Accra.
Mitchell, Brigitta, and Karim-Jacques Budin (1998) The Abidjan-Ouagadougou railway concession. Africa
Transport Technical Note No.13. Washington DC: The World Bank and Economic Commission for Africa.
Pálson, Gylfi (1998) Multiple ports of call versus hub-and-spoke: containerised maritime trade between West
Africa and Europe. SSATP Working Paper No. 31. Sub-Saharan Africa Transport Policy Program.
Washington DC: The World Bank and Economic Commission for Africa.
Pedersen, Poul Ove (2001) Transport under globalisation and its impact on Africa. Journal of Transport Geography, forthcoming.
Republic of Ghana (1994) Port rehabilitation project: phase II. Master plan study. December 1994. Accra: Ministry
of Transport and Communications, Ghana Ports and Harbours Authority.
Republic of Ghana (1996) Inter-modal transport study. Volume 2. Background, transport demand, transport sub-
sectors. Final report. Thorburn Colquhoun International in association with Nathan Associates and
Comptran Engineering and Planning Associates for Ministry of Transport and Communication. Accra.
Riverson, John D. N., and Steve Carapetis (1991) Intermediate means of transport in Sub-Saharan Africa: its
potential for improving rural travel and transport. World Bank Technical Paper 161, Africa Technical
Department Series. Washington DC: The World Bank.
Rizet, C., and J. L. Hine (1993) A comparison of the costs and productivity of road freight transport in Africa and
Pakistan. Transport Reviews 13,2:151-165.
Seierup, Steen (2001) The mkokoteni in urban transport: a socio-economic profile. In Patrick Alila and Poul Ove
Pedersen (eds.) East African microenterprises negotiating social space. Trenton NJ and Asmara: World
Africa Press.
Sieber, Niklas (1999) Transporting the yield: appropriate transport for agricultural production and marketing in
Sub-Saharan Africa. Transport Reviews 19,3:205-220.
Simon, David (1996) Transportation and development in the third world. London: Routledge.
Sørensen, Olav Juul (1978) A Survey of a rural Market : the case of Tsito(Volta Region). Working Paper Series
78/3, School of Administration, University of Ghana. Legon.
Taaffe, Edward J., Richard L. Morrill and Peter R. Gould (1963) Transport expansion in underdeveloped countries:
a comparative analysis. The Geographical Review 53:503-529.
TechEcon (1987) Road transport sub-sector study. Final Report. Accra: Ministry of Transport and
Communication.
The East African (2000) West African shippers alarmed over liner groups. November 13-19. Nairobi.
Transportation and Development Planning Consultancy Ltd. (1999) Inland free port, Fumesua, Kumasi. Integrated
study. Draft final report. Kumasi: Ministry of Transport and Communications and Ghana Shippers’
Council.