the french consumer - agriculture et agroalimentaire · pdf fileexecutive summary inside this...
TRANSCRIPT
International
Markets
Bureau
MARKET ANALYSIS REPORT | OCTOBER 2012
So
urc
e:
Sh
utters
tock
The French Consumer
Behaviour, Attitudes and Perceptions toward
Food Products
EXECUTIVE SUMMARY
INSIDE THIS ISSUE
DID YOU KNOW?
PAGE 2
The French Consumer Behaviour, Attitudes and Perceptions toward Food Products
Executive Summary 2
Global Trade Position 3
Economy 3
Demographics 4
Population 4
Ethnicity 5
Education 6
Households 6
Lifestyle and Health 8
Consumption and Expenditure
9
Expenditure Overview 9
Grocery Shopping 10
Foodservice 11
Consumer Tastes & Preferences
13
Trends 14
Convenience 14
Health and Wellness 16
Private Label 17
Halal 18
Organic 19
Conclusion 20
Key Resources 20
In 2010, traditional French gastronomy was added to the United Nations Educational, Scientific, and Cultural Organization’s (UNESCO) list of the Intangible Cultural Heritage of Humanity. Source: UNESCO, 2012.
In addition to membership in the largest regional market, the European Union (E.U.), France also has one of the largest economies in the world. In 2011, France’s gross domestic product (GDP) was close to US$2.8 trillion (Economic Intelligence Unit [EIU], 2012e). Total agri-food and seafood exports and imports amounted to approximately US$142.8 billion, ranking France fifth worldwide (Global Trade Atlas [GTA], 2012). Canada and France share strong bilateral relations through trade, investment, and membership in a large number of international organizations. In terms of agri-food and seafood, France is Canada’s seventh-largest trading partner. In 2011, agri-food and seafood exports and imports between these two countries totalled C$1.1 billion (Statistics Canada, 2012). Although France has experienced some economic challenges, which have influenced consumer behaviour, overall consumer expenditure is forecast to grow, as the French economy recovers (Euromonitor International, January 2012a). These economic challenges, as well as broad demographic patterns, have produced several consumer trends in France. These trends include the increased demand for private label food and beverage products, as well as convenient and halal products. Increased awareness of the benefits of living a healthy lifestyle, as well as government initiatives to encourage healthy living, have increased consumer interest in health and wellness products. Organic products have particularly benefitted from this trend, as some consumers are concerned about environmental sustainability. This report is intended to provide a portrait of the French consumer, as well as the French food and beverage market, to support export and marketing strategies for Canadian businesses.
Source: Shutterstock.
GLOBAL TRADE POSITION
PAGE 3
In 2011, total agri-food and seafood trade between Canada and France amounted to C$1.1 billion (Statistics Canada, 2012). This ranked Canada as France’s nineteenth-largest trading partner, while France ranked as Canada’s seventh-largest trading partner in terms of total agri-food and seafood trade (GTA, 2012). Canadian agri-food and seafood exports to France totalled over C$280.3 million in 2011, up from C$175.4 million in 2010. Top agri-food exports included canola or colza oil, soya beans, rape/colza seeds, horse meat, and edible fruits and nuts. Fish and seafood exports to France in 2011 totalled around C$65.2 million. Top fish and seafood exports included scallops, frozen lobster, and live lobster (Statistics Canada, 2012). Canada’s agri-food and seafood imports from France in 2011 totalled more than C$856.0 million, up from C$767.3 million in 2010. Top agri-food imports included grape wines, sparkling grape wines, cheese, other spirits obtained from grape wines, and mineral water. Fish and seafood imports from France totalled over C$6.0 million. Top fish and seafood imports included fish products not for human consumption, toothfish, and seaweeds (Statistics Canada, 2012).
ECONOMY
As an original member of the E.U., France belongs to the largest regional market in the world. (EIU, 2011a). Yet, with a GDP around US$2.8 trillion in 2011, France itself also has one of the largest economies in the world (EIU, 2012e). Its modern capitalist economy has traditionally experienced a significant level of state intervention and state ownership, although some of this has changed since 1980, with the privatization of many government entities (CIA, 2012; EIU, 2011a). France enjoyed increasing disposable income and positive GDP growth for much of the past decade, yet this came to an end with the onset of the global economic downturn. The French economy has since improved, with positive GDP growth and a smaller government budget deficit, at 5.8% of GDP in 2011, down from 7.5% of GDP in 2009 (CIA, 2012). However, France still faces many challenges to its full recovery, including ongoing debt and instability in the euro-zone. According to the Economic Intelligence Unit, France experienced stagnant GDP growth in the first half of 2012. Forecast real GDP growth for 2012 is 0.1% (EIU, 2012h). These conditions are expected to persist through 2013 as unemployment rises and fiscal austerity continues. Between 2013 and 2016, forecast GDP growth is 0.9%. Inflation peaked at 2.7% in late 2011, but it is expected to drop to 2.2% in 2012, before stabilizing at 2% at 2% from 2013 to 2016 (EIU, 2012a). Compared to other Western countries, agriculture and agri-food in France play a large role in overall economic activity, with agriculture employing 2.5% of the population. Notably, France is the largest producer of cereals and the second-largest producer of milk in the region (Euromonitor International, January 2012b).
France Canada
GDP (official exchange rate)
US$2,777 billion (2011)
US$1,737 billion (2011)
Real GDP growth rate
1.7% (2011) 1.6% (2010)
-3.1% (2009)
2.5% (2011) 3.2% (2010)
-2.8% (2009)
Unemployment rate 9.3% (2011) 7.5% (2011)
Inflation rate (consumer prices)
2.3% (2011) 1.7% (2010)
2.9% (2011) 1.8% (2010)
Source: EIU, 2012b; 2012c; 2012d; 2012e; 2012f; 2012g)
DEMOGRAPHICS
PAGE 4
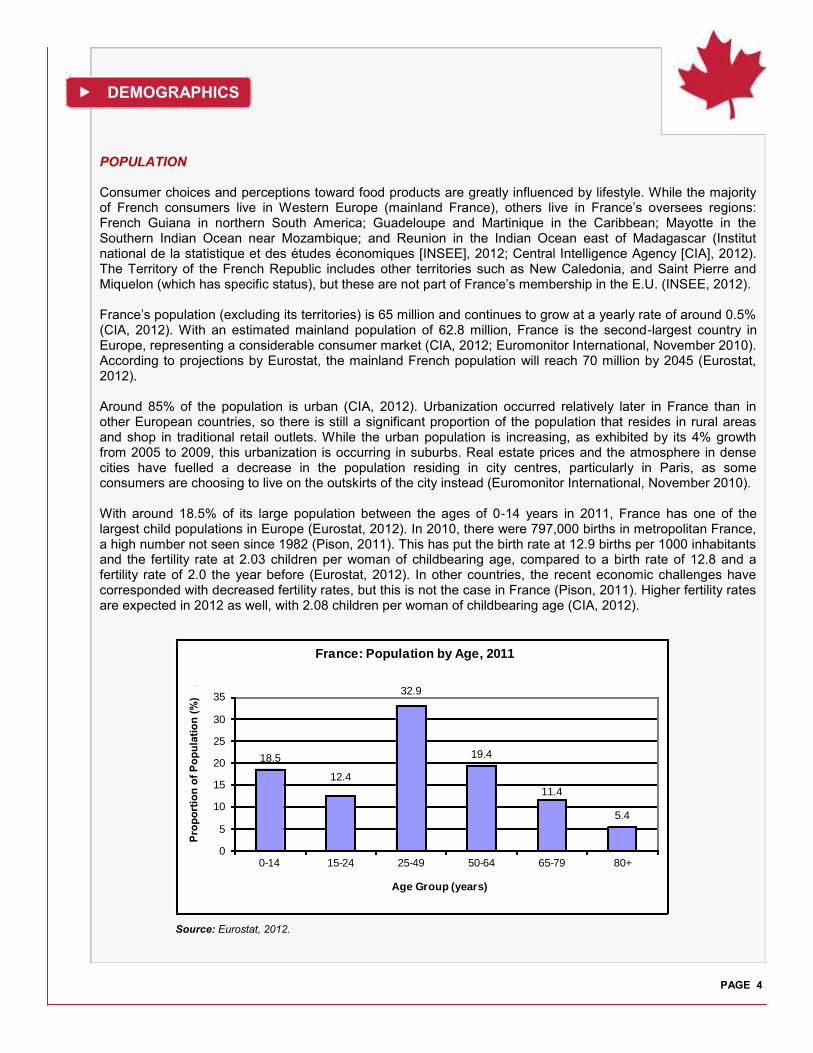
POPULATION Consumer choices and perceptions toward food products are greatly influenced by lifestyle. While the majority of French consumers live in Western Europe (mainland France), others live in France’s oversees regions: French Guiana in northern South America; Guadeloupe and Martinique in the Caribbean; Mayotte in the Southern Indian Ocean near Mozambique; and Reunion in the Indian Ocean east of Madagascar (Institut national de la statistique et des études économiques [INSEE], 2012; Central Intelligence Agency [CIA], 2012). The Territory of the French Republic includes other territories such as New Caledonia, and Saint Pierre and Miquelon (which has specific status), but these are not part of France’s membership in the E.U. (INSEE, 2012). France’s population (excluding its territories) is 65 million and continues to grow at a yearly rate of around 0.5% (CIA, 2012). With an estimated mainland population of 62.8 million, France is the second-largest country in Europe, representing a considerable consumer market (CIA, 2012; Euromonitor International, November 2010). According to projections by Eurostat, the mainland French population will reach 70 million by 2045 (Eurostat, 2012). Around 85% of the population is urban (CIA, 2012). Urbanization occurred relatively later in France than in other European countries, so there is still a significant proportion of the population that resides in rural areas and shop in traditional retail outlets. While the urban population is increasing, as exhibited by its 4% growth from 2005 to 2009, this urbanization is occurring in suburbs. Real estate prices and the atmosphere in dense cities have fuelled a decrease in the population residing in city centres, particularly in Paris, as some consumers are choosing to live on the outskirts of the city instead (Euromonitor International, November 2010). With around 18.5% of its large population between the ages of 0-14 years in 2011, France has one of the largest child populations in Europe (Eurostat, 2012). In 2010, there were 797,000 births in metropolitan France, a high number not seen since 1982 (Pison, 2011). This has put the birth rate at 12.9 births per 1000 inhabitants and the fertility rate at 2.03 children per woman of childbearing age, compared to a birth rate of 12.8 and a fertility rate of 2.0 the year before (Eurostat, 2012). In other countries, the recent economic challenges have corresponded with decreased fertility rates, but this is not the case in France (Pison, 2011). Higher fertility rates are expected in 2012 as well, with 2.08 children per woman of childbearing age (CIA, 2012).
Source: Eurostat, 2012.
18.5
12.4
32.9
19.4
11.4
5.4
0
5
10
15
20
25
30
35
0-14 15-24 25-49 50-64 65-79 80+
Proportion of Population (%)
Age Group (years)
France: Population by Age, 2011
Pro
po
rtio
n o
f P
op
ula
tio
n (
%)
DEMOGRAPHICS (continued)
PAGE 5
POPULATION (continued) This rising number of births may be explained by a number of factors. First, rising unemployment may be encouraging unemployed French women to focus on their families instead. The recent increase may also indicate that women chose to delay having children until economic conditions improved, leading to a higher number of births in 2010 when GDP experienced positive growth (Pison, 2011). Finally, as women in immigrant communities typically have more children, the high level of immigration in France may be contributing to this exceptional number of births (Euromonitor International, November 2010). However, despite more births in 2010, France’s population is aging. This is due to smaller incoming generations and increased life expectancy. In 2011, 16.7% of the population was over 65 years of age and the old-age dependency ratio was 25.9% (Eurostat, 2012). This means that there are around four people in the labour force per person over 65. By 2020, there will be an estimated 15.8 million pensioners, around 24% of the population (Euromonitor International, November 2010). There are more female consumers than male consumers in France. In 2011, there were over 33.5 million females and around 31.5 million males. Life expectancy has been increasing for both genders. In 2011, life expectancy at birth was 78.3 years for males and 85.3 years for females, compared to 75 years for males and 82.7 years for females in 1999 (Eurostat, 2012).
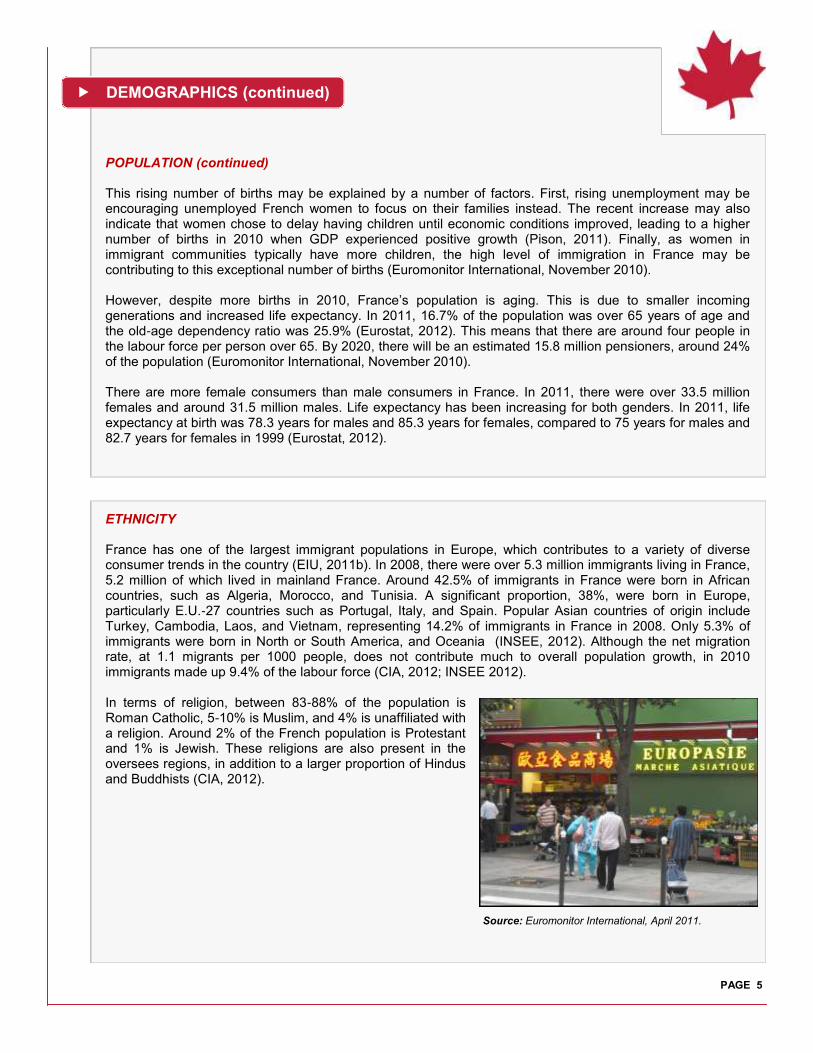
ETHNICITY France has one of the largest immigrant populations in Europe, which contributes to a variety of diverse consumer trends in the country (EIU, 2011b). In 2008, there were over 5.3 million immigrants living in France, 5.2 million of which lived in mainland France. Around 42.5% of immigrants in France were born in African countries, such as Algeria, Morocco, and Tunisia. A significant proportion, 38%, were born in Europe, particularly E.U.-27 countries such as Portugal, Italy, and Spain. Popular Asian countries of origin include Turkey, Cambodia, Laos, and Vietnam, representing 14.2% of immigrants in France in 2008. Only 5.3% of immigrants were born in North or South America, and Oceania (INSEE, 2012). Although the net migration rate, at 1.1 migrants per 1000 people, does not contribute much to overall population growth, in 2010 immigrants made up 9.4% of the labour force (CIA, 2012; INSEE 2012). In terms of religion, between 83-88% of the population is Roman Catholic, 5-10% is Muslim, and 4% is unaffiliated with a religion. Around 2% of the French population is Protestant and 1% is Jewish. These religions are also present in the oversees regions, in addition to a larger proportion of Hindus and Buddhists (CIA, 2012).
Source: Euromonitor International, April 2011.
DEMOGRAPHICS (continued)
PAGE 6
EDUCATION Like other demographic factors, educational attainment also has an impact upon consumer choice. While French consumers are generally becoming more educated, a significant proportion have only completed education at the lower levels. In 2009, there were over 12.2 million students in France, from primary education to post-graduate studies (Euromonitor International, November 2010). Primary education begins at the age of 6, yet 100% of children aged 4-5 years old were enrolled in pre-primary education in 2009 (Eurostat, 2012). Students between the ages of 11 and 15 are enrolled in the collèges. This first stage of secondary school education lasts for four years (Euromonitor International, November 2010). In 2010, 29.2% of the population aged 25-64 had this level of education or less. A number of students at this level have low proficiency in reading literacy, as in 2009, 19.8% of 15-year-olds in France who completed standardized tests exhibited poor reading skills (Eurostat, 2012). Students between the ages of 15 and 18 are enrolled in the lycées, the second stage of secondary school education, which lasts three years. Lycées are divided into three streams. Students in the lycée géneral are prepared for higher education at the university level or short-term, post-secondary studies. Students in the lycée technologique are prepared for short-term post-secondary studies, while students in the lycée professionnel are prepared for a particular vocation (Euromonitor International, November 2010). More French consumers are attaining this level of education. For the population between the ages of 25-64, 70.8% had achieved this level of education in 2010, compared to 60.9% in 1999 (Eurostat, 2012). Students take the French national exam, the Baccalaureate, at the end of their secondary education to determine whether they are eligible for post-secondary education (Euromonitor International, November 2010). In 2009, the median age of students enrolled in tertiary education was 20.5, with women accounting for 55.2% of all students. In 2010, 43.5% of the population aged 30-34 had completed tertiary education, compared to 27.4% in 2000 (Eurostat, 2012). Education in France is mainly funded publically. Compared to the E.-U. 27 average, overall, France spends more per student in all educational institutions as a whole (Eurostat, 2012). Not only does this make education more accessible to French consumers, it also allows them to direct spending to other areas (Euromonitor International, November 2010).
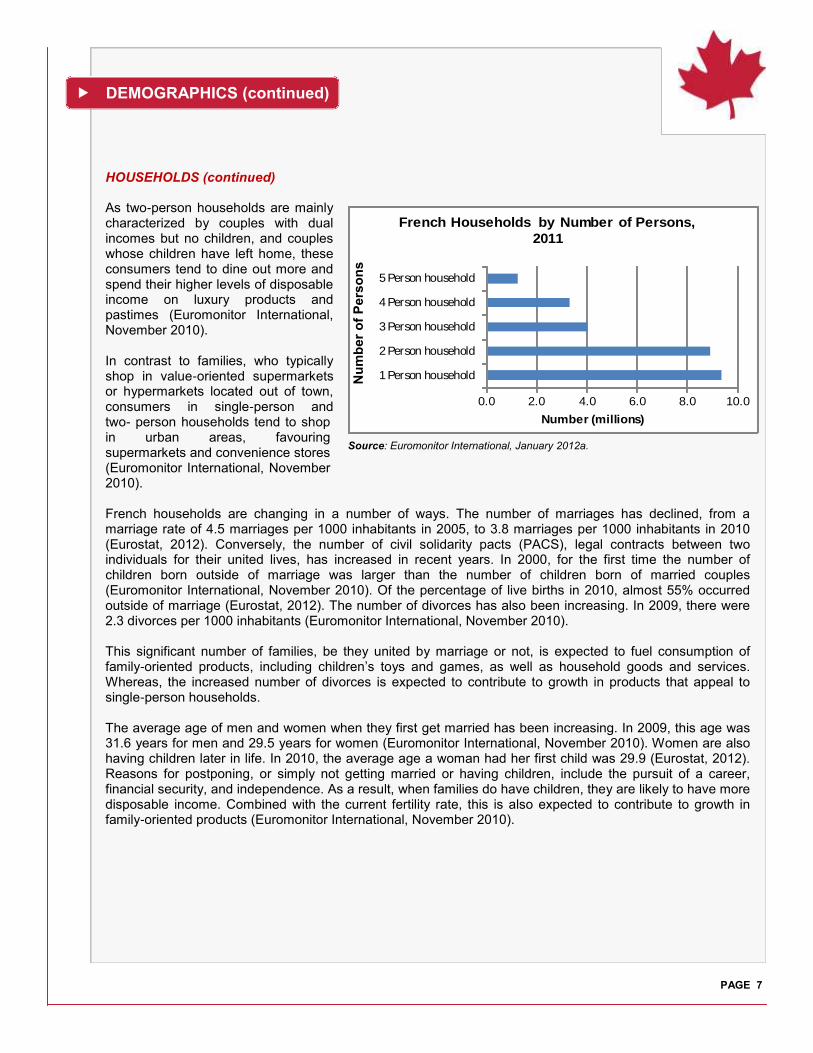
HOUSEHOLDS In 2011, there were around 27.4 million households in France. The most predominant type of household in France is the single-person household. The number of these households has increased by over 9% from 2006 to 2011, accounting for 34% of all households in France in 2011. It is expected to increase a further 14% between 2010 and 2020. Couples with children account for 26.6% of all households, while couples without children account for 26.4%. Even by number of occupants, one-person households still account for the most households. Two-person households, including couples, single-parents, and similar household types, represent around 32% of all households. Around 60% of households in France do not have children (Euromonitor International, January 2012a). This means that there is a significant market for consumer goods that appeal to adults, particularly consumers who live alone. These consumers are interested in single-serving meals and home furnishings that do not take up much room. In general, they spend more on groceries and are more likely to impulse shop (Euromonitor International, November 2010).
DEMOGRAPHICS (continued)
PAGE 7
HOUSEHOLDS (continued) As two-person households are mainly characterized by couples with dual incomes but no children, and couples whose children have left home, these consumers tend to dine out more and spend their higher levels of disposable income on luxury products and pastimes (Euromonitor International, November 2010). In contrast to families, who typically shop in value-oriented supermarkets or hypermarkets located out of town, consumers in single-person and two- person households tend to shop in urban areas, favouring supermarkets and convenience stores (Euromonitor International, November 2010). French households are changing in a number of ways. The number of marriages has declined, from a marriage rate of 4.5 marriages per 1000 inhabitants in 2005, to 3.8 marriages per 1000 inhabitants in 2010 (Eurostat, 2012). Conversely, the number of civil solidarity pacts (PACS), legal contracts between two individuals for their united lives, has increased in recent years. In 2000, for the first time the number of children born outside of marriage was larger than the number of children born of married couples (Euromonitor International, November 2010). Of the percentage of live births in 2010, almost 55% occurred outside of marriage (Eurostat, 2012). The number of divorces has also been increasing. In 2009, there were 2.3 divorces per 1000 inhabitants (Euromonitor International, November 2010). This significant number of families, be they united by marriage or not, is expected to fuel consumption of family-oriented products, including children’s toys and games, as well as household goods and services. Whereas, the increased number of divorces is expected to contribute to growth in products that appeal to single-person households. The average age of men and women when they first get married has been increasing. In 2009, this age was 31.6 years for men and 29.5 years for women (Euromonitor International, November 2010). Women are also having children later in life. In 2010, the average age a woman had her first child was 29.9 (Eurostat, 2012). Reasons for postponing, or simply not getting married or having children, include the pursuit of a career, financial security, and independence. As a result, when families do have children, they are likely to have more disposable income. Combined with the current fertility rate, this is also expected to contribute to growth in family-oriented products (Euromonitor International, November 2010).
Source: Euromonitor International, January 2012a.
0.0 2.0 4.0 6.0 8.0 10.0
1 Person household
2 Person household
3 Person household
4 Person household
5 Person household
Number (millions)
French Households by Number of Persons,
2011
Nu
mb
er
of
Pers
on
s
DEMOGRAPHICS (continued)
PAGE 8
LIFESTYLE AND HEALTH The work week in France runs Monday to Friday and is officially 35 hours, although many employees work between 37.5 to 40 hours and are paid overtime accordingly. The office work day typically runs from 9 a.m. to 6 p.m. (Euromonitor International, March 2012a). In order to address a low participation rate in the workforce, the current French government has loosened the regulations on the 35-hour work week. As France’s labour force is also impacted by an aging population, the government has introduced legislation to raise the retirement age in 2018 from 60 to 62, along with other measures designed to encourage workers to remain in the labour force past the minimum age of retirement (Mintel, 2012; EIU, 2011b). As mentioned previously, a recent demographic trend in France is the number of consumers choosing to live in semi-rural or suburban areas. As a consequence, these consumers have to travel longer to their workplace. The commute is typically longer for those living in urban areas. In Paris, for instance, the average commute in 2008 was 80 minutes, compared to 65 minutes for those in other urban and suburban areas, and 55 minutes for those in rural areas (Euromonitor International, November 2010). French consumers live busy urban lives which do not always lend themselves to a healthy lifestyle. In 2010, around a third of men and a quarter of women between the ages of 15 and 65 smoked regularly. The age group with the highest proportion of smokers was 26-34 years of age for men and 18-25 for women. Interestingly, the proportion of smokers for both sexes more or less decreases with age. A decline in daily smoking was seen in the French population from 2000 and 2005; however, it rose again from 2005 to 2010 (INSEE, 2012) Obesity rates have also been on the rise. In 1997, 9% of the French population was obese and 30% was overweight. By 2009, those numbers had risen to 15% and 32%, respectively. Childhood obesity rates have been increasing faster than adult rates in France. In spite of these numbers, there is a growing awareness among French consumers of the benefits of physical activity and a healthy diet (Euromonitor International, November 2010). The French consume considerable quantities of alcohol. In 2010, the average amount of pure alcohol sold per inhabitant of France was 12 litres. However, this has declined from 12.7 litres in 2007. Daily alcohol consumption increases with age and is three times more prevalent for males. In general, 12% of the French population between the ages of 18 and 75 reported daily alcohol consumption, 37% reported alcohol consumption at least once a week, 38% reported alcohol consumption less than weekly, and 13% reported that they did not drink at all (INSEE, 2012). In 2009, there were 660.5 hospital beds per 100,000 people. In the same year, there were 214,000 active physicians, a record high. Yet as France’s population grows, there are expected to be fewer doctors per person (Eurostat, 2012). The future of health care in France will gain profile as demographic trends and lifestyles burden the existing system.
CONSUMPTION AND EXPENDITURE
PAGE 9
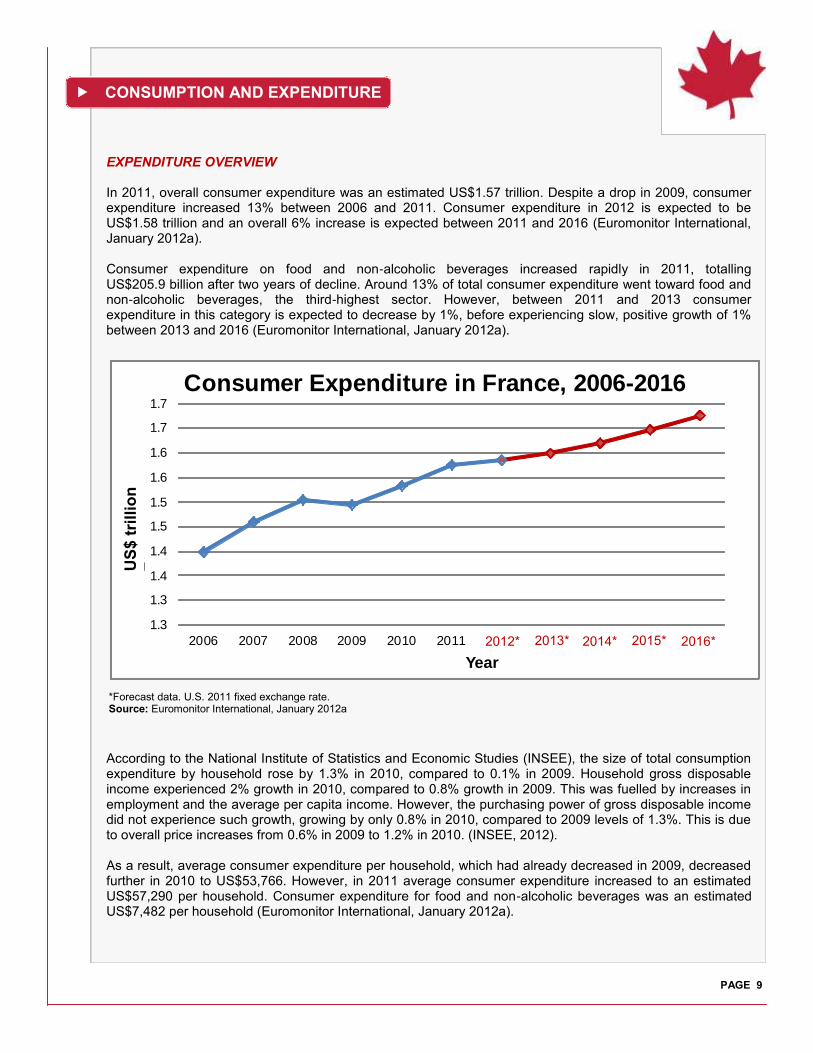
EXPENDITURE OVERVIEW In 2011, overall consumer expenditure was an estimated US$1.57 trillion. Despite a drop in 2009, consumer expenditure increased 13% between 2006 and 2011. Consumer expenditure in 2012 is expected to be US$1.58 trillion and an overall 6% increase is expected between 2011 and 2016 (Euromonitor International, January 2012a). Consumer expenditure on food and non-alcoholic beverages increased rapidly in 2011, totalling US$205.9 billion after two years of decline. Around 13% of total consumer expenditure went toward food and non-alcoholic beverages, the third-highest sector. However, between 2011 and 2013 consumer expenditure in this category is expected to decrease by 1%, before experiencing slow, positive growth of 1% between 2013 and 2016 (Euromonitor International, January 2012a).
According to the National Institute of Statistics and Economic Studies (INSEE), the size of total consumption expenditure by household rose by 1.3% in 2010, compared to 0.1% in 2009. Household gross disposable income experienced 2% growth in 2010, compared to 0.8% growth in 2009. This was fuelled by increases in employment and the average per capita income. However, the purchasing power of gross disposable income did not experience such growth, growing by only 0.8% in 2010, compared to 2009 levels of 1.3%. This is due to overall price increases from 0.6% in 2009 to 1.2% in 2010. (INSEE, 2012). As a result, average consumer expenditure per household, which had already decreased in 2009, decreased further in 2010 to US$53,766. However, in 2011 average consumer expenditure increased to an estimated US$57,290 per household. Consumer expenditure for food and non-alcoholic beverages was an estimated US$7,482 per household (Euromonitor International, January 2012a).
*Forecast data. U.S. 2011 fixed exchange rate. Source: Euromonitor International, January 2012a
1.3
1.3
1.4
1.4
1.5
1.5
1.6
1.6
1.7
1.7
2006 2007 2008 2009 2010 2011 2012* 2013* 2014* 2015* 2016*
US$ trillion
Year
Consumer Expenditure in France, 2006-2016
US
$ t
rill
ion
2012* 2013* 2014* 2015* 2016*
CONSUMPTION AND EXPENDITURE (continued)
PAGE 10
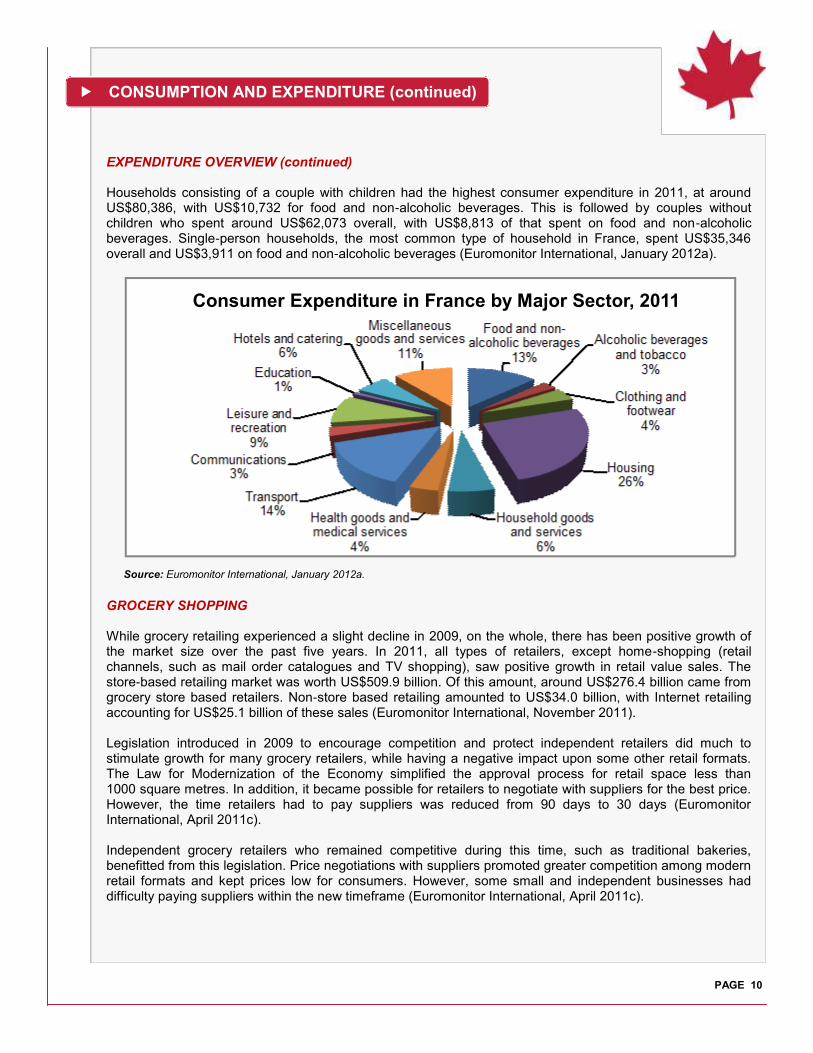
EXPENDITURE OVERVIEW (continued) Households consisting of a couple with children had the highest consumer expenditure in 2011, at around US$80,386, with US$10,732 for food and non-alcoholic beverages. This is followed by couples without children who spent around US$62,073 overall, with US$8,813 of that spent on food and non-alcoholic beverages. Single-person households, the most common type of household in France, spent US$35,346 overall and US$3,911 on food and non-alcoholic beverages (Euromonitor International, January 2012a).
GROCERY SHOPPING While grocery retailing experienced a slight decline in 2009, on the whole, there has been positive growth of the market size over the past five years. In 2011, all types of retailers, except home-shopping (retail channels, such as mail order catalogues and TV shopping), saw positive growth in retail value sales. The store-based retailing market was worth US$509.9 billion. Of this amount, around US$276.4 billion came from grocery store based retailers. Non-store based retailing amounted to US$34.0 billion, with Internet retailing accounting for US$25.1 billion of these sales (Euromonitor International, November 2011). Legislation introduced in 2009 to encourage competition and protect independent retailers did much to stimulate growth for many grocery retailers, while having a negative impact upon some other retail formats. The Law for Modernization of the Economy simplified the approval process for retail space less than 1000 square metres. In addition, it became possible for retailers to negotiate with suppliers for the best price. However, the time retailers had to pay suppliers was reduced from 90 days to 30 days (Euromonitor International, April 2011c). Independent grocery retailers who remained competitive during this time, such as traditional bakeries, benefitted from this legislation. Price negotiations with suppliers promoted greater competition among modern retail formats and kept prices low for consumers. However, some small and independent businesses had difficulty paying suppliers within the new timeframe (Euromonitor International, April 2011c).
Source: Euromonitor International, January 2012a.
Consumer Expenditure in France by Major Sector, 2011
CONSUMPTION AND EXPENDITURE (continued)
PAGE 11
GROCERY SHOPPING (continued) The popularity of private label products also explains why grocery retailers are faring better than other retailers. Recent product innovation has allowed retailers, such as Carrefour, to offer private label products that appeal to price-conscious consumers, without compromising quality or efficiency. Supermarkets and hypermarkets with their own private labels have benefitted from this, at the expense of discounters (Euromonitor International, April 2011c). In 2011, there were approximately 93,968 grocery retailers in France, up from 93,674 in 2010 (Euromonitor International, November 2011). Hypermarkets had the greatest value sales of all grocery retailers in France in 2011, with 42%, but the fewest outlets. Hypermarkets, supermarkets, and discounters all saw positive growth in 2011, while convenience stores did not (Euromonitor International, April 2012c).
The six major grocery retail chains in France are Carrefour, Leclerc, Casino, Auchan, Systeme U, and Monoprix, amongst which there is significant competition. Most French consumers have access to at least two of these chains, except in Paris, where there are few supermarkets.
Online grocery shopping has increased in popularity in recent years. From 2006 to 2011, Internet retailing as a whole grew by 214%. In 2011, 52.7 million French consumers had access to the Internet. Food and drink remains one of the main categories of Internet retailing (Euromonitor International, March 2012a). As a result of this trend, the main supermarket chains have begun to offer online grocery services, with grocery delivery services offered in Paris and other major cities. ‘Drive’ outlets have also gained popularity in France, mainly through word of mouth. This type of retail channel, where consumers order groceries online and then pick them up themselves, is emerging specifically outside of Paris, where consumers typically commute to work. This type of channel appeals to consumers who wish to save time and control spending (Aubril, 2012).
FOODSERVICE Higher unemployment rates and decreased disposable income have made consumers more price-conscious. Consumer foodservice has been negatively affected by this, as consumers prefer to dine and entertain at home in an effort to reduce expenditure (Euromonitor International, November 2010). Consumer foodservice sales have dropped in value since 2008, although the rate of decline slowed in 2010, when the market reached US$62.1 billion. Some types of foodservice have fared better than others. Chained consumer foodservice, for instance, saw persistent growth from 2005 to 2010 despite the economic downturn, while independent consumer foodservice growth has declined since 2008. In 2015, consumer foodservice is expected to have a market size of US$61.5 billion (Euromonitor International, May 2011). In 2009, the French government lowered the value added tax (VAT) from 19.6% to 5.5% on some types of foodservice. The lower rate does not apply to some products, like alcoholic drinks, for example. Nevertheless, over the long term, the reduced tax should encourage consumer expenditure (Euromonitor International, August 2011a).
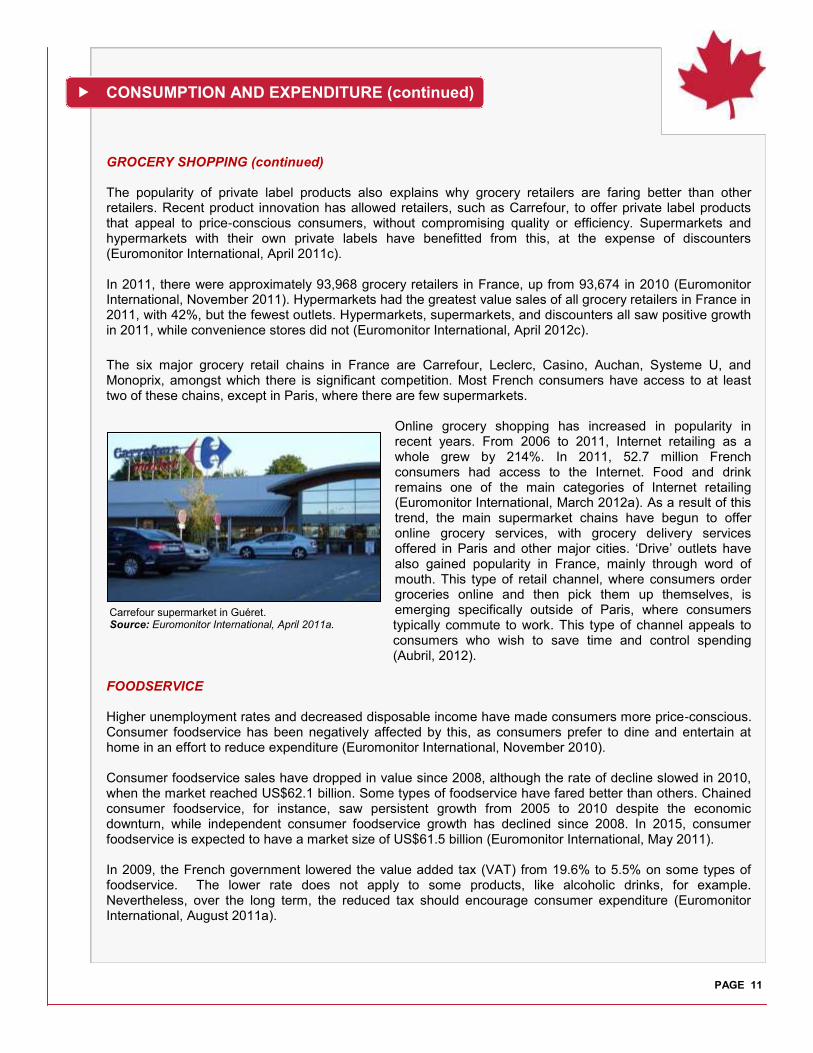
Carrefour supermarket in Guéret. Source: Euromonitor International, April 2011a.
CONSUMPTION AND EXPENDITURE (continued)
PAGE 12
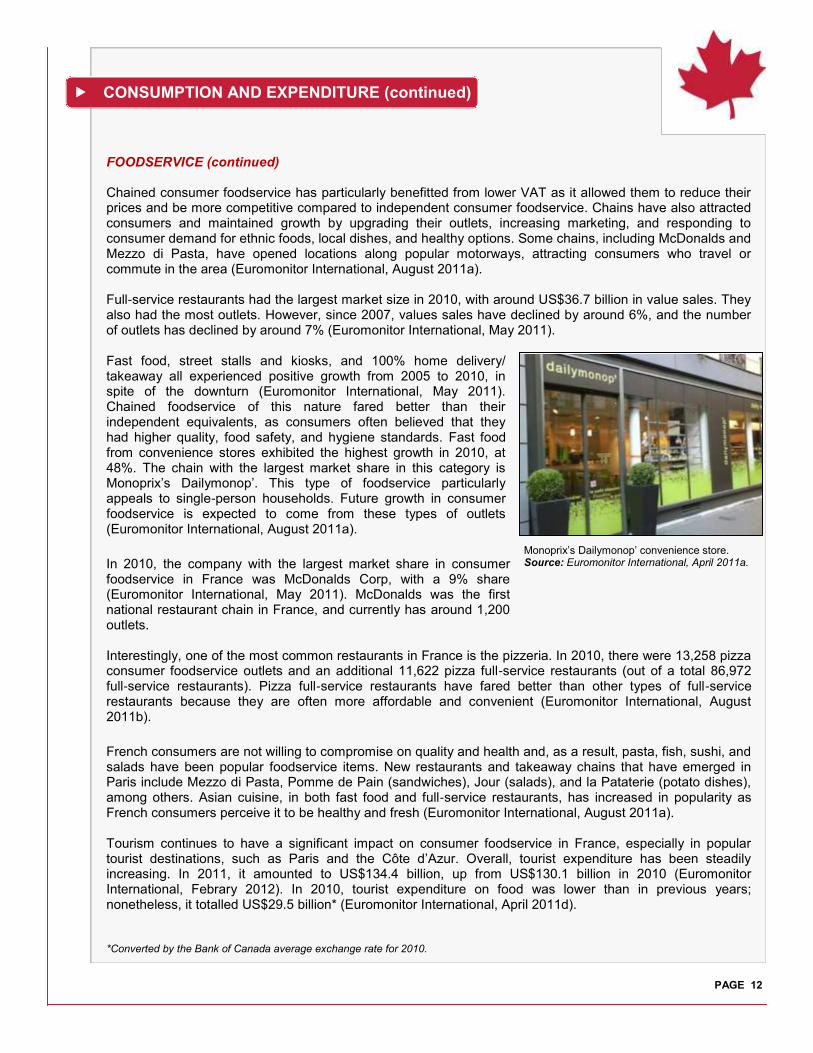
FOODSERVICE (continued) Chained consumer foodservice has particularly benefitted from lower VAT as it allowed them to reduce their prices and be more competitive compared to independent consumer foodservice. Chains have also attracted consumers and maintained growth by upgrading their outlets, increasing marketing, and responding to consumer demand for ethnic foods, local dishes, and healthy options. Some chains, including McDonalds and Mezzo di Pasta, have opened locations along popular motorways, attracting consumers who travel or commute in the area (Euromonitor International, August 2011a). Full-service restaurants had the largest market size in 2010, with around US$36.7 billion in value sales. They also had the most outlets. However, since 2007, values sales have declined by around 6%, and the number of outlets has declined by around 7% (Euromonitor International, May 2011). Fast food, street stalls and kiosks, and 100% home delivery/takeaway all experienced positive growth from 2005 to 2010, in spite of the downturn (Euromonitor International, May 2011). Chained foodservice of this nature fared better than their independent equivalents, as consumers often believed that they had higher quality, food safety, and hygiene standards. Fast food from convenience stores exhibited the highest growth in 2010, at 48%. The chain with the largest market share in this category is Monoprix’s Dailymonop’. This type of foodservice particularly appeals to single-person households. Future growth in consumer foodservice is expected to come from these types of outlets (Euromonitor International, August 2011a). In 2010, the company with the largest market share in consumer foodservice in France was McDonalds Corp, with a 9% share (Euromonitor International, May 2011). McDonalds was the first national restaurant chain in France, and currently has around 1,200 outlets. Interestingly, one of the most common restaurants in France is the pizzeria. In 2010, there were 13,258 pizza consumer foodservice outlets and an additional 11,622 pizza full-service restaurants (out of a total 86,972 full-service restaurants). Pizza full-service restaurants have fared better than other types of full-service restaurants because they are often more affordable and convenient (Euromonitor International, August 2011b).
French consumers are not willing to compromise on quality and health and, as a result, pasta, fish, sushi, and salads have been popular foodservice items. New restaurants and takeaway chains that have emerged in Paris include Mezzo di Pasta, Pomme de Pain (sandwiches), Jour (salads), and la Pataterie (potato dishes), among others. Asian cuisine, in both fast food and full-service restaurants, has increased in popularity as French consumers perceive it to be healthy and fresh (Euromonitor International, August 2011a). Tourism continues to have a significant impact on consumer foodservice in France, especially in popular tourist destinations, such as Paris and the Côte d’Azur. Overall, tourist expenditure has been steadily increasing. In 2011, it amounted to US$134.4 billion, up from US$130.1 billion in 2010 (Euromonitor International, Febrary 2012). In 2010, tourist expenditure on food was lower than in previous years; nonetheless, it totalled US$29.5 billion* (Euromonitor International, April 2011d). *Converted by the Bank of Canada average exchange rate for 2010.
Monoprix’s Dailymonop’ convenience store. Source: Euromonitor International, April 2011a.
CONSUMPTION AND EXPENDITURE (continued)
PAGE 13
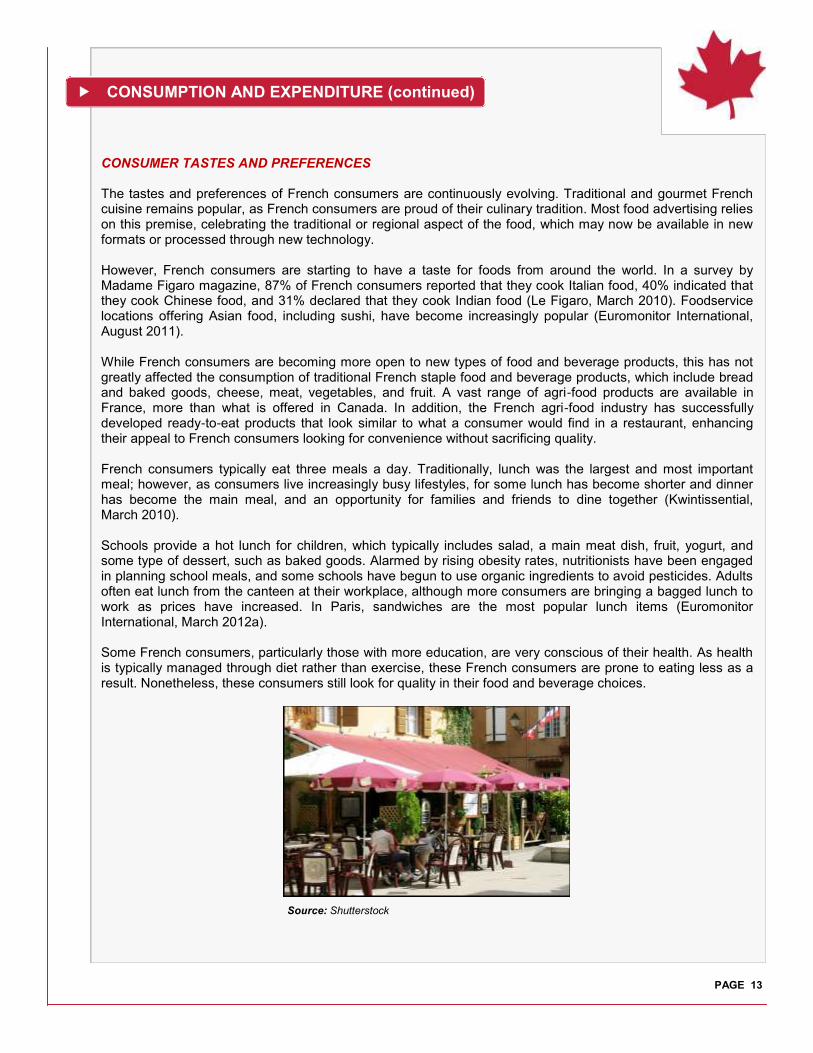
CONSUMER TASTES AND PREFERENCES The tastes and preferences of French consumers are continuously evolving. Traditional and gourmet French cuisine remains popular, as French consumers are proud of their culinary tradition. Most food advertising relies on this premise, celebrating the traditional or regional aspect of the food, which may now be available in new formats or processed through new technology. However, French consumers are starting to have a taste for foods from around the world. In a survey by Madame Figaro magazine, 87% of French consumers reported that they cook Italian food, 40% indicated that they cook Chinese food, and 31% declared that they cook Indian food (Le Figaro, March 2010). Foodservice locations offering Asian food, including sushi, have become increasingly popular (Euromonitor International, August 2011). While French consumers are becoming more open to new types of food and beverage products, this has not greatly affected the consumption of traditional French staple food and beverage products, which include bread and baked goods, cheese, meat, vegetables, and fruit. A vast range of agri-food products are available in France, more than what is offered in Canada. In addition, the French agri-food industry has successfully developed ready-to-eat products that look similar to what a consumer would find in a restaurant, enhancing their appeal to French consumers looking for convenience without sacrificing quality. French consumers typically eat three meals a day. Traditionally, lunch was the largest and most important meal; however, as consumers live increasingly busy lifestyles, for some lunch has become shorter and dinner has become the main meal, and an opportunity for families and friends to dine together (Kwintissential, March 2010). Schools provide a hot lunch for children, which typically includes salad, a main meat dish, fruit, yogurt, and some type of dessert, such as baked goods. Alarmed by rising obesity rates, nutritionists have been engaged in planning school meals, and some schools have begun to use organic ingredients to avoid pesticides. Adults often eat lunch from the canteen at their workplace, although more consumers are bringing a bagged lunch to work as prices have increased. In Paris, sandwiches are the most popular lunch items (Euromonitor International, March 2012a). Some French consumers, particularly those with more education, are very conscious of their health. As health is typically managed through diet rather than exercise, these French consumers are prone to eating less as a result. Nonetheless, these consumers still look for quality in their food and beverage choices.
Source: Shutterstock
TRENDS
PAGE 14
CONVENIENCE In France, there has been increased demand for convenient food and beverage products. This is due to changing lifestyles and demographics in the French consumer population. As more French consumers are moving to suburban areas, the length of their commute to work is increasing. With most adults in the workforce, there is less time for these consumers to spend on household and familial tasks. In 2010, the average lunch break was around 31 minutes, compared to a lunch break of an hour and a half 35 years ago. In addition, the average time spent preparing a meal has decreased to ten minutes (Euromonitor International, August 2011). The large and increasing number of single-person households has also fuelled this trend. Many of these households consist of young professionals, divorced adults, and students who also live busy lifestyles. Along with couples with two incomes but no children, these households spend more of their disposable income on services and leisure. Families are also interested in time-saving products and services (Euromonitor International, March 2012b).
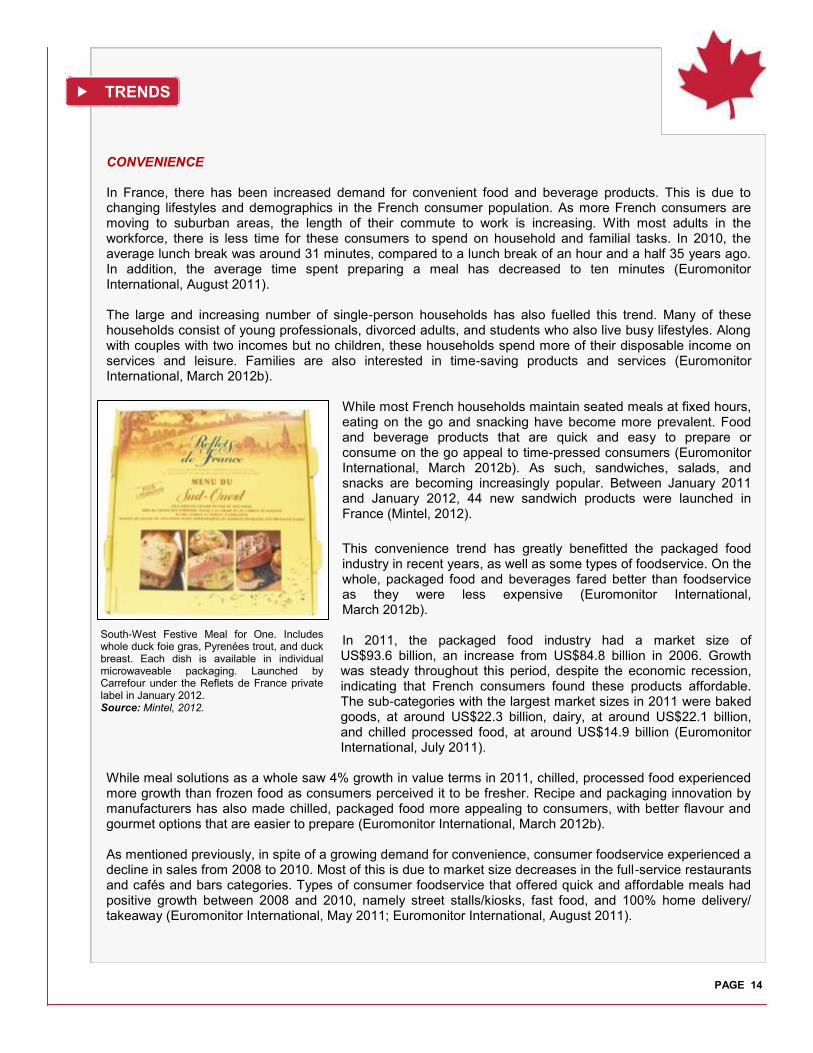
While most French households maintain seated meals at fixed hours, eating on the go and snacking have become more prevalent. Food and beverage products that are quick and easy to prepare or consume on the go appeal to time-pressed consumers (Euromonitor International, March 2012b). As such, sandwiches, salads, and snacks are becoming increasingly popular. Between January 2011 and January 2012, 44 new sandwich products were launched in France (Mintel, 2012).
This convenience trend has greatly benefitted the packaged food industry in recent years, as well as some types of foodservice. On the whole, packaged food and beverages fared better than foodservice as they were less expensive (Euromonitor International, March 2012b). In 2011, the packaged food industry had a market size of US$93.6 billion, an increase from US$84.8 billion in 2006. Growth was steady throughout this period, despite the economic recession, indicating that French consumers found these products affordable. The sub-categories with the largest market sizes in 2011 were baked goods, at around US$22.3 billion, dairy, at around US$22.1 billion, and chilled processed food, at around US$14.9 billion (Euromonitor International, July 2011).
While meal solutions as a whole saw 4% growth in value terms in 2011, chilled, processed food experienced more growth than frozen food as consumers perceived it to be fresher. Recipe and packaging innovation by manufacturers has also made chilled, packaged food more appealing to consumers, with better flavour and gourmet options that are easier to prepare (Euromonitor International, March 2012b). As mentioned previously, in spite of a growing demand for convenience, consumer foodservice experienced a decline in sales from 2008 to 2010. Most of this is due to market size decreases in the full-service restaurants and cafés and bars categories. Types of consumer foodservice that offered quick and affordable meals had positive growth between 2008 and 2010, namely street stalls/kiosks, fast food, and 100% home delivery/takeaway (Euromonitor International, May 2011; Euromonitor International, August 2011).
South-West Festive Meal for One. Includes whole duck foie gras, Pyrenées trout, and duck breast. Each dish is available in individual microwaveable packaging. Launched by Carrefour under the Reflets de France private label in January 2012. Source: Mintel, 2012.
TRENDS (continued)
PAGE 15
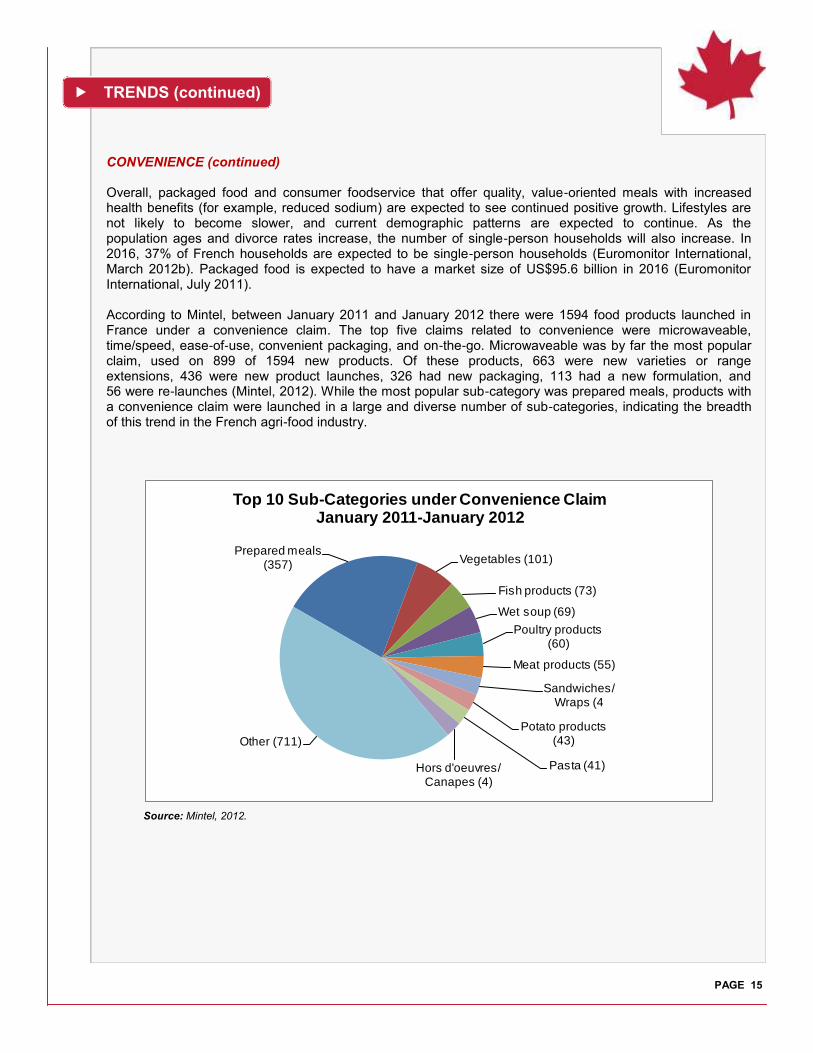
CONVENIENCE (continued) Overall, packaged food and consumer foodservice that offer quality, value-oriented meals with increased health benefits (for example, reduced sodium) are expected to see continued positive growth. Lifestyles are not likely to become slower, and current demographic patterns are expected to continue. As the population ages and divorce rates increase, the number of single-person households will also increase. In 2016, 37% of French households are expected to be single-person households (Euromonitor International, March 2012b). Packaged food is expected to have a market size of US$95.6 billion in 2016 (Euromonitor International, July 2011). According to Mintel, between January 2011 and January 2012 there were 1594 food products launched in France under a convenience claim. The top five claims related to convenience were microwaveable, time/speed, ease-of-use, convenient packaging, and on-the-go. Microwaveable was by far the most popular claim, used on 899 of 1594 new products. Of these products, 663 were new varieties or range extensions, 436 were new product launches, 326 had new packaging, 113 had a new formulation, and 56 were re-launches (Mintel, 2012). While the most popular sub-category was prepared meals, products with a convenience claim were launched in a large and diverse number of sub-categories, indicating the breadth of this trend in the French agri-food industry.
Source: Mintel, 2012.
Prepared meals (357) Vegetables (101)
Fish products (73)
Wet soup (69)
Poultry products (60)
Meat products (55)
Sandwiches/Wraps (4
Potato products (43)
Pasta (41)Hors d'oeuvres/Canapes (4)
Other (711)
Top 10 Sub-Categories under Convenience ClaimJanuary 2011-January 2012
TRENDS (continued)
PAGE 16
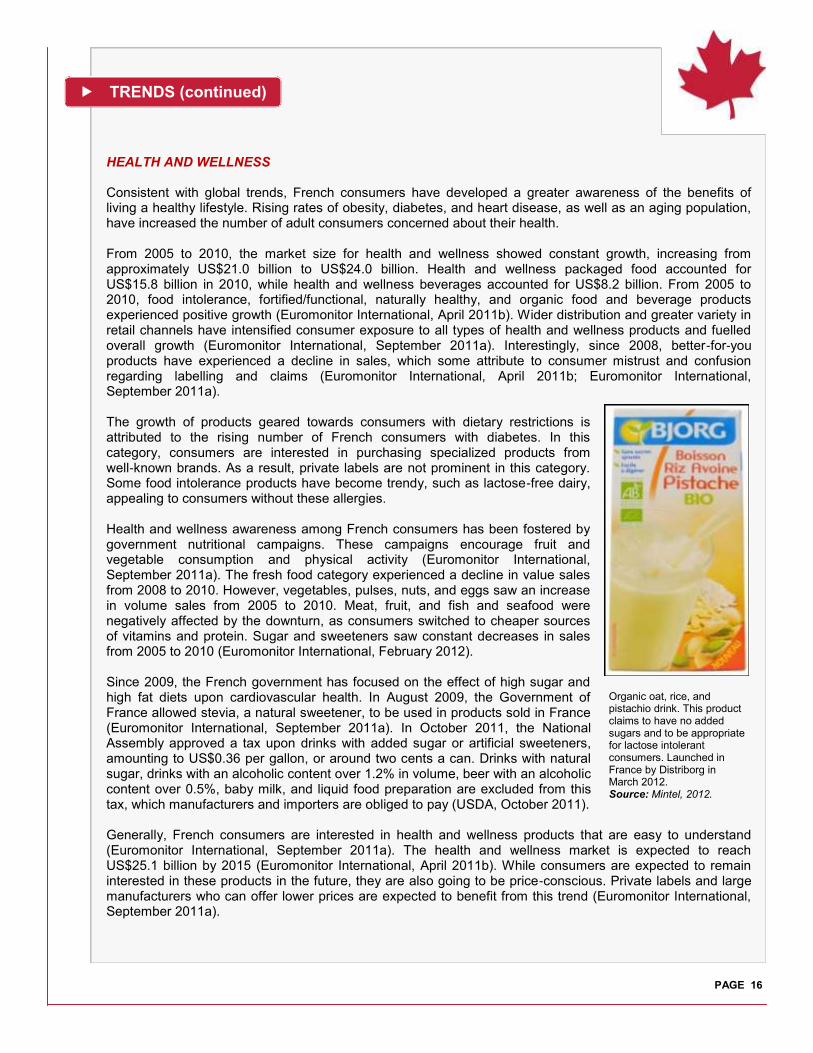
HEALTH AND WELLNESS Consistent with global trends, French consumers have developed a greater awareness of the benefits of living a healthy lifestyle. Rising rates of obesity, diabetes, and heart disease, as well as an aging population, have increased the number of adult consumers concerned about their health. From 2005 to 2010, the market size for health and wellness showed constant growth, increasing from approximately US$21.0 billion to US$24.0 billion. Health and wellness packaged food accounted for US$15.8 billion in 2010, while health and wellness beverages accounted for US$8.2 billion. From 2005 to 2010, food intolerance, fortified/functional, naturally healthy, and organic food and beverage products experienced positive growth (Euromonitor International, April 2011b). Wider distribution and greater variety in retail channels have intensified consumer exposure to all types of health and wellness products and fuelled overall growth (Euromonitor International, September 2011a). Interestingly, since 2008, better-for-you products have experienced a decline in sales, which some attribute to consumer mistrust and confusion regarding labelling and claims (Euromonitor International, April 2011b; Euromonitor International, September 2011a). The growth of products geared towards consumers with dietary restrictions is attributed to the rising number of French consumers with diabetes. In this category, consumers are interested in purchasing specialized products from well-known brands. As a result, private labels are not prominent in this category. Some food intolerance products have become trendy, such as lactose-free dairy, appealing to consumers without these allergies. Health and wellness awareness among French consumers has been fostered by government nutritional campaigns. These campaigns encourage fruit and vegetable consumption and physical activity (Euromonitor International, September 2011a). The fresh food category experienced a decline in value sales from 2008 to 2010. However, vegetables, pulses, nuts, and eggs saw an increase in volume sales from 2005 to 2010. Meat, fruit, and fish and seafood were negatively affected by the downturn, as consumers switched to cheaper sources of vitamins and protein. Sugar and sweeteners saw constant decreases in sales from 2005 to 2010 (Euromonitor International, February 2012). Since 2009, the French government has focused on the effect of high sugar and high fat diets upon cardiovascular health. In August 2009, the Government of France allowed stevia, a natural sweetener, to be used in products sold in France (Euromonitor International, September 2011a). In October 2011, the National Assembly approved a tax upon drinks with added sugar or artificial sweeteners, amounting to US$0.36 per gallon, or around two cents a can. Drinks with natural sugar, drinks with an alcoholic content over 1.2% in volume, beer with an alcoholic content over 0.5%, baby milk, and liquid food preparation are excluded from this tax, which manufacturers and importers are obliged to pay (USDA, October 2011). Generally, French consumers are interested in health and wellness products that are easy to understand (Euromonitor International, September 2011a). The health and wellness market is expected to reach US$25.1 billion by 2015 (Euromonitor International, April 2011b). While consumers are expected to remain interested in these products in the future, they are also going to be price-conscious. Private labels and large manufacturers who can offer lower prices are expected to benefit from this trend (Euromonitor International, September 2011a).
Organic oat, rice, and pistachio drink. This product claims to have no added sugars and to be appropriate for lactose intolerant consumers. Launched in France by Distriborg in March 2012. Source: Mintel, 2012.

TRENDS (continued)
PAGE 17
PRIVATE LABEL Recent economic challenges have made French consumers more price conscious. Consumers who are value-oriented, but not willing to compromise on quality, have turned to private labels, which offer a wide variety of products. Among other consumer groups, private labels appeal to single-parent families, which account for over 2.1 million households in France (Euromonitor International, November 2010). Private label products were traditionally limited to certain categories, including chilled food (Euromonitor International, March 2012). However, they have successfully moved into other categories including organics, luxury snack products, and chocolate confectionery, among others. This is largely due to increased innovation regarding flavour and recipe. By making existing products healthier, private labels have been able to compete on many levels with branded products (Euromonitor International, April 2011c). Private labels have also been able to address consumer concerns regarding environmental sustainability (Euromonitor International, March 2012). As such, private label products have been the drivers of growth in many categories, including health and wellness and organic products (Euromonitor International, September 2011a; September 2011b). Growth in retail grocery sales have also been attributed to private label brands from supermarkets and hypermarkets (Euromonitor International, April 2011a). This is often due to product innovation and entry into new markets, which allow private labels to offer consumers quality alternatives to branded products (Euromonitor International, March 2012). This trend is expected to continue and private labels are expected to increase price competition, keeping prices affordable for consumers (Euromonitor International, March 2012b). Between January 2011 and January 2012, there were 6749 food products and 1248 beverage products launched in France. Of the food products, 2416 were private label, while 331 of drink products were private label. Private label food products were launched in a wide variety of sub-categories, the most popular of which was prepared meals. The top five companies for food product launches were Monoprix (382 products), Intermarché (345 products), Casino (274 products), Systeme U (213 products), and CMI (200 products) (Mintel, 2012).
Source: Mintel, 2012.
Prepared meals (150)
Fish products (116)
Meat products (115)
Sweet biscuits/ Cookies (112)
Vegetables (111)
Other (1812)
Sub-Categories Private Label Food Product Launches in France
January 2011-January 2012

TRENDS (continued)
PAGE 18
HALAL The Muslim population in France was around 5-10% of the total population as of January 1, 2012. Given this, combined with the large number of immigrants each year from countries where the Muslim religion is widely practiced, it is no surprise that there is growing demand for halal food and beverage products (CIA, 2012). According to the World Halal Forum, in 2009, the halal food market in France was worth approximately US$17.4 billion, while the projected market size for 2010 was US$18.2 billion (World Halal Forum, 2009). The majority of halal products are sold in specialty stores, but supermarkets and hypermarkets have been expanding their product ranges to offer greater selection. Halal products in France are mostly meat, but there is increased demand for other grocery products (USDA, 2011). One of the most popular halal food products is poultry-based processed meat. Many younger Muslim consumers, particularly third-generation immigrants, are increasingly interested in ready-meals, convenience products, and health and wellness foods. This is fuelling demand for such products that also comply with religious dietary law (World Halal Forum, 2009). Halal fine cuisine products are being developed as well. Some young, Muslim professionals are looking for luxury and gourmet products, such as foie gras, with halal certification (Euromonitor International, November 2010). Halal has also been moving into consumer foodservice. Foodservice chain Quick Restaurants SA, for instance, modified 14 of its restaurants to offer its dishes made with certified halal meat. Sandwiches that formerly included bacon as an ingredient are now made with halal beef. These restaurants appeal, not only to Muslim consumers, but to non-Muslim consumers who enjoy the taste of the food (Maccaud, 2010). According to Mintel’s Global New Products Database, between January 2011 and January 2012, there were 84 food products launched in France using halal as a claim. Of these food products, 54 were new products, 18 were a new variety or a range extension, 7 had new packaging, and 5 had a new formulation. The sub-categories with the most new products launched were prepared meals and poultry products, each with 15 products (Mintel, 2012).
Foie Gras with Halal certification. Launched December 2011 by Labeyrie. Source: Mintel, 2012.
Halal kebab kit launched in France by Oriental Viandes in March 2012. Source: Mintel, 2012.
Halal minced poultry burgers. Launched in France by Fleury Michon in September 2011. Source: Mintel, 2012.
TRENDS (continued)
PAGE 19
ORGANIC The organic food and beverage market is one of the most rapidly growing markets in France. This is fuelled by growing awareness of the benefits of living a healthy lifestyle and concern for environmental sustainability. Although there is not as much demand in France as in other European countries, this market saw positive growth between 2005 and 2010, despite the economic downturn. Per capita consumption was approximately US$55.70* in 2009. By the beginning of 2011, an estimated 20% of French consumers were consuming an organic product on a regular basis. (Euromonitor International, March 2012b). In 2010, organic food and beverages had a market size of US$1.9 billion, up from US$1.2 billion in 2005. Organic packaged food represented the bulk of the market, totalling US$1.7 billion in 2010, while organic beverages totalled US$171 million. The largest sub-category was organic dairy products, at US$628.8 million. This represents a 71% increase from a total of US$366.1 million in 2005 and is attributed to growth in value sales for organic milk, cheese, and yogurt (Euromonitor International, April 2011b; Euromonitor International, September 2011b). Demand for organic milk is reported to be growing by 10% each year (Euromonitor International, March 2012b). Organic bakery products, the second-largest sub-category, saw market sales grow from US$353.2 million in 2005 to US$444.3 million in 2010 (Euromonitor International, April 2011b). Although continuing economic challenges are expected in 2012, the positive performance of this market throughout the last economic downturn is expected to continue. However, it should be noted that although most French consumers are aware of organic food and beverages, price often represents a barrier to their consumption. A 2009 survey by Agence Bio, the organic trade association in France, revealed that around 57% of French consumers compare prices between organic products and non-organic products when making purchasing decisions. As a result, the affordability of organic private label products has added appeal for consumers (Euromonitor International, April 2011b). In 2010, private label represented 25% of the organic packaged food market (Euromonitor International, September 2011b). Organic products typically appeal most to consumers with higher incomes. Couples without children or couples with children who are no longer living at home are the household types that are most interested in organic products. These consumers are generally more concerned with health and wellness, and have the disposable income to address these concerns (Euromonitor International, November 2010). Organic packaged food is expected to see a compound annual growth rate (CAGR) of 7% by 2015, in terms of value sales, reaching US$2.3 billion (Euromonitor International, September 2011b; Euromonitor International, April 2011b). Overall, in 2015 organic packaged food and beverage value sales are expected to total US$2.6 billion (Euromonitor International, April 2011b). While forecast unit price decreases will affect value sales, these decreases will have a favourable impact upon sales in terms of volume (Euromonitor International, September 2011b). The sub-categories that are expected to see the most growth are organic ready-meals and organic chocolate confectionery. Demand for these products will largely be driven by time-pressed urban consumers (Euromonitor International, September 2011b). Between January 2011 and January 2012, there were 1149 food product launches in France with organic as a claim. The top three sub-categories with the most product launches were sweet biscuits/cookies (68 products); vegetables (53 products); and cakes, pastries, and sweet goods (46 products) (Mintel, 2012). * Bank of Canada average exchange rate for 2009.
CONCLUSION
PAGE 20
France’s over 65 million consumers are a significant market for Canadian agri-food and fish and seafood businesses. In 2011, Canada’s agri-food and fish and seafood exports to France totalled C$280.3 million, while imports from France totalled C$856.0 million (Statistics Canada, 2012). Several demographic trends characterize the French population and affect consumer behaviour. With an increasing suburban population commuting to work, many types of French households, including single-person households, dual-income couples, and families, are interested in convenient food and beverage products that can be quickly prepared and consumed on the go. In addition, French consumers are living increasingly stressful lifestyles. The increased number of divorces and single-person households predicted for future years are also expected to raise demand for prepared food and household goods. The trend toward marrying and having children later in life means that families typically have higher disposable income to spend on family-friendly or child-oriented food and beverage products and services. As France has a large child population and a birth rate that has grown recently, children and families will remain important consumer groups. French consumers are proud of their regional culinary heritage, however, their tastes and preferences are diversifying. A significant proportion of Muslims in the French population is fuelling demand for halal food and beverage products, including in new categories such as convenience foods and ready-meals. Overall, France’s aging population and increasing awareness of rising obesity and diabetes rates have caused the French government and French consumers to be concerned with health and wellness. This has led to increased value sales in organic products, as well as food intolerance, fortified/functional, and naturally healthy products. The economic down turn in late 2008 and continuing economic challenges in the euro-zone have caused French consumers to be price-conscious. This has led to increased demand for private label products that are less expensive than branded products, but comparable in terms of quality. As France’s economy recovers and its population continues to grow, these trends are expected to continue.
KEY RESOURCES
Aubril, Sylvain. (2012). “Le drive répond visiblement aux attentes des clients.” LSA. Retrieved 2012, April 20 from: [http://www.lsa-
conso.fr/le-drive-repond-visiblement-aux-attentes-des-clients,127951]. Central Intelligence Agency. (March 2012). “Europe: France.” The World Factbook. Retrieved 2012, March 25 from [https://www.cia.gov/
library/publications/the-world-factbook/geos/fr.html]. Economist Intelligence Unit. (2012a, August 1). “Country Outlook.” ViewsWire France. The Economist. Retrieved 2012, August 20 from
[http://viewswire.eiu.com/index.asp?layout=oneclick&pubtype_id=1086275908&country_id=1350000135&rf=0]. Economist Intelligence Unit. (2011a, August 23). “Economy: Ten Year Growth Outlook.” ViewsWire France. The Economist. Retrieved
2012, August 20 from [http://viewswire.eiu.com/index.asp lay-out=oneclick&pubtype_id=1086275908&country_id=1350000135&rf=0].
Economist Intelligence Unit. (2012b, March 26). “Five year forecast table: Employment, wages, and prices.” ViewsWire Canada. The
Economist. Retrieved on 2012, 17 April from: [http://viewswire.eiu.com/index.asp?
layout=oneclick&pubtype_id=1086275908&country_id=1490000149].
KEY RESOURCES (continued)
PAGE 21
Economist Intelligence Unit. (2012c, July 10). “Five year forecast table: Employment, wages, and prices.” ViewsWire France. The
Economist. Retrieved 2012, August 20 from [http://viewswire.eiu.com/index.asp?layout=oneclick&pubtype_id=1086275908&country_id=1350000135&rf=0].
Economist Intelligence Unit. (2012d, March 26). “Five year forecast table: Gross domestic product, at current market prices.” ViewsWire
Canada. The Economist. Retrieved on 2012, 17 April from: [http://viewswire.eiu.com/index.asp?
layout=oneclick&pubtype_id=1086275908&country_id=1490000149].
Economist Intelligence Unit. (2012e, July 10). “Five year forecast table: Gross domestic product, at current market prices.” ViewsWire
France. The Economist. Retrieved 2012, August 20 from [http://viewswire.eiu.com/index.asp?layout=oneclick&pubtype_id=1086275908&country_id=1350000135&rf=0].
Economist Intelligence Unit. (2012f, July 10). “Five year forecast table: Growth and productivity.” ViewsWire France. The Economist.
Retrieved 2012, August 20 from [http://viewswire.eiu.com/index.asp?layout=oneclick&pubtype_id=1086275908&country_id=1350000135&rf=0].
Economist Intelligence Unit. (2012g, March 26). “Five year forecast table: Growth and productivity.” ViewsWire Canada. The Economist. Retrieved on 2012, 17 April from: [http://viewswire.eiu.com/
index.asplayout=oneclick&pubtype_id=1086275908&country_id=1490000149].
Economist Intelligence Unit. (2012h, August 1). “Key Developments.” ViewsWire France. The Economist. Retrieved 2012, August 20 from [http://viewswire.eiu.com/index.asp?layout=oneclick&pubtype_id=1086275908&country_id=1350000135&rf=0].
Euromonitor International. (August 2011a). “Consumer Foodservice in France.” Passport. Retrieved 2012, February 15 from [http://
www.portal.euromonitor.com/portal/Default.aspx]. Euromonitor International. (May 2011). “Consumer Foodservice: Market Size.” Passport. Retrieved 2012, March 30 from [http://
www.portal.euromonitor.com/portal/Default.aspx]. Euromonitor International. (November 2010). “Consumer Lifestyles in France.” Passport. Retrieved 2012. February 15 from [http://
www.portal.euromonitor.com/portal/Default.aspx]. Euromonitor International. (March 2012a). “Consumer Lifestyles in France.” Retrieved 2012, April 23 from [http://
www.portal.euromonitor.com/portal/Default.aspx]. Euromonitor International. (January 2012a). “Countries and Consumers Annual Data.” Passport. Retrieved 2012, March 23 from [http://
www.portal.euromonitor.com/portal/Default.aspx]. Euromonitor International. (January 2012b). “France: Country Factfile.” Passport. Retrieved 2012, March 5 from [http://www.portal.euromonitor.com/portal/Default.aspx]. Euromonitor International. (February 2012a). “Fresh Food: Market Sizes.” Passport. Retrieved 2012, February 15 from [http://
www.portal.euromonitor.com/portal/Default.aspx]. Euromonitor International. (August 2011b). “Full-Service Restaurants in France.” Passport. Retrieved 2012, June 25 from [http://
www.portal.euromonitor.com/portal/Default.aspx]. Euromonitor International. (April 2011a). “Grocery Retailers in France.” Passport. Retrieved 2012, February 15 from [http://
www.portal.euromonitor.com/portal/Default.aspx]. Euromonitor International. (April 2012). “Grocery Retailers in France.” Passport. Retrieved 2012, April 20 from [http://
www.portal.euromonitor.com/portal/Default.aspx]. Euromonitor International. (September 2011a). “Health and Wellness in France.” Passport. Retrieved 2012, April 3 from [http://
www.portal.euromonitor.com/portal/Default.aspx]. Euromonitor International. (April 2011b). “Health and Wellness: Market Sizes.” Passport. Retrieved 2012, April 3 from [http://
www.portal.euromonitor.com/portal/Default.aspx]. Euromonitor International. (September 2011b). “Organic Packaged Food in France.” Passport. Retrieved 2012, April 3 from [http://
www.portal.euromonitor.com/portal/Default.aspx].
KEY RESOURCES (continued)
PAGE 22
Euromonitor International. (March 2012b). “Packaged Food in France.” Passport. Retrieved 2012. April 2 from [http://www.portal.euromonitor.com/portal/Default.aspx].
Euromonitor International. (July 2011). “Packaged Food: Market Sizes.” Passport. Retrieved 2012, April 2 from [http://
www.portal.euromonitor.com/portal/Default.aspx.] Euromonitor International. (April 2011c). “Retailing in France.” Passport. Retrieved 2012, March 5 from [http://
www.portal.euromonitor.com/portal/Default.aspx]. Euromonitor International. (November 2011). “Retailing: Market Size.” Passport. Retrieved 2012, March 29 from [http://
www.portal.euromonitor.com/portal/Default.aspx] Euromonitor International. (April 2011d). “Tourism Inbound in France.” Passport. Retrieved 2012, April 20 from [http://
www.portal.euromonitor.com/portal/Default.aspx]. Euromonitor International. (February 2012b). “Travel and Tourism: Market Sizes.” Passport. Retrieved 2012, April 20 from [http://
www.portal.euromonitor.com/portal/Default.aspx].
Eurostat. (2012). Statistics database. Retrieved on 2012, March 7 from [http://epp.eurostat.ec.europa.eu/portal/page/portal/statistics/
search_database]. Le Figaro. (2010, August 3). “Cuisine : les Français battus.” Retrieved 2012, March 30 from [http://www.lefigaro.fr/flash-
actu/2010/03/08/01011-20100308FILWWW00740-cuisine-les-francais-battus.php]. Global Trade Atlas (2012). Global Trade Information Services. Retrieved on 2012, March 19 from: [http://www.gtis.com/] . Institut national de la statistique des études économiques (INSEE). (2012). “Tableaux de l’Économie française-Edition 2012.”
Retrieved 2012, March 26 from [http://www.insee.fr/fr/publications-et-services/sommaire.asp?id=279®_id=0]. Kwintessential Ltd. (2010, March 29). “French Meal Etiquette.” Country Facts and Information. Retrieved on 2012, April 2 from: [http://
www.kwintessential.co.uk/articles/france/french-meal-etiquette/586]. Maccaud, Jérémy. (2010). “Le Quick halal, ‘c’est bon aussi, ça ne change rien.’” Retrieved 2012, April 20 from: [http://www.lexpress.fr/
actualite/societe/le-quick-halal-c-est-bon-aussi-ca-ne-change-rien_915884.html]. Mintel Group. (2012). Global New Products Database (GNPD). Pison, Gilles. (2011). “Deux enfants par femme dans la France de 2010 : la fécondité serait-elle insensible à la crise économique ?”
Population & Sociétés No.476. Retrieved 2012, March 7 from [http://www.ined.fr/fr/publications/pop_soc/bdd/publication/1536/]. Statistics Canada. (2012). CATSNET. Agriculture and Agri-Food Canada. Retrieved 2012, 5 March. UNESCO. (2010). “The gastronomic meal of the French”. Intangible Heritage Lists. Retrieved 2012, March 30 from [http://
www.unesco.org/culture/ich/en/RL/00437?lg=en&pg=00173#TOC1]. United States Department of Agriculture (USDA). (January 2011). “France Exporter Guide..” Foreign Agricultural Service. Global
Agricultural Information Network. Retrieved 2012, February 16 from [http://gain.fas.usda.gov/Recent%20GAIN%20Publications/Exporter%20Guide_Paris_France_1-25-2011.pdf].
United States Department of Agriculture (USDA). (October 2011). “France to tax soft drinks - U.S. Companies to pay the most.” Foreign
Agricultural Service. Global Agricultural Information Network. Retrieved 2012, February 16 from [http://gain.fas.usda.gov/Recent%20GAIN%20Publications/France%20to%20tax%20soft%20drinks.%20U.S.%20Companies%20to%20pay%20the%20most._Paris_France_10-26-2011.pdf].
World Halal Forum Europe. (2009). “Post Event Report.” Retrieved 2012, April 23 from: [http://www.worldhalalforum.org/download/
WHF09EuropeGenericReport.pdf].
The French Consumer
Behaviour, Attitudes and Perceptions toward Food Products
© Her Majesty the Queen in Right of Canada, represented by the Minister of Agriculture and Agri-Food Canada (2012). ISSN 1920-6593 AAFC No. 11647E Photo Credits All photographs reproduced in this publication are used by permission of the rights holders. All images, unless otherwise noted, are copyright Her Majesty the Queen in Right of Canada.
For additional copies of this publication or to request an alternate format, please contact: Agriculture and Agri-Food Canada 1341 Baseline Road, Tower 5, 4th floor Ottawa, ON Canada K1A 0C5 E-mail: [email protected]
Aussi disponible en français sous le titre : Le consommateur français Comportement, attitudes et perceptions à l’égard des produits
alimentaires
The Government of Canada has prepared this report based on primary and secondary sources of information. Although every effort has been made to ensure that the information is accurate, Agriculture and Agri-Food Canada assumes no liability for any actions taken based on the information contained herein.