the fund selector - t. rowe price...eie fund selector asset class report | user guide user guide...
TRANSCRIPT

The fund selector asset class report
October 2015
Sponsored by

WelcomeWelcome to this latest edition of the report, which I hope you find informative.
Looking back since the last survey in May, it’s certainly been an interesting time for investors. Concerns over Greece, China, US interest rates, emerging markets, inflation, commodities and global growth have all heightened uncertainty across the world’s stock markets. And it shows no signs of abating anytime soon.
There are no short cuts to navigate today’s challenging markets. It requires in-depth research, meaningful resources and good old-fashioned hard work. But while rising volatility can lead to apprehension among investors, it is often these periods that can offer exceptional long-term investment opportunities to those with courage and conviction.
Peter Preisler Head of Global Investment Services, Europe, Middle East & Africa T. Rowe Price
For further information on T. Rowe Price, please visit www.troweprice.com
T. Rowe Price takes no responsibility for the opinions and content herein, including but not limited to its accuracy, timeliness and/or completeness. Accordingly, T. Rowe Price will not be liable or responsible for any and all liabilities arising directly or indirectly from the use and/or reliance of this report.

EIE FUND SELECTOR ASSET CLASS REPORT | CONTENTS & WELCOME
ContentsUser guide and methodology 4
Fund selector sentiment: equities 5
Fund selector sentiment: bonds 6
Fund selector sentiment: macroeconomic sentiment 7
Fund selector sentiment: absolute return and hedge strategies 8
Fund selector sentiment: commodities, global equities and index trackers 9
EIE research: the unruly trinity of Europe, the US and absolute returns 10
EIE research: fund managers and selectors divided on Japan/US 11
In-depth: US equities 12
European fund flows data 14
EIE Fund Manager Predictions Database 16
Things have moved on significantly since the last edition of this report in May 2015, both in terms of what is going on in the market and the extra bits of information we are including in this report.
Let’s start with what’s new in this report. To begin with, we have added several new asset classes and investment types: unconstrained bond funds (on page 6), commodities, global equity funds and index-trackers (all on page 9).
Also, on the back of the strong positive response last issue, we have doubled the space given to our research team to report on any interesting trends they have found that are not obvious from the data: correlations between asset classes, patterns involving not only attitude towards investments but also fund flows and the opinions of fund managers. This all appears on pages 10 and 11.
When it comes to changes in attitudes among European fund buyers, the trends are strong: GEM and Asian equities plus both EM govvies and credit have all taken a hit this quarter. You might think that this is obvious – it comes on the back of the Asian market crash this summer. But that’s not the whole picture: our data show these trends started two or even three quarters ago.
The attitude of fund selectors to absolute return remains as positive as ever and the use of hedge – while it covers only around half of our respondents – is almost as strong as it was in May.
Thanks so much to all our readers who gave us feedback on the May edition of the report – it has driven many of the changes. We will keep trying to make it as relevant and insightful as we can.
If you have any more thoughts about sections you’d like to see or any other changes you’d like us to make, please email [email protected].
Regards,
Dylan Emery Editor, Expert Investor Europe
Highlights
SPONSORED BY T. ROWE PRICE | 3
EIE FUND SELECTOR ASSET CLASS REPORT | USER GUIDE
User guide & methodology
0
20
40
60
80
100
Q1 ’15Q1 ’14Q1 ’13Q1 ’12
%
Increase Hold Decrease Not use
-6
-4
-2
0
2
4
6
8
Jan '15OctJulAprJan '14
European equity US equity Japan equity
Bullish Neutral Bearish
-75
-100
-50
-25
0
25
50
75
100
Mar ’15SepMar ’14SepMar ’13SepMar ’12
%
Hedge:long/short equities
Hedge:long/short debt
Hedge:global macro
Hedge:multi-strategy
0 20 40 60 80 100
Increase Hold Decrease Not use
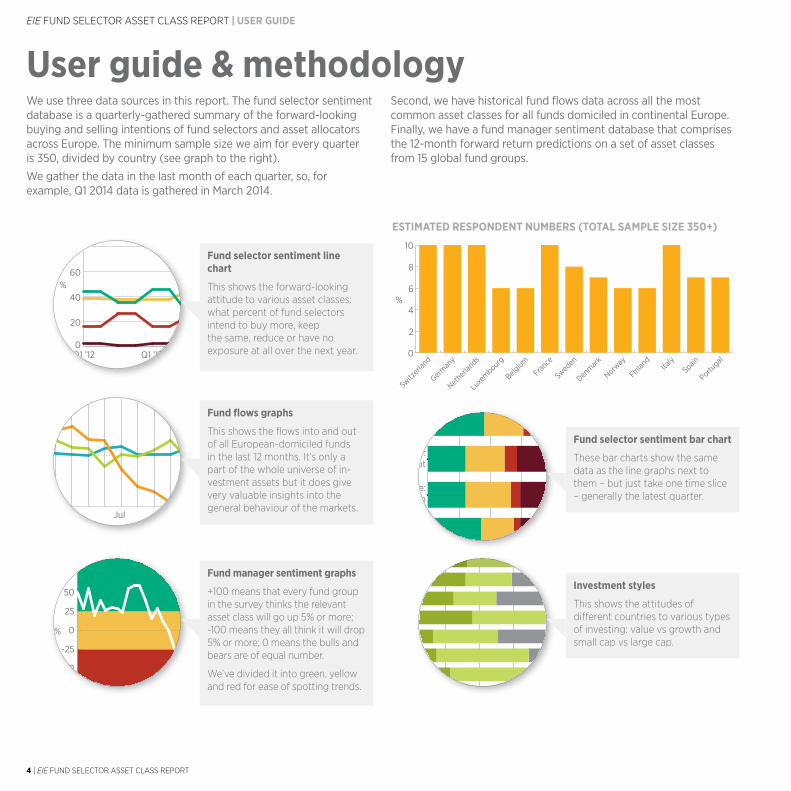
Fund selector sentiment bar chart
These bar charts show the same data as the line graphs next to them – but just take one time slice – generally the latest quarter.
Fund selector sentiment line chart
This shows the forward-looking attitude to various asset classes: what percent of fund selectors intend to buy more, keep the same, reduce or have no exposure at all over the next year.
Fund flows graphs
This shows the flows into and out of all European-domiciled funds in the last 12 months. It’s only a part of the whole universe of in-vestment assets but it does give very valuable insights into the general behaviour of the markets.
Fund manager sentiment graphs
+100 means that every fund group in the survey thinks the relevant asset class will go up 5% or more; -100 means they all think it will drop 5% or more; 0 means the bulls and bears are of equal number.
We’ve divided it into green, yellow and red for ease of spotting trends.
We use three data sources in this report. The fund selector sentiment database is a quarterly-gathered summary of the forward-looking buying and selling intentions of fund selectors and asset allocators across Europe. The minimum sample size we aim for every quarter is 350, divided by country (see graph to the right).
We gather the data in the last month of each quarter, so, for example, Q1 2014 data is gathered in March 2014.
Second, we have historical fund flows data across all the most common asset classes for all funds domiciled in continental Europe. Finally, we have a fund manager sentiment database that comprises the 12-month forward return predictions on a set of asset classes from 15 global fund groups.
Growth Value No pref
0 20 40 60 80 100
Portugal
Spain
Italy
Finland
Norway
Denmark
Sweden
France
Belgium
Luxembourg
Netherlands
Germany
Switzerland
European avg
Investment styles
This shows the attitudes of different countries to various types of investing: value vs growth and small cap vs large cap.
0
2
4
6
8
10
Portugal
SpainIta
ly
Finlan
d
Norway
Denmar
k
Swed
en
Fran
ce
Belgium
Luxe
mbourg
Nethe
rland
s
German
y
Switz
erlan
d
%
ESTIMATED RESPONDENT NUMBERS (TOTAL SAMPLE SIZE 350+)
4 | EIE FUND SELECTOR ASSET CLASS REPORT
US EQUITIES
0
20
40
60
80
100
Q1 ’15Q1 ’14Q1 ’13Q1 ’12
%
Increase Hold Decrease Not use
0
20
40
60
80
100
Q1 ’15Q1 ’14Q1 ’13Q1 ’12
%
Increase Hold Decrease Not use
EUROPEAN EQUITIES
GEM EQUITIES
0
20
40
60
80
100
Q1 ’15Q1 ’14Q1 ’13Q1 ’12
%
Increase Hold Decrease Not use
0
20
40
60
80
100
Q1 ’15Q1 ’14Q1 ’13Q1 ’12
%
Increase Hold Decrease Not use
JAPANESE EQUITIES
FRONTIER MARKET EQUITIES
0
20
40
60
80
100
Q1 ’15Q1 ’14Q1 ’13Q1 ’12
%
Increase Hold Decrease Not use
0
20
40
60
80
100
Q1 ’15Q1 ’14Q1 ’13Q1 ’12
%
Increase Hold Decrease Not use
ASIA EX-JAPAN EQUITIES
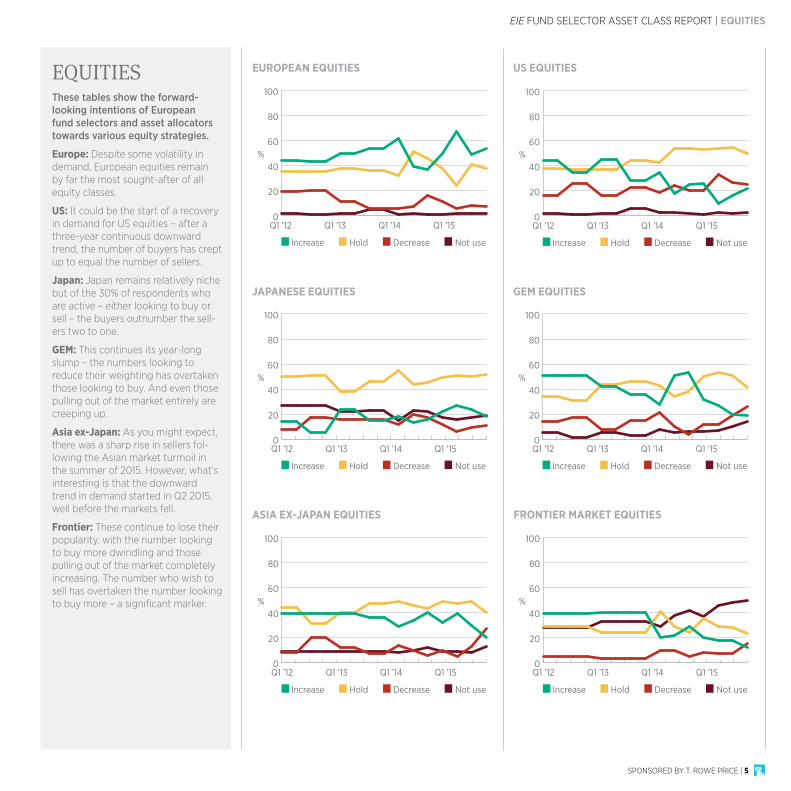
EQUITIESThese tables show the forward-looking intentions of European fund selectors and asset allocators towards various equity strategies.
Europe: Despite some volatility in demand, European equities remain by far the most sought-after of all equity classes.
US: It could be the start of a recovery in demand for US equities – after a three-year continuous downward trend, the number of buyers has crept up to equal the number of sellers.
Japan: Japan remains relatively niche but of the 30% of respondents who are active – either looking to buy or sell – the buyers outnumber the sell-ers two to one.
GEM: This continues its year-long slump – the numbers looking to reduce their weighting has overtaken those looking to buy. And even those pulling out of the market entirely are creeping up.
Asia ex-Japan: As you might expect, there was a sharp rise in sellers fol-lowing the Asian market turmoil in the summer of 2015. However, what’s interesting is that the downward trend in demand started in Q2 2015, well before the markets fell.
Frontier: These continue to lose their popularity, with the number looking to buy more dwindling and those pulling out of the market completely increasing. The number who wish to sell has overtaken the number looking to buy more – a significant marker.
EIE FUND SELECTOR ASSET CLASS REPORT | EQUITIES
SPONSORED BY T. ROWE PRICE | 5

EIE FUND SELECTOR ASSET CLASS REPORT | BOND SENTIMENT
DEVELOPED MARKET CORPORATE BONDS
0
20
40
60
80
100
Q1 ’15Q1 ’14Q1 ’13Q1 ’12
%
Increase Hold Decrease Not use
0
20
40
60
80
100
Q1 ’15Q1 ’14Q1 ’13Q1 ’12
%
Increase Hold Decrease Not use
DEVELOPED MARKET GOVERNMENT BONDS EM GOVERNMENT BONDS
0
20
40
60
80
100
Q1 ’15Q1 ’14Q1 ’13Q1 ’12
%
Increase Hold Decrease Not use
0
20
40
60
80
100
Q1 ’15Q1 ’14Q1 ’13Q1 ’12
%
Increase Hold Decrease Not use
0
Q3 ’15
20 40 60 80 100
Increase Hold Decrease Not use
DEVELOPED MARKET HIGH-YIELD BONDS UNCONSTRAINED BOND FUNDS
0
20
40
60
80
100
Q1 ’15Q1 ’14Q1 ’13Q1 ’12
%
Increase Hold Decrease Not use
EM CORPORATE BONDS
BONDSThese tables show the forward-looking allocation intentions of European funds selectors and asset allocators towards various bond strategies.
Developed mkt gov bonds: These re-main the most disliked of all the asset classes. However, in the last quarter, there was a notable shift downward in the number of sellers – perhaps the start of stabilisation?
Developed mkt corporate bonds: Very similar to government bonds (but never disliked to the same extent), you can see the same sharp reduction in the number of sellers in the last quarter.
Developed mkt high-yield bonds: Having slumped in popularity since the start of Q1 2013, high yield still maintains a small fanbase and with sellers down, it doesn’t look too bad.
EM government and corporates bonds: The attitudes to both these fixed income strategies is more or less the same – in the last quarter, the number of sellers accelerated sharply.
Unconstrained bond funds: This is a new category for the report and as you can see, these products are popular – they are used by 60% of our readers, of whom almost half are looking to buy more over the next year.
6 | EIE FUND SELECTOR ASSET CLASS REPORT

COUNTRY BREAKDOWN
0
20
40
60
80
100
Q1 ’15Q1 ’14Q1 ’13Q1 ’12
%
Positive Neutral Negative
0 20 40 60 80 100
Portugal
Spain
Italy
Finland
Norway
Denmark
Sweden
France
Luxembourg
Belgium
Netherlands
Germany
Switzerland
European avg
Increase Hold Decrease Not use
MACRO SENTIMENT
EIE FUND SELECTOR ASSET CLASS REPORT | MACRO AND ABSOLUTE RETURN
MACROECONOMIC SENTIMENTThis shows the attitude of fund selectors towards the macro outlook.
n The general optimism in the face of macro troubles has been one of the defining features of fund selectors since mid-2013.
n While the total number of optimists shrank this quarter, they are drawn to neutrality, not pessimism.
n Denmark, Switzerland and Norway stand out as being particularly enthusiastic about the future.
n Sweden, Germany and Finland, on the other hand, are much more cautious in their outlook.
SPONSORED BY T. ROWE PRICE | 7

EIE FUND SELECTOR ASSET CLASS REPORT | ABSOLUTE RETURN AND HEDGE STRATEGIES
HEDGE STRATEGIES: LONG/SHORT EQUITIES
0
20
40
60
80
100
Q1 ’15Q1 ’14Q1 ’13Q1 ’12
%
Increase Hold Decrease Not use
Increase Hold Decrease Not use
0 20 40 60 80 100
Q3 ’15
Q2 ’15
ABSOLUTE RETURN
Increase Hold Decrease Not use
0 20 40 60 80 100
Q3 ’15
Q2 ’15
HEDGE STRATEGIES: LONG/SHORT BONDS
Increase Hold Decrease Not use
0 20 40 60 80 100
Q3 ’15
Q2 ’15
HEDGE STRATEGIES: GLOBAL MACRO
ABSOLUTE RETURN
HEDGE STRATEGIES
These tables show the forward-looking allocation intentions of European fund selectors towards absolute return strategies.
n Absolute returns maintain their consistent popularity with more than 40% of respondents looking to increase their weighting.
n The one thing to note is a slight increase in the numbers not using the asset class – whether that is a glitch or a trend, we will know in the next report.
These tables show the forward-looking allocation intentions of European fund selectors towards the four most popular hedge strategies.
n As you can see, there has been a very slight overall drop in usage of hedge products this quarter since last – but nothing significant.
n The amount of green versus red makes it clear that the number of buyers overwhelm the sellers in this market.
n Long/short equity and multi-strate-gy remain by far the most popular.
8 | EIE FUND SELECTOR ASSET CLASS REPORT
HEDGE STRATEGIES: MULTI-STRATEGY
Increase Hold Decrease Not use
0 20 40 60 80 100
Q3 ’15
Q2 ’15

EIE FUND SELECTOR ASSET CLASS REPORT | OTHER STRATEGIES
SPONSORED BY T. ROWE PRICE | 9
OTHER STRATEGIESThese tables show the forward-looking allocation intentions of European fund selectors towards commodities, index-tracking prod-ucts and global equity funds.
Commodities: Just over half of our respondents have direct exposure to equities – around the same level as those who buy hedge strategies. Of those who have exposure, there are marginally more looking to increase than decrease their weight-ing, but there is no consensus.
Index-tracking products: These are very popular – and around a quarter of all respondents are expecting to use more over the next year. However, it is interesting to note that despite the general macro optimism, 15% of respondents expect to lower their usage of index-trackers so the traffic is certainly not one way.
Global equity funds: These are very widely used – more than 70% have exposure and that may go up, if the fact that there are more buyers than sellers is anything to go by.
INDEX-TRACKING PRODUCTS
Increase Hold Decrease Not use
0 20 40 60 80 100
Q3 ’15
Increase Hold Decrease Not use
0 20 40 60 80 100
Q3 ’15
Q2 ’15
Q1 ’15
COMMODITIES
Increase Hold Decrease Not use
0 20 40 60 80 100
Q3 ’15
GLOBAL EQUITY FUNDS

EIE FUND SELECTOR ASSET CLASS REPORT | EIE RESEARCH ANALYSIS
European equity net US equity net Absolute return net
%
-25
0
25
50
75
Q3 ’15Q2 ’15Q1 ’15Q4 ’14Q3 ’14Q2 ’14Q1 ’14
FUND SELECTOR SENTIMENT SINCE JAN 2014
-8
-6
-4
-2
0
2
4
6
8
10
JulAprJan ’15OctJulAprJan ’14
European equity US equity Absolute return
FUND FLOWS SINCE JAN 2014 (€bn)
10 | EIE FUND SELECTOR ASSET CLASS REPORT
The unruly trinity of Europe, the US and absolute returnThis is a piece of ad-hoc research from our Market Intelligence team.
n For the last seven quarters we have spotted an unusual relationship between US equities, European eq-uities and absolute return products.
n Over that time period, attitudes to European equities have been strongly correlated to absolute return products, while US equities have been strongly negatively correlated to both.
n This is also reflected in fund flows – in other words, when people sell out of US they buy Europe and absolute return.
n This trend became stronger over time, with almost perfect correla-tions (ranging from 0.85 to 0.99) for the year up to Q2 2015.
n It has only changed in the last data point, when we’ve seen both asset flow and attitude improvement in all three strategies.
Do you recognise this behaviour in your own portfolio construction? Has a negative outlook on US equi-ties tended to push you to alterna-tives or European equities? If so, why? Please write to [email protected] to let us know and we will investigate further.

US equity net Japan equity net
%
-25
-20
-15
-10
-5
0
5
10
15
20
25
JulAprJan ’15OctJulAprJan ’14
%
-60
-40
-20
0
20
40
60
80
100
JulAprJan ’15OctJulAprJan ’14
US equity Japan equity
US EQUITY VS JAPAN EQUITY: FUND MANAGER PREDICTIONS
EIE FUND SELECTOR ASSET CLASS REPORT | EIE RESEARCH ANALYSIS
Fund managers, selectors divided on Japan/USThis is another piece of research from our Market Intelligence team.
n More often than not, fund managers and fund selectors tend to agree on where they think the markets are heading. Not so, however, when it comes to the US and Japan.
n Prior to 2015 fund selectors had roughly the same views on the US and Japanese equity markets. Then in 2015 it diverged.
n As you can see from the top graph, the net % of fund selectors looking to buy more Japanese equities rose then fell, while attitudes to US equi-ties fell then rose – close to perfect negative correlation.
n The views of fund managers, on the other hand, have been very differ-ent. They have been consistently positive on Japan, while the predic-tion on US equity performance climbed slowly until the start of 2015 and has since collapsed.
n So at exactly the time that fund se-lector outlook on the US is improv-ing, the fund managers have rarely been so negative on the market.
n The difference in attitude to Japan could be explained by portfolio construction issues – when a fund selector moves assets out of the US, it has to go somewhere – on average, all the other asset classes will do better.
n But there is still a direct disagree-ment in the direction of US equities – next issue we will get an indication of who is right.
SPONSORED BY T. ROWE PRICE | 11
US EQUITY VS JAPAN EQUITY: FUND SELECTOR SENTIMENT

EIE FUND SELECTOR ASSET CLASS REPORT | IN DEPTH
IN DEPTH: US EQUITIES INVESTMENT SENTIMENTHere we take an in-depth look at just one asset class. This issue, we are examining the attitudes towards US equities, not only showing the pan-European attitudes, but also the country breakdown.
n US equities have been through a real roller-coaster since the crash of 2009. Three years ago they were still much more bought than sold – and remained that way up until the start of 2013.
n In Q2 2013, we got the first warning of a downturn in senti-ment. There was a big drop in those looking to buy more and a slight increase in sellers. It con-tinued going downhill, hitting the bottom at the start of 2015.
n Since then we have had two quarters of rising sentiment and the number of those looking to increase their weighting almost matches those wanting to sell off.
n You can see from the bar chart at the bottom that there is substantial variability depending on country. Belgian investors are very optimis-tic, while investors in Luxembourg are divided – with a lot of buyers and also a lot of sellers.
n Finland and Italy, meanwhile, are the bottom of the table – with a significant % of net sellers.
INDIVIDUAL COUNTRY SENTIMENT Q3 ’15
Increase Hold Decrease Not use
%
Switzerl
and
European avg
Norway
Finland
Denmark
Netherl
ands
Luxe
mbourg
France
Portugal
German
yIta
ly
Sweden
Spain
Belgium
0
20
40
60
80
100
Increase Same Decrease Not use
%
0
20
40
60
80
100
Q1 ’15Q1 ’14Q1 ’13Q1 ’12
US EQUITIES
12 | EIE FUND SELECTOR ASSET CLASS REPORT

IN DEPTH: US EQUITIES STYLE PREFERENCESWe look at how the style prefer-ences differ from country to country, both in terms of large vs small cap and growth vs value strategies.
n Overall as a continent, there is very little aggregate preference for large cap over small or the reverse. On a country basis, however, the differ-ences are huge.
n Sweden and Belgium are very keen on small-cap US strategies, while Italy and the Netherlands were 100% large cap.
n Growth versus value is the same as large vs small – as a continent, the number of those preferring growth is almost the same as those preferring value (and also almost matched by the number who have no preference).
n But on a country basis, the prefer-ences come out: The Netherlands and Norway stand out for having many more people who prefer value investing in US equities than growth.
n There are only a couple of countries with strong growth preferences overall: Sweden and Finland. The latter is interesting because only about half of the respondents had any preference at all, but of those who did, it was 100% growth.
GROWTH VS VALUE
LARGE CAP VS SMALL CAP
EIE FUND SELECTOR ASSET CLASS REPORT | IN DEPTH
%
Switzerl
and
European avg
Norway
Finland
Denmark
Netherl
ands
Luxe
mbourg
France
Portugal
German
yIta
ly
Sweden
Spain
Belgium
0
20
40
60
80
100
Small capLarge cap No pref
%
Growth Value No pref
Switzerl
and
European avg
Norway
Finland
Denmark
Netherl
ands
Luxe
mbourg
France
Portugal
German
yIta
ly
Sweden
Spain
Belgium
0
20
40
60
80
100
SPONSORED BY T. ROWE PRICE | 13

EIE FUND SELECTOR ASSET CLASS REPORT | FUND FLOWS: EQUITIES
EUROPEAN FUND FLOWS DATAThese graphs show the assets flowing into and out of European-domiciled equity funds over the past year.
n Note carefully the Y-axis scales for the graphs in this section. To allow us to pick up more detail, they are different – so while both Europe and Japan equities have seen substantial inflows, Europe’s were more than six times larger.
n The winner in the past six months has been Europe, with billions flowing into the asset class.
n While much smaller, Japan has nonetheless been a very consistent performer.
n These graphs show clearly what our sentiment has been showing for Q1/Q2 – that GEM and Asian equities have been losing assets quickly.
n Frontier is showing slight but consistent outflows.
US EQUITIES (€bn)
-8
-6
-4
-2
0
2
4
JulAprJan ’15OctJul ’14-6-4
-2
0
2
4
6
8
10
JulAprJan ’15OctJul ’14
EUROPEAN EQUITIES (€bn)
GEM EQUITIES (€bn)
-8-6
-4
-2
0
2
4
6
JulAprJan ’15OctJul ’14-1.5
-1
-0.5
0
0.5
1
1.5
2
JulAprJan ’15OctJul ’14
JAPANESE EQUITIES (€bn)
-0.4-0.3
-0.2
-0.1
0
0.1
0.2
0.3
0.4
JulAprJan ’15OctJul ’14-5-4-3-2-101234
JulAprJan ’15OctJul ’14
ASIAN EQUITIES (€bn) FRONTIER MARKET EQUITIES (€bn)
in association with
14 | EIE FUND SELECTOR ASSET CLASS REPORT

EIE FUND SELECTOR ASSET CLASS REPORT | FUND FLOWS: BONDS
EUROPEAN FUND FLOWS DATAThese graphs show the assets flowing into and out of European-domiciled bond and alternative funds over the past year.
n Matching our sentiment changes, EM bonds have been selling off in recent months, especially government bonds.
n Meanwhile, developed market bonds, after a strong sell-off in June, have come back to neutral.
n General absolute return products have maintained their very strong fund flows, with billions of euros coming in every month.
n Matching our sentiment data, the only hedge strategies that are taking significant assets are multi-strategy and, to a lesser extent, long/short equity.
EMERGING MARKET BONDS (€bn)
-2.5-2
-1.5-1
-0.50
0.51
1.52
JulAprJan ’15OctJul ’14
EM corporate bonds EM government bonds
-8
-6
-4
-2
0
2
4
6
JulAprJan ’15OctJul ’14
Dev mkt corp bd Dev mkt gov bd High-yield bd
DEVELOPED MARKET BONDS (€bn)
-4-2
0
2
4
6
8
10
JulAprJan ’15OctJul ’14Absolute return Alt long/short eqAlt long/short bd Alt multi-strategy
Alt glbl macro
ALTERNATIVE STRATEGIES (€bn)
in association with
SPONSORED BY T. ROWE PRICE | 15
EIE FUND SELECTOR ASSET CLASS REPORT | FUND MANAGER PREDICTIONS
US EQUITIES
-75
-50
-25
0
25
50
75
100
AugFeb ’15AugFeb ’14AugFeb ’13Aug ’12
Bullish Neutral Bearish
%
-75
-50
-25
0
25
50
75
100
AugFeb ’15AugFeb ’14AugFeb ’13Aug ’12
Bullish Neutral Bearish
%
EUROPE EX UK EQUITIES
JAPAN EQUITIES
Bullish Neutral Bearish
-75
-50
-25
0
25
50
75
100
AugFeb ’15AugFeb ’14AugFeb ’13Aug ’12
%
Bullish Neutral Bearish
-75
-50
-25
0
25
50
75
100
AugFeb ’15AugFeb ’14AugFeb ’13Aug ’12
%
ASIAN EQUITIES
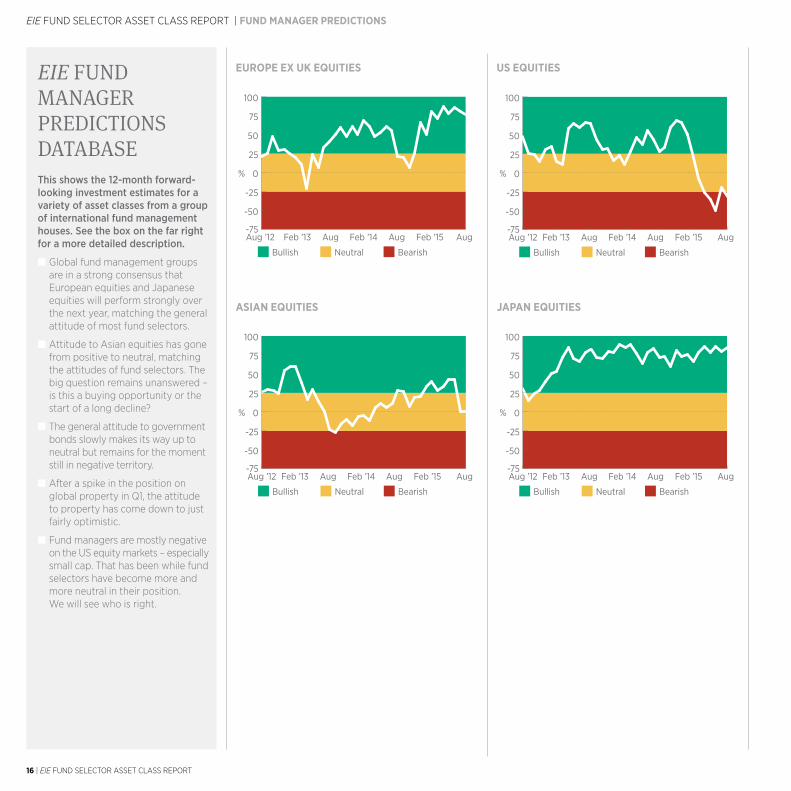
EIE FUND MANAGER PREDICTIONS DATABASEThis shows the 12-month forward-looking investment estimates for a variety of asset classes from a group of international fund management houses. See the box on the far right for a more detailed description.
n Global fund management groups are in a strong consensus that European equities and Japanese equities will perform strongly over the next year, matching the general attitude of most fund selectors.
n Attitude to Asian equities has gone from positive to neutral, matching the attitudes of fund selectors. The big question remains unanswered – is this a buying opportunity or the start of a long decline?
n The general attitude to government bonds slowly makes its way up to neutral but remains for the moment still in negative territory.
n After a spike in the position on global property in Q1, the attitude to property has come down to just fairly optimistic.
n Fund managers are mostly negative on the US equity markets – especially small cap. That has been while fund selectors have become more and more neutral in their position. We will see who is right.
16 | EIE FUND SELECTOR ASSET CLASS REPORT

GLOBAL GOVERNMENT BONDS
Bullish Neutral Bearish
-75
-50
-25
0
25
50
75
100
AugFeb ’15AugFeb ’14AugFeb ’13Aug ’12
%
Bullish Neutral Bearish
%
-75
-50
-25
0
25
50
75
100
AugFeb ’15AugFeb ’14AugFeb ’13Aug ’12
%
US SMALLER COMPANIES EQUITIES
-75
-50
-25
0
25
50
75
100
Bullish Neutral Bearish
%
AugFeb ’15AugFeb ’14AugFeb ’13Aug ’12
GLOBAL PROPERTY
EIE FUND SELECTOR ASSET CLASS REPORT | FUND MANAGER PREDICTIONS
Fund Manager Predictions data gathered by
This is how the Fund Manager Predictions Database numbers are calculated:
The data for these graphs are collected on a monthly basis from around 15 global fund groups. We’ve been gather-ing the data for more than 10 years, although we only show three years of data here.
Every respondent gives the house view on a series of indices, answering the question: do you think that in 12 months’ time this index will have gone up 5% or more; gone down 5% or more; or will be between -5% and +5% from where it is now.
We have taken that data and turned it into a sentiment number: -100 means every respondent is bearish; +100 means everyone is bullish; 0 means the bulls and the bears are evenly matched.
Anything from 25 or more we have designated bullish (green) on the graphs; anything from -25 or below bearish (red).
SPONSORED BY T. ROWE PRICE | 17

EIE FUND SELECTOR ASSET CLASS REPORT | MEET THE TEAM
Meet the team
DirectorAllan Goodridge+44 (0)20 7065 [email protected]
Business development manager, Southern EuropeRichard Parkins+44 (0)20 7065 [email protected]
Head of salesAndrew Davies+44 (0)20 7382 [email protected]
Researcher – FinlandMiia [email protected]
Researcher – Francophone EuropeAshley Castellini +44 (0)20 7065 [email protected]
Quantitative researcherAbtin Pourgive+44 (0)20 7382 [email protected]
Business development manager, Nordics Cecilia Johansson +44 (0)20 7382 [email protected]
Group editorial directorDylan Emery +44 (0)20 7065 [email protected]
Researcher – German-speaking EuropeNicolas Deschamps +44 (0)20 7065 [email protected]
Business development manager, EuropeThomas Whittingham +44 (0)20 382 [email protected]
Senior reporterTjibbe Hoekstra+44 (0)20 7382 [email protected]
Researcher – IberiaMatias Papariello +44 (0)20 7065 [email protected]
Head of market intelligenceSimon Andersson +44 (0)20 7382 [email protected]
Researcher – NordicsMadinda Wilhelmsson +44 (0)20 7382 [email protected]
18 | EIE FUND SELECTOR ASSET CLASS REPORT
ResearcherFrançois Haines+44 (0)20 7382 [email protected]
Business development managerJames Shepherd+44 (0)20 7065 [email protected]

About our sponsor
Founded in
1937
Local presence in
15countries3
Pure Asset ManagementOur sole business is managing our clients’ investments
WE’RE AGLOBAL ASSETMANAGER –FOCUSED ONCLIENT SUCCESS
Alignment of InterestsWe are a publicly owned company with substantial employee ownership€693.8
billion in assets under management1
468investment professionals
worldwide2
Financial StrengthWe carry no outstanding long-term debt and maintain substantial cash reserves
Global ExpertiseWe continually grow our investment team and capabilities globally
Over
5,900associates worldwide4
Stable Leadership TeamOur Management Committee averages 30 years with T. Rowe Price
If our client succeeds, our firm will succeed.
Founder:Thomas Rowe Price, Jr.(1898–1983)
1The combined asset under management of the T. Rowe Price Group of companies in EUR as of 30 June 2015. The T. Rowe Price Group of companies includes T. Rowe Price Associates, Inc., T. Rowe Price International Ltd, T. Rowe Price Hong Kong Limited, T. Rowe Price Singapore Private Ltd., T. Rowe Price (Canada), Inc.2As of 30 June 2015.3As of 30 June 2015. 4As of 30 June 2015.
T. ROWE PRICE, INVEST WITH CONFIDENCE and the Bighorn Sheep design are, collectively and/or apart, trademarks or registered trademarks of T. Rowe Price Group, Inc. in the United States, European Union, and other countries. This material is intended for use only in select countries.
