the future mobility survey: overview and preliminary...
TRANSCRIPT
The Future Mobility Survey: Overview and Preliminary Evaluation
Francisco PEREIRAa, Carlos CARRIONb, Fang ZHAOc, Caitlin D. COTTRILLd, Chris ZEGRASe, Moshe BEN-AKIVAf
a,b,c,d Future Urban Mobility IRG, Singapore-MIT Alliance for Research and Technology, Singapore
a E-mail: [email protected] b E-mail: [email protected] c E-mail: [email protected] d E-mail: [email protected] e Department of Urban Studies and Planning, Massachusetts Institute of
Technology, Cambridge, MA, USA; E-mail: [email protected] f Intelligent Transportation Systems Lab, Massachusetts Institute of Technology, Cambridge, MA, USA; E-mail: [email protected]
Abstract: Technological advances, such as GPS devices and smartphones, have had numerous impacts in the realm of travel surveys. These advances bring both challenges and opportunities as we work to balance the potential to collect nearly unlimited amounts of data with the need to not overburden transport survey participants. This paper addresses the steps currently taken to manage this balance in the context of the Future Mobility Survey (FMS), a smartphone based travel survey being developed in the Singaporean context, and presents a preliminary evaluation by comparison with a traditional survey which is being made simultaneously.
Keywords: Transport Surveys, Prompted-Recall, Ubiquitous Computing, Interface Design
1. INTRODUCTION
The rise in the availability of location-enabled devices has greatly expanded transportation data collection options. While traditional self-reported travel surveys typically suffer from problems such as limited sample size, underreporting of total completed trips, imprecision of trip start/end times etc. (Chen, 2010), location-enabled based surveys can lead to detailed and precise data needed for emerging agent- and activity-based behavioral models. Developments in this field (e.g., Auld et al., 2009; Bricka et al., 2006) suggest that location-enabled technologies can reduce the number of erroneous “no travel” days and missed trips; improve accuracy of reported trip times, locations and paths; and reduce respondent burden.
While smartphone-based travel surveys are in their infancy, GPS-based surveys have been widely implemented worldwide and largely successful as a supplement to household travel surveys (Stopher et al., 2007; Battelle et al., 1997; Bohte and Maat, 2009). However, GPS suffers from some limitations. Financially, the agencies conducting travel surveys must purchase and distributed GPS collection devices, which can be a significant investment. Also, the participants may forget to carry the GPS loggers with them for the duration of the travel survey, and they will face a recollection problem when completing their travel diary. The smartphones provide a clear benefit, with users accustomed to carrying their phones with them constantly, decreasing the likelihood of missing trips. They are almost always charged, and there are more sensors in a smartphone, e.g., GSM, Wi-Fi, and accelerometer, which can be used to provide activity and mode information. These attributes make smartphones ideal
Proceedings of the Eastern Asia Society for Transportation Studies, Vol.9, 2013

“life-loggers”. In this paper, we present the Future Mobility Survey (FMS), which is a smartphone based prompted-recall travel survey system currently being developed and tested in Singapore, and discuss our efforts to balance between the potential to collect nearly unlimited amounts of data with the need to not overburden transport survey participants.
The FMS survey uses a combination of a downloadable smartphone app (in iOS and Android), an intelligent data analysis backend and a web-interface to provide prompted recall interaction with respondents. Data collected from the smartphone application are uploaded to a central server, mapped, automatically cleaned and analysed and made accessible to the participant from the project website, where he or she is asked to provide detailed travel information a posteriori. The time when this interaction happens is fully dependent on user’s choice, thus the need to provide clear "prompted-recall" visual and textual cues to remind him of the details of those past activities and travel.
FMS is currently being field tested as a collaborative project between the Singapore-MIT Alliance for Research and Technology (SMART) and the Land Transport Authority of Singapore (LTA). With the help from LTA and MediaCorp, a recruited sample of nearly 1000 respondents, who also filled the Household Interview Travel Survey 2012/13 (Singapore), are being invited to run FMS. HITS follows the more traditional approach of “paper and pencil” questionnaire type. One key goal is to study the relationship between HITS and FMS, comparing the results from both sides, understanding the pros and cons of each approach and building on these conclusions for the future mobility surveys.
This paper addresses the overview of FMS technology, and elaborates on a preliminary comparative analysis with HITS. 2. METHODOLOGY The FMS survey (Cottril et al., forthcoming) uses a combination of a downloadable smartphone app, available for Android and iOS, and an online prompted recall survey to collect both demographic and travel data from participants (Figure 1). Data collected from the smartphone application are uploaded to a central server, mapped, automatically cleaned and analysed and made accessible to the participant from the project website, where he or she is asked to provide detailed travel information via a prompted-recall survey.
Figure 1: Survey architecture
In developing this system, we have worked to balance participant burden and data
accuracy. Achieving this balance has entailed a three-part strategy: first, we have carefully
Proceedings of the Eastern Asia Society for Transportation Studies, Vol.9, 2013
developed the app for ease of use, non-intrusiveness and low power consumption; next, we implemented data analysis techniques that aim to prepare the web interface in such a way that the user needs minimal interaction; finally, we designed the web interface to become as much intuitive and visually pleasant as possible in order to engage the user in the validation of the traces. Developing, implementing and testing this strategy provide considerable advancement in the use of ICT to support and enhance activity and travel data collection. 2.1. Smartphone Application Design The key role of the smartphone devices in our project is to act as data loggers. In fact, the overall FMS platform is being implemented to allow other types of devices to upload data to the server, such as dedicated GPS loggers or older phones. Thus, our app is deliberately “silent” in the sense that nothing at all is expected from the user besides making sure it is running. However, since the Apple App Store requires availability of some minimal visible functionality, we included simple stats such as total amount of data collected and a map-based visualization of recent traces. For coherency, we assumed the same exact design for the Android version. In any case, the interface is designed to minimally influence travel behaviour and to avoid distracting the user with any needed interaction. In Figure 2, we provide a few snapshots of the current interface.
Figure 2. Smartphone app interface
A crucial challenge of this kind of technology is battery consumption, mainly due to the
use of the GPS sensor. Effectively, this can become the major source of burden for participants while recording their trips and activities. On the other hand, since it is only available outdoors, the typical amount of GPS data collected during the day for a normal user is relatively small compared to the 24 hours of a day. As a result, a logger with fixed frequency GPS sampling will keep failing systematically to “get the first fix” (GTFF), which is itself a very battery consuming process. Another limitation of fixed frequency is that the GTFF process needs some time to converge to a position estimate, and this period depends on many factors, such as number of visible satellites and their geometry, almanac correctness, ambient noise or sensor quality. So, if not enough time is given for each GTFF attempt, the logger will keep failing and the data will be poor while still draining the battery.
We apply two techniques to minimize this problem, namely using the accelerometer for detecting “still”, or no-movement, stages (thus, GPS will not be needed) and what we call “phased sampling”. The concept is the following: we collect intensive GPS data (1Hz) for a continuous period of time and then deliberately sleep the remaining time. In this way, the number of GTFF processes will be much smaller than fixed sampling and we also give enough time for location estimation. After a period of fine-tuning, current configurations used
Proceedings of the Eastern Asia Society for Transportation Studies, Vol.9, 2013

are 3 minutes for collecting, 2 minutes for sleeping. 2.2. Data Analysis The data analysis component serves to transform the logged raw data into understandable information for the user. It is particularly focused on inferring stops, modes and activities. Figure 3 shows the general process followed.
Figure 3. Data analysis process
The algorithms used in each step vary. The “process raw data” step consists of a series
of scripts for cleaning, composing and temporally aligning the incoming data for use in the subsequent analysis steps. The “stop inference” applies a rule-based algorithm in two phases: first, it matches spatial/temporal windows (Hariharan and Toyama, 2004) to the data to obtain candidate stops; then, it uses wifi and GSM data to merge stops, particularly using accelerometer information to detect “still” periods (where, although the GSM is “jumping”, the user should stay in the same place). It also uses past validation information to match user’s recurrent places (e.g., home, work) with GSM signatures and adds/removes stops based on mode detection results (e.g. there must be a stop for change mode/transfer between any two different modes).
The “mode inference” step applies a machine-learning algorithm, support-vector machine or SVM (Cortes and Vapnik, 1995), to accelerometer and GPS data to identify the mode out of the set of car, bus, subway, walk, bicycle or motorbike. Finally, the “activity inference” matches the historical data, namely the previous validations, to current stops to identify recurrent locations. Current development of this module also considers contextual information such as the Points of Interest or the mode interchange areas.
The goal of the “learning from user validations” step, under development, is to systematically update these algorithms in time, i.e. perform online learning. 2.3. Web Interface Design The third component of our system is the web interface. In this case, the major challenge lies on the side of the user interaction design. First of all, the notion of activity diary is somewhat strange to the layman, thus the first difficulty of any regular user is simply to understand what to do. We note that, to properly fill the activity diary (i.e. to validate their data), the user needs to verify the following information:
• Stop locations
Proceedings of the Eastern Asia Society for Transportation Studies, Vol.9, 2013

• Stop durations (start and end time) • Activities performed in those locations • Travel modes taken between stops • Costs/options associated with travel modes such as bus number, parking cost or
accompanying persons The first challenge is thus to communicate what each concept means, explain each
individual task and options, as well as prompt the user with visual and textual cues to recall the actual activities and travel. Relying on lengthy tutorials to guide the user is known to have limited impact so we created a home page (Figure 4) with the essential recruitment information and links for a quick reference (FAQ) and detailed information (Participate!). We also provided leaflets, a video and a help line. Finally, we also added a personalized remote desktop help service that will be described below.
Figure 4. Opening page of FMS
Even with the above information plus other types of material (a leaflet and a video), the
task is still understandably challenging for the vast majority of users given the amount of information that is required from them to confirm/change. We designed several user interface proposals that considered aspects such as grouping (all stops together; individually; grouped by tours), sequencing (stops, activities, mode; stops, modes, activities, etc.), validation mode (on the map, on textual interface), icons, colors and font sizes. We then applied usability tests to the different web interface versions. We summarize a few of the key findings:
• Understanding the continuity of time is essential, particularly each activity/trip starts when the previous trip/activity ends. Previous simplified interfaces that only showed times for either activities or trips were deemed incomplete/confusing;
• Unless the traces have high quality, their visualization on the map can become confusing. GSM or low quality GPS data can become quite “jumpy”. After trying other intermediate solutions (e.g. represent trace precision with different line types; only show high precision), the less disturbing solution was adding a “show traces”
Proceedings of the Eastern Asia Society for Transportation Studies, Vol.9, 2013
option; • The ability to understand the map varies widely among users, this implies that the
text descriptions need to be as much self-explanatory as possible; • The task of deleting stops/trips is much easier than adding them. As a result, we
fine-tuned the stop detection algorithm to generate more false positives than false negatives. This generates more stops than what we’d intuitively desire but the interface burden is lower than otherwise;
• Users are sensitive to font size as well as to amount of information on the screen, especially in the first uses of the interface;
• Elaborate interface features, such as right-click, mouse-hover feedback or drag/drop are inappropriate for a vast amount of the public so we restricted ourselves to the more traditional solutions.
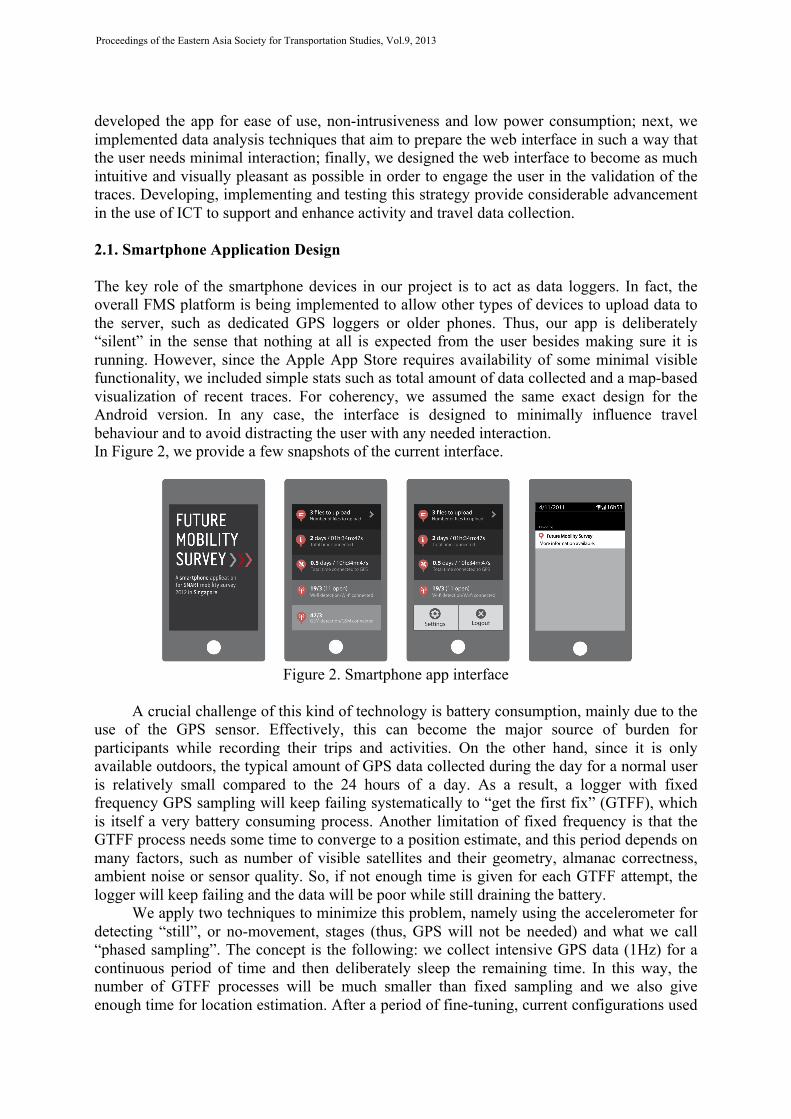
In Figure 5, we show the current activity diary interface as the user sees it after selecting
the validation day.
Figure 5. Activity diary main screen. The day started at 08:39am (after arriving to that
location the day before at 17:12) with a car trip to stop 2, followed by a 1 minute walk to stop 3, etc.
The task is to click on all the “Validate” buttons in the intended order and edit/confirm
each of stops/activities and trip. Figures 6 and 7 show the validation of stop 1 and the subsequent trip, respectively.
Proceedings of the Eastern Asia Society for Transportation Studies, Vol.9, 2013

Figure 6. Validating stop 1
Figure 7. Validating a trip
Finally, we reiterate the fact that, for the majority of the users, the learning curve can
still be steep, therefore we added a new feature that allows for remote desktop help, based on the Firefly® technology. With this feature, the user can provide an FMS representative (the “helper”) temporary remote access to her FMS page within the browser. The helper can then either use a chat window or call the user to guide her through the interface. The helper can see the user’s FMS page and highlight certain pre-defined areas. To initiate the process, the user only needs to click on the “need help?” button on the left-hand side of the window (Figure 8). Then, she can either talk to the helper immediately (if available) or schedule a tutorial session
Proceedings of the Eastern Asia Society for Transportation Studies, Vol.9, 2013

(Figure 9).
Figure 8. Accessing Firefly based help.
Figure 9. Scheduling a help session.
2.4 Evaluating the Survey At the moment of this writing, Singapore is conducting the Household Interview Travel Survey of 2012 (hereafter referred as HITS). This survey collects activity and mobility data for a typical weekday (Monday to Friday) for an individual. This data is collected through face-to-face interviews. A local subcontractor is responsible for the recruitment and interviewing of participants. In addition, they offer subjects the opportunity to participate in the Future Mobility Survey (FMS). They are required to provide at least 14 days of collected data, of which at least 5 have to be validated in order to receive a monetary incentive. Also, it should be noted that the days of collected data for both surveys (i.e. HITS and FMS) are not the same although the same subjects participate in both surveys.
HITS is thus the de facto benchmark for FMS as both surveys are designed to collect activity and mobility data and there is data available of subjects recruited for both surveys. We now present a descriptive statistical analysis of a small selective sample with four
Proceedings of the Eastern Asia Society for Transportation Studies, Vol.9, 2013

attributes: • Participation in activities: the number of out of home activities per day that subjects
partake in. Multiple episodes of an activity are not considered. • Total duration at work: the number of hours spent at work per day. • Total number of trips: the number of trips per day between activities that are not
related to traveling (e.g. changing mode). • Total time spent traveling: the number of hours per day spent traveling from one
activity to another activity. These attributes are further discussed in subsequent paragraphs.
Table 1. Socio-demographic characteristics Number of subjects 26
Male 13 Gender Female 13 20 - 29 years 7 30 - 44 years 16 Age 50 - 59 years 3 No income 4 $1 - $3999 10 $4000 - $6999 8
Personal Monthly Income
Refused 4 1 19 2 5 Household size 3 2 Full-time 20 Employment type Others 6 Yes 20 No 1 Fixed workplace No response 5
The socio-demographic characteristics of the sample are described in Table 1. Most
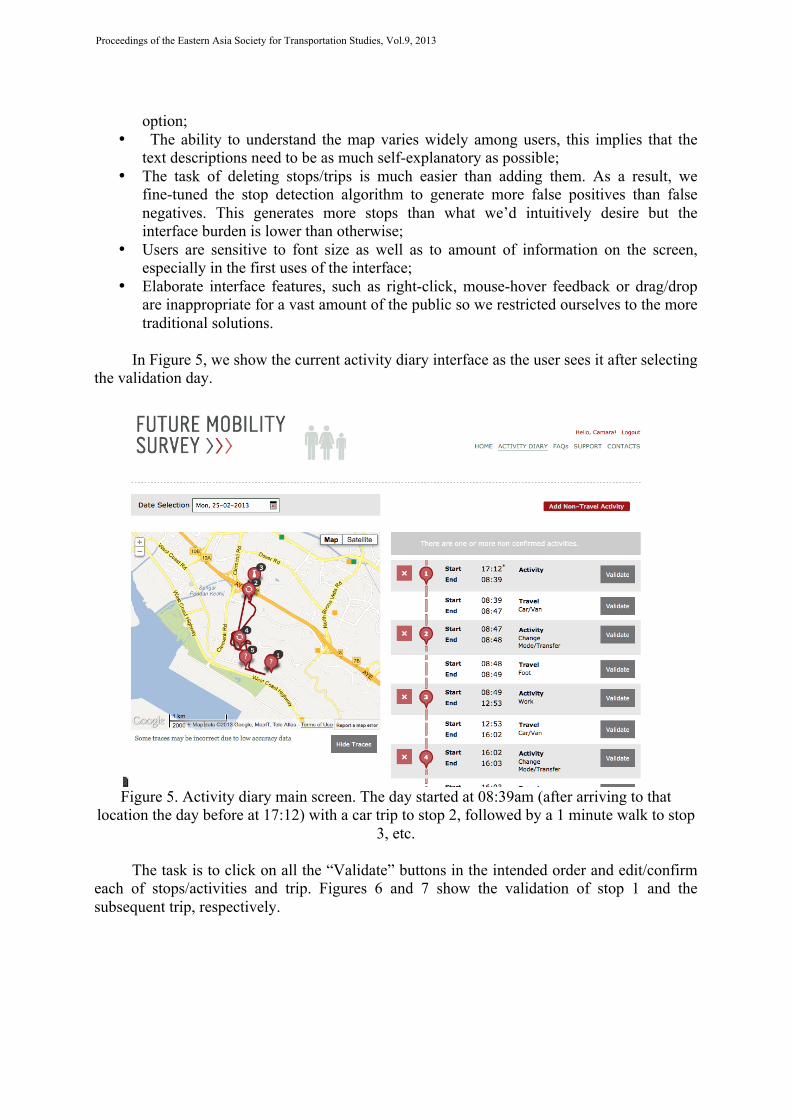
subjects are full-time workers with fixed workplaces. Also, most subjects belong to households of size 1. Thus, this sample is selective and not representative of Singapore. However, the subjects in the sample participated in both surveys, and thus it allows us to do an exploratory and preliminary comparison of the surveys. Participation in activities Figure 10 presents the participation in activities per day of the subjects in HITS 2012, and FMS. There is no clear difference between both bar graphs. Total duration at work Figure 11 presents the hours spent at work per day of the subjects in HITS 2012, and FMS. It is observed that FMS is able to trace the values at the extreme (i.e. shorter or longer work durations) in contrast to the HITS 2012. Total number of trips Figure 12 presents the number of trips per day of the subjects in HITS 2012, and FMS. There
Proceedings of the Eastern Asia Society for Transportation Studies, Vol.9, 2013

is no clear difference between both bar graphs. Total time spent traveling Figure 13 presents the hours spent traveling of the subjects in HITS 2012, and FMS. It is observed that the subjects overestimate their travel times. In the HITS 2012, subjects report their travel times to the interviewers. In the FMS, smart phone devices record the travel times.
Figure 10. Participation in activities of HITS 2012 and FMS.
Figure 11. Total duration at work of HITS 2012 and FMS.
Proceedings of the Eastern Asia Society for Transportation Studies, Vol.9, 2013
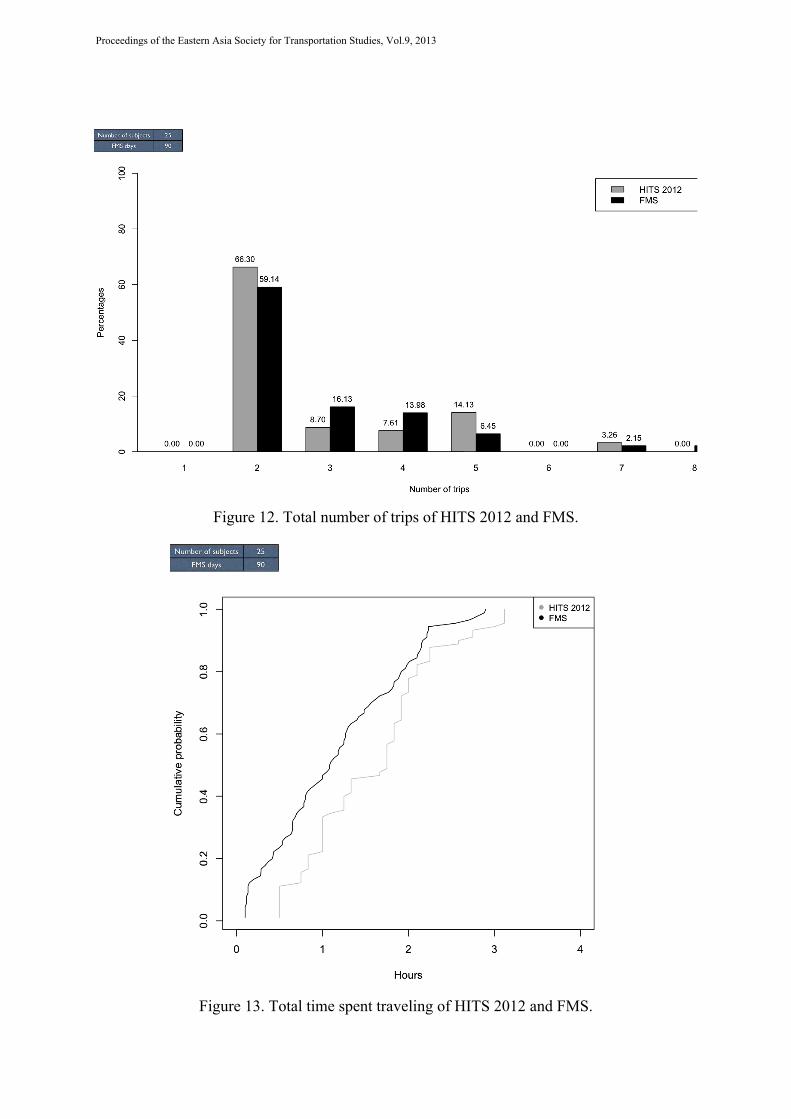
Figure 12. Total number of trips of HITS 2012 and FMS.
Figure 13. Total time spent traveling of HITS 2012 and FMS.
Proceedings of the Eastern Asia Society for Transportation Studies, Vol.9, 2013
3. CONCLUSIONS At the time of writing of this document, FMS was running in Singapore, with a targeted sample size of 1000 subjects. The findings and decisions reported here correspond to an on-going process that is currently being thoroughly tested. Upcoming publications shall bring a more conclusive and verified set of conclusions, particularly in comparison with the Household Interviews for Travel Surveys (HITS 2012), a traditional type of survey simultaneously being run in Singapore.
Our iterative process of testing, improving and refining the system revealed that implementing a smartphone-based activity survey requires various trade-offs in order to be palatable to survey participants and useful for data collection purposes. In this paper, we report on the critical needs to develop a comprehensive survey platform that respects this balance.
The ubiquity of advanced technologies in the mobile environment reveals great potential for expanding data collection methods. Taking advantage of such potential, however, will require careful attention to competing needs. This paper presented a comprehensive approach for the development of a basic data collection platform that may be modified or expanded for use in a variety of contexts or situations. ACKNOWLEDGEMENTS The research described in this project was funded in whole or in part by the Singapore National Research foundation (NRF) through the Singapore-MIT Alliance for Research and Technology (SMART) Future Urban Mobility (FM) program. REFERENCES
Auld, J. A., A. Mohammadian (2009) Framework for the development of the Agent-based Dynamic Activity Planning and Travel Scheduling (ADAPTS) model. Transportation Letters: The International Journal of Transportation Research, 1(3), 243-253.
Battelle, Transportation Division (1997) Lexington Area Travel Data Collection Test: Final Report. Office of Highway Information Management and Office Technology Applications, Federal Highway Administration, Washington, D.C.
Bohte, W., Maat, K. (2009) Deriving and validating trip purposes and travel modes for multi-day GPS-based travel surveys: A large-scale application in the Netherlands. Transportation Research Part C: Emerging Technologies, 17(3), pp. 285 – 297.
Bricka, S., Bhat, C.R. (2006) A Comparative Analysis of GPS-Based and Travel Survey-based Data. Transportation Research Record, vol. 1972, pp. 9-20.
Chen, C., Gong, H., Lawson, C., Bialostozky, E. (2010) Evaluating the feasibility of a passive travel survey collection in a complex urban environment: lessons learned from the New York City case study. Transportation Research, A(44), 830-840.
Cortes, C.; and Vapnik, V. N. (1995) Support-Vector Networks. Machine Learning, 20, 1995.
Cottrill, C., Pereira, F. C., Zhao, F., Dias, I., Lim, H. B., Ben-Akiva, M., Zegras, C. (forthcoming) Future Mobility Survey: Experience in Developing a Smart-Phone-Based Travel Survey in Singapore. Transportation Research Record:
Proceedings of the Eastern Asia Society for Transportation Studies, Vol.9, 2013

Journal of the Transportation Research Board. Hariharan, R., K. Toyama (2004) Project Lachesis: Parsing and Modeling Location
Histories. Geographic Information Science: Third International Conference, GIScience 2004, Adelphi, MD, USA: Springer-Verlag GmbH.
Stopher, P., FitzGerald, C., Xu, M. (2007) Assessing the accuracy of the Sydney Household Travel Survey with GPS. Transportation, vol. 34, iss. 6. P. 723-741.
Proceedings of the Eastern Asia Society for Transportation Studies, Vol.9, 2013