the future of global education - home | pardee center … future of global education 161 the future...
TRANSCRIPT

9
The Future of Global Education 161
The Future of Global Education
Parents around the world want their children to have education. Overwhelmingly, their support and encouragement, as well as that of broader communities, help make that happen. The result over many generations and across almost all the world has been steadily climbing rates of enrollment and completion at all levels of education and gradually rising levels of adult education attainment, an ongoing global transition in formal education from low to high levels.
The global education transition does not unfold in a vacuum. Growth in global incomes and change in the broader sociopolitical environment have been necessary foundations for the transition; and the transition has, in turn, contributed greatly to change in those systems. Similarly, education and demographics have a close, interactive dynamic. In this volume and in the forecasting system that underlies it, we have attempted to map many of the complex, two-way relationships.
Although we have broken some new ground both in the long-term forecasting of global
change in education and in considering that change within the broader context of human development, there is much that we would have liked to do in this volume that we did not. We have been able to give only minimal attention to quality of education, and we are unable to forecast it meaningfully. Parents not only want their children to have education, they want them to have better education. And we have focused throughout on transitions in enrollment patterns and not on transformations in education delivery systems or curriculum development and reform. Changing technology and the processes of globalization have laid foundations for potentially very significant changes in the ways education occurs and in its content.
This final chapter provides an opportunity to review what we have learned about the transition and its interaction with larger changes in the human condition, as well as to reflect on where further attention to the future of education might productively take us next.
VOL2_09 The Future of Global Edu161 161 21/8/09 08:30:58

Patterns of Potential Human Progress Volume 2: Advancing Global Education162
The Unfolding Enrollment and Attainment TransitionsIt is difficult to consider the historical and prospective global sweep of education’s advance without some sense of awe with respect to the process now under way. Figures 9.1 and 9.2 convey the possible, even quite likely, progression of education attainment for current students and adult populations. Figure 9.1 shows IFs base case estimations of the lifetime educational prospects of twelve-year-olds (roughly those of age to complete their primary education) in 2005, 2030, and 2060. It indicates first the portions likely not to complete even a primary education. In sub-Saharan Africa in 2005, that number still stood near 50 percent. Our base case forecasts,1 which we have seen to be somewhat conservative relative to change in the most recent years and optimistic relative to the last fifty years, show that the portion in sub-Saharan Africa not completing primary education could drop to under 20 percent by 2030 and to about 5 percent by 2060. Similarly, the noncompletion rate in South and West Asia is near 30 percent and declining rapidly.
Figure 9.1 also shows explicitly the ongoing progress across the globe at the lower secondary level and therefore in basic education. Globally, in 2005, more than 60 percent of all twelve-year-olds could expect to complete both primary and lower secondary education. By 2030, we anticipate that number will grow to 80 percent globally, reaching 47 percent in sub-Saharan Africa and 85 percent in South and West Asia.
Gender gaps at the primary level will have mostly disappeared by 2030, and in fact, we expect reverse gender gaps to have emerged at both levels of secondary education even in South and West Asia by 2030. The fact that we draw attention in this volume to the likely spread of reverse gender gaps should not in any way suggest that we downplay the critical importance of eliminating the current gender gaps that cause female enrollments to fall below those of males. Given the historical dominance of males in societies around the world, the elimination of these gaps and even the development of some reverse gaps can only begin to address larger and persistent social imbalances. Nonetheless, such reverse gaps are already becoming an issue of importance to societies.
By 2060, it is quite likely that nearly 75 percent of all twelve-year-olds globally may expect to complete upper secondary education, and, in fact, 50 percent may ultimately (although perhaps as older adults) attain tertiary degrees. The tertiary number may be somewhat exaggerated because neither our data nor our forecasts distinguish those who complete multiple tertiary degrees from those who complete only one. Because of our weak understanding of saturation levels and processes (and the complex variations in tertiary degree formats), this volume has emphasized that our tertiary forecasts, even though they build on the experience of current high-income countries, are the most tentative of those that we present. Nonetheless, we have much reason to believe that the advance of higher education will be striking.
Figure 9.2 turns our attention to adults age fifteen and older. (Our database does not distinguish between lower and upper secondary attainment among adults, so our forecasts show only total—effectively upper secondary—attainment.) In contrast to the fewer than 15 percent of twelve-year-olds in 2005 who had not completed primary education globally, the number of adults who had not done so in 2005 is a discouraging 45 percent (and, disturbingly, almost 75 percent in sub-Saharan Africa). In fact, more than 50 percent of female adults worldwide in 2005 never were able to complete that first level. Nearly 80 percent of adults (and more than 80 percent of women) never completed secondary education.
The steady progression of more highly educated young adults into the adult population mix will mean, however, that globally by 2030, the number of individuals without a primary education will likely drop to under 35 percent of the total; the number will fall to 20 percent by 2060. In that year, more than 45 percent of adults globally are likely to have a complete secondary education or more (about 40 percent in South and West Asia and somewhat over 20 percent in sub-Saharan Africa).
We have been able to say much less about quality of education in this volume than we would have liked. We do know, however, that cross-country instruments and systems for assessment of education quality, on the global stage only since 1995, are spreading rapidly.
The number of those in
sub-Saharan Africa not completing
a primary education will
likely fall below 20 percent by
2030.
Female gender gaps at the primary
level will have mostly disappeared
by 2030, even as male gaps
potentially become a growing issue at
higher levels.
VOL2_09 The Future of Global Edu162 162 21/8/09 08:31:00

The Future of Global Education 163
Figure 9.1 Base case forecast of highest level of education ever completed by those age 12 in 2005, 2030, and 2060
Note: Multiple degrees by some may inflate tertiary percentages; data on completion and graduation rates, used for 2005 values, are not of consistently high quality.
Source: IFs Version 6.12.
By 2060, it is quite likely that
nearly 75 percent of all twelve-year-olds globally may
expect to complete upper secondary
education.
Percent completing various education levels
0100
Lower secondaryPrimary Upper secondary
6020 40 80
No or incomplete primary Tertiary
World
2060
2030
2005
Central and Eastern Europe
2060
2030
2005
East Asia and the Pacific (Poorer)
2060
2030
2005
South and West Asia
2060
2030
2005
East Asia and the Pacific (Richer)
2060
2030
2005
Arab States
2060
2030
2005
Central Asia
2060
2030
2005
Latin America and the Caribbean
2060
2030
2005
Sub-Saharan Africa
2060
2030
2005
North America and Western Europe
2060
2030
2005
Percent completing various education levels
01006020 40 80
VOL2_09 The Future of Global Edu163 163 21/8/09 08:31:05

Patterns of Potential Human Progress Volume 2: Advancing Global Education164
Figure 9.2 Base case forecast of education attainment levels of all adults age 15 and older
Note: Multiple degrees by some may inflate tertiary percentages; IFs does not forecast adult percentages with lower secondary education separately from total secondary.
Source: IFs Version 6.12.
Percent completing various education levels
0100
Primary Secondary
6020 40 80
No or incomplete primary Tertiary
World
2060
2030
2005
Central and Eastern Europe
2060
2030
2005
East Asia and the Pacific (Poorer)
2060
2030
2005
South and West Asia
2060
2030
2005
East Asia and the Pacific (Richer)
2060
2030
2005
Arab States
2060
2030
2005
Central Asia
2060
2030
2005
Latin America and the Caribbean
2060
2030
2005
Sub-Saharan Africa
2060
2030
2005
North America and Western Europe
2060
2030
2005
Percent completing various education levels
01006020 40 80
VOL2_09 The Future of Global Edu164 164 21/8/09 08:31:09

The Future of Global Education 165
And we know that both higher levels of income and rising levels of education completion tend to go hand in hand with improvements in quality. We thus have much reason to hope that quality enhancements will also progress steadily.
This volume has repeatedly emphasized that unless one-size-fits-all global education goals are set unreasonably low, many countries will inevitably fail to meet them. In truth, such goals essentially set up some countries to be ultimately identified as failures. We add our voices to those who argue that universal basic education should be clearly recognized as a global goal and pursued, but we disagree with the identification of specific target years for all countries. As the next section discusses, targets that focus on realistic rates of progression toward goals, taking into account the broader process of human development, can serve us better.
Education and Broader Human DevelopmentPestilence, famine, and war could disrupt the steady path of education’s advance that the base case of IFs sketches, not just locally but even globally. Humanity has not fully confined to their barracks any of the horsemen of the apocalypse, and extreme consequences of environmental change or simple greed and mismanagement by human leaders and followers (although, as Mark Twain said, we repeat ourselves) could well unleash them.
Short of more catastrophic futures, we have seen that slower economic growth significantly affects societies’ ability to advance education participation and attainment. At lower income levels, demand drops and supply is constrained. Across our forecast horizon, 1 percent differences in average economic growth rates have a considerable impact on patterns of transition, especially at the tertiary level.
Nonetheless, barring an unfortunate and always very possible disruption of the paths of human advance in coming decades—and even in the face of some fairly significant reduction in global economic growth—many good things should continue to go together. This volume has consistently emphasized the extensive and complex relationships of educational, demographic, economic, and broader sociopolitical change (see, again, Figure 2.1), and we need not review them in detail here.
Although a great many of the relationships are strong, we have especially emphasized the subset between demographics and education. We have done so not just because sizes of population determine the numbers of potential students, because educational attainment levels shape fertility rates and thus population growth, and because the correlations among these forces are strong, but also because a massive global demographic transition has been reshaping the relationships and promises to continue doing so.
Figure 9.3 shows an important element of the worldwide demographic transition across the coming century. The share of population under fifteen years of age is falling steadily. That is true of every UNESCO region, including those with the lowest incomes. The last region to turn from growth to decline of that population segment’s share was sub-Saharan Africa in the early 1990s. Although the subsequent decline of share in Africa has only been 2 percent and remains slow compared to that in South and West Asia (which passed its peak of youth population in the late 1960s and has reduced youth share in total population by more than 10 percent), an accelerating decline of youth share has become obvious in much of sub-Saharan Africa. The resultant “demographic dividend” for education (many have explored that concept for the economy as well) is great—the peak youth share of population in the two regions was
The spread of education is receiving
a significant “demographic
dividend” from a decrease in those
fifteen and younger as a proportion of the population.
Figure 9.3 Base case forecast of dependent age categories as percent of total global population
30
5
20202030
20502040
21002005
Population over age 65 Population under age 15Percent
Year2010
20152025
20352045
2055
10
15
20
25
20602065
20702075
20802085
20902095
Source: IFs Version 6.12.
VOL2_09 The Future of Global Edu165 165 21/8/09 08:31:12

Patterns of Potential Human Progress Volume 2: Advancing Global Education166
about 45 and 42 percent, respectively, and those very high levels all but prohibited them from rapid transition to universal primary and lower secondary education.
Figure 9.3 also shows, however, the growing demographic challenge of aging populations. Their share is increasing in all UNESCO regions, and on a global basis, the older population share is growing faster than the younger share is declining, creating a mounting combined level of dependency on working-age populations. But sub-Saharan Africa should benefit through about 2080 (that is, through most of the century) from a more rapid decline in the younger population than growth in the aging segment, as should South and West Asia through about 2040. The consequences of these interacting demographic forces will be felt everywhere, which will both allow education’s expansion in many regions and simultaneously put downward pressure on total public education spending, especially in the high-income regions.
This volume has also explored many other linkages of education to the larger human development system. In our modeling and analysis, GDP per capita as a proxy for income and economic structure has played a foundational role in forecasting education demand, and attainment of education has in turn helped determine the rate of economic productivity growth. In our forecasts, education attainment also clearly (if not always dramatically) affects broader sociopolitical change such as democratization.
Representation of the interaction of these elements of global change allowed elaboration and exploration of a normative scenario in comparison with the base case. Consistent with our belief that universal global goals are valuable but that common temporal targets are mistaken, we based the normative scenario on target rates in enrollment growth at all levels below tertiary, incorporating also the typically S-shaped growth patterns in those target patterns. We identified peak target growth rates for student intake (or transition to higher levels) and survival to final grades that appear, based on historical experience, to be aggressive yet reasonable. This approach, centered on target growth rates, has its own weaknesses, including nonrecognition of sharply different demographic and economic realities across countries, but it
is a foundation on which analysts can build. Normative scenario analysis with IFs could also evaluate country-specific target growth rates.
We explored the economic costs of the normative scenario, comparing them with some of the economic benefits of it, and we considered some of the much less easily monetized consequences of more rapid educational advance. Our first conclusion is that the benefits, economic and otherwise, are often quite slow to come, lagging (like adult education attainment) by a generation or two behind increases in enrollment rates. Our second conclusion is that those benefits build steadily to very high levels relative to the costs. We come away convinced that continuing efforts to increase education participation—subject, as always, to caveats concerning appropriate pace, reasonable per-student expenditures, and substantial attention to quality—have great merit. It is time, for instance, for the global community to clearly state the goal of universal basic education and suggest target rates of movement toward it, but without specifying a year by which all countries will achieve it. And it is by no means too early to begin considering the global future of upper secondary education.
Because of demographic pressures, which remain intense now but will continue to ameliorate well into and perhaps through the century, the needs of low-income societies for extra education funding and possible outside assistance will be greatest in the normative scenario over the coming two to three decades. We are now in a period, framed by the expansion of education and still high youth populations, when a “bubble” of incremental funding would be extremely helpful. Some payoffs, including a positive feedback process of further fertility reduction, would begin quite soon. Others, such as higher levels of income, would come more slowly but would be significant. Our estimate, for instance, is that for sub-Saharan Africa as a whole, GDP per capita at PPP could be more than $1,000 higher in 2060 in the normative scenario than the roughly $6,200 we would expect in the base case. Investment now can pay huge dividends.
More generally, we should not accept the credo of modernization theory—that all good things tend to go together—without raising important caveats and concerns. For example,
However, at the same time,
societies face a demographic
challenge from an increase in their
aging populations.
Our normative scenario is built
on target rates of enrollment growth
rather than common temporal targets.
We conclude that benefits of
accelerated advance of education build
steadily to high levels relative to
the costs.
VOL2_09 The Future of Global Edu166 166 21/8/09 08:31:14

The Future of Global Education 167
adults age twenty-five and older in sub-Saharan Africa now have acquired, on average, only 3 years of formal education, about 7 years fewer than adults in Western Europe and North America. In our base case forecast for 2060, adults in Africa will be nearing 7 years of education, but those in the richest countries may have reached 15, a gap of 8 years; even in our normative scenario, that gap will still exceed 6 years. The overall pattern of advance would be wonderful. The continued prospective disadvantage of sub-Saharan Africa and similarly of South and West Asia, however, raises significant concerns about the global distribution of opportunity and well-being. Another half century of such remarkable inequality is a very sad prospect.
Concerns in the high-income world may seem paltry by comparison, but they are nonetheless real. Reductions in per-student public spending on tertiary education as a portion of GDP per capita have largely ceased. Yet tuition fees, and thus private spending, have been increasing. For example, a recent report on higher education finance (SHEEO 2008: 1) found that in the United States, students and their families paid 36 percent of the costs of attending public higher education institutions in fiscal year 2008, compared to 24 percent in the early 1980s. Another report noted that in the 1999–2000 academic year, the net college costs of attendance at a public four-year college or university in the United States were 18 percent of the income of a family in the middle-income quartile; in 2007–2008, that figure had increased to 25 percent of such a family’s income (National Center for Public Policy and Higher Education 2008: 8). Increased costs of attendance at private institutions have been even greater. Although education brings so much that is good, it remains expensive, even for the rich.
New Issues and HorizonsIn ways we cannot yet fully grasp, information and communication technology is fundamentally reshaping teaching and learning.The transformation of education is coming.2 Information and communication technology has clearly begun to reshape the foundational patterns of relationships between students and teachers and, more generally, between learners and teaching and learning resources and delivery
systems. Can there be a single reader of this volume who has not experienced the power of searching the Web for information? Not just science fiction fans anticipate the day when we will turn to our ambient environment, say “Computer, tell me … ,” and thereby initiate a conversation.
In spite of Moore’s Law, asserting that ICT power doubles about every two years, the day of such conversations is some distance in the future. And it will be considerably longer still before that conversation partner understands and adapts to our current knowledge level and perhaps even our personality, things that a good teacher always does. Illustrating the gap between prospect and reality that exists even with current technology, a study on ICT in British schools in 2008 reported that only 18 percent of primary schools and 44 percent of secondary schools were connected to high-speed broadband.3 The $100 personal computer, much less a proposed $20 version for Indian students, still has very low penetration levels in low-income countries. (The increasingly smart mobile phone is, however, advancing much more rapidly up the penetration curve.)
Still, the transformation is coming. Distance education and ICT-enhanced lifelong learning are powerful transformative forces, and they are only in their infancy. We certainly anticipate that education will look strikingly different by 2060 than it does today. Yet for the foreseeable future, quite probably for most or all of our forecast horizon, a significantly traditional formal education structure will likely remain in place, augmented by the rapidly advancing fruits of ICT rather than replaced by them. The strong need to support the quality and capabilities of teachers and formal education structures will remain and even grow. The availability of technologically enhanced education will certainly give ammunition for governments that seek to reduce spending on education and divert it to older populations or other purposes, rather than taking full advantage of technology’s development. Those supporting education will need to press for experimentation and innovation.
Another related and powerful transformative force is the general advance of globalization. Higher education is becoming increasingly internationalized in a variety of ways, many
Sadly, despite tremendous
absolute gain forecast for
sub-Saharan Africa, there is continued
prospective relative disadvantage for
the region.
And globalization itself
is transforming education.
VOL2_09 The Future of Global Edu167 167 21/8/09 08:31:15

Patterns of Potential Human Progress Volume 2: Advancing Global Education168
of which have positive potential, such as more emphasis on developing intercultural and global competencies; the creation of new international networks and consortia; the cross-border delivery of collaborative academic programs; and the international movement of students, professors, and researchers (Knight 2008). However, as Knight further noted, there is also widespread concern about risks associated with these endeavors, depending on the motives of those participating in them, the manner in which they are implemented, and the standards to which they adhere.
This volume has not attempted to elaborate and forecast the implications of these transformational processes. The fourth volume
in the Patterns of Potential Human Progress series, on building global infrastructure, will return to the development and expansion of knowledge creation and diffusion systems; it will look at their roots in ICT; at research and development; and at elements of education systems, particularly at the tertiary level.
More generally, there are a great many elements of the educational future that we cannot pretend to foresee. What we can be certain of is that the importance of education systems, through whatever transitions and transformations they may pass, will not diminish. Human development depends on them.
1 We have used the processes of data cleaning and filling that Chapter 4 described to make our initial estimates of completion rates and used the full IFs education model in the forecasts.
2 This phrase consciously echoes Kurzweil (2005), who has said that the singularity (a point of exceptionally rapid technological progress tied to the emergence of artificial intelligence) is near and that it will transform society in manifold and fundamental ways.
3 Report on “School’s In: Learning for the Twenty-First Century,” from the UK Department for Children, Schools, and Families’ Beyond the Current Horizons program, available through www.sigmascan.org.
VOL2_09 The Future of Global Edu168 168 21/8/09 08:31:16

Appendix: Countries by UNESCO Regions 169
Arab States
Algeria * Iraq * Libyan Arab Jamahiriya * Palestine Syrian Arab Republic *
Bahrain Jordan * Mauritania * Qatar Tunisia *
Djibouti Kuwait * Morocco Saudi Arabia * United Arab Emirates
Egypt * Lebanon * Oman Sudan * Yemen
Central and Eastern Europe
Albania Czech Republic * Lithuania Poland * Slovakia
Belarus Estonia Macedonia, TFYR Romania * Slovenia
Bosnia and Herzegovina Hungary * Moldova, Rep. of Russian Federation * Turkey *
Bulgaria * Latvia Montenegro Serbia Ukraine
Croatia
Central Asia
Armenia Georgia * Kyrgyzstan * Tajikistan Uzbekistan
Azerbaijan * Kazakhstan Mongolia * Turkmenistan
East Asia and the Pacific (Poorer Countries)
Brunei Darussalam Indonesia * Malaysia * Papua New Guinea * Timor-Leste
Cambodia Kiribati Marshall Islands Philippines * Tonga
China * Korea, Dem. People’s Rep. of Micronesia, Fed. Sts. Samoa Tuvalu
Cook Islands Lao PDR * Myanmar Solomon Islands Vanuatu
Fiji * Macao Nauru Thailand * Vietnam
East Asia and the Pacific (Richer Countries)
Australia * Japan * Korea, Rep. of New Zealand * Singapore *
Appendix: Countries by UNESCO Regions
VOL2_10 Appendices.indd 169 21/8/09 09:34:09

Patterns of Potential Human Progress Volume 2: Advancing Global Education170
Latin America and the Caribbean
Anguilla Brazil * Dominican Republic * Jamaica * St. Kitts and Nevis
Antigua and Barbuda British Virgin Islands Ecuador * Mexico * St. Lucia
Argentina * Cayman islands El Salvador * Montserrat St. Vincent & the Grenadines
Aruba Chile * Grenada Netherlands Antilles Suriname
Bahamas Colombia * Guatemala * Nicaragua * Trinidad and Tobago *
Barbados * Costa Rica * Guyana * Panama * Turks and Caicos Islands
Belize Cuba * Haiti Paraguay * Uruguay *
Bermuda Dominica Honduras * Peru * Venezuela, RB *
Bolivia *
North America and Western Europe
Andorra Finland * Ireland * Monaco Spain *
Austria * France * Israel * Netherlands * Sweden *
Belgium * Germany Italy * Norway * Switzerland *
Canada Greece * Luxembourg * Portugal * United Kingdom
Cyprus Iceland * Malta * San Marino United States of America *
Denmark *
South and West Asia
Afghanistan * Bhutan Iran, Islamic Republic of Nepal * Sri Lanka *
Bangladesh * India * Maldives Pakistan *
Sub-Saharan Africa
Angola Comoros * Ghana * Mauritius * Sierra Leone
Benin * Congo, Dem. Rep. of Guinea * Mozambique * Somalia
Botswana * Congo, Rep. of Guinea-Bissau Namibia South Africa *
Burkina Faso Côte d’Ivoire Kenya * Niger * Swaziland *
Burundi * Equatorial Guinea Lesotho * Nigeria * Tanzania, United Rep. of *
Cameroon * Eritrea Liberia Rwanda * Togo *
Cape Verde Ethiopia * Madagascar * São Tomé and Príncipe Uganda *
Central African Republlic Gabon Malawi * Senegal * Zambia *
Chad Gambia Mali * Seychelles Zimbabwe
* indicates this country is included in subset of countries with most data
Italics indicate countries not included in IFs
VOL2_10 Appendices.indd 170 21/8/09 09:34:11

Bibliography 171
Bibliography
Abu-Ghaida, Dina, and Stephan Klasen. 2004. “The Costs of Missing the Millennium Development Goal on Gender Equity.” Discussion Paper No. 1031. Institute for the Study of Labor (IZA), Bonn, Germany. http://papers.ssrn.com/sol3/papers.cfm?abstract_id=515945.
Acemoglu, Daron, Simon Johnson, James A. Robinson, and Pierre Yared. 2005. “From Education to Democracy?” American Economic Review 95(2): 44–49.
Allison, Graham T. 1971. The Essence of Decision: Explaining the Cuban Missile Crisis. Boston: Little, Brown.
Alvarez, Benjamin, John Gillies, and Monica Bradsher. 2003. Beyond Basic Education: Secondary Education in the Developing World. Academy for Educational Development and World Bank Institute. Washington, DC: World Bank. http://siteresources.worldbank.org/WBI/Resources?wbi37229Alvarez GilliesBradsher.pdf.
Appiah, Elizabeth N., and Walter W. McMahon. 2002. “The Social Outcomes of Education and Feedbacks on Growth in Africa.” Journal of Development Studies 38(4): 27–68.
Baldacci, Emanuele, Benedict J. Clements, Sanjeev Gupta, and Qiang Cui. 2004. “Social Spending, Human Capital, and Growth in Developing Countries: Implications for Achieving the MDGs.” IMF Working Paper No. 04/217. http://ssrn.com/abstract+879042.
Barrera, Albino. 1990. “The Role of Maternal Schooling and Its Interaction with Public Health Programs in Child Health Production.” Journal of Development Economics 32(1): 69–91.
Barro, Robert J. 1999. Determinants of Economic Growth: A Cross-country Empirical Study. 2nd ed. Cambridge: Massachusetts Institute of Technology Press.
Barro, Robert J., and Jong-Wha Lee. 2000. “International Data on Educational Attainment: Updates and Implications.” NBER Working Paper 7911. National Bureau of Economic Research, Cambridge, MA. http://www.nber.org/papers/w7911.
———. 2001. “International Data on Educational Attainment: Updates and Implications.” Oxford Economic Papers 53, 541–563.
Barro, Robert J., and Xavier X. Sala-i-Martin. 1999. Economic Growth. Cambridge: Massachusetts Institute of Technology Press.
Bates, Robert H., David L. Epstein, Jack A. Goldstone, Ted Robert Gurr, Barbara Harff, Colin H. Kahl, Kristen Knight, Marc A. Levy, Michael Lustik, Monty G. Marshall, Thomas M. Parris, Jay Ulfelder, and Mark R. Woodward. 2003. Political Instability Task Force Report: Phase IV Findings. Science Applications International, McLean, VA. http://globalpolicy.gmu.edu/pitf/pitfp4.htm.
Becker, Gary S. 1973. “A Theory of Marriage: Part I.” Journal of Political Economy 81(4): 813–846.
———. 1974. “A Theory of Marriage: Part II.” Journal of Political Economy 82(2): S11–S26.
Binder, Melissa. 2006. “The Cost of Providing Universal Secondary Education in Developing Countries.” In Joel E. Cohen, David E. Bloom, and Martin B. Malin, eds., Educating All Children: A Global Agenda. Cambridge, MA: American Academy of Arts and Sciences, 455–494.
Birdsall, Nancy, Ruth Levine, and Amina Ibrahim. 2005. Toward Universal Primary Education: Investments, Incentives, and Institutions. Report of the UN Millennium Project Task Force on Education and Gender Equality. London and Sterling, VA: Earthscan. http://www.unmillenniumproject.org/documents/Education-complete.pdf.
Bledsoe, Caroline H., Jennifer A. Johnson-Kuhn, and John G. Haaga. 1999. “Introduction.” In Caroline H. Bledsoe, John B. Casterline, Jennifer A. Johnson-Kuhn, and John G. Haaga, eds., Critical Perspectives on School and Fertility in the Developing World. Washington, DC: National Research Council, 23–48.
Bloom, David E. 2006. “Measuring Global Educational Progress.” In Joel E. Cohen, David E. Bloom, and Martin B. Malin,
VOL2_11 Bibliography.indd 171 21/8/09 09:57:05
Patterns of Potential Human Progress Volume 2: Advancing Global Education172
eds., Educating All Children: A Global Agenda. Cambridge, MA: American Academy of Arts and Sciences, 33–122.
Bloom, David E., and David Canning. 2005. “Health and Economic Growth: Reconciling the Micro and Macro Evidence.” Stanford Institute on International Studies: Center on Democracy, Development, and the Rule of Law. http://iis-db.stanford.edu/pubs/20924/BloomCanning_42.pdf.
Bosworth, Barry, and Susan M. Collins. 2003. “The Empirics of Growth: An Update.” Economics of Developing Countries Paper, Brookings Institution, Washington, DC. http:www.brookings.edu/~/media/Files/rc/papers/2003/0922globaleconomics_bosworth/20030307.pdf.
Bruns, Barbara, Alain Mingat, and Ramahatra Rakotomalala. 2003. Achieving Universal Primary Education by 2015: A Chance for Every Child. Washington, DC: World Bank. http://siteresources.worldbank.org/EDUCATION/Resources/278200-1089739404514/frontmatter.pdf.
Caldwell, John C. 1980. “Mass Education as a Determinant of the Timing of Fertility Decline.” Population and Development Review 6(2) (June): 225–255.
———. 1989. “Mass Education as a Determinant of Mortality Decline.” In John C. Caldwell and G. Santow, eds., Selected Readings in the Cultural, Social and Behavioural Determinants of Health. Canberra: Australian National University, Health Transition Centre, 101–111.
———. 1990. “Cultural and Social Factors Influencing Mortality Levels in Developing Countries.” Annals AAPSS 510 (July): 44–59.
———. 1993. “Health Transition: The Cultural, Social and Behavioural Determinants of Health in the Third World.” Social Science and Medicine 36(2): 125–135.
Cameron, Laurie. 2004. Indicator Handbook for Primary Education: Abridged. Publication of EQUIP2, Educational Quality Improvement Program, funded by USAID. http://www.epdc.org/static/MissionHandbookV1_FINAL.pdf.
———. 2005. “Primary Completion Rates.” Technical Paper WP-09-01. Education Policy and Data Center, Academy for Educational Development, Washington, DC. http://www.epdc.org/static/CompletionRates.pdf.
Case, Anne. 2006. “The Primacy of Education.” In Abhijit Vinayak Banerjee, Roland Benabou, and Dilip Mookherjee, eds., Understanding Poverty. New York: Oxford University Press, 269–285.
Castro-Martín, Teresa, and Fátima Juárez. 1994. “Women’s Education and Fertility in Latin America: Exploring the Significance of Education for Women’s Lives.” DHS Working Paper 10. Macro International, Calverton, MD.
Castelló-Climent, Amparo. 2006. “On the Distribution of Education and Democracy.” Working Paper 0602. Institute of International Economics at the University of Valencia, Valencia, Spain. http://iei.uv.es/docs/wp_internos/RePEc/pdf/iei_0602.pdf.
Chandola, Tarani, Paul Clarke, J. N. Morris, and David Blane. 2006. “Pathways Between Education and Health: A Casual Modelling Approach.” Journal of the Royal Statistical Society, Series A 169(2): 337–359.
Chen, Derek Hung Chiat, and Carl Johan Dahlman. 2004. “Knowledge and Development: A Cross-Sectional Approach.” World Bank Policy Research Working Paper No. 3366. World Bank, Washington, DC. http://www.econ.worldbank.org/view.Php?type=5&id37702
Cincotta, Richard P., Robert Engelman, and Daniele Anastasion. 2003. The Security Demographic:
Population and Civil Conflict After the Cold War. Washington, DC: Population Action International. http://www.populationaction.org/Publications/Reports?The_Security_Demographic?The_Security_Demographic_Population_and_Civil_Conflict_After_the_Cold_War.pdf.
Cleland, John. 2002. “Education and Future Fertility Trends, with Special Reference to Mid-transitional Countries.” In United Nations Population Division, ed., The Future of Fertility Decline in Intermediate-Fertility Countries. New York: Population Division, 187–202. See paper archives at http://www.un.org/esa/population/publications/completingfertility.
Clemens, Michael A. 2004. “The Long Walk to School: International Educational Goals in Historical Perspective.” Working Paper Number 37. Center for Global Development, Washington, DC. Originally prepared as a background paper for the Millennium Project Task Force on Education and Gender Equality. http://ideas.repec.org/p/wpa/wuwpdc/0403007.html.
Cohen, Daniel, and Marcelo Soto. 2001. “Growth and Human Capital: Good Data, Good Results.” OECD Development Centre Working Paper 179. OECD, Paris. http://lysander.sourceoecd.org/vl=8459400/cl=13/nw=1/rpsv/workingpapers/18151949/wp.
———. 2007. “Growth and Human Capital: Good Data, Good Results.” Journal of Economic Growth 12(1): 51–76.
Cohen, Joel E., David E. Bloom, and Martin B. Malin, eds. 2006. Educating All Children: A Global Agenda. Cambridge, MA: American Academy of Arts and Sciences.
Cohen, Joel E., David E. Bloom, Martin B. Malin, and Helen Anne Curry. 2006. “Introduction: Universal Basic and Secondary Education.” In Joel E. Cohen, David E. Bloom, and Martin B. Malin, eds., Educating All
VOL2_11 Bibliography.indd 172 21/8/09 09:57:07

Bibliography 173
Children: A Global Agenda. Cambridge, MA: American Academy of Arts and Sciences, 1–32.
Commission on Macroeconomics and Health (CMH). 2001. Macroeconomics and Health: Investing in Health for Economic Development. Geneva: World Health Organization. http://whqlibdoc.who.int/publications/2001/924154550x.pdf.
Coombs, Philip H. 1985. The World Crisis in Education: The View from the Eighties. New York: Oxford University Press.
Crecine, John P. 1969. Governmental Problem Solving. Chicago: Rand McNally.
Crespo-Cuaresma, Jesús, and Wolfgang Lutz. 2007. “Human Capital, Age Structure and Economic Growth: Evidence from a New Dataset.” Interim Report IR-07–011. International Institute for Applied Systems Analysis, Laxenburg, Austria. http://www.iiasa.ac.at/Admin/PUB/Documents/IR-07-011/pdf.
Cuadra, Ernesto, and Juan Manuel Moreno. 2005. Expanding Opportunities and Building Competencies for Young People: A New Agenda for Secondary Education. Washington, DC: World Bank. http:siteresources.worldbank.org/EDUCATION/Resources/278200-1099079877269/547664-1099079967208/Expanding_Opportunities_Secondary.pdf.
Cutright, Phillips. 1969. “National Political Development: Measurement and Analysis.” In Max Eckstein and Harold Noah, eds., Scientific Investigation in Comparative Education. New York: Macmillan, 367–383.
Delamonica, Enrique, Santosh Mehrotra, and Jan Vandemoortele. 2001. “Is EFA Affordable? Estimating the Global Minimum Cost of ‘Education for All.’” Innocenti Working Paper No. 87. UNICEF Innocenti Research Centre, Florence, Italy. http://www.untj.org/files/reports/UNICEF%20EFA%20COSTING/pdf.
Desai, Sonalde, and Soumya Alva. 1998. “Maternal Education and Child Health:
Is There a Strong Causal Relationship?” Demography 35(1) (February): 71–81.
Dewey, John. 1916. Democracy and Education: An Introduction to the Philosophy of Education. New York: Macmillan.
Diamond, Ian, Margaret Newby, and Sarah Varle. 1999. “Female Education and Fertility: Examining the Links.” In Caroline H. Bledsoe, John B. Casterline, Jennifer A. Johnson-Kuhn, and John G. Haaga, eds., Critical Perspectives on School and Fertility in the Developing World. Washington, DC: National Research Council, 23–48.
Durkheim, Emile. 1956. Education and Sociology, trans. S. D. Fox. Glencoe, England: Fole Press.
Durlauf, Steven N., Paul A. Johnson, and Jonathan R. W. Temple. 2005. “Growth Econometrics.” In Philippe Aghion and Steven N. Durlauf, eds., Handbook of Economic Growth, vol. 1A. Amsterdam: Elsevier, 555–677.
Easterlin, Richard. 1961. “The American Baby-Boom in Historical Perspective.” American Economic Review 51(5): 869–911.
Easterly, William. 2001. The Elusive Quest for Growth. Cambridge: Massachusetts Institute of Technology Press.
Education Policy and Data Center (EPDC). 2005. “Window on the Future: 2025.” Education Policy and Data Center, Washington, DC. http://epdc.org/static/WindowOnTheFuture2025.pdf.
———. 2007a. “What Does History Teach Us in Achieving UPE and UPC for Education for All 2015?” Policy Brief. Education Policy and Data Center, Washington, DC. http://epdc.org/static/ProgressTowardsUPEandUPC.pdf.
———. 2007b. “School Attendance and Enrolment: Global Trends and Projections.” Background paper prepared for the Education for All Global Monitoring Report 2008—Education for All by 2015: Will We Make It? http://
epdc.org/static/GMR%20Report%20All%20071113.pdf.
Fredriksen, Birger. 1980. “Progress Towards Regional Targets for Universal Primary Education: A Statistical Review.” UNESCO Office of Statistics (also published in International Journal of Education Development 1[1] [April 1983]).
Glaeser, Edward L., Giacomo A. M. Ponzetto, and Andrei Shleifer. 2007. “Why Does Democracy Need Education?” NBER Working Paper No. W12128. National Bureau of Economic Research, Cambridge, MA. http://www.nber.org/papers/212128.r.
Goldman, Charles A., Krishna B. Kumar, and Ying Liu. 2008. “Education and the Asian Surge: A Comparison of the Education Systems in India and China.” International Programs at RAND Occasional Paper. RAND Center for Asia Pacific Policy. http://www.rand.org/pubs/occasional_papers/2008/RAND_OP218.pdf.
Goujon, Anne, and Annababette Wils. 1996. “The Importance of Education in Future Population: Global Trends and Case Studies on Cape Verde, Sudan, and Tunisia,” Working Paper WP-96-138. International Institute for Applied Systems Analysis, Laxenburg, Austria. http://www.iiasa.ac.at/Admin/PUB/Documents/WP-96-138.pdf.
Green, Andy, and John Preston. 2001. “Education and Social Cohesion: Recentering the Debate.” Peabody Journal of Education 76(3–4): 247–284.
Groot, Wim, and Henriëtte Maassen van den Brink. 2007. “The Health Effects of Education.” Economics of Education Review 26(2): 186–200.
Grossman, Michael. 2005. “Education and Nonmarket Outcomes.” NBER Working Paper 11582. National Bureau of Economic Research, Cambridge, MA. http://www.nber.org/papers/w11582.
Gurria, Martin, and Alec Ian Gershberg. Undated. “Costing the Education
VOL2_11 Bibliography.indd 173 21/8/09 09:57:09

Patterns of Potential Human Progress Volume 2: Advancing Global Education174
MDGs: A Review of the Leading Methodologies.” Paper commissioned by the World Bank on Behalf of the Finance Working Group of the Education for All Fast Track Initiative. http://www.education-fast-track.org/libraryCostingeducationMDG.pdf.
Gwartney, James, Robert Lawson, Russell S. Sobel, and Peter T. Leeson. 2007. Economic Freedom of the World: 2007 Annual Report. Washington, DC: Cato Institute.
Hannum, Emily, and Claudia Buchmann. 2006. “Global Educational Expansion and Socioeconomic Development: An Assessment of Findings from the Social Sciences.” In Joel E. Cohen, David E. Bloom, and Martin B. Malin, eds., Educating All Children: A Global Agenda. Cambridge, MA: American Academy of Arts and Sciences, 495–534.
Hanushek, Eric A. 2004. “Some Simple Analytics of School Quality.” NBER Working Paper 10229. National Bureau of Economic Research, Cambridge, MA. http://www.nber.org/papers/w10229.
Haveman, Robert H., and Barbara L. Wolfe. 1984. “Schooling and Economic Well-Being: The Role of Nonmarket Effects.” Journal of Human Resources 19(3) (Summer): 377–407.
Hilderink, Henk. 2005. “Modeling Education Dynamics.” Manuscript. Ministry of Health and Environment, Utrecht, Netherlands.
———. 2007. “Modelling Education Dynamics: Why, How, Implementation & Results.” GISMO Working Paper No. 10. Ministry of Health and Environment, Utrecht, Netherlands.
Holsinger, Donald B., and Richard N. Cowell. 2000. Positioning Secondary School Education in Developing Countries. Paris: UNESCO International Institute for Educational Planning. http://unesdoc.unesco.org/images/0012/001224/122425e.pdf.
Hough, J. R. 1993. “Educational
Cost-Benefit Analysis.” Education Research Paper No. 02. Department for International Development, London, England.
Hughes, Barry B. 2001. “Global Social Transformation: The Sweet Spot, the Steady Slog, and the Systemic Shift.” Economic Development and Cultural Change 49(2) (January): 423–458.
———. 2004a. “Forecasting the Human Development Index.” Pardee Center for International Futures Working Paper, Denver, CO. http://www.ifs.du.edu/documents/reports.aspx.
———. 2004b. “International Futures (IFs): An Overview of Structural Design.” Pardee Center for International Futures Working Paper, Denver, CO. http://www.ifs.du.edu/documents/reports.aspx.
———. 2004c. “Scenario Analysis with International Futures.” Pardee Center for International Futures Working Paper, Denver, CO. http://www.ifs.du.edu/documents/reports.aspx.
———. 2005. “Forecasting Productivity and Growth with International Futures (IFs).” Pardee Center for International Futures Working Paper (pts. 1 and 2), Denver, CO. http://www.ifs.du.edu/documents/reports.aspx.
———. 2006. “Assessing the Credibility of Forecasts Using International Futures (IFs): Verification and Validation.” Pardee Center for International Futures Working Paper, Denver, CO. http://www.ifs.du.edu/documents/reports.aspx.
———. 2007. “Forecasting Global Economic Growth with Endogenous Multifactor Productivity: The International Futures (IFs) Approach.” Pardee Center for International Futures Working Paper, Denver, CO. http://www.ifs.du.edu/documents/reports.aspx.
Hughes, Barry B., and Evan E. Hillebrand. 2006. Exploring and Shaping International Futures. Boulder, CO: Paradigm Publishers.
Hughes, Barry B., with Anwar Hossain and Mohammod T. Irfan. 2004. “The Structure of IFs.” Pardee Center for International Futures Working Paper, Denver, CO. http://www.ifs.du.edu/documents/reports.aspx.
Hughes, Barry B., Mohammod T. Irfan, Haider Khan, Krishna Kumar, Dale S. Rothman, and José Roberto Solórzano. 2008. Reducing Global Poverty. Vol. 1 of the Patterns of Potential Human Progress series. Boulder, CO, and New Delhi, India: Paradigm Publishers and Oxford University Press.
Hungerford, Thomas, and Gary Solon. 1987. “Sheepskin Effects in the Return to Education.” Review of Economics and Statistics 69(1) (February): 175–177.
Huntington, Samuel P. 1991. The Third Wave: Democratization in the Late Twentieth Century. Norman: University of Oklahoma Press.
Inglehart, Ronald, and Christian Welzel. 2005. Modernization, Cultural Change, and Democracy: The Human Development Sequence. Cambridge: Cambridge University Press.
International Energy Agency (IEA). 2007. World Energy Outlook 2007. Paris: IEA. http://www.iea.org/textbase/nppdf/free/2007/weo_2007.pdf.
Irfan, Mohammod T. 2008. “A Global Education Transition: Computer Simulation of Alternative Paths in Universal Basic Education.” Ph.D. diss., Josef Korbel School of International Studies, University of Denver. http://www.ifs.du.edu/documents/reports.aspx.
Jamison, Dean T., Lawrence J. Lau, and Jia Wang. 2005. “Health’s Contribution to Economic Growth in an Environment of Partially Endogenous Technical Progress.” In G. López-Casanovas, B. Rivera, and L. Currais, eds., Health and Economic Growth: Findings and Policy Implications. Cambridge: Massachusetts Institute of Technology Press, 67–94.
VOL2_11 Bibliography.indd 174 21/8/09 09:57:10

Bibliography 175
Jamison, Eliot A., Dean T. Jamison, and Eric A. Hanushek. 2006. “The Effects of Education Quality on Income Growth and Mortality.” NBER Working Paper 12652. National Bureau of Economic Research, Cambridge, MA. http://www.nber.org/papers/w12652.
Kaufmann, Daniel, Aart Kraay, and Massimo Mastruzzi. 2003. “Governance Matters III: Governance Indicators for 1996–2002.” World Bank Policy Research Working Paper 3106. World Bank, Washington, DC. http://www.worldbank.org/wbi/governance/wp-governance.html.
———. 2007. “Governance Matters VI: Governance Indicators for 1996–2006.” World Bank Policy Research Working Paper No. 4280. World Bank, Washington, DC. http://www.worldbank.org/wbi/governance/wp-governance.html.
Key, V. O. 1940. “The Lack of a Budgetary Theory.” American Political Science Review 34(6) (December): 1137–1144.
King, Elizabeth M., and M. Anne Hill, eds. 1993. Women’s Education in Developing Countries: Barriers, Benefits, and Policies. Baltimore, MD: Johns Hopkins University Press.
King, Kenneth. 2007. “Multilateral Agencies in the Construction of the Global Agenda on Education.” Comparative Education 43(3) (August): 377–391.
Knight, Jane. 2008. “The Internationalization of Higher Education: Are We on the Right Track.” Academic Matters, October–November 2008 (online and unpaginated). http://www.academicmatters.ca/current_issue.article.gk?catalog_item_id=1234&category+issues/OCT2008.
Kornhauser, William. 1959. The Politics of Mass Society. Glencoe, IL: Free Press.
Krueger, Alan B., and Mikael Lindahl. 2000. “Education for Growth: Why and for Whom?” NBER Working Paper No. 7591. National Bureau of Economic Research, Cambridge, MA.
http://papers.ssrn.com/sol3/papers.cfm?abstract_id=223589.
Kunst, A. E., and J. P. Machenbach. 1994. “The Size of the Mortality Difference Associated with Educational Level in Nine Industrialized Countries.” American Journal of Public Health 84(6): 932–937.
Kurzweil, Raymond. 2005. The Singularity Is Near. New York: Viking.
Lambsdorff, Johann Graf. 2003. “Framework Document 2003: Background Paper to the 2003 Corruption Perceptions Index.” Transparency International and University of Passau, Germany. http://www.transparency.org/policy_research/surveys_indices/cpi/2003.
———. 2008. “The Methodology of the Corruption Perceptions Index.” Transparency International and University of Passau, Germany. http://www.transparency.org/policy_research/surveys_indices/cpi.
Lewin, Keith M. 2004. “Beyond Primary Education for All: Planning and Financing Secondary Education in Africa (SEIA).” Paper presented at the Donor Conference on Secondary Education in Africa (SEIA), Vrije Universiteit Amsterdam, October 15. http://siteresources.worldbank.org/INTAFRREGTOPSEIA/Resources/lewin_main.pdf.
Lewin, Keith, and Francoise Caillods. 2001. Financing Secondary Education in Developing Countries: Strategies for Sustainable Growth. Paris: International Institute for Educational Planning, UNESCO.
Lewis, Maureen, and Marlaine Lockheed. 2006. Inexcusable Absence: Why 60 Million Girls Still Aren’t in School and What to Do About It. Washington, DC: Center for Global Development. http://www.cgdev.org/content/publications/detail/11898.
Lindblom, Charles E. 1959. “The Science of ‘Muddling Through.’” Public Administration Review 19(2): 79–88.
Lipset, Seymour Martin. 1959. “Some Social Requisites of Democracy: Economic Development and Political Legitimacy.” American Political Science Review 53(1): 69–105.
López-Casanovas, Guillem, Berta Rivera, and Luis Currais, eds. 2005. Health and Economic Growth: Findings and Policy Implications. Cambridge: Massachusetts Institute of Technology Press.
Lutz, Wolfgang, Anne Goujon, and Annababette Wils. 2005. “Forecasting Human Capital: Using Demographic Multi-state Methods by Age, Sex, and Education to Show the Long-Term Effects of Investments in Education.” EPDC Working Paper WP-07-03. Education Policy and Data Center, Washington, DC. http://www.epdc.org/static/ForecastingHumanCapital.pdf.
Lutz, Wolfgang, Anne Goujon, Samir K. C. and Warren Sanderson. 2007. “Reconstruction of Populations by Age, Sex and Level of Educational Attainment for 120 Countries for 1970–2000.” Interim Report IR-07-002. International Institute for Applied Systems Analysis, Laxenburg, Austria. http://www.iiasa.ac.at/Atmin/PUB/Documents/IR-07-002.pdf.
Maddox, Brian. 2008. “What Good Is Literacy? Insights and Implications of the Capabilities Approach.” Journal of Human Development 9(2) (July): 185–206.
Mathers, Colin D., and Dejan Loncar. 2006. “Projections of Global Mortality and Burden of Disease from 2002 to 2030.” PLoS Medicine 3(11) (November): 2011–2030.
McMahon, Walter W. 1999. Education and Development: Measuring the Social Benefits. Oxford: Oxford University Press.
McMahon, Walter W. 2002. Education and Development: Measuring the Social Benefits. Oxford: Oxford University Press.
———. 2007. “An Analysis of Education Externalities with Applications to Development in the Deep South.”
VOL2_11 Bibliography.indd 175 21/8/09 09:57:12

Patterns of Potential Human Progress Volume 2: Advancing Global Education176
Contemporary Economic Policy 25(3) (July): 459–482.
———. 2009. Higher Learning, Greater Good: The Private and Social Benefits of Higher Education. Baltimore, MD: Johns Hopkins University Press.
Meyer, John W., Francisco O. Ramirez, and Yasemin Nuhoglu Soysal. 1992. “World Expansion of Mass Education, 1870–1980.” Sociology of Education 65(2) (April): 128–149.
Meyer, John W., Francisco O. Ramirez, Richard Rubinson, and John Boli-Bennett. 1977. “The World Educational Revolution, 1950–1970.” Sociology of Education 50(4) (October): 242–258.
Milanovic, Branko. 2005. Worlds Apart: Measuring International and Global Inequality. Princeton, NJ: Princeton University Press.
Mingat, Alain. 2004. “Issues of Financial Sustainability in the Development of Secondary Education in Africa (SEIA).” Paper presented at the Donor Conference on Secondary Education in Africa (SEIA), Vrije Universiteit Amsterdam, October 15. http://siteresources.worldbank.org/INTAFFREGTOPSEIA/Resources/mingat_main.pdf.
Mingat, Alain, and Jee-Peng Tan. 1996. “The Full Social Returns to Education: Estimates Based on Countries’ Economic Growth Performance.” Human Capital Working Paper No. 16131. World Bank, Washington, DC.
National Center for Public Policy and Higher Education. 2008. Measuring Up 2008: The National Report Card on Higher Education. San Jose, CA: National Center for Public Policy and Higher Education. http://www.highereducation.org.
Notestein, Frank W. 1945. “Population—The Long View.” In Theodore W. Schultz, ed., Food for the World. Chicago: University of Chicago Press, 36–57.
Nussbaum, Martha C. 2003. “Women’s Education: A Global Challenge.” Signs:
Journal of Women in Culture and Society 29(2): 325–355.
Omran, Abdel R. 2001. “The Epidemiological Transition: A Theory of the Epidemiology of Population Change.” Reprinted in Bulletin of the World Health Organization 79(2): 161–170. (Originally published in 1971 in The Milbank Memorial Fund Quarterly 49[4] Part 1: 509–538.)
Oneal, John R., and Bruce M. Russett. 1999. “The Kantian Peace: The Pacific Benefits of Democracy, Interdependence, and International Organizations, 1885–1992.” World Politics 52(1) (October): 1–37.
Organization for Economic Cooperation and Development (OECD). 2003. The Sources of Economic Growth in OECD Countries. Paris: OECD.
Porta, Emilio, and Annababette Wils. 2007. “Review and Evaluation of Selected Education Projection Models in Use in 2006.” EPDC Working Paper WP-02-07. Education Policy and Data Center, Washington, DC. http://epdc.org/static/EducationProjectionModels.pdf.
Pritchett, Lant. 1996. “Where Has All the Education Gone?” World Bank Policy Research Working Paper Series No. 1581. World Bank, Washington, DC.
———. 2004. “Does Learning to Add Up Add Up? The Returns to Schooling in Aggregate Data.” BREAD Working Paper No. 053. Bureau for Research and Economic Analysis of Development, Duke University, Durham, NC. http://ipl.econ.duke.edu/bread/abstract.php?paper=053.
Przeworski, Adam, Michael Alvarez, Jose Antonio Cheibub, and Fernando Limongi. 1996. “What Makes Democracies Endure?” Journal of Democracy 7(1) (January): 39–55.
Psacharopoulos, George, and Harry Anthony Patrinos. 2002. “Returns to Investment in Education: A Further Update.” World Bank Policy Research Working Paper Series No. 2881.
World Bank Latin America and the Caribbean Region, Education Sector Unit, Washington, DC. http://papers.ssrn.com/sol3/papers.cfm?abstract_id=367780.
Ranis, Gustav, Frances Stewart, and Alejandro Ramirez. 2003. “Economic Growth and Human Development.” In Sakiko Fukada-Parr and A. K. Shiva Kumar, eds., Readings in Human Development, 2nd ed. United Nations Development Programme Human Development Report Office. New York: Oxford University Press, 61–84.
Rawls, John. 1971. A Theory of Justice. Cambridge, MA: Harvard University Press.
Robeyns, Ingrid. 2006. “Three Models of Education: Rights, Capabilities and Human Capital.” Theory and Research in Education 4(1) (March): 69–84.
Schultz, Theodore W. 1961. “Investment in Human Capital.” American Economic Review 51(1) (March): 1–17.
Sen, Amartya Kumar. 1999. Development as Freedom. New York: Knopf.
Shkolnikov, Vladimir M., David A. Leon, Sergey Adamets, Eugeniy Andreev, and Alexander Deev. 1998. “Educational Level and Adult Mortality in Russia: An Analysis of Routine Data, 1979–1994.” Social Science and Medicine 47(3): 357–369.
Sperling, Gene. 2006. “The Way Forward for Universal Education.” Foreword in Joel E. Cohen, David E. Bloom, and Martin B. Malin, eds., Educating All Children: A Global Agenda. Cambridge, MA: American Academy of Arts and Sciences, xi–xvi.
State Higher Education Executive Officers (SHEEO). n.d. State Higher Education Finance: Early Release FY 2008. http://www/sheeo.org/finance/shef/SHEF%20FY08%20Early%20Release%20.pdf.
Task Force on Higher Education and Society. 2000. Higher Education in Developing Countries: Peril and Promise. Report of the Task Force convened by
VOL2_11 Bibliography.indd 176 21/8/09 09:57:14
Bibliography 177
UNESCO and the World Bank. http://www.tfhe.net/index.htm.
Thomas, Vinod, Mansoor Dailami, Ashok Dhareshwar, Ramon E. López, Yan Wang, Nalin Kishor, and Daniel Kaufmann. 2000. The Quality of Growth. Washington, DC, and New York: World Bank and Oxford University Press.
ul Haq, Mahbub. 1990. “The Human Development Concept.” http://hdr.undp.org/en/humandev.
———. 2003. “The Human Development Paradigm.” In Sakiko Fukada-Parr and A. K. Shiva Kumar, eds., Readings in Human Development, 2nd ed. United Nations Development Programme Human Development Report Office. New York: Oxford University Press, 17–34.
UNESCO. 1990. World Declaration on Education for All. Text adopted by the World Conference on Education for All, Jomtien, Thailand, March 5–9. http://www.unesco.org/edution/efa/ed_for_all/background/jomtien_declaration.shtml.
———. 1994. Statistics on Adult Illiteracy: Preliminary Results of the 1994 Estimations and Projections. Document No. STE-16. Division of Statistics, United Nations Educational, Scientific, and Cultural Organization, Paris, France. http://unesdoc.unesco.org/images/0010/001055/105526E/pdf.
———. 1997. International Standard Classification of Education: ISCED 1997. http://www.unesco.org/education/information/nfsunesco/doc/isced_1997.htm.
———. 2000. Dakar Framework for Action. Text adopted by the World Education Forum, Dakar, Senegal, April 26–28. http://www.unesco.org/education/wef/en-conf/dakframeng.shtm.
———. 2005a. Education for All Global Monitoring Report 2006: Literacy for Life. Paris: UNESCO Publishing. http://www.unesdoc.unesco.org/images/0014/001416/141639e.pdf.
———. 2005b. EFA—Paving the Way for Action: Education for All in Africa. Report of the Regional Office for Education in Africa (BREDA). Dakar: UNESCO Regional Office. http://www.poledakar.org/spip.php?article245.
———. 2007a. Global Education Digest 2007: Comparing Education Statistics Across the World. Montreal, Canada: UNESCO Institute for Statistics. http://www.uis.unesco.org/ev.php?ID=7167_201&ID2=DO_TOPIC.
———. 2007b. Education for All Global Monitoring Report 2008: Education for All by 2015—Will We Make It? London and Paris: Oxford University Press and UNESCO Publishing. http://www.unesco.org/en/efareport/reports/2008-mid-term-review.
———. 2008. Education for All Global Monitoring Report 2009: Overcoming Inequality: Why Governance Matters. London and Paris: Oxford University Press and UNESCO Publishing. http://www.unesco.org/en/efareport/reports/2009-governance.
UNESCO Division of Statistics. 1989. “Trends and Projections of Enrolment by Level of Education, by Age and by Sex, 1960–2025 (as Assessed in 1989).” Current Surveys and Research in Statistics Document No. CSR-E-60 (archived as ST/89/WS/13). UNESCO, Paris, France.
———. 1993. “Trends and Projections of Enrolment by Level of Education, by Age and by Sex, 1960–2025 (as Assessed in 1993).” Current Surveys and Research in Statistics Document No. CSR-E-63 (archived as BPE-94/WS.1). UNESCO, Paris, France. http://unesdoc.unesco.org/images/0009/000963/096348eb.pdf.
UNESCO Division of Statistics on Education. 1983. “Trends and Projections of Enrolment by Level of Education and by Age: 1960–2000 (as Assessed in 1983).” UNESCO (no publication location provided).
UNESCO Institute for Statistics (UIS). 2002. Financing Education—Investments and Returns: Analysis of the World Education Indicators. Paris: UNESCO-UIS/OECD. http://www.oecd.org/dataoecd/27/8/2494749.pdf.
———. 2005. Education Trends in Perspective: Analysis of the World Education Indicators. Paris: UNESCO-UIS/OECD. http://www.uis.unesco.org/TEMPLATE/pdf/wei/WEI2005.pdf.
———. 2006. Education Counts: Benchmarking Progress in 19 WEI Countries. World Education Indicators 2006. Montreal, Canada: UNESCO Institute for Statistics. http://www.uis.unesco.org/template/publications/wei2006/WEI2006-FINALwc.pdf.
United Nations. 1987. Report of the World Commission on Environment and Development. Oxford: Oxford University Press.
———. 2000. United Nations Millennium Declaration. Text adopted by the General Assembly at the Millennium Summit, New York, USA, September 6–8. http://www.un.org/millennium/declaration/ares552e.pdf.
United Nations Development Group. 2003. Indicators for Monitoring the Millennium Development Goals: Definitions, Rationale, Concepts and Sources. New York: United Nations. http://mdgs.un.org/unsd/mdg/Resources/Attach/Indicators/HandbookEnglish.pdf.
United Nations Environment Programme (UNEP). 2008. Global Environment Outlook: Environment for Development (GEO-4). Nairobi: United Nations Environment Programme. (See especially Chapter 9, “The Future Today,” to which IFs contributed.) http://www.unep.org/geo/geo4/report/GEO-4_Report_Full-en.pdf.
United Nations Millennium Project. 2005. Investing in Development: A Practical Plan to Achieve the Millennium Development Goals. Jeffrey D. Sachs, series editor. New York: United Nations
VOL2_11 Bibliography.indd 177 21/8/09 09:57:16

Patterns of Potential Human Progress Volume 2: Advancing Global Education178
Development Program and Earthscan. http://www.unmillenniumproject.org/reports/fullreport.htm.
United Nations Population Division, ed. 2002. “Fertility Levels and Trends in Countries with Intermediate Levels of Fertility.” In United Nations Population Division, ed., The Future of Fertility Decline in Intermediate-Fertility Countries. New York: Population Division, 136–168. See paper archives at http://www.un.org/esa/population/publications/completingfertility.
———. 2003. Population, Education, and Development: The Concise Report. New York: United Nations. http://www.un.org.esa/population/publications/concise2003/Concisereport2003.pdf.
United States Department of Energy. 2006. International Energy Outlook 2006. Washington, DC: U.S. Department of Energy, Energy Information Administration. http://www.globaloilwatch.com/reports/EIA%20Outlook%202006.pdf.
United States National Intelligence Council (USNIC). 2004. Mapping the Global Future: Report of the National Intelligence Council’s 2020 Project. Washington, DC: U.S. National Intelligence Council. http://www.dni.gov/nic/NIC_globaltrend2020.html.
———. 2008. Global Trends 2025: A Transformed World. Washington, DC: U.S. National Intelligence Council. http://www.dri.gov/nic/PDF_2025/2025_Global_Trends_Final_Report.pdf.
Unterhalter, Elaine, and Harry Brighouse. 2003. “Distribution of What? How Will We Know If We Have Achieved Education for All by 2015?” Paper delivered at the Third Conference on the Capabilities Approach (from Sustainable Development to Sustainable Freedom), University of Pavia, Italy, September 7–9.
Walker, Melanie. 2006. “Towards a Capability-Based Theory of Social Justice for Education Policy-Making.”
Journal of Education Policy 21(2) (March): 163–185.
Weimer, David, and Aidan R. Vining. 2004. Policy Analysis: Concepts and Practice, 4th ed. Englewood Cliffs, NY: Prentice-Hall.
Wildavsky, Aaron. 1988. The New Politics of Budgetary Process. Glenview, IL: Scott, Foresman.
Wils, Annababette. 2002. “On Accelerating the Global Literacy Transition.” Belfer Center for Science and International Affairs Paper 2002-18. John F. Kennedy School of Government, Harvard University, Cambridge, MA. http://belfercenter.ksg.harvard.edu/publication/2916/on_accelerating_the_global_literacy_transition.html.
Wils, Annababette, and Anne Goujon. 1998. “Diffusion of Education in Six World Regions, 1960–90.” Population and Development Review 24(2) (June): 357–368.
Wils, Annababette, and Raymond O’Connor. 2003. “The Causes and Dynamics of the Global Education Transition.” Unpublished paper prepared for the Sustainability Trends and Transition Project, Harvard University, Cambridge, MA.
Wils, Annababette, Bidemi Carrol, and Karima Barrow. 2005. “Educating the World’s Children: Patterns of Growth and Inequality.” EPDC Working Paper. Education Policy and Data Center, Washington, DC. http://www.epdc.org/static/EducatingTheWorldsChildren.pdf.
Woodhall, Maureen. 2004. Cost-Benefit Analysis in Educational Planning, 4th ed. Paris: UNESCO International Institute for Educational Planning.
Woolf, S. H., R. E. Johnson, Robert L. Phillips, and Maike Philipsen. 2007. “Giving Everyone the Health of the Educated: An Examination of Whether Social Change Would Save More Lives Than Medical Advances.” American Journal of Public Health 97(4): 679–783.
World Bank. 2007a. Global Economic Prospects 2007: Managing the Next Wave of Globalization. Washington, DC: World Bank. http://econ.worldbank.org/external/default/main?pagePK=64165259&theSitePK=469372&piPK+64165421&menuPK=64166322&entityID=000112742_20061206155022.
———. 2007b. “Quality Education for All Children: Meeting the Challenge.” Fast Track Initiative Annual Report 2007. World Bank, Washington, DC. http://www.education-fast-track.org/library/AR2007_Eng_Full.pdf.
———. 2008a. “The Road to 2015: Reaching the Education Goals.” Fast Track Initiative Annual Report 2008. World Bank, Washington, DC. http://www.education-fast-track.org/library/Annual_Report_2008_EFA_FTI.pdf.
———. 2008b. World Development Indicators (on CD). Washington, DC: World Bank.
VOL2_11 Bibliography.indd 178 21/8/09 09:57:17

Forecast Tables: Introduction and Glossary 179
Forecast Tables: Introduction and Glossary
Forecasts (or simulation results) from International Futures are dynamic calculations of the full modeling system, not extrapolations of series, results of isolated multiple regressions, or representations of the forecasts of others. To understand more about the forecasts of IFs and the specific formulations for the variables shown in output tables, see Chapter 4 and the documentation of the model.
Forecasts are seldom made for individual countries over a long period of time. There are good reasons for the reluctance to provide such forecasts. For example:
• Data in any series are seldom available for all countries, particularly for smaller ones or those that have undergone substantial sociopolitical transitions. IFs represents 183 countries and uses estimation procedures to fill data holes as necessary.
• Every country is decidedly unique. Formulating a large-scale dynamic model to behave reasonably in the face of such complexity is extremely challenging, and structures of the system will never be completely free of poor behavior for many countries, especially under extreme or new circumstances.
• Some variables, such as the future level of democracy, have especially weak bases for forecasting.
Most longer-term global forecasting reduces the severity of these problems in several ways, such as by relying on regional aggregations of countries and significantly limiting the forecast horizon. The accompanying tables obviously ignore such practical approaches and
simply present the numbers that the model produces. This volume has repeatedly stressed that we should never treat any model results as predictions; we should instead use them for thinking about and exploring possible futures. That is the spirit behind these tables. With continuing development of the modeling system, results will change and presumably improve on average. The project will give regular attention, in particular, to results that are extreme relative to other countries or to expectations based on regional expertise or other forecasts.
These forecast tables are organized by geographic, substantive, and temporal attributes. Geographically, the first of multiple sets begins with global and four-continent totals (Africa, the Americas, Asia with Oceania, and Europe), followed by subregional divisions within each of the continents (see maps that precede tables). The subsequent six pages of each set provide forecasts for each of the country members of the subregional divisions within the four continents. Within the subregional divisions, countries appear in descending order by forecasted population levels in 2060.
The multiple sets cover six substantive issue areas. The first provides population and population density information, and an overall measure of human well-being. The remaining sets of forecasting variables are divided into five categories: poverty (accompanied by standard economic variables such as GDP and GDP per capita), health, education, infrastructure, and governance. These categories correspond to the topics that this five-volume series will cover, and forecasts in each category will therefore be developed across volumes. At this time many of the health and infrastructure forecasts are very
VOL2_12 Intro and Glossary.indd 179 21/8/09 09:31:21

Patterns of Potential Human Progress Volume 2: Advancing Global Education180
preliminary, as those parts of the IFs system of models are the most-recently developed.
Temporally, each series contains values for 2010, 2030, and 2060, thereby providing a forecast horizon of fifty years. Additional columns for many variables show the cumulative percentage change from 2010 through 2060 and the annualized rate of change over the period. The model is currently initialized in 2005, and it computes annual results recursively from 2005 through the simulation horizon. Thus, results in years after 2005 are computations rather than actual
values, even when data are available. The only exception is that IFs imposes the actual GDP 2005–2006 data on the model calculations so as to obtain accurate values for this key series. We will post new forecast sets online periodically.
To facilitate the reading and interpretation of the hard-copy tables associated with this volume and of the electronic copies on the IFs Web site (www.ifs.du.edu), we provide the variable names used in the tables, the variable name used in IFs, and some basic commentary on the variables, such as the sources of initial conditions and/or the forecast approach.
Variables IFs Name Source and Notes
Population, Land Area, and Human Development Index
Population POP Total number of people within a country. Total initialized from WDI data with cohort data on age/sex distribution, fertility, and mortality from UN Population Division.
Land area in 1,000 sq kilometers
LANDAREA Total national land area in 1,000 square kilometers, initialized with data from FAO via WDI. Constant over time.
Land area in 1,000 sq miles
No variable name in model; calculated by converting square kilometers
Total national land area in 1,000 square miles. Constant over time.
Population density per sq kilometer
No variable name in model; calculated from LANDAREA and POP
Population per land area measured in square kilometers.
Population density per sq mile
No variable name in model; calculated by converting density per square kilometer
Population per land area measured in square miles.
Urban population No variable name in model; calculated from others
Percentage of population living in urban areas. Initialized with WDI data.
Population growth rate
POPR Annual percentage change. See population.
Population below 15 years of age
POPLT15 The total number of people in this age category, which is generally considered a period of economic dependence on others.
Population 65 years of age and above
POPGE65 The total number of people in this age category, which is generally considered a period of nonparticipation in the labor force.
Youth bulge YTHBULGE Although the youth bulge is always an indicator of the portion of a population that is young, specific definitions vary. In IFs the definition is population 15–29 as a percentage of all adults (15 and older). A bulge exists when this ratio is above a specified level, such as 50 percent.
Human Development Index
HDI This corresponds very closely to the UNDP’s HDI (see http://hdr.undp.org), which is an average of three components: long and healthy life, knowledge (literacy and education), and standard of living (GDP/capita). Computed in IFs population model from nearly identical drivers within IFs (see Hughes 2004a for specifics).
HDI with higher ceilings
HDI21STFIX An IFs-specific measure. Computed in IFs population model from driver categories within IFs corresponding to the UNDP’s HDI but with maximum values raised to levels that constitute better upper limits for the twenty-first century, notably life expectancy of 120 and GDP per capita of $100,000 (see Hughes 2004a).
VOL2_12 Intro and Glossary.indd 180 21/8/09 09:31:23

Forecast Tables: Introduction and Glossary 181
Variables IFs Name Source and Notes
Poverty
Poverty (below $1 per day)
INCOMELT1LN Population living below $1.08 per day at 1993 international prices (purchasing power parity). Initialized from the World Bank’s PovCalNet. The forecasting formulation is based on an assumption that income in a country is subject to log-normal (LN) distribution, also responsive to the Gini index of distribution. There are complexities in the conversion of values from 1993 dollars to contemporary currency levels; although changes in the global consumer price index suggest that $1.08 in 1993 dollars would be $1.98 in 2000 dollars and $2.82 in 2005 dollars, the problems converting different countries with different market baskets and inflation patterns preclude such simple translation.
Poverty gap index POVGAP Average (normalized) income shortfall expressed as the average shortfall relative to a poverty line ($1 per day in IFs). The further below the poverty line incomes are, the greater the gap.
Poverty (below $2 per day)
INCOMELT2LN Population living below $2.15 per day at 1993 international prices (purchasing power parity). Initialized from the World Bank’s PovCalNet. See poverty below $1 for information.
Poverty (below $5 per day)
No variable name in model; calculated from others
Population living below $5.40 per day at 1993 international prices (purchasing power parity). See poverty below $1 for interpretation. The forecasts of values at income poverty levels above $2 per day do not use survey data for initial conditions but rather use the log-normal formulation and survey data for $2 per day to estimate initial conditions.
Poverty (below $10 per day)
No variable name in model; calculated from others
Population living below $10.80 per day at 1993 international prices (purchasing power parity). See poverty below $1 for general interpretation and poverty below $5 for a note on initialization.
Poverty (below $20 per day)
No variable name in model; calculated from others
Population living below $21.60 per day at 1993 international prices (purchasing power parity). See poverty below $1 for general interpretation and poverty below $5 for a note on initialization.
GDP per capita at PPP
GDPPCP Gross domestic product at purchasing power parity (using 2000 dollars) divided by total population. See GDP for explanation of gross domestic product and GDPP for explanation of PPP.
Gross domestic product
GDP Gross domestic product is defined as either the sum of value added across all sectors of an economy or as the sum of goods and services delivered to meet final demand of an economy. Initialized from WDI data using 2005 dollars; forecasts use much other data including series from the GTAP.
GDP at PPP GDPP The application of purchasing power parity to GDP. As OECD describes them, “Purchasing Power Parities (PPPs) are currency conversion rates that both convert to a common currency and equalize the purchasing power of different currencies. In other words, they eliminate the differences in price levels between countries in the process of conversion.” Initialized from WDI data using 2000 dollars at purchasing power parity; forecasts use much other data including series from the GTAP.
Health
Life expectancy at birth
LIFEXP The average number of years a newborn is expected to live. Initialized from WDI data.
Infant mortality INFMOR The death rate of infants in the first year of life per 1,000 births. Initialized from WDI data.
Total fertility rate TFR The average number of children a woman is expected to bear throughout her life. Initialized from WDI data; forecasts initialized with cohort data on fertility from UN Population Division.
Calories per capita
CLPC Calorie consumption per day from all sources, measured in kilocalories. Initialized with data originally from the UN FAO.
Malnourished children
MALNCHP As defined by the World Bank, “The percentage of children under five whose weight for age is more than two standard deviations below the median reference standard for their age as established by the World Health Organization” and other bodies. Individual countries may look at children at ages three, four, or five. Initialized from WDI data using weight-based malnutrition measure.
AIDS death rate AIDSDRATE Deaths per thousand population per year. Initialized with data from UN AIDS.
Death rate: Digestive diseases
Not directly available in model; calculated as DEATHS by cause divided by population (POP)
Deaths per thousand population per year. Initialized with data from the WHO’s Global Burden of Disease project.
Death rate: Respiratory diseases
Not directly available in model; calculated as DEATHS by cause divided by population (POP)
Deaths per thousand population per year. Initialized with data from the WHO’s Global Burden of Disease project.
VOL2_12 Intro and Glossary.indd 181 21/8/09 09:31:25

Patterns of Potential Human Progress Volume 2: Advancing Global Education182
Variables IFs Name Source and Notes
Death rate: Other communicable diseases
Not directly available in model; calculated as DEATHS by cause divided by population (POP)
Deaths per thousand population per year. Initialized with data from the WHO’s Global Burden of Disease project.
Death rate: Cardiovascular diseases
Not directly available in model; calculated as DEATHS by cause divided by population (POP)
Deaths per thousand population per year. Initialized with data from the WHO’s Global Burden of Disease project.
Death rate: Malignant neoplasms
Not directly available in model; calculated as DEATHS by cause divided by population (POP)
Deaths per thousand population per year. Initialized with data from the WHO’s Global Burden of Disease project.
Death rate: Other noncommunicable diseases
Not directly available in model; calculated as DEATHS by cause divided by population (POP)
Deaths per thousand population per year. Initialized with data from the WHO’s Global Burden of Disease project. IFs forecasts do not include diabetes in the current tables.
Water safety WATSAFE Percentage of population with no access to improved drinking water. Initialized with data from WHO and UNICEF.
Sanitation SANITATION Percentage of population with no access to improved sanitation. Initialized with data from WHO and UNICEF.
Education
Literacy LIT The basic definition is the ability of adults to read and write, but different countries use very different standards. IFs uses 15 and older as the definition of adult for this variable. Initialized from WDI data.
Years of education, Adults 25+
EDYRSAG25 Average number of years of education, presented separately for males and females 25 years of age and older. Initialized from the Barro and Lee dataset (Barro and Lee 2001).
Primary education enrollment rate, net
EDPRIENRN The percentage of the official primary age group enrolled at the primary level. Contrast this with gross enrollment, which includes enrolled students from all age groups but maintains the base of the official age group and can therefore exceed 100 percent. Initialized with UNESCO data.
Primary education enrollment rate, gross
EDPRIENRG All students of any age enrolled at the primary level as a percentage of those of the official age to enroll at the primary level. Contrast this with net enrollment, which considers only those enrolled who are of the official primary age. Initialized with UNESCO data.
Lower secondary enrollment rate, gross
EDSECLOWRENRG All students of any age enrolled at the lower secondary level as a percentage of those of the official age to enroll at the lower secondary level. Lower secondary education for most countries is approximately grades 7–9. (See net primary enrollment for distinction between gross and net.) Initialized with UNESCO data.
Upper secondary enrollment rate, gross
EDSECUPPRENRG All students of any age enrolled at the upper secondary level as a percentage of those of the official age to enroll at the upper secondary level. Upper secondary education for most countries is approximately grades 10–12. (See net primary enrollment for distinction between gross and net.) Initialized with UNESCO data.
Tertiary enrollment rate, gross
EDTERENRG All students of any age enrolled at the tertiary level as a percentage of those of the official age (frequently considered to be 18–21) to enroll at the tertiary level. Initialized with UNESCO data.
Gender parity index: Primary education net enrollment
Not directly available in model; calculated as female enrollment rates over male enrollment rates
The ratio of the enrollment rate of females of official primary-level ages to the enrollment rate of males of official primary-level ages. Initialized with UNESCO data.
Gender parity index: Secondary education gross enrollment
Not directly available in model; calculated as female enrollment rates over male enrollment rates
The ratio of the secondary enrollment rate of females of all ages to the secondary enrollment rate of males of all ages. Initialized with UNESCO data.
Gender parity index: Tertiary education gross enrollment
Not directly available in model; calculated as female enrollment rates over male enrollment rates
The ratio of the tertiary enrollment rate of females of all ages to the tertiary enrollment rate of males of all ages. Initialized with UNESCO data.
VOL2_12 Intro and Glossary.indd 182 21/8/09 09:31:27

Forecast Tables: Introduction and Glossary 183
Variables IFs Name Source and Notes
Infrastructure
Water use per capita
WATUSEPC Annual water withdrawals (all uses) divided by population. Initialized with data from FAO via WRI EarthTrends. Formulation in IFs is very basic and does not include feedback from water supply constraints.
Crop yield YL Annual agricultural crop production of all kinds divided by land area devoted to the production (metric tons per hectare). Initialized with production and land data ultimately from UN FAO.
Energy demand ratio to GDP
ENRGDP Sometimes called energy intensity, and measured here as equivalent barrels of oil. The units of energy consumed per unit of GDP generally decrease as countries get richer. Initialized mostly using data from British Petroleum. A technology parameter heavily influences forecasts.
Carbon emissions CARANN Releases to the atmosphere of carbon from human activity (burning fossil fuels or deforestation) in billion tons or gigatons (1,000 million). Computed in IFs without initialization from a data source.
Road density INFRAROAD Defined as kilometers of road per 1,000 hectares. Initialized from WDI data.
Electricity use INFRAELEC Defined as kilowatt-hours per capita per year. Initialized from WDI data.
Telephone density INFRATELE Defined as telephone lines per 1,000 people. Initialized from WDI data and indirectly from ITU data.
Mobile phone usage
ICTMOBIL Percentage access of population to mobile phones. Initialized from ITU data.
Internet usage Not directly available in model; calculated from the number of networked people (NUMNWP) divided by POP
The percentage of the population with Internet access. Initialized mostly from ITU data.
Broadband usage CTBROAD Percentage access of population to broadband. Initialized from ITU data.
R&D expenditures Not directly available in model; calculated as RANDDEXP over GDP
The OECD defines research and development to cover basic research, applied research, and experimental development; expenditures can be private or public. Initialized from OECD and WDI data and expressed here as a percentage of GDP.
Governance
Freedom House Index (inverted)
FREEDOM Freedom or democracy levels. This variable is based on and initialized from the well-known indicator from the Freedom House Freedom in the World series. Freedom House defines freedom as “the opportunity to act spontaneously in a variety of fields outside the control of government and other centers of potential domination.” See www.freedomhouse.org. Coding of countries on separate civil and political liberty scales is done by experts. Inverted from Freedom House so that higher is more free (2–14).
Polity Democracy Index
DEMOCPOLITY Democracy level, with attention to autocracy level. Based on and initialized from Polity Project data; see http://www.cidcm.umd.edu/polity. Historical values are coded by experts. Computed in IFs as the Polity measure of democracy (1–10 with highest most democratic) minus Polity autocracy (1–10 with highest most authoritarian) plus 10. This combined index measure is fairly widely used. See also FREEDOM.
Economic Freedom Index
ECONFREE Initialized from Fraser International, which defines economic freedom as “the extent to which one can pursue economic activity without interference from government” and builds its index on several measures assessed by experts. Index range is 0–10, with higher values representing greater economic freedom. See http://www.freetheworld.com.
Government Corruption Perception Index
GOVCORRUPT Based on and initialized from Transparency International’s Corruption Perceptions Index. CPI is a composite index that draws on multiple polls and surveys. The index runs from 1–10, with higher values representing less corruption. See www.transparency.org.
Government Effectiveness Index
GOVEFFECT Initialized from the World Bank’s Governance Indicators Project Index, defined as “the quality of public services, the quality of the civil service and the degree of its independence from political pressures, the quality of policy formulation and implementation, and the credibility of the government’s commitment to such policies.” Rescaled from the original to run from 0 to 5 (most effective).
Knowledge Society Index
KNOWSOC Based on A. T. Kearney/Foreign Policy knowledge subindex. Range runs from 0–100, with higher values indicating greater knowledge. See Hughes 2005, part 2, for specification tied to R&D spending and tertiary graduation rate.
VOL2_12 Intro and Glossary.indd 183 21/8/09 09:31:29

Patterns of Potential Human Progress Volume 2: Advancing Global Education184
Data Source Organization AbbreviationsFAO Food and Agriculture Organization of the United NationsGTAP Global Trade Analysis ProjectITU International Telecommunications UnionOECD Organization for Economic Cooperation and DevelopmentUNAIDS United Nations Program on AIDSUNDP United Nations Development ProgramUNESCO United Nations Educational, Scientific, and Cultural OrganizationUNICEF United Nations Children’s FundWDI World Development Indicators of the World BankWHO World Health OrganizationWRI World Resources Institute
Variables IFs Name Source and Notes
Economic Integration Index
ECONINTEG Based on A. T. Kearney/Foreign Policy globalization subindex, tied to trade and foreign direct investment flows. Values run from 0–100, with higher values representing greater economic integration. See Hughes 2005, part 2, for IFs specification.
Globalization Index
GLOBALIZ Based on A. T. Kearney/Foreign Policy Globalization Index, built on four subindexes for economic integration, personal contact, technological connectivity, and political engagement. Index values extend from 0–100, with higher values representing greater globalization. See Hughes 2005, part 2, for specification in IFs.
VOL2_12 Intro and Glossary.indd 184 21/8/09 09:31:30

Forecast Tables: Maps of Continents and Subregions 185
Forecast Tables: Maps of Continents and Subregions
African regions

Patterns of Potential Human Progress Volume 2: Advancing Global Education186
Asian regions

Forecast Tables: Maps of Continents and Subregions 187
American regions

Patterns of Potential Human Progress Volume 2: Advancing Global Education188
European regions

Forecast Tables 189
Population, Land Area, and Human Development IndexPopulation 190LandAreain1,000SquareKilometers 190LandAreain1,000SquareMiles 190PopulationDensityperSquareKilometer 190PopulationDensityperSquareMile 190UrbanPopulation 197PopulationGrowthRate 197PopulationBelow15YearsofAge 197Population65YearsofAgeandAbove 204YouthBulge 204HumanDevelopmentIndex 204HDIwithHigherCeilings 211
PovertyPoverty(below$1perday) 211PovertyGapIndex 211Poverty(below$2perday) 211Poverty(below$5perday) 218Poverty(below$10perday) 218Poverty(below$20perday) 218GDPperCapitaatPPP 225GrossDomesticProduct 225GDPatPPP 225
HealthLifeExpectancyatBirth 232InfantMortality 232TotalFertilityRate 232CaloriesperCapita 239MalnourishedChildren 239AIDSDeathRate 239DeathRate:DigestiveDiseases 246DeathRate:RespiratoryDiseases 246DeathRate:OtherCommunicableDiseases 246DeathRate:CardiovascularDiseases 246DeathRate:MalignantNeoplasms 246DeathRate:OtherNoncommunicableDiseases 246
WaterSafety 253Sanitation 253
EducationLiteracy 253YearsofEducation,Adults25+ 260PrimaryEducationEnrollmentRate,Net 260PrimaryEducationEnrollmentRate,Gross 267LowerSecondaryEnrollmentRate,Gross 267UpperSecondaryEnrollmentRate,Gross 267TertiaryEducationEnrollmentRate,Gross 274GenderParityIndex:PrimaryNetEnrollment 274GenderParityIndex:SecondaryGrossEnrollment 274GenderParityIndex:TertiaryGrossEnrollment 274
InfrastructureWaterUseperCapita 281CropYield 281EnergyDemandRatiotoGDP 281CarbonEmissions 281RoadDensity 288ElectricityUse 288TelephoneDensity 288MobilePhoneUsage 295InternetUsage 295BroadbandUsage 295R&DExpenditures 302
GovernanceFreedomHouseIndex(Inverted) 302PolityDemocracyIndex 302EconomicFreedomIndex 309GovernmentCorruptionPerceptionIndex 309GovernmentEffectivenessIndex 309KnowledgeSocietyIndex 316EconomicIntegrationIndex 316GlobalizationIndex 316
Forecast TablesMeasures of Poverty, Health, Education, Infrastructure, and Governance
VOL2_14 FT Intro page.indd 189 21/8/09 08:55:18

Patterns of Potential Hum
an Progress Volume 2: Enhancing Global Education
190
Patterns of Potential Human Progress Multination Regional Analysis Measures of Poverty, Health, Education, Infrastructure, and Governance
Population, Land Area, and Human Development IndexPopulation Land Area Population Density
Million People Sq Km Sq Mi Persons per Sq Km Persons per Sq Mi
2010 2035 2060 % Chg % An Chg (000s) (000s) 2010 2035 2060 2010 2035 2060
World 6806 8419 9448 38.8% 0.7% 133588 51579 51 63 71 132 163 183
Africa 1009 1682 2354 133.3% 1.7% 30042 11599 34 56 78 87 145 203Americas 937 1126 1212 29.3% 0.5% 40072 15472 23 28 30 61 73 78Asia with Oceania 4130 4913 5266 27.5% 0.5% 40444 15615 102 121 130 264 315 337Europe 720.9 689 608.8 -15.6% -0.3% 22970 8869 31 30 27 81 78 69World 6806 8419 9448 38.8% 0.7% 133588 51579 51 63 71 132 163 183
Africa-Eastern 320.2 568.6 792.6 147.5% 1.8% 6358 2455 50 89 125 130 232 323Africa-Middle 126.9 249.1 424 234.1% 2.4% 6613 2553 19 38 64 50 98 166Africa-Northern 206 275.2 317.9 54.3% 0.9% 8259 3189 25 33 38 65 86 100Africa-Southern 56.8 68.56 73.63 29.6% 0.5% 2675 1033 21 26 28 55 66 71Africa-Western 298.9 520.9 745.5 149.4% 1.8% 6138 2370 49 85 121 126 220 315Africa 1009 1682 2354 133.3% 1.7% 30042 11599 34 56 78 87 145 203
America-Caribbean 39.52 46.94 50.47 27.7% 0.5% 228.1 88.06 173 206 221 449 533 573America-Central 43.87 63.18 75.26 71.6% 1.1% 521.6 201.4 84 121 144 218 314 374America-North 453.8 531.5 565 24.5% 0.4% 21558 8324 21 25 26 55 64 68America-South 399.8 484.8 521.4 30.4% 0.5% 17764 6859 23 27 29 58 71 76Americas 937 1126 1212 29.3% 0.5% 40072 15472 23 28 30 61 73 78
Asia-East 1576 1690 1667 5.8% 0.1% 11799 4556 134 143 141 346 371 366Asia-South Central 1705 2162 2439 43.0% 0.7% 10791 4166 158 200 226 409 519 585Asia-South East 585.5 692.1 719.1 22.8% 0.4% 4495 1735 130 154 160 337 399 414Asia-West 229 325.7 391.9 71.1% 1.1% 4815 1859 48 68 81 123 175 211Oceania 34.28 43.12 48.79 42.3% 0.7% 8543 3299 4 5 6 10 13 15Asia with Oceania 4130 4913 5266 27.5% 0.5% 40444 15615 102 121 130 264 315 337
Europe-East 293.5 265.8 224.5 -23.5% -0.5% 18852 7279 16 14 12 40 37 31Europe-North 98.23 102.9 100.5 2.3% 0.0% 1746 674.2 56 59 58 146 153 149Europe-South 149 140.8 119.9 -19.5% -0.4% 1324 511.2 113 106 91 291 275 235Europe-West 189 188.1 171.4 -9.3% -0.2% 1108 427.9 171 170 155 442 440 401Europe 720.9 689 608.8 -15.6% -0.3% 22970 8869 31 30 27 81 78 69
Base Case
Source: International Futures Version 6.12, March 2009
VOL2_15 Forecast Tables rev.indd 190 21/08/2009 08:59

191Forecast Tables
Patterns of Potential Human Progress Multination Regional Analysis Measures of Poverty, Health, Education, Infrastructure, and Governance
Base Case: Countries in Year 2060
Descending Population Sequence
Population, Land Area, and Human Development IndexPopulation Land Area Population Density
Million People Sq Km Sq Mi Persons per Sq Km Persons per Sq Mi
2010 2035 2060 % Chg % An Chg (000s) (000s) 2010 2035 2060 2010 2035 2060
AFRICAEthiopia 80.65 143.5 211 161.6% 1.9% 1104 426.4 73 130 191 189 337 495
Uganda 34.16 71.59 104.8 206.8% 2.3% 241 93.07 142 297 435 367 769 1126
Tanzania, United Rep. of 43.77 75.96 99.32 126.9% 1.7% 945.1 364.9 46 80 105 120 208 272
Kenya 39.25 66.38 83.5 112.7% 1.5% 580.4 224.1 68 114 144 175 296 373
Madagascar 21.1 36.58 51.45 143.8% 1.8% 587 226.7 36 62 88 93 161 227
Mozambique 22.43 37.65 48.86 117.8% 1.6% 801.6 309.5 28 47 61 72 122 158
Malawi 14.83 27.81 39.68 167.6% 2.0% 118.5 45.75 125 235 335 324 608 867
Zambia 13.21 23.79 32.22 143.9% 1.8% 752.6 290.6 18 32 43 45 82 111
Burundi 8.821 17.71 28.41 222.1% 2.4% 27.83 10.75 317 636 1021 821 1647 2643
Rwanda 10.44 19.35 28.13 169.4% 2.0% 26.34 10.17 396 735 1068 1027 1903 2766
Somalia 9.26 15.04 25.08 170.8% 2.0% 637.7 246.2 15 24 39 38 61 102
Zimbabwe 14.41 21.07 23.68 64.3% 1.0% 390.8 150.9 37 54 61 95 140 157
Eritrea 5.102 8.563 12.53 145.6% 1.8% 117.6 45.41 43 73 107 112 189 276
Mauritius 1.297 1.469 1.488 14.7% 0.3% 2.04 0.788 636 720 729 1646 1864 1888
Comoros 0.665 1.065 1.408 111.7% 1.5% 2.23 0.861 298 478 631 772 1237 1635
Djibouti 0.843 1.075 1.12 32.9% 0.6% 23.2 8.958 36 46 48 94 120 125
Africa-Eastern 320.2 568.6 792.6 147.5% 1.8% 6358 2455 50 89 125 130 232 323
Congo; Dem. Rep. of 67.7 142.3 261.7 286.6% 2.7% 2345 905.4 29 61 112 75 157 289
Angola 18.32 35.05 57.3 212.8% 2.3% 1247 481.4 15 28 46 38 73 119
Cameroon 18.29 30.26 40.69 122.5% 1.6% 475.4 183.6 38 64 86 100 165 222
Chad 11.35 22.72 38.34 237.8% 2.5% 1284 495.8 9 18 30 23 46 77
Central African Republic 4.488 7.769 11.45 155.1% 1.9% 623 240.5 7 12 18 19 32 48
Congo, Rep. of 4.52 7.626 10.3 127.9% 1.7% 342 132 13 22 30 34 58 78
Gabon 1.513 2.181 2.647 75.0% 1.1% 267.7 103.3 6 8 10 15 21 26
Equatorial Guinea 0.565 0.894 1.213 114.7% 1.5% 28.05 10.83 20 32 43 52 83 112
São Tomé and Príncipe 0.176 0.298 0.418 137.5% 1.7% 0.96 0.371 183 310 435 474 803 1127
Africa-Middle 126.9 249.1 424 234.1% 2.4% 6613 2553 19 38 64 50 98 166
Egypt 81.14 106.6 122.6 51.1% 0.8% 1001 386.7 81 106 122 210 276 317
Sudan 40.33 64.11 84.99 110.7% 1.5% 2506 967.5 16 26 34 42 66 88
Algeria 35.34 44.13 45.98 30.1% 0.5% 2382 919.6 15 19 19 38 48 50
Morocco 32.15 38.99 40.88 27.2% 0.5% 446.5 172.4 72 87 92 186 226 237
Tunisia 10.59 12.68 13.49 27.4% 0.5% 163.6 63.17 65 78 82 168 201 214
Libyan Arab Jamahiriya 6.456 8.713 9.873 52.9% 0.9% 1760 679.4 4 5 6 10 13 15
Africa-Northern 206 275.2 317.9 54.3% 0.9% 8259 3189 25 33 38 65 86 100
VOL2_15 Forecast Tables rev.indd 191 21/08/2009 08:59

Patterns of Potential Hum
an Progress Volume 2: Enhancing Global Education
192
Patterns of Potential Human Progress Multination Regional Analysis Measures of Poverty, Health, Education, Infrastructure, and Governance
Base Case: Countries in Year 2060
Descending Population Sequence
Population, Land Area, and Human Development IndexPopulation Land Area Population Density
Million People Sq Km Sq Mi Persons per Sq Km Persons per Sq Mi
2010 2035 2060 % Chg % An Chg (000s) (000s) 2010 2035 2060 2010 2035 2060
AFRICA continuedSouth Africa 49.52 58.54 62.22 25.6% 0.5% 1221 471.4 41 48 51 105 124 132
Namibia 2.215 3.203 3.825 72.7% 1.1% 824.3 318.3 3 4 5 7 10 12
Lesotho 1.935 2.628 2.952 52.6% 0.8% 30.35 11.72 64 87 97 165 224 252
Botswana 1.898 2.428 2.618 37.9% 0.6% 581.7 224.6 3 4 5 8 11 12
Swaziland 1.227 1.762 2.017 64.4% 1.0% 17.36 6.703 71 101 116 183 263 301
Africa-Southern 56.8 68.56 73.63 29.6% 0.5% 2675 1033 21 26 28 55 66 71
Nigeria 149.3 255.9 358.6 140.2% 1.8% 923.8 356.7 162 277 388 419 717 1005
Niger 16.21 32.35 51.43 217.3% 2.3% 1267 489.2 13 26 41 33 66 105
Côte d’Ivoire 20.43 35.19 48.69 138.3% 1.8% 322.5 124.5 63 109 151 164 283 391
Ghana 24.41 37.02 46.17 89.1% 1.3% 238.5 92.1 102 155 194 265 402 501
Burkina Faso 15.17 28.7 43.61 187.5% 2.1% 274 105.8 55 105 159 143 271 412
Mali 15.54 29.04 43.4 179.3% 2.1% 1240 478.8 13 23 35 32 61 91
Senegal 13.22 23.63 34.96 164.4% 2.0% 196.7 75.95 67 120 178 174 311 460
Guinea 10.31 18.49 28 171.6% 2.0% 245.9 94.93 42 75 114 109 195 295
Benin 9.637 17.08 24.51 154.3% 1.9% 112.6 43.48 86 152 218 222 393 564
Togo 6.964 11.93 16.47 136.5% 1.7% 56.79 21.93 123 210 290 318 544 751
Sierra Leone 6.293 10.47 15.25 142.3% 1.8% 71.74 27.7 88 146 213 227 378 551
Liberia 3.86 7.916 14.76 282.4% 2.7% 111.4 43 35 71 132 90 184 343
Mauritania 3.437 5.807 8.363 143.3% 1.8% 1026 396 3 6 8 9 15 21
Guinea-Bissau 1.85 3.688 6.23 236.8% 2.5% 36.12 13.95 51 102 172 133 264 447
Gambia 1.694 2.804 4.011 136.8% 1.7% 11.3 4.363 150 248 355 388 643 919
Cape Verde 0.566 0.838 1.002 77.0% 1.1% 4.03 1.556 140 208 249 364 539 644
Africa-Western 298.9 520.9 745.5 149.4% 1.8% 6138 2370 49 85 121 126 220 315
VOL2_15 Forecast Tables rev.indd 192 21/08/2009 08:59

193Forecast Tables
Patterns of Potential Human Progress Multination Regional Analysis Measures of Poverty, Health, Education, Infrastructure, and Governance
Base Case: Countries in Year 2060
Descending Population Sequence
Population, Land Area, and Human Development IndexPopulation Land Area Population Density
Million People Sq Km Sq Mi Persons per Sq Km Persons per Sq Mi
2010 2035 2060 % Chg % An Chg (000s) (000s) 2010 2035 2060 2010 2035 2060
AMERICASHaiti 9.303 13.65 17.03 83.1% 1.2% 27.75 10.71 335 492 614 869 1275 1590
Dominican Republic 9.609 11.7 12.9 34.2% 0.6% 48.73 18.81 197 240 265 511 622 686
Cuba 11.43 11.29 10.24 -10.4% -0.2% 110.9 42.8 103 102 92 267 264 239
Puerto Rico 4.063 4.647 4.757 17.1% 0.3% 8.95 3.456 454 519 532 1176 1345 1376
Jamaica 2.756 3.132 3.139 13.9% 0.3% 10.99 4.243 251 285 286 650 738 740
Trinidad and Tobago 1.339 1.367 1.244 -7.1% -0.1% 5.13 1.981 261 266 242 676 690 628
Bahamas 0.34 0.398 0.412 21.2% 0.4% 13.88 5.359 24 29 30 63 74 77
Barbados 0.275 0.278 0.246 -10.5% -0.2% 0.43 0.166 640 647 572 1657 1675 1482
St. Vincent & the Grenadines 0.127 0.159 0.176 38.6% 0.7% 0.39 0.151 326 408 451 841 1053 1166
Grenada 0.113 0.146 0.165 46.0% 0.8% 0.34 0.131 332 429 485 863 1115 1260
St. Lucia 0.17 0.176 0.16 -5.9% -0.1% 0.62 0.239 274 284 258 711 736 669
America-Caribbean 39.52 46.94 50.47 27.7% 0.5% 228.1 88.06 173 206 221 449 533 573
Guatemala 14.33 24.25 31.95 123.0% 1.6% 108.9 42.04 132 223 293 341 577 760
Honduras 7.96 11.11 12.66 59.0% 0.9% 112.1 43.28 71 99 113 184 257 293
El Salvador 7.446 9.481 10.5 41.0% 0.7% 21.04 8.124 354 451 499 917 1167 1292
Nicaragua 5.67 7.75 8.56 51.0% 0.8% 130 50.19 44 60 66 113 154 171
Costa Rica 4.672 5.836 6.367 36.3% 0.6% 51.1 19.73 91 114 125 237 296 323
Panama 3.473 4.315 4.712 35.7% 0.6% 75.52 29.16 46 57 62 119 148 162
Belize 0.319 0.442 0.513 60.8% 1.0% 22.96 8.865 14 19 22 36 50 58
America-Central 43.87 63.18 75.26 71.6% 1.1% 521.6 201.4 84 121 144 218 314 374
United States of America 311.1 364.6 394.6 26.8% 0.5% 9629 3718 32 38 41 84 98 106
Mexico 109 128.3 130.2 19.4% 0.4% 1958 756.1 56 66 66 144 170 172
Canada 33.68 38.57 40.17 19.3% 0.4% 9971 3850 3 4 4 9 10 10
America-North 453.8 531.5 565 24.5% 0.4% 21558 8324 21 25 26 55 64 68
Brazil 198.6 236.3 251.4 26.6% 0.5% 8547 3300 23 28 29 60 72 76
Colombia 48.82 59.65 64.78 32.7% 0.6% 1139 439.7 43 52 57 111 136 147
Argentina 40.83 48.26 52.2 27.8% 0.5% 2780 1074 15 17 19 38 45 49
Venezuela, RB 28.87 37.17 41.04 42.2% 0.7% 912.1 352.1 32 41 45 82 106 117
Peru 29.98 37.08 40.25 34.3% 0.6% 1285 496.2 23 29 31 60 75 81
Chile 17.07 20.24 20.93 22.6% 0.4% 756.6 292.1 23 27 28 58 69 72
Ecuador 14.32 18.25 19.45 35.8% 0.6% 283.6 109.5 50 64 69 131 167 178
Bolivia 10.06 13.98 16.35 62.5% 1.0% 1099 424.2 9 13 15 24 33 39
Paraguay 6.484 8.854 10.01 54.4% 0.9% 406.7 157 16 22 25 41 56 64
Uruguay 3.553 3.823 3.922 10.4% 0.2% 176.2 68.04 20 22 22 52 56 58
Guyana 0.754 0.697 0.622 -17.5% -0.4% 215 83 4 3 3 9 8 7
Suriname 0.464 0.483 0.439 -5.4% -0.1% 163.3 63.04 3 3 3 7 8 7
America-South 399.8 484.8 521.4 30.4% 0.5% 17764 6859 23 27 29 58 71 76
VOL2_15 Forecast Tables rev.indd 193 21/08/2009 09:00
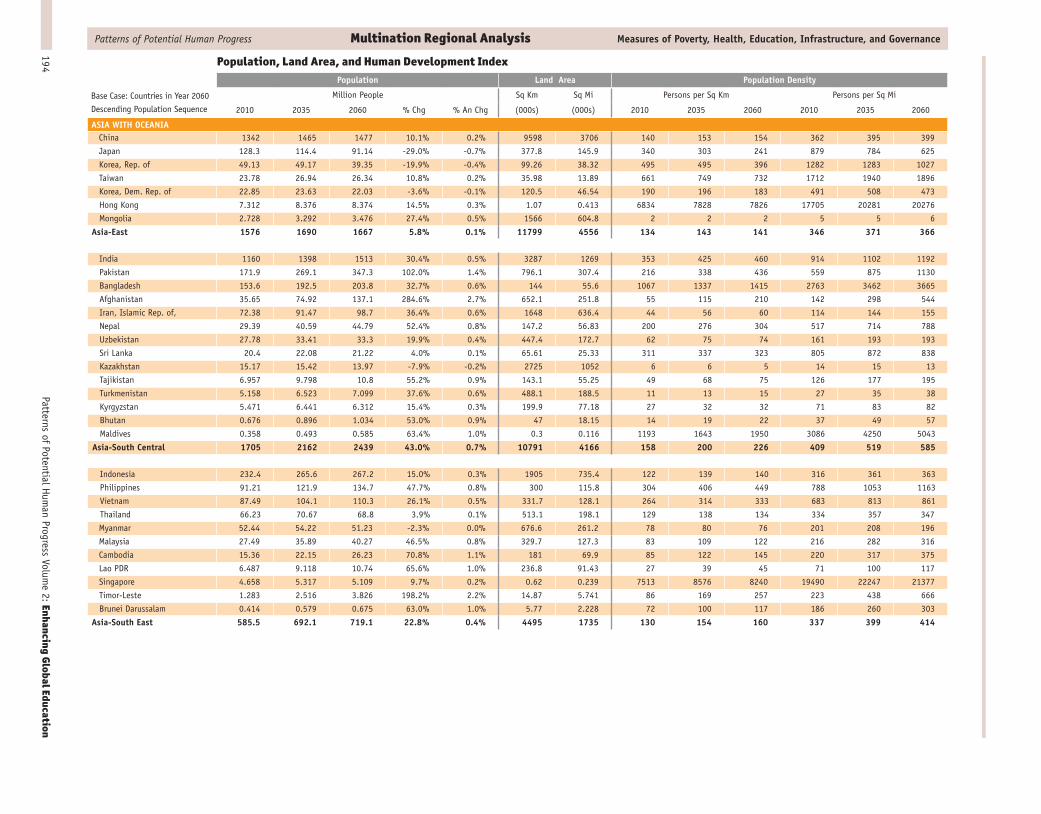
Patterns of Potential Hum
an Progress Volume 2: Enhancing Global Education
194
Patterns of Potential Human Progress Multination Regional Analysis Measures of Poverty, Health, Education, Infrastructure, and Governance
Base Case: Countries in Year 2060
Descending Population Sequence
Population, Land Area, and Human Development IndexPopulation Land Area Population Density
Million People Sq Km Sq Mi Persons per Sq Km Persons per Sq Mi
2010 2035 2060 % Chg % An Chg (000s) (000s) 2010 2035 2060 2010 2035 2060
ASIA WITH OCEANIAChina 1342 1465 1477 10.1% 0.2% 9598 3706 140 153 154 362 395 399
Japan 128.3 114.4 91.14 -29.0% -0.7% 377.8 145.9 340 303 241 879 784 625
Korea, Rep. of 49.13 49.17 39.35 -19.9% -0.4% 99.26 38.32 495 495 396 1282 1283 1027
Taiwan 23.78 26.94 26.34 10.8% 0.2% 35.98 13.89 661 749 732 1712 1940 1896
Korea, Dem. Rep. of 22.85 23.63 22.03 -3.6% -0.1% 120.5 46.54 190 196 183 491 508 473
Hong Kong 7.312 8.376 8.374 14.5% 0.3% 1.07 0.413 6834 7828 7826 17705 20281 20276
Mongolia 2.728 3.292 3.476 27.4% 0.5% 1566 604.8 2 2 2 5 5 6
Asia-East 1576 1690 1667 5.8% 0.1% 11799 4556 134 143 141 346 371 366
India 1160 1398 1513 30.4% 0.5% 3287 1269 353 425 460 914 1102 1192
Pakistan 171.9 269.1 347.3 102.0% 1.4% 796.1 307.4 216 338 436 559 875 1130
Bangladesh 153.6 192.5 203.8 32.7% 0.6% 144 55.6 1067 1337 1415 2763 3462 3665
Afghanistan 35.65 74.92 137.1 284.6% 2.7% 652.1 251.8 55 115 210 142 298 544
Iran, Islamic Rep. of, 72.38 91.47 98.7 36.4% 0.6% 1648 636.4 44 56 60 114 144 155
Nepal 29.39 40.59 44.79 52.4% 0.8% 147.2 56.83 200 276 304 517 714 788
Uzbekistan 27.78 33.41 33.3 19.9% 0.4% 447.4 172.7 62 75 74 161 193 193
Sri Lanka 20.4 22.08 21.22 4.0% 0.1% 65.61 25.33 311 337 323 805 872 838
Kazakhstan 15.17 15.42 13.97 -7.9% -0.2% 2725 1052 6 6 5 14 15 13
Tajikistan 6.957 9.798 10.8 55.2% 0.9% 143.1 55.25 49 68 75 126 177 195
Turkmenistan 5.158 6.523 7.099 37.6% 0.6% 488.1 188.5 11 13 15 27 35 38
Kyrgyzstan 5.471 6.441 6.312 15.4% 0.3% 199.9 77.18 27 32 32 71 83 82
Bhutan 0.676 0.896 1.034 53.0% 0.9% 47 18.15 14 19 22 37 49 57
Maldives 0.358 0.493 0.585 63.4% 1.0% 0.3 0.116 1193 1643 1950 3086 4250 5043
Asia-South Central 1705 2162 2439 43.0% 0.7% 10791 4166 158 200 226 409 519 585
Indonesia 232.4 265.6 267.2 15.0% 0.3% 1905 735.4 122 139 140 316 361 363
Philippines 91.21 121.9 134.7 47.7% 0.8% 300 115.8 304 406 449 788 1053 1163
Vietnam 87.49 104.1 110.3 26.1% 0.5% 331.7 128.1 264 314 333 683 813 861
Thailand 66.23 70.67 68.8 3.9% 0.1% 513.1 198.1 129 138 134 334 357 347
Myanmar 52.44 54.22 51.23 -2.3% 0.0% 676.6 261.2 78 80 76 201 208 196
Malaysia 27.49 35.89 40.27 46.5% 0.8% 329.7 127.3 83 109 122 216 282 316
Cambodia 15.36 22.15 26.23 70.8% 1.1% 181 69.9 85 122 145 220 317 375
Lao PDR 6.487 9.118 10.74 65.6% 1.0% 236.8 91.43 27 39 45 71 100 117
Singapore 4.658 5.317 5.109 9.7% 0.2% 0.62 0.239 7513 8576 8240 19490 22247 21377
Timor-Leste 1.283 2.516 3.826 198.2% 2.2% 14.87 5.741 86 169 257 223 438 666
Brunei Darussalam 0.414 0.579 0.675 63.0% 1.0% 5.77 2.228 72 100 117 186 260 303
Asia-South East 585.5 692.1 719.1 22.8% 0.4% 4495 1735 130 154 160 337 399 414
VOL2_15 Forecast Tables rev.indd 194 21/08/2009 09:00

195Forecast Tables
Patterns of Potential Human Progress Multination Regional Analysis Measures of Poverty, Health, Education, Infrastructure, and Governance
Base Case: Countries in Year 2060
Descending Population Sequence
Population, Land Area, and Human Development IndexPopulation Land Area Population Density
Million People Sq Km Sq Mi Persons per Sq Km Persons per Sq Mi
2010 2035 2060 % Chg % An Chg (000s) (000s) 2010 2035 2060 2010 2035 2060
ASIA WITH OCEANIA continuedTurkey 76.35 91.8 98.3 28.7% 0.5% 774.8 299.2 99 118 127 255 307 329
Yemen 24.23 45.43 65.9 172.0% 2.0% 528 203.9 46 86 125 119 223 323
Iraq 29.95 50.27 65.58 119.0% 1.6% 438.3 169.2 68 115 150 177 297 388
Saudi Arabia 25.88 40.55 51.04 97.2% 1.4% 2150 830 12 19 24 31 49 61
Syria 21.41 32.63 39.31 83.6% 1.2% 185.2 71.5 116 176 212 299 456 550
Israel 7.639 10.05 11.64 52.4% 0.8% 21.06 8.131 363 477 553 939 1236 1432
Azerbaijan 8.933 10.43 10.24 14.6% 0.3% 86.6 33.44 103 120 118 267 312 306
Jordan 6.074 8.356 9.953 63.9% 1.0% 89.21 34.44 68 94 112 176 243 289
Palestine 4.181 7.216 9.363 123.9% 1.6% 0.38 0.147 11003 18989 24639 28442 49088 63694
United Arab Emirates 4.995 6.448 6.603 32.2% 0.6% 83.6 32.28 60 77 79 155 200 205
Oman 2.849 4.437 5.62 97.3% 1.4% 309.5 119.5 9 14 18 24 37 47
Kuwait 2.872 4.157 5.06 76.2% 1.1% 17.82 6.88 161 233 284 417 604 735
Lebanon 3.806 4.484 4.715 23.9% 0.4% 10.4 4.015 366 431 453 948 1117 1174
Georgia 4.344 3.538 2.899 -33.3% -0.8% 69.7 26.91 62 51 42 161 131 108
Armenia 3.06 3.027 2.75 -10.1% -0.2% 29.8 11.51 103 102 92 266 263 239
Bahrain 0.795 1.037 1.129 42.0% 0.7% 0.71 0.274 1120 1461 1590 2901 3785 4120
Qatar 0.876 1.058 1.049 19.7% 0.4% 11 4.247 80 96 95 206 249 247
Cyprus 0.781 0.818 0.733 -6.1% -0.1% 9.25 3.571 84 88 79 219 229 205
Asia-West 229 325.7 391.9 71.1% 1.1% 4815 1859 48 68 81 123 175 211
Australia 21.41 25.41 27.69 29.3% 0.5% 7741 2989 3 3 4 7 9 9
Papua New Guniea 6.522 10.07 13.02 99.6% 1.4% 462.8 178.7 14 22 28 36 56 73
New Zealand 4.268 4.867 4.93 15.5% 0.3% 270.5 104.5 16 18 18 41 47 47
Solomon Islands 0.534 0.847 1.128 111.2% 1.5% 28.9 11.16 18 29 39 48 76 101
Fiji 0.885 0.959 0.891 0.7% 0.0% 18.27 7.054 48 52 49 125 136 126
Vanuatu 0.237 0.37 0.459 93.7% 1.3% 12.19 4.707 19 30 38 50 79 98
Micronesia 0.123 0.186 0.229 86.2% 1.3% 5.801 2.24 21 32 39 55 83 102
Tonga 0.113 0.178 0.225 99.1% 1.4% 0.75 0.29 151 237 300 390 614 776
Samoa 0.19 0.228 0.221 16.3% 0.3% 2.84 1.097 67 80 78 173 208 201
Oceania 34.28 43.12 48.79 42.3% 0.7% 8543 3299 4 5 6 10 13 15
VOL2_15 Forecast Tables rev.indd 195 21/08/2009 09:00

Patterns of Potential Hum
an Progress Volume 2: Enhancing Global Education
196
Patterns of Potential Human Progress Multination Regional Analysis Measures of Poverty, Health, Education, Infrastructure, and Governance
Base Case: Countries in Year 2060
Descending Population Sequence
Population, Land Area, and Human Development IndexPopulation Land Area Population Density
Million People Sq Km Sq Mi Persons per Sq Km Persons per Sq Mi
2010 2035 2060 % Chg % An Chg (000s) (000s) 2010 2035 2060 2010 2035 2060
EUROPERussian Federation 141.1 130.1 110 -22.0% -0.5% 17075 6593 8 8 6 21 20 17
Ukraine 45.5 37.21 30.9 -32.1% -0.8% 603.7 233.1 75 62 51 195 160 133
Poland 38.29 36.3 30.65 -20.0% -0.4% 312.7 120.7 122 116 98 317 301 254
Romania 21.49 19.53 16.63 -22.6% -0.5% 238.4 92.04 90 82 70 233 212 181
Czech Republic 10.3 9.686 8.29 -19.5% -0.4% 127.9 49.37 81 76 65 209 196 168
Belarus 9.688 9.037 7.938 -18.1% -0.4% 207.6 80.15 47 44 38 121 113 99
Hungary 9.988 8.982 7.502 -24.9% -0.6% 93.03 35.92 107 97 81 278 250 209
Bulgaria 7.496 6.037 4.962 -33.8% -0.8% 110.9 42.82 68 54 45 175 141 116
Slovakia 5.44 5.231 4.486 -17.5% -0.4% 49.01 18.92 111 107 92 288 276 237
Moldova, Rep. of 4.153 3.633 3.111 -25.1% -0.6% 33.85 13.07 123 107 92 318 278 238
Europe-East 293.5 265.8 224.5 -23.5% -0.5% 18852 7279 16 14 12 40 37 31
United Kingdom 61.74 65.33 64.37 4.3% 0.1% 242.9 93.79 254 269 265 658 697 686
Sweden 9.189 9.424 9.024 -1.8% 0.0% 450 173.7 20 21 20 53 54 52
Denmark 5.532 5.77 5.69 2.9% 0.1% 43.09 16.64 128 134 132 332 347 342
Ireland 4.389 5.148 5.434 23.8% 0.4% 70.27 27.13 62 73 77 162 190 200
Norway 4.765 5.227 5.307 11.4% 0.2% 323.9 125.1 15 16 16 38 42 42
Finland 5.339 5.388 5.044 -5.5% -0.1% 338.1 130.6 16 16 15 41 41 39
Lithuania 3.383 3.108 2.636 -22.1% -0.5% 65.2 25.17 52 48 40 134 123 105
Latvia 2.275 2.067 1.749 -23.1% -0.5% 64.6 24.94 35 32 27 91 83 70
Estonia 1.308 1.092 0.917 -29.9% -0.7% 45.1 17.41 29 24 20 75 63 53
Iceland 0.308 0.342 0.333 8.1% 0.2% 103 39.77 3 3 3 8 9 8
Europe-North 98.23 102.9 100.5 2.3% 0.0% 1746 674.2 56 59 58 146 153 149
Italy 58.86 54.07 44.77 -23.9% -0.5% 301.3 116.3 195 179 149 506 465 385
Spain 44.14 42.74 36.32 -17.7% -0.4% 506 195.4 87 84 72 226 219 186
Greece 11.23 10.72 9.287 -17.3% -0.4% 132 50.95 85 81 70 220 210 182
Portugal 10.66 10.3 9.278 -13.0% -0.3% 91.98 35.51 116 112 101 300 290 261
Serbia 7.373 6.833 6.129 -16.9% -0.4% 102.2 39.45 72 67 60 187 173 155
Croatia 4.423 4.025 3.487 -21.2% -0.5% 56.54 21.83 78 71 62 203 184 160
Bosnia and Herzegovina 4.071 3.81 3.208 -21.2% -0.5% 51.2 19.77 80 74 63 206 193 162
Albania 3.181 3.375 3.19 0.3% 0.0% 28.75 11.1 111 117 111 287 304 287
Macedonia, TFYR 2.066 1.998 1.753 -15.2% -0.3% 25.71 9.927 80 78 68 208 201 177
Slovenia 2.011 1.88 1.522 -24.3% -0.6% 20.25 7.819 99 93 75 257 240 195
Montenegro 0.62 0.62 0.589 -5.0% -0.1% 7.757 2.995 80 80 76 207 207 197
Malta 0.41 0.408 0.351 -14.4% -0.3% 0.32 0.124 1281 1275 1097 3306 3290 2831
Europe-South 149 140.8 119.9 -19.5% -0.4% 1324 511.2 113 106 91 291 275 235
Germany 82.96 79.16 68.86 -17.0% -0.4% 357 137.8 232 222 193 602 574 500
France 62.3 64.67 61.8 -0.8% 0.0% 551.5 212.9 113 117 112 293 304 290
Netherlands 16.78 17.71 17.09 1.8% 0.0% 41.53 16.03 404 426 412 1047 1105 1066
Belgium 10.67 10.81 10.15 -4.9% -0.1% 30.51 11.78 350 354 333 906 918 862
Austria 8.288 7.843 6.555 -20.9% -0.5% 83.86 32.38 99 94 78 256 242 202
Switzerland 7.526 7.297 6.178 -17.9% -0.4% 41.29 15.94 182 177 150 472 458 388
Luxembourg 0.487 0.616 0.742 52.4% 0.8% 2.59 1 188 238 286 487 616 742
Europe-West 189 188.1 171.4 -9.3% -0.2% 1108 1108 171 170 155 171 170 155
VOL2_15 Forecast Tables rev.indd 196 21/08/2009 09:00

197Forecast Tables
Patterns of Potential Human Progress Multination Regional Analysis Measures of Poverty, Health, Education, Infrastructure, and Governance
Base Case
Source: International Futures Version 6.12, March 2009
Population, Land Area, and Human Development Index Urban Population Population Growth Rate Population Below 15 Years
Percent Percent Million People
2010 2035 2060 % Chg % An Chg 2010 2035 2060 2010 2035 2060 % Chg % An Chg
World 52.3 58.81 64.6 23.5% 0.4% 1.081 0.65 0.225 1805 1808 1724 -4.5% -0.1%
Africa 41.92 46.31 51.84 23.7% 0.4% 2.367 1.702 0.952 404.5 567.5 616 52.3% 0.8%Americas 80.65 83.13 84.95 5.3% 0.1% 1.044 0.491 0.157 231.1 209.6 189.6 -18.0% -0.4%Asia with Oceania 44.62 54.67 63.46 42.2% 0.7% 0.964 0.463 0.016 1059 942.4 841.4 -20.5% -0.5%Europe 73.99 79.04 83.21 12.5% 0.2% 0.009 -0.315 -0.627 109.1 87.86 75.78 -30.5% -0.7%World 52.3 58.81 64.6 23.5% 0.4% 1.081 0.65 0.225 1805 1808 1724 -4.5% -0.1%
Africa-Eastern 24.85 31.78 41.2 65.8% 1.0% 2.664 1.821 0.888 138.5 202.2 196 41.5% 0.7%Africa-Middle 42.97 46.43 50.69 18.0% 0.3% 2.919 2.508 1.658 57.6 103.8 144.6 151.0% 1.9%Africa-Northern 53.65 59.13 64.78 20.7% 0.4% 1.643 0.806 0.299 64.14 61.79 56.8 -11.4% -0.2%Africa-Southern 61.43 67.99 73.82 20.2% 0.4% 1.138 0.505 -0.002 17.74 14.66 12.29 -30.7% -0.7%Africa-Western 47.98 52.48 56.13 17.0% 0.3% 2.548 1.817 0.991 126.5 185 206.3 63.1% 1.0%Africa 41.92 46.31 51.84 23.7% 0.4% 2.367 1.702 0.952 404.5 567.5 616 52.3% 0.8%
America-Caribbean 67.33 69.97 72.56 7.8% 0.1% 0.958 0.433 0.072 10.53 10.1 9.076 -13.8% -0.3%America-Central 57.13 61.6 66.9 17.1% 0.3% 1.917 1.013 0.394 15.42 16.11 13.59 -11.9% -0.3%America-North 81.61 84.91 87.03 6.6% 0.1% 0.876 0.423 0.18 96.73 91.63 87.21 -9.8% -0.2%America-South 83.47 85.27 86.49 3.6% 0.1% 1.147 0.503 0.105 108.4 91.79 79.73 -26.4% -0.6%Americas 80.65 83.13 84.95 5.3% 0.1% 1.044 0.491 0.157 231.1 209.6 189.6 -18.0% -0.4%
Asia-East 50.63 62.58 72.25 42.7% 0.7% 0.48 0.151 -0.436 300.4 251.3 222.2 -26.0% -0.6%Asia-South Central 33.9 44.61 55 62.2% 1.0% 1.272 0.655 0.271 520.1 466.3 425 -18.3% -0.4%Asia-South East 49.07 57.94 64.74 31.9% 0.6% 1.042 0.328 -0.04 159 136.3 114.8 -27.8% -0.6%Asia-West 67.61 70.96 75 10.9% 0.2% 1.782 1.067 0.421 71.68 79.69 70.83 -1.2% 0.0%Oceania 71.98 72.98 75.14 4.4% 0.1% 1.164 0.699 0.347 7.998 8.774 8.589 7.4% 0.1%Asia with Oceania 44.62 54.67 63.46 42.2% 0.7% 0.964 0.463 0.016 1059 942.4 841.4 -20.5% -0.5%
Europe-East 69.72 75.14 80.3 15.2% 0.3% -0.264 -0.472 -0.87 42.56 30.83 24.75 -41.8% -1.1%Europe-North 83.98 85.85 87.63 4.3% 0.1% 0.388 0.025 -0.161 16.76 15.87 14.95 -10.8% -0.2%Europe-South 68.93 75.09 80.14 16.3% 0.3% 0.069 -0.406 -0.859 21.76 16.33 13.64 -37.3% -0.9%Europe-West 78.43 82.98 86.01 9.7% 0.2% 0.196 -0.219 -0.424 29.39 25.87 23.27 -20.8% -0.5%Europe 73.99 79.04 83.21 12.5% 0.2% 0.009 -0.315 -0.627 109.1 87.86 75.78 -30.5% -0.7%
VOL2_15 Forecast Tables rev.indd 197 21/08/2009 09:00

Patterns of Potential Hum
an Progress Volume 2: Enhancing Global Education
198
Patterns of Potential Human Progress Multination Regional Analysis Measures of Poverty, Health, Education, Infrastructure, and Governance
Base Case: Countries in Year 2060
Descending Population Sequence
Population, Land Area, and Human Development Index Urban Population Population Growth Rate Population Below 15 Years
Percent Percent Million People
2010 2035 2060 % Chg % An Chg 2010 2035 2060 2010 2035 2060 % Chg % An Chg
AFRICAEthiopia 18.91 24.96 33 74.5% 1.1% 2.539 1.946 1.042 34.1 52.8 59.27 73.8% 1.1%
Uganda 15.41 28.39 43 179.0% 2.1% 3.462 2.293 0.935 16.57 28.06 24.76 49.4% 0.8%
Tanzania, United Rep. of 26.76 34.51 46.92 75.3% 1.1% 2.628 1.64 0.834 19.15 25.67 19.8 3.4% 0.1%
Kenya 23.91 33.36 44.93 87.9% 1.3% 2.671 1.498 0.62 16.64 21.49 16.46 -1.1% 0.0%
Madagascar 28.58 32.59 39.25 37.3% 0.6% 2.536 1.768 0.921 8.846 12.99 13.78 55.8% 0.9%
Mozambique 41.37 49.87 61.04 47.5% 0.8% 2.46 1.589 0.749 9.733 12.73 9.827 1.0% 0.0%
Malawi 19.87 25.77 33.63 69.3% 1.1% 2.826 2.056 0.596 6.779 10.43 10.36 52.8% 0.9%
Zambia 33.6 37.29 45.97 36.8% 0.6% 2.598 1.905 0.529 5.876 8.715 7.461 27.0% 0.5%
Burundi 11.74 17.5 28.39 141.8% 1.8% 3.175 2.399 1.294 3.924 7.207 8.812 124.6% 1.6%
Rwanda 27.47 36.89 42.73 55.6% 0.9% 3.023 1.964 0.852 4.472 7.198 7.755 73.4% 1.1%
Somalia 33.78 36.58 43.28 28.1% 0.5% 1.916 1.715 2.042 4.004 5.543 8.589 114.5% 1.5%
Zimbabwe 38.49 44.28 52.05 35.2% 0.6% 2.113 0.787 -0.005 5.389 5.387 4.433 -17.7% -0.4%
Eritrea 20.77 24.1 28.13 35.4% 0.6% 2.797 1.846 1.173 2.208 3.073 3.916 77.4% 1.2%
Mauritius 44.83 57.16 68.47 52.7% 0.9% 0.694 0.249 -0.181 0.289 0.252 0.218 -24.6% -0.6%
Comoros 39.77 43.13 48.55 22.1% 0.4% 2.094 1.466 0.748 0.26 0.344 0.338 30.0% 0.5%
Djibouti 94.72 98.76 96.61 2.0% 0.0% 1.194 0.457 -0.308 0.301 0.329 0.246 -18.3% -0.4%
Africa-Eastern 24.85 31.78 41.2 65.8% 1.0% 2.664 1.821 0.888 138.5 202.2 196 41.5% 0.7%
Congo; Dem. Rep. of 33.16 37.06 44.6 34.5% 0.6% 3.18 2.862 1.889 32.29 64.13 95.24 195.0% 2.2%
Angola 59.52 65.02 65.26 9.6% 0.2% 2.819 2.302 1.627 8.34 14.01 19.11 129.1% 1.7%
Cameroon 64.95 69.57 70.9 9.2% 0.2% 2.324 1.637 0.657 7.321 10.13 10.18 39.1% 0.7%
Chad 29.13 36.99 42.74 46.7% 0.8% 3.105 2.427 1.746 5.139 9.12 13.16 156.1% 1.9%
Central African Republic 40.67 44.35 50.13 23.3% 0.4% 2.268 1.926 1.06 1.855 2.872 3.377 82.0% 1.2%
Congo, Rep. of 56.4 59.71 61.99 9.9% 0.2% 2.462 1.674 0.704 1.846 2.551 2.58 39.8% 0.7%
Gabon 84.13 89.21 88.68 5.4% 0.1% 1.833 1.107 0.426 0.505 0.593 0.553 9.5% 0.2%
Equatorial Guinea 43.08 61.08 69.79 62.0% 1.0% 2.261 1.578 0.838 0.233 0.291 0.31 33.0% 0.6%
São Tomé and Príncipe 59.85 62.51 63.96 6.9% 0.1% 2.38 1.719 0.927 0.069 0.098 0.112 62.3% 1.0%
Africa-Middle 42.97 46.43 50.69 18.0% 0.3% 2.919 2.508 1.658 57.6 103.8 144.6 151.0% 1.9%
Egypt 43.24 51.6 62 43.4% 0.7% 1.717 0.758 0.346 25.91 21.91 19.42 -25.0% -0.6%
Sudan 46.96 53.68 58.14 23.8% 0.4% 2.151 1.481 0.744 15.5 20.19 19.98 28.9% 0.5%
Algeria 67.18 70.21 71.54 6.5% 0.1% 1.421 0.456 -0.216 9.45 8.195 7.25 -23.3% -0.5%
Morocco 62.01 65.47 69.35 11.8% 0.2% 1.224 0.348 -0.013 8.853 7.615 6.601 -25.4% -0.6%
Tunisia 67.67 71.75 77.44 14.4% 0.3% 0.991 0.413 -0.053 2.481 2.238 1.953 -21.3% -0.5%
Libyan Arab Jamahiriya 87.53 88.49 88.57 1.2% 0.0% 1.909 0.802 0.073 1.939 1.639 1.593 -17.8% -0.4%
Africa-Northern 53.65 59.13 64.78 20.7% 0.4% 1.643 0.806 0.299 64.14 61.79 56.8 -11.4% -0.2%
VOL2_15 Forecast Tables rev.indd 198 21/08/2009 09:00

199Forecast Tables
Patterns of Potential Human Progress Multination Regional Analysis Measures of Poverty, Health, Education, Infrastructure, and Governance
Base Case: Countries in Year 2060
Descending Population Sequence
Population, Land Area, and Human Development Index Urban Population Population Growth Rate Population Below 15 Years
Percent Percent Million People
2010 2035 2060 % Chg % An Chg 2010 2035 2060 2010 2035 2060 % Chg % An Chg
AFRICA continuedSouth Africa 64.43 70.69 76 18.0% 0.3% 1.065 0.449 -0.037 15.15 12.04 10.23 -32.5% -0.8%
Namibia 40.59 53.09 64.31 58.4% 0.9% 1.812 0.979 0.494 0.773 0.855 0.697 -9.8% -0.2%
Lesotho 22.97 33.1 44.99 95.9% 1.4% 1.529 0.779 0.099 0.737 0.752 0.55 -25.4% -0.6%
Botswana 67.78 77.56 81.9 20.8% 0.4% 1.471 0.58 -0.124 0.628 0.516 0.429 -31.7% -0.8%
Swaziland 28.97 44 56.39 94.6% 1.3% 1.755 0.974 0.139 0.447 0.503 0.377 -15.7% -0.3%
Africa-Southern 61.43 67.99 73.82 20.2% 0.4% 1.138 0.505 -0.002 17.74 14.66 12.29 -30.7% -0.7%
Nigeria 56.67 61.69 63.79 12.6% 0.2% 2.553 1.742 0.943 63.66 89.33 98.6 54.9% 0.9%
Niger 17.68 23.74 32.56 84.2% 1.2% 3.071 2.334 1.315 7.484 12.67 15.24 103.6% 1.4%
Côte d’Ivoire 48.47 52.03 56.23 16.0% 0.3% 2.483 1.759 0.785 8.088 12.02 12.55 55.2% 0.9%
Ghana 53.19 57.05 59.22 11.3% 0.2% 1.977 1.245 0.457 8.961 11.49 10.87 21.3% 0.4%
Burkina Faso 22.43 32.01 42.02 87.3% 1.3% 2.818 2.146 1.075 6.755 10.95 12.28 81.8% 1.2%
Mali 28.73 34.78 42.4 47.6% 0.8% 2.812 2.052 1.07 7.158 11.04 12.44 73.8% 1.1%
Senegal 43.15 46 51.31 18.9% 0.3% 2.59 1.929 1.128 5.406 8.454 9.684 79.1% 1.2%
Guinea 34.94 40.97 47.78 36.7% 0.6% 2.11 2.056 1.223 4.41 6.819 7.831 77.6% 1.2%
Benin 42.86 46.18 50.87 18.7% 0.3% 2.639 1.868 0.939 4.114 6.139 6.559 59.4% 0.9%
Togo 44.77 48.1 48.95 9.3% 0.2% 2.512 1.424 0.815 2.879 4.083 4.744 64.8% 1.0%
Sierra Leone 42.02 47.22 56.46 34.4% 0.6% 2.427 1.877 0.979 2.703 4.026 4.221 56.2% 0.9%
Liberia 66.93 72.11 74.14 10.8% 0.2% 3.196 2.435 2.045 1.815 3.305 5.422 198.7% 2.2%
Mauritania 40.34 43.46 47.94 18.8% 0.3% 2.338 1.756 1.171 1.327 1.944 2.315 74.5% 1.1%
Guinea-Bissau 30.18 32.66 37.36 23.8% 0.4% 3.035 2.469 1.655 0.876 1.555 2.209 152.2% 1.9%
Gambia 65.98 74.09 74.11 12.3% 0.2% 2.21 1.686 1.131 0.669 0.957 1.111 66.1% 1.0%
Cape Verde 61.55 66.6 73.79 19.9% 0.4% 2.155 0.909 0.46 0.21 0.22 0.181 -13.8% -0.3%
Africa-Western 47.98 52.48 56.13 17.0% 0.3% 2.548 1.817 0.991 126.5 185 206.3 63.1% 1.0%
VOL2_15 Forecast Tables rev.indd 199 21/08/2009 09:01

Patterns of Potential Hum
an Progress Volume 2: Enhancing Global Education
200
Patterns of Potential Human Progress Multination Regional Analysis Measures of Poverty, Health, Education, Infrastructure, and Governance
Base Case: Countries in Year 2060
Descending Population Sequence
Population, Land Area, and Human Development Index Urban Population Population Growth Rate Population Below 15 Years
Percent Percent Million People
2010 2035 2060 % Chg % An Chg 2010 2035 2060 2010 2035 2060 % Chg % An Chg
AMERICASHaiti 45.56 49.03 52.58 15.4% 0.3% 1.775 1.158 0.487 3.381 4.368 4.305 27.3% 0.5%
Dominican Republic 74.42 78.9 82.85 11.3% 0.2% 1.336 0.554 0.179 3.038 2.401 2.021 -33.5% -0.8%
Cuba 76.4 79.12 83.16 8.8% 0.2% 0.198 -0.344 -0.493 1.984 1.534 1.22 -38.5% -1.0%
Puerto Rico 100 99.69 99.3 -0.7% 0.0% 0.724 0.28 -0.068 0.814 0.757 0.695 -14.6% -0.3%
Jamaica 55.17 60.45 65.38 18.5% 0.3% 0.724 0.207 -0.228 0.795 0.628 0.498 -37.4% -0.9%
Trinidad and Tobago 19.99 46.97 63.67 218.5% 2.3% 0.411 -0.183 -0.507 0.277 0.215 0.17 -38.6% -1.0%
Bahamas 93.87 96.24 95.63 1.9% 0.0% 0.89 0.359 -0.119 0.085 0.073 0.063 -25.9% -0.6%
Barbados 60.99 69.18 76.39 25.3% 0.5% 0.31 -0.249 -0.818 0.047 0.036 0.029 -38.3% -1.0%
St. Vincent & the Grenadines 47.6 55.85 64.96 36.5% 0.6% 1.27 0.634 0.21 0.035 0.03 0.027 -22.9% -0.5%
Grenada 33.45 47.9 60.54 81.0% 1.2% 1.273 0.641 0.292 0.033 0.03 0.026 -21.2% -0.5%
St. Lucia 31.79 47.98 61.09 92.2% 1.3% 0.447 -0.23 -0.503 0.043 0.032 0.022 -48.8% -1.3%
America-Caribbean 67.33 69.97 72.56 7.8% 0.1% 0.958 0.433 0.072 10.53 10.1 9.076 -13.8% -0.3%
Guatemala 49.77 55.77 62.36 25.3% 0.5% 2.533 1.579 0.74 5.912 7.748 6.52 10.3% 0.2%
Honduras 46.78 52.58 59.1 26.3% 0.5% 1.908 0.715 0.278 2.902 2.717 2.226 -23.3% -0.5%
El Salvador 61.78 65.97 70.65 14.4% 0.3% 1.458 0.612 0.163 2.373 1.964 1.678 -29.3% -0.7%
Nicaragua 64.49 67.09 71.57 11.0% 0.2% 1.877 0.68 0.095 1.932 1.722 1.466 -24.1% -0.6%
Costa Rica 66.66 73.3 79.19 18.8% 0.3% 1.307 0.619 -0.021 1.189 1.048 0.923 -22.4% -0.5%
Panama 76.84 82.31 84.72 10.3% 0.2% 1.281 0.641 -0.011 0.999 0.813 0.693 -30.6% -0.7%
Belize 51.73 61.07 70.5 36.3% 0.6% 1.747 0.817 0.197 0.111 0.099 0.083 -25.2% -0.6%
America-Central 57.13 61.6 66.9 17.1% 0.3% 1.917 1.013 0.394 15.42 16.11 13.59 -11.9% -0.3%
United States of America 82.96 86.67 88.41 6.6% 0.1% 0.85 0.473 0.308 61.05 61.73 62.31 2.1% 0.0%
Mexico 77.63 79.57 82.48 6.2% 0.1% 0.97 0.312 -0.203 30.31 24.45 19.25 -36.5% -0.9%
Canada 82.02 86.04 88.23 7.6% 0.1% 0.817 0.323 0.168 5.363 5.46 5.65 5.4% 0.1%
America-North 81.61 84.91 87.03 6.6% 0.1% 0.876 0.423 0.18 96.73 91.63 87.21 -9.8% -0.2%
Brazil 86.84 88.67 88.98 2.5% 0.0% 1.073 0.443 0.11 52.68 43.9 38.01 -27.8% -0.7%
Colombia 73.09 75.91 80.65 10.3% 0.2% 1.213 0.505 0.183 13.56 11.4 9.877 -27.2% -0.6%
Argentina 90.7 90.67 90.26 -0.5% 0.0% 0.918 0.523 0.042 10.08 8.821 7.769 -22.9% -0.5%
Venezuela, RB 96.68 98.34 97.59 0.9% 0.0% 1.534 0.688 0.129 8.475 7.206 6.399 -24.5% -0.6%
Peru 71.93 75.01 79.74 10.9% 0.2% 1.258 0.58 0.105 8.654 7.187 6.202 -28.3% -0.7%
Chile 90.01 91.79 91.16 1.3% 0.0% 0.845 0.458 -0.188 3.759 3.439 3.029 -19.4% -0.4%
Ecuador 64.06 66.16 67.62 5.6% 0.1% 1.485 0.558 -0.04 4.305 3.643 3.149 -26.9% -0.6%
Bolivia 67.4 71.79 76.85 14.0% 0.3% 1.792 0.801 0.397 3.578 3.253 2.823 -21.1% -0.5%
Paraguay 61.85 64.49 67.74 9.5% 0.2% 1.808 0.666 0.275 2.161 2.029 1.739 -19.5% -0.4%
Uruguay 88.31 88.96 89.01 0.8% 0.0% 0.39 0.22 -0.15 0.782 0.67 0.57 -27.1% -0.6%
Guyana 29.94 41.59 53.87 79.9% 1.2% -0.134 -0.506 -0.488 0.218 0.138 0.097 -55.5% -1.6%
Suriname 76.2 78.08 81.54 7.0% 0.1% 0.505 -0.268 -0.508 0.132 0.095 0.067 -49.2% -1.3%
America-South 83.47 85.27 86.49 3.6% 0.1% 1.147 0.503 0.105 108.4 91.79 79.73 -26.4% -0.6%
VOL2_15 Forecast Tables rev.indd 200 21/08/2009 09:01

201Forecast Tables
Patterns of Potential Human Progress Multination Regional Analysis Measures of Poverty, Health, Education, Infrastructure, and Governance
Base Case: Countries in Year 2060
Descending Population Sequence
Population, Land Area, and Human Development Index Urban Population Population Growth Rate Population Below 15 Years
Percent Percent Million People
2010 2035 2060 % Chg % An Chg 2010 2035 2060 2010 2035 2060 % Chg % An Chg
ASIA WITH OCEANIAChina 46.64 59.95 70.86 51.9% 0.8% 0.532 0.246 -0.382 264.4 224 200 -24.4% -0.6%
Japan 68.41 76.6 81.82 19.6% 0.4% -0.059 -0.757 -1.012 17.13 12.26 9.71 -43.3% -1.1%
Korea, Rep. of 84.4 87.81 88.11 4.4% 0.1% 0.287 -0.476 -1.301 7.612 5.143 3.716 -51.2% -1.4%
Taiwan 78.35 81.29 84.33 7.6% 0.1% 0.797 0.238 -0.403 4.811 4.113 3.705 -23.0% -0.5%
Korea, Dem. Rep. of 67.44 70.86 73.14 8.5% 0.2% 0.284 -0.252 -0.383 4.843 4.26 3.596 -25.7% -0.6%
Hong Kong 99.34 100 100 0.7% 0.0% 0.959 0.302 -0.068 0.971 0.886 0.937 -3.5% -0.1%
Mongolia 56.44 59.64 66.74 18.2% 0.3% 1.217 0.439 0.016 0.721 0.612 0.527 -26.9% -0.6%
Asia-East 50.63 62.58 72.25 42.7% 0.7% 0.48 0.151 -0.436 300.4 251.3 222.2 -26.0% -0.6%
India 32 44.45 57.52 79.8% 1.2% 1.087 0.477 0.144 344.3 264.8 223.7 -35.0% -0.9%
Pakistan 37.9 45.32 52.06 37.4% 0.6% 2.076 1.318 0.565 58.85 80.59 78 32.5% 0.6%
Bangladesh 29.95 38.39 48.02 60.3% 0.9% 1.493 0.414 -0.013 50.18 41.95 33.52 -33.2% -0.8%
Afghanistan 21.94 27.46 32.33 47.4% 0.8% 3.253 2.778 2.005 16.69 33.1 52.08 212.0% 2.3%
Iran, Islamic Rep. of 72.32 77.2 79.42 9.8% 0.2% 1.182 0.617 -0.085 18.08 16.49 14.62 -19.1% -0.4%
Nepal 20.6 31.49 40.61 97.1% 1.4% 1.626 0.748 0.121 10.38 11.04 8.322 -19.8% -0.4%
Uzbekistan 37.42 43.94 50.96 36.2% 0.6% 1.153 0.286 -0.278 7.889 6.457 5.167 -34.5% -0.8%
Sri Lanka 18.39 35.88 51.95 182.5% 2.1% 0.668 -0.055 -0.256 4.518 3.913 3.246 -28.2% -0.7%
Kazakhstan 58.58 67.35 74.76 27.6% 0.5% 0.025 -0.189 -0.508 3.409 2.626 2.01 -41.0% -1.1%
Tajikistan 25.67 34.47 44.81 74.6% 1.1% 1.54 0.717 0.107 2.483 2.527 1.934 -22.1% -0.5%
Turkmenistan 47.86 55.12 62 29.5% 0.5% 1.339 0.679 -0.115 1.444 1.254 1.116 -22.7% -0.5%
Kyrgyzstan 35.42 39.63 46.39 31.0% 0.5% 1.172 0.188 -0.347 1.521 1.261 1.035 -32.0% -0.8%
Bhutan 16.55 37.12 53.98 226.2% 2.4% 1.326 0.746 0.396 0.192 0.202 0.172 -10.4% -0.2%
Maldives 31.03 46.91 62.6 101.7% 1.4% 1.748 0.879 0.239 0.106 0.099 0.091 -14.2% -0.3%
Asia-South Central 33.9 44.61 55 62.2% 1.0% 1.272 0.655 0.271 520.1 466.3 425 -18.3% -0.4%
Indonesia 54.49 61.09 64.53 18.4% 0.3% 0.909 0.249 -0.163 61.83 49.91 41.43 -33.0% -0.8%
Philippines 68.32 72.28 76.63 12.2% 0.2% 1.749 0.542 0.134 31.18 28.53 23.48 -24.7% -0.6%
Vietnam 30.56 43.93 56.38 84.5% 1.2% 0.918 0.357 0.026 22.45 19.77 17.14 -23.7% -0.5%
Thailand 35.93 50.96 63.02 75.4% 1.1% 0.516 0.038 -0.182 13.73 11.78 10.29 -25.1% -0.6%
Myanmar 31.19 37.81 45.93 47.3% 0.8% 0.579 -0.124 -0.343 12.99 9.827 7.922 -39.0% -1.0%
Malaysia 75.6 82.21 84.31 11.5% 0.2% 1.53 0.762 0.127 8.011 6.844 6.156 -23.2% -0.5%
Cambodia 24.77 39.21 51.9 109.5% 1.5% 1.825 0.945 0.422 5.157 5.761 4.727 -8.3% -0.2%
Lao PDR 24.07 38.78 54.3 125.6% 1.6% 1.844 0.727 0.439 2.264 2.16 1.819 -19.7% -0.4%
Singapore 100 99.83 100 0.0% 0.0% 1.161 0.088 -0.187 0.727 0.679 0.634 -12.8% -0.3%
Timor-Leste 24.4 32.73 45.13 85.0% 1.2% 4.833 2.163 0.992 0.56 0.975 1.065 90.2% 1.3%
Brunei Darussalam 77.57 83.6 86.02 10.9% 0.2% 1.904 0.998 0.352 0.118 0.117 0.112 -5.1% -0.1%
Asia-South East 49.07 57.94 64.74 31.9% 0.6% 1.042 0.328 -0.04 159 136.3 114.8 -27.8% -0.6%
VOL2_15 Forecast Tables rev.indd 201 21/08/2009 09:01

Patterns of Potential Hum
an Progress Volume 2: Enhancing Global Education
202
Patterns of Potential Human Progress Multination Regional Analysis Measures of Poverty, Health, Education, Infrastructure, and Governance
Base Case: Countries in Year 2060
Descending Population Sequence
Population, Land Area, and Human Development Index Urban Population Population Growth Rate Population Below 15 Years
Percent Percent Million People
2010 2035 2060 % Chg % An Chg 2010 2035 2060 2010 2035 2060 % Chg % An Chg
ASIA WITH OCEANIA continuedTurkey 70.69 74.98 79.9 13.0% 0.2% 1.015 0.51 -0.072 19.9 16.76 14.29 -28.2% -0.7%
Yemen 32.12 42.95 51.61 60.7% 1.0% 2.955 1.973 0.93 10.47 16.03 15.96 52.4% 0.8%
Iraq 71.36 74.03 79.87 11.9% 0.2% 2.633 1.551 0.765 12.12 16.02 12.94 6.8% 0.1%
Saudi Arabia 82.37 83.88 85.58 3.9% 0.1% 2.249 1.336 0.584 8.419 10.29 9.327 10.8% 0.2%
Syria 51.48 55.58 61.65 19.8% 0.4% 2.306 1.108 0.497 7.425 8.244 7.081 -4.6% -0.1%
Israel 92.54 92.35 92.34 -0.2% 0.0% 1.707 0.904 0.426 2.067 1.852 1.776 -14.1% -0.3%
Azerbaijan 50.97 57.64 64.85 27.2% 0.5% 1.138 0.261 -0.369 1.994 1.702 1.439 -27.8% -0.7%
Jordan 87.21 91.37 90.73 4.0% 0.1% 1.922 0.905 0.332 2.113 1.764 1.577 -25.4% -0.6%
Palestine 75.94 79.23 82.67 8.9% 0.2% 2.795 1.392 0.823 1.797 2.106 1.798 0.1% 0.0%
United Arab Emirates 80.34 89.54 89.34 11.2% 0.2% 1.749 0.556 -0.346 1.03 0.991 0.96 -6.8% -0.1%
Oman 73.72 78.86 81.46 10.5% 0.2% 2.177 1.246 0.522 0.881 1.116 1.107 25.7% 0.5%
Kuwait 100 100 100 0.0% 0.0% 2.284 1.186 0.583 0.684 0.696 0.796 16.4% 0.3%
Lebanon 100 99.56 98.7 -1.3% 0.0% 1.051 0.403 -0.031 1.004 0.842 0.709 -29.4% -0.7%
Georgia 53.36 57.47 63.04 18.1% 0.3% -0.72 -0.74 -0.866 0.705 0.437 0.339 -51.9% -1.5%
Armenia 63.97 69.13 76.9 20.2% 0.4% 0.275 -0.221 -0.534 0.542 0.39 0.304 -43.9% -1.1%
Bahrain 100 99.77 99.57 -0.4% 0.0% 1.562 0.682 0.158 0.192 0.182 0.177 -7.8% -0.2%
Qatar 98.46 99.77 99.23 0.8% 0.0% 1.331 0.391 -0.237 0.191 0.164 0.155 -18.8% -0.4%
Cyprus 73.54 80.48 83.94 14.1% 0.3% 0.504 -0.191 -0.682 0.135 0.109 0.088 -34.8% -0.9%
Asia-West 67.61 70.96 75 10.9% 0.2% 1.782 1.067 0.421 71.68 79.69 70.83 -1.2% 0.0%
Australia 89.18 89.94 90.56 1.5% 0.0% 0.974 0.498 0.313 3.91 4.081 4.254 8.8% 0.2%
Papua New Guniea 16.93 30.7 42.79 152.7% 1.9% 2.027 1.399 0.593 2.522 3.135 2.96 17.4% 0.3%
New Zealand 87.3 88.32 88.93 1.9% 0.0% 0.685 0.287 -0.087 0.845 0.793 0.731 -13.5% -0.3%
Solomon Islands 20.54 32.82 42.19 105.4% 1.5% 2.197 1.471 0.783 0.204 0.267 0.283 38.7% 0.7%
Fiji 52.81 57.34 63.06 19.4% 0.4% 0.698 -0.219 -0.488 0.274 0.219 0.147 -46.4% -1.2%
Vanuatu 28.16 41.33 51.92 84.4% 1.2% 2.226 1.266 0.608 0.088 0.108 0.088 0.0% 0.0%
Micronesia 24.31 39.07 52.5 116.0% 1.6% 2.133 1.137 0.654 0.044 0.053 0.043 -2.3% 0.0%
Tonga 25.71 39.55 52.12 102.7% 1.4% 2.075 1.282 0.691 0.038 0.051 0.043 13.2% 0.2%
Samoa 26.42 41.84 54.54 106.4% 1.5% 0.473 0.18 -0.369 0.073 0.067 0.04 -45.2% -1.2%
Oceania 71.98 72.98 75.14 4.4% 0.1% 1.164 0.699 0.347 7.998 8.774 8.589 7.4% 0.1%
VOL2_15 Forecast Tables rev.indd 202 21/08/2009 09:01

203Forecast Tables
Patterns of Potential Human Progress Multination Regional Analysis Measures of Poverty, Health, Education, Infrastructure, and Governance
Base Case: Countries in Year 2060
Descending Population Sequence
Population, Land Area, and Human Development Index Urban Population Population Growth Rate Population Below 15 Years
Percent Percent Million People
2010 2035 2060 % Chg % An Chg 2010 2035 2060 2010 2035 2060 % Chg % An Chg
EUROPERussian Federation 74.34 79.32 83.28 12.0% 0.2% -0.219 -0.412 -0.883 20.79 15.55 12.65 -39.2% -1.0%
Ukraine 69.6 74.39 80.17 15.2% 0.3% -0.743 -0.664 -0.865 6.129 3.972 3.082 -49.7% -1.4%
Poland 63.34 70.37 77.61 22.5% 0.4% 0.025 -0.447 -0.931 5.605 4.061 3.213 -42.7% -1.1%
Romania 55.44 63.35 70.99 28.0% 0.5% -0.186 -0.485 -0.799 3.258 2.32 1.822 -44.1% -1.2%
Czech Republic 73.58 76.89 81.35 10.6% 0.2% 0.049 -0.437 -0.809 1.413 1.088 0.917 -35.1% -0.9%
Belarus 74.07 78.29 82.66 11.6% 0.2% -0.151 -0.358 -0.747 1.394 1.032 0.85 -39.0% -1.0%
Hungary 67.75 73.62 79.37 17.2% 0.3% -0.264 -0.552 -0.891 1.46 1.083 0.859 -41.2% -1.1%
Bulgaria 71.43 74.62 79.47 11.3% 0.2% -0.762 -0.708 -0.924 0.988 0.647 0.511 -48.3% -1.3%
Slovakia 58.11 66.73 74.24 27.8% 0.5% 0.149 -0.427 -0.822 0.818 0.608 0.486 -40.6% -1.0%
Moldova, Rep. of 43.84 48.25 56.29 28.4% 0.5% -0.278 -0.667 -0.641 0.704 0.473 0.356 -49.4% -1.4%
Europe-East 69.72 75.14 80.3 15.2% 0.3% -0.264 -0.472 -0.87 42.56 30.83 24.75 -41.8% -1.1%
United Kingdom 89.05 88.87 89.43 0.4% 0.0% 0.436 0.065 -0.131 10.63 10.2 9.694 -8.8% -0.2%
Sweden 84.31 86.2 87.79 4.1% 0.1% 0.288 -0.094 -0.218 1.467 1.421 1.326 -9.6% -0.2%
Denmark 85.26 86.68 88.24 3.5% 0.1% 0.322 0.036 -0.033 0.98 0.933 0.872 -11.0% -0.2%
Ireland 63.4 73.84 80.35 26.7% 0.5% 1.009 0.43 0.078 0.894 0.842 0.827 -7.5% -0.2%
Norway 79.48 84.2 86.71 9.1% 0.2% 0.536 0.205 0.033 0.869 0.848 0.81 -6.8% -0.1%
Finland 63.38 73.39 80.08 26.3% 0.5% 0.297 -0.213 -0.228 0.872 0.824 0.758 -13.1% -0.3%
Lithuania 68.05 73.44 79.16 16.3% 0.3% -0.188 -0.528 -0.93 0.49 0.373 0.297 -39.4% -1.0%
Latvia 69.32 74.81 80.37 15.9% 0.3% -0.233 -0.467 -0.958 0.305 0.239 0.198 -35.1% -0.9%
Estonia 71.42 77.39 82.14 15.0% 0.3% -0.661 -0.542 -0.878 0.193 0.13 0.115 -40.4% -1.0%
Iceland 92.99 92.6 92.18 -0.9% 0.0% 0.629 0.129 -0.259 0.063 0.056 0.049 -22.2% -0.5%
Europe-North 83.98 85.85 87.63 4.3% 0.1% 0.388 0.025 -0.161 16.76 15.87 14.95 -10.8% -0.2%
Italy 68.77 75.26 80.8 17.5% 0.3% -0.066 -0.504 -0.94 8.021 6.031 5.028 -37.3% -0.9%
Spain 77.67 81.44 84.53 8.8% 0.2% 0.221 -0.324 -0.972 6.461 4.714 4.003 -38.0% -1.0%
Greece 62.24 72.88 79.7 28.1% 0.5% 0.14 -0.367 -0.734 1.553 1.207 1.054 -32.1% -0.8%
Portugal 62.36 71.92 78.29 25.5% 0.5% 0.1 -0.25 -0.659 1.649 1.272 1.088 -34.0% -0.8%
Serbia 67.74 70.84 75.26 11.1% 0.2% -0.202 -0.38 -0.514 1.263 0.939 0.738 -41.6% -1.1%
Croatia 58.46 66.49 74.43 27.3% 0.5% -0.179 -0.509 -0.741 0.645 0.502 0.41 -36.4% -0.9%
Bosnia and Herzegovina 45.41 52.03 60.9 34.1% 0.6% 0.492 -0.593 -0.737 0.643 0.459 0.361 -43.9% -1.1%
Albania 48.13 57.16 66.42 38.0% 0.6% 0.355 -0.141 -0.455 0.718 0.586 0.457 -36.4% -0.9%
Macedonia, TFYR 72.08 74.35 75.78 5.1% 0.1% 0.233 -0.453 -0.594 0.362 0.281 0.226 -37.6% -0.9%
Slovenia 53.74 66.2 75.41 40.3% 0.7% 0.037 -0.562 -1.071 0.269 0.197 0.161 -40.1% -1.0%
Montenegro 66.19 69.46 74.53 12.6% 0.2% 0.276 -0.169 -0.207 0.114 0.093 0.079 -30.7% -0.7%
Malta 97.98 99.46 98.77 0.8% 0.0% 0.266 -0.334 -0.801 0.064 0.05 0.04 -37.5% -0.9%
Europe-South 68.93 75.09 80.14 16.3% 0.3% 0.069 -0.406 -0.859 21.76 16.33 13.64 -37.3% -0.9%
Germany 76.81 81.92 85.33 11.1% 0.2% 0.041 -0.418 -0.607 11.1 9.522 8.52 -23.2% -0.5%
France 77.36 81.51 84.83 9.7% 0.2% 0.342 -0.005 -0.249 11.21 10.05 9.088 -18.9% -0.4%
Netherlands 83.61 87.61 88.75 6.1% 0.1% 0.453 0.002 -0.148 2.936 2.72 2.523 -14.1% -0.3%
Belgium 96.58 95.61 95.57 -1.0% 0.0% 0.272 -0.12 -0.293 1.737 1.598 1.47 -15.4% -0.3%
Austria 68.12 76.4 81.66 19.9% 0.4% 0.031 -0.494 -0.871 1.196 0.963 0.8 -33.1% -0.8%
Switzerland 78.75 84.28 86.41 9.7% 0.2% 0.138 -0.438 -0.8 1.122 0.914 0.752 -33.0% -0.8%
Luxembourg 83.55 86.77 89.2 6.8% 0.1% 1.21 0.883 0.83 0.086 0.1 0.118 37.2% 0.6%
Europe-West 78.43 82.98 86.01 9.7% 0.2% 0.196 -0.219 -0.424 29.39 25.87 23.27 -20.8% -0.5%
VOL2_15 Forecast Tables rev.indd 203 21/08/2009 09:01

Patterns of Potential Hum
an Progress Volume 2: Enhancing Global Education
204
Patterns of Potential Human Progress Multination Regional Analysis Measures of Poverty, Health, Education, Infrastructure, and Governance
Base Case
Source: International Futures Version 6.12, March 2009
Population, Land Area, and Human Development IndexPopulation 65 Years and Above Youth Bulge Human Development Index
Million People Ratio Index
2010 2035 2060 % Chg % An Chg 2010 2035 2060 % Chg % An Chg 2010 2035 2060 % Chg % An Chg
World 538.6 1198 2052 281.0% 2.7% 0.358 0.28 0.235 -34.4% -0.8% 0.733 0.836 0.912 24.4% 0.4%
Africa 36.41 87.88 225.8 520.2% 3.7% 0.48 0.414 0.341 -29.0% -0.7% 0.543 0.673 0.79 45.5% 0.8%Americas 87.38 190.8 298.8 242.0% 2.5% 0.328 0.243 0.2 -39.0% -1.0% 0.872 0.937 0.985 13.0% 0.2%Asia with Oceania 292.2 730.2 1319 351.4% 3.1% 0.357 0.258 0.204 -42.9% -1.1% 0.718 0.85 0.941 31.1% 0.5%Europe 121.4 187.3 205.3 69.1% 1.1% 0.231 0.176 0.161 -30.3% -0.7% 0.907 0.971 0.995 9.7% 0.2%World 538.6 1198 2052 281.0% 2.7% 0.358 0.28 0.235 -34.4% -0.8% 0.733 0.836 0.912 24.4% 0.4%
Africa-Eastern 9.817 24 69.15 604.4% 4.0% 0.506 0.436 0.341 -32.6% -0.8% 0.501 0.661 0.81 61.7% 1.0%Africa-Middle 3.853 8.72 21.88 467.9% 3.5% 0.505 0.487 0.427 -15.4% -0.3% 0.454 0.585 0.725 59.7% 0.9%Africa-Northern 10.16 26.22 62.8 518.1% 3.7% 0.423 0.311 0.231 -45.4% -1.2% 0.689 0.815 0.923 34.0% 0.6%Africa-Southern 2.773 6.481 13.44 384.7% 3.2% 0.419 0.315 0.224 -46.5% -1.2% 0.711 0.846 0.935 31.5% 0.5%Africa-Western 9.805 22.45 58.54 497.0% 3.6% 0.494 0.424 0.35 -29.1% -0.7% 0.493 0.629 0.737 49.5% 0.8%Africa 36.41 87.88 225.8 520.2% 3.7% 0.48 0.414 0.341 -29.0% -0.7% 0.543 0.673 0.79 45.5% 0.8%
America-Caribbean 3.433 7.055 11.11 223.6% 2.4% 0.354 0.281 0.231 -34.7% -0.9% 0.758 0.832 0.912 20.3% 0.4%America-Central 2.204 5.362 12.96 488.0% 3.6% 0.444 0.34 0.244 -45.0% -1.2% 0.75 0.837 0.932 24.3% 0.4%America-North 53.24 107.2 144 170.5% 2.0% 0.286 0.219 0.196 -31.5% -0.8% 0.937 0.982 0.999 6.6% 0.1%America-South 28.51 71.14 130.7 358.4% 3.1% 0.36 0.253 0.196 -45.6% -1.2% 0.823 0.91 0.985 19.7% 0.4%Americas 87.38 190.8 298.8 242.0% 2.5% 0.328 0.243 0.2 -39.0% -1.0% 0.872 0.937 0.985 13.0% 0.2%
Asia-East 154.4 380.1 562.4 264.2% 2.6% 0.283 0.2 0.165 -41.7% -1.1% 0.808 0.948 0.998 23.5% 0.4%Asia-South Central 88.02 222.1 508.8 478.1% 3.6% 0.415 0.291 0.223 -46.3% -1.2% 0.615 0.775 0.906 47.3% 0.8%Asia-South East 34.72 86.53 162.5 368.0% 3.1% 0.374 0.267 0.205 -45.2% -1.2% 0.745 0.835 0.923 23.9% 0.4%Asia-West 11.09 33.71 75.15 577.6% 3.9% 0.405 0.318 0.242 -40.2% -1.0% 0.765 0.865 0.948 23.9% 0.4%Oceania 3.938 7.793 10.45 165.4% 2.0% 0.302 0.255 0.227 -24.8% -0.6% 0.868 0.914 0.937 7.9% 0.2%Asia with Oceania 292.2 730.2 1319 351.4% 3.1% 0.357 0.258 0.204 -42.9% -1.1% 0.718 0.85 0.941 31.1% 0.5%
Europe-East 41.87 67.08 84.02 100.7% 1.4% 0.26 0.174 0.145 -44.2% -1.2% 0.848 0.944 0.988 16.5% 0.3%Europe-North 16.9 26.04 28.35 67.8% 1.0% 0.233 0.198 0.187 -19.7% -0.4% 0.954 0.997 1 4.8% 0.1%Europe-South 28.23 41.79 43.22 53.1% 0.9% 0.199 0.162 0.151 -24.1% -0.6% 0.929 0.972 0.996 7.2% 0.1%Europe-West 35.63 54.35 52.51 47.4% 0.8% 0.211 0.176 0.173 -18.0% -0.4% 0.955 0.994 1 4.7% 0.1%Europe 121.4 187.3 205.3 69.1% 1.1% 0.231 0.176 0.161 -30.3% -0.7% 0.907 0.971 0.995 9.7% 0.2%
VOL2_15 Forecast Tables rev.indd 204 21/08/2009 09:02

205Forecast Tables
Patterns of Potential Human Progress Multination Regional Analysis Measures of Poverty, Health, Education, Infrastructure, and Governance
Base Case: Countries in Year 2060
Descending Population Sequence
Population, Land Area, and Human Development IndexPopulation 65 Years and Above Youth Bulge Human Development Index
Million People Ratio Index
2010 2035 2060 % Chg % An Chg 2010 2035 2060 % Chg % An Chg 2010 2035 2060 % Chg % An Chg
AFRICAEthiopia 2.571 6.211 16.3 534.0% 3.8% 0.493 0.424 0.364 -26.2% -0.6% 0.395 0.545 0.738 86.8% 1.3%
Uganda 0.866 2.163 7.71 790.3% 4.5% 0.544 0.484 0.36 -33.8% -0.8% 0.578 0.75 0.892 54.3% 0.9%
Tanzania, United Rep. of 1.414 3.453 10.38 634.1% 4.1% 0.498 0.429 0.3 -39.8% -1.0% 0.583 0.75 0.913 56.6% 0.9%
Kenya 1.062 3.158 9.197 766.0% 4.4% 0.509 0.425 0.293 -42.4% -1.1% 0.602 0.74 0.868 44.2% 0.7%
Madagascar 0.701 1.641 3.971 466.5% 3.5% 0.478 0.418 0.35 -26.8% -0.6% 0.545 0.652 0.767 40.7% 0.7%
Mozambique 0.769 1.812 5.084 561.1% 3.8% 0.485 0.425 0.306 -36.9% -0.9% 0.41 0.68 0.909 121.7% 1.6%
Malawi 0.462 1.009 2.88 523.4% 3.7% 0.517 0.456 0.369 -28.6% -0.7% 0.54 0.684 0.75 38.9% 0.7%
Zambia 0.41 0.837 2.679 553.4% 3.8% 0.529 0.451 0.35 -33.8% -0.8% 0.54 0.688 0.798 47.8% 0.8%
Burundi 0.236 0.602 1.746 639.8% 4.1% 0.528 0.473 0.401 -24.1% -0.5% 0.442 0.622 0.766 73.3% 1.1%
Rwanda 0.26 0.719 2.242 762.3% 4.4% 0.558 0.462 0.364 -34.8% -0.9% 0.47 0.667 0.777 65.3% 1.0%
Somalia 0.259 0.627 1.923 642.5% 4.1% 0.463 0.407 0.372 -19.7% -0.4% 0.231 0.399 0.656 184.0% 2.1%
Zimbabwe 0.528 1.139 3.688 598.5% 4.0% 0.541 0.387 0.243 -55.1% -1.6% 0.628 0.782 0.821 30.7% 0.5%
Eritrea 0.133 0.229 0.659 395.5% 3.3% 0.503 0.458 0.392 -22.1% -0.5% 0.419 0.457 0.561 33.9% 0.6%
Mauritius 0.098 0.287 0.427 335.7% 3.0% 0.302 0.22 0.184 -39.1% -1.0% 0.82 0.927 1 22.0% 0.4%
Comoros 0.019 0.048 0.133 600.0% 4.0% 0.482 0.369 0.32 -33.6% -0.8% 0.589 0.662 0.819 39.0% 0.7%
Djibouti 0.029 0.064 0.133 358.6% 3.1% 0.469 0.375 0.3 -36.0% -0.9% 0.513 0.61 0.763 48.7% 0.8%
Africa-Eastern 9.817 24 69.15 604.4% 4.0% 0.506 0.436 0.341 -32.6% -0.8% 0.501 0.661 0.81 61.7% 1.0%
Congo; Dem. Rep. of 1.902 4.244 10.44 448.9% 3.5% 0.513 0.523 0.46 -10.3% -0.2% 0.389 0.52 0.72 85.1% 1.2%
Angola 0.477 1.264 3.332 598.5% 4.0% 0.511 0.467 0.398 -22.1% -0.5% 0.542 0.732 0.766 41.3% 0.7%
Cameroon 0.689 1.502 3.867 461.2% 3.5% 0.489 0.406 0.334 -31.7% -0.8% 0.568 0.671 0.762 34.2% 0.6%
Chad 0.345 0.774 1.976 472.8% 3.6% 0.496 0.46 0.403 -18.8% -0.4% 0.402 0.573 0.641 59.5% 0.9%
Central African Republic 0.181 0.344 0.847 368.0% 3.1% 0.492 0.438 0.377 -23.4% -0.5% 0.399 0.542 0.668 67.4% 1.0%
Congo, Rep. of 0.155 0.366 0.912 488.4% 3.6% 0.479 0.417 0.334 -30.3% -0.7% 0.662 0.77 0.793 19.8% 0.4%
Gabon 0.072 0.166 0.364 405.6% 3.3% 0.445 0.346 0.28 -37.1% -0.9% 0.748 0.822 0.875 17.0% 0.3%
Equatorial Guinea 0.025 0.049 0.108 332.0% 3.0% 0.46 0.415 0.33 -28.3% -0.7% 0.74 0.853 0.864 16.8% 0.3%
São Tomé and Príncipe 0.006 0.011 0.035 483.3% 3.6% 0.512 0.39 0.337 -34.2% -0.8% 0.652 0.701 0.767 17.6% 0.3%
Africa-Middle 3.853 8.72 21.88 467.9% 3.5% 0.505 0.487 0.427 -15.4% -0.3% 0.454 0.585 0.725 59.7% 0.9%
Egypt 4.184 10.36 26.56 534.8% 3.8% 0.418 0.31 0.208 -50.2% -1.4% 0.719 0.851 0.983 36.7% 0.6%
Sudan 1.586 3.828 9.564 503.0% 3.7% 0.464 0.381 0.306 -34.1% -0.8% 0.58 0.732 0.843 45.3% 0.8%
Algeria 1.669 4.94 11.06 562.7% 3.9% 0.421 0.269 0.2 -52.5% -1.5% 0.742 0.832 0.897 20.9% 0.4%
Morocco 1.744 4.214 9.168 425.7% 3.4% 0.406 0.275 0.203 -50.0% -1.4% 0.637 0.78 0.898 41.0% 0.7%
Tunisia 0.685 1.887 4.162 507.6% 3.7% 0.376 0.236 0.177 -52.9% -1.5% 0.769 0.888 1 30.0% 0.5%
Libyan Arab Jamahiriya 0.295 0.997 2.29 676.3% 4.2% 0.399 0.294 0.204 -48.9% -1.3% 0.829 0.929 0.967 16.6% 0.3%
Africa-Northern 10.16 26.22 62.8 518.1% 3.7% 0.423 0.311 0.231 -45.4% -1.2% 0.689 0.815 0.923 34.0% 0.6%
VOL2_15 Forecast Tables rev.indd 205 21/08/2009 09:02

Patterns of Potential Hum
an Progress Volume 2: Enhancing Global Education
206
Patterns of Potential Human Progress Multination Regional Analysis Measures of Poverty, Health, Education, Infrastructure, and Governance
Base Case: Countries in Year 2060
Descending Population Sequence
Population, Land Area, and Human Development IndexPopulation 65 Years and Above Youth Bulge Human Development Index
Million People Ratio Index
2010 2035 2060 % Chg % An Chg 2010 2035 2060 % Chg % An Chg 2010 2035 2060 % Chg % An Chg
AFRICA continuedSouth Africa 2.48 5.814 11.55 365.7% 3.1% 0.407 0.307 0.221 -45.7% -1.2% 0.718 0.849 0.936 30.4% 0.5%
Namibia 0.085 0.223 0.624 634.1% 4.1% 0.495 0.356 0.239 -51.7% -1.4% 0.702 0.84 0.964 37.3% 0.6%
Lesotho 0.092 0.142 0.448 387.0% 3.2% 0.526 0.391 0.252 -52.1% -1.5% 0.581 0.765 0.88 51.5% 0.8%
Botswana 0.072 0.202 0.529 634.7% 4.1% 0.481 0.324 0.214 -55.5% -1.6% 0.737 0.898 0.976 32.4% 0.6%
Swaziland 0.044 0.1 0.293 565.9% 3.9% 0.533 0.383 0.266 -50.1% -1.4% 0.621 0.79 0.886 42.7% 0.7%
Africa-Southern 2.773 6.481 13.44 384.7% 3.2% 0.419 0.315 0.224 -46.5% -1.2% 0.711 0.846 0.935 31.5% 0.5%
Nigeria 4.755 11.5 29.31 516.4% 3.7% 0.496 0.423 0.344 -30.6% -0.7% 0.539 0.675 0.727 34.9% 0.6%
Niger 0.517 1.305 3.195 518.0% 3.7% 0.478 0.443 0.376 -21.3% -0.5% 0.346 0.5 0.698 101.7% 1.4%
Côte d’Ivoire 0.719 1.597 4.365 507.1% 3.7% 0.502 0.412 0.341 -32.1% -0.8% 0.486 0.653 0.761 56.6% 0.9%
Ghana 0.979 2.157 4.944 405.0% 3.3% 0.466 0.374 0.311 -33.3% -0.8% 0.553 0.623 0.731 32.2% 0.6%
Burkina Faso 0.407 0.828 2.87 605.2% 4.0% 0.515 0.445 0.371 -28.0% -0.7% 0.376 0.583 0.787 109.3% 1.5%
Mali 0.497 0.89 2.996 502.8% 3.7% 0.531 0.45 0.367 -30.9% -0.7% 0.399 0.573 0.762 91.0% 1.3%
Senegal 0.503 0.889 2.683 433.4% 3.4% 0.488 0.422 0.35 -28.3% -0.7% 0.504 0.639 0.789 56.5% 0.9%
Guinea 0.351 0.81 2.074 490.9% 3.6% 0.478 0.427 0.361 -24.5% -0.6% 0.418 0.628 0.784 87.6% 1.3%
Benin 0.278 0.718 1.886 578.4% 3.9% 0.496 0.428 0.353 -28.8% -0.7% 0.459 0.609 0.771 68.0% 1.0%
Togo 0.225 0.512 1.222 443.1% 3.4% 0.489 0.411 0.33 -32.5% -0.8% 0.501 0.496 0.65 29.7% 0.5%
Sierra Leone 0.23 0.453 0.924 301.7% 2.8% 0.459 0.47 0.372 -19.0% -0.4% 0.281 0.45 0.706 151.2% 1.9%
Liberia 0.091 0.242 0.697 665.9% 4.2% 0.512 0.491 0.429 -16.2% -0.4% 0.354 0.4 0.661 86.7% 1.3%
Mauritania 0.11 0.245 0.617 460.9% 3.5% 0.459 0.39 0.344 -25.1% -0.6% 0.56 0.697 0.788 40.7% 0.7%
Guinea-Bissau 0.057 0.119 0.288 405.3% 3.3% 0.495 0.482 0.425 -14.1% -0.3% 0.451 0.58 0.667 47.9% 0.8%
Gambia 0.064 0.131 0.302 371.9% 3.2% 0.443 0.393 0.342 -22.8% -0.5% 0.422 0.597 0.72 70.6% 1.1%
Cape Verde 0.021 0.053 0.175 733.3% 4.3% 0.498 0.361 0.226 -54.6% -1.6% 0.729 0.841 0.979 34.3% 0.6%
Africa-Western 9.805 22.45 58.54 497.0% 3.6% 0.494 0.424 0.35 -29.1% -0.7% 0.493 0.629 0.737 49.5% 0.8%
VOL2_15 Forecast Tables rev.indd 206 21/08/2009 09:02

207Forecast Tables
Patterns of Potential Human Progress Multination Regional Analysis Measures of Poverty, Health, Education, Infrastructure, and Governance
Base Case: Countries in Year 2060
Descending Population Sequence
Population, Land Area, and Human Development IndexPopulation 65 Years and Above Youth Bulge Human Development Index
Million People Ratio Index
2010 2035 2060 % Chg % An Chg 2010 2035 2060 % Chg % An Chg 2010 2035 2060 % Chg % An Chg
AMERICASHaiti 0.392 0.696 1.626 314.8% 2.9% 0.475 0.392 0.326 -31.4% -0.8% 0.534 0.629 0.753 41.0% 0.7%
Dominican Republic 0.599 1.47 2.867 378.6% 3.2% 0.387 0.297 0.205 -47.0% -1.3% 0.775 0.907 1 29.0% 0.5%
Cuba 1.475 2.971 3.785 156.6% 1.9% 0.246 0.176 0.148 -39.8% -1.0% 0.846 0.902 1 18.2% 0.3%
Puerto Rico 0.576 1.041 1.398 142.7% 1.8% 0.283 0.207 0.181 -36.0% -0.9% 0.913 1 1 9.5% 0.2%
Jamaica 0.209 0.411 0.713 241.1% 2.5% 0.387 0.273 0.205 -47.0% -1.3% 0.777 0.842 0.93 19.7% 0.4%
Trinidad and Tobago 0.099 0.26 0.392 296.0% 2.8% 0.358 0.225 0.175 -51.1% -1.4% 0.864 0.955 0.999 15.6% 0.3%
Bahamas 0.026 0.068 0.105 303.8% 2.8% 0.342 0.236 0.195 -43.0% -1.1% 0.877 0.943 1 14.0% 0.3%
Barbados 0.028 0.076 0.091 225.0% 2.4% 0.253 0.172 0.149 -41.1% -1.1% 0.895 0.956 1 11.7% 0.2%
St. Vincent & the Grenadines 0.008 0.018 0.046 475.0% 3.6% 0.406 0.265 0.195 -52.0% -1.5% 0.785 0.873 0.986 25.6% 0.5%
Grenada 0.008 0.016 0.039 387.5% 3.2% 0.44 0.271 0.198 -55.0% -1.6% 0.816 0.886 0.983 20.5% 0.4%
St. Lucia 0.013 0.028 0.051 292.3% 2.8% 0.379 0.236 0.175 -53.8% -1.5% 0.833 0.911 1 20.0% 0.4%
America-Caribbean 3.433 7.055 11.11 223.6% 2.4% 0.354 0.281 0.231 -34.7% -0.9% 0.758 0.832 0.912 20.3% 0.4%
Guatemala 0.626 1.303 3.763 501.1% 3.7% 0.484 0.402 0.292 -39.7% -1.0% 0.718 0.814 0.924 28.7% 0.5%
Honduras 0.343 0.825 2.132 521.6% 3.7% 0.478 0.342 0.224 -53.1% -1.5% 0.718 0.802 0.904 25.9% 0.5%
El Salvador 0.436 0.95 2.273 421.3% 3.4% 0.398 0.297 0.206 -48.2% -1.3% 0.754 0.857 0.972 28.9% 0.5%
Nicaragua 0.243 0.622 1.553 539.1% 3.8% 0.47 0.322 0.222 -52.8% -1.5% 0.71 0.771 0.861 21.3% 0.4%
Costa Rica 0.308 0.971 1.876 509.1% 3.7% 0.372 0.232 0.181 -51.3% -1.4% 0.873 0.971 1 14.5% 0.3%
Panama 0.235 0.652 1.249 431.5% 3.4% 0.355 0.257 0.191 -46.2% -1.2% 0.845 0.951 1 18.3% 0.3%
Belize 0.013 0.04 0.113 769.2% 4.4% 0.448 0.313 0.201 -55.1% -1.6% 0.765 0.9 1 30.7% 0.5%
America-Central 2.204 5.362 12.96 488.0% 3.6% 0.444 0.34 0.244 -45.0% -1.2% 0.75 0.837 0.932 24.3% 0.4%
United States of America 41.12 78.8 97.12 136.2% 1.7% 0.262 0.214 0.201 -23.3% -0.5% 0.964 1 1 3.7% 0.1%
Mexico 7.183 18.58 35.48 393.9% 3.2% 0.368 0.244 0.186 -49.5% -1.4% 0.851 0.925 0.997 17.2% 0.3%
Canada 4.93 9.872 11.37 130.6% 1.7% 0.238 0.185 0.18 -24.4% -0.6% 0.966 1 1 3.5% 0.1%
America-North 53.24 107.2 144 170.5% 2.0% 0.286 0.219 0.196 -31.5% -0.8% 0.937 0.982 0.999 6.6% 0.1%
Brazil 13.79 35.91 64.41 367.1% 3.1% 0.353 0.245 0.193 -45.3% -1.2% 0.817 0.91 0.998 22.2% 0.4%
Colombia 2.834 8.541 16.32 475.9% 3.6% 0.37 0.252 0.195 -47.3% -1.3% 0.81 0.886 0.989 22.1% 0.4%
Argentina 4.432 7.841 14.18 219.9% 2.4% 0.328 0.237 0.189 -42.4% -1.1% 0.872 0.961 1 14.7% 0.3%
Venezuela, RB 1.671 4.987 9.604 474.7% 3.6% 0.383 0.275 0.203 -47.0% -1.3% 0.849 0.926 0.971 14.4% 0.3%
Peru 1.829 4.545 9.706 430.7% 3.4% 0.395 0.263 0.2 -49.4% -1.4% 0.789 0.88 0.965 22.3% 0.4%
Chile 1.624 4.236 6.361 291.7% 2.8% 0.319 0.213 0.178 -44.2% -1.2% 0.893 0.995 1 12.0% 0.2%
Ecuador 0.93 2.237 4.078 338.5% 3.0% 0.392 0.28 0.211 -46.2% -1.2% 0.824 0.864 0.888 7.8% 0.1%
Bolivia 0.477 1.143 2.893 506.5% 3.7% 0.438 0.333 0.216 -50.7% -1.4% 0.741 0.856 0.942 27.1% 0.5%
Paraguay 0.337 0.796 1.784 429.4% 3.4% 0.437 0.322 0.219 -49.9% -1.4% 0.778 0.821 0.9 15.7% 0.3%
Uruguay 0.504 0.72 1.135 125.2% 1.6% 0.287 0.218 0.181 -36.9% -0.9% 0.868 0.946 1 15.2% 0.3%
Guyana 0.047 0.11 0.141 200.0% 2.2% 0.355 0.26 0.196 -44.8% -1.2% 0.755 0.837 0.935 23.8% 0.4%
Suriname 0.032 0.073 0.112 250.0% 2.5% 0.373 0.272 0.19 -49.1% -1.3% 0.793 0.887 0.97 22.3% 0.4%
America-South 28.51 71.14 130.7 358.4% 3.1% 0.36 0.253 0.196 -45.6% -1.2% 0.823 0.91 0.985 19.7% 0.4%
VOL2_15 Forecast Tables rev.indd 207 21/08/2009 09:02

Patterns of Potential Hum
an Progress Volume 2: Enhancing Global Education
208
Patterns of Potential Human Progress Multination Regional Analysis Measures of Poverty, Health, Education, Infrastructure, and Governance
Base Case: Countries in Year 2060
Descending Population Sequence
Population, Land Area, and Human Development IndexPopulation 65 Years and Above Youth Bulge Human Development Index
Million People Ratio Index
2010 2035 2060 % Chg % An Chg 2010 2035 2060 % Chg % An Chg 2010 2035 2060 % Chg % An Chg
ASIA WITH OCEANIAChina 113.8 315.1 493.8 333.9% 3.0% 0.293 0.206 0.168 -42.7% -1.1% 0.788 0.945 1 26.9% 0.5%
Japan 29.31 37.26 34.83 18.8% 0.3% 0.181 0.146 0.14 -22.7% -0.5% 0.968 1 1 3.3% 0.1%
Korea, Rep. of 5.779 14.8 16.73 189.5% 2.1% 0.251 0.134 0.119 -52.6% -1.5% 0.94 1 1 6.4% 0.1%
Taiwan 2.098 6.139 8.216 291.6% 2.8% 0.291 0.209 0.177 -39.2% -1.0% 0.902 0.986 1 10.9% 0.2%
Korea, Dem. Rep. of 2.393 3.971 5.065 111.7% 1.5% 0.303 0.221 0.194 -36.0% -0.9% 0.68 0.749 0.829 21.9% 0.4%
Hong Kong 0.931 2.447 2.81 201.8% 2.2% 0.22 0.151 0.151 -31.4% -0.7% 0.979 1 1 2.1% 0.0%
Mongolia 0.119 0.361 0.865 626.9% 4.0% 0.422 0.271 0.2 -52.6% -1.5% 0.748 0.813 0.925 23.7% 0.4%
Asia-East 154.4 380.1 562.4 264.2% 2.6% 0.283 0.2 0.165 -41.7% -1.1% 0.808 0.948 0.998 23.5% 0.4%
India 64.44 162.4 368.2 471.4% 3.5% 0.399 0.264 0.19 -52.4% -1.5% 0.624 0.809 0.962 54.2% 0.9%
Pakistan 7.117 16.66 43.95 517.5% 3.7% 0.474 0.369 0.291 -38.6% -1.0% 0.566 0.702 0.828 46.3% 0.8%
Bangladesh 6.213 15.49 35.45 470.6% 3.5% 0.429 0.317 0.215 -49.9% -1.4% 0.535 0.695 0.831 55.3% 0.9%
Afghanistan 0.847 2.013 5.185 512.2% 3.7% 0.508 0.498 0.45 -11.4% -0.2% 0.292 0.44 0.6 105.5% 1.5%
Iran, Islamic Rep. of 3.338 10.57 28.03 739.7% 4.3% 0.456 0.256 0.189 -58.6% -1.7% 0.798 0.912 0.964 20.8% 0.4%
Nepal 1.188 2.482 5.736 382.8% 3.2% 0.456 0.343 0.264 -42.1% -1.1% 0.52 0.629 0.77 48.1% 0.8%
Uzbekistan 1.253 3.44 7.395 490.2% 3.6% 0.44 0.26 0.202 -54.1% -1.5% 0.728 0.788 0.846 16.2% 0.3%
Sri Lanka 1.606 4.097 5.769 259.2% 2.6% 0.333 0.228 0.19 -42.9% -1.1% 0.785 0.863 0.962 22.5% 0.4%
Kazakhstan 1.205 2.852 4.245 252.3% 2.6% 0.349 0.234 0.186 -46.7% -1.3% 0.834 0.956 0.977 17.1% 0.3%
Tajikistan 0.251 0.653 1.644 555.0% 3.8% 0.496 0.347 0.235 -52.6% -1.5% 0.713 0.752 0.842 18.1% 0.3%
Turkmenistan 0.225 0.711 1.651 633.8% 4.1% 0.431 0.283 0.205 -52.4% -1.5% 0.738 0.889 0.887 20.2% 0.4%
Kyrgyzstan 0.285 0.627 1.19 317.5% 2.9% 0.418 0.286 0.219 -47.6% -1.3% 0.724 0.751 0.805 11.2% 0.2%
Bhutan 0.035 0.082 0.236 574.3% 3.9% 0.456 0.287 0.211 -53.7% -1.5% 0.614 0.784 0.953 55.2% 0.9%
Maldives 0.014 0.047 0.15 971.4% 4.9% 0.484 0.298 0.193 -60.1% -1.8% 0.783 0.928 1 27.7% 0.5%
Asia-South Central 88.02 222.1 508.8 478.1% 3.6% 0.415 0.291 0.223 -46.3% -1.2% 0.615 0.775 0.906 47.3% 0.8%
Indonesia 14.09 33 61.59 337.1% 3.0% 0.362 0.253 0.202 -44.2% -1.2% 0.744 0.83 0.906 21.8% 0.4%
Philippines 3.933 10.2 23.89 507.4% 3.7% 0.427 0.331 0.218 -48.9% -1.3% 0.755 0.821 0.919 21.7% 0.4%
Vietnam 4.817 12.5 28.2 485.4% 3.6% 0.399 0.245 0.194 -51.4% -1.4% 0.746 0.847 0.947 26.9% 0.5%
Thailand 6.029 14.69 18.78 211.5% 2.3% 0.283 0.219 0.191 -32.5% -0.8% 0.809 0.902 0.979 21.0% 0.4%
Myanmar 3.115 7.083 11.52 269.8% 2.7% 0.366 0.253 0.202 -44.8% -1.2% 0.629 0.723 0.83 32.0% 0.6%
Malaysia 1.408 5.118 10.02 611.6% 4.0% 0.382 0.267 0.199 -47.9% -1.3% 0.854 0.957 1 17.1% 0.3%
Cambodia 0.562 1.608 4.417 685.9% 4.2% 0.501 0.349 0.235 -53.1% -1.5% 0.605 0.774 0.906 49.8% 0.8%
Lao PDR 0.248 0.709 2.143 764.1% 4.4% 0.487 0.328 0.206 -57.7% -1.7% 0.626 0.799 0.964 54.0% 0.9%
Singapore 0.471 1.479 1.629 245.9% 2.5% 0.249 0.156 0.156 -37.3% -0.9% 0.96 1 1 4.2% 0.1%
Timor-Leste 0.038 0.073 0.209 450.0% 3.5% 0.486 0.491 0.388 -20.2% -0.4% 0.58 0.641 0.821 41.6% 0.7%
Brunei Darussalam 0.015 0.079 0.145 866.7% 4.6% 0.346 0.267 0.222 -35.8% -0.9% 0.944 0.986 1 5.9% 0.1%
Asia-South East 34.72 86.53 162.5 368.0% 3.1% 0.374 0.267 0.205 -45.2% -1.2% 0.745 0.835 0.923 23.9% 0.4%
VOL2_15 Forecast Tables rev.indd 208 21/08/2009 09:02

209Forecast Tables
Patterns of Potential Human Progress Multination Regional Analysis Measures of Poverty, Health, Education, Infrastructure, and Governance
Base Case: Countries in Year 2060
Descending Population Sequence
Population, Land Area, and Human Development IndexPopulation 65 Years and Above Youth Bulge Human Development Index
Million People Ratio Index
2010 2035 2060 % Chg % An Chg 2010 2035 2060 % Chg % An Chg 2010 2035 2060 % Chg % An Chg
ASIA WITH OCEANIA continuedTurkey 4.644 13.63 28.15 506.2% 3.7% 0.357 0.238 0.183 -48.7% -1.3% 0.803 0.92 1 24.5% 0.4%
Yemen 0.597 1.692 5.999 904.9% 4.7% 0.533 0.432 0.329 -38.3% -1.0% 0.571 0.738 0.86 50.6% 0.8%
Iraq 0.912 2.65 7.792 754.4% 4.4% 0.471 0.414 0.285 -39.5% -1.0% 0.633 0.792 0.918 45.0% 0.7%
Saudi Arabia 0.779 3.981 9.07 1064.3% 5.0% 0.393 0.322 0.247 -37.2% -0.9% 0.841 0.922 0.985 17.1% 0.3%
Syria 0.728 2.218 6.644 812.6% 4.5% 0.472 0.342 0.237 -49.8% -1.4% 0.752 0.813 0.917 21.9% 0.4%
Israel 0.78 1.704 2.834 263.3% 2.6% 0.318 0.244 0.203 -36.2% -0.9% 0.931 1 1 7.4% 0.1%
Azerbaijan 0.65 1.821 2.966 356.3% 3.1% 0.375 0.245 0.184 -50.9% -1.4% 0.823 0.898 0.935 13.6% 0.3%
Jordan 0.228 0.743 2.222 874.6% 4.7% 0.438 0.31 0.204 -53.4% -1.5% 0.782 0.897 1 27.9% 0.5%
Palestine 0.13 0.374 1.177 805.4% 4.5% 0.487 0.38 0.245 -49.7% -1.4% 0.78 0.836 0.932 19.5% 0.4%
United Arab Emirates 0.077 1.133 1.978 2468.8% 6.7% 0.263 0.21 0.185 -29.7% -0.7% 0.952 0.987 1 5.0% 0.1%
Oman 0.092 0.42 1.067 1059.8% 5.0% 0.43 0.313 0.244 -43.3% -1.1% 0.854 0.941 0.99 15.9% 0.3%
Kuwait 0.073 0.664 1.201 1545.2% 5.8% 0.287 0.237 0.209 -27.2% -0.6% 0.945 1 1 5.8% 0.1%
Lebanon 0.288 0.646 1.241 330.9% 3.0% 0.354 0.246 0.191 -46.0% -1.2% 0.782 0.887 0.991 26.7% 0.5%
Georgia 0.616 0.809 0.962 56.2% 0.9% 0.285 0.183 0.154 -46.0% -1.2% 0.724 0.836 0.91 25.7% 0.5%
Armenia 0.343 0.624 1.036 202.0% 2.2% 0.343 0.201 0.146 -57.4% -1.7% 0.808 0.919 0.993 22.9% 0.4%
Bahrain 0.028 0.174 0.273 875.0% 4.7% 0.31 0.227 0.202 -34.8% -0.9% 0.9 0.951 0.998 10.9% 0.2%
Qatar 0.02 0.22 0.281 1305.0% 5.4% 0.246 0.212 0.198 -19.5% -0.4% 0.946 1 1 5.7% 0.1%
Cyprus 0.108 0.213 0.261 141.7% 1.8% 0.273 0.174 0.15 -45.1% -1.2% 0.936 0.991 1 6.8% 0.1%
Asia-West 11.09 33.71 75.15 577.6% 3.9% 0.405 0.318 0.242 -40.2% -1.0% 0.765 0.865 0.948 23.9% 0.4%
Australia 3.1 5.867 7.251 133.9% 1.7% 0.25 0.205 0.194 -22.4% -0.5% 0.968 1 1 3.3% 0.1%
Papua New Guniea 0.171 0.538 1.329 677.2% 4.2% 0.454 0.382 0.303 -33.3% -0.8% 0.537 0.695 0.796 48.2% 0.8%
New Zealand 0.575 1.18 1.405 144.3% 1.8% 0.264 0.202 0.186 -29.5% -0.7% 0.945 0.996 1 5.8% 0.1%
Solomon Islands 0.017 0.04 0.105 517.6% 3.7% 0.467 0.378 0.323 -30.8% -0.7% 0.602 0.661 0.757 25.7% 0.5%
Fiji 0.045 0.103 0.196 335.6% 3.0% 0.403 0.31 0.203 -49.6% -1.4% 0.773 0.838 0.954 23.4% 0.4%
Vanuatu 0.008 0.023 0.062 675.0% 4.2% 0.464 0.367 0.271 -41.6% -1.1% 0.707 0.783 0.901 27.4% 0.5%
Micronesia 0.004 0.01 0.032 700.0% 4.2% 0.495 0.368 0.26 -47.5% -1.3% 0.735 0.779 0.912 24.1% 0.4%
Tonga 0.007 0.011 0.034 385.7% 3.2% 0.475 0.356 0.26 -45.3% -1.2% 0.812 0.835 0.926 14.0% 0.3%
Samoa 0.009 0.02 0.035 288.9% 2.8% 0.44 0.345 0.238 -45.9% -1.2% 0.803 0.853 0.963 19.9% 0.4%
Oceania 3.938 7.793 10.45 165.4% 2.0% 0.302 0.255 0.227 -24.8% -0.6% 0.868 0.914 0.937 7.9% 0.2%
VOL2_15 Forecast Tables rev.indd 209 21/08/2009 09:03

Patterns of Potential Hum
an Progress Volume 2: Enhancing Global Education
210
Patterns of Potential Human Progress Multination Regional Analysis Measures of Poverty, Health, Education, Infrastructure, and Governance
Base Case: Countries in Year 2060
Descending Population Sequence
Population, Land Area, and Human Development IndexPopulation 65 Years and Above Youth Bulge Human Development Index
Million People Ratio Index
2010 2035 2060 % Chg % An Chg 2010 2035 2060 % Chg % An Chg 2010 2035 2060 % Chg % An Chg
EUROPERussian Federation 18.6 32.22 39.32 111.4% 1.5% 0.268 0.18 0.153 -42.9% -1.1% 0.843 0.953 0.981 16.4% 0.3%
Ukraine 7.401 9.727 12.58 70.0% 1.1% 0.254 0.166 0.132 -48.0% -1.3% 0.807 0.91 1 23.9% 0.4%
Poland 5.348 9.735 12.39 131.7% 1.7% 0.264 0.164 0.133 -49.6% -1.4% 0.891 0.974 1 12.2% 0.2%
Romania 3.257 4.687 6.197 90.3% 1.3% 0.246 0.172 0.143 -41.9% -1.1% 0.847 0.921 0.983 16.1% 0.3%
Czech Republic 1.671 2.591 3.108 86.0% 1.2% 0.221 0.165 0.145 -34.4% -0.8% 0.916 0.963 1 9.2% 0.2%
Belarus 1.36 2.213 2.999 120.5% 1.6% 0.268 0.172 0.141 -47.4% -1.3% 0.839 0.928 0.993 18.4% 0.3%
Hungary 1.679 2.312 2.704 61.0% 1.0% 0.221 0.169 0.148 -33.0% -0.8% 0.888 0.951 1 12.6% 0.2%
Bulgaria 1.376 1.7 2.005 45.7% 0.8% 0.218 0.16 0.136 -37.6% -0.9% 0.851 0.925 1 17.5% 0.3%
Slovakia 0.702 1.272 1.699 142.0% 1.8% 0.262 0.17 0.14 -46.6% -1.2% 0.894 0.941 0.992 11.0% 0.2%
Moldova, Rep. of 0.471 0.622 1.021 116.8% 1.6% 0.337 0.194 0.151 -55.2% -1.6% 0.746 0.799 0.911 22.1% 0.4%
Europe-East 41.87 67.08 84.02 100.7% 1.4% 0.26 0.174 0.145 -44.2% -1.2% 0.848 0.944 0.988 16.5% 0.3%
United Kingdom 10.67 16.51 17.85 67.3% 1.0% 0.231 0.2 0.19 -17.7% -0.4% 0.956 0.999 1 4.6% 0.1%
Sweden 1.775 2.518 2.667 50.3% 0.8% 0.225 0.193 0.183 -18.7% -0.4% 0.968 1 1 3.3% 0.1%
Denmark 0.956 1.454 1.492 56.1% 0.9% 0.212 0.195 0.194 -8.5% -0.2% 0.951 0.997 1 5.2% 0.1%
Ireland 0.54 1.045 1.416 162.2% 1.9% 0.268 0.217 0.197 -26.5% -0.6% 0.972 1 1 2.9% 0.1%
Norway 0.762 1.287 1.428 87.4% 1.3% 0.232 0.197 0.191 -17.7% -0.4% 0.985 1 1 1.5% 0.0%
Finland 0.946 1.471 1.424 50.5% 0.8% 0.221 0.194 0.187 -15.4% -0.3% 0.959 1 1 4.3% 0.1%
Lithuania 0.562 0.809 0.989 76.0% 1.1% 0.263 0.171 0.141 -46.4% -1.2% 0.878 0.947 1 13.9% 0.3%
Latvia 0.414 0.555 0.67 61.8% 1.0% 0.251 0.174 0.144 -42.6% -1.1% 0.878 0.966 1 13.9% 0.3%
Estonia 0.237 0.318 0.322 35.9% 0.6% 0.244 0.184 0.161 -34.0% -0.8% 0.899 0.972 1 11.2% 0.2%
Iceland 0.04 0.079 0.096 140.0% 1.8% 0.27 0.204 0.184 -31.9% -0.8% 0.974 1 1 2.7% 0.1%
Europe-North 16.9 26.04 28.35 67.8% 1.0% 0.233 0.198 0.187 -19.7% -0.4% 0.954 0.997 1 4.8% 0.1%
Italy 12.57 17.74 16.26 29.4% 0.5% 0.174 0.151 0.15 -13.8% -0.3% 0.95 0.982 1 5.3% 0.1%
Spain 7.978 12.79 13.54 69.7% 1.1% 0.196 0.164 0.149 -24.0% -0.5% 0.948 0.993 1 5.5% 0.1%
Greece 2.176 3.122 3.31 52.1% 0.8% 0.2 0.158 0.15 -25.0% -0.6% 0.943 0.984 1 6.0% 0.1%
Portugal 1.921 2.81 3.28 70.7% 1.1% 0.21 0.172 0.154 -26.7% -0.6% 0.904 0.963 1 10.6% 0.2%
Serbia 1.096 1.522 2.098 91.4% 1.3% 0.256 0.184 0.154 -39.8% -1.0% 0.817 0.894 0.991 21.3% 0.4%
Croatia 0.794 1.112 1.265 59.3% 0.9% 0.221 0.172 0.149 -32.6% -0.8% 0.886 0.944 1 12.9% 0.2%
Bosnia and Herzegovina 0.626 0.856 1.059 69.2% 1.1% 0.244 0.164 0.145 -40.6% -1.0% 0.824 0.862 0.932 13.1% 0.2%
Albania 0.317 0.615 0.978 208.5% 2.3% 0.348 0.22 0.172 -50.6% -1.4% 0.841 0.908 0.987 17.4% 0.3%
Macedonia, TFYR 0.254 0.396 0.525 106.7% 1.5% 0.28 0.196 0.168 -40.0% -1.0% 0.837 0.856 0.922 10.2% 0.2%
Slovenia 0.345 0.587 0.598 73.3% 1.1% 0.213 0.151 0.137 -35.7% -0.9% 0.933 0.985 1 7.2% 0.1%
Montenegro 0.09 0.132 0.183 103.3% 1.4% 0.276 0.202 0.169 -38.8% -1.0% 0.809 0.888 0.999 23.5% 0.4%
Malta 0.063 0.114 0.132 109.5% 1.5% 0.247 0.165 0.142 -42.5% -1.1% 0.909 0.979 1 10.0% 0.2%
Europe-South 28.23 41.79 43.22 53.1% 0.9% 0.199 0.162 0.151 -24.1% -0.6% 0.929 0.972 0.996 7.2% 0.1%
Germany 17.46 24.96 22.76 30.4% 0.5% 0.199 0.158 0.158 -20.6% -0.5% 0.95 0.992 1 5.3% 0.1%
France 10.64 16.91 17.57 65.1% 1.0% 0.225 0.196 0.187 -16.9% -0.4% 0.958 0.996 1 4.4% 0.1%
Netherlands 2.646 4.698 4.668 76.4% 1.1% 0.217 0.189 0.188 -13.4% -0.3% 0.959 0.992 1 4.3% 0.1%
Belgium 1.941 2.947 2.939 51.4% 0.8% 0.214 0.189 0.183 -14.5% -0.3% 0.955 0.989 1 4.7% 0.1%
Austria 1.519 2.413 2.253 48.3% 0.8% 0.209 0.16 0.155 -25.8% -0.6% 0.958 0.997 1 4.4% 0.1%
Switzerland 1.341 2.292 2.147 60.1% 0.9% 0.213 0.158 0.153 -28.2% -0.7% 0.972 1 1 2.9% 0.1%
Luxembourg 0.073 0.139 0.17 132.9% 1.7% 0.222 0.204 0.206 -7.2% -0.1% 1 1 1 0.0% 0.0%
Europe-West 35.63 54.35 52.51 47.4% 0.8% 0.211 0.176 0.173 -18.0% -0.4% 0.955 0.994 1 4.7% 0.1%
VOL2_15 Forecast Tables rev.indd 210 21/08/2009 09:03

211Forecast Tables
Patterns of Potential Human Progress Multination Regional Analysis Measures of Poverty, Health, Education, Infrastructure, and Governance
Base Case
Source: International Futures Version 6.12, March 2009
Pop., Land Area, & Hum. Dev. Ind. PovertyHDI with Higher Ceilings Poverty (below $1 per Day) Poverty (below $2 per Day)
Index Million People Poverty Gap Index Million People
2010 2035 2060 % Chg % An Chg 2010 2035 2060 % Chg % An Chg 2010 2035 2060 2010 2035 2060 % Chg % An Chg
World 0.616 0.701 0.772 25.3% 0.5% 841.8 454 298.9 -64.5% -2.0% 4.288 2.088 1.171 2402 1431 912.5 -62.0% -1.9%
Africa 0.459 0.571 0.668 45.5% 0.8% 304 326 235.5 -22.5% -0.5% 12.58 8.004 3.659 612.9 730.7 683.9 11.6% 0.2%Americas 0.733 0.788 0.839 14.5% 0.3% 39.63 25.64 11.98 -69.8% -2.4% 1.52 0.86 0.368 115.9 73.88 34.97 -69.8% -2.4%Asia with Oceania 0.601 0.71 0.794 32.1% 0.6% 497.3 101.7 51.38 -89.7% -4.4% 3.643 0.636 0.38 1665 623 193.2 -88.4% -4.2%Europe 0.763 0.813 0.852 11.7% 0.2% 1.007 0.806 0.08 -92.1% -4.9% 0.034 0.034 0.003 6.503 2.396 0.344 -94.7% -5.7%World 0.616 0.701 0.772 25.3% 0.5% 841.8 454 298.9 -64.5% -2.0% 4.288 2.088 1.171 2402 1431 912.5 -62.0% -1.9%
Africa-Eastern 0.425 0.562 0.683 60.7% 1.0% 123.9 157.8 50.88 -58.9% -1.8% 17.13 11.63 2.526 238.2 335.5 136 -42.9% -1.1%Africa-Middle 0.394 0.505 0.618 56.9% 0.9% 44.47 78.17 47.96 7.8% 0.2% 15.1 14.15 3.878 82.96 155 221.4 166.9% 2.0%Africa-Northern 0.571 0.681 0.77 34.9% 0.6% 8.864 1.947 1.621 -81.7% -3.3% 1.23 0.159 0.108 53.78 21.24 10.52 -80.4% -3.2%Africa-Southern 0.615 0.719 0.789 28.3% 0.5% 5.94 2.772 0.619 -89.6% -4.4% 3.933 1.383 0.24 16.56 9.873 3.333 -79.9% -3.2%Africa-Western 0.416 0.535 0.626 50.5% 0.8% 120.8 85.32 134.4 11.3% 0.2% 16.11 6.12 6.592 221.4 209.1 312.7 41.2% 0.7%Africa 0.459 0.571 0.668 45.5% 0.8% 304 326 235.5 -22.5% -0.5% 12.58 8.004 3.659 612.9 730.7 683.9 11.6% 0.2%
America-Caribbean 0.636 0.696 0.771 21.2% 0.4% 6.602 6.818 4.915 -25.6% -0.6% 7.88 7.229 4.374 12.29 12.12 9.881 -19.6% -0.4%America-Central 0.626 0.701 0.783 25.1% 0.4% 7.381 8.693 4.486 -39.2% -1.0% 6.301 5.3 2.082 15.81 18.51 11.55 -26.9% -0.6%America-North 0.787 0.83 0.867 10.2% 0.2% 1.233 0.322 0.054 -95.6% -6.1% 0.063 0.012 0.002 17.41 8.41 2.581 -85.2% -3.7%America-South 0.692 0.762 0.822 18.8% 0.3% 24.42 9.806 2.53 -89.6% -4.4% 2.021 0.594 0.13 70.36 34.85 10.96 -84.4% -3.7%Americas 0.733 0.788 0.839 14.5% 0.3% 39.63 25.64 11.98 -69.8% -2.4% 1.52 0.86 0.368 115.9 73.88 34.97 -69.8% -2.4%
Asia-East 0.68 0.791 0.861 26.6% 0.5% 59.48 2.923 0.427 -99.3% -9.4% 1.03 0.041 0.006 326.7 29.1 2.605 -99.2% -9.2%Asia-South Central 0.511 0.647 0.754 47.6% 0.8% 374.4 80.04 48.01 -87.2% -4.0% 6.627 1.185 0.787 1044 447.8 160.3 -84.6% -3.7%Asia-South East 0.63 0.704 0.771 22.4% 0.4% 49.11 12.95 1.349 -97.3% -6.9% 2.861 0.489 0.041 246.9 121.9 22.25 -91.0% -4.7%Asia-West 0.641 0.725 0.798 24.5% 0.4% 12.52 5.02 1.186 -90.5% -4.6% 1.672 0.415 0.073 42.67 21.71 6.62 -84.5% -3.7%Oceania 0.727 0.768 0.811 11.6% 0.2% 1.767 0.74 0.403 -77.2% -2.9% 1.864 0.525 0.269 4.19 2.558 1.445 -65.5% -2.1%Asia with Oceania 0.601 0.71 0.794 32.1% 0.6% 497.3 101.7 51.38 -89.7% -4.4% 3.643 0.636 0.38 1665 623 193.2 -88.4% -4.2%
Europe-East 0.72 0.791 0.826 14.7% 0.3% 0.035 0.003 0 -100.0% 0.002 0 0 5.416 1.443 0.099 -98.2% -7.7%Europe-North 0.8 0.836 0.876 9.5% 0.2% 0.002 0 0 -100.0% 0 0 0 0.111 0.022 0.002 -98.2% -7.7%Europe-South 0.777 0.81 0.848 9.1% 0.2% 0.865 0.775 0.077 -91.1% -4.7% 0.143 0.162 0.016 2.727 1.84 0.264 -90.3% -4.6%Europe-West 0.8 0.831 0.873 9.1% 0.2% 0 0 0 0 0 0 0 0 0Europe 0.763 0.813 0.852 11.7% 0.2% 1.007 0.806 0.08 -92.1% -4.9% 0.034 0.034 0.003 6.503 2.396 0.344 -94.7% -5.7%
VOL2_15 Forecast Tables rev.indd 211 21/08/2009 09:03

Patterns of Potential Hum
an Progress Volume 2: Enhancing Global Education
212
Patterns of Potential Human Progress Multination Regional Analysis Measures of Poverty, Health, Education, Infrastructure, and Governance
Base Case: Countries in Year 2060
Descending Population Sequence
Pop., Land Area, & Hum. Dev. Ind. PovertyHDI with Higher Ceilings Poverty (below $1 per Day) Poverty (below $2 per Day)
Index Million People Poverty Gap Index Million People
2010 2035 2060 % Chg % An Chg 2010 2035 2060 % Chg % An Chg 2010 2035 2060 2010 2035 2060 % Chg % An Chg
AFRICAEthiopia 0.322 0.458 0.622 93.2% 1.3% 13.24 24.79 0.888 -93.3% -5.3% 3.87 4.322 0.072 55.38 95.72 17.53 -68.3% -2.3%
Uganda 0.492 0.638 0.751 52.6% 0.8% 26.27 42.67 7.502 -71.4% -2.5% 41.17 29.29 2.188 29.88 52.14 13.99 -53.2% -1.5%
Tanzania, United Rep. of 0.5 0.639 0.764 52.8% 0.9% 20.28 7.702 0.004 -100.0% -15.7% 16.2 2.625 0 34.35 24.11 0.094 -99.7% -11.1%
Kenya 0.512 0.628 0.73 42.6% 0.7% 4.542 2.896 0.072 -98.4% -8.0% 3.319 1.144 0.016 22.42 22.36 2.593 -88.4% -4.2%
Madagascar 0.462 0.562 0.653 41.3% 0.7% 12.8 22.94 12.25 -4.3% -0.1% 29.75 32.39 9.391 18.08 31.38 25.52 41.2% 0.7%
Mozambique 0.346 0.571 0.76 119.7% 1.6% 5.398 0.491 0 -100.0% 8.777 0.327 0 11.65 2.551 0 -100.0%
Malawi 0.462 0.584 0.64 38.5% 0.7% 2.877 5.761 0.885 -69.2% -2.3% 5.735 6.089 0.515 11.03 21.46 10.67 -3.3% -0.1%
Zambia 0.474 0.587 0.682 43.9% 0.7% 9.421 11.35 2.5 -73.5% -2.6% 39.64 22.31 2.441 11.83 17.41 7.456 -37.0% -0.9%
Burundi 0.378 0.539 0.651 72.2% 1.1% 4.296 7.053 0.169 -96.1% -6.3% 16.85 13.49 0.11 7.6 13.84 1.832 -75.9% -2.8%
Rwanda 0.408 0.578 0.663 62.5% 1.0% 5.853 9.075 3.772 -35.6% -0.9% 26.25 21.27 4.766 8.164 13.44 8.033 -1.6% 0.0%
Somalia 0.209 0.353 0.55 163.2% 2.0% 7.241 8.138 11.06 52.7% 0.9% 50.84 24.06 20.56 8.797 14.29 21.69 146.6% 1.8%
Zimbabwe 0.548 0.663 0.699 27.6% 0.5% 8.765 9.208 5.301 -39.5% -1.0% 33.45 21.34 9.352 13.27 17.56 15.05 13.4% 0.3%
Eritrea 0.352 0.401 0.492 39.8% 0.7% 2.328 5.042 6.283 169.9% 2.0% 18.68 27.86 23.38 4.518 7.942 10.91 141.5% 1.8%
Mauritius 0.687 0.773 0.835 21.5% 0.4% 0.033 0.004 0 -100.0% 0.529 0.046 0.003 0.188 0.042 0.005 -97.3% -7.0%
Comoros 0.496 0.563 0.691 39.3% 0.7% 0.293 0.395 0.154 -47.4% -1.3% 18.06 15.59 3.788 0.525 0.739 0.451 -14.1% -0.3%
Djibouti 0.428 0.515 0.644 50.5% 0.8% 0.27 0.228 0.042 -84.4% -3.7% 11.85 7.455 0.988 0.525 0.509 0.166 -68.4% -2.3%
Africa-Eastern 0.425 0.562 0.683 60.7% 1.0% 123.9 157.8 50.88 -58.9% -1.8% 17.13 11.63 2.526 238.2 335.5 136 -42.9% -1.1%
Congo; Dem. Rep. of 0.343 0.453 0.614 79.0% 1.2% 36.73 69.1 38.67 5.3% 0.1% 23.65 21.99 5.079 64.32 135.1 194.2 201.9% 2.2%
Angola 0.477 0.639 0.66 38.4% 0.7% 0.467 0.071 0.092 -80.3% -3.2% 0.592 0.038 0.03 1.925 0.528 0.671 -65.1% -2.1%
Cameroon 0.483 0.567 0.645 33.5% 0.6% 3.155 4.211 1.427 -54.8% -1.6% 5.554 4.485 0.969 8.406 11.69 5.93 -29.5% -0.7%
Chad 0.324 0.48 0.545 68.2% 1.0% 0.884 0.09 4.567 416.6% 3.3% 2.009 0.078 3.544 3.635 0.933 14.38 295.6% 2.8%
Central African Republic 0.337 0.455 0.564 67.4% 1.0% 2.931 4.449 2.977 1.6% 0.0% 38.26 31.64 11.44 3.766 6.078 5.514 46.4% 0.8%
Congo, Rep. of 0.568 0.658 0.676 19.0% 0.3% 0.212 0.064 0.112 -47.2% -1.3% 1.197 0.189 0.27 0.74 0.313 0.458 -38.1% -1.0%
Gabon 0.64 0.699 0.743 16.1% 0.3% 0.007 0.01 0 -100.0% 0.118 0.122 0.003 0.031 0.046 0.003 -90.3% -4.6%
Equatorial Guinea 0.648 0.736 0.738 13.9% 0.3% 0 0 0 0 0 0 0 0 0
São Tomé and Príncipe 0.555 0.601 0.653 17.7% 0.3% 0.078 0.173 0.119 52.6% 0.8% 18.25 27.61 11.31 0.135 0.252 0.236 74.8% 1.1%
Africa-Middle 0.394 0.505 0.618 56.9% 0.9% 44.47 78.17 47.96 7.8% 0.2% 15.1 14.15 3.878 82.96 155 221.4 166.9% 2.0%
Egypt 0.596 0.712 0.816 36.9% 0.6% 0.622 0.068 0.001 -99.8% -12.1% 0.133 0.01 0 29.6 10.48 0.81 -97.3% -6.9%
Sudan 0.486 0.615 0.71 46.1% 0.8% 8.205 1.872 1.617 -80.3% -3.2% 6.001 0.665 0.404 20.34 8.78 8.967 -55.9% -1.6%
Algeria 0.615 0.695 0.75 22.0% 0.4% 0.002 0 0.002 0.0% 0.0% 0.001 0 0 0.476 0.003 0.419 -12.0% -0.3%
Morocco 0.518 0.651 0.748 44.4% 0.7% 0.011 0.007 0 -100.0% 0.005 0.003 0 2.882 1.952 0.293 -89.8% -4.5%
Tunisia 0.637 0.737 0.837 31.4% 0.5% 0.002 0 0 -100.0% 0.003 0 0 0.148 0.022 0.001 -99.3% -9.5%
Libyan Arab Jamahiriya 0.692 0.773 0.805 16.3% 0.3% 0.022 0 0.001 -95.5% -6.0% 0.061 0 0.001 0.328 0.001 0.033 -89.9% -4.5%
Africa-Northern 0.571 0.681 0.77 34.9% 0.6% 8.864 1.947 1.621 -81.7% -3.3% 1.23 0.159 0.108 53.78 21.24 10.52 -80.4% -3.2%
VOL2_15 Forecast Tables rev.indd 212 21/08/2009 09:03

213Forecast Tables
Patterns of Potential Human Progress Multination Regional Analysis Measures of Poverty, Health, Education, Infrastructure, and Governance
Base Case: Countries in Year 2060
Descending Population Sequence
Pop., Land Area, & Hum. Dev. Ind. PovertyHDI with Higher Ceilings Poverty (below $1 per Day) Poverty (below $2 per Day)
Index Million People Poverty Gap Index Million People
2010 2035 2060 % Chg % An Chg 2010 2035 2060 % Chg % An Chg 2010 2035 2060 2010 2035 2060 % Chg % An Chg
AFRICA continuedSouth Africa 0.621 0.722 0.79 27.2% 0.5% 4.201 1.542 0.345 -91.8% -4.9% 2.964 0.79 0.146 13.5 7.303 2.461 -81.8% -3.3%
Namibia 0.602 0.711 0.808 34.2% 0.6% 0.385 0.217 0.02 -94.8% -5.7% 7.063 2.393 0.146 0.811 0.593 0.095 -88.3% -4.2%
Lesotho 0.505 0.649 0.739 46.3% 0.8% 0.599 0.48 0.087 -85.5% -3.8% 14.16 7.496 0.948 0.953 0.88 0.233 -75.6% -2.8%
Botswana 0.63 0.758 0.823 30.6% 0.5% 0.161 0.034 0.007 -95.7% -6.1% 3.08 0.424 0.076 0.359 0.108 0.03 -91.6% -4.8%
Swaziland 0.541 0.669 0.75 38.6% 0.7% 0.594 0.499 0.159 -73.2% -2.6% 22.59 11.45 2.475 0.933 0.989 0.513 -45.0% -1.2%
Africa-Southern 0.615 0.719 0.789 28.3% 0.5% 5.94 2.772 0.619 -89.6% -4.4% 3.933 1.383 0.24 16.56 9.873 3.333 -79.9% -3.2%
Nigeria 0.466 0.577 0.622 33.5% 0.6% 71.24 11.16 100.7 41.4% 0.7% 19.78 1.122 10.3 113.7 43.99 199.7 75.6% 1.1%
Niger 0.27 0.417 0.586 117.0% 1.6% 8.749 17.22 6.603 -24.5% -0.6% 26.19 26.04 4.705 13.8 27.21 19.77 43.3% 0.7%
Côte d’Ivoire 0.405 0.551 0.648 60.0% 0.9% 3.096 2.44 1.462 -52.8% -1.5% 4.79 2.012 0.801 9.678 10.06 7.875 -18.6% -0.4%
Ghana 0.462 0.526 0.618 33.8% 0.6% 9.331 13.64 9.772 4.7% 0.1% 13.84 13.88 7.604 18.96 27.44 24.12 27.2% 0.5%
Burkina Faso 0.301 0.489 0.66 119.3% 1.6% 4.083 5.575 0.128 -96.9% -6.7% 8.828 5.966 0.057 10.43 16.93 1.913 -81.7% -3.3%
Mali 0.322 0.482 0.642 99.4% 1.4% 4.925 8.531 1.598 -67.6% -2.2% 10.86 10.26 0.987 12.31 21.79 10.46 -15.0% -0.3%
Senegal 0.408 0.534 0.662 62.3% 1.0% 2.153 2.215 0.758 -64.8% -2.1% 4.883 2.689 0.537 7.749 9.962 5.966 -23.0% -0.5%
Guinea 0.336 0.527 0.658 95.8% 1.4% 3.726 2.388 0.186 -95.0% -5.8% 12.33 3.624 0.135 7.651 7.893 1.663 -78.3% -3.0%
Benin 0.376 0.513 0.648 72.3% 1.1% 3.014 6.148 1.54 -48.9% -1.3% 9.988 12.45 1.69 7.081 12.94 6.686 -5.6% -0.1%
Togo 0.416 0.436 0.555 33.4% 0.6% 3.314 6.483 6.578 98.5% 1.4% 19.45 24.49 17.64 6.184 10.78 12.83 107.5% 1.5%
Sierra Leone 0.247 0.39 0.593 140.1% 1.8% 3.111 1.767 0.241 -92.3% -5.0% 19.65 5.582 0.386 4.391 3.212 0.68 -84.5% -3.7%
Liberia 0.305 0.355 0.553 81.3% 1.2% 1.633 3.926 1.97 20.6% 0.4% 15.76 20.45 4.091 3.667 7.52 12.05 228.6% 2.4%
Mauritania 0.461 0.594 0.669 45.1% 0.7% 1.038 1.429 0.277 -73.3% -2.6% 9.611 7.549 0.781 2.371 3.6 1.487 -37.3% -0.9%
Guinea-Bissau 0.394 0.512 0.578 46.7% 0.8% 0.948 1.784 2.314 144.1% 1.8% 23.26 22.21 17.15 1.758 3.504 5.765 227.9% 2.4%
Gambia 0.336 0.504 0.605 80.1% 1.2% 0.416 0.613 0.269 -35.3% -0.9% 8.753 8.124 2.131 1.351 2.035 1.699 25.8% 0.5%
Cape Verde 0.612 0.709 0.813 32.8% 0.6% 0.001 0.001 0 -100.0% 0.053 0.015 0 0.298 0.241 0.054 -81.9% -3.4%
Africa-Western 0.416 0.535 0.626 50.5% 0.8% 120.8 85.32 134.4 11.3% 0.2% 16.11 6.12 6.592 221.4 209.1 312.7 41.2% 0.7%
VOL2_15 Forecast Tables rev.indd 213 21/08/2009 09:04

Patterns of Potential Hum
an Progress Volume 2: Enhancing Global Education
214
Patterns of Potential Human Progress Multination Regional Analysis Measures of Poverty, Health, Education, Infrastructure, and Governance
Base Case: Countries in Year 2060
Descending Population Sequence
Pop., Land Area, & Hum. Dev. Ind. PovertyHDI with Higher Ceilings Poverty (below $1 per Day) Poverty (below $2 per Day)
Index Million People Poverty Gap Index Million People
2010 2035 2060 % Chg % An Chg 2010 2035 2060 % Chg % An Chg 2010 2035 2060 2010 2035 2060 % Chg % An Chg
AMERICASHaiti 0.444 0.53 0.636 43.2% 0.7% 4.97 6.426 4.901 -1.4% 0.0% 28.56 24.21 12.94 7.377 10.13 9.618 30.4% 0.5%
Dominican Republic 0.653 0.76 0.832 27.4% 0.5% 0.114 0.021 0.002 -98.2% -7.8% 0.301 0.041 0.003 0.678 0.186 0.027 -96.0% -6.2%
Cuba 0.709 0.753 0.851 20.0% 0.4% 1.481 0.343 0 -100.0% 3.671 0.682 0 3.763 1.385 0.002 -99.9% -14.0%
Puerto Rico 0.763 0.831 0.881 15.5% 0.3% 0 0 0 0 0 0 0 0 0
Jamaica 0.652 0.706 0.776 19.0% 0.3% 0.007 0.012 0.011 57.1% 0.9% 0.051 0.083 0.086 0.296 0.342 0.225 -24.0% -0.5%
Trinidad and Tobago 0.735 0.802 0.834 13.5% 0.3% 0 0 0 0.005 0 0 0.064 0.011 0 -100.0%
Bahamas 0.739 0.791 0.835 13.0% 0.2% 0 0 0 0 0 0 0 0 0
Barbados 0.752 0.797 0.859 14.2% 0.3% 0.002 0 0 -100.0% 0.134 0.027 0 0.019 0.006 0 -100.0%
St. Vincent & the Grenadines 0.659 0.731 0.818 24.1% 0.4% 0.015 0.009 0 -100.0% 3.283 1.365 0.046 0.041 0.029 0.003 -92.7% -5.1%
Grenada 0.685 0.744 0.817 19.3% 0.4% 0.006 0.005 0.001 -83.3% -3.5% 1.309 0.877 0.077 0.025 0.023 0.004 -84.0% -3.6%
St. Lucia 0.698 0.761 0.829 18.8% 0.3% 0.006 0.001 0 -100.0% 0.93 0.173 0.004 0.029 0.01 0.001 -96.6% -6.5%
America-Caribbean 0.636 0.696 0.771 21.2% 0.4% 6.602 6.818 4.915 -25.6% -0.6% 7.88 7.229 4.374 12.29 12.12 9.881 -19.6% -0.4%
Guatemala 0.597 0.683 0.772 29.3% 0.5% 2.068 2.727 1.808 -12.6% -0.3% 4.898 3.954 1.901 4.654 6.086 4.487 -3.6% -0.1%
Honduras 0.603 0.676 0.756 25.4% 0.5% 1.026 1.365 0.426 -58.5% -1.7% 4.646 4.694 1.097 3.168 3.948 1.871 -40.9% -1.0%
El Salvador 0.629 0.717 0.808 28.5% 0.5% 1.512 1.368 0.557 -63.2% -2.0% 7.761 5.518 1.823 2.964 2.787 1.38 -53.4% -1.5%
Nicaragua 0.59 0.646 0.721 22.2% 0.4% 2.618 3.209 1.693 -35.3% -0.9% 18.87 17.27 7.346 4.417 5.55 3.8 -14.0% -0.3%
Costa Rica 0.73 0.807 0.872 19.5% 0.4% 0.03 0.001 0 -100.0% 0.148 0.004 0 0.173 0.015 0 -100.0%
Panama 0.707 0.791 0.857 21.2% 0.4% 0.105 0.019 0.001 -99.0% -8.9% 0.92 0.112 0.005 0.363 0.096 0.009 -97.5% -7.1%
Belize 0.636 0.748 0.838 31.8% 0.6% 0.021 0.006 0 -100.0% 1.715 0.29 0.016 0.068 0.024 0.003 -95.6% -6.1%
America-Central 0.626 0.701 0.783 25.1% 0.4% 7.381 8.693 4.486 -39.2% -1.0% 6.301 5.3 2.082 15.81 18.51 11.55 -26.9% -0.6%
United States of America 0.811 0.849 0.88 8.5% 0.2% 0 0 0 0 0 0 0 0 0
Mexico 0.714 0.772 0.827 15.8% 0.3% 1.233 0.322 0.054 -95.6% -6.1% 0.261 0.051 0.008 17.41 8.41 2.581 -85.2% -3.7%
Canada 0.809 0.843 0.875 8.2% 0.2% 0 0 0 0 0 0 0 0 0
America-North 0.787 0.83 0.867 10.2% 0.2% 1.233 0.322 0.054 -95.6% -6.1% 0.063 0.012 0.002 17.41 8.41 2.581 -85.2% -3.7%
Brazil 0.687 0.763 0.829 20.7% 0.4% 12.23 3.656 0.689 -94.4% -5.6% 2.026 0.43 0.067 34.89 14.95 4.008 -88.5% -4.2%
Colombia 0.681 0.743 0.821 20.6% 0.4% 2.818 1.506 0.238 -91.6% -4.8% 1.909 0.771 0.097 6.993 4.344 0.928 -86.7% -4.0%
Argentina 0.733 0.801 0.853 16.4% 0.3% 0.388 0.036 0.001 -99.7% -11.2% 0.239 0.015 0 5.822 1.471 0.133 -97.7% -7.3%
Venezuela, RB 0.713 0.774 0.807 13.2% 0.2% 2.649 0.943 0.201 -92.4% -5.0% 2.828 0.661 0.115 5.199 2.327 0.592 -88.6% -4.3%
Peru 0.663 0.736 0.803 21.1% 0.4% 2.16 0.922 0.258 -88.1% -4.2% 2.281 0.708 0.168 7.37 4.208 1.552 -78.9% -3.1%
Chile 0.747 0.826 0.871 16.6% 0.3% 0.004 0 0 -100.0% 0.005 0 0 0.554 0.026 0 -100.0%
Ecuador 0.691 0.726 0.744 7.7% 0.1% 1.275 1.192 0.705 -44.7% -1.2% 2.497 1.834 1.012 3.61 3.489 2.191 -39.3% -1.0%
Bolivia 0.629 0.722 0.785 24.8% 0.4% 1.95 0.701 0.184 -90.6% -4.6% 8.039 1.712 0.333 3.605 1.77 0.614 -83.0% -3.5%
Paraguay 0.656 0.693 0.753 14.8% 0.3% 0.889 0.831 0.251 -71.8% -2.5% 5.281 3.464 0.795 2.127 2.186 0.926 -56.5% -1.6%
Uruguay 0.73 0.789 0.85 16.4% 0.3% 0.001 0 0 -100.0% 0.005 0 0 0.027 0.002 0 -100.0%
Guyana 0.643 0.706 0.781 21.5% 0.4% 0.012 0.002 0 -100.0% 0.361 0.06 0.003 0.034 0.007 0 -100.0%
Suriname 0.668 0.743 0.807 20.8% 0.4% 0.044 0.018 0.003 -93.2% -5.2% 2.531 0.866 0.117 0.13 0.067 0.014 -89.2% -4.4%
America-South 0.692 0.762 0.822 18.8% 0.3% 24.42 9.806 2.53 -89.6% -4.4% 2.021 0.594 0.13 70.36 34.85 10.96 -84.4% -3.7%
VOL2_15 Forecast Tables rev.indd 214 21/08/2009 09:04

215Forecast Tables
Patterns of Potential Human Progress Multination Regional Analysis Measures of Poverty, Health, Education, Infrastructure, and Governance
Base Case: Countries in Year 2060
Descending Population Sequence
Pop., Land Area, & Hum. Dev. Ind. PovertyHDI with Higher Ceilings Poverty (below $1 per Day) Poverty (below $2 per Day)
Index Million People Poverty Gap Index Million People
2010 2035 2060 % Chg % An Chg 2010 2035 2060 % Chg % An Chg 2010 2035 2060 2010 2035 2060 % Chg % An Chg
ASIA WITH OCEANIAChina 0.663 0.787 0.862 30.0% 0.5% 57.07 1.172 0.015 -100.0% -15.2% 1.161 0.016 0 318.4 22.65 0.789 -99.8% -11.3%
Japan 0.808 0.84 0.878 8.7% 0.2% 0 0 0 0 0 0 0 0 0
Korea, Rep. of 0.787 0.844 0.88 11.8% 0.2% 0 0 0 0 0 0 0.05 0 0 -100.0%
Taiwan 0.758 0.822 0.873 15.2% 0.3% 0 0 0 0 0 0 0 0 0
Korea, Dem. Rep. of 0.568 0.628 0.694 22.2% 0.4% 2.312 1.733 0.412 -82.2% -3.4% 2.773 1.915 0.443 6.841 5.69 1.807 -73.6% -2.6%
Hong Kong 0.819 0.842 0.86 5.0% 0.1% 0 0 0 0 0 0 0 0 0
Mongolia 0.638 0.687 0.772 21.0% 0.4% 0.091 0.018 0 -100.0% 0.644 0.094 0 1.443 0.756 0.01 -99.3% -9.5%
Asia-East 0.68 0.791 0.861 26.6% 0.5% 59.48 2.923 0.427 -99.3% -9.4% 1.03 0.041 0.006 326.7 29.1 2.605 -99.2% -9.2%
India 0.518 0.674 0.797 53.9% 0.9% 290.9 21.33 0.125 -100.0% -14.4% 7.535 0.306 0.001 744.8 175.3 5.157 -99.3% -9.5%
Pakistan 0.462 0.585 0.692 49.8% 0.8% 11.56 7.231 0.387 -96.7% -6.6% 1.362 0.504 0.017 115.4 125.6 33.64 -70.8% -2.4%
Bangladesh 0.439 0.584 0.696 58.5% 0.9% 45.91 7.559 0.319 -99.3% -9.5% 8.683 0.819 0.025 108.1 43.85 4.813 -95.5% -6.0%
Afghanistan 0.244 0.378 0.517 111.9% 1.5% 16.78 36.76 45.01 168.2% 2.0% 19.44 21.38 13.42 31.28 65.41 99.75 218.9% 2.3%
Iran, Islamic Rep. of 0.668 0.76 0.803 20.2% 0.4% 0.002 0 0 -100.0% 0 0 0 0.084 0 0 -100.0%
Nepal 0.426 0.529 0.649 52.3% 0.8% 6.7 6.42 2.134 -68.1% -2.3% 8.119 5.502 1.498 23.2 27.18 15.95 -31.3% -0.7%
Uzbekistan 0.619 0.668 0.711 14.9% 0.3% 1.233 0.252 0.001 -99.9% -13.3% 0.97 0.134 0 9.76 4.738 0.141 -98.6% -8.1%
Sri Lanka 0.657 0.724 0.8 21.8% 0.4% 0.563 0.084 0.004 -99.3% -9.4% 0.626 0.075 0.004 6.791 2.326 0.311 -95.4% -6.0%
Kazakhstan 0.71 0.801 0.815 14.8% 0.3% 0 0 0 0 0 0 0.118 0 0 -100.0%
Tajikistan 0.609 0.641 0.709 16.4% 0.3% 0.243 0.366 0.024 -90.1% -4.5% 0.706 0.825 0.041 2.295 2.875 0.475 -79.3% -3.1%
Turkmenistan 0.633 0.747 0.743 17.4% 0.3% 0.401 0 0 -100.0% 2.037 0 0 1.235 0.001 0 -100.0%
Kyrgyzstan 0.616 0.639 0.681 10.6% 0.2% 0.003 0 0 -100.0% 0.007 0 0 1.12 0.412 0.05 -95.5% -6.0%
Bhutan 0.502 0.648 0.787 56.8% 0.9% 0.114 0.037 0.006 -94.7% -5.7% 5.186 1.102 0.128 0.264 0.117 0.025 -90.5% -4.6%
Maldives 0.664 0.774 0.862 29.8% 0.5% 0.025 0.001 0 -100.0% 1.818 0.045 0 0.076 0.007 0 -100.0%
Asia-South Central 0.511 0.647 0.754 47.6% 0.8% 374.4 80.04 48.01 -87.2% -4.0% 6.627 1.185 0.787 1044 447.8 160.3 -84.6% -3.7%
Indonesia 0.63 0.7 0.758 20.3% 0.4% 9.433 1.992 0.07 -99.3% -9.3% 0.942 0.144 0.004 97.91 52.81 7.242 -92.6% -5.1%
Philippines 0.636 0.691 0.768 20.8% 0.4% 9.181 3.747 0.539 -94.1% -5.5% 2.949 0.796 0.089 35.81 22.25 5.798 -83.8% -3.6%
Vietnam 0.63 0.714 0.789 25.2% 0.5% 0.029 0.001 0 -100.0% 0.005 0 0 40.58 11.14 0.684 -98.3% -7.8%
Thailand 0.683 0.757 0.814 19.2% 0.4% 0.034 0.001 0 -100.0% 0.009 0 0 11.08 2.77 0.549 -95.0% -5.8%
Myanmar 0.545 0.621 0.699 28.3% 0.5% 20.36 3.522 0.329 -98.4% -7.9% 14.7 1.618 0.128 42.71 21.88 5.363 -87.4% -4.1%
Malaysia 0.716 0.798 0.843 17.7% 0.3% 0.003 0 0 -100.0% 0.002 0 0 1.132 0.246 0.099 -91.3% -4.8%
Cambodia 0.512 0.65 0.758 48.0% 0.8% 8.485 3.047 0.301 -96.5% -6.5% 24 4.22 0.256 13 9 2.098 -83.9% -3.6%
Lao PDR 0.525 0.667 0.798 52.0% 0.8% 1.272 0.034 0 -100.0% 5.497 0.066 0 3.987 0.545 0.001 -100.0% -15.3%
Singapore 0.803 0.844 0.859 7.0% 0.1% 0 0 0 0 0 0 0 0 0
Timor-Leste 0.496 0.553 0.693 39.7% 0.7% 0.313 0.604 0.109 -65.2% -2.1% 8.503 8.424 0.77 0.661 1.268 0.412 -37.7% -0.9%
Brunei Darussalam 0.792 0.826 0.849 7.2% 0.1% 0 0 0 0 0 0 0 0 0
Asia-South East 0.63 0.704 0.771 22.4% 0.4% 49.11 12.95 1.349 -97.3% -6.9% 2.861 0.489 0.041 246.9 121.9 22.25 -91.0% -4.7%
VOL2_15 Forecast Tables rev.indd 215 21/08/2009 09:04

Patterns of Potential Hum
an Progress Volume 2: Enhancing Global Education
216
Patterns of Potential Human Progress Multination Regional Analysis Measures of Poverty, Health, Education, Infrastructure, and Governance
Base Case: Countries in Year 2060
Descending Population Sequence
Pop., Land Area, & Hum. Dev. Ind. PovertyHDI with Higher Ceilings Poverty (below $1 per Day) Poverty (below $2 per Day)
Index Million People Poverty Gap Index Million People
2010 2035 2060 % Chg % An Chg 2010 2035 2060 % Chg % An Chg 2010 2035 2060 2010 2035 2060 % Chg % An Chg
ASIA WITH OCEANIA continuedTurkey 0.674 0.766 0.85 26.1% 0.5% 0.377 0.041 0.001 -99.7% -11.2% 0.098 0.008 0 9.459 2.286 0.17 -98.2% -7.7%
Yemen 0.473 0.619 0.721 52.4% 0.8% 1.136 0.986 0.308 -72.9% -2.6% 1.111 0.496 0.099 6.816 7.287 3.302 -51.6% -1.4%
Iraq 0.537 0.668 0.767 42.8% 0.7% 6.409 0.343 0.001 -100.0% -16.1% 6.993 0.139 0 14.41 2.281 0.023 -99.8% -12.1%
Saudi Arabia 0.703 0.769 0.821 16.8% 0.3% 0 0 0 0 0 0 0 0 0
Syria 0.626 0.681 0.764 22.0% 0.4% 3.082 2.828 0.707 -77.1% -2.9% 4.344 2.584 0.465 7.419 7.336 2.5 -66.3% -2.2%
Israel 0.777 0.851 0.892 14.8% 0.3% 0 0 0 0 0 0 0 0 0
Azerbaijan 0.695 0.752 0.779 12.1% 0.2% 0 0 0 0 0 0 0 0 0
Jordan 0.658 0.752 0.851 29.3% 0.5% 0.001 0 0 -100.0% 0.002 0 0 0.276 0.011 0 -100.0%
Palestine 0.656 0.705 0.778 18.6% 0.3% 1.307 0.73 0.162 -87.6% -4.1% 9.924 2.577 0.389 2.305 1.805 0.528 -77.1% -2.9%
United Arab Emirates 0.799 0.826 0.85 6.4% 0.1% 0 0 0 0 0 0 0 0 0
Oman 0.711 0.785 0.824 15.9% 0.3% 0 0 0 0 0 0 0 0 0
Kuwait 0.793 0.844 0.845 6.6% 0.1% 0 0 0 0 0 0 0 0 0
Lebanon 0.653 0.739 0.822 25.9% 0.5% 0.087 0.062 0.006 -93.1% -5.2% 0.474 0.297 0.024 0.51 0.364 0.058 -88.6% -4.3%
Georgia 0.602 0.704 0.76 26.2% 0.5% 0.112 0.03 0.002 -98.2% -7.7% 0.588 0.172 0.014 0.724 0.279 0.035 -95.2% -5.9%
Armenia 0.683 0.768 0.823 20.5% 0.4% 0.01 0 0 -100.0% 0.056 0 0 0.755 0.059 0.003 -99.6% -10.5%
Bahrain 0.753 0.796 0.835 10.9% 0.2% 0 0 0 0 0 0 0 0 0
Qatar 0.793 0.85 0.86 8.4% 0.2% 0 0 0 0 0 0 0 0 0
Cyprus 0.783 0.825 0.858 9.6% 0.2% 0 0 0 0 0 0 0 0 0
Asia-West 0.641 0.725 0.798 24.5% 0.4% 12.52 5.02 1.186 -90.5% -4.6% 1.672 0.415 0.073 42.67 21.71 6.62 -84.5% -3.7%
Australia 0.81 0.841 0.875 8.0% 0.2% 0 0 0 0 0 0 0 0 0
Papua New Guniea 0.45 0.585 0.67 48.9% 0.8% 1.372 0.378 0.136 -90.1% -4.5% 7.872 1.093 0.277 3.286 1.667 0.821 -75.0% -2.7%
New Zealand 0.791 0.829 0.874 10.5% 0.2% 0 0 0 0 0 0 0 0 0
Solomon Islands 0.503 0.556 0.636 26.4% 0.5% 0.127 0.177 0.229 80.3% 1.2% 8.089 7.268 7.499 0.288 0.404 0.497 72.6% 1.1%
Fiji 0.656 0.707 0.793 20.9% 0.4% 0.158 0.058 0.003 -98.1% -7.6% 5.405 1.537 0.066 0.363 0.189 0.019 -94.8% -5.7%
Vanuatu 0.591 0.658 0.752 27.2% 0.5% 0.049 0.061 0.011 -77.6% -2.9% 6.767 5.368 0.615 0.105 0.137 0.041 -61.0% -1.9%
Micronesia 0.62 0.658 0.762 22.9% 0.4% 0.011 0.019 0.007 -36.4% -0.9% 2.452 2.906 0.838 0.032 0.048 0.021 -34.4% -0.8%
Tonga 0.686 0.705 0.773 12.7% 0.2% 0.021 0.029 0.016 -23.8% -0.5% 5.525 5.315 2.208 0.046 0.062 0.04 -13.0% -0.3%
Samoa 0.681 0.719 0.801 17.6% 0.3% 0.03 0.018 0.001 -96.7% -6.6% 4.766 2.256 0.116 0.07 0.05 0.006 -91.4% -4.8%
Oceania 0.727 0.768 0.811 11.6% 0.2% 1.767 0.74 0.403 -77.2% -2.9% 1.864 0.525 0.269 4.19 2.558 1.445 -65.5% -2.1%
VOL2_15 Forecast Tables rev.indd 216 21/08/2009 09:04

217Forecast Tables
Patterns of Potential Human Progress Multination Regional Analysis Measures of Poverty, Health, Education, Infrastructure, and Governance
Base Case: Countries in Year 2060
Descending Population Sequence
Pop., Land Area, & Hum. Dev. Ind. PovertyHDI with Higher Ceilings Poverty (below $1 per Day) Poverty (below $2 per Day)
Index Million People Poverty Gap Index Million People
2010 2035 2060 % Chg % An Chg 2010 2035 2060 % Chg % An Chg 2010 2035 2060 2010 2035 2060 % Chg % An Chg
EUROPERussian Federation 0.719 0.799 0.82 14.0% 0.3% 0.005 0 0 -100.0% 0.001 0 0 1.3 0 0 -100.0%
Ukraine 0.686 0.762 0.829 20.8% 0.4% 0.002 0 0 -100.0% 0 0 0 0.078 0 0 -100.0%
Poland 0.75 0.811 0.853 13.7% 0.3% 0.001 0 0 -100.0% 0 0 0 0.028 0 0 -100.0%
Romania 0.715 0.771 0.817 14.3% 0.3% 0.011 0.001 0 -100.0% 0.007 0.001 0 1.418 0.248 0.041 -97.1% -6.8%
Czech Republic 0.77 0.805 0.834 8.3% 0.2% 0 0 0 0 0 0 0.006 0.002 0 -100.0%
Belarus 0.712 0.778 0.826 16.0% 0.3% 0 0 0 0 0 0 0.014 0.002 0.001 -92.9% -5.1%
Hungary 0.75 0.797 0.836 11.5% 0.2% 0.001 0 0 -100.0% 0.001 0 0 0.011 0.002 0 -100.0%
Bulgaria 0.718 0.774 0.833 16.0% 0.3% 0.007 0 0 -100.0% 0.013 0 0 0.092 0.003 0 -100.0%
Slovakia 0.754 0.788 0.826 9.5% 0.2% 0.001 0 0 -100.0% 0.001 0.001 0.001 0.006 0.002 0.001 -83.3% -3.5%
Moldova, Rep. of 0.634 0.676 0.761 20.0% 0.4% 0.006 0.001 0 -100.0% 0.023 0.004 0 2.462 1.184 0.055 -97.8% -7.3%
Europe-East 0.72 0.791 0.826 14.7% 0.3% 0.035 0.003 0 -100.0% 0.002 0 0 5.416 1.443 0.099 -98.2% -7.7%
United Kingdom 0.801 0.835 0.877 9.5% 0.2% 0 0 0 0 0 0 0 0 0
Sweden 0.81 0.849 0.887 9.5% 0.2% 0 0 0 0 0 0 0 0 0
Denmark 0.799 0.835 0.877 9.8% 0.2% 0 0 0 0 0 0 0 0 0
Ireland 0.815 0.85 0.872 7.0% 0.1% 0 0 0 0 0 0 0 0 0
Norway 0.825 0.855 0.884 7.2% 0.1% 0 0 0 0 0 0 0 0 0
Finland 0.803 0.836 0.876 9.1% 0.2% 0 0 0 0 0 0 0 0 0
Lithuania 0.742 0.793 0.837 12.8% 0.2% 0.001 0 0 -100.0% 0.005 0.001 0 0.088 0.019 0.002 -97.7% -7.3%
Latvia 0.742 0.807 0.852 14.8% 0.3% 0.001 0 0 -100.0% 0.004 0 0 0.007 0.001 0 -100.0%
Estonia 0.759 0.813 0.853 12.4% 0.2% 0 0 0 0.005 0 0 0.016 0.002 0 -100.0%
Iceland 0.815 0.851 0.887 8.8% 0.2% 0 0 0 0 0 0 0 0 0
Europe-North 0.8 0.836 0.876 9.5% 0.2% 0.002 0 0 -100.0% 0 0 0 0.111 0.022 0.002 -98.2% -7.7%
Italy 0.795 0.818 0.852 7.2% 0.1% 0 0 0 0 0 0 0 0 0
Spain 0.792 0.827 0.859 8.5% 0.2% 0 0 0 0 0 0 0 0 0
Greece 0.789 0.822 0.848 7.5% 0.1% 0 0 0 0 0 0 0 0 0
Portugal 0.756 0.803 0.851 12.6% 0.2% 0.001 0.001 0 -100.0% 0.001 0.002 0 0.025 0.029 0.007 -72.0% -2.5%
Serbia 0.685 0.747 0.823 20.1% 0.4% 0.215 0.027 0.002 -99.1% -8.9% 0.516 0.06 0.004 0.946 0.178 0.015 -98.4% -8.0%
Croatia 0.745 0.788 0.841 12.9% 0.2% 0 0 0 0 0 0 0.008 0.001 0 -100.0%
Bosnia and Herzegovina 0.693 0.724 0.778 12.3% 0.2% 0.596 0.725 0.074 -87.6% -4.1% 3.963 5.753 0.563 1.387 1.48 0.229 -83.5% -3.5%
Albania 0.707 0.76 0.819 15.8% 0.3% 0.001 0 0 -100.0% 0.003 0.001 0 0.2 0.066 0.004 -98.0% -7.5%
Macedonia, TFYR 0.706 0.72 0.77 9.1% 0.2% 0 0.001 0 0.003 0.005 0 0.004 0.006 0.001 -75.0% -2.7%
Slovenia 0.782 0.821 0.863 10.4% 0.2% 0 0 0 0 0 0 0.002 0 0 -100.0%
Montenegro 0.675 0.741 0.828 22.7% 0.4% 0.052 0.021 0.001 -98.1% -7.6% 2.212 0.81 0.044 0.155 0.079 0.008 -94.8% -5.8%
Malta 0.756 0.812 0.861 13.9% 0.3% 0 0 0 0 0 0 0 0 0
Europe-South 0.777 0.81 0.848 9.1% 0.2% 0.865 0.775 0.077 -91.1% -4.7% 0.143 0.162 0.016 2.727 1.84 0.264 -90.3% -4.6%
Germany 0.797 0.829 0.873 9.5% 0.2% 0 0 0 0 0 0 0 0 0
France 0.802 0.831 0.875 9.1% 0.2% 0 0 0 0 0 0 0 0 0
Netherlands 0.804 0.83 0.863 7.3% 0.1% 0 0 0 0 0 0 0 0 0
Belgium 0.801 0.826 0.866 8.1% 0.2% 0 0 0 0 0 0 0 0 0
Austria 0.803 0.833 0.87 8.3% 0.2% 0 0 0 0 0 0 0 0 0
Switzerland 0.813 0.842 0.879 8.1% 0.2% 0 0 0 0 0 0 0 0 0
Luxembourg 0.84 0.855 0.874 4.0% 0.1% 0 0 0 0 0 0 0 0 0
Europe-West 0.8 0.831 0.873 9.1% 0.2% 0 0 0 0 0 0 0 0 0
VOL2_15 Forecast Tables rev.indd 217 21/08/2009 09:05

Patterns of Potential Hum
an Progress Volume 2: Enhancing Global Education
218
Patterns of Potential Human Progress Multination Regional Analysis Measures of Poverty, Health, Education, Infrastructure, and Governance
Base Case
Source: International Futures Version 6.12, March 2009
PovertyPoverty (below $5 per Day) Poverty (below $10 per Day) Poverty (below $20 per Day)
Million People Percent Million People Percent Million People Percent
2010 2035 2060 2010 2035 2060 2010 2035 2060 2010 2035 2060 2010 2035 2060 2010 2035 2060
World 4224 3477 2218 62.1% 41.3% 23.5% 5112 5066 3882 75.1% 60.2% 41.1% 5697 6240 5669 83.7% 74.1% 60.0%
Africa 869.7 1195 1302 86.2% 71.0% 55.3% 953.2 1450 1770 94.5% 86.2% 75.2% 987.4 1588 2093 97.9% 94.4% 88.9%Americas 297.3 230.2 122.5 31.7% 20.4% 10.1% 443.2 406.6 261.2 47.3% 36.1% 21.6% 562.1 570.7 443 60.0% 50.7% 36.6%Asia with Oceania 2996 2034 788.4 72.5% 41.4% 15.0% 3540 3153 1831 85.7% 64.2% 34.8% 3815 3933 3073 92.4% 80.1% 58.4%Europe 58.04 15.78 4.092 8.1% 2.3% 0.7% 168.7 51.04 18.21 23.4% 7.4% 3.0% 322.8 139.2 54.55 44.8% 20.2% 9.0%World 4224 3477 2218 62.1% 41.3% 23.5% 5112 5066 3882 75.1% 60.2% 41.1% 5697 6240 5669 83.7% 74.1% 60.0%
Africa-Eastern 308.7 495.5 351.8 96.4% 87.1% 44.4% 316.3 541.3 544.1 98.8% 95.2% 68.6% 317 556.9 676 99.0% 97.9% 85.3%Africa-Middle 107 186.2 315.7 84.3% 74.7% 74.5% 118.8 212.6 364.7 93.6% 85.3% 86.0% 123.6 234.1 396 97.4% 94.0% 93.4%Africa-Northern 133.5 105.1 69.22 64.8% 38.2% 21.8% 177.1 180.3 162 86.0% 65.5% 51.0% 198.1 230.8 252.6 96.2% 83.9% 79.5%Africa-Southern 33.97 27.11 13.73 59.8% 39.5% 18.6% 45.65 43.52 28.64 80.4% 63.5% 38.9% 52.72 56.94 46.29 92.8% 83.1% 62.9%Africa-Western 286.6 381.4 551.7 95.9% 73.2% 74.0% 295.4 472.7 670.4 98.8% 90.7% 89.9% 295.9 509.4 722.4 99.0% 97.8% 96.9%Africa 869.7 1195 1302 86.2% 71.0% 55.3% 953.2 1450 1770 94.5% 86.2% 75.2% 987.4 1588 2093 97.9% 94.4% 88.9%
America-Caribbean 22.85 21.72 15.48 57.8% 46.3% 30.7% 30.01 29.96 20.61 75.9% 63.8% 40.8% 34.81 36.61 28.55 88.1% 78.0% 56.6%America-Central 29.12 35.19 28.13 66.4% 55.7% 37.4% 36.87 46.54 42.77 84.0% 73.7% 56.8% 41.29 54.67 55.25 94.1% 86.5% 73.4%America-North 57.96 42.85 21.17 12.8% 8.1% 3.7% 92.08 83.97 56.29 20.3% 15.8% 10.0% 133.7 120.4 97.52 29.5% 22.7% 17.3%America-South 187.4 130.5 57.71 46.9% 26.9% 11.1% 284.3 246.1 141.5 71.1% 50.8% 27.1% 352.3 358.9 261.7 88.1% 74.0% 50.2%Americas 297.3 230.2 122.5 31.7% 20.4% 10.1% 443.2 406.6 261.2 47.3% 36.1% 21.6% 562.1 570.7 443 60.0% 50.7% 36.6%
Asia-East 856.9 204.1 26.45 54.4% 12.1% 1.6% 1201 546.3 117.4 76.2% 32.3% 7.0% 1385 1006 373.2 87.9% 59.5% 22.4%Asia-South Central 1552 1343 563.2 91.0% 62.1% 23.1% 1625 1859 1246 95.3% 86.0% 51.1% 1657 2024 1949 97.2% 93.6% 79.9%Asia-South East 466.7 389.3 154.7 79.7% 56.2% 21.5% 544.9 566.8 363 93.1% 81.9% 50.5% 567.4 648 561.5 96.9% 93.6% 78.1%Asia-West 114 90.7 39.2 49.8% 27.8% 10.0% 161.6 170.6 95.67 70.6% 52.4% 24.4% 193.5 242 175.7 84.5% 74.3% 44.8%Oceania 7.151 6.833 4.862 20.9% 15.8% 10.0% 8.691 10.11 8.92 25.4% 23.4% 18.3% 12.4 13.26 12.95 36.2% 30.8% 26.5%Asia with Oceania 2996 2034 788.4 72.5% 41.4% 15.0% 3540 3153 1831 85.7% 64.2% 34.8% 3815 3933 3073 92.4% 80.1% 58.4%
Europe-East 46.98 9.507 2.328 16.0% 3.6% 1.0% 143.8 33.94 12 49.0% 12.8% 5.3% 241.3 88.03 34.77 82.2% 33.1% 15.5%Europe-North 1.499 0.527 0.086 1.5% 0.5% 0.1% 4.982 2.322 0.612 5.1% 2.3% 0.6% 15.91 7.45 2.309 16.2% 7.2% 2.3%Europe-South 12.35 7.866 2.141 8.3% 5.6% 1.8% 25.13 19.09 7.663 16.9% 13.6% 6.4% 54.08 43.15 21.41 36.3% 30.6% 17.9%Europe-West 0.033 0.017 0.001 0.0% 0.0% 0.0% 1.432 0.618 0.056 0.8% 0.3% 0.0% 20.78 8.9 1.198 11.0% 4.7% 0.7%Europe 58.04 15.78 4.092 8.1% 2.3% 0.7% 168.7 51.04 18.21 23.4% 7.4% 3.0% 322.8 139.2 54.55 44.8% 20.2% 9.0%
VOL2_15 Forecast Tables rev.indd 218 21/08/2009 09:05

219Forecast Tables
Patterns of Potential Human Progress Multination Regional Analysis Measures of Poverty, Health, Education, Infrastructure, and Governance
Base Case: Countries in Year 2060
Descending Population Sequence
PovertyPoverty (below $5 per Day) Poverty (below $10 per Day) Poverty (below $20 per Day)
Million People Percent Million People Percent Million People Percent
2010 2035 2060 2010 2035 2060 2010 2035 2060 2010 2035 2060 2010 2035 2060 2010 2035 2060
AFRICAEthiopia 79.27 139.9 106.3 98.3% 97.5% 50.4% 79.84 142.1 180.6 99.0% 99.0% 85.6% 79.84 142.1 207.3 99.0% 99.0% 98.2%
Uganda 33.76 67.64 46.2 98.8% 94.5% 44.1% 33.82 70.88 75.28 99.0% 99.0% 71.8% 33.82 70.88 94.72 99.0% 99.0% 90.4%
Tanzania, United Rep. of 43.18 60.19 4.362 98.7% 79.2% 4.4% 43.34 73.17 25.65 99.0% 96.3% 25.8% 43.34 75.2 65.44 99.0% 99.0% 65.9%
Kenya 35.7 49.57 17.78 91.0% 74.7% 21.3% 38.72 61.82 42.17 98.6% 93.1% 50.5% 38.86 65.68 66.32 99.0% 98.9% 79.4%
Madagascar 20.7 35.78 41.71 98.1% 97.8% 81.1% 20.89 36.22 48.36 99.0% 99.0% 94.0% 20.89 36.22 50.78 99.0% 99.0% 98.7%
Mozambique 19.17 11.43 0.029 85.5% 30.4% 0.1% 21.65 22.2 0.44 96.5% 59.0% 0.9% 22.21 31.37 3.325 99.0% 83.3% 6.8%
Malawi 14.43 27.25 28.08 97.3% 98.0% 70.8% 14.68 27.53 36.63 99.0% 99.0% 92.3% 14.68 27.53 39.26 99.0% 99.0% 98.9%
Zambia 13.03 22.32 18.7 98.6% 93.8% 58.0% 13.08 23.49 26.39 99.0% 98.7% 81.9% 13.08 23.55 30.53 99.0% 99.0% 94.8%
Burundi 8.733 17.43 12 99.0% 98.4% 42.2% 8.733 17.53 22.43 99.0% 99.0% 79.0% 8.733 17.53 27.4 99.0% 99.0% 96.4%
Rwanda 10.07 17.97 17.58 96.5% 92.9% 62.5% 10.33 19.08 23.58 98.9% 98.6% 83.8% 10.33 19.16 26.76 98.9% 99.0% 95.1%
Somalia 9.168 14.89 24.49 99.0% 99.0% 97.6% 9.168 14.89 24.83 99.0% 99.0% 99.0% 9.168 14.89 24.83 99.0% 99.0% 99.0%
Zimbabwe 14.22 20.27 20.68 98.7% 96.2% 87.3% 14.26 20.86 22.72 99.0% 99.0% 95.9% 14.26 20.86 23.44 99.0% 99.0% 99.0%
Eritrea 5.05 8.477 12.3 99.0% 99.0% 98.2% 5.051 8.477 12.41 99.0% 99.0% 99.0% 5.051 8.477 12.41 99.0% 99.0% 99.0%
Mauritius 0.805 0.426 0.126 62.1% 29.0% 8.5% 1.181 1 0.522 91.1% 68.1% 35.1% 1.284 1.37 1.084 99.0% 93.3% 72.8%
Comoros 0.646 0.989 0.928 97.1% 92.9% 65.9% 0.658 1.05 1.208 98.9% 98.6% 85.8% 0.658 1.054 1.35 98.9% 99.0% 95.9%
Djibouti 0.776 0.893 0.559 92.1% 83.1% 49.9% 0.832 1.03 0.877 98.7% 95.8% 78.3% 0.835 1.064 1.055 99.1% 99.0% 94.2%
Africa-Eastern 308.7 495.5 351.8 96.4% 87.1% 44.4% 316.3 541.3 544.1 98.8% 95.2% 68.6% 317 556.9 676 99.0% 97.9% 85.3%
Congo; Dem. Rep. of 67.03 140.8 247.4 99.0% 98.9% 94.5% 67.03 140.8 259 99.0% 98.9% 99.0% 67.03 140.8 259.1 99.0% 98.9% 99.0%
Angola 8.589 5.716 7.503 46.9% 16.3% 13.1% 14.49 16.35 22.86 79.1% 46.6% 39.9% 17.5 27.76 41.77 95.5% 79.2% 72.9%
Cameroon 15.34 23.32 19.11 83.9% 77.1% 47.0% 17.65 28.31 30.38 96.5% 93.6% 74.7% 18.1 29.93 37.43 99.0% 98.9% 92.0%
Chad 8.816 6.56 30.11 77.7% 28.9% 78.5% 10.84 14.35 36.36 95.5% 63.2% 94.8% 11.24 20.23 37.95 99.0% 89.0% 99.0%
Central African Republic 4.312 7.299 8.763 96.1% 94.0% 76.5% 4.443 7.641 10.35 99.0% 98.4% 90.4% 4.443 7.691 11.11 99.0% 99.0% 97.0%
Congo, Rep. of 2.547 1.919 2.396 56.3% 25.2% 23.3% 3.826 4.236 5.168 84.6% 55.5% 50.2% 4.385 6.319 7.93 97.0% 82.9% 77.0%
Gabon 0.153 0.224 0.026 10.1% 10.3% 1.0% 0.37 0.539 0.106 24.5% 24.7% 4.0% 0.69 1.003 0.322 45.6% 46.0% 12.2%
Equatorial Guinea 0 0 0 0.0% 0.0% 0.0% 0.005 0.002 0.003 0.9% 0.2% 0.2% 0.083 0.041 0.042 14.7% 4.6% 3.5%
São Tomé and Príncipe 0.17 0.292 0.361 96.6% 98.0% 86.4% 0.174 0.295 0.403 98.9% 99.0% 96.4% 0.174 0.295 0.414 98.9% 99.0% 99.0%
Africa-Middle 107 186.2 315.7 84.3% 74.7% 74.5% 118.8 212.6 364.7 93.6% 85.3% 86.0% 123.6 234.1 396 97.4% 94.0% 93.4%
Egypt 70.43 56.17 14.82 86.8% 52.7% 12.1% 80.07 92.02 52.48 98.7% 86.3% 42.8% 80.32 104.8 96.92 99.0% 98.3% 79.1%
Sudan 36.44 35.44 42.98 90.4% 55.3% 50.6% 39.88 54.86 70.9 98.9% 85.6% 83.4% 39.93 62.62 82.7 99.0% 97.7% 97.3%
Algeria 7.417 0.363 7.081 21.0% 0.8% 15.4% 21.25 4.305 22.91 60.1% 9.8% 49.8% 32.04 18.69 38.8 90.7% 42.4% 84.4%
Morocco 15.09 12.52 3.589 46.9% 32.1% 8.8% 26.06 25.95 12.23 81.1% 66.6% 29.9% 31.09 35.34 25.27 96.7% 90.6% 61.8%
Tunisia 1.769 0.506 0.058 16.7% 4.0% 0.4% 5.153 2.432 0.515 48.7% 19.2% 3.8% 8.637 6.386 2.415 81.6% 50.4% 17.9%
Libyan Arab Jamahiriya 2.314 0.075 0.699 35.8% 0.9% 7.1% 4.69 0.712 2.951 72.6% 8.2% 29.9% 6.078 2.978 6.524 94.1% 34.2% 66.1%
Africa-Northern 133.5 105.1 69.22 64.8% 38.2% 21.8% 177.1 180.3 162 86.0% 65.5% 51.0% 198.1 230.8 252.6 96.2% 83.9% 79.5%
VOL2_15 Forecast Tables rev.indd 219 21/08/2009 09:05

Patterns of Potential Hum
an Progress Volume 2: Enhancing Global Education
220
Patterns of Potential Human Progress Multination Regional Analysis Measures of Poverty, Health, Education, Infrastructure, and Governance
Base Case: Countries in Year 2060
Descending Population Sequence
PovertyPoverty (below $5 per Day) Poverty (below $10 per Day) Poverty (below $20 per Day)
Million People Percent Million People Percent Million People Percent
2010 2035 2060 2010 2035 2060 2010 2035 2060 2010 2035 2060 2010 2035 2060 2010 2035 2060
AFRICA continuedSouth Africa 28.97 22.06 11.11 58.5% 37.7% 17.9% 39.51 36.62 24.04 79.8% 62.6% 38.6% 45.91 48.58 39.46 92.7% 83.0% 63.4%
Namibia 1.474 1.441 0.446 66.5% 45.0% 11.7% 1.869 2.165 1.036 84.4% 67.6% 27.1% 2.092 2.724 1.87 94.4% 85.0% 48.9%
Lesotho 1.497 1.667 0.769 77.4% 63.4% 26.1% 1.759 2.162 1.406 90.9% 82.3% 47.6% 1.882 2.455 2.065 97.3% 93.4% 70.0%
Botswana 0.865 0.427 0.175 45.6% 17.6% 6.7% 1.293 0.883 0.47 68.1% 36.4% 18.0% 1.621 1.438 0.965 85.4% 59.2% 36.9%
Swaziland 1.165 1.509 1.229 94.9% 85.6% 60.9% 1.215 1.692 1.692 99.0% 96.0% 83.9% 1.215 1.744 1.927 99.0% 99.0% 95.5%
Africa-Southern 33.97 27.11 13.73 59.8% 39.5% 18.6% 45.65 43.52 28.64 80.4% 63.5% 38.9% 52.72 56.94 46.29 92.8% 83.1% 62.9%
Nigeria 144.3 144.8 317.2 96.7% 56.6% 88.5% 147.8 215.8 350.4 99.0% 84.3% 97.7% 147.8 247.7 355.1 99.0% 96.8% 99.0%
Niger 15.82 31.45 36.32 97.6% 97.2% 70.6% 16.05 32.02 45.26 99.0% 99.0% 88.0% 16.05 32.02 49.61 99.0% 99.0% 96.5%
Côte d’Ivoire 17.26 23.85 24.62 84.5% 67.8% 50.6% 19.75 31.39 37.97 96.7% 89.2% 78.0% 20.22 34.41 45.62 99.0% 97.8% 93.7%
Ghana 23.83 35.63 39.33 97.6% 96.2% 85.2% 24.16 36.65 44.48 99.0% 99.0% 96.3% 24.16 36.65 45.71 99.0% 99.0% 99.0%
Burkina Faso 14.51 26.52 12.73 95.6% 92.4% 29.2% 15.01 28.41 27.43 98.9% 99.0% 62.9% 15.01 28.41 38.65 98.9% 99.0% 88.6%
Mali 15.22 28.06 27.21 97.9% 96.6% 62.7% 15.39 28.75 37.52 99.0% 99.0% 86.5% 15.39 28.75 42.09 99.0% 99.0% 97.0%
Senegal 12.16 19.33 18.92 92.0% 81.8% 54.1% 13.08 22.67 28.54 98.9% 95.9% 81.6% 13.09 23.39 33.4 99.0% 99.0% 95.5%
Guinea 10.05 15.73 9.902 97.5% 85.1% 35.4% 10.21 18.04 19.56 99.0% 97.6% 69.9% 10.21 18.31 25.81 99.0% 99.0% 92.2%
Benin 9.401 16.67 17.04 97.6% 97.6% 69.5% 9.541 16.91 22.36 99.0% 99.0% 91.2% 9.541 16.91 24.17 99.0% 99.0% 98.6%
Togo 6.895 11.82 15.71 99.0% 99.1% 95.4% 6.895 11.82 16.3 99.0% 99.1% 99.0% 6.895 11.82 16.3 99.0% 99.1% 99.0%
Sierra Leone 6.035 7.378 3.846 95.9% 70.5% 25.2% 6.23 9.505 8.312 99.0% 90.8% 54.5% 6.23 10.29 12.42 99.0% 98.3% 81.4%
Liberia 3.822 7.837 14.42 99.0% 99.0% 97.7% 3.822 7.837 14.61 99.0% 99.0% 99.0% 3.822 7.837 14.61 99.0% 99.0% 99.0%
Mauritania 3.32 5.493 5.08 96.6% 94.6% 60.7% 3.403 5.749 7.363 99.0% 99.0% 88.0% 3.403 5.749 8.207 99.0% 99.0% 98.1%
Guinea-Bissau 1.832 3.652 6.156 99.0% 99.0% 98.8% 1.832 3.652 6.167 99.0% 99.0% 99.0% 1.832 3.652 6.167 99.0% 99.0% 99.0%
Gambia 1.643 2.634 3.049 97.0% 93.9% 76.0% 1.677 2.771 3.68 99.0% 98.8% 91.7% 1.677 2.776 3.934 99.0% 99.0% 98.1%
Cape Verde 0.474 0.512 0.221 83.7% 61.1% 22.1% 0.54 0.688 0.448 95.4% 82.1% 44.7% 0.561 0.788 0.694 99.1% 94.0% 69.3%
Africa-Western 286.6 381.4 551.7 95.9% 73.2% 74.0% 295.4 472.7 670.4 98.8% 90.7% 89.9% 295.9 509.4 722.4 99.0% 97.8% 96.9%
VOL2_15 Forecast Tables rev.indd 220 21/08/2009 09:05

221Forecast Tables
Patterns of Potential Human Progress Multination Regional Analysis Measures of Poverty, Health, Education, Infrastructure, and Governance
Base Case: Countries in Year 2060
Descending Population Sequence
PovertyPoverty (below $5 per Day) Poverty (below $10 per Day) Poverty (below $20 per Day)
Million People Percent Million People Percent Million People Percent
2010 2035 2060 2010 2035 2060 2010 2035 2060 2010 2035 2060 2010 2035 2060 2010 2035 2060
AMERICASHaiti 8.789 12.59 14.04 94.5% 92.2% 82.4% 9.169 13.34 15.93 98.6% 97.7% 93.5% 9.21 13.51 16.73 99.0% 99.0% 98.2%
Dominican Republic 2.884 1.265 0.318 30.0% 10.8% 2.5% 5.539 3.419 1.281 57.6% 29.2% 9.9% 7.865 6.513 3.518 81.9% 55.7% 27.3%
Cuba 8.896 6.073 0.174 77.8% 53.8% 1.7% 10.9 9.623 1.432 95.4% 85.2% 14.0% 11.31 11.03 4.953 99.0% 97.7% 48.4%
Puerto Rico 0.25 0.051 0.007 6.2% 1.1% 0.1% 0.83 0.272 0.056 20.4% 5.9% 1.2% 1.851 0.924 0.289 45.6% 19.9% 6.1%
Jamaica 1.202 1.276 0.854 43.6% 40.7% 27.2% 2.051 2.187 1.621 74.4% 69.8% 51.6% 2.563 2.815 2.368 93.0% 89.9% 75.4%
Trinidad and Tobago 0.437 0.168 0.003 32.6% 12.3% 0.2% 0.912 0.559 0.033 68.1% 40.9% 2.7% 1.229 1.036 0.181 91.8% 75.8% 14.5%
Bahamas 0.002 0 0 0.6% 0.0% 0.0% 0.025 0.009 0.001 7.4% 2.3% 0.2% 0.116 0.069 0.019 34.1% 17.3% 4.6%
Barbados 0.115 0.062 0.007 41.8% 22.3% 2.8% 0.214 0.16 0.04 77.8% 57.6% 16.3% 0.263 0.243 0.117 95.6% 87.4% 47.6%
St. Vincent & the Grenadines 0.1 0.097 0.03 78.7% 61.0% 17.0% 0.122 0.14 0.084 96.1% 88.1% 47.7% 0.126 0.156 0.14 99.2% 98.1% 79.5%
Grenada 0.079 0.083 0.034 69.9% 56.8% 20.6% 0.105 0.125 0.084 92.9% 85.6% 50.9% 0.112 0.142 0.133 99.1% 97.3% 80.6%
St. Lucia 0.1 0.062 0.013 58.8% 35.2% 8.1% 0.147 0.122 0.051 86.5% 69.3% 31.9% 0.166 0.162 0.107 97.6% 92.0% 66.9%
America-Caribbean 22.85 21.72 15.48 57.8% 46.3% 30.7% 30.01 29.96 20.61 75.9% 63.8% 40.8% 34.81 36.61 28.55 88.1% 78.0% 56.6%
Guatemala 9.962 13.96 12.53 69.5% 57.6% 39.2% 12.79 19.41 20.16 89.3% 80.0% 63.1% 13.98 22.61 26.43 97.6% 93.2% 82.7%
Honduras 5.775 7.302 4.953 72.6% 65.7% 39.1% 7.116 9.325 7.854 89.4% 83.9% 62.0% 7.73 10.47 10.29 97.1% 94.2% 81.3%
El Salvador 5.477 5.729 3.814 73.6% 60.4% 36.3% 6.728 7.67 6.215 90.4% 80.9% 59.2% 7.266 8.828 8.32 97.6% 93.1% 79.2%
Nicaragua 5.504 7.322 6.695 97.1% 94.5% 78.2% 5.613 7.673 7.961 99.0% 99.0% 93.0% 5.613 7.673 8.432 99.0% 99.0% 98.5%
Costa Rica 1.014 0.218 0.007 21.7% 3.7% 0.1% 2.295 0.911 0.076 49.1% 15.6% 1.2% 3.596 2.37 0.454 77.0% 40.6% 7.1%
Panama 1.178 0.52 0.096 33.9% 12.1% 2.0% 2.041 1.273 0.373 58.8% 29.5% 7.9% 2.795 2.319 1.034 80.5% 53.7% 21.9%
Belize 0.211 0.137 0.038 66.1% 31.0% 7.4% 0.29 0.28 0.133 90.9% 63.3% 25.9% 0.315 0.389 0.289 98.7% 88.0% 56.3%
America-Central 29.12 35.19 28.13 66.4% 55.7% 37.4% 36.87 46.54 42.77 84.0% 73.7% 56.8% 41.29 54.67 55.25 94.1% 86.5% 73.4%
United States of America 0.202 0.013 0.001 0.1% 0.0% 0.0% 3.39 0.422 0.051 1.1% 0.1% 0.0% 26.5 6.158 1.234 8.5% 1.7% 0.3%
Mexico 57.75 42.83 21.17 53.0% 33.4% 16.3% 88.49 83.53 56.24 81.2% 65.1% 43.2% 104.1 113.7 96.25 95.5% 88.6% 73.9%
Canada 0.004 0 0 0.0% 0.0% 0.0% 0.2 0.016 0 0.6% 0.0% 0.0% 3.083 0.603 0.029 9.2% 1.6% 0.1%
America-North 57.96 42.85 21.17 12.8% 8.1% 3.7% 92.08 83.97 56.29 20.3% 15.8% 10.0% 133.7 120.4 97.52 29.5% 22.7% 17.3%
Brazil 92.09 60.2 25.41 46.4% 25.5% 10.1% 140.4 117.9 67.52 70.7% 49.9% 26.9% 175 175.7 129.8 88.1% 74.4% 51.6%
Colombia 19.77 15.53 5.353 40.5% 26.0% 8.3% 31.71 29.18 14.06 65.0% 48.9% 21.7% 41.17 43.05 27.86 84.3% 72.2% 43.0%
Argentina 18.32 8.692 1.741 44.9% 18.0% 3.3% 29.38 20.5 7.059 72.0% 42.5% 13.5% 36.82 33.97 18.56 90.2% 70.4% 35.6%
Venezuela, RB 15.39 11.17 4.508 53.3% 30.1% 11.0% 23.06 22.13 12.62 79.9% 59.5% 30.8% 27.26 31.32 24.12 94.4% 84.3% 58.8%
Peru 17.69 13.96 7.261 59.0% 37.6% 18.0% 24.62 23.76 15.87 82.1% 64.1% 39.4% 28.38 31.52 26.05 94.7% 85.0% 64.7%
Chile 2.803 0.365 0.011 16.4% 1.8% 0.1% 6.39 1.638 0.114 37.4% 8.1% 0.5% 10.78 4.889 0.733 63.2% 24.2% 3.5%
Ecuador 9.7 10.48 7.857 67.7% 57.4% 40.4% 12.97 15.31 13.38 90.6% 83.9% 68.8% 14.1 17.59 17.3 98.5% 96.4% 88.9%
Bolivia 6.619 4.959 2.554 65.8% 35.5% 15.6% 8.438 8.151 5.468 83.9% 58.3% 33.4% 9.476 10.99 9.18 94.2% 78.6% 56.1%
Paraguay 4.11 4.728 2.896 63.4% 53.4% 28.9% 5.355 6.621 5.114 82.6% 74.8% 51.1% 6.078 7.918 7.298 93.7% 89.4% 72.9%
Uruguay 0.315 0.054 0.002 8.9% 1.4% 0.1% 1.052 0.328 0.031 29.6% 8.6% 0.8% 2.165 1.125 0.228 60.9% 29.4% 5.8%
Guyana 0.206 0.065 0.007 27.3% 9.3% 1.1% 0.445 0.205 0.036 59.0% 29.4% 5.8% 0.644 0.413 0.121 85.4% 59.3% 19.5%
Suriname 0.345 0.264 0.108 74.4% 54.7% 24.6% 0.438 0.41 0.253 94.4% 84.9% 57.6% 0.459 0.47 0.377 98.9% 97.3% 85.9%
America-South 187.4 130.5 57.71 46.9% 26.9% 11.1% 284.3 246.1 141.5 71.1% 50.8% 27.1% 352.3 358.9 261.7 88.1% 74.0% 50.2%
VOL2_15 Forecast Tables rev.indd 221 21/08/2009 09:06

Patterns of Potential Hum
an Progress Volume 2: Enhancing Global Education
222
Patterns of Potential Human Progress Multination Regional Analysis Measures of Poverty, Health, Education, Infrastructure, and Governance
Base Case: Countries in Year 2060
Descending Population Sequence
PovertyPoverty (below $5 per Day) Poverty (below $10 per Day) Poverty (below $20 per Day)
Million People Percent Million People Percent Million People Percent
2010 2035 2060 2010 2035 2060 2010 2035 2060 2010 2035 2060 2010 2035 2060 2010 2035 2060
ASIA WITH OCEANIAChina 833.7 185.2 17.65 62.1% 12.6% 1.2% 1155 517.7 100.2 86.1% 35.3% 6.8% 1300 955.4 345.6 96.9% 65.2% 23.4%
Japan 0 0 0 0.0% 0.0% 0.0% 0.132 0.006 0 0.1% 0.0% 0.0% 8.334 1.031 0.016 6.5% 0.9% 0.0%
Korea, Rep. of 3.117 0.158 0.008 6.3% 0.3% 0.0% 17.92 3.061 0.319 36.5% 6.2% 0.8% 39.21 17.92 4.09 79.8% 36.4% 10.4%
Taiwan 0.369 0.021 0 1.6% 0.1% 0.0% 3.168 0.512 0.013 13.3% 1.9% 0.0% 11.27 4.364 0.34 47.4% 16.2% 1.3%
Korea, Dem. Rep. of 17.1 16.26 8.493 74.8% 68.8% 38.6% 21.53 21.7 15.55 94.2% 91.8% 70.6% 22.62 23.38 20.16 99.0% 98.9% 91.5%
Hong Kong 0.025 0.003 0.002 0.3% 0.0% 0.0% 0.239 0.057 0.035 3.3% 0.7% 0.4% 1.186 0.473 0.296 16.2% 5.6% 3.5%
Mongolia 2.581 2.509 0.298 94.6% 76.2% 8.6% 2.7 3.177 1.312 99.0% 96.5% 37.7% 2.7 3.259 2.682 99.0% 99.0% 77.2%
Asia-East 856.9 204.1 26.45 54.4% 12.1% 1.6% 1201 546.3 117.4 76.2% 32.3% 7.0% 1385 1006 373.2 87.9% 59.5% 22.4%
India 1109 793.5 139.8 95.6% 56.8% 9.2% 1148 1228 588.3 99.0% 87.8% 38.9% 1148 1377 1175 99.0% 98.5% 77.7%
Pakistan 168.6 249.7 197.3 98.1% 92.8% 56.8% 170.2 266.4 312.7 99.0% 99.0% 90.0% 170.2 266.4 343.9 99.0% 99.0% 99.0%
Bangladesh 150.4 145.1 55.01 97.9% 75.4% 27.0% 152.1 185.1 135.4 99.0% 96.2% 66.4% 152.1 190.6 189.1 99.0% 99.0% 92.8%
Afghanistan 35.25 73.86 128.9 98.9% 98.6% 94.0% 35.3 74.17 135.5 99.0% 99.0% 98.8% 35.3 74.17 135.7 99.0% 99.0% 99.0%
Iran, Islamic Rep. of 2.858 0.001 0.003 3.9% 0.0% 0.0% 15.71 0.042 0.111 21.7% 0.0% 0.1% 41.71 1.027 1.866 57.6% 1.1% 1.9%
Nepal 28.4 37.26 30.81 96.6% 91.8% 68.8% 29.1 39.89 39.09 99.0% 98.3% 87.3% 29.1 40.19 43.14 99.0% 99.0% 96.3%
Uzbekistan 23.34 21.22 3.719 84.0% 63.5% 11.2% 27.2 30.8 14.7 97.9% 92.2% 44.1% 27.5 33.08 27.37 99.0% 99.0% 82.2%
Sri Lanka 16.03 10.31 3.024 78.6% 46.7% 14.3% 19.52 17.41 8.684 95.7% 78.8% 40.9% 20.19 21.07 15.47 99.0% 95.4% 72.9%
Kazakhstan 2.851 0.001 0 18.8% 0.0% 0.0% 9.229 0.069 0.001 60.8% 0.4% 0.0% 14.02 1.414 0.072 92.4% 9.2% 0.5%
Tajikistan 5.887 7.654 3.337 84.6% 78.1% 30.9% 6.84 9.425 7.138 98.3% 96.2% 66.1% 6.887 9.7 9.807 99.0% 99.0% 90.8%
Turkmenistan 3.556 0.068 0.014 68.9% 1.0% 0.2% 4.745 0.594 0.177 92.0% 9.1% 2.5% 5.105 2.352 1.056 99.0% 36.1% 14.9%
Kyrgyzstan 4.282 3.48 1.208 78.3% 54.0% 19.1% 5.346 5.849 3.887 97.7% 90.8% 61.6% 5.416 6.376 5.858 99.0% 99.0% 92.8%
Bhutan 0.546 0.416 0.157 80.8% 46.4% 15.2% 0.649 0.678 0.391 96.0% 75.7% 37.8% 0.67 0.834 0.681 99.1% 93.1% 65.9%
Maldives 0.229 0.073 0 64.0% 14.8% 0.0% 0.319 0.21 0.004 89.1% 42.6% 0.7% 0.352 0.368 0.032 98.3% 74.6% 5.5%
Asia-South Central 1552 1343 563.2 91.0% 62.1% 23.1% 1625 1859 1246 95.3% 86.0% 51.1% 1657 2024 1949 97.2% 93.6% 79.9%
Indonesia 198.8 178.5 67.16 85.5% 67.2% 25.1% 227.3 245 163 97.8% 92.2% 61.0% 230.1 262.9 237.9 99.0% 99.0% 89.0%
Philippines 72.37 67.76 32.53 79.3% 55.6% 24.1% 86.64 100.5 70.91 95.0% 82.4% 52.6% 90.3 116.8 107.5 99.0% 95.8% 79.8%
Vietnam 77.38 50.56 10.06 88.4% 48.6% 9.1% 86.18 84.29 35.98 98.5% 81.0% 32.6% 86.61 100.3 73.61 99.0% 96.3% 66.7%
Thailand 38.49 20.69 7.291 58.1% 29.3% 10.6% 57.1 45.64 24.49 86.2% 64.6% 35.6% 64.63 63.74 47.8 97.6% 90.2% 69.5%
Myanmar 51.38 45.6 24.62 98.0% 84.1% 48.1% 51.92 52.8 41.3 99.0% 97.4% 80.6% 51.92 53.68 49.3 99.0% 99.0% 96.2%
Malaysia 5.84 2.376 1.227 21.2% 6.6% 3.0% 12.79 7.832 4.932 46.5% 21.8% 12.2% 20.16 17.21 13.12 73.3% 48.0% 32.6%
Cambodia 15.13 17.85 10.16 98.5% 80.6% 38.7% 15.2 21.16 18.68 99.0% 95.5% 71.2% 15.2 21.93 24.13 99.0% 99.0% 92.0%
Lao PDR 6.172 3.754 0.093 95.1% 41.2% 0.9% 6.422 7.147 1.073 99.0% 78.4% 10.0% 6.422 8.786 4.575 99.0% 96.4% 42.6%
Singapore 0.013 0 0.001 0.3% 0.0% 0.0% 0.14 0.015 0.014 3.0% 0.3% 0.3% 0.758 0.196 0.169 16.3% 3.7% 3.3%
Timor-Leste 1.115 2.16 1.529 86.9% 85.9% 40.0% 1.25 2.44 2.633 97.4% 97.0% 68.8% 1.27 2.491 3.411 99.0% 99.0% 89.2%
Brunei Darussalam 0 0 0 0.0% 0.0% 0.0% 0 0 0 0.0% 0.0% 0.0% 0.016 0 0 3.9% 0.0% 0.0%
Asia-South East 466.7 389.3 154.7 79.7% 56.2% 21.5% 544.9 566.8 363 93.1% 81.9% 50.5% 567.4 648 561.5 96.9% 93.6% 78.1%
VOL2_15 Forecast Tables rev.indd 222 21/08/2009 09:06

223Forecast Tables
Patterns of Potential Human Progress Multination Regional Analysis Measures of Poverty, Health, Education, Infrastructure, and Governance
Base Case: Countries in Year 2060
Descending Population Sequence
PovertyPoverty (below $5 per Day) Poverty (below $10 per Day) Poverty (below $20 per Day)
Million People Percent Million People Percent Million People Percent
2010 2035 2060 2010 2035 2060 2010 2035 2060 2010 2035 2060 2010 2035 2060 2010 2035 2060
ASIA WITH OCEANIA continuedTurkey 39.36 18.89 3.398 51.6% 20.6% 3.5% 63.15 47.43 16.06 82.7% 51.7% 16.3% 73.87 75.01 43.52 96.8% 81.7% 44.3%
Yemen 18.17 25.96 19.14 75.0% 57.1% 29.0% 22.96 38.94 40.06 94.8% 85.7% 60.8% 23.99 44.28 56.95 99.0% 97.5% 86.4%
Iraq 25.82 15.37 0.938 86.2% 30.6% 1.4% 29.18 32.7 6.558 97.4% 65.0% 10.0% 29.65 45.24 23.22 99.0% 90.0% 35.4%
Saudi Arabia 0.816 0.798 0.014 3.2% 2.0% 0.0% 5.423 6.372 0.309 21.0% 15.7% 0.6% 15.42 21.05 2.974 59.6% 51.9% 5.8%
Syria 16.52 19.87 11.45 77.2% 60.9% 29.1% 20.25 27.89 22.58 94.6% 85.5% 57.4% 21.19 31.55 32.34 99.0% 96.7% 82.3%
Israel 0.109 0.004 0 1.4% 0.0% 0.0% 0.853 0.084 0.006 11.2% 0.8% 0.1% 3.084 0.793 0.121 40.4% 7.9% 1.0%
Azerbaijan 0.04 0 0 0.4% 0.0% 0.0% 0.559 0 0 6.3% 0.0% 0.0% 2.906 0.004 0 32.5% 0.0% 0.0%
Jordan 2.153 0.397 0 35.4% 4.8% 0.0% 4.455 2.156 0.019 73.3% 25.8% 0.2% 5.755 5.386 0.395 94.7% 64.5% 4.0%
Palestine 3.892 5.339 3.132 93.1% 74.0% 33.5% 4.14 6.85 6.302 99.0% 94.9% 67.3% 4.14 7.143 8.495 99.0% 99.0% 90.7%
United Arab Emirates 0.001 0 0 0.0% 0.0% 0.0% 0.038 0.001 0 0.8% 0.0% 0.0% 0.612 0.058 0.004 12.3% 0.9% 0.1%
Oman 0.052 0.014 0.001 1.8% 0.3% 0.0% 0.436 0.199 0.028 15.3% 4.5% 0.5% 1.475 1.119 0.283 51.8% 25.2% 5.0%
Kuwait 0 0 0 0.0% 0.0% 0.0% 0.002 0 0 0.1% 0.0% 0.0% 0.132 0 0 4.6% 0.0% 0.0%
Lebanon 2.232 1.89 0.638 58.6% 42.1% 13.5% 3.384 3.411 1.916 88.9% 76.1% 40.6% 3.757 4.246 3.466 98.7% 94.7% 73.5%
Georgia 2.584 1.477 0.375 59.5% 41.7% 12.9% 3.804 2.685 1.131 87.6% 75.9% 39.0% 4.26 3.35 2.076 98.1% 94.7% 71.6%
Armenia 2.289 0.694 0.12 74.8% 22.9% 4.4% 2.921 1.825 0.7 95.5% 60.3% 25.5% 3.029 2.715 1.793 99.0% 89.7% 65.2%
Bahrain 0 0 0 0.0% 0.0% 0.0% 0.003 0.001 0.001 0.4% 0.1% 0.1% 0.06 0.038 0.027 7.5% 3.7% 2.4%
Qatar 0 0 0 0.0% 0.0% 0.0% 0 0 0 0.0% 0.0% 0.0% 0.003 0 0 0.3% 0.0% 0.0%
Cyprus 0 0 0 0.0% 0.0% 0.0% 0.013 0.004 0 1.7% 0.5% 0.0% 0.124 0.055 0.01 15.9% 6.7% 1.4%
Asia-West 114 90.7 39.2 49.8% 27.8% 10.0% 161.6 170.6 95.67 70.6% 52.4% 24.4% 193.5 242 175.7 84.5% 74.3% 44.8%
Australia 0.011 0.001 0 0.1% 0.0% 0.0% 0.298 0.049 0.007 1.4% 0.2% 0.0% 2.831 0.853 0.2 13.2% 3.4% 0.7%
Papua New Guniea 5.384 4.826 3.387 82.6% 47.9% 26.0% 6.192 7.452 6.656 94.9% 74.0% 51.1% 6.457 9.161 9.867 99.0% 91.0% 75.8%
New Zealand 0.014 0.003 0 0.3% 0.1% 0.0% 0.186 0.059 0.002 4.4% 1.2% 0.0% 1.047 0.519 0.044 24.5% 10.7% 0.9%
Solomon Islands 0.474 0.707 0.884 88.8% 83.5% 78.4% 0.523 0.813 1.051 97.9% 96.0% 93.2% 0.529 0.838 1.112 99.1% 98.9% 98.6%
Fiji 0.738 0.609 0.178 83.4% 63.5% 20.0% 0.858 0.858 0.464 96.9% 89.5% 52.1% 0.876 0.944 0.737 99.0% 98.4% 82.7%
Vanuatu 0.198 0.285 0.177 83.5% 77.0% 38.6% 0.229 0.348 0.317 96.6% 94.1% 69.1% 0.234 0.367 0.414 98.7% 99.2% 90.2%
Micronesia 0.087 0.125 0.079 70.7% 67.2% 34.5% 0.114 0.168 0.143 92.7% 90.3% 62.4% 0.121 0.183 0.195 98.4% 98.4% 85.2%
Tonga 0.094 0.133 0.114 83.2% 74.7% 50.7% 0.11 0.165 0.172 97.3% 92.7% 76.4% 0.112 0.176 0.208 99.1% 98.9% 92.4%
Samoa 0.151 0.144 0.044 79.5% 63.2% 19.9% 0.182 0.201 0.108 95.8% 88.2% 48.9% 0.188 0.223 0.173 98.9% 97.8% 78.3%
Oceania 7.151 6.833 4.862 20.9% 15.8% 10.0% 8.691 10.11 8.92 25.4% 23.4% 18.3% 12.4 13.26 12.95 36.2% 30.8% 26.5%
VOL2_15 Forecast Tables rev.indd 223 21/08/2009 09:06

Patterns of Potential Hum
an Progress Volume 2: Enhancing Global Education
224
Patterns of Potential Human Progress Multination Regional Analysis Measures of Poverty, Health, Education, Infrastructure, and Governance
Base Case: Countries in Year 2060
Descending Population Sequence
PovertyPoverty (below $5 per Day) Poverty (below $10 per Day) Poverty (below $20 per Day)
Million People Percent Million People Percent Million People Percent
2010 2035 2060 2010 2035 2060 2010 2035 2060 2010 2035 2060 2010 2035 2060 2010 2035 2060
EUROPERussian Federation 17.78 0.08 0.001 12.6% 0.1% 0.0% 57.77 1.733 0.072 40.9% 1.3% 0.1% 106.4 14.94 1.477 75.4% 11.5% 1.3%
Ukraine 5.363 0.011 0 11.8% 0.0% 0.0% 25.12 0.772 0.003 55.2% 2.1% 0.0% 42.14 9.707 0.323 92.6% 26.1% 1.0%
Poland 1.668 0.078 0.002 4.4% 0.2% 0.0% 10.5 1.62 0.103 27.4% 4.5% 0.3% 26.63 10.67 1.736 69.5% 29.4% 5.7%
Romania 11.74 4.633 1.257 54.6% 23.7% 7.6% 19.57 13.05 5.747 91.1% 66.8% 34.6% 21.28 18.43 12.29 99.0% 94.4% 73.9%
Czech Republic 1.286 0.475 0.104 12.5% 4.9% 1.3% 6.821 4.136 1.378 66.2% 42.7% 16.6% 10.06 8.725 5.127 97.7% 90.1% 61.8%
Belarus 1.086 0.197 0.075 11.2% 2.2% 0.9% 5.321 1.817 0.764 54.9% 20.1% 9.6% 8.993 5.73 3.162 92.8% 63.4% 39.8%
Hungary 0.897 0.223 0.05 9.0% 2.5% 0.7% 4.804 2.062 0.61 48.1% 23.0% 8.1% 8.926 6.153 2.816 89.4% 68.5% 37.5%
Bulgaria 2.324 0.384 0.011 31.0% 6.4% 0.2% 5.972 2.507 0.273 79.7% 41.5% 5.5% 7.38 5.215 1.783 98.5% 86.4% 35.9%
Slovakia 0.852 0.416 0.146 15.7% 8.0% 3.3% 3.85 2.695 1.209 70.8% 51.5% 27.0% 5.343 4.871 3.278 98.2% 93.1% 73.1%
Moldova, Rep. of 3.981 3.01 0.681 95.9% 82.9% 21.9% 4.111 3.551 1.839 99.0% 97.7% 59.1% 4.111 3.596 2.775 99.0% 99.0% 89.2%
Europe-East 46.98 9.507 2.328 16.0% 3.6% 1.0% 143.8 33.94 12 49.0% 12.8% 5.3% 241.3 88.03 34.77 82.2% 33.1% 15.5%
United Kingdom 0.036 0.005 0 0.1% 0.0% 0.0% 0.876 0.189 0.007 1.4% 0.3% 0.0% 7.876 2.83 0.224 12.8% 4.3% 0.3%
Sweden 0 0 0 0.0% 0.0% 0.0% 0.01 0 0 0.1% 0.0% 0.0% 0.601 0.019 0 6.5% 0.2% 0.0%
Denmark 0 0 0 0.0% 0.0% 0.0% 0.005 0 0 0.1% 0.0% 0.0% 0.306 0.031 0 5.5% 0.5% 0.0%
Ireland 0.001 0 0 0.0% 0.0% 0.0% 0.041 0.003 0.002 0.9% 0.1% 0.0% 0.475 0.073 0.043 10.8% 1.4% 0.8%
Norway 0 0 0 0.0% 0.0% 0.0% 0 0 0 0.0% 0.0% 0.0% 0.041 0.009 0 0.9% 0.2% 0.0%
Finland 0 0 0 0.0% 0.0% 0.0% 0.013 0.001 0 0.2% 0.0% 0.0% 0.413 0.065 0.004 7.7% 1.2% 0.1%
Lithuania 0.989 0.409 0.068 29.2% 13.2% 2.6% 2.349 1.465 0.447 69.4% 47.1% 17.0% 3.184 2.597 1.351 94.1% 83.6% 51.3%
Latvia 0.212 0.037 0.004 9.3% 1.8% 0.2% 0.921 0.302 0.053 40.5% 14.6% 3.0% 1.818 1.029 0.319 79.9% 49.8% 18.2%
Estonia 0.261 0.077 0.014 20.0% 7.1% 1.5% 0.767 0.362 0.104 58.6% 33.2% 11.3% 1.177 0.793 0.367 90.0% 72.6% 40.0%
Iceland 0 0 0 0.0% 0.0% 0.0% 0.001 0 0 0.3% 0.0% 0.0% 0.017 0.003 0 5.5% 0.9% 0.0%
Europe-North 1.499 0.527 0.086 1.5% 0.5% 0.1% 4.982 2.322 0.612 5.1% 2.3% 0.6% 15.91 7.45 2.309 16.2% 7.2% 2.3%
Italy 0.099 0.072 0.022 0.2% 0.1% 0.0% 1.889 1.335 0.414 3.2% 2.5% 0.9% 12.99 9.581 3.495 22.1% 17.7% 7.8%
Spain 0.06 0.028 0.005 0.1% 0.1% 0.0% 1.343 0.702 0.153 3.0% 1.6% 0.4% 9.987 6.233 1.821 22.6% 14.6% 5.0%
Greece 0.005 0.003 0.003 0.0% 0.0% 0.0% 0.137 0.094 0.061 1.2% 0.9% 0.7% 1.399 0.963 0.597 12.5% 9.0% 6.4%
Portugal 0.69 0.614 0.178 6.5% 6.0% 1.9% 3.203 2.671 0.998 30.0% 25.9% 10.8% 7.257 6.234 3.171 68.1% 60.5% 34.2%
Serbia 5.203 2.452 0.548 70.6% 35.9% 8.9% 7.113 5.453 2.488 96.5% 79.8% 40.6% 7.299 6.689 4.949 99.0% 97.9% 80.7%
Croatia 0.567 0.184 0.012 12.8% 4.6% 0.3% 2.591 1.377 0.206 58.6% 34.2% 5.9% 4.165 3.257 1.167 94.2% 80.9% 33.5%
Bosnia and Herzegovina 3.336 3.15 1.135 81.9% 82.7% 35.4% 3.958 3.692 2.16 97.2% 96.9% 67.3% 4.031 3.771 2.883 99.0% 99.0% 89.9%
Albania 1.672 0.849 0.126 52.6% 25.2% 3.9% 2.857 2.19 0.686 89.8% 64.9% 21.5% 3.15 3.119 1.822 99.0% 92.4% 57.1%
Macedonia, TFYR 0.111 0.149 0.026 5.4% 7.5% 1.5% 0.552 0.653 0.183 26.7% 32.7% 10.4% 1.327 1.414 0.646 64.2% 70.8% 36.9%
Slovenia 0.162 0.047 0.005 8.1% 2.5% 0.3% 0.886 0.409 0.073 44.1% 21.8% 4.8% 1.739 1.232 0.42 86.5% 65.5% 27.6%
Montenegro 0.437 0.318 0.083 70.5% 51.3% 14.1% 0.575 0.509 0.24 92.7% 82.1% 40.7% 0.614 0.598 0.429 99.0% 96.5% 72.8%
Malta 0.002 0 0 0.5% 0.0% 0.0% 0.023 0.007 0 5.6% 1.7% 0.0% 0.128 0.062 0.007 31.2% 15.2% 2.0%
Europe-South 12.35 7.866 2.141 8.3% 5.6% 1.8% 25.13 19.09 7.663 16.9% 13.6% 6.4% 54.08 43.15 21.41 36.3% 30.6% 17.9%
Germany 0.001 0 0 0.0% 0.0% 0.0% 0.209 0.018 0 0.3% 0.0% 0.0% 6.484 1.277 0.031 7.8% 1.6% 0.0%
France 0.026 0.016 0.001 0.0% 0.0% 0.0% 0.932 0.517 0.045 1.5% 0.8% 0.1% 9.793 5.878 0.851 15.7% 9.1% 1.4%
Netherlands 0.002 0 0 0.0% 0.0% 0.0% 0.119 0.033 0.006 0.7% 0.2% 0.0% 1.985 0.813 0.191 11.8% 4.6% 1.1%
Belgium 0.003 0.001 0 0.0% 0.0% 0.0% 0.123 0.046 0.004 1.2% 0.4% 0.0% 1.467 0.735 0.107 13.7% 6.8% 1.1%
Austria 0 0 0 0.0% 0.0% 0.0% 0.02 0.003 0 0.2% 0.0% 0.0% 0.545 0.129 0.015 6.6% 1.6% 0.2%
Switzerland 0 0 0 0.0% 0.0% 0.0% 0.029 0.001 0 0.4% 0.0% 0.0% 0.502 0.069 0.003 6.7% 0.9% 0.0%
Luxembourg 0 0 0 0.0% 0.0% 0.0% 0 0 0 0.0% 0.0% 0.0% 0.001 0 0 0.2% 0.0% 0.0%
Europe-West 0.033 0.017 0.001 0.0% 0.0% 0.0% 1.432 0.618 0.056 0.8% 0.3% 0.0% 20.78 8.9 1.198 11.0% 4.7% 0.7%
VOL2_15 Forecast Tables rev.indd 224 21/08/2009 09:06

225Forecast Tables
Patterns of Potential Human Progress Multination Regional Analysis Measures of Poverty, Health, Education, Infrastructure, and Governance
Base Case
Source: International Futures Version 6.12, March 2009
PovertyGDP per Capita at PPP Gross Domestic Product GDP at PPP
Thousands in 2005 Dollars Billions in 2000 Dollars Billions in 2005 Dollars
2010 2035 2060 % Chg % An Chg 2010 2035 2060 % Chg % An Chg 2010 2035 2060 % Chg % An Chg
World 8.408 15.85 31.25 271.7% 2.7% 42257 106371 262977 522.3% 3.7% 57222 133466 295223 415.9% 3.3%
Africa 2.144 3.53 7.654 257.0% 2.6% 887.6 3079 12287 1284.3% 5.4% 2163 5939 18014 732.8% 4.3%Americas 19.97 34.94 59.6 198.4% 2.2% 16553 36454 69567 320.3% 2.9% 18716 39360 72248 286.0% 2.7%Asia with Oceania 5.137 12.96 31.31 509.5% 3.7% 13587 46570 144324 962.2% 4.8% 21216 63671 164883 677.2% 4.2%Europe 20.82 35.33 65.42 214.2% 2.3% 11187 20190 36608 227.2% 2.4% 15011 24341 39827 165.3% 2.0%World 8.408 15.85 31.25 271.7% 2.7% 42257 106371 262977 522.3% 3.7% 57222 133466 295223 415.9% 3.3%
Africa-Eastern 0.879 1.886 7.673 772.9% 4.4% 96.59 469.8 4119 4164.4% 7.8% 281.6 1072 6081 2059.4% 6.3%Africa-Middle 1.492 2.11 2.952 97.9% 1.4% 63.4 205 537.3 747.5% 4.4% 189.4 525.6 1252 561.0% 3.8%Africa-Northern 4.262 7.82 16.67 291.1% 2.8% 391 1256 4104 949.6% 4.8% 878.1 2152 5299 503.5% 3.7%Africa-Southern 7.802 14.83 33.46 328.9% 3.0% 210.9 675.6 2154 921.3% 4.8% 443.2 1017 2464 456.0% 3.5%Africa-Western 1.24 2.25 3.915 215.7% 2.3% 125.7 472.6 1372 991.5% 4.9% 370.7 1172 2918 687.2% 4.2%Africa 2.144 3.53 7.654 257.0% 2.6% 887.6 3079 12287 1284.3% 5.4% 2163 5939 18014 732.8% 4.3%
America-Caribbean 6.483 12.47 27.71 327.4% 2.9% 178.5 484.9 1282 618.2% 4.0% 256.2 585.5 1399 446.1% 3.5%America-Central 4.956 9.338 21.53 334.4% 3.0% 104.5 379.8 1329 1171.8% 5.2% 217.4 590 1620 645.2% 4.1%America-North 33.17 58.29 93.73 182.6% 2.1% 14451 30286 52421 262.7% 2.6% 15051 30981 52958 251.9% 2.5%America-South 7.981 14.86 31.21 291.1% 2.8% 1819 5303 14535 699.1% 4.2% 3191 7204 16271 409.9% 3.3%Americas 19.97 34.94 59.6 198.4% 2.2% 16553 36454 69567 320.3% 2.9% 18716 39360 72248 286.0% 2.7%
Asia-East 7.463 21.51 57.19 666.3% 4.2% 9413 30342 89121 846.8% 4.6% 11765 36359 95362 710.6% 4.3%Asia-South Central 2.55 6.942 17.62 591.0% 3.9% 1395 7914 33267 2284.7% 6.5% 4347 15006 42984 888.8% 4.7%Asia-South East 3.901 7.932 16.27 317.1% 2.9% 1025 3185 9001 778.1% 4.4% 2284 5490 11702 412.3% 3.3%Asia-West 8.79 16.07 29.99 241.2% 2.5% 1124 3751 10123 800.6% 4.5% 2013 5234 11753 483.9% 3.6%Oceania 23.52 36.68 63.18 168.6% 2.0% 630.6 1378 2812 345.9% 3.0% 806.4 1582 3083 282.3% 2.7%Asia with Oceania 5.137 12.96 31.31 509.5% 3.7% 13587 46570 144324 962.2% 4.8% 21216 63671 164883 677.2% 4.2%
Europe-East 11.55 25.1 36.59 216.8% 2.3% 1064 3447 5907 455.2% 3.5% 3389 6671 8213 142.3% 1.8%Europe-North 30.43 51.95 99.9 228.3% 2.4% 2892 5273 10001 245.8% 2.5% 2989 5345 10040 235.9% 2.5%Europe-South 21.99 30.06 52.05 136.7% 1.7% 2336 3606 5683 143.3% 1.8% 3277 4232 6241 90.4% 1.3%Europe-West 28.96 43.85 90.93 214.0% 2.3% 4937 7942 15209 208.1% 2.3% 5473 8248 15584 184.7% 2.1%Europe 20.82 35.33 65.42 214.2% 2.3% 11187 20190 36608 227.2% 2.4% 15011 24341 39827 165.3% 2.0%
VOL2_15 Forecast Tables rev.indd 225 21/08/2009 09:06
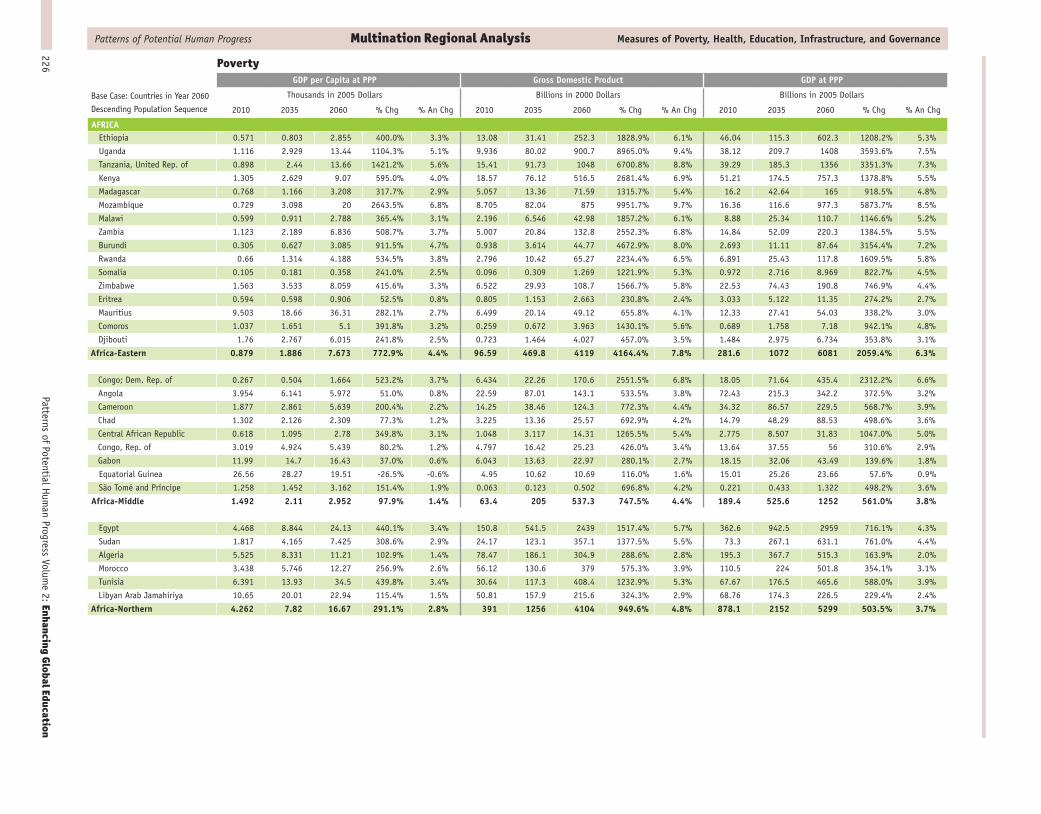
Patterns of Potential Hum
an Progress Volume 2: Enhancing Global Education
226
Patterns of Potential Human Progress Multination Regional Analysis Measures of Poverty, Health, Education, Infrastructure, and Governance
Base Case: Countries in Year 2060
Descending Population Sequence
PovertyGDP per Capita at PPP Gross Domestic Product GDP at PPP
Thousands in 2005 Dollars Billions in 2000 Dollars Billions in 2005 Dollars
2010 2035 2060 % Chg % An Chg 2010 2035 2060 % Chg % An Chg 2010 2035 2060 % Chg % An Chg
AFRICAEthiopia 0.571 0.803 2.855 400.0% 3.3% 13.08 31.41 252.3 1828.9% 6.1% 46.04 115.3 602.3 1208.2% 5.3%
Uganda 1.116 2.929 13.44 1104.3% 5.1% 9.936 80.02 900.7 8965.0% 9.4% 38.12 209.7 1408 3593.6% 7.5%
Tanzania, United Rep. of 0.898 2.44 13.66 1421.2% 5.6% 15.41 91.73 1048 6700.8% 8.8% 39.29 185.3 1356 3351.3% 7.3%
Kenya 1.305 2.629 9.07 595.0% 4.0% 18.57 76.12 516.5 2681.4% 6.9% 51.21 174.5 757.3 1378.8% 5.5%
Madagascar 0.768 1.166 3.208 317.7% 2.9% 5.057 13.36 71.59 1315.7% 5.4% 16.2 42.64 165 918.5% 4.8%
Mozambique 0.729 3.098 20 2643.5% 6.8% 8.705 82.04 875 9951.7% 9.7% 16.36 116.6 977.3 5873.7% 8.5%
Malawi 0.599 0.911 2.788 365.4% 3.1% 2.196 6.546 42.98 1857.2% 6.1% 8.88 25.34 110.7 1146.6% 5.2%
Zambia 1.123 2.189 6.836 508.7% 3.7% 5.007 20.84 132.8 2552.3% 6.8% 14.84 52.09 220.3 1384.5% 5.5%
Burundi 0.305 0.627 3.085 911.5% 4.7% 0.938 3.614 44.77 4672.9% 8.0% 2.693 11.11 87.64 3154.4% 7.2%
Rwanda 0.66 1.314 4.188 534.5% 3.8% 2.796 10.42 65.27 2234.4% 6.5% 6.891 25.43 117.8 1609.5% 5.8%
Somalia 0.105 0.181 0.358 241.0% 2.5% 0.096 0.309 1.269 1221.9% 5.3% 0.972 2.716 8.969 822.7% 4.5%
Zimbabwe 1.563 3.533 8.059 415.6% 3.3% 6.522 29.93 108.7 1566.7% 5.8% 22.53 74.43 190.8 746.9% 4.4%
Eritrea 0.594 0.598 0.906 52.5% 0.8% 0.805 1.153 2.663 230.8% 2.4% 3.033 5.122 11.35 274.2% 2.7%
Mauritius 9.503 18.66 36.31 282.1% 2.7% 6.499 20.14 49.12 655.8% 4.1% 12.33 27.41 54.03 338.2% 3.0%
Comoros 1.037 1.651 5.1 391.8% 3.2% 0.259 0.672 3.963 1430.1% 5.6% 0.689 1.758 7.18 942.1% 4.8%
Djibouti 1.76 2.767 6.015 241.8% 2.5% 0.723 1.464 4.027 457.0% 3.5% 1.484 2.975 6.734 353.8% 3.1%
Africa-Eastern 0.879 1.886 7.673 772.9% 4.4% 96.59 469.8 4119 4164.4% 7.8% 281.6 1072 6081 2059.4% 6.3%
Congo; Dem. Rep. of 0.267 0.504 1.664 523.2% 3.7% 6.434 22.26 170.6 2551.5% 6.8% 18.05 71.64 435.4 2312.2% 6.6%
Angola 3.954 6.141 5.972 51.0% 0.8% 22.59 87.01 143.1 533.5% 3.8% 72.43 215.3 342.2 372.5% 3.2%
Cameroon 1.877 2.861 5.639 200.4% 2.2% 14.25 38.46 124.3 772.3% 4.4% 34.32 86.57 229.5 568.7% 3.9%
Chad 1.302 2.126 2.309 77.3% 1.2% 3.225 13.36 25.57 692.9% 4.2% 14.79 48.29 88.53 498.6% 3.6%
Central African Republic 0.618 1.095 2.78 349.8% 3.1% 1.048 3.117 14.31 1265.5% 5.4% 2.775 8.507 31.83 1047.0% 5.0%
Congo, Rep. of 3.019 4.924 5.439 80.2% 1.2% 4.797 16.42 25.23 426.0% 3.4% 13.64 37.55 56 310.6% 2.9%
Gabon 11.99 14.7 16.43 37.0% 0.6% 6.043 13.63 22.97 280.1% 2.7% 18.15 32.06 43.49 139.6% 1.8%
Equatorial Guinea 26.56 28.27 19.51 -26.5% -0.6% 4.95 10.62 10.69 116.0% 1.6% 15.01 25.26 23.66 57.6% 0.9%
São Tomé and Príncipe 1.258 1.452 3.162 151.4% 1.9% 0.063 0.123 0.502 696.8% 4.2% 0.221 0.433 1.322 498.2% 3.6%
Africa-Middle 1.492 2.11 2.952 97.9% 1.4% 63.4 205 537.3 747.5% 4.4% 189.4 525.6 1252 561.0% 3.8%
Egypt 4.468 8.844 24.13 440.1% 3.4% 150.8 541.5 2439 1517.4% 5.7% 362.6 942.5 2959 716.1% 4.3%
Sudan 1.817 4.165 7.425 308.6% 2.9% 24.17 123.1 357.1 1377.5% 5.5% 73.3 267.1 631.1 761.0% 4.4%
Algeria 5.525 8.331 11.21 102.9% 1.4% 78.47 186.1 304.9 288.6% 2.8% 195.3 367.7 515.3 163.9% 2.0%
Morocco 3.438 5.746 12.27 256.9% 2.6% 56.12 130.6 379 575.3% 3.9% 110.5 224 501.8 354.1% 3.1%
Tunisia 6.391 13.93 34.5 439.8% 3.4% 30.64 117.3 408.4 1232.9% 5.3% 67.67 176.5 465.6 588.0% 3.9%
Libyan Arab Jamahiriya 10.65 20.01 22.94 115.4% 1.5% 50.81 157.9 215.6 324.3% 2.9% 68.76 174.3 226.5 229.4% 2.4%
Africa-Northern 4.262 7.82 16.67 291.1% 2.8% 391 1256 4104 949.6% 4.8% 878.1 2152 5299 503.5% 3.7%
VOL2_15 Forecast Tables rev.indd 226 21/08/2009 09:07

227Forecast Tables
Patterns of Potential Human Progress Multination Regional Analysis Measures of Poverty, Health, Education, Infrastructure, and Governance
Base Case: Countries in Year 2060
Descending Population Sequence
PovertyGDP per Capita at PPP Gross Domestic Product GDP at PPP
Thousands in 2005 Dollars Billions in 2000 Dollars Billions in 2005 Dollars
2010 2035 2060 % Chg % An Chg 2010 2035 2060 % Chg % An Chg 2010 2035 2060 % Chg % An Chg
AFRICA continuedSouth Africa 8.146 15.17 33.92 316.4% 2.9% 192.3 586.3 1846 860.0% 4.6% 403.4 888.2 2110 423.1% 3.4%
Namibia 4.492 9.835 33.39 643.3% 4.1% 5.311 22.43 114.8 2061.6% 6.3% 9.949 31.5 127.7 1183.5% 5.2%
Lesotho 1.295 2.788 9.857 661.2% 4.1% 1.18 3.877 22.07 1770.3% 6.0% 2.506 7.327 29.1 1061.2% 5.0%
Botswana 11.75 31.08 59.98 410.5% 3.3% 10.24 55.81 140.8 1275.0% 5.4% 22.31 75.45 157 603.7% 4.0%
Swaziland 4.074 8.119 19.61 381.3% 3.2% 1.786 7.155 30.19 1590.4% 5.8% 4.999 14.31 39.56 691.4% 4.2%
Africa-Southern 7.802 14.83 33.46 328.9% 3.0% 210.9 675.6 2154 921.3% 4.8% 443.2 1017 2464 456.0% 3.5%
Nigeria 1.44 2.812 3.448 139.4% 1.8% 73.57 304 515.9 601.2% 4.0% 214.9 719.6 1237 475.6% 3.6%
Niger 0.55 0.865 2.834 415.3% 3.3% 2.579 8.022 61.43 2281.9% 6.5% 8.912 27.98 145.7 1534.9% 5.7%
Côte d’Ivoire 1.49 2.58 4.866 226.6% 2.4% 11.95 39.71 122.2 922.6% 4.8% 30.44 90.77 236.9 678.3% 4.2%
Ghana 1.117 1.491 2.969 165.8% 2.0% 7.769 16.44 51.84 567.3% 3.9% 27.26 55.2 137.1 402.9% 3.3%
Burkina Faso 1.005 1.964 6.557 552.4% 3.8% 4.419 19.79 158.6 3489.0% 7.4% 15.25 56.37 286 1775.4% 6.0%
Mali 0.93 1.597 4.738 409.5% 3.3% 4.001 14.67 98.97 2373.6% 6.6% 14.45 46.38 205.6 1322.8% 5.5%
Senegal 1.429 2.29 5.384 276.8% 2.7% 6.926 21.58 99.78 1340.7% 5.5% 18.89 54.09 188.2 896.3% 4.7%
Guinea 1.034 2.126 5.663 447.7% 3.5% 4.147 17.26 92.88 2139.7% 6.4% 10.66 39.31 158.6 1387.8% 5.5%
Benin 1.148 1.734 4.782 316.6% 2.9% 3.333 9.772 56.72 1601.8% 5.8% 11.06 29.62 117.2 959.7% 4.8%
Togo 0.685 0.741 1.332 94.5% 1.3% 1.703 2.539 6.711 294.1% 2.8% 4.772 8.843 21.94 359.8% 3.1%
Sierra Leone 0.584 1.586 5.477 837.8% 4.6% 1.515 7.768 53.81 3451.8% 7.4% 3.674 16.61 83.53 2173.5% 6.4%
Liberia 0.297 0.432 1.429 381.1% 3.2% 0.505 1.068 7.987 1481.6% 5.7% 1.148 3.423 21.09 1737.1% 6.0%
Mauritania 1.567 1.998 3.998 155.1% 1.9% 1.589 3.606 13.73 764.1% 4.4% 5.386 11.61 33.43 520.7% 3.7%
Guinea-Bissau 0.431 0.577 1.348 212.8% 2.3% 0.253 0.576 2.676 957.7% 4.8% 0.798 2.128 8.399 952.5% 4.8%
Gambia 0.997 1.474 3.44 245.0% 2.5% 0.586 1.434 6.152 949.8% 4.8% 1.689 4.132 13.8 717.1% 4.3%
Cape Verde 2.541 6.733 24.07 847.3% 4.6% 0.878 4.355 22.28 2437.6% 6.7% 1.439 5.645 24.11 1575.5% 5.8%
Africa-Western 1.24 2.25 3.915 215.7% 2.3% 125.7 472.6 1372 991.5% 4.9% 370.7 1172 2918 687.2% 4.2%
VOL2_15 Forecast Tables rev.indd 227 21/08/2009 09:07

Patterns of Potential Hum
an Progress Volume 2: Enhancing Global Education
228
Patterns of Potential Human Progress Multination Regional Analysis Measures of Poverty, Health, Education, Infrastructure, and Governance
Base Case: Countries in Year 2060
Descending Population Sequence
PovertyGDP per Capita at PPP Gross Domestic Product GDP at PPP
Thousands in 2005 Dollars Billions in 2000 Dollars Billions in 2005 Dollars
2010 2035 2060 % Chg % An Chg 2010 2035 2060 % Chg % An Chg 2010 2035 2060 % Chg % An Chg
AMERICASHaiti 1.108 1.674 3.509 216.7% 2.3% 4.226 9.162 28.17 566.6% 3.9% 10.31 22.85 59.77 479.7% 3.6%
Dominican Republic 5.46 13.49 30.15 452.2% 3.5% 31.83 129.8 366.9 1052.7% 5.0% 52.47 157.8 388.8 641.0% 4.1%
Cuba 5.197 10.22 36.17 596.0% 4.0% 30.26 77.76 325.4 975.3% 4.9% 59.39 115.5 370.5 523.8% 3.7%
Puerto Rico 20.04 42.13 90.11 349.7% 3.1% 76.46 192.3 426.5 457.8% 3.5% 81.43 195.8 428.7 426.5% 3.4%
Jamaica 6.47 8.423 15.26 135.9% 1.7% 9.357 15.28 35.66 281.1% 2.7% 17.83 26.38 47.89 168.6% 2.0%
Trinidad and Tobago 16.33 33.08 45.64 179.5% 2.1% 16.24 41.24 55.3 240.5% 2.5% 21.87 45.2 56.78 159.6% 1.9%
Bahamas 17.85 25.7 46.33 159.6% 1.9% 5.532 9.963 18.92 242.0% 2.5% 6.068 10.24 19.07 214.3% 2.3%
Barbados 13.01 21.27 55.03 323.0% 2.9% 2.809 5.38 13.17 368.9% 3.1% 3.577 5.918 13.54 278.5% 2.7%
St. Vincent & the Grenadines 6.383 10.39 25.42 298.2% 2.8% 0.452 1.103 3.916 766.4% 4.4% 0.813 1.65 4.482 451.3% 3.5%
Grenada 8.509 11.56 26.43 210.6% 2.3% 0.509 1.04 3.659 618.9% 4.0% 0.964 1.688 4.351 351.3% 3.1%
St. Lucia 8.889 14.23 29.35 230.2% 2.4% 0.876 1.798 4.229 382.8% 3.2% 1.511 2.509 4.705 211.4% 2.3%
America-Caribbean 6.483 12.47 27.71 327.4% 2.9% 178.5 484.9 1282 618.2% 4.0% 256.2 585.5 1399 446.1% 3.5%
Guatemala 4.584 7.283 14.99 227.0% 2.4% 26.7 89.46 341.6 1179.4% 5.2% 65.67 176.6 478.9 629.3% 4.1%
Honduras 3.135 5.313 11.68 272.6% 2.7% 8.714 26.24 94.66 986.3% 4.9% 24.95 59.03 147.9 492.8% 3.6%
El Salvador 5.241 9.984 23.04 339.6% 3.0% 17.88 58.04 203.5 1038.1% 5.0% 39.03 94.66 242 520.0% 3.7%
Nicaragua 2.504 4.176 8.865 254.0% 2.6% 5.52 14.98 46.87 749.1% 4.4% 14.19 32.36 75.88 434.7% 3.4%
Costa Rica 8.908 22.79 65.53 635.6% 4.1% 25.77 111.5 396 1436.7% 5.6% 41.62 133 417.2 902.4% 4.7%
Panama 8.539 20.21 50.62 492.8% 3.6% 18.6 73.79 227.1 1121.0% 5.1% 29.66 87.18 238.5 704.1% 4.3%
Belize 7.169 16.29 39.13 445.8% 3.5% 1.367 5.808 18.83 1277.5% 5.4% 2.29 7.199 20.08 776.9% 4.4%
America-Central 4.956 9.338 21.53 334.4% 3.0% 104.5 379.8 1329 1171.8% 5.2% 217.4 590 1620 645.2% 4.1%
United States of America 40.95 73.01 114.6 179.9% 2.1% 12739 26624 45199 254.8% 2.6% 12739 26624 45199 254.8% 2.6%
Mexico 10.91 17.03 29.83 173.4% 2.0% 751.5 1693 3586 377.2% 3.2% 1190 2186 3886 226.6% 2.4%
Canada 33.31 56.28 96.39 189.4% 2.1% 959.7 1970 3636 278.9% 2.7% 1122 2171 3873 245.2% 2.5%
America-North 33.17 58.29 93.73 182.6% 2.1% 14451 30286 52421 262.7% 2.6% 15051 30981 52958 251.9% 2.5%
Brazil 8.05 14.47 31.19 287.5% 2.7% 868.4 2440 7024 708.8% 4.3% 1599 3419 7842 390.4% 3.2%
Colombia 5.708 10.1 25.88 353.4% 3.1% 121.5 347.7 1376 1032.5% 5.0% 278.7 602.8 1676 501.4% 3.7%
Argentina 11 23.41 51.58 368.9% 3.1% 390.8 1085 2661 580.9% 3.9% 449.3 1130 2692 499.2% 3.6%
Venezuela, RB 9.484 16.26 23.32 145.9% 1.8% 161.9 458.1 854 427.5% 3.4% 273.8 604.4 957.1 249.6% 2.5%
Peru 6.415 12.04 21.98 242.6% 2.5% 83.36 267.5 717.2 760.4% 4.4% 192.3 446.4 884.7 360.1% 3.1%
Chile 12.36 30.12 68.09 450.9% 3.5% 119.1 497.7 1341 1025.9% 5.0% 211 609.5 1425 575.4% 3.9%
Ecuador 6.168 7.899 9.857 59.8% 0.9% 24.2 50.81 85.04 251.4% 2.5% 88.3 144.2 191.7 117.1% 1.6%
Bolivia 3.686 8.415 17.62 378.0% 3.2% 12.64 61.21 209.7 1559.0% 5.8% 37.08 117.6 288.1 677.0% 4.2%
Paraguay 3.562 5.156 10.84 204.3% 2.3% 9.402 21.4 70.1 645.6% 4.1% 23.09 45.65 108.5 369.9% 3.1%
Uruguay 9.247 19.42 47.1 409.4% 3.3% 25.81 68.57 180.6 599.7% 4.0% 32.85 74.24 184.7 462.3% 3.5%
Guyana 3.19 6.378 16.77 425.7% 3.4% 0.852 2.154 7.753 810.0% 4.5% 2.405 4.443 10.43 333.7% 3.0%
Suriname 7.171 12.7 23.72 230.8% 2.4% 1.404 3.537 8.374 496.4% 3.6% 3.327 6.13 10.41 212.9% 2.3%
America-South 7.981 14.86 31.21 291.1% 2.8% 1819 5303 14535 699.1% 4.2% 3191 7204 16271 409.9% 3.3%
VOL2_15 Forecast Tables rev.indd 228 21/08/2009 09:07
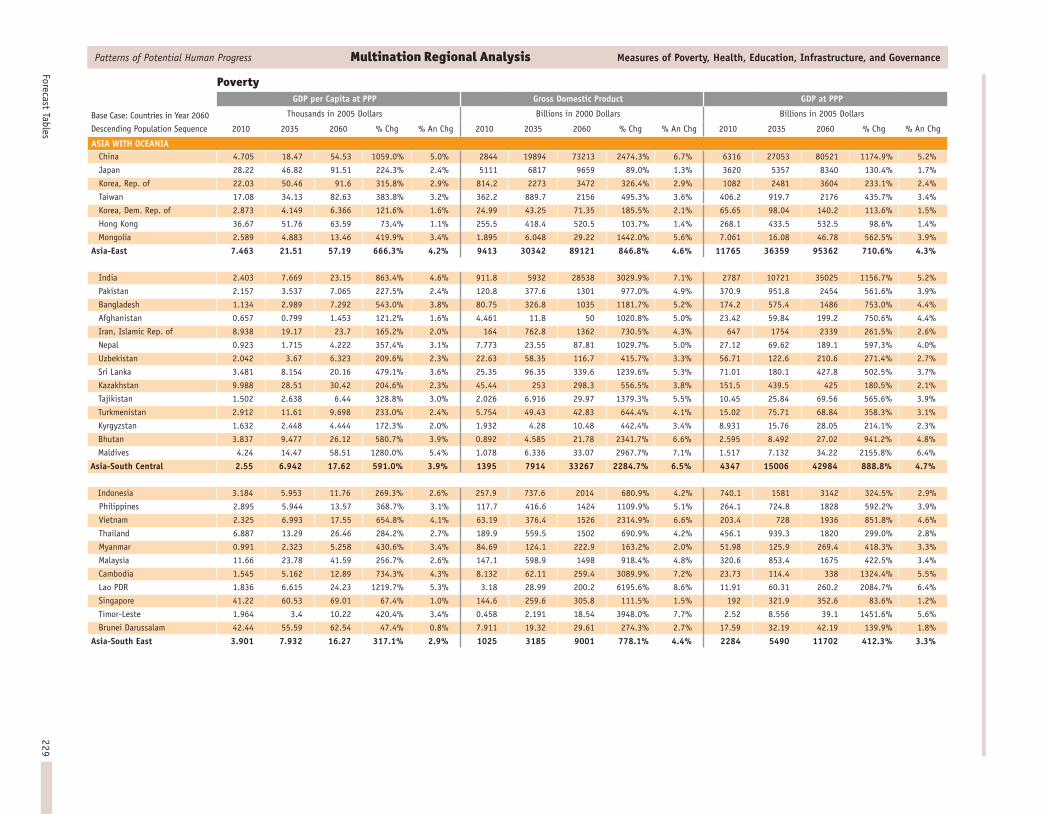
229Forecast Tables
Patterns of Potential Human Progress Multination Regional Analysis Measures of Poverty, Health, Education, Infrastructure, and Governance
Base Case: Countries in Year 2060
Descending Population Sequence
PovertyGDP per Capita at PPP Gross Domestic Product GDP at PPP
Thousands in 2005 Dollars Billions in 2000 Dollars Billions in 2005 Dollars
2010 2035 2060 % Chg % An Chg 2010 2035 2060 % Chg % An Chg 2010 2035 2060 % Chg % An Chg
ASIA WITH OCEANIAChina 4.705 18.47 54.53 1059.0% 5.0% 2844 19894 73213 2474.3% 6.7% 6316 27053 80521 1174.9% 5.2%
Japan 28.22 46.82 91.51 224.3% 2.4% 5111 6817 9659 89.0% 1.3% 3620 5357 8340 130.4% 1.7%
Korea, Rep. of 22.03 50.46 91.6 315.8% 2.9% 814.2 2273 3472 326.4% 2.9% 1082 2481 3604 233.1% 2.4%
Taiwan 17.08 34.13 82.63 383.8% 3.2% 362.2 889.7 2156 495.3% 3.6% 406.2 919.7 2176 435.7% 3.4%
Korea, Dem. Rep. of 2.873 4.149 6.366 121.6% 1.6% 24.99 43.25 71.35 185.5% 2.1% 65.65 98.04 140.2 113.6% 1.5%
Hong Kong 36.67 51.76 63.59 73.4% 1.1% 255.5 418.4 520.5 103.7% 1.4% 268.1 433.5 532.5 98.6% 1.4%
Mongolia 2.589 4.883 13.46 419.9% 3.4% 1.895 6.048 29.22 1442.0% 5.6% 7.061 16.08 46.78 562.5% 3.9%
Asia-East 7.463 21.51 57.19 666.3% 4.2% 9413 30342 89121 846.8% 4.6% 11765 36359 95362 710.6% 4.3%
India 2.403 7.669 23.15 863.4% 4.6% 911.8 5932 28538 3029.9% 7.1% 2787 10721 35025 1156.7% 5.2%
Pakistan 2.157 3.537 7.065 227.5% 2.4% 120.8 377.6 1301 977.0% 4.9% 370.9 951.8 2454 561.6% 3.9%
Bangladesh 1.134 2.989 7.292 543.0% 3.8% 80.75 326.8 1035 1181.7% 5.2% 174.2 575.4 1486 753.0% 4.4%
Afghanistan 0.657 0.799 1.453 121.2% 1.6% 4.461 11.8 50 1020.8% 5.0% 23.42 59.84 199.2 750.6% 4.4%
Iran, Islamic Rep. of 8.938 19.17 23.7 165.2% 2.0% 164 762.8 1362 730.5% 4.3% 647 1754 2339 261.5% 2.6%
Nepal 0.923 1.715 4.222 357.4% 3.1% 7.773 23.55 87.81 1029.7% 5.0% 27.12 69.62 189.1 597.3% 4.0%
Uzbekistan 2.042 3.67 6.323 209.6% 2.3% 22.63 58.35 116.7 415.7% 3.3% 56.71 122.6 210.6 271.4% 2.7%
Sri Lanka 3.481 8.154 20.16 479.1% 3.6% 25.35 96.35 339.6 1239.6% 5.3% 71.01 180.1 427.8 502.5% 3.7%
Kazakhstan 9.988 28.51 30.42 204.6% 2.3% 45.44 253 298.3 556.5% 3.8% 151.5 439.5 425 180.5% 2.1%
Tajikistan 1.502 2.638 6.44 328.8% 3.0% 2.026 6.916 29.97 1379.3% 5.5% 10.45 25.84 69.56 565.6% 3.9%
Turkmenistan 2.912 11.61 9.698 233.0% 2.4% 5.754 49.43 42.83 644.4% 4.1% 15.02 75.71 68.84 358.3% 3.1%
Kyrgyzstan 1.632 2.448 4.444 172.3% 2.0% 1.932 4.28 10.48 442.4% 3.4% 8.931 15.76 28.05 214.1% 2.3%
Bhutan 3.837 9.477 26.12 580.7% 3.9% 0.892 4.585 21.78 2341.7% 6.6% 2.595 8.492 27.02 941.2% 4.8%
Maldives 4.24 14.47 58.51 1280.0% 5.4% 1.078 6.336 33.07 2967.7% 7.1% 1.517 7.132 34.22 2155.8% 6.4%
Asia-South Central 2.55 6.942 17.62 591.0% 3.9% 1395 7914 33267 2284.7% 6.5% 4347 15006 42984 888.8% 4.7%
Indonesia 3.184 5.953 11.76 269.3% 2.6% 257.9 737.6 2014 680.9% 4.2% 740.1 1581 3142 324.5% 2.9%
Philippines 2.895 5.944 13.57 368.7% 3.1% 117.7 416.6 1424 1109.9% 5.1% 264.1 724.8 1828 592.2% 3.9%
Vietnam 2.325 6.993 17.55 654.8% 4.1% 63.19 376.4 1526 2314.9% 6.6% 203.4 728 1936 851.8% 4.6%
Thailand 6.887 13.29 26.46 284.2% 2.7% 189.9 559.5 1502 690.9% 4.2% 456.1 939.3 1820 299.0% 2.8%
Myanmar 0.991 2.323 5.258 430.6% 3.4% 84.69 124.1 222.9 163.2% 2.0% 51.98 125.9 269.4 418.3% 3.3%
Malaysia 11.66 23.78 41.59 256.7% 2.6% 147.1 598.9 1498 918.4% 4.8% 320.6 853.4 1675 422.5% 3.4%
Cambodia 1.545 5.162 12.89 734.3% 4.3% 8.132 62.11 259.4 3089.9% 7.2% 23.73 114.4 338 1324.4% 5.5%
Lao PDR 1.836 6.615 24.23 1219.7% 5.3% 3.18 28.99 200.2 6195.6% 8.6% 11.91 60.31 260.2 2084.7% 6.4%
Singapore 41.22 60.53 69.01 67.4% 1.0% 144.6 259.6 305.8 111.5% 1.5% 192 321.9 352.6 83.6% 1.2%
Timor-Leste 1.964 3.4 10.22 420.4% 3.4% 0.458 2.191 18.54 3948.0% 7.7% 2.52 8.556 39.1 1451.6% 5.6%
Brunei Darussalam 42.44 55.59 62.54 47.4% 0.8% 7.911 19.32 29.61 274.3% 2.7% 17.59 32.19 42.19 139.9% 1.8%
Asia-South East 3.901 7.932 16.27 317.1% 2.9% 1025 3185 9001 778.1% 4.4% 2284 5490 11702 412.3% 3.3%
VOL2_15 Forecast Tables rev.indd 229 21/08/2009 09:07

Patterns of Potential Hum
an Progress Volume 2: Enhancing Global Education
230
Patterns of Potential Human Progress Multination Regional Analysis Measures of Poverty, Health, Education, Infrastructure, and Governance
Base Case: Countries in Year 2060
Descending Population Sequence
PovertyGDP per Capita at PPP Gross Domestic Product GDP at PPP
Thousands in 2005 Dollars Billions in 2000 Dollars Billions in 2005 Dollars
2010 2035 2060 % Chg % An Chg 2010 2035 2060 % Chg % An Chg 2010 2035 2060 % Chg % An Chg
ASIA WITH OCEANIA continuedTurkey 7.691 17.48 45.82 495.8% 3.6% 307.4 1211 4131 1243.9% 5.3% 587.2 1605 4504 667.0% 4.2%
Yemen 1.969 4.248 8.527 333.1% 3.0% 13.52 77.94 312.3 2209.9% 6.5% 47.7 193 561.9 1078.0% 5.1%
Iraq 2.287 5.936 14.17 519.6% 3.7% 23.38 153.5 685.9 2833.7% 7.0% 68.49 298.4 929.4 1257.0% 5.4%
Saudi Arabia 18.97 27.63 36.51 92.5% 1.3% 263.8 792.2 1619 513.7% 3.7% 490.8 1120 1863 279.6% 2.7%
Syria 3.727 5.961 13.33 257.7% 2.6% 28.73 88.49 349.6 1116.8% 5.1% 79.8 194.5 524 556.6% 3.8%
Israel 21.78 54.21 113.9 423.0% 3.4% 161.1 540.2 1322 720.6% 4.3% 166.3 545.1 1325 696.8% 4.2%
Azerbaijan 5.343 11.37 15.5 190.1% 2.2% 16.08 61.58 101.3 530.0% 3.7% 47.73 118.6 158.7 232.5% 2.4%
Jordan 4.313 11.47 43.88 917.4% 4.7% 14.66 72.82 401.5 2638.7% 6.8% 26.2 95.86 436.7 1566.8% 5.8%
Palestine 3.256 6.235 15.76 384.0% 3.2% 4.586 20.52 105 2189.6% 6.5% 13.61 44.99 147.6 984.5% 4.9%
United Arab Emirates 30.32 43.28 58.79 93.9% 1.3% 119.9 248.5 360 200.3% 2.2% 151.5 279.1 388.2 156.2% 1.9%
Oman 18.37 25.57 33.48 82.3% 1.2% 28.92 80.57 159.1 450.1% 3.5% 52.34 113.4 188.2 259.6% 2.6%
Kuwait 39.7 66.85 54.76 37.9% 0.6% 63.73 191.7 215.4 238.0% 2.5% 114 277.9 277.1 143.1% 1.8%
Lebanon 8.71 15.95 31.16 257.7% 2.6% 22.73 61.27 140.4 517.7% 3.7% 33.15 71.54 146.9 343.1% 3.0%
Georgia 3.716 6.702 12.28 230.5% 2.4% 5.485 11 22.23 305.3% 2.8% 16.14 23.71 35.61 120.6% 1.6%
Armenia 4.485 14.35 27.5 513.2% 3.7% 4.685 26.58 64.32 1272.9% 5.4% 13.72 43.43 75.63 451.2% 3.5%
Bahrain 31.28 38.31 49.46 58.1% 0.9% 13.09 26.71 44.35 238.8% 2.5% 24.86 39.74 55.86 124.7% 1.6%
Qatar 70.04 132 87.7 25.2% 0.5% 19.53 59.46 49.49 153.4% 1.9% 61.39 139.6 92.01 49.9% 0.8%
Cyprus 23.2 36.63 59.35 155.8% 1.9% 12.77 26.59 40.23 215.0% 2.3% 18.11 29.96 43.48 140.1% 1.8%
Asia-West 8.79 16.07 29.99 241.2% 2.5% 1124 3751 10123 800.6% 4.5% 2013 5234 11753 483.9% 3.6%
Australia 32.24 53.21 92.74 187.7% 2.1% 551.2 1192 2364 328.9% 3.0% 690.1 1352 2568 272.1% 2.7%
Papua New Guniea 1.588 3.604 5.784 264.2% 2.6% 4.069 18.27 41.71 925.1% 4.8% 10.36 36.29 75.33 627.1% 4.0%
New Zealand 23.12 36.69 81.49 252.5% 2.6% 71.7 160.1 378.1 427.3% 3.4% 98.68 178.6 401.7 307.1% 2.8%
Solomon Islands 1.641 2.433 4.298 161.9% 1.9% 0.387 0.916 2.414 523.8% 3.7% 0.876 2.06 4.848 453.4% 3.5%
Fiji 4.015 6.652 18.13 351.6% 3.1% 2.101 4.206 13.94 563.5% 3.9% 3.552 6.382 16.16 355.0% 3.1%
Vanuatu 3.29 5.05 11.33 244.4% 2.5% 0.312 0.878 3.452 1006.4% 4.9% 0.779 1.871 5.199 567.4% 3.9%
Micronesia 5.039 6.99 16.56 228.6% 2.4% 0.254 0.627 2.699 962.6% 4.8% 0.618 1.299 3.79 513.3% 3.7%
Tonga 4.626 6.229 14.41 211.5% 2.3% 0.188 0.473 2.116 1025.5% 5.0% 0.523 1.111 3.239 519.3% 3.7%
Samoa 4.661 7.887 20.68 343.7% 3.0% 0.328 0.874 3.433 946.6% 4.8% 0.886 1.797 4.57 415.8% 3.3%
Oceania 23.52 36.68 63.18 168.6% 2.0% 630.6 1378 2812 345.9% 3.0% 806.4 1582 3083 282.3% 2.7%
VOL2_15 Forecast Tables rev.indd 230 21/08/2009 09:08

231Forecast Tables
Patterns of Potential Human Progress Multination Regional Analysis Measures of Poverty, Health, Education, Infrastructure, and Governance
Base Case: Countries in Year 2060
Descending Population Sequence
PovertyGDP per Capita at PPP Gross Domestic Product GDP at PPP
Thousands in 2005 Dollars Billions in 2000 Dollars Billions in 2005 Dollars
2010 2035 2060 % Chg % An Chg 2010 2035 2060 % Chg % An Chg 2010 2035 2060 % Chg % An Chg
EUROPERussian Federation 12.57 30.14 35.73 184.2% 2.1% 468.3 1906 2585 452.0% 3.5% 1774 3922 3930 121.5% 1.6%
Ukraine 5.904 14.36 30.68 419.6% 3.4% 58.88 210.6 638 983.6% 4.9% 268.6 534.4 947.9 252.9% 2.6%
Poland 13.83 27.48 51.97 275.8% 2.7% 251.7 715.3 1409 459.8% 3.5% 529.6 997.8 1593 200.8% 2.2%
Romania 9.386 16.61 27.35 191.4% 2.2% 60.05 146.8 307.2 411.6% 3.3% 201.7 324.3 454.8 125.5% 1.6%
Czech Republic 19.41 27.08 40.04 106.3% 1.5% 79.7 143.4 255.2 220.2% 2.4% 200 262.3 331.9 66.0% 1.0%
Belarus 8.983 18.56 32.84 265.6% 2.6% 24.13 77.49 186.5 672.9% 4.2% 87.03 167.7 260.7 199.6% 2.2%
Hungary 16.37 26.04 45.25 176.4% 2.1% 68.44 141 277.5 305.5% 2.8% 163.5 233.9 339.4 107.6% 1.5%
Bulgaria 9.322 16.62 33.79 262.5% 2.6% 19.51 43.25 117.8 503.8% 3.7% 69.88 100.3 167.6 139.8% 1.8%
Slovakia 15.64 21.77 33.4 113.6% 1.5% 31.28 57.98 108.9 248.1% 2.5% 85.08 113.9 149.8 76.1% 1.1%
Moldova, Rep. of 2.202 4.077 12.11 450.0% 3.5% 2.183 4.993 22.17 915.6% 4.7% 9.146 14.81 37.68 312.0% 2.9%
Europe-East 11.55 25.1 36.59 216.8% 2.3% 1064 3447 5907 455.2% 3.5% 3389 6671 8213 142.3% 1.8%
United Kingdom 29.81 49.91 100.3 236.5% 2.5% 1799 3240 6448 258.4% 2.6% 1840 3260 6459 251.0% 2.5%
Sweden 32.02 61.2 116.1 262.6% 2.6% 312.4 602.6 1077 244.8% 2.5% 294.2 576.8 1048 256.2% 2.6%
Denmark 32.09 53.37 105.7 229.4% 2.4% 187.3 320.1 616.3 229.0% 2.4% 177.5 307.9 601.3 238.8% 2.5%
Ireland 40.44 69.8 94.99 134.9% 1.7% 159.9 332.4 490.9 207.0% 2.3% 177.5 359.3 516.2 190.8% 2.2%
Norway 46.56 72.41 112.5 141.6% 1.8% 214 368.6 586.9 174.3% 2.0% 221.9 378.5 596.9 169.0% 2.0%
Finland 30.67 50.4 100 226.1% 2.4% 160.4 270 503.8 214.1% 2.3% 163.7 271.6 504.6 208.2% 2.3%
Lithuania 14.32 24.26 44.18 208.5% 2.3% 20.73 47.11 98.48 375.1% 3.2% 48.44 75.4 116.5 140.5% 1.8%
Latvia 13.76 28.48 58.3 323.7% 2.9% 14.98 42.84 90.21 502.2% 3.7% 31.29 58.87 102 226.0% 2.4%
Estonia 17.64 32.23 61.99 251.4% 2.5% 11.03 25.43 48.27 337.6% 3.0% 23.08 35.2 56.84 146.3% 1.8%
Iceland 35.56 63.69 115.4 224.5% 2.4% 12.43 23.83 40.67 227.2% 2.4% 10.97 21.77 38.43 250.3% 2.5%
Europe-North 30.43 51.95 99.9 228.3% 2.4% 2892 5273 10001 245.8% 2.5% 2989 5345 10040 235.9% 2.5%
Italy 24.62 31.19 54.77 122.5% 1.6% 1168 1561 2353 101.5% 1.4% 1449 1687 2453 69.3% 1.1%
Spain 24.9 36.23 60.95 144.8% 1.8% 752.2 1330 2004 166.4% 2.0% 1099 1548 2214 101.5% 1.4%
Greece 27.46 36.68 53.51 94.9% 1.3% 202.3 322.5 436.9 116.0% 1.6% 308.4 393.4 496.9 61.1% 1.0%
Portugal 17.76 24.75 49.4 178.2% 2.1% 122.1 202.4 427.2 249.9% 2.5% 189.2 255 458.3 142.2% 1.8%
Serbia 8.586 13.91 28.07 226.9% 2.4% 13.51 31.11 98.83 631.5% 4.1% 63.3 95.02 172 171.7% 2.0%
Croatia 12.84 20.09 40.77 217.5% 2.3% 27 52.05 122.8 354.8% 3.1% 56.77 80.85 142.2 150.5% 1.9%
Bosnia and Herzegovina 5.626 7.926 16.11 186.3% 2.1% 7.927 13.23 33.58 323.6% 2.9% 22.91 30.19 51.69 125.6% 1.6%
Albania 5.563 12.59 25.93 366.1% 3.1% 6.075 23.02 66.32 991.7% 4.9% 17.7 42.51 82.72 367.3% 3.1%
Macedonia, TFYR 6.808 7.883 14.54 113.6% 1.5% 4.231 5.799 13.97 230.2% 2.4% 14.06 15.75 25.49 81.3% 1.2%
Slovenia 21.87 34.11 69.53 217.9% 2.3% 26.9 52.47 94.6 251.7% 2.5% 43.97 64.13 105.8 140.6% 1.8%
Montenegro 7.179 12.48 30.51 325.0% 2.9% 1.27 3.266 12.75 903.9% 4.7% 4.45 7.741 17.98 304.0% 2.8%
Malta 19.47 30.42 60.58 211.1% 2.3% 4.667 9.735 19.09 309.0% 2.9% 7.983 12.41 21.29 166.7% 2.0%
Europe-South 21.99 30.06 52.05 136.7% 1.7% 2336 3606 5683 143.3% 1.8% 3277 4232 6241 90.4% 1.3%
Germany 27.9 43.83 95.1 240.9% 2.5% 2099 3370 6428 206.2% 2.3% 2314 3470 6549 183.0% 2.1%
France 28.28 41.9 90.96 221.6% 2.4% 1573 2609 5487 248.8% 2.5% 1762 2709 5621 219.0% 2.3%
Netherlands 32.3 46.08 78.38 142.7% 1.8% 460.1 741.2 1259 173.6% 2.0% 542.1 816.1 1340 147.2% 1.8%
Belgium 28.87 40.86 80.39 178.5% 2.1% 269.2 416.2 785.5 191.8% 2.2% 308.1 441.8 816.3 164.9% 2.0%
Austria 31.46 48.44 89.34 184.0% 2.1% 226.5 350.1 555.5 145.3% 1.8% 260.8 379.9 585.6 124.5% 1.6%
Switzerland 33.62 52.36 96.69 187.6% 2.1% 280.9 412.2 626.4 123.0% 1.6% 253 382.1 597.3 136.1% 1.7%
Luxembourg 68.23 79.15 101.1 48.2% 0.8% 27.97 42.84 68.96 146.5% 1.8% 33.23 48.75 75.02 125.8% 1.6%
Europe-West 28.96 43.85 90.93 214.0% 2.3% 4937 7942 15209 208.1% 2.3% 5473 8248 15584 184.7% 2.1%
VOL2_15 Forecast Tables rev.indd 231 21/08/2009 09:08

Patterns of Potential Hum
an Progress Volume 2: Enhancing Global Education
232
Patterns of Potential Human Progress Multination Regional Analysis Measures of Poverty, Health, Education, Infrastructure, and Governance
Base Case
Source: International Futures Version 6.12, March 2009
HealthLife Expectancy at Birth Infant Mortality Total Fertility Rate
Years Per Thousand Births Births per Woman
2010 2035 2060 % Chg % An Chg 2010 2035 2060 % Chg % An Chg 2010 2035 2060 % Chg % An Chg
World 68.81 75.1 80.85 17.5% 0.3% 40.46 30.11 18.93 -53.2% -1.5% 2.512 2.232 2.005 -20.2% -0.4%
Africa 56.59 63.32 70.64 24.8% 0.4% 81.79 67.68 45.11 -44.8% -1.2% 4.665 3.542 2.489 -46.6% -1.2%Americas 75.3 79.99 85.17 13.1% 0.2% 16.93 10.81 4.999 -70.5% -2.4% 2.054 1.829 1.802 -12.3% -0.3%Asia with Oceania 68.99 77.04 83.92 21.6% 0.4% 41.43 25.2 12.19 -70.6% -2.4% 2.278 1.973 1.876 -17.6% -0.4%Europe 76.34 81.96 85.07 11.4% 0.2% 8.244 5.335 3.943 -52.2% -1.5% 1.451 1.553 1.649 13.6% 0.3%World 68.81 75.1 80.85 17.5% 0.3% 40.46 30.11 18.93 -53.2% -1.5% 2.512 2.232 2.005 -20.2% -0.4%
Africa-Eastern 54.84 63.63 72.48 32.2% 0.6% 87.28 70.73 38.64 -55.7% -1.6% 5.158 3.602 2.204 -57.3% -1.7%Africa-Middle 47.38 55.19 65.76 38.8% 0.7% 88.26 70.67 50.47 -42.8% -1.1% 5.751 4.689 3.212 -44.1% -1.2%Africa-Northern 69.51 74.76 81.96 17.9% 0.3% 41.01 28.58 14.18 -65.4% -2.1% 2.866 2.112 1.904 -33.6% -0.8%Africa-Southern 56.54 69.04 75.42 33.4% 0.6% 50.86 35.36 19.66 -61.3% -1.9% 2.652 1.853 1.8 -32.1% -0.8%Africa-Western 53.48 60.09 66.16 23.7% 0.4% 107.1 87.84 64.64 -39.6% -1.0% 5.298 3.905 2.698 -49.1% -1.3%Africa 56.59 63.32 70.64 24.8% 0.4% 81.79 67.68 45.11 -44.8% -1.2% 4.665 3.542 2.489 -46.6% -1.2%
America-Caribbean 71.15 75.37 82.04 15.3% 0.3% 26 21.39 14.56 -44.0% -1.2% 2.432 2.174 1.938 -20.3% -0.5%America-Central 71.83 75.63 82.35 14.6% 0.3% 28.64 21.52 10.37 -63.8% -2.0% 3.074 2.16 1.8 -41.4% -1.1%America-North 77.8 81.38 84.77 9.0% 0.2% 9.384 6.416 3.948 -57.9% -1.7% 1.831 1.785 1.791 -2.2% 0.0%America-South 73.25 79.48 86.31 17.8% 0.3% 23.3 13.2 4.437 -81.0% -3.3% 2.158 1.8 1.8 -16.6% -0.4%Americas 75.3 79.99 85.17 13.1% 0.2% 16.93 10.81 4.999 -70.5% -2.4% 2.054 1.829 1.802 -12.3% -0.3%
Asia-East 73.17 83.41 88.63 21.1% 0.4% 23.28 7.424 3.525 -84.9% -3.7% 1.736 1.758 1.778 2.4% 0.0%Asia-South Central 64.9 73.03 81.54 25.6% 0.5% 62.17 39.87 18.27 -70.6% -2.4% 2.681 2.135 1.975 -26.3% -0.6%Asia-South East 68.63 73.91 81.56 18.8% 0.3% 32.42 23.99 11.85 -63.4% -2.0% 2.236 1.821 1.8 -19.5% -0.4%Asia-West 70.6 77.04 83.33 18.0% 0.3% 38.52 24.02 11.83 -69.3% -2.3% 3.12 2.325 1.828 -41.4% -1.1%Oceania 75.96 78.75 81.55 7.4% 0.1% 17.61 15.48 12.38 -29.7% -0.7% 2.269 2.065 1.838 -19.0% -0.4%Asia with Oceania 68.99 77.04 83.92 21.6% 0.4% 41.43 25.2 12.19 -70.6% -2.4% 2.278 1.973 1.876 -17.6% -0.4%
Europe-East 70.87 80.04 84.61 19.4% 0.4% 12.46 6.891 4.505 -63.8% -2.0% 1.3 1.434 1.567 20.5% 0.4%Europe-North 79.66 82.59 84.82 6.5% 0.1% 4.961 4.127 3.603 -27.4% -0.6% 1.766 1.778 1.788 1.2% 0.0%Europe-South 79.85 83.46 86.23 8.0% 0.2% 6.209 4.836 3.533 -43.1% -1.1% 1.371 1.486 1.601 16.8% 0.3%Europe-West 80.23 83.06 85.03 6.0% 0.1% 4.397 3.845 3.515 -20.1% -0.4% 1.578 1.643 1.704 8.0% 0.2%Europe 76.34 81.96 85.07 11.4% 0.2% 8.244 5.335 3.943 -52.2% -1.5% 1.451 1.553 1.649 13.6% 0.3%
VOL2_15 Forecast Tables rev.indd 232 21/08/2009 09:08

233Forecast Tables
Patterns of Potential Human Progress Multination Regional Analysis Measures of Poverty, Health, Education, Infrastructure, and Governance
Base Case: Countries in Year 2060
Descending Population Sequence
HealthLife Expectancy at Birth Infant Mortality Total Fertility Rate
Years Per Thousand Births Births per Woman
2010 2035 2060 % Chg % An Chg 2010 2035 2060 % Chg % An Chg 2010 2035 2060 % Chg % An Chg
AFRICAEthiopia 54.3 60.08 69.82 28.6% 0.5% 94.29 81.27 48.49 -48.6% -1.3% 5.215 4.16 2.512 -51.8% -1.5%
Uganda 58.35 67.71 76.56 31.2% 0.5% 82.64 61.09 25.66 -68.9% -2.3% 6.318 3.77 1.8 -71.5% -2.5%
Tanzania, United Rep. of 57.34 68.06 80.08 39.7% 0.7% 76.83 53.84 17.82 -76.8% -2.9% 4.987 2.98 1.8 -63.9% -2.0%
Kenya 59.71 68.33 76.09 27.4% 0.5% 68.02 51.33 25.35 -62.7% -2.0% 4.642 2.792 1.8 -61.2% -1.9%
Madagascar 58.49 60.01 68.34 16.8% 0.3% 74.71 72.36 48.77 -34.7% -0.8% 4.823 3.732 2.388 -50.5% -1.4%
Mozambique 49.08 65.65 78.55 60.0% 0.9% 105 70.98 23.27 -77.8% -3.0% 4.995 3.123 1.8 -64.0% -2.0%
Malawi 56.47 65.93 66.73 18.2% 0.3% 101.9 87.3 59.37 -41.7% -1.1% 5.415 3.743 1.957 -63.9% -2.0%
Zambia 48.29 63.13 66.73 38.2% 0.6% 98.86 82.15 53.07 -46.3% -1.2% 5.079 3.479 1.8 -64.6% -2.1%
Burundi 52.63 59.21 68.49 30.1% 0.5% 106.4 92.47 53.03 -50.2% -1.4% 6.613 5.182 2.868 -56.6% -1.7%
Rwanda 48.51 59.35 67.52 39.2% 0.7% 116.9 91.19 57.3 -51.0% -1.4% 5.769 4.177 2.365 -59.0% -1.8%
Somalia 35.42 45.58 72.62 105.0% 1.4% 132.2 126.9 53.9 -59.2% -1.8% 5.406 4.646 4.345 -19.6% -0.4%
Zimbabwe 54.07 70.06 68.77 27.2% 0.5% 62.92 47.02 33.86 -46.2% -1.2% 3.509 1.8 1.8 -48.7% -1.3%
Eritrea 51.37 45.67 50.51 -1.7% 0.0% 62.11 60.78 57.86 -6.8% -0.1% 5.15 4.505 3.64 -29.3% -0.7%
Mauritius 73.51 81.18 87.02 18.4% 0.3% 14.36 7.317 3.262 -77.3% -2.9% 1.816 1.8 1.8 -0.9% 0.0%
Comoros 62.47 63.48 72.98 16.8% 0.3% 57.37 54.58 32.5 -43.4% -1.1% 3.733 3.216 2.014 -46.0% -1.2%
Djibouti 56.16 59.61 68.67 22.3% 0.4% 93.26 84.42 53.34 -42.8% -1.1% 4.08 3.207 1.909 -53.2% -1.5%
Africa-Eastern 54.84 63.63 72.48 32.2% 0.6% 87.28 70.73 38.64 -55.7% -1.6% 5.158 3.602 2.204 -57.3% -1.7%
Congo; Dem. Rep. of 43.79 51.57 66.99 53.0% 0.9% 72.1 57.72 37.59 -47.9% -1.3% 6.144 5.123 3.264 -46.9% -1.3%
Angola 43.51 55.57 61.97 42.4% 0.7% 132 102.5 81.16 -38.5% -1.0% 6.215 4.674 3.618 -41.8% -1.1%
Cameroon 56.09 63.82 67.56 20.4% 0.4% 87.07 71.16 49.83 -42.8% -1.1% 4.389 3.365 2.19 -50.1% -1.4%
Chad 53.87 59.41 60.71 12.7% 0.2% 121.5 104.6 92.45 -23.9% -0.5% 6.22 4.84 3.899 -37.3% -0.9%
Central African Republic 48.61 58.68 63.79 31.2% 0.5% 100.2 84.8 60.65 -39.5% -1.0% 4.649 3.812 2.626 -43.5% -1.1%
Congo, Rep. of 58.64 66.02 67.77 15.6% 0.3% 71.97 55.59 45.47 -36.8% -0.9% 4.436 3.161 2.21 -50.2% -1.4%
Gabon 60.69 66.99 71.46 17.7% 0.3% 58.71 45.74 32.63 -44.4% -1.2% 3.153 2.567 1.962 -37.8% -0.9%
Equatorial Guinea 49.87 62.03 67.73 35.8% 0.6% 94.11 70.53 54.21 -42.4% -1.1% 5.045 3.329 2.512 -50.2% -1.4%
São Tomé and Príncipe 63.54 64.39 68.47 7.8% 0.1% 78.1 74.45 63.36 -18.9% -0.4% 3.995 3.543 2.602 -34.9% -0.9%
Africa-Middle 47.38 55.19 65.76 38.8% 0.7% 88.26 70.67 50.47 -42.8% -1.1% 5.751 4.689 3.212 -44.1% -1.2%
Egypt 71.36 76.98 87.06 22.0% 0.4% 35.46 21.84 3.112 -91.2% -4.7% 2.801 1.8 1.8 -35.7% -0.9%
Sudan 60.33 68.76 74.74 23.9% 0.4% 67.76 46.65 30.77 -54.6% -1.6% 4.282 3.14 2.189 -48.9% -1.3%
Algeria 72.47 75.95 79.72 10.0% 0.2% 36.51 25.82 18.12 -50.4% -1.4% 2.27 1.8 1.8 -20.7% -0.5%
Morocco 70.43 73.5 81.04 15.1% 0.3% 37.17 30.74 14.27 -61.6% -1.9% 2.287 1.8 1.8 -21.3% -0.5%
Tunisia 74.18 81.04 89.56 20.7% 0.4% 22.15 10.52 3.062 -86.2% -3.9% 1.861 1.8 1.8 -3.3% -0.1%
Libyan Arab Jamahiriya 75.11 82.1 84.59 12.6% 0.2% 18.44 8.665 5.386 -70.8% -2.4% 2.629 1.8 1.8 -31.5% -0.8%
Africa-Northern 69.51 74.76 81.96 17.9% 0.3% 41.01 28.58 14.18 -65.4% -2.1% 2.866 2.112 1.904 -33.6% -0.8%
VOL2_15 Forecast Tables rev.indd 233 21/08/2009 09:08

Patterns of Potential Hum
an Progress Volume 2: Enhancing Global Education
234
Patterns of Potential Human Progress Multination Regional Analysis Measures of Poverty, Health, Education, Infrastructure, and Governance
Base Case: Countries in Year 2060
Descending Population Sequence
HealthLife Expectancy at Birth Infant Mortality Total Fertility Rate
Years Per Thousand Births Births per Woman
2010 2035 2060 % Chg % An Chg 2010 2035 2060 % Chg % An Chg 2010 2035 2060 % Chg % An Chg
AFRICA continuedSouth Africa 56.53 68.77 75.07 32.8% 0.6% 48.99 34.18 19.33 -60.5% -1.8% 2.57 1.8 1.8 -30.0% -0.7%
Namibia 60.19 71.25 80.42 33.6% 0.6% 52.57 34.43 14.27 -72.9% -2.6% 3.22 2.187 1.8 -44.1% -1.2%
Lesotho 52.84 69.56 77.47 46.6% 0.8% 70.85 47.02 22.12 -68.8% -2.3% 3.376 2.27 1.8 -46.7% -1.2%
Botswana 59.98 72.76 76.57 27.7% 0.5% 55.7 33.47 20.99 -62.3% -1.9% 2.818 1.8 1.8 -36.1% -0.9%
Swaziland 50.81 68.12 72.26 42.2% 0.7% 84.26 61.46 34.68 -58.8% -1.8% 3.53 2.47 1.8 -49.0% -1.3%
Africa-Southern 56.54 69.04 75.42 33.4% 0.6% 50.86 35.36 19.66 -61.3% -1.9% 2.652 1.853 1.8 -32.1% -0.8%
Nigeria 50.91 60.6 63.29 24.3% 0.4% 110.7 85.26 70.29 -36.5% -0.9% 5.255 3.676 2.804 -46.6% -1.2%
Niger 56.26 57.94 67.44 19.9% 0.4% 118.4 114.5 73.92 -37.6% -0.9% 6.77 5.095 2.949 -56.4% -1.6%
Côte d’Ivoire 55.03 63.3 66.4 20.7% 0.4% 118.4 95.33 67.74 -42.8% -1.1% 4.608 3.558 2.342 -49.2% -1.3%
Ghana 60.72 62.81 67.79 11.6% 0.2% 62.99 59.19 44.48 -29.4% -0.7% 3.905 3.153 2.141 -45.2% -1.2%
Burkina Faso 52.97 59.92 71.62 35.2% 0.6% 108.5 86.31 46.85 -56.8% -1.7% 5.968 4.432 2.362 -60.4% -1.8%
Mali 54.23 59.45 69.79 28.7% 0.5% 136.7 114.7 68.67 -49.8% -1.4% 6.222 4.468 2.719 -56.3% -1.6%
Senegal 62.32 65.05 72.69 16.6% 0.3% 68.76 61.97 39.19 -43.0% -1.1% 5.166 4.038 2.613 -49.4% -1.4%
Guinea 56.52 63.29 72.11 27.6% 0.5% 110.5 85.82 51.33 -53.5% -1.5% 5.53 4.139 2.582 -53.3% -1.5%
Benin 57.04 61.83 71.03 24.5% 0.4% 104.2 88.1 52.91 -49.2% -1.3% 5.315 3.923 2.332 -56.1% -1.6%
Togo 59.87 47.42 61.84 3.3% 0.1% 93.39 91.24 84.2 -9.8% -0.2% 4.8 3.912 2.824 -41.2% -1.1%
Sierra Leone 35.56 43.99 65.55 84.3% 1.2% 161.6 128 78.4 -51.5% -1.4% 6.232 4.468 2.459 -60.5% -1.8%
Liberia 45.21 41.61 68.1 50.6% 0.8% 136.9 110.3 66.33 -51.5% -1.4% 6.577 5.536 3.799 -42.2% -1.1%
Mauritania 63.48 64.54 69.98 10.2% 0.2% 67.43 65.65 48.09 -28.7% -0.7% 4.476 3.749 2.782 -37.8% -0.9%
Guinea-Bissau 47.63 51.86 59.1 24.1% 0.4% 119.9 109.9 84.74 -29.3% -0.7% 6.775 5.249 3.748 -44.7% -1.2%
Gambia 59.11 61.04 68.64 16.1% 0.3% 79.71 73.97 51.36 -35.6% -0.9% 4.706 3.833 2.793 -40.7% -1.0%
Cape Verde 70.59 74.18 86.4 22.4% 0.4% 29.81 24.13 3.283 -89.0% -4.3% 3.302 1.992 1.8 -45.5% -1.2%
Africa-Western 53.48 60.09 66.16 23.7% 0.4% 107.1 87.84 64.64 -39.6% -1.0% 5.298 3.905 2.698 -49.1% -1.3%
VOL2_15 Forecast Tables rev.indd 234 21/08/2009 09:08

235Forecast Tables
Patterns of Potential Human Progress Multination Regional Analysis Measures of Poverty, Health, Education, Infrastructure, and Governance
Base Case: Countries in Year 2060
Descending Population Sequence
HealthLife Expectancy at Birth Infant Mortality Total Fertility Rate
Years Per Thousand Births Births per Woman
2010 2035 2060 % Chg % An Chg 2010 2035 2060 % Chg % An Chg 2010 2035 2060 % Chg % An Chg
AMERICASHaiti 60.59 63.22 69.48 14.7% 0.3% 56.14 51.01 36.51 -35.0% -0.9% 3.854 3.253 2.287 -40.7% -1.0%
Dominican Republic 69.96 79.09 88.56 26.6% 0.5% 34.58 15.27 3.297 -90.5% -4.6% 2.597 1.8 1.8 -30.7% -0.7%
Cuba 77.7 81.06 91.52 17.8% 0.3% 6.066 4.885 2.464 -59.4% -1.8% 1.561 1.625 1.688 8.1% 0.2%
Puerto Rico 79.52 85.62 87.57 10.1% 0.2% 7.115 3.457 3.009 -57.7% -1.7% 1.776 1.782 1.789 0.7% 0.0%
Jamaica 70.84 75.48 82.1 15.9% 0.3% 14.19 11.13 6.207 -56.3% -1.6% 2.232 1.8 1.8 -19.4% -0.4%
Trinidad and Tobago 69.74 78.77 83.52 19.8% 0.4% 13.31 7.74 5.42 -59.3% -1.8% 1.636 1.679 1.723 5.3% 0.1%
Bahamas 73.73 79.72 83.6 13.4% 0.3% 14.45 9.155 5.682 -60.7% -1.8% 1.872 1.8 1.8 -3.8% -0.1%
Barbados 77.33 83.36 87.97 13.8% 0.3% 11.38 5.451 3.08 -72.9% -2.6% 1.518 1.593 1.668 9.9% 0.2%
St. Vincent & the Grenadines 71.68 77.59 87.11 21.5% 0.4% 25.45 15.1 3.01 -88.2% -4.2% 2.089 1.8 1.8 -13.8% -0.3%
Grenada 73.32 77.07 86.02 17.3% 0.3% 36.45 25.12 3.289 -91.0% -4.7% 2.295 1.8 1.8 -21.6% -0.5%
St. Lucia 74.7 80.36 88.22 18.1% 0.3% 13.83 8.171 3.15 -77.2% -2.9% 1.903 1.8 1.8 -5.4% -0.1%
America-Caribbean 71.15 75.37 82.04 15.3% 0.3% 26 21.39 14.56 -44.0% -1.2% 2.432 2.174 1.938 -20.3% -0.5%
Guatemala 70.31 73.87 81.22 15.5% 0.3% 37.53 26.93 11.73 -68.7% -2.3% 4.068 2.721 1.8 -55.8% -1.6%
Honduras 68.61 72.18 80.08 16.7% 0.3% 31.47 27.1 13.91 -55.8% -1.6% 3.043 1.838 1.8 -40.8% -1.0%
El Salvador 71.92 76.89 85.47 18.8% 0.3% 26.23 16.18 3.668 -86.0% -3.9% 2.586 1.8 1.8 -30.4% -0.7%
Nicaragua 71.9 72.24 77.04 7.1% 0.1% 26.34 25.61 18.09 -31.3% -0.7% 2.664 1.8 1.8 -32.4% -0.8%
Costa Rica 78.51 85.47 89.33 13.8% 0.3% 10.36 3.999 3.118 -69.9% -2.4% 1.893 1.8 1.8 -4.9% -0.1%
Panama 76.05 83.88 88.73 16.7% 0.3% 20.08 6.284 3.209 -84.0% -3.6% 2.369 1.8 1.8 -24.0% -0.5%
Belize 72.7 81.15 88.16 21.3% 0.4% 17.42 8.059 3.154 -81.9% -3.4% 2.797 1.8 1.8 -35.6% -0.9%
America-Central 71.83 75.63 82.35 14.6% 0.3% 28.64 21.52 10.37 -63.8% -2.0% 3.074 2.16 1.8 -41.4% -1.1%
United States of America 78.33 81.31 83.9 7.1% 0.1% 6.543 5.303 4.219 -35.5% -0.9% 1.8 1.8 1.8 0.0% 0.0%
Mexico 75.39 81.08 87.33 15.8% 0.3% 18.87 10.25 3.222 -82.9% -3.5% 2.012 1.8 1.8 -10.5% -0.2%
Canada 80.71 83.08 85.02 5.3% 0.1% 4.921 4.193 3.639 -26.1% -0.6% 1.526 1.599 1.672 9.6% 0.2%
America-North 77.8 81.38 84.77 9.0% 0.2% 9.384 6.416 3.948 -57.9% -1.7% 1.831 1.785 1.791 -2.2% 0.0%
Brazil 72.46 79.04 87.15 20.3% 0.4% 25.81 13.76 3.208 -87.6% -4.1% 2.05 1.8 1.8 -12.2% -0.3%
Colombia 73.26 78.34 87.46 19.4% 0.4% 20.12 12.4 3.02 -85.0% -3.7% 2.144 1.8 1.8 -16.0% -0.3%
Argentina 75.86 83.34 87.14 14.9% 0.3% 13.37 4.791 3.277 -75.5% -2.8% 2.039 1.8 1.8 -11.7% -0.2%
Venezuela, RB 74.99 80.68 85.13 13.5% 0.3% 17.15 9.178 3.891 -77.3% -2.9% 2.431 1.8 1.8 -26.0% -0.6%
Peru 71.6 78.18 84.78 18.4% 0.3% 28.11 15.78 4.698 -83.3% -3.5% 2.303 1.8 1.8 -21.8% -0.5%
Chile 78.94 86.91 88.53 12.1% 0.2% 7.694 3.424 3.167 -58.8% -1.8% 1.8 1.8 1.8 0.0% 0.0%
Ecuador 74.99 76.75 78.9 5.2% 0.1% 24.67 22.89 17.7 -28.3% -0.7% 2.476 1.8 1.8 -27.3% -0.6%
Bolivia 66.71 74.74 82.69 24.0% 0.4% 50.81 30.09 11.25 -77.9% -3.0% 3.369 1.8 1.8 -46.6% -1.2%
Paraguay 71.45 73.32 80.07 12.1% 0.2% 35.23 33.12 17.48 -50.4% -1.4% 2.977 1.8 1.8 -39.5% -1.0%
Uruguay 76.43 82.51 87.71 14.8% 0.3% 13.8 5.801 3.311 -76.0% -2.8% 1.852 1.8 1.8 -2.8% -0.1%
Guyana 66.99 74.12 82.06 22.5% 0.4% 47.33 29.59 10.16 -78.5% -3.0% 2.273 1.8 1.8 -20.8% -0.5%
Suriname 70.56 77.79 84.76 20.1% 0.4% 32.49 19.03 5.821 -82.1% -3.4% 2.381 1.8 1.8 -24.4% -0.6%
America-South 73.25 79.48 86.31 17.8% 0.3% 23.3 13.2 4.437 -81.0% -3.3% 2.158 1.8 1.8 -16.6% -0.4%
VOL2_15 Forecast Tables rev.indd 235 21/08/2009 09:09

Patterns of Potential Hum
an Progress Volume 2: Enhancing Global Education
236
Patterns of Potential Human Progress Multination Regional Analysis Measures of Poverty, Health, Education, Infrastructure, and Governance
Base Case: Countries in Year 2060
Descending Population Sequence
HealthLife Expectancy at Birth Infant Mortality Total Fertility Rate
Years Per Thousand Births Births per Woman
2010 2035 2060 % Chg % An Chg 2010 2035 2060 % Chg % An Chg 2010 2035 2060 % Chg % An Chg
ASIA WITH OCEANIAChina 72 83.45 89.07 23.7% 0.4% 25.59 7.366 3.182 -87.6% -4.1% 1.8 1.8 1.8 0.0% 0.0%
Japan 82.72 84.89 86.49 4.6% 0.1% 3.323 3.436 3.412 2.7% 0.1% 1.292 1.427 1.562 20.9% 0.4%
Korea, Rep. of 80.15 85.01 86.89 8.4% 0.2% 4.423 3.536 3.243 -26.7% -0.6% 1.123 1.303 1.483 32.1% 0.6%
Taiwan 76.72 84.07 86.36 12.6% 0.2% 23.19 7.671 4.323 -81.4% -3.3% 1.868 1.8 1.8 -3.6% -0.1%
Korea, Dem. Rep. of 67.51 70.63 75.9 12.4% 0.2% 44.62 36.11 25.3 -43.3% -1.1% 1.8 1.8 1.8 0.0% 0.0%
Hong Kong 82.1 84.15 86.19 5.0% 0.1% 3.76 3.512 3.308 -12.0% -0.3% 1.048 1.248 1.448 38.2% 0.6%
Mongolia 67.05 72.38 82.47 23.0% 0.4% 43.92 32.1 11.99 -72.7% -2.6% 2.063 1.8 1.8 -12.7% -0.3%
Asia-East 73.17 83.41 88.63 21.1% 0.4% 23.28 7.424 3.525 -84.9% -3.7% 1.736 1.758 1.778 2.4% 0.0%
India 65.15 75.72 86.26 32.4% 0.6% 60.56 30.28 3.513 -94.2% -5.5% 2.401 1.8 1.8 -25.0% -0.6%
Pakistan 64.95 68.96 75.86 16.8% 0.3% 74.7 60.68 37.19 -50.2% -1.4% 3.996 3.145 2.017 -49.5% -1.4%
Bangladesh 63.15 67.25 75.65 19.8% 0.4% 60.73 50.04 28.92 -52.4% -1.5% 2.795 1.8 1.8 -35.6% -0.9%
Afghanistan 41.57 47.51 55.92 34.5% 0.6% 165 143.6 113.7 -31.1% -0.7% 7.741 6.245 4.369 -43.6% -1.1%
Iran, Islamic Rep. of 72.05 80.28 84 16.6% 0.3% 33.11 15.36 8.31 -74.9% -2.7% 1.833 1.8 1.8 -1.8% 0.0%
Nepal 62.68 63.53 70.85 13.0% 0.2% 64 61.43 41.95 -34.5% -0.8% 3.066 2.42 1.8 -41.3% -1.1%
Uzbekistan 67.47 70.74 75.73 12.2% 0.2% 57.12 50.21 33.58 -41.2% -1.1% 2.035 1.8 1.8 -11.5% -0.2%
Sri Lanka 74.53 77.05 85.02 14.1% 0.3% 12.27 11.16 4.428 -63.9% -2.0% 1.8 1.8 1.8 0.0% 0.0%
Kazakhstan 69.02 80.46 83.66 21.2% 0.4% 27.65 11.22 7.054 -74.5% -2.7% 1.8 1.8 1.8 0.0% 0.0%
Tajikistan 66.29 67.59 74.83 12.9% 0.2% 62.49 60.02 37.35 -40.2% -1.0% 3.28 2.165 1.8 -45.1% -1.2%
Turkmenistan 64.24 77.41 78.92 22.9% 0.4% 70.6 27.16 24.04 -65.9% -2.1% 2.485 1.8 1.8 -27.6% -0.6%
Kyrgyzstan 67.58 68.2 71.9 6.4% 0.1% 54.66 52.58 43.79 -19.9% -0.4% 2.245 1.8 1.8 -19.8% -0.4%
Bhutan 66.43 75.06 86.09 29.6% 0.5% 48.66 28.04 3.332 -93.2% -5.2% 2.466 2.07 1.8 -27.0% -0.6%
Maldives 69.5 82.24 87.96 26.6% 0.5% 39.95 12.29 3.495 -91.3% -4.8% 2.554 1.8 1.8 -29.5% -0.7%
Asia-South Central 64.9 73.03 81.54 25.6% 0.5% 62.17 39.87 18.27 -70.6% -2.4% 2.681 2.135 1.975 -26.3% -0.6%
Indonesia 68.4 73.41 80.36 17.5% 0.3% 33.87 24.15 12.94 -61.8% -1.9% 2.095 1.8 1.8 -14.1% -0.3%
Philippines 70.99 73.72 81.27 14.5% 0.3% 27.6 23.84 10.85 -60.7% -1.8% 3.12 1.8 1.8 -42.3% -1.1%
Vietnam 70.62 74.94 83.76 18.6% 0.3% 22.1 17.01 6.399 -71.0% -2.4% 1.8 1.8 1.8 0.0% 0.0%
Thailand 71.15 78.41 85.37 20.0% 0.4% 11.26 7.181 3.372 -70.1% -2.4% 1.8 1.8 1.8 0.0% 0.0%
Myanmar 57.8 63.65 74.65 29.2% 0.5% 73.93 60.23 36.9 -50.1% -1.4% 2.017 1.8 1.8 -10.8% -0.2%
Malaysia 75.14 83.28 87.21 16.1% 0.3% 9.248 4.829 3.211 -65.3% -2.1% 2.476 1.8 1.8 -27.3% -0.6%
Cambodia 60.47 71.44 79.91 32.1% 0.6% 67.87 39.07 16.48 -75.7% -2.8% 3.275 2.209 1.8 -45.0% -1.2%
Lao PDR 63.74 74.21 86.01 34.9% 0.6% 95.68 51.52 3.422 -96.4% -6.4% 3.194 1.831 1.8 -43.6% -1.1%
Singapore 80.16 82.68 85.04 6.1% 0.1% 2.998 3.078 3.129 4.4% 0.1% 1.274 1.414 1.554 22.0% 0.4%
Timor-Leste 55.3 55.35 70.84 28.1% 0.5% 79.73 83.57 41.37 -48.1% -1.3% 7.089 4.685 2.08 -70.7% -2.4%
Brunei Darussalam 77.62 80.45 83.3 7.3% 0.1% 5.823 4.93 4.105 -29.5% -0.7% 2.291 1.978 1.8 -21.4% -0.5%
Asia-South East 68.63 73.91 81.56 18.8% 0.3% 32.42 23.99 11.85 -63.4% -2.0% 2.236 1.821 1.8 -19.5% -0.4%
VOL2_15 Forecast Tables rev.indd 236 21/08/2009 09:09

237Forecast Tables
Patterns of Potential Human Progress Multination Regional Analysis Measures of Poverty, Health, Education, Infrastructure, and Governance
Base Case: Countries in Year 2060
Descending Population Sequence
HealthLife Expectancy at Birth Infant Mortality Total Fertility Rate
Years Per Thousand Births Births per Woman
2010 2035 2060 % Chg % An Chg 2010 2035 2060 % Chg % An Chg 2010 2035 2060 % Chg % An Chg
ASIA WITH OCEANIA continuedTurkey 72.36 81.6 88.03 21.7% 0.4% 29 11.06 3.035 -89.5% -4.4% 2.015 1.8 1.8 -10.7% -0.2%
Yemen 62.18 69.42 77.15 24.1% 0.4% 67.12 46.47 25.24 -62.4% -1.9% 5.442 3.495 1.978 -63.7% -2.0%
Iraq 60.6 71.09 80.94 33.6% 0.6% 87.93 51.92 21.87 -75.1% -2.7% 5.045 2.907 1.8 -64.3% -2.0%
Saudi Arabia 73.46 79.61 83.99 14.3% 0.3% 20.77 12.13 7.126 -65.7% -2.1% 3.418 2.37 1.8 -47.3% -1.3%
Syria 73.55 74.76 81.8 11.2% 0.2% 18.37 17.04 8.494 -53.8% -1.5% 3.088 2.171 1.8 -41.7% -1.1%
Israel 80.79 85.98 87.53 8.3% 0.2% 4.808 3.402 3.121 -35.1% -0.9% 2.43 1.8 1.8 -25.9% -0.6%
Azerbaijan 73.34 79.24 82.77 12.9% 0.2% 74.7 39.36 21.82 -70.8% -2.4% 2.049 1.8 1.8 -12.2% -0.3%
Jordan 71.98 79.03 88.91 23.5% 0.4% 23.02 13.06 3.221 -86.0% -3.9% 2.96 1.8 1.8 -39.2% -1.0%
Palestine 73.06 74.08 82.01 12.3% 0.2% 20.86 20.56 8.61 -58.7% -1.8% 4.203 2.135 1.8 -57.2% -1.7%
United Arab Emirates 79.14 81.88 84.56 6.8% 0.1% 8.411 6.494 4.75 -43.5% -1.1% 2.319 1.8 1.8 -22.4% -0.5%
Oman 75.92 81.08 84.94 11.9% 0.2% 14.14 8.619 4.886 -65.4% -2.1% 3.194 2.463 1.867 -41.5% -1.1%
Kuwait 77.86 81.13 84.22 8.2% 0.2% 8.133 6.287 4.63 -43.1% -1.1% 2.303 1.8 1.8 -21.8% -0.5%
Lebanon 72.16 79.06 86.62 20.0% 0.4% 24.41 13.47 3.306 -86.5% -3.9% 2.113 1.8 1.8 -14.8% -0.3%
Georgia 71.51 74.77 80.56 12.7% 0.2% 40 31.59 16.64 -58.4% -1.7% 1.377 1.489 1.602 16.3% 0.3%
Armenia 72.58 80.66 87.43 20.5% 0.4% 29.83 12.79 3.394 -88.6% -4.3% 1.424 1.524 1.624 14.0% 0.3%
Bahrain 76.11 79.38 82.55 8.5% 0.2% 11.9 8.971 6.417 -46.1% -1.2% 2.072 1.8 1.8 -13.1% -0.3%
Qatar 75.81 79.51 83.17 9.7% 0.2% 9.223 7.114 5.123 -44.5% -1.2% 2.578 1.8 1.8 -30.2% -0.7%
Cyprus 80.32 84.65 86.73 8.0% 0.2% 5.503 3.845 3.191 -42.0% -1.1% 1.443 1.538 1.633 13.2% 0.2%
Asia-West 70.6 77.04 83.33 18.0% 0.3% 38.52 24.02 11.83 -69.3% -2.3% 3.12 2.325 1.828 -41.4% -1.1%
Australia 81.33 83.49 85.44 5.1% 0.1% 4.693 4.038 3.532 -24.7% -0.6% 1.768 1.777 1.785 1.0% 0.0%
Papua New Guniea 57.91 65.99 72.06 24.4% 0.4% 62.93 45.63 32.77 -47.9% -1.3% 3.879 2.802 1.93 -50.2% -1.4%
New Zealand 80.64 85.15 86.8 7.6% 0.1% 5.265 3.677 3.228 -38.7% -1.0% 1.8 1.8 1.8 0.0% 0.0%
Solomon Islands 62.99 64.53 70.32 11.6% 0.2% 59.79 56.17 41.16 -31.2% -0.7% 3.93 3.212 2.329 -40.7% -1.0%
Fiji 68.72 73.72 84.57 23.1% 0.4% 20.88 14.94 5.1 -75.6% -2.8% 2.705 1.872 1.8 -33.5% -0.8%
Vanuatu 69.42 71.86 80.5 16.0% 0.3% 34.09 29.59 13.91 -59.2% -1.8% 3.706 2.563 1.8 -51.4% -1.4%
Micronesia 67.44 68.49 80.09 18.8% 0.3% 38.51 37.72 13.81 -64.1% -2.0% 3.701 2.506 1.8 -51.4% -1.4%
Tonga 72.68 74 81.86 12.6% 0.2% 20.6 19.41 8.744 -57.6% -1.7% 3.636 2.614 1.8 -50.5% -1.4%
Samoa 71.15 74.76 84.86 19.3% 0.4% 25.61 18.58 4.985 -80.5% -3.2% 3.844 2.376 1.8 -53.2% -1.5%
Oceania 75.96 78.75 81.55 7.4% 0.1% 17.61 15.48 12.38 -29.7% -0.7% 2.269 2.065 1.838 -19.0% -0.4%
VOL2_15 Forecast Tables rev.indd 237 21/08/2009 09:09

Patterns of Potential Hum
an Progress Volume 2: Enhancing Global Education
238
Patterns of Potential Human Progress Multination Regional Analysis Measures of Poverty, Health, Education, Infrastructure, and Governance
Base Case: Countries in Year 2060
Descending Population Sequence
HealthLife Expectancy at Birth Infant Mortality Total Fertility Rate
Years Per Thousand Births Births per Woman
2010 2035 2060 % Chg % An Chg 2010 2035 2060 % Chg % An Chg 2010 2035 2060 % Chg % An Chg
EUROPERussian Federation 68.59 79.33 82.76 20.7% 0.4% 15.18 8.009 5.718 -62.3% -1.9% 1.321 1.448 1.576 19.3% 0.4%
Ukraine 69.49 78.98 87.61 26.1% 0.5% 12.01 6.138 2.902 -75.8% -2.8% 1.236 1.386 1.536 24.3% 0.4%
Poland 76.24 84.03 87.1 14.2% 0.3% 6.616 3.78 3.133 -52.6% -1.5% 1.274 1.414 1.554 22.0% 0.4%
Romania 73.12 79.56 85.66 17.1% 0.3% 15.32 8.961 3.598 -76.5% -2.9% 1.349 1.469 1.589 17.8% 0.3%
Czech Republic 77.09 82.31 85.3 10.6% 0.2% 3.843 3.564 3.314 -13.8% -0.3% 1.313 1.442 1.572 19.7% 0.4%
Belarus 70.94 79.81 85.76 20.9% 0.4% 8.819 5.47 3.385 -61.6% -1.9% 1.245 1.393 1.54 23.7% 0.4%
Hungary 74.01 80.57 84.14 13.7% 0.3% 6.805 4.866 3.804 -44.1% -1.2% 1.349 1.469 1.589 17.8% 0.3%
Bulgaria 73.5 80.24 87.42 18.9% 0.3% 11.52 6.693 3.123 -72.9% -2.6% 1.339 1.462 1.584 18.3% 0.3%
Slovakia 75.33 80.41 85.35 13.3% 0.3% 6.936 5.177 3.587 -48.3% -1.3% 1.283 1.421 1.558 21.4% 0.4%
Moldova, Rep. of 68.47 71.62 81 18.3% 0.3% 16.5 14.7 7.129 -56.8% -1.7% 1.254 1.399 1.544 23.1% 0.4%
Europe-East 70.87 80.04 84.61 19.4% 0.4% 12.46 6.891 4.505 -63.8% -2.0% 1.3 1.434 1.567 20.5% 0.4%
United Kingdom 80.02 82.6 84.77 5.9% 0.1% 4.973 4.218 3.655 -26.5% -0.6% 1.8 1.8 1.8 0.0% 0.0%
Sweden 81.44 83.71 85.71 5.2% 0.1% 3.359 3.274 3.266 -2.8% -0.1% 1.772 1.779 1.787 0.8% 0.0%
Denmark 78.39 81.63 84.15 7.3% 0.1% 4.532 3.933 3.519 -22.4% -0.5% 1.8 1.8 1.8 0.0% 0.0%
Ireland 79.85 82.09 84.2 5.4% 0.1% 5.243 4.547 3.91 -25.4% -0.6% 1.8 1.8 1.8 0.0% 0.0%
Norway 80.76 83.12 85.26 5.6% 0.1% 3.72 3.476 3.28 -11.8% -0.3% 1.8 1.8 1.8 0.0% 0.0%
Finland 80.22 82.76 84.77 5.7% 0.1% 3.839 3.552 3.378 -12.0% -0.3% 1.8 1.8 1.8 0.0% 0.0%
Lithuania 73.32 80.52 84.78 15.6% 0.3% 8.754 5.672 3.9 -55.4% -1.6% 1.302 1.434 1.567 20.4% 0.4%
Latvia 73.65 82.3 85.22 15.7% 0.3% 10.47 5.419 3.903 -62.7% -2.0% 1.339 1.462 1.584 18.3% 0.3%
Estonia 75.06 82.19 84.56 12.7% 0.2% 6.687 4.489 3.731 -44.2% -1.2% 1.518 1.593 1.668 9.9% 0.2%
Iceland 81.48 83.8 85.84 5.4% 0.1% 3.133 3.163 3.22 2.8% 0.1% 1.8 1.8 1.8 0.0% 0.0%
Europe-North 79.66 82.59 84.82 6.5% 0.1% 4.961 4.127 3.603 -27.4% -0.6% 1.766 1.778 1.788 1.2% 0.0%
Italy 80.87 84.29 86.23 6.6% 0.1% 5.047 3.92 3.362 -33.4% -0.8% 1.349 1.469 1.589 17.8% 0.3%
Spain 81.35 84.72 86.53 6.4% 0.1% 4.31 3.658 3.358 -22.1% -0.5% 1.358 1.476 1.593 17.3% 0.3%
Greece 80 83.06 85.25 6.6% 0.1% 7.071 5.161 3.908 -44.7% -1.2% 1.311 1.441 1.571 19.8% 0.4%
Portugal 78.63 83.27 87.14 10.8% 0.2% 5.382 4.026 3.189 -40.7% -1.0% 1.424 1.524 1.624 14.0% 0.3%
Serbia 73.5 79.13 87.09 18.5% 0.3% 11.97 7.69 3.172 -73.5% -2.6% 1.471 1.559 1.646 11.9% 0.2%
Croatia 76.05 81.76 87.15 14.6% 0.3% 6.555 4.6 3.201 -51.2% -1.4% 1.443 1.538 1.633 13.2% 0.2%
Bosnia and Herzegovina 74.47 76.33 81.94 10.0% 0.2% 13.37 12.48 6.72 -49.7% -1.4% 1.236 1.386 1.536 24.3% 0.4%
Albania 76.09 80 86.92 14.2% 0.3% 21.5 14.94 3.368 -84.3% -3.6% 1.781 1.786 1.791 0.6% 0.0%
Macedonia, TFYR 73.99 75.26 81.1 9.6% 0.2% 16.43 14.71 7.96 -51.6% -1.4% 1.499 1.579 1.659 10.7% 0.2%
Slovenia 78.91 83.91 86.08 9.1% 0.2% 5.029 3.815 3.334 -33.7% -0.8% 1.264 1.407 1.549 22.5% 0.4%
Montenegro 74.83 79.56 87.72 17.2% 0.3% 23.34 14.02 3.545 -84.8% -3.7% 1.612 1.662 1.712 6.2% 0.1%
Malta 80.35 85.9 87.27 8.6% 0.2% 6.453 3.499 3.301 -48.8% -1.3% 1.396 1.503 1.611 15.4% 0.3%
Europe-South 79.85 83.46 86.23 8.0% 0.2% 6.209 4.836 3.533 -43.1% -1.1% 1.371 1.486 1.601 16.8% 0.3%
Germany 79.63 82.71 84.59 6.2% 0.1% 4.373 3.847 3.57 -18.4% -0.4% 1.386 1.496 1.606 15.9% 0.3%
France 81 83.74 85.71 5.8% 0.1% 4.303 3.724 3.399 -21.0% -0.5% 1.8 1.8 1.8 0.0% 0.0%
Netherlands 79.8 82.22 84.41 5.8% 0.1% 4.92 4.262 3.736 -24.1% -0.5% 1.734 1.752 1.769 2.0% 0.0%
Belgium 80.25 82.85 84.86 5.7% 0.1% 4.275 3.81 3.504 -18.0% -0.4% 1.725 1.745 1.765 2.3% 0.0%
Austria 79.86 82.49 84.51 5.8% 0.1% 4.527 3.967 3.579 -20.9% -0.5% 1.433 1.531 1.628 13.6% 0.3%
Switzerland 81.7 83.87 85.9 5.1% 0.1% 4.294 3.761 3.376 -21.4% -0.5% 1.443 1.538 1.633 13.2% 0.2%
Luxembourg 79.59 81.8 83.93 5.5% 0.1% 4.627 4.214 3.788 -18.1% -0.4% 1.706 1.731 1.756 2.9% 0.1%
Europe-West 80.23 83.06 85.03 6.0% 0.1% 4.397 3.845 3.515 -20.1% -0.4% 1.578 1.643 1.704 8.0% 0.2%
VOL2_15 Forecast Tables rev.indd 238 21/08/2009 09:10

239Forecast Tables
Patterns of Potential Human Progress Multination Regional Analysis Measures of Poverty, Health, Education, Infrastructure, and Governance
Base Case
Source: International Futures Version 6.12, March 2009
HealthCalories per Capita Malnourished Children AIDS Death Rate
Per Person Daily Percent Percent
2010 2035 2060 % Chg % An Chg 2010 2035 2060 % Chg % An Chg 2010 2035 2060
World 2853 3064 3185 11.6% 0.2% 14.57 7.143 4.185 -71.3% -2.5% 0.026 0.011 0.001
Africa 2443 2574 2762 13.1% 0.2% 22.59 16.97 11.97 -47.0% -1.3% 0.136 0.04 0.002Americas 3228 3359 3416 5.8% 0.1% 3.29 1.581 0.45 -86.3% -3.9% 0.009 0.005 0Asia with Oceania 2775 3102 3285 18.4% 0.3% 17.7 6.061 2.054 -88.4% -4.2% 0.006 0.003 0Europe 3380 3505 3481 3.0% 0.1% 0.295 0.065 0.021 -92.9% -5.1% 0.007 0.003 0World 2853 3064 3185 11.6% 0.2% 14.57 7.143 4.185 -71.3% -2.5% 0.026 0.011 0.001
Africa-Eastern 2046 2317 2738 33.8% 0.6% 26.69 20.81 10.52 -60.6% -1.8% 0.199 0.046 0.002Africa-Middle 1930 2164 2430 25.9% 0.5% 27.37 22.77 17.19 -37.2% -0.9% 0.125 0.072 0.005Africa-Northern 3046 3151 3224 5.8% 0.1% 12.38 5.53 2.901 -76.6% -2.9% 0.011 0.005 0Africa-Southern 2926 3171 3440 17.6% 0.3% 10.83 1.039 0 -100.0% 0.52 0.177 0.009Africa-Western 2580 2668 2714 5.2% 0.1% 25.43 18.14 15.59 -38.7% -1.0% 0.085 0.021 0.001Africa 2443 2574 2762 13.1% 0.2% 22.59 16.97 11.97 -47.0% -1.3% 0.136 0.04 0.002
America-Caribbean 2713 2902 3118 14.9% 0.3% 10.45 8.278 4.697 -55.1% -1.6% 0.063 0.04 0.003America-Central 2461 2761 3095 25.8% 0.5% 12.16 7.783 2.203 -81.9% -3.4% 0.027 0.016 0.001America-North 3635 3673 3556 -2.2% 0.0% 1.626 0.554 0 -100.0% 0.005 0.003 0America-South 2901 3137 3340 15.1% 0.3% 3.497 1.251 0.274 -92.2% -5.0% 0.007 0.003 0Americas 3228 3359 3416 5.8% 0.1% 3.29 1.581 0.45 -86.3% -3.9% 0.009 0.005 0
Asia-East 3028 3453 3613 19.3% 0.4% 2.448 0.221 0.139 -94.3% -5.6% 0.004 0.003 0Asia-South Central 2521 2858 3105 23.2% 0.4% 32.39 11.07 3.705 -88.6% -4.2% 0.001 0.001 0Asia-South East 2762 2998 3164 14.6% 0.3% 19.33 5.158 0.899 -95.3% -6.0% 0.025 0.013 0.001Asia-West 2945 3114 3245 10.2% 0.2% 10.95 5.297 1.928 -82.4% -3.4% 0.001 0 0Oceania 2936 3155 3244 10.5% 0.2% 5.813 3.92 2.999 -48.4% -1.3% 0.006 0.003 0Asia with Oceania 2775 3102 3285 18.4% 0.3% 17.7 6.061 2.054 -88.4% -4.2% 0.006 0.003 0
Europe-East 3204 3422 3402 6.2% 0.1% 0.423 0.035 0 -100.0% 0.016 0.007 0Europe-North 3412 3556 3527 3.4% 0.1% 0.071 0 0 -100.0% 0.002 0.001 0Europe-South 3457 3471 3479 0.6% 0.0% 0.541 0.16 0.023 -95.7% -6.1% 0.002 0.001 0Europe-West 3561 3602 3552 -0.3% 0.0% 0 0 0 0.001 0.001 0Europe 3380 3505 3481 3.0% 0.1% 0.295 0.065 0.021 -92.9% -5.1% 0.007 0.003 0
VOL2_15 Forecast Tables rev.indd 239 21/08/2009 09:10

Patterns of Potential Hum
an Progress Volume 2: Enhancing Global Education
240
Patterns of Potential Human Progress Multination Regional Analysis Measures of Poverty, Health, Education, Infrastructure, and Governance
Base Case: Countries in Year 2060
Descending Population Sequence
HealthCalories per Capita Malnourished Children AIDS Death Rate
Per Person Daily Percent Percent
2010 2035 2060 % Chg % An Chg 2010 2035 2060 % Chg % An Chg 2010 2035 2060
AFRICAEthiopia 1917 2056 2504 30.6% 0.5% 35.56 31.18 16.83 -52.7% -1.5% 0.081 0.016 0Uganda 2431 2732 3139 29.1% 0.5% 22.31 11.54 0 -100.0% 0.203 0.014 0Tanzania, United Rep. of 2030 2435 3050 50.2% 0.8% 19.3 13.43 1.466 -92.4% -5.0% 0.229 0.054 0.002Kenya 2142 2451 2903 35.5% 0.6% 19.22 14.18 4.799 -75.0% -2.7% 0.299 0.105 0.005Madagascar 2040 2225 2553 25.1% 0.4% 35.67 28.01 16.39 -54.1% -1.5% 0.004 0.002 0Mozambique 2164 2676 3259 50.6% 0.8% 21.53 9.886 0 -100.0% 0.299 0.105 0.005Malawi 2176 2255 2571 18.2% 0.3% 19.84 19.97 13.19 -33.5% -0.8% 0.403 0.094 0.003Zambia 1990 2314 2761 38.7% 0.7% 24.26 18.15 8.282 -65.9% -2.1% 0.484 0.156 0.007Burundi 1698 1963 2518 48.3% 0.8% 45.97 35.51 16.67 -63.7% -2.0% 0.109 0.005 0Rwanda 2121 2356 2675 26.1% 0.5% 18.79 15.98 10.03 -46.6% -1.2% 0.099 0.005 0Somalia 1500 1727 1714 14.3% 0.3% 41.85 37.31 41.35 -1.2% 0.0% 0.013 0.006 0Zimbabwe 1997 2402 2782 39.3% 0.7% 15.14 12.05 6.69 -55.8% -1.6% 0.449 0.014 0Eritrea 1500 1500 1500 0.0% 0.0% 40.77 45.41 50.04 22.7% 0.4% 0.145 0.086 0.005Mauritius 3000 3241 3402 13.4% 0.3% 10.33 0 0 -100.0% 0.022 0.011 0.001Comoros 1813 2115 2600 43.4% 0.7% 30.04 24.02 12.45 -58.6% -1.7% 0.001 0 0Djibouti 2272 2481 2748 21.0% 0.4% 23.3 17.2 9.765 -58.1% -1.7% 0.096 0.034 0.002
Africa-Eastern 2046 2317 2738 33.8% 0.6% 26.69 20.81 10.52 -60.6% -1.8% 0.199 0.046 0.002
Congo; Dem. Rep. of 1662 1928 2321 39.7% 0.7% 28.45 26.15 18.77 -34.0% -0.8% 0.119 0.102 0.008Angola 2193 2510 2624 19.7% 0.4% 34.59 20.28 15.3 -55.8% -1.6% 0.086 0.034 0.002Cameroon 2320 2511 2732 17.8% 0.3% 19.29 14.99 9.685 -49.8% -1.4% 0.187 0.032 0.001Chad 2142 2377 2414 12.7% 0.2% 32.84 23.19 21.37 -34.9% -0.9% 0.09 0.022 0.001Central African Republic 2022 2250 2533 25.3% 0.5% 24.86 20.67 14.42 -42.0% -1.1% 0.221 0.064 0.003Congo, Rep. of 2224 2521 2638 18.6% 0.3% 10.8 9.502 9.618 -10.9% -0.2% 0.126 0.016 0Gabon 2679 2879 2979 11.2% 0.2% 10.85 5.921 3.532 -67.4% -2.2% 0.103 0.01 0Equatorial Guinea 3398 3377 3136 -7.7% -0.2% 17.08 10.9 7.97 -53.3% -1.5% 0.154 0.083 0.005São Tomé and Príncipe 2468 2468 2632 6.6% 0.1% 11.86 13.66 11.22 -5.4% -0.1% 0.001 0 0
Africa-Middle 1930 2164 2430 25.9% 0.5% 27.37 22.77 17.19 -37.2% -0.9% 0.125 0.072 0.005
Egypt 3351 3415 3508 4.7% 0.1% 6.038 2.463 0 -100.0% 0.001 0 0Sudan 2317 2656 2848 22.9% 0.4% 39.28 19.03 9.507 -75.8% -2.8% 0.05 0.018 0.001Algeria 3032 3108 3075 1.4% 0.0% 7.679 0.891 2.482 -67.7% -2.2% 0.002 0.001 0Morocco 3073 3134 3201 4.2% 0.1% 6.098 0 0 -100.0% 0.003 0.001 0Tunisia 3274 3431 3538 8.1% 0.2% 0.778 0 0 -100.0% 0.002 0.001 0Libyan Arab Jamahiriya 3352 3458 3294 -1.7% 0.0% 0 0 0 0.001 0 0
Africa-Northern 3046 3151 3224 5.8% 0.1% 12.38 5.53 2.901 -76.6% -2.9% 0.011 0.005 0
VOL2_15 Forecast Tables rev.indd 240 21/08/2009 09:10

241Forecast Tables
Patterns of Potential Human Progress Multination Regional Analysis Measures of Poverty, Health, Education, Infrastructure, and Governance
Base Case: Countries in Year 2060
Descending Population Sequence
HealthCalories per Capita Malnourished Children AIDS Death Rate
Per Person Daily Percent Percent
2010 2035 2060 % Chg % An Chg 2010 2035 2060 % Chg % An Chg 2010 2035 2060
AFRICA continuedSouth Africa 3001 3234 3479 15.9% 0.3% 10.35 0 0 -100.0% 0.535 0.187 0.009Namibia 2356 2768 3309 40.4% 0.7% 20.31 8.901 0 -100.0% 0.341 0.11 0.005Lesotho 2673 2856 3144 17.6% 0.3% 15.52 8.408 0 -100.0% 0.41 0.122 0.005Botswana 2261 2839 3271 44.7% 0.7% 6.935 3.498 0 -100.0% 0.441 0.089 0.002Swaziland 2376 2736 3136 32.0% 0.6% 11.62 6.897 0 -100.0% 0.537 0.163 0.007
Africa-Southern 2926 3171 3440 17.6% 0.3% 10.83 1.039 0 -100.0% 0.52 0.177 0.009
Nigeria 2739 2859 2704 -1.3% 0.0% 25.55 14.46 19.2 -24.9% -0.6% 0.1 0.024 0.001Niger 2146 2276 2593 20.8% 0.4% 39.49 31.13 16.99 -57.0% -1.7% 0.019 0.008 0.001Côte d’Ivoire 2641 2750 2806 6.2% 0.1% 20.24 13.92 10.53 -48.0% -1.3% 0.167 0.007 0Ghana 2686 2637 2669 -0.6% 0.0% 20.58 20.53 16.66 -19.0% -0.4% 0.071 0.014 0Burkina Faso 2485 2659 2949 18.7% 0.3% 35.51 21.73 6.532 -81.6% -3.3% 0.052 0.009 0Mali 2205 2406 2735 24.0% 0.4% 30.03 21.99 10.91 -63.7% -2.0% 0.031 0.011 0.001Senegal 2314 2499 2755 19.1% 0.3% 17.42 14.21 8.671 -50.2% -1.4% 0.013 0.006 0Guinea 2431 2638 2852 17.3% 0.3% 24 15.41 7.864 -67.2% -2.2% 0.033 0.012 0.001Benin 2567 2616 2796 8.9% 0.2% 19.37 16.57 9.757 -49.6% -1.4% 0.03 0.004 0Togo 2357 1701 2357 0.0% 0.0% 20.83 45.85 21.6 3.7% 0.1% 0.103 0.025 0.001Sierra Leone 1998 2374 2767 38.5% 0.7% 25.92 17.44 8.371 -67.7% -2.2% 0.242 0.188 0.011Liberia 1933 1585 2357 21.9% 0.4% 28.75 44.16 19.76 -31.3% -0.7% 0.088 0.035 0.002Mauritania 2778 2742 2793 0.5% 0.0% 21.41 20.2 14.25 -33.4% -0.8% 0.025 0.011 0.001Guinea-Bissau 2054 2127 2329 13.4% 0.3% 27.3 26.45 21.31 -21.9% -0.5% 0.053 0.018 0.001Gambia 2298 2418 2631 14.5% 0.3% 6.855 9.59 9.001 31.3% 0.5% 0.025 0.009 0Cape Verde 3265 3447 3653 11.9% 0.2% 12.48 6.87 0 -100.0% 0.001 0 0
Africa-Western 2580 2668 2714 5.2% 0.1% 25.43 18.14 15.59 -38.7% -1.0% 0.085 0.021 0.001
VOL2_15 Forecast Tables rev.indd 241 21/08/2009 09:10

Patterns of Potential Hum
an Progress Volume 2: Enhancing Global Education
242
Patterns of Potential Human Progress Multination Regional Analysis Measures of Poverty, Health, Education, Infrastructure, and Governance
Base Case: Countries in Year 2060
Descending Population Sequence
HealthCalories per Capita Malnourished Children AIDS Death Rate
Per Person Daily Percent Percent
2010 2035 2060 % Chg % An Chg 2010 2035 2060 % Chg % An Chg 2010 2035 2060
AMERICASHaiti 2132 2322 2568 20.5% 0.4% 17.85 16.42 12.52 -29.9% -0.7% 0.066 0.023 0.001Dominican Republic 2447 2904 3288 34.4% 0.6% 3.289 2.241 0 -100.0% 0.143 0.107 0.007Cuba 3168 3297 3564 12.5% 0.2% 17.01 11.19 2.097 -87.7% -4.1% 0.001 0 0Puerto Rico 3296 3522 3567 8.2% 0.2% 0 0 0 0.001 0 0Jamaica 2720 2875 3080 13.2% 0.2% 3.655 3.335 0.733 -79.9% -3.2% 0.079 0.039 0.002Trinidad and Tobago 2834 3190 3335 17.7% 0.3% 4.268 0 0 -100.0% 0.174 0.119 0.008Bahamas 2818 3076 3363 19.3% 0.4% 8.119 1.164 0 -100.0% 0.047 0.016 0.001Barbados 3133 3317 3579 14.2% 0.3% 0 0 0 0.028 0.012 0.001St. Vincent & the Grenadines 2654 2906 3239 22.0% 0.4% 12.22 5.467 0 -100.0% 0.001 0 0Grenada 2966 3095 3370 13.6% 0.3% 4.052 0.668 0 -100.0% 0.001 0 0St. Lucia 3029 3193 3417 12.8% 0.2% 2.373 0 0 -100.0% 0.001 0 0
America-Caribbean 2713 2902 3118 14.9% 0.3% 10.45 8.278 4.697 -55.1% -1.6% 0.063 0.04 0.003
Guatemala 2289 2613 2994 30.8% 0.5% 18.67 11.61 2.921 -84.4% -3.6% 0.025 0.011 0.001Honduras 2412 2679 2993 24.1% 0.4% 12.36 8.61 2.72 -78.0% -3.0% 0.063 0.05 0.003El Salvador 2643 2936 3267 23.6% 0.4% 8.613 3.611 0 -100.0% 0.019 0.008 0.001Nicaragua 2353 2604 2894 23.0% 0.4% 9.954 8.507 4.445 -55.3% -1.6% 0.007 0.003 0Costa Rica 2949 3325 3583 21.5% 0.4% 3.595 0 0 -100.0% 0.006 0.003 0Panama 2377 2885 3341 40.6% 0.7% 7.832 3.32 0 -100.0% 0.024 0.01 0.001Belize 2921 3219 3417 17.0% 0.3% 8.954 0 0 -100.0% 0.052 0.018 0.001
America-Central 2461 2761 3095 25.8% 0.5% 12.16 7.783 2.203 -81.9% -3.4% 0.027 0.016 0.001
United States of America 3796 3800 3605 -5.0% -0.1% 0.642 0 0 -100.0% 0.005 0.003 0Mexico 3182 3304 3402 6.9% 0.1% 4.939 2.295 0 -100.0% 0.008 0.004 0Canada 3611 3697 3581 -0.8% 0.0% 0 0 0 0.001 0 0
America-North 3635 3673 3556 -2.2% 0.0% 1.626 0.554 0 -100.0% 0.005 0.003 0
Brazil 3084 3269 3427 11.1% 0.2% 2.83 0 0 -100.0% 0.004 0.001 0Colombia 2649 2927 3295 24.4% 0.4% 4.859 2.757 0 -100.0% 0.016 0.007 0Argentina 3061 3337 3523 15.1% 0.3% 1.259 0 0 -100.0% 0.01 0.004 0Venezuela, RB 2425 2818 3092 27.5% 0.5% 4.632 3.539 0.479 -89.7% -4.4% 0.001 0 0Peru 2646 2957 3184 20.3% 0.4% 4.38 2.198 0 -100.0% 0.008 0.004 0Chile 2938 3292 3476 18.3% 0.3% 0.507 0 0 -100.0% 0.006 0.002 0Ecuador 2789 2918 2967 6.4% 0.1% 9.926 5.775 4.239 -57.3% -1.7% 0.008 0.003 0Bolivia 2317 2736 3082 33.0% 0.6% 7.297 5.144 0.683 -90.6% -4.6% 0.004 0.002 0Paraguay 2605 2754 2962 13.7% 0.3% 5.446 5.404 2.955 -45.7% -1.2% 0.024 0.012 0.001Uruguay 2897 3193 3429 18.4% 0.3% 3.558 0 0 -100.0% 0.011 0.005 0Guyana 2736 2980 3257 19.0% 0.3% 7.765 2.982 0 -100.0% 0.101 0.035 0.002Suriname 2721 2985 3196 17.5% 0.3% 9.455 3.197 0 -100.0% 0.062 0.031 0.002
America-South 2901 3137 3340 15.1% 0.3% 3.497 1.251 0.274 -92.2% -5.0% 0.007 0.003 0
VOL2_15 Forecast Tables rev.indd 242 21/08/2009 09:11

243Forecast Tables
Patterns of Potential Human Progress Multination Regional Analysis Measures of Poverty, Health, Education, Infrastructure, and Governance
Base Case: Countries in Year 2060
Descending Population Sequence
HealthCalories per Capita Malnourished Children AIDS Death Rate
Per Person Daily Percent Percent
2010 2035 2060 % Chg % An Chg 2010 2035 2060 % Chg % An Chg 2010 2035 2060
ASIA WITH OCEANIAChina 3052 3495 3651 19.6% 0.4% 1.783 0 0 -100.0% 0.005 0.003 0Japan 2832 3145 3343 18.0% 0.3% 7.733 0 0 -100.0% 0.001 0 0Korea, Rep. of 3137 3435 3457 10.2% 0.2% 0 0 0 0.001 0 0Taiwan 3239 3473 3554 9.7% 0.2% 0 0 0 0.001 0 0Korea, Dem. Rep. of 2221 2471 2689 21.1% 0.4% 19.26 14.64 10.26 -46.7% -1.3% 0.001 0 0Hong Kong 3274 3432 3426 4.6% 0.1% 0 0 0 0.001 0 0Mongolia 2322 2642 3040 30.9% 0.5% 12.3 8.62 1.634 -86.7% -4.0% 0.001 0 0
Asia-East 3028 3453 3613 19.3% 0.4% 2.448 0.221 0.139 -94.3% -5.6% 0.004 0.003 0
India 2548 2961 3277 28.6% 0.5% 34.93 7.781 0 -100.0% 0.001 0 0Pakistan 2476 2662 2865 15.7% 0.3% 29.27 18.1 8.672 -70.4% -2.4% 0.002 0.001 0Bangladesh 2278 2637 2890 26.9% 0.5% 39.98 19.28 7.811 -80.5% -3.2% 0.001 0 0Afghanistan 1788 1823 2214 23.8% 0.4% 36.17 37 24.94 -31.0% -0.7% 0.001 0 0Iran, Islamic Rep. of 3122 3341 3272 4.8% 0.1% 0 0 0 0.003 0.001 0Nepal 2480 2623 2779 12.1% 0.2% 38.38 25 13.97 -63.6% -2.0% 0.013 0.006 0Uzbekistan 2317 2586 2781 20.0% 0.4% 3.492 5.596 5.514 57.9% 0.9% 0.001 0 0Sri Lanka 2464 2832 3183 29.2% 0.5% 24.09 9.318 0 -100.0% 0.001 0 0Kazakhstan 2800 3227 3231 15.4% 0.3% 10.27 0 0 -100.0% 0.001 0 0Tajikistan 1919 2259 2677 39.5% 0.7% 38.64 25.68 12.19 -68.5% -2.3% 0.002 0.001 0Turkmenistan 2778 3246 3011 8.4% 0.2% 8.572 0 2.755 -67.9% -2.2% 0.001 0 0Kyrgyzstan 2997 2955 2887 -3.7% -0.1% 5.796 6.898 8.537 47.3% 0.8% 0.001 0.001 0Bhutan 2693 3021 3344 24.2% 0.4% 7.13 1.847 0 -100.0% 0.001 0 0Maldives 2636 3124 3556 34.9% 0.6% 23.74 0 0 -100.0% 0.001 0 0
Asia-South Central 2521 2858 3105 23.2% 0.4% 32.39 11.07 3.705 -88.6% -4.2% 0.001 0.001 0
Indonesia 2942 3078 3156 7.3% 0.1% 18.43 3.48 0 -100.0% 0.002 0.001 0Philippines 2443 2763 3064 25.4% 0.5% 24.95 11.7 1.676 -93.3% -5.3% 0.001 0 0Vietnam 2651 3030 3244 22.4% 0.4% 23.39 3.735 0 -100.0% 0.016 0.007 0Thailand 2544 2901 3208 26.1% 0.5% 15.36 5.571 0 -100.0% 0.048 0.007 0Myanmar 3036 3134 3050 0.5% 0.0% 14.77 0 6.821 -53.8% -1.5% 0.159 0.133 0.009Malaysia 2951 3260 3420 15.9% 0.3% 6.235 0 0 -100.0% 0.014 0.007 0Cambodia 2143 2649 3014 40.6% 0.7% 28.38 12.55 2.723 -90.4% -4.6% 0.044 0.001 0Lao PDR 2380 2865 3294 38.4% 0.7% 34.02 9.703 0 -100.0% 0.001 0.001 0Singapore 3555 3609 3513 -1.2% 0.0% 2.575 0 0 -100.0% 0.006 0.003 0Timor-Leste 2741 2891 3136 14.4% 0.3% 60.47 27.79 0 -100.0% 0.001 0 0Brunei Darussalam 2919 3182 3336 14.3% 0.3% 5.311 0 0 -100.0% 0.001 0 0
Asia-South East 2762 2998 3164 14.6% 0.3% 19.33 5.158 0.899 -95.3% -6.0% 0.025 0.013 0.001
VOL2_15 Forecast Tables rev.indd 243 21/08/2009 09:11

Patterns of Potential Hum
an Progress Volume 2: Enhancing Global Education
244
Patterns of Potential Human Progress Multination Regional Analysis Measures of Poverty, Health, Education, Infrastructure, and Governance
Base Case: Countries in Year 2060
Descending Population Sequence
HealthCalories per Capita Malnourished Children AIDS Death Rate
Per Person Daily Percent Percent
2010 2035 2060 % Chg % An Chg 2010 2035 2060 % Chg % An Chg 2010 2035 2060
ASIA WITH OCEANIA continuedTurkey 3384 3530 3601 6.4% 0.1% 2.375 0 0 -100.0% 0.001 0 0Yemen 2088 2474 2801 34.1% 0.6% 46.4 24.59 10.42 -77.5% -2.9% 0.001 0 0Iraq 2483 2834 3110 25.3% 0.5% 20.24 8.294 0.293 -98.6% -8.1% 0.001 0 0Saudi Arabia 2889 3108 3231 11.8% 0.2% 11.56 0.547 0 -100.0% 0.001 0 0Syria 3046 3102 3220 5.7% 0.1% 2.779 0.651 0 -100.0% 0.001 0 0Israel 3679 3800 3611 -1.8% 0.0% 0 0 0 0.001 0 0Azerbaijan 2698 2997 3070 13.8% 0.3% 8.724 2.637 1.164 -86.7% -3.9% 0.002 0.001 0Jordan 2732 3082 3461 26.7% 0.5% 3.832 0.539 0 -100.0% 0.001 0 0Palestine 2236 2598 3028 35.4% 0.6% 5.959 6.287 1.544 -74.1% -2.7% 0.001 0 0United Arab Emirates 3254 3371 3387 4.1% 0.1% 0 0 0 0.001 0 0Oman 3265 3352 3348 2.5% 0.1% 11.61 6.93 2.42 -79.2% -3.1% 0.001 0 0Kuwait 3063 3326 3292 7.5% 0.1% 0.09 0 0 -100.0% 0.001 0 0Lebanon 3207 3338 3392 5.8% 0.1% 3.643 1.115 0 -100.0% 0.004 0.002 0Georgia 2448 2727 2950 20.5% 0.4% 9.385 6.69 3.405 -63.7% -2.0% 0.001 0 0Armenia 2376 2893 3177 33.7% 0.6% 4.412 2.51 0 -100.0% 0.005 0.002 0Bahrain 3456 3486 3505 1.4% 0.0% 7.692 3.282 0 -100.0% 0.001 0 0Qatar 3746 3681 3522 -6.0% -0.1% 4.301 0 0 -100.0% 0.001 0 0Cyprus 3291 3417 3455 5.0% 0.1% 0 0 0 0.001 0 0
Asia-West 2945 3114 3245 10.2% 0.2% 10.95 5.297 1.928 -82.4% -3.4% 0.001 0 0
Australia 3111 3364 3450 10.9% 0.2% 0.259 0 0 -100.0% 0.001 0.001 0Papua New Guniea 2222 2587 2746 23.6% 0.4% 26.98 14.9 10.17 -62.3% -1.9% 0.024 0.012 0.001New Zealand 3257 3424 3547 8.9% 0.2% 0 0 0 0.002 0.001 0Solomon Islands 2313 2487 2662 15.1% 0.3% 19.95 15.9 11.68 -41.5% -1.1% 0.001 0 0Fiji 2917 3044 3283 12.5% 0.2% 1.121 0.833 0 -100.0% 0.001 0 0Vanuatu 2627 2796 3052 16.2% 0.3% 9.711 6.872 1.536 -84.2% -3.6% 0.001 0 0Micronesia 2794 2922 3188 14.1% 0.3% 8.787 5.249 0 -100.0% 0.001 0 0Tonga 2763 2875 3120 12.9% 0.2% 9.69 6.542 0.039 -99.6% -10.4% 0.001 0 0Samoa 2972 3116 3379 13.7% 0.3% 8.609 0.249 0 -100.0% 0.001 0 0
Oceania 2936 3155 3244 10.5% 0.2% 5.813 3.92 2.999 -48.4% -1.3% 0.006 0.003 0
VOL2_15 Forecast Tables rev.indd 244 21/08/2009 09:11
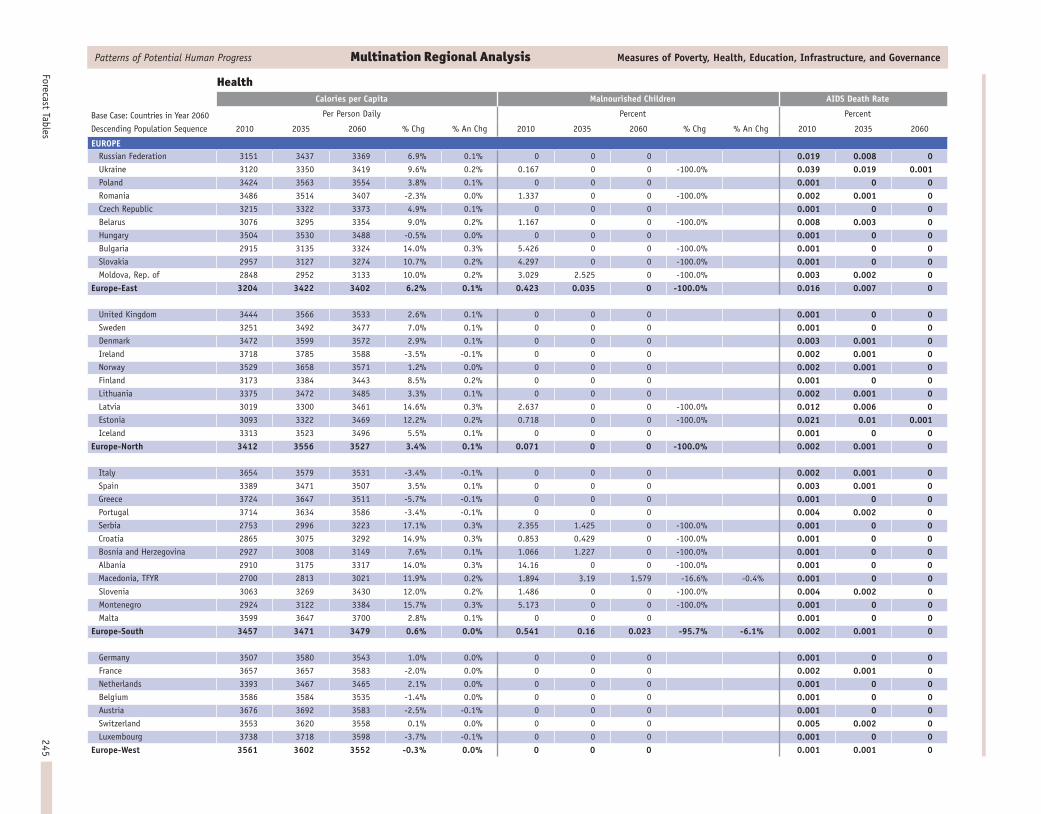
245Forecast Tables
Patterns of Potential Human Progress Multination Regional Analysis Measures of Poverty, Health, Education, Infrastructure, and Governance
Base Case: Countries in Year 2060
Descending Population Sequence
HealthCalories per Capita Malnourished Children AIDS Death Rate
Per Person Daily Percent Percent
2010 2035 2060 % Chg % An Chg 2010 2035 2060 % Chg % An Chg 2010 2035 2060
EUROPERussian Federation 3151 3437 3369 6.9% 0.1% 0 0 0 0.019 0.008 0Ukraine 3120 3350 3419 9.6% 0.2% 0.167 0 0 -100.0% 0.039 0.019 0.001Poland 3424 3563 3554 3.8% 0.1% 0 0 0 0.001 0 0Romania 3486 3514 3407 -2.3% 0.0% 1.337 0 0 -100.0% 0.002 0.001 0Czech Republic 3215 3322 3373 4.9% 0.1% 0 0 0 0.001 0 0Belarus 3076 3295 3354 9.0% 0.2% 1.167 0 0 -100.0% 0.008 0.003 0Hungary 3504 3530 3488 -0.5% 0.0% 0 0 0 0.001 0 0Bulgaria 2915 3135 3324 14.0% 0.3% 5.426 0 0 -100.0% 0.001 0 0Slovakia 2957 3127 3274 10.7% 0.2% 4.297 0 0 -100.0% 0.001 0 0Moldova, Rep. of 2848 2952 3133 10.0% 0.2% 3.029 2.525 0 -100.0% 0.003 0.002 0
Europe-East 3204 3422 3402 6.2% 0.1% 0.423 0.035 0 -100.0% 0.016 0.007 0
United Kingdom 3444 3566 3533 2.6% 0.1% 0 0 0 0.001 0 0Sweden 3251 3492 3477 7.0% 0.1% 0 0 0 0.001 0 0Denmark 3472 3599 3572 2.9% 0.1% 0 0 0 0.003 0.001 0Ireland 3718 3785 3588 -3.5% -0.1% 0 0 0 0.002 0.001 0Norway 3529 3658 3571 1.2% 0.0% 0 0 0 0.002 0.001 0Finland 3173 3384 3443 8.5% 0.2% 0 0 0 0.001 0 0Lithuania 3375 3472 3485 3.3% 0.1% 0 0 0 0.002 0.001 0Latvia 3019 3300 3461 14.6% 0.3% 2.637 0 0 -100.0% 0.012 0.006 0Estonia 3093 3322 3469 12.2% 0.2% 0.718 0 0 -100.0% 0.021 0.01 0.001Iceland 3313 3523 3496 5.5% 0.1% 0 0 0 0.001 0 0
Europe-North 3412 3556 3527 3.4% 0.1% 0.071 0 0 -100.0% 0.002 0.001 0
Italy 3654 3579 3531 -3.4% -0.1% 0 0 0 0.002 0.001 0Spain 3389 3471 3507 3.5% 0.1% 0 0 0 0.003 0.001 0Greece 3724 3647 3511 -5.7% -0.1% 0 0 0 0.001 0 0Portugal 3714 3634 3586 -3.4% -0.1% 0 0 0 0.004 0.002 0Serbia 2753 2996 3223 17.1% 0.3% 2.355 1.425 0 -100.0% 0.001 0 0Croatia 2865 3075 3292 14.9% 0.3% 0.853 0.429 0 -100.0% 0.001 0 0Bosnia and Herzegovina 2927 3008 3149 7.6% 0.1% 1.066 1.227 0 -100.0% 0.001 0 0Albania 2910 3175 3317 14.0% 0.3% 14.16 0 0 -100.0% 0.001 0 0Macedonia, TFYR 2700 2813 3021 11.9% 0.2% 1.894 3.19 1.579 -16.6% -0.4% 0.001 0 0Slovenia 3063 3269 3430 12.0% 0.2% 1.486 0 0 -100.0% 0.004 0.002 0Montenegro 2924 3122 3384 15.7% 0.3% 5.173 0 0 -100.0% 0.001 0 0Malta 3599 3647 3700 2.8% 0.1% 0 0 0 0.001 0 0
Europe-South 3457 3471 3479 0.6% 0.0% 0.541 0.16 0.023 -95.7% -6.1% 0.002 0.001 0
Germany 3507 3580 3543 1.0% 0.0% 0 0 0 0.001 0 0France 3657 3657 3583 -2.0% 0.0% 0 0 0 0.002 0.001 0Netherlands 3393 3467 3465 2.1% 0.0% 0 0 0 0.001 0 0Belgium 3586 3584 3535 -1.4% 0.0% 0 0 0 0.001 0 0Austria 3676 3692 3583 -2.5% -0.1% 0 0 0 0.001 0 0Switzerland 3553 3620 3558 0.1% 0.0% 0 0 0 0.005 0.002 0Luxembourg 3738 3718 3598 -3.7% -0.1% 0 0 0 0.001 0 0
Europe-West 3561 3602 3552 -0.3% 0.0% 0 0 0 0.001 0.001 0
VOL2_15 Forecast Tables rev.indd 245 21/08/2009 09:11

Patterns of Potential Hum
an Progress Volume 2: Enhancing Global Education
246
Patterns of Potential Human Progress Multination Regional Analysis Measures of Poverty, Health, Education, Infrastructure, and Governance
HealthDeath Rate: Communicable Diseases Death Rate: Non-Communicable Diseases
Digestive Respiratory Other Communicable Cardiovascular Malignant Neoplasm Other Non-Communicable
Per Thousand Pop per Year Per Thousand Pop per Year Per Thousand Pop per Year Per Thousand Pop per Year Per Thousand Pop per Year Per Thousand Pop per Year
2010 2035 2060 2010 2035 2060 2010 2035 2060 2010 2035 2060 2010 2035 2060 2010 2035 2060
World 0.317 0.35 0.431 0.168 0.302 0.636 3.151 1.639 0.967 2.777 3.782 5.114 1.247 1.811 2.491 0.482 0.61 0.862
Africa 0.217 0.221 0.265 0.161 0.17 0.253 8.912 4.154 1.901 1.499 1.931 2.877 0.53 0.799 1.525 0.424 0.432 0.568Americas 0.342 0.433 0.565 0.195 0.397 0.866 0.85 0.44 0.339 2.253 3.027 3.727 1.354 1.801 2.283 0.63 0.838 1.12Asia with Oceania 0.313 0.348 0.451 0.16 0.312 0.733 2.742 1.24 0.779 2.681 4.07 6.018 1.212 2.009 2.891 0.441 0.584 0.91Europe 0.445 0.529 0.62 0.187 0.408 0.83 0.456 0.321 0.246 5.769 7.415 8.612 2.298 2.875 3.158 0.609 0.854 1.072World 0.317 0.35 0.431 0.168 0.302 0.636 3.151 1.639 0.967 2.777 3.782 5.114 1.247 1.811 2.491 0.482 0.61 0.862
Africa-Eastern 0.149 0.144 0.161 0.131 0.105 0.114 8.932 3.628 1.111 1.102 1.497 2.422 0.426 0.707 1.641 0.368 0.345 0.44Africa-Middle 0.207 0.221 0.258 0.155 0.133 0.131 11.62 6.435 3.122 1.263 1.441 1.893 0.538 0.762 1.348 0.354 0.357 0.416Africa-Northern 0.375 0.441 0.63 0.162 0.3 0.766 2.341 0.834 0.493 2.372 3.526 5.681 0.59 0.877 1.385 0.589 0.73 1.153Africa-Southern 0.164 0.211 0.296 0.194 0.372 0.849 2.5 0.733 0.512 1.743 2.67 3.725 0.729 1.14 2.068 0.338 0.433 0.7Africa-Western 0.196 0.189 0.222 0.189 0.162 0.193 13.49 5.842 2.785 1.378 1.7 2.64 0.558 0.832 1.506 0.416 0.407 0.527Africa 0.217 0.221 0.265 0.161 0.17 0.253 8.912 4.154 1.901 1.499 1.931 2.877 0.53 0.799 1.525 0.424 0.432 0.568
America-Caribbean 0.305 0.373 0.454 0.139 0.237 0.451 2.302 1.496 0.855 2.291 3.064 4.021 1.027 1.409 2.164 0.655 0.879 1.165America-Central 0.322 0.346 0.456 0.101 0.152 0.346 1.949 0.562 0.319 1.234 1.671 2.643 0.653 0.909 1.461 0.525 0.575 0.81America-North 0.355 0.481 0.625 0.171 0.357 0.74 0.476 0.349 0.289 2.587 3.199 3.496 1.681 2.096 2.331 0.822 1.136 1.444America-South 0.333 0.397 0.527 0.24 0.487 1.118 1.011 0.422 0.345 1.981 3.012 4.105 1.092 1.632 2.363 0.422 0.541 0.809Americas 0.342 0.433 0.565 0.195 0.397 0.866 0.85 0.44 0.339 2.253 3.027 3.727 1.354 1.801 2.283 0.63 0.838 1.12
Asia-East 0.34 0.438 0.689 0.194 0.542 1.462 0.789 0.493 0.488 3.006 4.653 5.983 1.894 3.341 4.834 0.405 0.627 1.026Asia-South Central 0.314 0.3 0.315 0.12 0.131 0.219 4.837 2.049 1.117 2.537 3.779 6.076 0.731 1.266 2.014 0.428 0.504 0.764Asia-South East 0.286 0.337 0.429 0.195 0.366 0.946 2.223 0.84 0.568 2.231 3.662 5.945 0.948 1.526 2.135 0.539 0.725 1.146Asia-West 0.197 0.236 0.337 0.13 0.207 0.466 2.108 0.67 0.335 2.683 3.917 6.196 0.699 1.047 1.552 0.498 0.551 0.858Oceania 0.25 0.317 0.391 0.166 0.286 0.488 1.477 0.718 0.464 2.591 3.514 3.978 1.67 2.01 2.242 0.704 0.96 1.151Asia with Oceania 0.313 0.348 0.451 0.16 0.312 0.733 2.742 1.24 0.779 2.681 4.07 6.018 1.212 2.009 2.891 0.441 0.584 0.91
Europe-East 0.481 0.527 0.612 0.125 0.25 0.553 0.36 0.178 0.126 8.098 10.32 13.8 2.036 2.755 3.155 0.336 0.339 0.391Europe-North 0.407 0.484 0.568 0.19 0.329 0.574 0.814 0.629 0.475 3.924 4.694 4.239 2.349 2.515 2.612 0.77 1.034 1.17Europe-South 0.41 0.527 0.667 0.335 0.829 1.888 0.381 0.273 0.226 4.522 6.725 8.25 2.434 3.072 3.543 0.757 1.188 1.734Europe-West 0.457 0.575 0.644 0.157 0.338 0.566 0.463 0.385 0.278 4.067 5.371 4.794 2.584 3.105 3.244 0.825 1.219 1.428Europe 0.445 0.529 0.62 0.187 0.408 0.83 0.456 0.321 0.246 5.769 7.415 8.612 2.298 2.875 3.158 0.609 0.854 1.072
Base Case
Source: International Futures Version 6.12, Mar 2009
VOL2_15 Forecast Tables rev.indd 246 21/08/2009 09:11

247Forecast Tables
Patterns of Potential Human Progress Multination Regional Analysis Measures of Poverty, Health, Education, Infrastructure, and Governance
HealthDeath Rate: Communicable Diseases Death Rate: Non-Communicable Diseases
Digestive Respiratory Other Communicable Cardiovascular Malignant Neoplasm Other Non-Communicable
Per Thousand Pop per Year Per Thousand Pop per Year Per Thousand Pop per Year Per Thousand Pop per Year Per Thousand Pop per Year Per Thousand Pop per Year
2010 2035 2060 2010 2035 2060 2010 2035 2060 2010 2035 2060 2010 2035 2060 2010 2035 2060
AFRICAEthiopia 0.207 0.2 0.188 0.187 0.15 0.106 11.45 5.663 1.397 1.293 1.889 2.773 0.529 0.845 1.984 0.583 0.51 0.482
Uganda 0.102 0.089 0.105 0.11 0.078 0.118 8.512 2.564 0.588 0.85 0.95 1.6 0.327 0.513 1.178 0.248 0.213 0.308
Tanzania, United Rep. of 0.118 0.107 0.12 0.075 0.05 0.069 7.044 1.903 0.561 1.03 1.4 2.249 0.39 0.704 1.711 0.301 0.32 0.512
Kenya 0.105 0.125 0.179 0.084 0.082 0.13 5.758 2.201 0.928 0.879 1.369 2.612 0.333 0.63 1.625 0.247 0.276 0.468
Madagascar 0.23 0.23 0.236 0.208 0.19 0.163 10.78 5.415 1.868 1.47 1.931 2.66 0.603 0.919 1.664 0.407 0.428 0.515
Mozambique 0.121 0.096 0.084 0.114 0.06 0.083 10.17 2.107 0.556 0.956 1.173 1.841 0.386 0.779 1.6 0.288 0.244 0.327
Malawi 0.066 0.059 0.104 0.089 0.069 0.08 6.632 2.951 0.961 0.89 1.099 1.916 0.286 0.411 1.176 0.175 0.172 0.289
Zambia 0.076 0.071 0.116 0.109 0.087 0.137 8.32 3.891 1.591 0.762 0.859 1.6 0.278 0.4 1.1 0.227 0.199 0.3
Burundi 0.139 0.14 0.132 0.115 0.072 0.041 13.93 5.262 0.986 1.05 1.296 1.758 0.419 0.716 1.737 0.303 0.287 0.321
Rwanda 0.185 0.207 0.212 0.13 0.108 0.101 13.06 5.617 1.76 1.079 1.433 2.281 0.47 0.815 1.813 0.355 0.366 0.454
Somalia 0.251 0.21 0.271 0.097 0.048 0.039 9.132 2.389 0.729 1.798 2.802 5.174 0.602 1.022 1.936 0.624 0.534 0.69
Zimbabwe 0.092 0.099 0.204 0.128 0.12 0.278 3.609 1.43 1.66 0.914 1.306 3.09 0.306 0.527 1.585 0.25 0.245 0.532
Eritrea 0.214 0.215 0.245 0.168 0.175 0.173 7.829 5.403 3.098 1.34 1.763 2.714 0.554 0.725 1.172 0.369 0.4 0.503
Mauritius 0.335 0.378 0.392 0.377 1.003 2.302 0.454 0.298 0.256 3.432 5.665 6.917 0.644 1.071 1.443 0.419 0.608 0.843
Comoros 0.232 0.283 0.295 0.216 0.233 0.233 6.541 4.121 1.598 1.486 2.092 3.278 0.621 1.052 2.094 0.417 0.497 0.662
Djibouti 0.375 0.501 0.544 0.115 0.143 0.169 8.641 4.43 1.414 2.031 3.037 4.802 0.698 0.954 1.306 0.568 0.705 0.917
Africa-Eastern 0.149 0.144 0.161 0.131 0.105 0.114 8.932 3.628 1.111 1.102 1.497 2.422 0.426 0.707 1.641 0.368 0.345 0.44
Congo; Dem. Rep. of 0.217 0.234 0.266 0.126 0.088 0.058 10.36 5.702 1.961 1.202 1.322 1.516 0.527 0.764 1.445 0.329 0.325 0.354
Angola 0.21 0.213 0.263 0.199 0.204 0.264 16.58 8.853 6.507 1.182 1.449 2.357 0.533 0.723 1.052 0.44 0.434 0.536
Cameroon 0.179 0.191 0.233 0.182 0.189 0.246 9.006 4.903 2.292 1.386 1.778 2.852 0.549 0.794 1.448 0.34 0.381 0.538
Chad 0.17 0.17 0.196 0.177 0.16 0.189 18.91 10.76 7.169 1.245 1.358 2.024 0.492 0.658 0.935 0.359 0.347 0.417
Central African Republic 0.211 0.22 0.233 0.166 0.138 0.119 9.993 5.589 2.178 1.544 1.727 2.314 0.627 0.898 1.604 0.342 0.358 0.446
Congo, Rep. of 0.207 0.234 0.317 0.17 0.194 0.284 6.606 4.038 3.035 1.417 1.84 3.312 0.576 0.845 1.404 0.366 0.419 0.624
Gabon 0.298 0.386 0.475 0.271 0.53 1.14 5.23 2.114 0.879 2.06 2.493 3.937 0.881 1.051 1.314 0.552 0.616 0.846
Equatorial Guinea 0.253 0.307 0.469 0.255 0.335 0.526 11.33 8.646 8.291 1.727 2.232 4.277 0.733 0.971 1.42 0.495 0.561 0.819
São Tomé and Príncipe 0.187 0.2 0.248 0.222 0.212 0.242 8.454 6.101 2.935 1.711 1.783 3.004 0.608 0.717 1.431 0.363 0.345 0.448
Africa-Middle 0.207 0.221 0.258 0.155 0.133 0.131 11.62 6.435 3.122 1.263 1.441 1.893 0.538 0.762 1.348 0.354 0.357 0.416
Egypt 0.454 0.504 0.788 0.162 0.294 0.725 1.2 0.278 0.202 2.68 3.951 6.074 0.532 0.722 1.123 0.695 0.832 1.321
Sudan 0.345 0.32 0.349 0.133 0.107 0.133 6.67 2.372 1.08 1.949 2.597 4.252 0.65 0.935 1.43 0.675 0.654 0.847
Algeria 0.204 0.299 0.461 0.223 0.578 1.878 1.705 0.653 0.582 1.679 2.977 5.699 0.619 1.108 1.899 0.339 0.571 1.133
Morocco 0.447 0.654 0.903 0.154 0.344 0.938 1.485 0.393 0.23 2.794 4.077 6.222 0.64 0.895 1.379 0.571 0.805 1.269
Tunisia 0.33 0.433 0.757 0.139 0.296 0.927 0.41 0.161 0.171 2.958 4.895 8.443 0.633 1.054 1.927 0.505 0.719 1.374
Libyan Arab Jamahiriya 0.212 0.334 0.567 0.075 0.191 0.607 0.537 0.195 0.169 1.862 3.483 7.014 0.47 0.826 1.155 0.328 0.541 1.01
Africa-Northern 0.375 0.441 0.63 0.162 0.3 0.766 2.341 0.834 0.493 2.372 3.526 5.681 0.59 0.877 1.385 0.589 0.73 1.153
Base Case: Countries in Year 2060
Descending Population Sequence
VOL2_15 Forecast Tables rev.indd 247 21/08/2009 09:12

Patterns of Potential Hum
an Progress Volume 2: Enhancing Global Education
248
Patterns of Potential Human Progress Multination Regional Analysis Measures of Poverty, Health, Education, Infrastructure, and Governance
HealthDeath Rate: Communicable Diseases Death Rate: Non-Communicable Diseases
Digestive Respiratory Other Communicable Cardiovascular Malignant Neoplasm Other Non-Communicable
Per Thousand Pop per Year Per Thousand Pop per Year Per Thousand Pop per Year Per Thousand Pop per Year Per Thousand Pop per Year Per Thousand Pop per Year
2010 2035 2060 2010 2035 2060 2010 2035 2060 2010 2035 2060 2010 2035 2060 2010 2035 2060
AFRICA continuedSouth Africa 0.171 0.225 0.307 0.204 0.408 0.939 2.355 0.633 0.416 1.805 2.812 3.785 0.759 1.179 1.993 0.343 0.445 0.698
Namibia 0.087 0.101 0.141 0.138 0.181 0.27 3.162 1.369 1.203 1.299 2.027 3.367 0.551 1.083 2.914 0.283 0.371 0.675
Lesotho 0.164 0.134 0.256 0.153 0.11 0.221 4.603 1.73 1.067 1.651 1.806 3.605 0.602 0.837 2.462 0.338 0.323 0.678
Botswana 0.12 0.169 0.333 0.11 0.244 0.76 1.866 0.427 0.364 1.177 1.798 3.311 0.487 0.929 1.988 0.265 0.391 0.848
Swaziland 0.105 0.122 0.252 0.099 0.107 0.207 4.833 1.849 1.54 1.082 1.624 3.272 0.422 0.711 2.311 0.315 0.343 0.642
Africa-Southern 0.164 0.211 0.296 0.194 0.372 0.849 2.5 0.733 0.512 1.743 2.67 3.725 0.729 1.14 2.068 0.338 0.433 0.7
Nigeria 0.201 0.192 0.244 0.194 0.168 0.23 13.2 5.167 3.449 1.33 1.725 2.799 0.542 0.855 1.49 0.441 0.429 0.577
Niger 0.143 0.127 0.119 0.162 0.109 0.069 21.16 9.237 2.085 1.115 1.323 1.721 0.445 0.62 1.165 0.394 0.341 0.334
Côte d’Ivoire 0.203 0.213 0.241 0.147 0.138 0.159 11.09 5.636 2.442 1.371 1.738 2.862 0.571 0.83 1.485 0.356 0.39 0.536
Ghana 0.229 0.266 0.312 0.212 0.244 0.285 6.864 4.439 2.314 1.576 2.246 3.415 0.649 1.033 2.003 0.413 0.499 0.673
Burkina Faso 0.181 0.187 0.198 0.181 0.145 0.16 18.38 8.098 1.997 1.399 1.422 2.288 0.55 0.774 1.676 0.369 0.35 0.474
Mali 0.15 0.107 0.115 0.173 0.096 0.098 18.53 5.81 1.508 1.308 1.288 2.194 0.485 0.597 1.275 0.441 0.316 0.385
Senegal 0.219 0.185 0.208 0.232 0.173 0.2 11.46 5.55 2.011 1.821 1.695 2.831 0.706 0.815 1.55 0.449 0.388 0.529
Guinea 0.206 0.198 0.197 0.197 0.158 0.155 14.54 6.204 2.062 1.446 1.71 2.337 0.607 0.905 1.509 0.366 0.38 0.47
Benin 0.187 0.186 0.198 0.178 0.17 0.172 12.01 5.656 1.931 1.295 1.808 2.593 0.532 0.831 1.526 0.371 0.395 0.497
Togo 0.17 0.186 0.245 0.172 0.187 0.194 10.2 7.236 3.475 1.341 1.806 2.752 0.519 0.71 1.3 0.344 0.387 0.513
Sierra Leone 0.207 0.197 0.179 0.19 0.125 0.099 20.21 7.674 1.97 1.509 1.615 1.814 0.633 1.045 1.703 0.38 0.367 0.4
Liberia 0.187 0.201 0.242 0.17 0.149 0.099 16.79 9.89 3.11 1.158 1.45 1.813 0.508 0.765 1.588 0.369 0.378 0.422
Mauritania 0.206 0.214 0.232 0.212 0.229 0.247 8.615 5.08 2.241 1.753 2.197 3.306 0.674 0.989 1.666 0.373 0.413 0.566
Guinea-Bissau 0.174 0.131 0.138 0.166 0.117 0.085 15.42 6.673 2.476 1.309 1.526 1.896 0.534 0.664 1.123 0.353 0.312 0.342
Gambia 0.227 0.216 0.244 0.231 0.196 0.193 9.937 5.566 2.591 1.842 2.155 2.93 0.744 0.992 1.683 0.459 0.462 0.57
Cape Verde 0.161 0.171 0.269 0.188 0.212 0.567 1.912 0.68 0.492 1.61 2.019 4.537 0.675 1.209 2.835 0.312 0.325 0.687
Africa-Western 0.196 0.189 0.222 0.189 0.162 0.193 13.49 5.842 2.785 1.378 1.7 2.64 0.558 0.832 1.506 0.416 0.407 0.527
Base Case: Countries in Year 2060
Descending Population Sequence
VOL2_15 Forecast Tables rev.indd 248 21/08/2009 09:12

249Forecast Tables
Patterns of Potential Human Progress Multination Regional Analysis Measures of Poverty, Health, Education, Infrastructure, and Governance
HealthDeath Rate: Communicable Diseases Death Rate: Non-Communicable Diseases
Digestive Respiratory Other Communicable Cardiovascular Malignant Neoplasm Other Non-Communicable
Per Thousand Pop per Year Per Thousand Pop per Year Per Thousand Pop per Year Per Thousand Pop per Year Per Thousand Pop per Year Per Thousand Pop per Year
2010 2035 2060 2010 2035 2060 2010 2035 2060 2010 2035 2060 2010 2035 2060 2010 2035 2060
AMERICASHaiti 0.449 0.472 0.478 0.196 0.199 0.245 7.119 4.11 1.746 1.875 2.187 3.418 0.599 0.809 1.53 0.526 0.546 0.7
Dominican Republic 0.297 0.355 0.454 0.149 0.288 0.658 1.278 0.354 0.196 1.837 2.473 3.431 0.741 1.113 1.726 0.209 0.255 0.366
Cuba 0.281 0.389 0.569 0.061 0.119 0.231 0.723 0.669 0.877 3.158 4.872 6.018 1.694 2.556 4.249 0.456 0.711 1.219
Puerto Rico 0.121 0.155 0.192 0.202 0.448 0.851 0.117 0.08 0.058 1.314 1.743 1.626 0.534 0.735 0.899 2.73 4.062 4.958
Jamaica 0.237 0.265 0.311 0.14 0.251 0.553 0.81 0.33 0.226 2.786 3.541 5.121 1.328 1.59 2.061 0.541 0.644 0.978
Trinidad and Tobago 0.265 0.367 0.504 0.141 0.347 0.891 0.602 0.427 0.405 2.883 4.616 7.031 1.103 1.858 2.496 0.441 0.632 1.05
Bahamas 0.357 0.446 0.489 0.12 0.217 0.414 0.5 0.324 0.284 2.093 3.543 4.514 1.174 1.779 2.314 0.613 0.878 1.221
Barbados 0.274 0.487 0.829 0.196 0.523 1.299 0.497 0.502 0.595 2.778 5.46 6.559 1.454 3.166 5.38 0.743 1.503 2.687
St. Vincent & the Grenadines 0.258 0.309 0.437 0.126 0.233 0.921 1.024 0.36 0.346 2.5 3.272 5.95 1.13 1.59 2.828 0.467 0.504 0.865
Grenada 0.242 0.28 0.274 0.141 0.207 0.381 1.264 0.493 0.404 2.5 2.948 4.668 0.985 1.196 2.046 0.471 0.56 0.967
St. Lucia 0.242 0.279 0.303 0.133 0.338 0.979 0.573 0.284 0.28 2.388 3.774 6.164 0.972 1.523 2.575 0.522 0.74 1.329
America-Caribbean 0.305 0.373 0.454 0.139 0.237 0.451 2.302 1.496 0.855 2.291 3.064 4.021 1.027 1.409 2.164 0.655 0.879 1.165
Guatemala 0.3 0.24 0.281 0.095 0.122 0.26 3.275 0.75 0.357 0.846 0.911 1.328 0.448 0.481 0.73 0.412 0.37 0.459
Honduras 0.374 0.39 0.484 0.093 0.094 0.163 1.926 0.609 0.301 1.47 2.207 4.054 0.704 1.002 1.661 0.644 0.719 1.017
El Salvador 0.372 0.435 0.56 0.152 0.265 0.663 1.531 0.552 0.428 1.407 1.83 3.088 0.686 0.898 1.456 0.84 1.003 1.525
Nicaragua 0.32 0.425 0.542 0.071 0.114 0.245 1.223 0.326 0.123 1.345 2.207 3.877 0.604 0.865 1.193 0.477 0.61 0.881
Costa Rica 0.312 0.468 0.835 0.091 0.204 0.527 0.26 0.161 0.188 1.331 2.177 3.019 0.941 1.859 3.506 0.328 0.463 0.819
Panama 0.219 0.351 0.673 0.091 0.217 0.616 0.947 0.383 0.368 1.597 2.556 3.965 1.009 1.872 3.521 0.403 0.53 0.913
Belize 0.135 0.203 0.401 0.138 0.281 0.715 1.225 0.482 0.642 1.303 1.742 3.214 0.632 1.12 2.355 0.323 0.344 0.736
America-Central 0.322 0.346 0.456 0.101 0.152 0.346 1.949 0.562 0.319 1.234 1.671 2.643 0.653 0.909 1.461 0.525 0.575 0.81
United States of America 0.297 0.378 0.449 0.197 0.389 0.723 0.412 0.334 0.25 3.026 3.476 3.357 1.956 2.328 2.391 0.924 1.256 1.492
Mexico 0.541 0.787 1.178 0.109 0.281 0.848 0.706 0.406 0.423 1.336 2.292 3.929 0.747 1.204 1.947 0.501 0.696 1.196
Canada 0.286 0.439 0.553 0.129 0.303 0.56 0.313 0.302 0.238 2.588 3.598 3.455 2.17 2.87 2.98 0.912 1.465 1.783
America-North 0.355 0.481 0.625 0.171 0.357 0.74 0.476 0.349 0.289 2.587 3.199 3.496 1.681 2.096 2.331 0.822 1.136 1.444
Brazil 0.338 0.37 0.434 0.231 0.475 1.069 0.942 0.33 0.227 2.177 3.348 4.343 0.993 1.44 1.966 0.403 0.515 0.725
Colombia 0.234 0.347 0.533 0.101 0.224 0.528 0.823 0.315 0.243 1.796 3.277 4.735 0.929 1.617 2.591 0.292 0.392 0.626
Argentina 0.311 0.371 0.532 0.657 1.34 3.067 0.785 0.533 0.528 2.461 2.85 3.408 1.644 2.199 3.113 0.52 0.64 0.948
Venezuela, RB 0.226 0.312 0.462 0.066 0.145 0.384 0.582 0.251 0.21 1.718 3.035 5.041 0.876 1.398 1.985 0.327 0.407 0.637
Peru 0.489 0.623 0.884 0.24 0.502 1.3 1.744 0.869 0.835 1.137 1.706 2.717 1.208 1.84 2.736 0.551 0.713 1.178
Chile 0.39 0.523 0.738 0.157 0.43 0.999 0.442 0.421 0.457 1.583 2.468 3.077 1.38 2.555 3.724 0.469 0.769 1.259
Ecuador 0.328 0.453 0.647 0.132 0.277 0.681 1.27 0.559 0.402 1.489 2.415 3.786 0.814 1.137 1.497 0.42 0.558 0.818
Bolivia 0.582 0.596 0.849 0.272 0.31 0.517 3.596 1.163 0.998 1.309 1.822 3.167 1.516 2.402 4.541 0.714 0.78 1.28
Paraguay 0.228 0.265 0.373 0.124 0.23 0.552 1.507 0.413 0.225 1.666 2.397 3.454 0.897 1.147 1.729 0.342 0.352 0.477
Uruguay 0.394 0.409 0.574 0.232 0.376 0.811 0.56 0.283 0.254 3.395 3.518 4.054 2.388 2.776 3.935 0.973 1.135 1.715
Guyana 0.373 0.46 0.479 0.103 0.206 0.426 1.887 0.655 0.266 3.166 5.882 7.768 0.587 0.973 1.137 0.506 0.662 0.9
Suriname 0.348 0.523 0.707 0.085 0.205 0.483 1.372 0.677 0.541 2.446 3.789 5.5 0.856 1.394 2.12 0.532 0.735 1.163
America-South 0.333 0.397 0.527 0.24 0.487 1.118 1.011 0.422 0.345 1.981 3.012 4.105 1.092 1.632 2.363 0.422 0.541 0.809
Base Case: Countries in Year 2060
Descending Population Sequence
VOL2_15 Forecast Tables rev.indd 249 21/08/2009 09:12
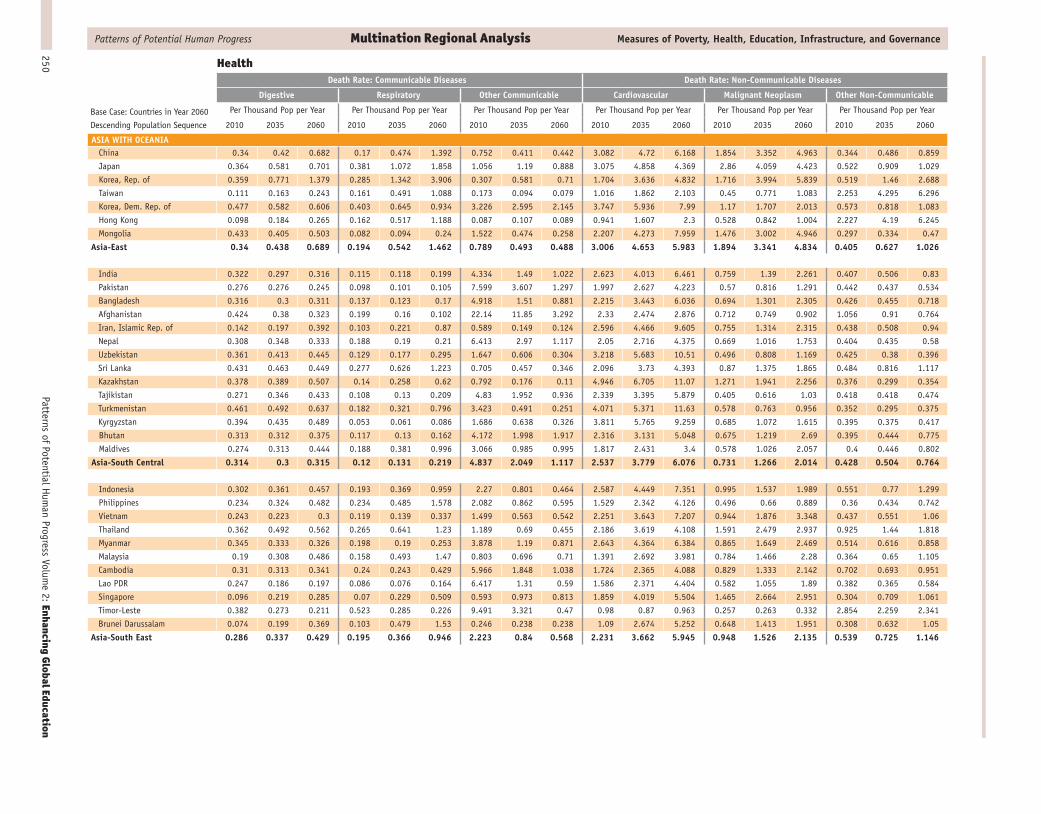
Patterns of Potential Hum
an Progress Volume 2: Enhancing Global Education
250
Patterns of Potential Human Progress Multination Regional Analysis Measures of Poverty, Health, Education, Infrastructure, and Governance
HealthDeath Rate: Communicable Diseases Death Rate: Non-Communicable Diseases
Digestive Respiratory Other Communicable Cardiovascular Malignant Neoplasm Other Non-Communicable
Per Thousand Pop per Year Per Thousand Pop per Year Per Thousand Pop per Year Per Thousand Pop per Year Per Thousand Pop per Year Per Thousand Pop per Year
2010 2035 2060 2010 2035 2060 2010 2035 2060 2010 2035 2060 2010 2035 2060 2010 2035 2060
ASIA WITH OCEANIAChina 0.34 0.42 0.682 0.17 0.474 1.392 0.752 0.411 0.442 3.082 4.72 6.168 1.854 3.352 4.963 0.344 0.486 0.859
Japan 0.364 0.581 0.701 0.381 1.072 1.858 1.056 1.19 0.888 3.075 4.858 4.369 2.86 4.059 4.423 0.522 0.909 1.029
Korea, Rep. of 0.359 0.771 1.379 0.285 1.342 3.906 0.307 0.581 0.71 1.704 3.636 4.832 1.716 3.994 5.839 0.519 1.46 2.688
Taiwan 0.111 0.163 0.243 0.161 0.491 1.088 0.173 0.094 0.079 1.016 1.862 2.103 0.45 0.771 1.083 2.253 4.295 6.296
Korea, Dem. Rep. of 0.477 0.582 0.606 0.403 0.645 0.934 3.226 2.595 2.145 3.747 5.936 7.99 1.17 1.707 2.013 0.573 0.818 1.083
Hong Kong 0.098 0.184 0.265 0.162 0.517 1.188 0.087 0.107 0.089 0.941 1.607 2.3 0.528 0.842 1.004 2.227 4.19 6.245
Mongolia 0.433 0.405 0.503 0.082 0.094 0.24 1.522 0.474 0.258 2.207 4.273 7.959 1.476 3.002 4.946 0.297 0.334 0.47
Asia-East 0.34 0.438 0.689 0.194 0.542 1.462 0.789 0.493 0.488 3.006 4.653 5.983 1.894 3.341 4.834 0.405 0.627 1.026
India 0.322 0.297 0.316 0.115 0.118 0.199 4.334 1.49 1.022 2.623 4.013 6.461 0.759 1.39 2.261 0.407 0.506 0.83
Pakistan 0.276 0.276 0.245 0.098 0.101 0.105 7.599 3.607 1.297 1.997 2.627 4.223 0.57 0.816 1.291 0.442 0.437 0.534
Bangladesh 0.316 0.3 0.311 0.137 0.123 0.17 4.918 1.51 0.881 2.215 3.443 6.036 0.694 1.301 2.305 0.426 0.455 0.718
Afghanistan 0.424 0.38 0.323 0.199 0.16 0.102 22.14 11.85 3.292 2.33 2.474 2.876 0.712 0.749 0.902 1.056 0.91 0.764
Iran, Islamic Rep. of 0.142 0.197 0.392 0.103 0.221 0.87 0.589 0.149 0.124 2.596 4.466 9.605 0.755 1.314 2.315 0.438 0.508 0.94
Nepal 0.308 0.348 0.333 0.188 0.19 0.21 6.413 2.97 1.117 2.05 2.716 4.375 0.669 1.016 1.753 0.404 0.435 0.58
Uzbekistan 0.361 0.413 0.445 0.129 0.177 0.295 1.647 0.606 0.304 3.218 5.683 10.51 0.496 0.808 1.169 0.425 0.38 0.396
Sri Lanka 0.431 0.463 0.449 0.277 0.626 1.223 0.705 0.457 0.346 2.096 3.73 4.393 0.87 1.375 1.865 0.484 0.816 1.117
Kazakhstan 0.378 0.389 0.507 0.14 0.258 0.62 0.792 0.176 0.11 4.946 6.705 11.07 1.271 1.941 2.256 0.376 0.299 0.354
Tajikistan 0.271 0.346 0.433 0.108 0.13 0.209 4.83 1.952 0.936 2.339 3.395 5.879 0.405 0.616 1.03 0.418 0.418 0.474
Turkmenistan 0.461 0.492 0.637 0.182 0.321 0.796 3.423 0.491 0.251 4.071 5.371 11.63 0.578 0.763 0.956 0.352 0.295 0.375
Kyrgyzstan 0.394 0.435 0.489 0.053 0.061 0.086 1.686 0.638 0.326 3.811 5.765 9.259 0.685 1.072 1.615 0.395 0.375 0.417
Bhutan 0.313 0.312 0.375 0.117 0.13 0.162 4.172 1.998 1.917 2.316 3.131 5.048 0.675 1.219 2.69 0.395 0.444 0.775
Maldives 0.274 0.313 0.444 0.188 0.381 0.996 3.066 0.985 0.995 1.817 2.431 3.4 0.578 1.026 2.057 0.4 0.446 0.802
Asia-South Central 0.314 0.3 0.315 0.12 0.131 0.219 4.837 2.049 1.117 2.537 3.779 6.076 0.731 1.266 2.014 0.428 0.504 0.764
Indonesia 0.302 0.361 0.457 0.193 0.369 0.959 2.27 0.801 0.464 2.587 4.449 7.351 0.995 1.537 1.989 0.551 0.77 1.299
Philippines 0.234 0.324 0.482 0.234 0.485 1.578 2.082 0.862 0.595 1.529 2.342 4.126 0.496 0.66 0.889 0.36 0.434 0.742
Vietnam 0.243 0.223 0.3 0.119 0.139 0.337 1.499 0.563 0.542 2.251 3.643 7.207 0.944 1.876 3.348 0.437 0.551 1.06
Thailand 0.362 0.492 0.562 0.265 0.641 1.23 1.189 0.69 0.455 2.186 3.619 4.108 1.591 2.479 2.937 0.925 1.44 1.818
Myanmar 0.345 0.333 0.326 0.198 0.19 0.253 3.878 1.19 0.871 2.643 4.364 6.384 0.865 1.649 2.469 0.514 0.616 0.858
Malaysia 0.19 0.308 0.486 0.158 0.493 1.47 0.803 0.696 0.71 1.391 2.692 3.981 0.784 1.466 2.28 0.364 0.65 1.105
Cambodia 0.31 0.313 0.341 0.24 0.243 0.429 5.966 1.848 1.038 1.724 2.365 4.088 0.829 1.333 2.142 0.702 0.693 0.951
Lao PDR 0.247 0.186 0.197 0.086 0.076 0.164 6.417 1.31 0.59 1.586 2.371 4.404 0.582 1.055 1.89 0.382 0.365 0.584
Singapore 0.096 0.219 0.285 0.07 0.229 0.509 0.593 0.973 0.813 1.859 4.019 5.504 1.465 2.664 2.951 0.304 0.709 1.061
Timor-Leste 0.382 0.273 0.211 0.523 0.285 0.226 9.491 3.321 0.47 0.98 0.87 0.963 0.257 0.263 0.332 2.854 2.259 2.341
Brunei Darussalam 0.074 0.199 0.369 0.103 0.479 1.53 0.246 0.238 0.238 1.09 2.674 5.252 0.648 1.413 1.951 0.308 0.632 1.05
Asia-South East 0.286 0.337 0.429 0.195 0.366 0.946 2.223 0.84 0.568 2.231 3.662 5.945 0.948 1.526 2.135 0.539 0.725 1.146
Base Case: Countries in Year 2060
Descending Population Sequence
VOL2_15 Forecast Tables rev.indd 250 21/08/2009 09:13

251Forecast Tables
Patterns of Potential Human Progress Multination Regional Analysis Measures of Poverty, Health, Education, Infrastructure, and Governance
HealthDeath Rate: Communicable Diseases Death Rate: Non-Communicable Diseases
Digestive Respiratory Other Communicable Cardiovascular Malignant Neoplasm Other Non-Communicable
Per Thousand Pop per Year Per Thousand Pop per Year Per Thousand Pop per Year Per Thousand Pop per Year Per Thousand Pop per Year Per Thousand Pop per Year
2010 2035 2060 2010 2035 2060 2010 2035 2060 2010 2035 2060 2010 2035 2060 2010 2035 2060
ASIA WITH OCEANIA continuedTurkey 0.166 0.194 0.261 0.154 0.303 0.727 0.729 0.179 0.14 3.784 6.348 9.815 0.787 1.233 1.849 0.234 0.245 0.321
Yemen 0.323 0.292 0.367 0.152 0.11 0.148 6.583 1.838 0.569 1.957 2.352 4.21 0.612 0.781 1.137 0.823 0.671 0.822
Iraq 0.303 0.268 0.336 0.174 0.12 0.196 6.807 1.602 0.54 2.266 2.748 4.925 0.826 1.072 1.61 0.956 0.691 0.824
Saudi Arabia 0.12 0.239 0.379 0.059 0.216 0.556 0.663 0.342 0.404 1.589 3.07 5.627 0.482 0.981 1.468 0.455 0.532 0.829
Syria 0.096 0.139 0.252 0.081 0.155 0.465 0.595 0.179 0.134 1.494 2.235 4.003 0.338 0.494 0.874 0.62 0.864 1.729
Israel 0.183 0.292 0.454 0.14 0.27 0.529 0.298 0.241 0.205 1.755 2.024 2.051 1.533 2.173 2.887 0.674 1.015 1.395
Azerbaijan 0.309 0.42 0.607 0.138 0.1 0.159 1.55 0.447 0.343 3.207 5.748 9.696 0.706 1.224 1.758 0.304 0.308 0.429
Jordan 0.101 0.147 0.342 0.081 0.175 0.498 0.641 0.138 0.137 1.361 2.156 3.533 0.667 1.201 2.387 0.472 0.54 1.078
Palestine 0.124 0.113 0.155 0.145 0.138 0.267 0.753 0.215 0.137 0.532 0.701 1.281 0.144 0.206 0.44 1.152 1.378 2.623
United Arab Emirates 0.054 0.201 0.397 0.021 0.183 0.664 0.184 0.417 0.653 0.661 3.156 7.307 0.185 0.952 2.088 0.17 0.55 1.467
Oman 0.103 0.228 0.405 0.051 0.207 0.628 0.419 0.127 0.066 1.397 3.037 5.558 0.427 0.938 1.544 0.277 0.446 0.825
Kuwait 0.062 0.195 0.382 0.037 0.232 0.882 0.184 0.291 0.43 1.013 3.176 7.345 0.296 1.052 1.447 0.164 0.324 0.762
Lebanon 0.395 0.522 0.812 0.176 0.348 0.927 0.626 0.249 0.209 3.609 5.202 8.21 0.828 1.134 1.701 0.603 0.745 1.187
Georgia 0.377 0.413 0.432 0.117 0.149 0.196 0.854 0.37 0.242 8.808 12.35 16.08 1.344 1.862 2.289 0.157 0.148 0.135
Armenia 0.306 0.318 0.424 0.116 0.203 0.502 0.406 0.071 0.039 5.593 6.832 9.812 1.486 1.985 2.667 0.368 0.339 0.447
Bahrain 0.146 0.438 0.714 0.137 0.804 2.564 0.265 0.339 0.395 1.229 3.199 4.921 0.535 1.501 1.892 0.474 1.242 2.564
Qatar 0.08 0.183 0.317 0.069 0.605 1.878 0.241 0.434 0.6 1.313 3.314 6.845 0.294 1.155 1.551 0.291 0.923 1.764
Cyprus 0.14 0.235 0.325 0.57 1.697 4.003 0.506 0.556 0.512 4.076 6.979 8.751 1.119 1.632 2.015 0.179 0.307 0.428
Asia-West 0.197 0.236 0.337 0.13 0.207 0.466 2.108 0.67 0.335 2.683 3.917 6.196 0.699 1.047 1.552 0.498 0.551 0.858
Australia 0.234 0.327 0.415 0.153 0.313 0.566 0.269 0.218 0.166 2.696 3.615 3.553 2.007 2.413 2.546 0.758 1.114 1.328
Papua New Guniea 0.351 0.312 0.334 0.194 0.181 0.257 6.089 2.115 1.127 2.078 2.865 4.665 0.72 1.066 1.559 0.504 0.482 0.629
New Zealand 0.166 0.273 0.386 0.127 0.288 0.523 0.202 0.186 0.161 2.911 4.456 4.273 1.962 2.561 3.014 0.733 1.239 1.594
Solomon Islands 0.338 0.351 0.404 0.322 0.214 0.151 3.996 2.15 1.171 2.339 3.066 4.284 0.721 0.948 1.275 0.953 0.904 1.011
Fiji 0.223 0.319 0.484 0.382 0.862 2.024 1.169 0.686 0.601 2.831 4.292 5.586 0.571 0.797 1.293 0.662 0.906 1.391
Vanuatu 0.243 0.275 0.403 0.162 0.116 0.119 1.953 1.087 0.957 1.91 2.671 4.153 0.507 0.707 1.256 0.589 0.629 0.912
Micronesia 0.287 0.279 0.44 0.199 0.167 0.238 2.065 0.712 0.446 2.203 2.362 3.449 0.577 0.591 0.911 0.683 0.606 0.851
Tonga 0.282 0.275 0.398 0.114 0.125 0.205 1.388 0.595 0.42 2.225 2.134 2.933 0.499 0.482 0.74 0.519 0.481 0.708
Samoa 0.258 0.29 0.419 0.12 0.126 0.223 1.306 0.532 0.406 2.092 2.586 3.339 0.477 0.59 0.965 0.51 0.572 0.857
Oceania 0.25 0.317 0.391 0.166 0.286 0.488 1.477 0.718 0.464 2.591 3.514 3.978 1.67 2.01 2.242 0.704 0.96 1.151
Base Case: Countries in Year 2060
Descending Population Sequence
VOL2_15 Forecast Tables rev.indd 251 21/08/2009 09:13

Patterns of Potential Hum
an Progress Volume 2: Enhancing Global Education
252
Patterns of Potential Human Progress Multination Regional Analysis Measures of Poverty, Health, Education, Infrastructure, and Governance
HealthDeath Rate: Communicable Diseases Death Rate: Non-Communicable Diseases
Digestive Respiratory Other Communicable Cardiovascular Malignant Neoplasm Other Non-Communicable
Per Thousand Pop per Year Per Thousand Pop per Year Per Thousand Pop per Year Per Thousand Pop per Year Per Thousand Pop per Year Per Thousand Pop per Year
2010 2035 2060 2010 2035 2060 2010 2035 2060 2010 2035 2060 2010 2035 2060 2010 2035 2060
EUROPERussian Federation 0.466 0.483 0.576 0.175 0.348 0.792 0.44 0.179 0.112 8.671 10.55 14.68 1.849 2.536 2.736 0.354 0.301 0.328Ukraine 0.424 0.42 0.398 0.073 0.122 0.23 0.269 0.101 0.051 9.917 11.84 14.88 1.904 2.403 2.77 0.31 0.266 0.241Poland 0.41 0.589 0.822 0.082 0.197 0.423 0.264 0.245 0.226 4.977 7.828 9.541 2.518 3.719 4.727 0.338 0.466 0.616Romania 0.689 0.742 0.792 0.089 0.171 0.385 0.44 0.217 0.164 7.943 10.64 15.13 2.022 2.478 2.862 0.258 0.274 0.337Czech Republic 0.415 0.529 0.622 0.06 0.125 0.242 0.255 0.221 0.182 5.58 9.535 12.35 2.728 3.591 4.112 0.345 0.521 0.691Belarus 0.309 0.344 0.393 0.088 0.179 0.372 0.178 0.083 0.053 8.653 10.62 13.74 1.936 2.654 3.237 0.324 0.341 0.396Hungary 0.812 0.835 0.832 0.066 0.122 0.22 0.171 0.105 0.076 6.538 9.494 11.02 3.074 3.751 4.214 0.429 0.58 0.732Bulgaria 0.349 0.394 0.439 0.078 0.154 0.306 0.315 0.186 0.154 10.05 13.27 16.25 1.987 2.404 2.724 0.3 0.348 0.434Slovakia 0.477 0.586 0.669 0.088 0.208 0.457 0.307 0.247 0.225 5.313 9.338 13.42 2.179 3.042 3.653 0.295 0.397 0.514Moldova, Rep. of 1.161 1.266 1.214 0.062 0.068 0.088 0.437 0.269 0.143 7.156 9.801 13.7 1.392 1.787 2.491 0.287 0.297 0.307
Europe-East 0.481 0.527 0.612 0.125 0.25 0.553 0.36 0.178 0.126 8.098 10.32 13.8 2.036 2.755 3.155 0.336 0.339 0.391
United Kingdom 0.433 0.503 0.591 0.242 0.398 0.681 1.035 0.773 0.578 3.652 4.352 3.81 2.38 2.412 2.512 0.746 0.975 1.116Sweden 0.31 0.413 0.497 0.097 0.168 0.275 0.426 0.369 0.269 4.284 4.571 3.874 2.325 2.497 2.542 1.03 1.414 1.562Denmark 0.553 0.643 0.692 0.127 0.259 0.39 0.361 0.297 0.208 3.618 4.57 3.762 2.932 3.479 3.372 0.926 1.238 1.295Ireland 0.221 0.319 0.447 0.174 0.402 0.918 0.585 0.534 0.478 2.443 3.104 3.81 1.639 2.151 2.404 0.513 0.72 0.988Norway 0.298 0.405 0.516 0.113 0.218 0.394 0.59 0.51 0.416 3.542 4.246 4.289 2.208 2.515 2.57 0.737 0.947 1.107Finland 0.387 0.491 0.506 0.078 0.154 0.222 0.528 0.505 0.326 4.062 5.318 4.108 2.135 2.546 2.469 1.201 1.968 1.99Lithuania 0.425 0.452 0.509 0.044 0.075 0.133 0.235 0.119 0.074 6.83 9.179 11.24 2.473 3.08 3.628 0.326 0.351 0.403Latvia 0.398 0.43 0.516 0.08 0.12 0.196 0.303 0.131 0.079 7.962 10.2 11.3 2.322 2.956 3.559 0.457 0.485 0.547Estonia 0.411 0.491 0.514 0.072 0.128 0.194 0.281 0.148 0.08 7.116 10.68 10.46 2.17 2.901 3.043 0.373 0.474 0.504Iceland 0.15 0.235 0.344 0.063 0.133 0.271 0.323 0.294 0.266 2.482 3.388 3.697 1.813 2.384 2.761 0.685 1.115 1.545
Europe-North 0.407 0.484 0.568 0.19 0.329 0.574 0.814 0.629 0.475 3.924 4.694 4.239 2.349 2.515 2.612 0.77 1.034 1.17
Italy 0.437 0.547 0.634 0.197 0.468 0.932 0.35 0.244 0.18 4.746 7.379 8.47 2.719 3.34 3.599 0.756 1.184 1.574Spain 0.458 0.649 0.938 0.558 1.424 3.452 0.376 0.305 0.285 3.148 4.542 6.016 2.358 3.231 3.964 1.079 1.781 2.893Greece 0.234 0.319 0.4 0.5 1.237 2.736 0.353 0.299 0.255 5.474 8.122 10.14 2.382 2.951 3.272 0.336 0.457 0.582Portugal 0.423 0.479 0.571 0.441 1.032 2.353 0.711 0.469 0.383 4.61 6.797 8.438 2.435 2.954 3.733 0.561 0.825 1.214Serbia 0.335 0.368 0.435 0.18 0.331 0.657 0.302 0.148 0.11 7.708 9.827 12.79 1.983 2.185 2.559 0.418 0.475 0.596Croatia 0.502 0.52 0.541 0.065 0.124 0.231 0.321 0.203 0.149 6.629 9.834 11.6 2.675 3.101 3.663 0.417 0.57 0.728Bosnia and Herzegovina 0.244 0.295 0.308 0.208 0.444 0.872 0.203 0.108 0.068 6.13 9.317 11.54 1.529 1.752 2.036 0.312 0.402 0.484Albania 0.142 0.178 0.27 0.122 0.267 0.651 0.562 0.193 0.168 3.539 5.313 7.864 1.145 1.608 2.324 0.345 0.441 0.692Macedonia, TFYR 0.172 0.195 0.205 0.117 0.258 0.539 0.261 0.105 0.054 5.631 9.169 12.15 1.646 1.901 2.151 0.258 0.332 0.422Slovenia 0.637 0.81 0.934 0.077 0.184 0.344 0.383 0.352 0.283 4.204 7.534 8.463 2.556 3.658 4.497 0.4 0.644 0.803Montenegro 0.199 0.203 0.209 0.3 0.583 1.05 0.309 0.112 0.066 1.826 2.351 2.435 0.499 0.588 0.705 3.4 4.477 5.464Malta 0.252 0.492 0.665 0.114 0.34 0.663 0.637 0.876 0.731 3.421 6.171 6.485 1.854 2.773 3.403 0.563 1.155 1.523
Europe-South 0.41 0.527 0.667 0.335 0.829 1.888 0.381 0.273 0.226 4.522 6.725 8.25 2.434 3.072 3.543 0.757 1.188 1.734
Germany 0.518 0.667 0.734 0.139 0.302 0.485 0.412 0.365 0.26 5.189 6.949 6.12 2.747 3.386 3.543 0.543 0.765 0.838France 0.426 0.494 0.552 0.194 0.405 0.671 0.512 0.364 0.257 2.918 3.746 3.282 2.482 2.807 2.959 1.183 1.693 1.939Netherlands 0.347 0.534 0.639 0.078 0.185 0.312 0.588 0.58 0.417 3.037 4.294 4.082 2.48 3.152 3.14 0.909 1.483 1.781Belgium 0.46 0.541 0.609 0.287 0.608 1.038 0.605 0.457 0.331 3.676 4.81 4.399 2.594 3.001 3.103 1.03 1.507 1.779Austria 0.411 0.503 0.579 0.079 0.173 0.343 0.203 0.158 0.125 4.919 6.754 7.417 2.367 3.013 3.386 0.39 0.554 0.703Switzerland 0.325 0.517 0.694 0.11 0.283 0.55 0.428 0.456 0.391 3.191 4.723 5.023 2.105 2.909 3.258 0.975 1.63 2.154Luxembourg 0.419 0.544 0.604 0.207 0.463 0.859 0.366 0.303 0.22 3.15 4.047 4.345 2.11 2.362 2.213 0.613 0.861 1.044
Europe-West 0.457 0.575 0.644 0.157 0.338 0.566 0.463 0.385 0.278 4.067 5.371 4.794 2.584 3.105 3.244 0.825 1.219 1.428
Base Case: Countries in Year 2060
Descending Population Sequence
VOL2_15 Forecast Tables rev.indd 252 21/08/2009 09:13

253Forecast Tables
Patterns of Potential Human Progress Multination Regional Analysis Measures of Poverty, Health, Education, Infrastructure, and Governance
Health EducationWater Safety Sanitation Literacy
No Improvement No Improvement Percent of Pop 15 and Older
2010 2035 2060 % Chg % An Chg 2010 2035 2060 % Chg % An Chg 2010 2035 2060 % Chg % An Chg
World 15.25 10.69 6.665 -56.3% -1.6% 36.78 23.73 13.98 -62.0% -1.9% 83.36 92.39 97.45 16.9% 0.3%
Africa 35.82 27.28 16.83 -53.0% -1.5% 52.66 42.59 31.45 -40.3% -1.0% 66.53 85.72 95.61 43.7% 0.7%Americas 4.669 2.35 1.12 -76.0% -2.8% 12.07 6.487 3.348 -72.3% -2.5% 95.25 98.99 99.86 4.8% 0.1%Asia with Oceania 14.95 8.341 4.152 -72.2% -2.5% 44.31 24.43 10.19 -77.0% -2.9% 81.91 92.09 97.41 18.9% 0.3%Europe 2.191 0.728 0.241 -89.0% -4.3% 3.85 1.068 0.486 -87.4% -4.1% 99.37 99.93 100 0.6% 0.0%World 15.25 10.69 6.665 -56.3% -1.6% 36.78 23.73 13.98 -62.0% -1.9% 83.36 92.39 97.45 16.9% 0.3%
Africa-Eastern 46.88 34.02 17.41 -62.9% -2.0% 62.09 49.03 31.49 -49.3% -1.3% 66.6 88.46 96.92 45.5% 0.8%Africa-Middle 46.29 36.8 24.63 -46.8% -1.3% 65.63 56.33 43.63 -33.5% -0.8% 65.98 84.36 96.3 46.0% 0.8%Africa-Northern 11.58 7.223 3.787 -67.3% -2.2% 27.77 19.84 12.77 -54.0% -1.5% 71.32 89.95 98.76 38.5% 0.7%Africa-Southern 10.01 4.089 0.899 -91.0% -4.7% 30.16 12.63 3.088 -89.8% -4.5% 88.78 97.74 99.97 12.6% 0.2%Africa-Western 41.15 29.03 18.91 -54.0% -1.5% 58.47 44.94 35.24 -39.7% -1.0% 59.16 79.55 92.04 55.6% 0.9%Africa 35.82 27.28 16.83 -53.0% -1.5% 52.66 42.59 31.45 -40.3% -1.0% 66.53 85.72 95.61 43.7% 0.7%
America-Caribbean 14.74 12.45 9.403 -36.2% -0.9% 23.61 23.02 21.06 -10.8% -0.2% 86.92 92.98 97.44 12.1% 0.2%America-Central 9.423 6.226 3.342 -64.5% -2.1% 24.89 19.38 12.43 -50.1% -1.4% 83.08 93.55 99.51 19.8% 0.4%America-North 0.619 0.331 0.122 -80.3% -3.2% 4.07 1.731 0.511 -87.4% -4.1% 98.34 99.56 100 1.7% 0.0%America-South 7.75 3.081 1.079 -86.1% -3.9% 18.6 8.421 3.396 -81.7% -3.3% 93.91 99.65 100 6.5% 0.1%Americas 4.669 2.35 1.12 -76.0% -2.8% 12.07 6.487 3.348 -72.3% -2.5% 95.25 98.99 99.86 4.8% 0.1%
Asia-East 15.04 3.599 0.743 -95.1% -5.8% 41.56 14.31 3.155 -92.4% -5.0% 94.31 98.93 99.93 6.0% 0.1%Asia-South Central 15.12 11.67 6.387 -57.8% -1.7% 55.91 35.4 14.87 -73.4% -2.6% 65.95 84.33 94.68 43.6% 0.7%Asia-South East 16.61 10.91 5.288 -68.2% -2.3% 31.3 22.57 13.33 -57.4% -1.7% 93.36 98.79 99.87 7.0% 0.1%Asia-West 9.103 5.147 2.386 -73.8% -2.6% 14.94 9.702 5.217 -65.1% -2.1% 84.7 93.48 99.11 17.0% 0.3%Oceania 13 10.41 6.346 -51.2% -1.4% 12.7 12.49 10.62 -16.4% -0.4% 91.71 94.91 97.75 6.6% 0.1%Asia with Oceania 14.95 8.341 4.152 -72.2% -2.5% 44.31 24.43 10.19 -77.0% -2.9% 81.91 92.09 97.41 18.9% 0.3%
Europe-East 4.585 1.515 0.477 -89.6% -4.4% 7.288 1.889 0.741 -89.8% -4.5% 99.64 100 100 0.4% 0.0%Europe-North 0.127 0.044 0.021 -83.5% -3.5% 1.852 0.657 0.401 -78.3% -3.0% 100 100 100 0.0% 0.0%Europe-South 1.163 0.545 0.234 -79.9% -3.2% 2.726 1.204 0.56 -79.5% -3.1% 98.27 99.73 99.99 1.8% 0.0%Europe-West 0.05 0.019 0.014 -72.0% -2.5% 0.755 0.217 0.159 -78.9% -3.1% 100 100 100 0.0% 0.0%Europe 2.191 0.728 0.241 -89.0% -4.3% 3.85 1.068 0.486 -87.4% -4.1% 99.37 99.93 100 0.6% 0.0%
Base Case
Source: International Futures Version 6.12, Mar 2009
VOL2_15 Forecast Tables rev.indd 253 21/08/2009 09:13

Patterns of Potential Hum
an Progress Volume 2: Enhancing Global Education
254
Patterns of Potential Human Progress Multination Regional Analysis Measures of Poverty, Health, Education, Infrastructure, and Governance
Health EducationWater Safety Sanitation Literacy
No Improvement No Improvement Percent of Pop 15 and Older
2010 2035 2060 % Chg % An Chg 2010 2035 2060 % Chg % An Chg 2010 2035 2060 % Chg % An Chg
AFRICAEthiopia 74.73 53.78 29.2 -60.9% -1.9% 84.88 66.88 46.17 -45.6% -1.2% 40.56 70.26 90.85 124.0% 1.6%
Uganda 38.45 31.98 15.46 -59.8% -1.8% 52.97 45.8 29.07 -45.1% -1.2% 77.6 97.49 100 28.9% 0.5%
Tanzania, United Rep. of 34.68 22.21 6.672 -80.8% -3.2% 49.23 36.2 14.73 -70.1% -2.4% 84.23 100 100 18.7% 0.3%
Kenya 35.64 22.87 9.568 -73.2% -2.6% 53.87 42.05 24.11 -55.2% -1.6% 79.84 95.36 100 25.3% 0.5%
Madagascar 52.06 41.73 30.11 -42.2% -1.1% 66.61 58.18 49.42 -25.8% -0.6% 73.78 96.23 100 35.5% 0.6%
Mozambique 52.98 30.86 4.971 -90.6% -4.6% 64.7 45.33 11.38 -82.4% -3.4% 49.72 78.87 94.99 91.0% 1.3%
Malawi 25.94 19.92 14.09 -45.7% -1.2% 37.06 26.19 21.42 -42.2% -1.1% 79.66 100 100 25.5% 0.5%
Zambia 40.53 32.83 19.03 -53.0% -1.5% 44.57 41.64 30.23 -32.2% -0.8% 82.68 91.43 99.44 20.3% 0.4%
Burundi 21.48 21.3 17.52 -18.4% -0.4% 62.86 51.35 35.76 -43.1% -1.1% 68.01 99.01 100 47.0% 0.8%
Rwanda 26.03 22.06 16.08 -38.2% -1.0% 57.47 49.27 42.76 -25.6% -0.6% 70.35 100 100 42.1% 0.7%
Somalia 65 46.47 1.416 -97.8% -7.4% 70.95 41.14 1.583 -97.8% -7.3% 51.08 75.58 96.28 88.5% 1.3%
Zimbabwe 17.9 13.24 9.548 -46.7% -1.2% 43.86 31.6 25.74 -41.3% -1.1% 94.13 100 100 6.2% 0.1%
Eritrea 38.8 33.8 28.54 -26.4% -0.6% 88.7 78.3 65.51 -26.1% -0.6% 51.91 72.67 88.89 71.2% 1.1%
Mauritius 0 0 0 6.072 3.494 1.119 -81.6% -3.3% 88.99 97.14 100 12.4% 0.2%
Comoros 15.08 17.52 14.31 -5.1% -0.1% 66.89 62.58 51.99 -22.3% -0.5% 75.36 87.71 100 32.7% 0.6%
Djibouti 23.95 16.07 6.354 -73.5% -2.6% 18.07 16.5 8.403 -53.5% -1.5% 54.17 69.93 87.77 62.0% 1.0%
Africa-Eastern 46.88 34.02 17.41 -62.9% -2.0% 62.09 49.03 31.49 -49.3% -1.3% 66.6 88.46 96.92 45.5% 0.8%
Congo; Dem. Rep. of 51.93 42.14 27.59 -46.9% -1.3% 67.93 60.63 46.6 -31.4% -0.8% 68.93 84.61 99.23 44.0% 0.7%
Angola 44.13 28.75 16.22 -63.2% -2.0% 62.23 42.36 28.42 -54.3% -1.6% 70.39 100 100 42.1% 0.7%
Cameroon 31.75 22.75 13.56 -57.3% -1.7% 45.71 37.36 28.12 -38.5% -1.0% 69.78 80.68 90.44 29.6% 0.5%
Chad 55.58 44.85 32.86 -40.9% -1.0% 87.28 73.86 58.51 -33.0% -0.8% 29.62 63.53 80.48 171.7% 2.0%
Central African Republic 25.58 26.48 23.84 -6.8% -0.1% 72 67.55 60.39 -16.1% -0.4% 49.92 66.54 80.12 60.5% 1.0%
Congo, Rep. of 39.05 27.63 17.83 -54.3% -1.6% 70.03 57.8 44.51 -36.4% -0.9% 85.69 97.74 100 16.7% 0.3%
Gabon 9.704 5.665 3.044 -68.6% -2.3% 59.37 51.78 41.37 -30.3% -0.7% 85.06 93.25 100 17.6% 0.3%
Equatorial Guinea 51.26 23.72 10.87 -78.8% -3.1% 38.15 19.29 12.52 -67.2% -2.2% 87.46 100 100 14.3% 0.3%
São Tomé and Príncipe 20.62 15.68 10.2 -50.5% -1.4% 73.25 55.08 36.35 -50.4% -1.4% 89.26 100 100 12.0% 0.2%
Africa-Middle 46.29 36.8 24.63 -46.8% -1.3% 65.63 56.33 43.63 -33.5% -0.8% 65.98 84.36 96.3 46.0% 0.8%
Egypt 2.255 1.951 0.684 -69.7% -2.4% 25.52 12.44 2.961 -88.4% -4.2% 74.95 93.98 100 33.4% 0.6%
Sudan 26.79 16.12 8.57 -68.0% -2.3% 62.64 49.69 36.15 -42.3% -1.1% 66.69 84.5 98.17 47.2% 0.8%
Algeria 10.8 5.691 3.65 -66.2% -2.1% 5.856 4.431 4.53 -22.6% -0.5% 76.54 90.89 99.07 29.4% 0.5%
Morocco 16.78 10.43 4.583 -72.7% -2.6% 24 17.23 9.389 -60.9% -1.9% 56.4 85.49 95.67 69.6% 1.1%
Tunisia 5.638 2.226 0.445 -92.1% -5.0% 12.27 5.352 1.128 -90.8% -4.7% 79.29 90.63 98.59 24.3% 0.4%
Libyan Arab Jamahiriya 21.71 6.905 3.076 -85.8% -3.8% 2.453 1.593 1.555 -36.6% -0.9% 87.16 95.14 100 14.7% 0.3%
Africa-Northern 11.58 7.223 3.787 -67.3% -2.2% 27.77 19.84 12.77 -54.0% -1.5% 71.32 89.95 98.76 38.5% 0.7%
Base Case: Countries in Year 2060
Descending Population Sequence
VOL2_15 Forecast Tables rev.indd 254 21/08/2009 09:14

255Forecast Tables
Patterns of Potential Human Progress Multination Regional Analysis Measures of Poverty, Health, Education, Infrastructure, and Governance
Health EducationWater Safety Sanitation Literacy
No Improvement No Improvement Percent of Pop 15 and Older
2010 2035 2060 % Chg % An Chg 2010 2035 2060 % Chg % An Chg 2010 2035 2060 % Chg % An Chg
AFRICA continuedSouth Africa 9.24 3.388 0.695 -92.5% -5.0% 26.95 10.52 2.377 -91.2% -4.7% 89.33 97.96 100 11.9% 0.2%
Namibia 9.925 4.867 0.7 -92.9% -5.2% 53.55 23.34 2.883 -94.6% -5.7% 88.53 98.29 100 13.0% 0.2%
Lesotho 19.93 12.89 4.081 -79.5% -3.1% 57.81 38.04 15.03 -74.0% -2.7% 85.11 99.57 100 17.5% 0.3%
Botswana 3.896 0.753 0.345 -91.1% -4.7% 45.57 8.568 2.508 -94.5% -5.6% 83.14 94.15 100 20.3% 0.4%
Swaziland 35.23 17.42 3.63 -89.7% -4.4% 49.84 30.97 8.699 -82.5% -3.4% 81.42 91.7 98.96 21.5% 0.4%
Africa-Southern 10.01 4.089 0.899 -91.0% -4.7% 30.16 12.63 3.088 -89.8% -4.5% 88.78 97.74 99.97 12.6% 0.2%
Nigeria 47.94 30.57 19.15 -60.1% -1.8% 49.55 33.51 27.87 -43.8% -1.1% 74.02 87.38 95.18 28.6% 0.5%
Niger 52.2 41.24 28.65 -45.1% -1.2% 85.81 76.42 64.61 -24.7% -0.6% 23.38 59.16 82.84 254.3% 2.6%
Côte d’Ivoire 16.36 15.28 10.75 -34.3% -0.8% 61.29 50.7 34.34 -44.0% -1.2% 50.82 77.91 94.55 86.0% 1.2%
Ghana 23.61 18.87 14.2 -39.9% -1.0% 77.39 61.69 47.76 -38.3% -1.0% 65.95 78.73 91.34 38.5% 0.7%
Burkina Faso 38.5 31.18 16.62 -56.8% -1.7% 84.85 67.87 39.25 -53.7% -1.5% 27.52 66.93 88.48 221.5% 2.4%
Mali 45.65 30.7 18.37 -59.8% -1.8% 49.65 38.31 31.3 -37.0% -0.9% 33.63 68.1 89.49 166.1% 2.0%
Senegal 23.36 18.11 11.1 -52.5% -1.5% 42.61 37.35 27.68 -35.0% -0.9% 44.74 72.58 90.83 103.0% 1.4%
Guinea 47.46 35.9 20.97 -55.8% -1.6% 79.4 67.82 51.5 -35.1% -0.9% 33.94 73.48 89.42 163.5% 2.0%
Benin 31.16 23.09 14.69 -52.9% -1.5% 64.24 52.36 43.01 -33.0% -0.8% 43.63 73.84 89.92 106.1% 1.5%
Togo 45.77 37.49 29.58 -35.4% -0.9% 61.56 55 51.04 -17.1% -0.4% 60.15 78.16 90.27 50.1% 0.8%
Sierra Leone 41.75 34.69 19.35 -53.7% -1.5% 60.08 56.51 39.55 -34.2% -0.8% 37.38 57.1 77.35 106.9% 1.5%
Liberia 38.38 37.42 36.79 -4.1% -0.1% 65.43 43.27 21.96 -66.4% -2.2% 54.39 67.95 82.11 51.0% 0.8%
Mauritania 43.88 30.64 19.41 -55.8% -1.6% 62.26 48.48 36.44 -41.5% -1.1% 57.94 93.14 100 72.6% 1.1%
Guinea-Bissau 39.42 33.19 29.73 -24.6% -0.6% 62.77 54.82 55.81 -11.1% -0.2% 73.24 100 100 36.5% 0.6%
Gambia 16.84 13.59 10.63 -36.9% -0.9% 41.02 34 29.08 -29.1% -0.7% 31.48 74.23 84.34 167.9% 2.0%
Cape Verde 18.1 10.98 2.276 -87.4% -4.1% 51.33 35.01 8.368 -83.7% -3.6% 88.7 100 100 12.7% 0.2%
Africa-Western 41.15 29.03 18.91 -54.0% -1.5% 58.47 44.94 35.24 -39.7% -1.0% 59.16 79.55 92.04 55.6% 0.9%
Base Case: Countries in Year 2060
Descending Population Sequence
VOL2_15 Forecast Tables rev.indd 255 21/08/2009 09:14

Patterns of Potential Hum
an Progress Volume 2: Enhancing Global Education
256
Patterns of Potential Human Progress Multination Regional Analysis Measures of Poverty, Health, Education, Infrastructure, and Governance
Health EducationWater Safety Sanitation Literacy
No Improvement No Improvement Percent of Pop 15 and Older
2010 2035 2060 % Chg % An Chg 2010 2035 2060 % Chg % An Chg 2010 2035 2060 % Chg % An Chg
AMERICASHaiti 45.11 37.63 26.51 -41.2% -1.1% 70.26 65.45 57.21 -18.6% -0.4% 60.82 77.91 92.4 51.9% 0.8%
Dominican Republic 4.533 2.433 0.759 -83.3% -3.5% 19.53 10.37 3.257 -83.3% -3.5% 90.73 100 100 10.2% 0.2%
Cuba 7.454 2.009 0.138 -98.1% -7.7% 1.966 0.824 0.063 -96.8% -6.6% 100 100 100 0.0% 0.0%
Puerto Rico 1.347 0.271 0.182 -86.5% -3.9% 3.044 0.545 0.379 -87.5% -4.1% 94.65 98.03 100 5.7% 0.1%
Jamaica 6.513 4.884 3.192 -51.0% -1.4% 18.99 16.22 13.63 -28.2% -0.7% 87.07 94.37 100 14.9% 0.3%
Trinidad and Tobago 5.826 0.953 0.382 -93.4% -5.3% 0 0 0 99.71 100 100 0.3% 0.0%
Bahamas 2.459 1.033 0.397 -83.9% -3.6% 0 0 0 95.35 99.22 100 4.9% 0.1%
Barbados 0 0 0 0 0 0 100 100 100 0.0% 0.0%
St. Vincent & the Grenadines 7.946 3.46 0.778 -90.2% -4.5% 17.38 7.98 1.735 -90.0% -4.5% 88.47 96.69 100 13.0% 0.2%
Grenada 4.645 2.691 0.786 -83.1% -3.5% 4.627 5.841 2.692 -41.8% -1.1% 90.21 99.63 100 10.9% 0.2%
St. Lucia 2.218 1.615 0.52 -76.6% -2.9% 10.64 7.679 2.308 -78.3% -3.0% 92.12 98.36 100 8.6% 0.2%
America-Caribbean 14.74 12.45 9.403 -36.2% -0.9% 23.61 23.02 21.06 -10.8% -0.2% 86.92 92.98 97.44 12.1% 0.2%
Guatemala 5.217 5.112 3.349 -35.8% -0.9% 14.04 15.07 11.95 -14.9% -0.3% 75.96 91.25 99.79 31.4% 0.5%
Honduras 11.32 8.077 4.647 -58.9% -1.8% 28.72 25.13 16.92 -41.1% -1.1% 85.16 95.6 100 17.4% 0.3%
El Salvador 13.96 7.803 2.562 -81.6% -3.3% 34.59 24.73 10.81 -68.7% -2.3% 81.98 93.73 100 22.0% 0.4%
Nicaragua 18.75 11.85 6.4 -65.9% -2.1% 49.65 37.3 24.67 -50.3% -1.4% 80.98 90.13 96.57 19.3% 0.4%
Costa Rica 2.317 0.641 0.237 -89.8% -4.5% 6.911 2.265 0.73 -89.4% -4.4% 97.76 100 100 2.3% 0.0%
Panama 7.185 2.024 0.461 -93.6% -5.3% 21.74 7.602 1.78 -91.8% -4.9% 94.11 98.41 100 6.3% 0.1%
Belize 7.715 3.123 0.534 -93.1% -5.2% 47.58 23.99 3.64 -92.3% -5.0% 78.82 91.5 98.59 25.1% 0.4%
America-Central 9.423 6.226 3.342 -64.5% -2.1% 24.89 19.38 12.43 -50.1% -1.4% 83.08 93.55 99.51 19.8% 0.4%
United States of America 0 0 0 0 0 0 100 100 100 0.0% 0.0%
Mexico 2.577 1.371 0.527 -79.5% -3.1% 16.95 7.169 2.219 -86.9% -4.0% 93.1 98.17 100 7.4% 0.1%
Canada 0 0 0 0 0 0 100 100 100 0.0% 0.0%
America-North 0.619 0.331 0.122 -80.3% -3.2% 4.07 1.731 0.511 -87.4% -4.1% 98.34 99.56 100 1.7% 0.0%
Brazil 7.827 2.69 0.648 -91.7% -4.9% 20.39 7.84 2.104 -89.7% -4.4% 92.66 100 100 7.9% 0.2%
Colombia 5.627 2.496 0.619 -89.0% -4.3% 11.37 5.612 1.565 -86.2% -3.9% 95.04 100 100 5.2% 0.1%
Argentina 3.304 1.099 0.303 -90.8% -4.7% 7.63 2.9 0.865 -88.7% -4.3% 98.39 100 100 1.6% 0.0%
Venezuela, RB 12.09 3.975 1.636 -86.5% -3.9% 23.54 8.768 4.373 -81.4% -3.3% 95.27 100 100 5.0% 0.1%
Peru 14.47 6.615 2.375 -83.6% -3.5% 32.43 17.62 7.949 -75.5% -2.8% 89.48 95.45 100 11.8% 0.2%
Chile 3.794 0.826 0.48 -87.3% -4.1% 6.831 1.502 0.931 -86.4% -3.9% 97.73 100 100 2.3% 0.0%
Ecuador 5.461 4.996 4.6 -15.8% -0.3% 9.995 11.1 12.42 24.3% 0.4% 94.95 100 100 5.3% 0.1%
Bolivia 11.45 5.182 1.927 -83.2% -3.5% 45.29 24.91 9.974 -78.0% -3.0% 92.55 100 100 8.0% 0.2%
Paraguay 12.06 8.433 4.697 -61.1% -1.9% 19.72 19.91 15.98 -19.0% -0.4% 96.27 100 100 3.9% 0.1%
Uruguay 0 0 0 0 0 0 99.19 100 100 0.8% 0.0%
Guyana 15.79 9.035 3.881 -75.4% -2.8% 28.72 20.92 13.1 -54.4% -1.6% 98.69 100 100 1.3% 0.0%
Suriname 6.896 3.495 1.151 -83.3% -3.5% 6.293 7.451 7.872 25.1% 0.4% 90.53 97.35 100 10.5% 0.2%
America-South 7.75 3.081 1.079 -86.1% -3.9% 18.6 8.421 3.396 -81.7% -3.3% 93.91 99.65 100 6.5% 0.1%
Base Case: Countries in Year 2060
Descending Population Sequence
VOL2_15 Forecast Tables rev.indd 256 21/08/2009 09:14

257Forecast Tables
Patterns of Potential Human Progress Multination Regional Analysis Measures of Poverty, Health, Education, Infrastructure, and Governance
Health EducationWater Safety Sanitation Literacy
No Improvement No Improvement Percent of Pop 15 and Older
2010 2035 2060 % Chg % An Chg 2010 2035 2060 % Chg % An Chg 2010 2035 2060 % Chg % An Chg
ASIA WITH OCEANIAChina 17.36 4.071 0.804 -95.4% -6.0% 47.93 16.02 3.253 -93.2% -5.2% 93.73 98.98 100 6.7% 0.1%
Japan 0 0 0 0 0 0 100 100 100 0.0% 0.0%
Korea, Rep. of 5.568 1.203 0.737 -86.8% -4.0% 2.758 0.676 0.498 -81.9% -3.4% 100 100 100 0.0% 0.0%
Taiwan 1.819 0.388 0.245 -86.5% -3.9% 4.119 0.744 0.44 -89.3% -4.4% 98.57 100 100 1.5% 0.0%
Korea, Dem. Rep. of 0 0 0 36.86 25.99 18.31 -50.3% -1.4% 77.03 86.43 94.53 22.7% 0.4%
Hong Kong 0.566 0.301 0.247 -56.4% -1.6% 1.244 0.638 0.597 -52.0% -1.5% 100 100 100 0.0% 0.0%
Mongolia 32.11 15.08 4.277 -86.7% -4.0% 32.86 15.63 5.084 -84.5% -3.7% 100 100 100 0.0% 0.0%
Asia-East 15.04 3.599 0.743 -95.1% -5.8% 41.56 14.31 3.155 -92.4% -5.0% 94.31 98.93 99.93 6.0% 0.1%
India 13.7 9.107 2.324 -83.0% -3.5% 62.4 36.3 8.418 -86.5% -3.9% 67.23 85.88 95.75 42.4% 0.7%
Pakistan 9.637 10.41 7.781 -19.3% -0.4% 39.29 30.65 19.05 -51.5% -1.4% 52.06 77.67 92.55 77.8% 1.2%
Bangladesh 25.59 21.59 13.85 -45.9% -1.2% 58.06 44.56 29.16 -49.8% -1.4% 56.39 81.46 93.43 65.7% 1.0%
Afghanistan 59.55 49.92 38.54 -35.3% -0.9% 65.95 60.32 54.41 -17.5% -0.4% 28.63 59.66 83.83 192.8% 2.2%
Iran, Islamic Rep. of 3.943 1.352 0.883 -77.6% -2.9% 13.28 5.377 3.125 -76.5% -2.9% 85.86 93.86 99.59 16.0% 0.3%
Nepal 11.28 14.09 13.26 17.6% 0.3% 63.87 55.96 45.81 -28.3% -0.7% 56.01 77.01 92.25 64.7% 1.0%
Uzbekistan 16.05 10.06 6.22 -61.2% -1.9% 29.53 20.39 13.54 -54.1% -1.5% 97.38 100 100 2.7% 0.1%
Sri Lanka 20.44 13.77 4.556 -77.7% -3.0% 10.04 11.55 8.364 -16.7% -0.4% 93.56 98.83 100 6.9% 0.1%
Kazakhstan 10.49 1.827 0.866 -91.7% -4.9% 20.26 3.29 1.609 -92.1% -4.9% 100 100 100 0.0% 0.0%
Tajikistan 38.43 26.76 14.74 -61.6% -1.9% 46.93 38.85 27.7 -41.0% -1.0% 99.94 100 100 0.1% 0.0%
Turkmenistan 23.88 8.423 4.718 -80.2% -3.2% 33.53 15.03 9.422 -71.9% -2.5% 99.8 100 100 0.2% 0.0%
Kyrgyzstan 21.31 14.32 9.721 -54.4% -1.6% 38.62 27.87 20.36 -47.3% -1.3% 99.63 100 100 0.4% 0.0%
Bhutan 33.28 14.24 2.549 -92.3% -5.0% 28.49 18.86 5.406 -81.0% -3.3% 54.31 75.86 91.25 68.0% 1.0%
Maldives 15.36 4.249 0.714 -95.4% -6.0% 32.38 6.095 1.25 -96.1% -6.3% 98.08 100 100 2.0% 0.0%
Asia-South Central 15.12 11.67 6.387 -57.8% -1.7% 55.91 35.4 14.87 -73.4% -2.6% 65.95 84.33 94.68 43.6% 0.7%
Indonesia 20.78 12.53 6.284 -69.8% -2.4% 41.21 26.98 15.61 -62.1% -1.9% 93.21 100 100 7.3% 0.1%
Philippines 13.19 8.587 3.974 -69.9% -2.4% 26.4 20.67 12.02 -54.5% -1.6% 93.55 96.81 100 6.9% 0.1%
Vietnam 13.93 8.673 3.459 -75.2% -2.7% 35.86 24.61 12.2 -66.0% -2.1% 95.34 100 100 4.9% 0.1%
Thailand 1.665 2.048 0.928 -44.3% -1.2% 2.574 6.434 8.342 224.1% 2.4% 95.16 100 100 5.1% 0.1%
Myanmar 21.46 17.81 12.27 -42.8% -1.1% 21.68 17.09 14.7 -32.2% -0.8% 95.65 100 100 4.5% 0.1%
Malaysia 0.845 0.463 0.298 -64.7% -2.1% 5.409 2.706 1.505 -72.2% -2.5% 93.23 98.72 100 7.3% 0.1%
Cambodia 56.08 37.22 14.94 -73.4% -2.6% 79.82 59.31 29.95 -62.5% -1.9% 76.63 88.97 99.15 29.4% 0.5%
Lao PDR 45.83 26.48 5.413 -88.2% -4.2% 67.51 48.52 15.56 -77.0% -2.9% 74.72 87.6 95.8 28.2% 0.5%
Singapore 0 0 0 0 0 0 95.53 99.76 100 4.7% 0.1%
Timor-Leste 41.14 32.53 13.71 -66.7% -2.2% 65.52 56.33 29.36 -55.2% -1.6% 73.9 82.92 92.78 25.5% 0.5%
Brunei Darussalam 0.373 0.157 0.168 -55.0% -1.6% 0.659 0.232 0.28 -57.5% -1.7% 94.66 97.82 100 5.6% 0.1%
Asia-South East 16.61 10.91 5.288 -68.2% -2.3% 31.3 22.57 13.33 -57.4% -1.7% 93.36 98.79 99.87 7.0% 0.1%
Base Case: Countries in Year 2060
Descending Population Sequence
VOL2_15 Forecast Tables rev.indd 257 21/08/2009 09:15

Patterns of Potential Hum
an Progress Volume 2: Enhancing Global Education
258
Patterns of Potential Human Progress Multination Regional Analysis Measures of Poverty, Health, Education, Infrastructure, and Governance
Health EducationWater Safety Sanitation Literacy
No Improvement No Improvement Percent of Pop 15 and Older
2010 2035 2060 % Chg % An Chg 2010 2035 2060 % Chg % An Chg 2010 2035 2060 % Chg % An Chg
ASIA WITH OCEANIA continuedTurkey 3.083 1.062 0.236 -92.3% -5.0% 8.786 2.865 0.571 -93.5% -5.3% 89.45 95.41 100 11.8% 0.2%
Yemen 30.01 18.09 8.598 -71.3% -2.5% 52.11 34.28 18.72 -64.1% -2.0% 59.54 84.71 96.93 62.8% 1.0%
Iraq 15.55 6.156 1.774 -88.6% -4.2% 18.92 11.32 4.09 -78.4% -3.0% 78.47 92.65 99.54 26.9% 0.5%
Saudi Arabia 6.128 1.814 0.527 -91.4% -4.8% 3.262 1.312 0.573 -82.4% -3.4% 84.05 91.82 98.86 17.6% 0.3%
Syria 6.718 5.57 2.952 -56.1% -1.6% 10.06 10.46 6.496 -35.4% -0.9% 84.19 92.88 98.72 17.3% 0.3%
Israel 0 0 0 2.828 0.544 0.34 -88.0% -4.1% 96.47 100 100 3.7% 0.1%
Azerbaijan 19.56 8.103 3.757 -80.8% -3.2% 38.47 16.07 8.207 -78.7% -3.0% 100 100 100 0.0% 0.0%
Jordan 2.086 0.82 0.153 -92.7% -5.1% 4.842 1.813 0.266 -94.5% -5.6% 93.56 100 100 6.9% 0.1%
Palestine 6.609 3.685 1.61 -75.6% -2.8% 25.41 15.51 7.22 -71.6% -2.5% 95.68 100 100 4.5% 0.1%
United Arab Emirates 0 0 0 1.042 0.279 0.284 -72.7% -2.6% 100 100 100 0.0% 0.0%
Oman 15.46 6.608 2.167 -86.0% -3.9% 8.36 3.565 1.758 -79.0% -3.1% 84.31 96.33 100 18.6% 0.3%
Kuwait 0.505 0.11 0.113 -77.6% -2.9% 0.979 0.158 0.173 -82.3% -3.4% 95.48 100 100 4.7% 0.1%
Lebanon 0 0 0 1.534 1.109 0.48 -68.7% -2.3% 81.54 91.43 98.69 21.0% 0.4%
Georgia 16.11 10.02 5.418 -66.4% -2.2% 6.871 8.364 7.706 12.2% 0.2% 79.26 97.8 100 26.2% 0.5%
Armenia 7.503 3.042 0.921 -87.7% -4.1% 17.29 7.7 2.12 -87.7% -4.1% 99.66 100 100 0.3% 0.0%
Bahrain 0.607 0.271 0.144 -76.3% -2.8% 1.207 0.483 0.27 -77.6% -3.0% 88.8 95.36 100 12.6% 0.2%
Qatar 0 0 0 0 0 0 89.72 93.73 98.73 10.0% 0.2%
Cyprus 0 0 0 0 0 0 97.71 99.23 100 2.3% 0.0%
Asia-West 9.103 5.147 2.386 -73.8% -2.6% 14.94 9.702 5.217 -65.1% -2.1% 84.7 93.48 99.11 17.0% 0.3%
Australia 0 0 0 0 0 0 100 100 100 0.0% 0.0%
Papua New Guniea 57.01 38.71 21.26 -62.7% -2.0% 53.43 44.47 34.33 -35.7% -0.9% 60.24 80.46 92.65 53.8% 0.9%
New Zealand 1.097 0.456 0.289 -73.7% -2.6% 2.413 0.905 0.567 -76.5% -2.9% 100 100 100 0.0% 0.0%
Solomon Islands 29.35 25.68 19.09 -35.0% -0.9% 67.16 59.08 46.81 -30.3% -0.7% 70.47 79.11 88.79 26.0% 0.5%
Fiji 47.72 26.69 6.482 -86.4% -3.9% 24.19 14.93 5.039 -79.2% -3.1% 97.31 100 100 2.8% 0.1%
Vanuatu 35.86 19.62 6.736 -81.2% -3.3% 46.84 30.81 12.66 -73.0% -2.6% 79.83 91.22 98.83 23.8% 0.4%
Micronesia 6.166 5.244 1.889 -69.4% -2.3% 61.56 47.8 15.41 -75.0% -2.7% 84.46 90.28 96.64 14.4% 0.3%
Tonga 0 0 0 5.521 9.646 7.762 40.6% 0.7% 100 100 100 0.0% 0.0%
Samoa 10.96 6.393 2.06 -81.2% -3.3% 0 0 0 100 100 100 0.0% 0.0%
Oceania 13 10.41 6.346 -51.2% -1.4% 12.7 12.49 10.62 -16.4% -0.4% 91.71 94.91 97.75 6.6% 0.1%
Base Case: Countries in Year 2060
Descending Population Sequence
VOL2_15 Forecast Tables rev.indd 258 21/08/2009 09:15

259Forecast Tables
Patterns of Potential Human Progress Multination Regional Analysis Measures of Poverty, Health, Education, Infrastructure, and Governance
Health EducationWater Safety Sanitation Literacy
No Improvement No Improvement Percent of Pop 15 and Older
2010 2035 2060 % Chg % An Chg 2010 2035 2060 % Chg % An Chg 2010 2035 2060 % Chg % An Chg
EUROPERussian Federation 2.262 0.56 0.304 -86.6% -3.9% 8.828 1.535 0.702 -92.0% -4.9% 99.69 100 100 0.3% 0.0%
Ukraine 3.294 1.159 0.265 -92.0% -4.9% 3.387 1.201 0.265 -92.2% -5.0% 100 100 100 0.0% 0.0%
Poland 1.572 0.419 0.173 -89.0% -4.3% 5.698 1.268 0.409 -92.8% -5.1% 99.74 100 100 0.3% 0.0%
Romania 35.8 12.49 2.996 -91.6% -4.8% 10.05 4.304 1.619 -83.9% -3.6% 98.19 100 100 1.8% 0.0%
Czech Republic 0 0 0 1.548 0.565 0.214 -86.2% -3.9% 100 100 100 0.0% 0.0%
Belarus 0 0 0 12 3.575 0.913 -92.4% -5.0% 100 100 100 0.0% 0.0%
Hungary 0.866 0.36 0.167 -80.7% -3.2% 4.096 1.397 0.536 -86.9% -4.0% 99.68 100 100 0.3% 0.0%
Bulgaria 0.898 0.525 0.159 -82.3% -3.4% 0.94 0.635 0.203 -78.4% -3.0% 98.79 100 100 1.2% 0.0%
Slovakia 0 0 0 0.867 0.522 0.273 -68.5% -2.3% 100 100 100 0.0% 0.0%
Moldova, Rep. of 7.579 5.791 2.631 -65.3% -2.1% 28.85 19.43 8.369 -71.0% -2.4% 99.76 100 100 0.2% 0.0%
Europe-East 4.585 1.515 0.477 -89.6% -4.4% 7.288 1.889 0.741 -89.8% -4.5% 99.64 100 100 0.4% 0.0%
United Kingdom 0 0 0 1.746 0.713 0.475 -72.8% -2.6% 100 100 100 0.0% 0.0%
Sweden 0 0 0 0 0 0 100 100 100 0.0% 0.0%
Denmark 0 0 0 1.543 0.65 0.385 -75.0% -2.7% 100 100 100 0.0% 0.0%
Ireland 0.442 0.224 0.195 -55.9% -1.6% 1.016 0.479 0.414 -59.3% -1.8% 100 100 100 0.0% 0.0%
Norway 0 0 0 0.518 0.324 0.246 -52.5% -1.5% 100 100 100 0.0% 0.0%
Finland 0 0 0 0 0 0 100 100 100 0.0% 0.0%
Lithuania 2.549 0.875 0.289 -88.7% -4.3% 5.752 1.791 0.591 -89.7% -4.4% 100 100 100 0.0% 0.0%
Latvia 0.848 0.304 0.169 -80.1% -3.2% 16 3.336 1.127 -93.0% -5.2% 100 100 100 0.0% 0.0%
Estonia 0 0 0 2.116 0.616 0.448 -78.8% -3.1% 100 100 100 0.0% 0.0%
Iceland 0 0 0 0 0 0 100 100 100 0.0% 0.0%
Europe-North 0.127 0.044 0.021 -83.5% -3.5% 1.852 0.657 0.401 -78.3% -3.0% 100 100 100 0.0% 0.0%
Italy 0.917 0.361 0.147 -84.0% -3.6% 2.667 0.899 0.352 -86.8% -4.0% 99.91 100 100 0.1% 0.0%
Spain 0 0 0 0 0 0 98.27 100 100 1.8% 0.0%
Greece 0.928 0.353 0.207 -77.7% -3.0% 2.121 0.816 0.484 -77.2% -2.9% 97.57 100 100 2.5% 0.0%
Portugal 1.946 0.632 0.21 -89.2% -4.4% 4.759 1.47 0.483 -89.9% -4.5% 95.29 99.72 100 4.9% 0.1%
Serbia 5.576 2.312 0.549 -90.2% -4.5% 10.48 4.569 1.063 -89.9% -4.5% 89.92 95.6 99.82 11.0% 0.2%
Croatia 0 0 0 0 0 0 99.58 100 100 0.4% 0.0%
Bosnia and Herzegovina 3.558 3.388 2.258 -36.5% -0.9% 6.237 6.803 6.009 -3.7% -0.1% 97.63 100 100 2.4% 0.0%
Albania 3.886 2.544 1.011 -74.0% -2.7% 8.252 5.341 2.284 -72.3% -2.5% 100 100 100 0.0% 0.0%
Macedonia, TFYR 6.767 3.705 1.727 -74.5% -2.7% 15.38 8.488 4.284 -72.1% -2.5% 99.03 100 100 1.0% 0.0%
Slovenia 1.324 0.303 0.162 -87.8% -4.1% 2.983 0.563 0.292 -90.2% -4.5% 100 100 100 0.0% 0.0%
Montenegro 5.719 2.557 0.734 -87.2% -4.0% 10.94 5.52 2.006 -81.7% -3.3% 88.27 94.92 99.65 12.9% 0.2%
Malta 0 0 0 3.256 0.965 0.401 -87.7% -4.1% 92.36 96.66 100 8.3% 0.2%
Europe-South 1.163 0.545 0.234 -79.9% -3.2% 2.726 1.204 0.56 -79.5% -3.1% 98.27 99.73 99.99 1.8% 0.0%
Germany 0 0 0 0 0 0 100 100 100 0.0% 0.0%
France 0 0 0 1.956 0.513 0.352 -82.0% -3.4% 100 100 100 0.0% 0.0%
Netherlands 0 0 0 0 0 0 100 100 100 0.0% 0.0%
Belgium 0.877 0.326 0.23 -73.8% -2.6% 1.942 0.696 0.523 -73.1% -2.6% 100 100 100 0.0% 0.0%
Austria 0 0 0 0 0 0 100 100 100 0.0% 0.0%
Switzerland 0 0 0 0 0 0 100 100 100 0.0% 0.0%
Luxembourg 0 0 0 0.297 0.202 0.175 -41.1% -1.1% 100 100 100 0.0% 0.0%
Europe-West 0.05 0.019 0.014 -72.0% -2.5% 0.755 0.217 0.159 -78.9% -3.1% 100 100 100 0.0% 0.0%
Base Case: Countries in Year 2060
Descending Population Sequence
VOL2_15 Forecast Tables rev.indd 259 21/08/2009 09:15

Patterns of Potential Hum
an Progress Volume 2: Enhancing Global Education
260
Patterns of Potential Human Progress Multination Regional Analysis Measures of Poverty, Health, Education, Infrastructure, and Governance
Base Case
Source: International Futures Version 6.12, March 2009
EducationYears of Education, Adult Males 25+ Years of Education, Adult Females 25+ Primary Education Enrollment Rate, Net
Years Years Percent
2010 2035 2060 % Chg % An Chg 2010 2035 2060 % Chg % An Chg 2010 2035 2060 % Chg % An Chg
World 7.168 8.622 10.19 42.2% 0.7% 5.723 7.542 9.555 67.0% 1.0% 88.8 95.94 98.26 10.7% 0.2%
Africa 4.47 5.866 7.564 69.2% 1.1% 3.161 4.863 6.942 119.6% 1.6% 73.11 86.01 94.54 29.3% 0.5%Americas 8.794 10.62 12.4 41.0% 0.7% 8.72 11.01 13.05 49.7% 0.8% 95.53 99.49 99.83 4.5% 0.1%Asia with Oceania 6.929 8.526 10.31 48.8% 0.8% 4.94 6.985 9.318 88.6% 1.3% 89.5 97.95 99.36 11.0% 0.2%Europe 10.15 12.69 14.82 46.0% 0.8% 9.845 12.31 14.65 48.8% 0.8% 97.88 99.99 99.98 2.1% 0.0%World 7.168 8.622 10.19 42.2% 0.7% 5.723 7.542 9.555 67.0% 1.0% 88.8 95.94 98.26 10.7% 0.2%
Africa-Eastern 3.221 4.743 6.702 108.1% 1.5% 2.262 4.214 6.672 195.0% 2.2% 76.49 89.51 96.59 26.3% 0.5%Africa-Middle 4.756 5.489 6.974 46.6% 0.8% 2.871 3.674 5.202 81.2% 1.2% 57.05 74 85.86 50.5% 0.8%Africa-Northern 6.289 8.399 10.3 63.8% 1.0% 4.518 7.312 9.891 118.9% 1.6% 86.85 95.01 99.37 14.4% 0.3%Africa-Southern 8.082 10.85 13.52 67.3% 1.0% 7.569 10.04 12.59 66.3% 1.0% 88.61 99.82 99.99 12.8% 0.2%Africa-Western 3.747 5.278 7.061 88.4% 1.3% 2.474 4.164 6.403 158.8% 1.9% 63.9 81.37 94.71 48.2% 0.8%Africa 4.47 5.866 7.564 69.2% 1.1% 3.161 4.863 6.942 119.6% 1.6% 73.11 86.01 94.54 29.3% 0.5%
America-Caribbean 6.225 7.482 9.015 44.8% 0.7% 6.592 8.039 9.822 49.0% 0.8% 84.31 93.03 96.28 14.2% 0.3%America-Central 5.163 7.058 9.008 74.5% 1.1% 5.03 7.412 9.776 94.4% 1.3% 92.23 97.63 99.87 8.3% 0.2%America-North 11.35 12.7 14.11 24.3% 0.4% 11.26 13.05 14.72 30.7% 0.5% 96.63 99.94 99.99 3.5% 0.1%America-South 6.541 9.116 11.36 73.7% 1.1% 6.452 9.522 12.03 86.5% 1.3% 95.76 99.86 99.98 4.4% 0.1%Americas 8.794 10.62 12.4 41.0% 0.7% 8.72 11.01 13.05 49.7% 0.8% 95.53 99.49 99.83 4.5% 0.1%
Asia-East 7.785 9.329 11.13 43.0% 0.7% 5.831 8.062 10.52 80.4% 1.2% 90.71 99.91 99.99 10.2% 0.2%Asia-South Central 6.286 7.805 9.607 52.8% 0.9% 3.702 5.468 7.817 111.2% 1.5% 86.55 95.99 98.66 14.0% 0.3%Asia-South East 6.32 8.461 10.34 63.6% 1.0% 5.577 8.211 10.51 88.5% 1.3% 95.46 98.93 99.94 4.7% 0.1%Asia-West 6.952 8.881 10.91 56.9% 0.9% 5.745 8.271 10.88 89.4% 1.3% 87.87 99.14 99.98 13.8% 0.3%Oceania 9.808 11.53 12.82 30.7% 0.5% 9.284 11.42 13.23 42.5% 0.7% 90.19 94.5 99.09 9.9% 0.2%Asia with Oceania 6.929 8.526 10.31 48.8% 0.8% 4.94 6.985 9.318 88.6% 1.3% 89.5 97.95 99.36 11.0% 0.2%
Europe-East 10.83 13.29 15.26 40.9% 0.7% 10.97 13.04 14.99 36.6% 0.6% 95.88 100 99.97 4.3% 0.1%Europe-North 10.63 13.22 15.11 42.1% 0.7% 10.4 13.21 15.45 48.6% 0.8% 99.1 99.99 99.99 0.9% 0.0%Europe-South 8.368 11.12 13.46 60.9% 1.0% 7.685 10.7 13.44 74.9% 1.1% 98.87 99.96 99.96 1.1% 0.0%Europe-West 10.3 12.82 15.12 46.8% 0.8% 9.533 12.06 14.69 54.1% 0.9% 99.55 100 100 0.5% 0.0%Europe 10.15 12.69 14.82 46.0% 0.8% 9.845 12.31 14.65 48.8% 0.8% 97.88 99.99 99.98 2.1% 0.0%
VOL2_15 Forecast Tables rev.indd 260 21/08/2009 09:15

261Forecast Tables
Patterns of Potential Human Progress Multination Regional Analysis Measures of Poverty, Health, Education, Infrastructure, and Governance
Base Case: Countries in Year 2060
Descending Population Sequence
EducationYears of Education, Adult Males 25+ Years of Education, Adult Females 25+ Primary Education Enrollment Rate, Net
Years Years Percent
2010 2035 2060 % Chg % An Chg 2010 2035 2060 % Chg % An Chg 2010 2035 2060 % Chg % An Chg
AFRICAEthiopia 1.845 2.596 4.608 149.8% 1.8% 0.64 1.918 4.583 616.1% 4.0% 60.96 83.44 95.62 56.9% 0.9%
Uganda 3.598 5.484 7.666 113.1% 1.5% 3.654 6.101 8.916 144.0% 1.8% 89.23 97.02 100 12.1% 0.2%
Tanzania, United Rep. of 3.297 6.075 8.847 168.3% 2.0% 2.029 5.1 8.299 309.0% 2.9% 91.59 94.79 99.99 9.2% 0.2%
Kenya 5.476 7.43 9.662 76.4% 1.1% 4.275 6.883 9.675 126.3% 1.6% 77.98 94.92 100 28.2% 0.5%
Madagascar 2.634 3.626 5.26 99.7% 1.4% 1.491 2.956 4.892 228.1% 2.4% 92.96 97.32 98.46 5.9% 0.1%
Mozambique 1.897 3.84 6.821 259.6% 2.6% 1.342 3.004 6.343 372.7% 3.2% 77.9 90.62 100 28.4% 0.5%
Malawi 3.608 5.965 7.362 104.0% 1.4% 2.521 4.597 6.203 146.1% 1.8% 91.16 95.46 96.04 5.4% 0.1%
Zambia 5.859 6.352 7.653 30.6% 0.5% 5.284 7.288 9.421 78.3% 1.2% 90.16 92.37 99.87 10.8% 0.2%
Burundi 1.99 3.171 5.772 190.1% 2.2% 0.79 1.865 4.634 486.6% 3.6% 58.35 76.62 96.25 65.0% 1.0%
Rwanda 2.614 3.469 5.354 104.8% 1.4% 1.948 2.828 4.897 151.4% 1.9% 82.18 93.56 96.77 17.8% 0.3%
Somalia 0.255 1.351 2.282 794.9% 4.5% 0.226 0.934 1.796 694.7% 4.2% 10.39 35.73 51.34 394.1% 3.2%
Zimbabwe 6.806 8.893 10.3 51.3% 0.8% 5.306 8.456 10.61 100.0% 1.4% 88.69 95.18 96.96 9.3% 0.2%
Eritrea 2.391 3.59 4.992 108.8% 1.5% 1.072 2.187 3.83 257.3% 2.6% 52.19 73.53 96.71 85.3% 1.2%
Mauritius 6.565 8.513 11.03 68.0% 1.0% 5.671 7.902 10.67 88.2% 1.3% 97.15 99.97 100 2.9% 0.1%
Comoros 3.142 3.504 5.044 60.5% 1.0% 2.058 3.017 5.473 165.9% 2.0% 56.39 77.32 98.44 74.6% 1.1%
Djibouti 4.09 4.508 6.441 57.5% 0.9% 3.005 3.704 6.274 108.8% 1.5% 39 74.78 98.85 153.5% 1.9%
Africa-Eastern 3.221 4.743 6.702 108.1% 1.5% 2.262 4.214 6.672 195.0% 2.2% 76.49 89.51 96.59 26.3% 0.5%
Congo; Dem. Rep. of 4.806 5.651 7.024 46.2% 0.8% 2.174 2.958 4.359 100.5% 1.4% 56.26 67.63 81.49 44.8% 0.7%
Angola 5.49 5.913 7.827 42.6% 0.7% 4.665 5.781 8.054 72.6% 1.1% 38.08 88.29 98.59 158.9% 1.9%
Cameroon 4.414 5.467 7.117 61.2% 1.0% 3.138 4.47 6.379 103.3% 1.4% 74.03 84.31 97.1 31.2% 0.5%
Chad 3.659 4.127 5.505 50.5% 0.8% 2.513 3.07 4.641 84.7% 1.2% 62.63 74.45 83.29 33.0% 0.6%
Central African Republic 3.072 3.487 4.631 50.7% 0.8% 1.492 2.088 3.689 147.3% 1.8% 47.6 67.32 78.9 65.8% 1.0%
Congo, Rep. of 5.217 5.618 7.256 39.1% 0.7% 4.99 5.755 7.787 56.1% 0.9% 56.48 80.56 93.04 64.7% 1.0%
Gabon 8.071 8.29 10.54 30.6% 0.5% 7.367 7.92 10.44 41.7% 0.7% 88.52 99.05 100 13.0% 0.2%
Equatorial Guinea 9.219 8.473 10.19 10.5% 0.2% 8.838 9.157 11.48 29.9% 0.5% 89.67 99.5 100 11.5% 0.2%
São Tomé and Príncipe 3.501 3.698 4.787 36.7% 0.6% 2.62 3.607 5.168 97.3% 1.4% 95.05 97.49 98.09 3.2% 0.1%
Africa-Middle 4.756 5.489 6.974 46.6% 0.8% 2.871 3.674 5.202 81.2% 1.2% 57.05 74 85.86 50.5% 0.8%
Egypt 7.887 11.24 13.28 68.4% 1.0% 5.349 9.217 11.94 123.2% 1.6% 97.48 99.98 100 2.6% 0.1%
Sudan 2.941 4.39 6.664 126.6% 1.6% 1.884 3.778 6.807 261.3% 2.6% 45.06 79.47 97.8 117.0% 1.6%
Algeria 6.988 8.96 10.85 55.3% 0.9% 5.165 8.21 10.62 105.6% 1.5% 99.77 100 99.77 0.0% 0.0%
Morocco 5.557 6.41 8.029 44.5% 0.7% 4.63 5.951 8.186 76.8% 1.1% 91.73 98.58 99.95 9.0% 0.2%
Tunisia 6.243 8.705 10.99 76.0% 1.1% 4.705 8.384 11.38 141.9% 1.8% 99.98 100 99.98 0.0% 0.0%
Libyan Arab Jamahiriya 7.019 8.774 10.46 49.0% 0.8% 6.119 10.02 12.54 104.9% 1.4% 97.75 99.98 99.91 2.2% 0.0%
Africa-Northern 6.289 8.399 10.3 63.8% 1.0% 4.518 7.312 9.891 118.9% 1.6% 86.85 95.01 99.37 14.4% 0.3%
VOL2_15 Forecast Tables rev.indd 261 21/08/2009 09:15

Patterns of Potential Hum
an Progress Volume 2: Enhancing Global Education
262
Patterns of Potential Human Progress Multination Regional Analysis Measures of Poverty, Health, Education, Infrastructure, and Governance
Base Case: Countries in Year 2060
Descending Population Sequence
EducationYears of Education, Adult Males 25+ Years of Education, Adult Females 25+ Primary Education Enrollment Rate, Net
Years Years Percent
2010 2035 2060 % Chg % An Chg 2010 2035 2060 % Chg % An Chg 2010 2035 2060 % Chg % An Chg
AFRICA continuedSouth Africa 8.428 11.41 14.13 67.7% 1.0% 7.824 10.41 12.96 65.6% 1.0% 89.3 99.98 100 12.0% 0.2%
Namibia 6.109 7.38 9.975 63.3% 1.0% 5.317 7.316 10.06 89.2% 1.3% 87.41 99.93 100 14.4% 0.3%
Lesotho 4.413 6.49 9.011 104.2% 1.4% 5.573 7.409 10.07 80.7% 1.2% 78.19 96.22 99.84 27.7% 0.5%
Botswana 6.535 8.797 11.02 68.6% 1.1% 6.228 8.925 11.41 83.2% 1.2% 87.61 100 100 14.1% 0.3%
Swaziland 5.83 7.834 11.02 89.0% 1.3% 6.565 8.071 11.01 67.7% 1.0% 81.05 99.28 100 23.4% 0.4%
Africa-Southern 8.082 10.85 13.52 67.3% 1.0% 7.569 10.04 12.59 66.3% 1.0% 88.61 99.82 99.99 12.8% 0.2%
Nigeria 4.149 6.171 7.84 89.0% 1.3% 2.962 5.091 7.256 145.0% 1.8% 66.76 83.09 93.68 40.3% 0.7%
Niger 1.412 2.314 4.135 192.8% 2.2% 0.731 1.735 4.169 470.3% 3.5% 43.89 68.12 88.96 102.7% 1.4%
Côte d’Ivoire 3.973 5.049 7.648 92.5% 1.3% 2.735 3.623 6.504 137.8% 1.7% 57.91 85.74 100 72.7% 1.1%
Ghana 5.408 6.305 8.041 48.7% 0.8% 3.598 5.458 7.872 118.8% 1.6% 67.07 87.37 96.97 44.6% 0.7%
Burkina Faso 3.045 3.828 6.015 97.5% 1.4% 1.884 2.916 5.751 205.3% 2.3% 46.66 71.45 97.95 109.9% 1.5%
Mali 1.4 2.935 5.164 268.9% 2.6% 0.637 2.405 4.774 649.5% 4.1% 61.02 79.99 99.45 63.0% 1.0%
Senegal 3.029 3.977 6.421 112.0% 1.5% 2.002 3.685 6.594 229.4% 2.4% 71.6 86.84 98.9 38.1% 0.6%
Guinea 3.389 4.989 7.214 112.9% 1.5% 1.943 2.988 5.246 170.0% 2.0% 70 79.29 96.02 37.2% 0.6%
Benin 3.64 5.678 7.587 108.4% 1.5% 1.526 3.21 5.472 258.6% 2.6% 78.65 89.43 98.13 24.8% 0.4%
Togo 4.678 6.22 7.17 53.3% 0.9% 2.092 3.819 5.29 152.9% 1.9% 78.55 85.61 97.36 23.9% 0.4%
Sierra Leone 3.207 4.059 5.7 77.7% 1.2% 1.658 2.523 4.675 182.0% 2.1% 46.97 68.57 94.36 100.9% 1.4%
Liberia 3.295 4.393 5.347 62.3% 1.0% 1.568 2.781 4.067 159.4% 1.9% 42.32 58.54 78.01 84.3% 1.2%
Mauritania 2.582 3.797 5.956 130.7% 1.7% 1.462 2.736 5.215 256.7% 2.6% 77.96 87.78 94.42 21.1% 0.4%
Guinea-Bissau 1.585 3.175 4.516 184.9% 2.1% 0.239 1.184 2.53 958.6% 4.8% 47.25 64.89 83.25 76.2% 1.1%
Gambia 3.561 5.121 6.315 77.3% 1.2% 1.743 3.464 4.928 182.7% 2.1% 61.8 73.87 86.39 39.8% 0.7%
Cape Verde 5.252 7.426 9.55 81.8% 1.2% 4.309 7.209 9.659 124.2% 1.6% 91.83 100 99.39 8.2% 0.2%
Africa-Western 3.747 5.278 7.061 88.4% 1.3% 2.474 4.164 6.403 158.8% 1.9% 63.9 81.37 94.71 48.2% 0.8%
VOL2_15 Forecast Tables rev.indd 262 21/08/2009 09:16

263Forecast Tables
Patterns of Potential Human Progress Multination Regional Analysis Measures of Poverty, Health, Education, Infrastructure, and Governance
Base Case: Countries in Year 2060
Descending Population Sequence
EducationYears of Education, Adult Males 25+ Years of Education, Adult Females 25+ Primary Education Enrollment Rate, Net
Years Years Percent
2010 2035 2060 % Chg % An Chg 2010 2035 2060 % Chg % An Chg 2010 2035 2060 % Chg % An Chg
AMERICASHaiti 2.641 3.032 4.361 65.1% 1.0% 2.784 3.186 4.745 70.4% 1.1% 55.93 76.82 89.08 59.3% 0.9%
Dominican Republic 5.429 7.105 9.606 76.9% 1.1% 6.116 8.408 11.3 84.8% 1.2% 83.13 99.11 100 20.3% 0.4%
Cuba 8.492 10.8 12.7 49.6% 0.8% 8.621 10.97 13.09 51.8% 0.8% 99.32 100 99.83 0.5% 0.0%
Puerto Rico 9.238 11.75 13.96 51.1% 0.8% 9.973 12.69 15.27 53.1% 0.9% 99.21 99.96 100 0.8% 0.0%
Jamaica 5.393 7.554 9.405 74.4% 1.1% 6.38 8.481 10.16 59.2% 0.9% 91.91 99.85 100 8.8% 0.2%
Trinidad and Tobago 8.351 10.64 13.36 60.0% 0.9% 8.423 10.46 12.93 53.5% 0.9% 92.83 100 99.84 7.6% 0.1%
Bahamas 9.149 10.63 12.51 36.7% 0.6% 8.632 10.88 13.08 51.5% 0.8% 93.51 99.99 99.9 6.8% 0.1%
Barbados 8.687 10.69 12.56 44.6% 0.7% 7.931 10.22 12.35 55.7% 0.9% 98.21 100 99.99 1.8% 0.0%
St. Vincent & the Grenadines 7.508 10.14 12.16 62.0% 1.0% 6.635 9.72 12.19 83.7% 1.2% 93.23 99.99 99.99 7.3% 0.1%
Grenada 7.632 9.191 11.38 49.1% 0.8% 6.908 9.189 11.64 68.5% 1.0% 85.96 100 99.99 16.3% 0.3%
St. Lucia 8.052 10.45 12.27 52.4% 0.8% 7.355 10.37 12.55 70.6% 1.1% 99.33 100 99.99 0.7% 0.0%
America-Caribbean 6.225 7.482 9.015 44.8% 0.7% 6.592 8.039 9.822 49.0% 0.8% 84.31 93.03 96.28 14.2% 0.3%
Guatemala 4.396 6.665 8.693 97.7% 1.4% 3.371 5.916 8.567 154.1% 1.9% 91.5 96.66 99.99 9.3% 0.2%
Honduras 4.667 6.664 8.36 79.1% 1.2% 4.894 8.485 10.95 123.7% 1.6% 92.29 97.36 99.56 7.9% 0.2%
El Salvador 5.164 6.857 9.299 80.1% 1.2% 5.209 7.102 9.761 87.4% 1.3% 93.3 99.18 100 7.2% 0.1%
Nicaragua 4.62 6.372 8.259 78.8% 1.2% 5.583 7.782 9.94 78.0% 1.2% 86.49 95.97 99.61 15.2% 0.3%
Costa Rica 6.59 8.56 10.71 62.5% 1.0% 6.615 9.175 11.5 73.8% 1.1% 94.8 99.93 100 5.5% 0.1%
Panama 8.255 9.805 11.17 35.3% 0.6% 8.641 10.59 12.12 40.3% 0.7% 98.41 99.99 100 1.6% 0.0%
Belize 7.078 8.268 10.22 44.4% 0.7% 6.422 8.463 10.67 66.1% 1.0% 95.58 99.99 99.99 4.6% 0.1%
America-Central 5.163 7.058 9.008 74.5% 1.1% 5.03 7.412 9.776 94.4% 1.3% 92.23 97.63 99.87 8.3% 0.2%
United States of America 12.55 13.79 15.04 19.8% 0.4% 12.61 14.21 15.69 24.4% 0.4% 95.74 99.93 99.99 4.4% 0.1%
Mexico 7.739 9.362 11.12 43.7% 0.7% 7.171 9.46 11.48 60.1% 0.9% 98.53 99.96 100 1.5% 0.0%
Canada 12 13.46 14.72 22.7% 0.4% 12 13.98 15.75 31.3% 0.5% 98.72 99.96 99.99 1.3% 0.0%
America-North 11.35 12.7 14.11 24.3% 0.4% 11.26 13.05 14.72 30.7% 0.5% 96.63 99.94 99.99 3.5% 0.1%
Brazil 5.604 8.382 10.95 95.4% 1.3% 5.486 9.037 12.07 120.0% 1.6% 96.74 99.91 100 3.4% 0.1%
Colombia 5.607 8.109 10.17 81.4% 1.2% 6.021 8.515 10.51 74.6% 1.1% 92.19 99.83 100 8.5% 0.2%
Argentina 9.162 11.21 12.97 41.6% 0.7% 9.451 11.76 13.59 43.8% 0.7% 98.69 99.97 99.99 1.3% 0.0%
Venezuela, RB 6.403 8.82 10.85 69.5% 1.1% 6.376 9.073 11.06 73.5% 1.1% 92.86 99.99 100 7.7% 0.1%
Peru 8.828 11.07 12.79 44.9% 0.7% 7.809 10.68 12.73 63.0% 1.0% 96.46 99.98 100 3.7% 0.1%
Chile 8.827 11.68 14.03 58.9% 0.9% 8.808 11.77 14.23 61.6% 1.0% 91.14 99.99 100 9.7% 0.2%
Ecuador 7.384 9.465 10.82 46.5% 0.8% 7.114 9.139 10.68 50.1% 0.8% 96.22 98.88 99.8 3.7% 0.1%
Bolivia 6.957 9.678 12.08 73.6% 1.1% 6.021 9.252 11.96 98.6% 1.4% 95.39 99.99 99.84 4.7% 0.1%
Paraguay 6.507 9.098 10.84 66.6% 1.0% 6.384 9.625 11.69 83.1% 1.2% 94.71 98.59 99.99 5.6% 0.1%
Uruguay 7.865 10.74 13.04 65.8% 1.0% 8.363 11.17 13.33 59.4% 0.9% 97.77 99.61 100 2.3% 0.0%
Guyana 6.517 8.406 10.55 61.9% 1.0% 6.596 7.953 9.819 48.9% 0.8% 95.15 99.4 98.97 4.0% 0.1%
Suriname 6.883 7.361 9.326 35.5% 0.6% 6.395 8.29 10.76 68.3% 1.0% 94.1 99.95 100 6.3% 0.1%
America-South 6.541 9.116 11.36 73.7% 1.1% 6.452 9.522 12.03 86.5% 1.3% 95.76 99.86 99.98 4.4% 0.1%
VOL2_15 Forecast Tables rev.indd 263 21/08/2009 09:16

Patterns of Potential Hum
an Progress Volume 2: Enhancing Global Education
264
Patterns of Potential Human Progress Multination Regional Analysis Measures of Poverty, Health, Education, Infrastructure, and Governance
Base Case: Countries in Year 2060
Descending Population Sequence
EducationYears of Education, Adult Males 25+ Years of Education, Adult Females 25+ Primary Education Enrollment Rate, Net
Years Years Percent
2010 2035 2060 % Chg % An Chg 2010 2035 2060 % Chg % An Chg 2010 2035 2060 % Chg % An Chg
ASIA WITH OCEANIAChina 7.337 8.924 10.84 47.7% 0.8% 5.231 7.583 10.19 94.8% 1.3% 89.6 99.97 100 11.6% 0.2%
Japan 10.81 12.82 14.39 33.1% 0.6% 10.02 12.23 14.3 42.7% 0.7% 99.67 99.98 100 0.3% 0.0%
Korea, Rep. of 11.99 12.97 14.15 18.0% 0.3% 10.05 11.26 12.7 26.4% 0.5% 98.5 99.92 99.99 1.5% 0.0%
Taiwan 9.969 12.01 13.76 38.0% 0.6% 8.991 11.86 14.29 58.9% 0.9% 98.58 100 100 1.4% 0.0%
Korea, Dem. Rep. of 5.312 6.58 8.059 51.7% 0.8% 4.291 5.847 7.808 82.0% 1.2% 79.02 95.35 99.48 25.9% 0.5%
Hong Kong 10.08 10.4 12.19 20.9% 0.4% 8.984 9.646 11.78 31.1% 0.5% 95.89 100 100 4.3% 0.1%
Mongolia 5.6 9.12 11.44 104.3% 1.4% 4.641 9.51 12.46 168.5% 2.0% 90.42 100 99.99 10.6% 0.2%
Asia-East 7.785 9.329 11.13 43.0% 0.7% 5.831 8.062 10.52 80.4% 1.2% 90.71 99.91 99.99 10.2% 0.2%
India 7.184 9.27 11.58 61.2% 1.0% 4.182 6.255 8.982 114.8% 1.5% 89.49 98.98 100 11.7% 0.2%
Pakistan 3.35 3.323 4.769 42.4% 0.7% 1.377 2.26 4.46 223.9% 2.4% 69.38 87.32 98.69 42.2% 0.7%
Bangladesh 3.565 4.584 6.374 78.8% 1.2% 1.987 4.025 6.327 218.4% 2.3% 89.85 95.14 99.04 10.2% 0.2%
Afghanistan 1.697 2.107 3.186 87.7% 1.3% 0.598 1.098 2.842 375.3% 3.2% 31.95 65.15 81.05 153.7% 1.9%
Iran, Islamic Rep. of 7.391 10.68 12.85 73.9% 1.1% 5.115 8.233 10.95 114.1% 1.5% 97.22 100 100 2.9% 0.1%
Nepal 3.222 3.253 4.862 50.9% 0.8% 1.273 2.159 4.569 258.9% 2.6% 81.63 93.82 100 22.5% 0.4%
Uzbekistan 4.842 7.09 8.872 83.2% 1.2% 3.672 5.809 7.796 112.3% 1.5% 83.27 99.19 99.92 20.0% 0.4%
Sri Lanka 7.391 9.994 12.55 69.8% 1.1% 6.821 9.49 12.42 82.1% 1.2% 99.69 99.99 99.5 -0.2% 0.0%
Kazakhstan 10.03 12.79 14.77 47.3% 0.8% 9.271 12.09 14.41 55.4% 0.9% 95.01 100 100 5.3% 0.1%
Tajikistan 10.78 12.47 13.49 25.1% 0.4% 9.081 10.1 11.25 23.9% 0.4% 98.76 99.85 100 1.3% 0.0%
Turkmenistan 5.136 5.757 7.921 54.2% 0.9% 4.115 4.852 7.219 75.4% 1.1% 80.35 100 99.98 24.4% 0.4%
Kyrgyzstan 4.594 6.999 8.61 87.4% 1.3% 3.518 6.177 8.127 131.0% 1.7% 87.95 98.92 100 13.7% 0.3%
Bhutan 5.407 6.12 8.966 65.8% 1.0% 4.455 5.44 8.546 91.8% 1.3% 75.97 98.86 99.72 31.3% 0.5%
Maldives 5.677 6.83 9.673 70.4% 1.1% 4.691 5.981 8.87 89.1% 1.3% 97.86 100 98.01 0.2% 0.0%
Asia-South Central 6.286 7.805 9.607 52.8% 0.9% 3.702 5.468 7.817 111.2% 1.5% 86.55 95.99 98.66 14.0% 0.3%
Indonesia 6.532 8.842 10.59 62.1% 1.0% 5.314 8.093 10.33 94.4% 1.3% 95.09 99.28 100 5.2% 0.1%
Philippines 7.962 8.986 10.13 27.2% 0.5% 8.364 9.886 11.25 34.5% 0.6% 92.45 97.64 99.93 8.1% 0.2%
Vietnam 4.986 8.247 10.8 116.6% 1.6% 3.891 7.176 10.06 158.5% 1.9% 96.56 99.31 99.86 3.4% 0.1%
Thailand 7 8.686 10.96 56.6% 0.9% 6.624 9.283 12.1 82.7% 1.2% 96.14 99.99 100 4.0% 0.1%
Myanmar 3.246 5.66 7.782 139.7% 1.8% 2.941 5.85 8.557 191.0% 2.2% 98.83 99.54 100 1.2% 0.0%
Malaysia 8.99 10.93 13 44.6% 0.7% 8.202 11.12 13.69 66.9% 1.0% 100 100 100 0.0% 0.0%
Cambodia 3.667 4.6 6.509 77.5% 1.2% 2.574 3.766 6.144 138.7% 1.8% 96.1 96.62 99.74 3.8% 0.1%
Lao PDR 4.427 6.314 8.745 97.5% 1.4% 3.349 5.544 8.336 148.9% 1.8% 86.31 95.56 99.99 15.8% 0.3%
Singapore 9.272 10.97 13.04 40.6% 0.7% 8.137 9.987 12.38 52.1% 0.8% 95.02 99.99 99.84 5.1% 0.1%
Timor-Leste 4.874 6.243 7.748 59.0% 0.9% 3.879 5.711 7.792 100.9% 1.4% 69.13 80.51 97.83 41.5% 0.7%
Brunei Darussalam 10.88 11.82 13.35 22.7% 0.4% 10.56 12.27 14.06 33.1% 0.6% 96.51 100 100 3.6% 0.1%
Asia-South East 6.32 8.461 10.34 63.6% 1.0% 5.577 8.211 10.51 88.5% 1.3% 95.46 98.93 99.94 4.7% 0.1%
VOL2_15 Forecast Tables rev.indd 264 21/08/2009 09:16

265Forecast Tables
Patterns of Potential Human Progress Multination Regional Analysis Measures of Poverty, Health, Education, Infrastructure, and Governance
Base Case: Countries in Year 2060
Descending Population Sequence
EducationYears of Education, Adult Males 25+ Years of Education, Adult Females 25+ Primary Education Enrollment Rate, Net
Years Years Percent
2010 2035 2060 % Chg % An Chg 2010 2035 2060 % Chg % An Chg 2010 2035 2060 % Chg % An Chg
ASIA WITH OCEANIA continuedTurkey 6.002 7.943 9.492 58.1% 0.9% 4.851 7.411 9.579 97.5% 1.4% 93.71 99.98 100 6.7% 0.1%
Yemen 5.012 7.289 9.549 90.5% 1.3% 3.781 6.131 9.681 156.0% 1.9% 78.21 95.72 100 27.9% 0.5%
Iraq 6.19 8.539 10.87 75.6% 1.1% 4.074 6.334 9.143 124.4% 1.6% 90.24 98.82 99.99 10.8% 0.2%
Saudi Arabia 9.158 10.16 12.83 40.1% 0.7% 8.84 11.59 14.5 64.0% 1.0% 63.57 100 100 57.3% 0.9%
Syria 7.73 8.989 10.47 35.4% 0.6% 5.531 7.79 9.894 78.9% 1.2% 97.2 99.99 99.95 2.8% 0.1%
Israel 9.991 12.4 14.34 43.5% 0.7% 9.799 12.43 14.74 50.4% 0.8% 98.81 99.96 100 1.2% 0.0%
Azerbaijan 6.67 9.757 12.3 84.4% 1.2% 5.57 8.469 11.34 103.6% 1.4% 90.01 100 100 11.1% 0.2%
Jordan 10.01 12.83 14.64 46.3% 0.8% 8.173 12.47 14.88 82.1% 1.2% 93.34 99.75 99.81 6.9% 0.1%
Palestine 6.24 9.526 11.93 91.2% 1.3% 5.274 9.317 12.37 134.5% 1.7% 80.09 96.96 99.97 24.8% 0.4%
United Arab Emirates 10.47 12.17 14.98 43.1% 0.7% 10.23 13.8 16.98 66.0% 1.0% 89.89 100 99.77 11.0% 0.2%
Oman 9.136 10.19 11.99 31.2% 0.5% 8.657 10.64 12.88 48.8% 0.8% 79 99.96 100 26.6% 0.5%
Kuwait 7.822 9.229 12.06 54.2% 0.9% 7.857 10.57 13.22 68.3% 1.0% 92.12 99.99 100 8.6% 0.2%
Lebanon 7.916 9.951 12.02 51.8% 0.8% 7.138 9.665 11.98 67.8% 1.0% 84.84 99.98 100 17.9% 0.3%
Georgia 5.862 7.75 9.344 59.4% 0.9% 4.851 6.741 8.419 73.6% 1.1% 95.56 100 100 4.6% 0.1%
Armenia 6.399 9.134 11.23 75.5% 1.1% 5.427 8.072 10.14 86.8% 1.3% 86.52 100 99.96 15.5% 0.3%
Bahrain 10.28 11.51 13.28 29.2% 0.5% 9.875 12.1 14.23 44.1% 0.7% 99.64 100 100 0.4% 0.0%
Qatar 11.57 12.13 14.21 22.8% 0.4% 11.46 14.04 16.54 44.3% 0.7% 98.16 99.98 100 1.9% 0.0%
Cyprus 9.626 11.28 12.81 33.1% 0.6% 9.11 11.25 13.28 45.8% 0.8% 99.95 100 99.96 0.0% 0.0%
Asia-West 6.952 8.881 10.91 56.9% 0.9% 5.745 8.271 10.88 89.4% 1.3% 87.87 99.14 99.98 13.8% 0.3%
Australia 11.65 14.08 15.63 34.2% 0.6% 11.21 14.13 16.26 45.0% 0.7% 98.51 99.97 100 1.5% 0.0%
Papua New Guniea 3.383 4.832 6.564 94.0% 1.3% 2.532 4.115 6.356 151.0% 1.9% 57.9 78.8 96.97 67.5% 1.0%
New Zealand 12.43 14.8 16.5 32.7% 0.6% 12.16 15.21 17.53 44.2% 0.7% 100 99.92 100 0.0% 0.0%
Solomon Islands 4.162 4.841 5.976 43.6% 0.7% 3.127 4.27 5.702 82.3% 1.2% 63.68 76 95.67 50.2% 0.8%
Fiji 6.21 7.795 9.644 55.3% 0.9% 5.345 7.56 9.799 83.3% 1.2% 94.4 98.72 99.99 5.9% 0.1%
Vanuatu 5.703 7.208 9.463 65.9% 1.0% 4.794 6.686 9.2 91.9% 1.3% 96.23 99.51 99.98 3.9% 0.1%
Micronesia 6.818 8.233 9.613 41.0% 0.7% 5.908 7.792 9.884 67.3% 1.0% 84.2 95.34 99.63 18.3% 0.3%
Tonga 6.285 6.995 8.556 36.1% 0.6% 5.428 6.612 8.489 56.4% 0.9% 96.3 99.47 99.9 3.7% 0.1%
Samoa 6.415 7.932 9.931 54.8% 0.9% 5.612 8.076 10.32 83.9% 1.2% 88.82 99.64 100 12.6% 0.2%
Oceania 9.808 11.53 12.82 30.7% 0.5% 9.284 11.42 13.23 42.5% 0.7% 90.19 94.5 99.09 9.9% 0.2%
VOL2_15 Forecast Tables rev.indd 265 21/08/2009 09:16

Patterns of Potential Hum
an Progress Volume 2: Enhancing Global Education
266
Patterns of Potential Human Progress Multination Regional Analysis Measures of Poverty, Health, Education, Infrastructure, and Governance
Base Case: Countries in Year 2060
Descending Population Sequence
EducationYears of Education, Adult Males 25+ Years of Education, Adult Females 25+ Primary Education Enrollment Rate, Net
Years Years Percent
2010 2035 2060 % Chg % An Chg 2010 2035 2060 % Chg % An Chg 2010 2035 2060 % Chg % An Chg
EUROPERussian Federation 10.9 13.25 15.03 37.9% 0.6% 11.45 13.07 14.67 28.1% 0.5% 94.01 100 99.95 6.3% 0.1%
Ukraine 10.9 13.4 15.63 43.4% 0.7% 11.44 13.12 14.86 29.9% 0.5% 97.43 100 100 2.6% 0.1%
Poland 10.77 13.27 15.3 42.1% 0.7% 10.54 13.22 15.6 48.0% 0.8% 99.52 100 99.96 0.4% 0.0%
Romania 10.69 13.27 15.46 44.6% 0.7% 9.821 12.79 15.27 55.5% 0.9% 95.93 100 100 4.2% 0.1%
Czech Republic 11.09 14.2 16.59 49.6% 0.8% 9.576 13.06 15.93 66.4% 1.0% 97.68 100 100 2.4% 0.0%
Belarus 10.75 12.65 14.37 33.7% 0.6% 11.46 13.34 15.16 32.3% 0.6% 96.21 100 100 3.9% 0.1%
Hungary 10.34 13.56 16.07 55.4% 0.9% 9.224 12.84 16 73.5% 1.1% 94.34 100 99.99 6.0% 0.1%
Bulgaria 10.61 13.18 15.14 42.7% 0.7% 10.36 12.42 14.22 37.3% 0.6% 99.59 100 100 0.4% 0.0%
Slovakia 10.93 14.04 16.35 49.6% 0.8% 9.479 13.24 16.34 72.4% 1.1% 98.21 100 100 1.8% 0.0%
Moldova, Rep. of 10.02 11.9 13.53 35.0% 0.6% 9.045 11.41 13.49 49.1% 0.8% 97.63 99.97 99.93 2.4% 0.0%
Europe-East 10.83 13.29 15.26 40.9% 0.7% 10.97 13.04 14.99 36.6% 0.6% 95.88 100 99.97 4.3% 0.1%
United Kingdom 10.28 13.02 14.99 45.8% 0.8% 10.18 13.1 15.39 51.2% 0.8% 99.52 99.98 100 0.5% 0.0%
Sweden 11.84 13.95 15.58 31.6% 0.6% 11.9 14.17 16.08 35.1% 0.6% 98.57 99.99 100 1.5% 0.0%
Denmark 11.55 14.04 15.88 37.5% 0.6% 9.998 12.88 15.2 52.0% 0.8% 98.26 100 100 1.8% 0.0%
Ireland 9.733 11.97 13.55 39.2% 0.7% 9.743 12.02 13.74 41.0% 0.7% 97.86 99.99 99.94 2.1% 0.0%
Norway 12.51 14.47 15.85 26.7% 0.5% 12.07 14.48 16.34 35.4% 0.6% 98.73 100 99.97 1.3% 0.0%
Finland 11.17 13.5 15.36 37.5% 0.6% 10.67 13.27 15.51 45.4% 0.8% 99.56 100 100 0.4% 0.0%
Lithuania 10.3 13.07 15.08 46.4% 0.8% 9.55 12.92 15.67 64.1% 1.0% 96.01 100 99.98 4.1% 0.1%
Latvia 10.46 13.82 16.57 58.4% 0.9% 9.991 13.77 17.06 70.8% 1.1% 98.63 100 99.99 1.4% 0.0%
Estonia 9.792 12.82 15.63 59.6% 0.9% 9.66 12.76 16.07 66.4% 1.0% 98.87 100 99.99 1.1% 0.0%
Iceland 9.967 12.08 13.71 37.6% 0.6% 9.564 12.62 14.98 56.6% 0.9% 98.75 99.96 99.99 1.3% 0.0%
Europe-North 10.63 13.22 15.11 42.1% 0.7% 10.4 13.21 15.45 48.6% 0.8% 99.1 99.99 99.99 0.9% 0.0%
Italy 8.388 11.74 14.65 74.7% 1.1% 7.598 11.06 14.32 88.5% 1.3% 99.93 100 99.99 0.1% 0.0%
Spain 8.482 11.04 13.1 54.4% 0.9% 8.304 10.77 12.94 55.8% 0.9% 99.94 100 100 0.1% 0.0%
Greece 10.36 11.89 13.14 26.8% 0.5% 8.572 11.53 14.07 64.1% 1.0% 99.95 100 100 0.1% 0.0%
Portugal 5.737 8.015 10.26 78.8% 1.2% 5.793 8.945 11.87 104.9% 1.4% 99.7 100 99.99 0.3% 0.0%
Serbia 10.19 12.43 14.47 42.0% 0.7% 8.506 11.44 14.01 64.7% 1.0% 92.82 99.89 99.99 7.7% 0.1%
Croatia 7.909 11.11 13.82 74.7% 1.1% 6.774 10.2 13.3 96.3% 1.4% 95.26 100 99.99 5.0% 0.1%
Bosnia and Herzegovina 6.813 8.255 10.05 47.5% 0.8% 5.989 8.188 10.8 80.3% 1.2% 85.97 98.88 98.94 15.1% 0.3%
Albania 6.878 9.343 11.49 67.1% 1.0% 5.959 8.539 10.99 84.4% 1.2% 96.75 99.73 100 3.4% 0.1%
Macedonia, TFYR 7.751 11.22 13.81 78.2% 1.2% 6.792 10.2 13.06 92.3% 1.3% 95.53 100 99.96 4.6% 0.1%
Slovenia 8.64 12.28 15.39 78.1% 1.2% 7.914 11.6 14.99 89.4% 1.3% 99.5 100 99.97 0.5% 0.0%
Montenegro 7.48 9.934 12.32 64.7% 1.0% 6.65 9.704 12.49 87.8% 1.3% 92.96 99.96 99.65 7.2% 0.1%
Malta 9.469 11.28 13.26 40.0% 0.7% 8.723 10.59 12.83 47.1% 0.8% 95.61 100 99.99 4.6% 0.1%
Europe-South 8.368 11.12 13.46 60.9% 1.0% 7.685 10.7 13.44 74.9% 1.1% 98.87 99.96 99.96 1.1% 0.0%
Germany 10.78 13.01 15.34 42.3% 0.7% 9.843 11.82 14.31 45.4% 0.8% 100 99.99 100 0.0% 0.0%
France 9.587 12.76 15.23 58.9% 0.9% 9.204 12.55 15.43 67.6% 1.0% 99.99 100 100 0.0% 0.0%
Netherlands 10.14 11.83 13.75 35.6% 0.6% 9.419 11.26 13.51 43.4% 0.7% 99.72 100 100 0.3% 0.0%
Belgium 9.779 12.69 14.91 52.5% 0.8% 9.206 12.36 14.95 62.4% 1.0% 99.05 100 100 1.0% 0.0%
Austria 10.53 13.33 15.57 47.9% 0.8% 8.944 11.95 14.77 65.1% 1.0% 100 100 100 0.0% 0.0%
Switzerland 11.7 13.44 15.37 31.4% 0.5% 10.09 11.88 14.17 40.4% 0.7% 90.92 100 99.99 10.0% 0.2%
Luxembourg 11.73 12.85 14.47 23.4% 0.4% 11.37 13.21 15.06 32.5% 0.6% 97.53 99.98 99.94 2.5% 0.0%
Europe-West 10.3 12.82 15.12 46.8% 0.8% 9.533 12.06 14.69 54.1% 0.9% 99.55 100 100 0.5% 0.0%
VOL2_15 Forecast Tables rev.indd 266 21/08/2009 09:16

267Forecast Tables
Patterns of Potential Human Progress Multination Regional Analysis Measures of Poverty, Health, Education, Infrastructure, and Governance
Base Case
Source: International Futures Version 6.12, March 2009
EducationPrimary Education Enrollment Rate, Gross Lower Secondary Enrollment Rate, Gross Upper Secondary Enrollment Rate, Gross
Percent Percent Percent
2010 2035 2060 % Chg % An Chg 2010 2035 2060 % Chg % An Chg 2010 2035 2060 % Chg % An Chg
World 108.4 103.5 101.4 -6.5% -0.1% 84.66 93.46 93.65 10.6% 0.2% 59.46 73.56 82.64 39.0% 0.7%
Africa 99.72 106.4 103.4 3.7% 0.1% 51.62 65.87 80.61 56.2% 0.9% 31.19 42.45 57.81 85.3% 1.2%Americas 113.4 101.6 100.6 -11.3% -0.2% 102.5 106 103.1 0.6% 0.0% 80.81 89.45 95.49 18.2% 0.3%Asia with Oceania 109.8 103.4 100.9 -8.1% -0.2% 85.41 98.88 96.43 12.9% 0.2% 54.24 76.61 88.44 63.1% 1.0%Europe 105.6 100.5 100.1 -5.2% -0.1% 103.2 101.6 101 -2.1% 0.0% 100.7 101.5 102.6 1.9% 0.0%World 108.4 103.5 101.4 -6.5% -0.1% 84.66 93.46 93.65 10.6% 0.2% 59.46 73.56 82.64 39.0% 0.7%
Africa-Eastern 105.2 105 102.2 -2.9% -0.1% 38.57 57.58 83.49 116.5% 1.6% 14.31 30.08 59.42 315.2% 2.9%Africa-Middle 90.82 106.5 106.3 17.0% 0.3% 32.43 49.89 65.86 103.1% 1.4% 17.53 26.53 38.48 119.5% 1.6%Africa-Northern 100.4 103.8 101.5 1.1% 0.0% 88.49 98.94 102.8 16.2% 0.3% 59.76 76.98 85.58 43.2% 0.7%Africa-Southern 107.2 102 100.2 -6.5% -0.1% 94.76 99.33 100.2 5.7% 0.1% 86.71 105.4 109.4 26.2% 0.5%Africa-Western 95.77 110 104.3 8.9% 0.2% 40.15 60.67 74.53 85.6% 1.2% 24.82 37.05 50.16 102.1% 1.4%Africa 99.72 106.4 103.4 3.7% 0.1% 51.62 65.87 80.61 56.2% 0.9% 31.19 42.45 57.81 85.3% 1.2%
America-Caribbean 108.5 110.7 108.7 0.2% 0.0% 82.89 92.86 94.51 14.0% 0.3% 67.23 76.27 79.53 18.3% 0.3%America-Central 113.4 104.1 101 -10.9% -0.2% 74.65 87.57 97.99 31.3% 0.5% 59.55 74.1 92.94 56.1% 0.9%America-North 105.4 100.3 100 -5.1% -0.1% 103.2 101 100.6 -2.5% -0.1% 85.14 95.61 98.75 16.0% 0.3%America-South 123 101.9 100.4 -18.4% -0.4% 106.8 115.2 107.4 0.6% 0.0% 79.57 85.97 93.87 18.0% 0.3%Americas 113.4 101.6 100.6 -11.3% -0.2% 102.5 106 103.1 0.6% 0.0% 80.81 89.45 95.49 18.2% 0.3%
Asia-East 109.9 101.1 100.4 -8.6% -0.2% 99.34 108.9 99.44 0.1% 0.0% 63.07 91.57 101.5 60.9% 1.0%Asia-South Central 110.6 105.6 101.4 -8.3% -0.2% 73.38 92.99 93.26 27.1% 0.5% 43.65 66.69 80.66 84.8% 1.2%Asia-South East 112.1 102.9 100.6 -10.3% -0.2% 83.13 94.4 98.64 18.7% 0.3% 54.57 68.99 83.33 52.7% 0.9%Asia-West 100.6 101.8 100.2 -0.4% 0.0% 83.84 97.2 99.95 19.2% 0.4% 63.63 80.18 91.02 43.0% 0.7%Oceania 96.49 99.48 100.2 3.8% 0.1% 92.36 87.25 91.9 -0.5% 0.0% 106.8 82.63 86.3 -19.2% -0.4%Asia with Oceania 109.8 103.4 100.9 -8.1% -0.2% 85.41 98.88 96.43 12.9% 0.2% 54.24 76.61 88.44 63.1% 1.0%
Europe-East 106.7 101 100.3 -6.0% -0.1% 96.71 102.5 101.4 4.8% 0.1% 96.18 101.4 102.8 6.9% 0.1%Europe-North 105.3 100.2 100.1 -4.9% -0.1% 102.8 99.43 99.99 -2.7% -0.1% 109.1 102.7 103.9 -4.8% -0.1%Europe-South 103.4 100.2 100 -3.3% -0.1% 106.5 99.63 99.66 -6.4% -0.1% 101.1 100.4 102.1 1.0% 0.0%Europe-West 105.8 100.2 100.1 -5.4% -0.1% 110.8 102.9 102 -7.9% -0.2% 102.8 101.5 101.9 -0.9% 0.0%Europe 105.6 100.5 100.1 -5.2% -0.1% 103.2 101.6 101 -2.1% 0.0% 100.7 101.5 102.6 1.9% 0.0%
VOL2_15 Forecast Tables rev.indd 267 21/08/2009 09:17

Patterns of Potential Hum
an Progress Volume 2: Enhancing Global Education
268
Patterns of Potential Human Progress Multination Regional Analysis Measures of Poverty, Health, Education, Infrastructure, and Governance
Base Case: Countries in Year 2060
Descending Population Sequence
EducationPrimary Education Enrollment Rate, Gross Lower Secondary Enrollment Rate, Gross Upper Secondary Enrollment Rate, Gross
Percent Percent Percent
2010 2035 2060 % Chg % An Chg 2010 2035 2060 % Chg % An Chg 2010 2035 2060 % Chg % An Chg
AFRICAEthiopia 87.02 89.13 96.92 11.4% 0.2% 38.49 56.8 80.44 109.0% 1.5% 10.19 32.58 63.05 518.7% 3.7%
Uganda 128.7 123.9 113.1 -12.1% -0.3% 24.69 54.87 94.73 283.7% 2.7% 12.63 33.22 73.09 478.7% 3.6%
Tanzania, United Rep. of 107.6 102.5 100.8 -6.3% -0.1% 12.35 35.33 80.76 553.9% 3.8% 7.002 19.81 54.73 681.6% 4.2%
Kenya 109.2 105.3 100.2 -8.2% -0.2% 92.37 101.7 111.4 20.6% 0.4% 29 41.71 71.49 146.5% 1.8%
Madagascar 144.1 126 110 -23.7% -0.5% 31.45 49.54 63.77 102.8% 1.4% 12.52 23.28 35.85 186.3% 2.1%
Mozambique 106.2 103.7 102.8 -3.2% -0.1% 23.24 53.04 101.7 337.6% 3.0% 7.491 28.4 87.64 1069.9% 5.0%
Malawi 125.3 115.5 108.2 -13.6% -0.3% 40.84 59.25 72.59 77.7% 1.2% 16.15 29.47 44.62 176.3% 2.1%
Zambia 109.4 100.4 103.1 -5.8% -0.1% 50.15 56.43 85.59 70.7% 1.1% 19.92 28.02 54.55 173.8% 2.0%
Burundi 89.55 105.6 104.1 16.2% 0.3% 21.29 38.92 68.47 221.6% 2.4% 9.098 17.66 44.27 386.6% 3.2%
Rwanda 137.2 121.5 107.4 -21.7% -0.5% 21.27 44.84 64.93 205.3% 2.3% 10.8 22.16 39.58 266.5% 2.6%
Somalia 19.51 86.91 75.51 287.0% 2.7% 6.657 23.24 27.37 311.1% 2.9% 5.489 9.484 11.55 110.4% 1.5%
Zimbabwe 103.6 101 98.83 -4.6% -0.1% 61.2 76.6 88.81 45.1% 0.7% 31.95 46.01 62.71 96.3% 1.4%
Eritrea 77.22 125.9 110.1 42.6% 0.7% 48.68 73.05 89.73 84.3% 1.2% 21.45 34.14 49.35 130.1% 1.7%
Mauritius 103.7 100.2 100 -3.6% -0.1% 98.45 100.3 100 1.6% 0.0% 79.73 102 102.2 28.2% 0.5%
Comoros 93.75 114.9 108.4 15.6% 0.3% 44.64 66.12 90.08 101.8% 1.4% 29.03 40.08 62.75 116.2% 1.6%
Djibouti 57.14 109.7 107.7 88.5% 1.3% 31.89 58.5 94.31 195.7% 2.2% 16.52 27.96 62.43 277.9% 2.7%
Africa-Eastern 105.2 105 102.2 -2.9% -0.1% 38.57 57.58 83.49 116.5% 1.6% 14.31 30.08 59.42 315.2% 2.9%
Congo; Dem. Rep. of 67.89 90.6 103.2 52.0% 0.8% 33.03 46.2 65.38 97.9% 1.4% 18.3 23.9 36.06 97.0% 1.4%
Angola 154.1 166.5 122.1 -20.8% -0.5% 27.55 63.69 69.17 151.1% 1.9% 13.67 34.79 46.73 241.8% 2.5%
Cameroon 111.4 113.1 109 -2.2% 0.0% 35.59 51.87 76.77 115.7% 1.5% 21.24 31.86 50.79 139.1% 1.8%
Chad 83.98 101.3 99.48 18.5% 0.3% 21.29 39.59 48.4 127.3% 1.7% 11.78 20.68 27.51 133.5% 1.7%
Central African Republic 66.94 97.8 105.4 57.5% 0.9% 18.28 37.97 55.41 203.1% 2.2% 9.443 17.25 28.6 202.9% 2.2%
Congo, Rep. of 109.6 117.8 112.2 2.4% 0.0% 57.68 73.27 81.37 41.1% 0.7% 23.39 30.27 44.68 91.0% 1.3%
Gabon 148.1 124 100.3 -32.3% -0.8% 65.81 88.51 95.36 44.9% 0.7% 33.54 59.5 75.59 125.4% 1.6%
Equatorial Guinea 133.5 137.5 113 -15.4% -0.3% 47.76 91.07 90.63 89.8% 1.3% 17.27 56.21 61.73 257.4% 2.6%
São Tomé and Príncipe 129.3 118.5 107.9 -16.6% -0.4% 72.29 82.19 91.3 26.3% 0.5% 28.44 31.62 42.13 48.1% 0.8%
Africa-Middle 90.82 106.5 106.3 17.0% 0.3% 32.43 49.89 65.86 103.1% 1.4% 17.53 26.53 38.48 119.5% 1.6%
Egypt 104.1 100.4 100.1 -3.8% -0.1% 99.68 96.84 99.62 -0.1% 0.0% 80.49 98.44 99.18 23.2% 0.4%
Sudan 70.64 112.1 105.5 49.3% 0.8% 50.25 92 102.1 103.2% 1.4% 27.14 58.57 74.13 173.1% 2.0%
Algeria 111.1 100.3 99.88 -10.1% -0.2% 111.5 118.6 115.4 3.5% 0.1% 59.08 66.04 76.07 28.8% 0.5%
Morocco 112.9 104.8 100.3 -11.2% -0.2% 71.77 91.68 101.4 41.3% 0.7% 38.12 54.49 73.51 92.8% 1.3%
Tunisia 110.1 100.1 100.1 -9.1% -0.2% 107.9 107.1 102.6 -4.9% -0.1% 72.07 85 95.92 33.1% 0.6%
Libyan Arab Jamahiriya 102.6 100.3 99.83 -2.7% -0.1% 112.1 97.06 96.62 -13.8% -0.3% 94.41 94.24 95.16 0.8% 0.0%
Africa-Northern 100.4 103.8 101.5 1.1% 0.0% 88.49 98.94 102.8 16.2% 0.3% 59.76 76.98 85.58 43.2% 0.7%
VOL2_15 Forecast Tables rev.indd 268 21/08/2009 09:17

269Forecast Tables
Patterns of Potential Human Progress Multination Regional Analysis Measures of Poverty, Health, Education, Infrastructure, and Governance
Base Case: Countries in Year 2060
Descending Population Sequence
EducationPrimary Education Enrollment Rate, Gross Lower Secondary Enrollment Rate, Gross Upper Secondary Enrollment Rate, Gross
Percent Percent Percent
2010 2035 2060 % Chg % An Chg 2010 2035 2060 % Chg % An Chg 2010 2035 2060 % Chg % An Chg
AFRICA continuedSouth Africa 106.4 101.6 100.1 -5.9% -0.1% 98.22 100.5 100.2 2.0% 0.0% 93.88 113.1 113.3 20.7% 0.4%
Namibia 110.6 101.7 100.1 -9.5% -0.2% 77.85 97.83 103.8 33.3% 0.6% 29.4 48.4 84.43 187.2% 2.1%
Lesotho 117.9 109.7 100.4 -14.8% -0.3% 49.52 74.56 96.46 94.8% 1.3% 27.05 48.73 83.26 207.8% 2.3%
Botswana 112.2 101.4 100.2 -10.7% -0.2% 92.41 105.1 100.7 9.0% 0.2% 59.5 82.72 96.52 62.2% 1.0%
Swaziland 110.6 102.8 100.2 -9.4% -0.2% 60.41 90.74 98.11 62.4% 1.0% 36.67 70.51 92.18 151.4% 1.9%
Africa-Southern 107.2 102 100.2 -6.5% -0.1% 94.76 99.33 100.2 5.7% 0.1% 86.71 105.4 109.4 26.2% 0.5%
Nigeria 103.4 110.8 104.6 1.2% 0.0% 40.7 62.79 67.12 64.9% 1.0% 32.23 46.8 51.25 59.0% 0.9%
Niger 58.35 101.9 101.1 73.3% 1.1% 16.55 39.88 65.32 294.7% 2.8% 5.96 13.35 33.4 460.4% 3.5%
Côte d’Ivoire 82.38 112.5 102 23.8% 0.4% 33.54 57.68 84.49 151.9% 1.9% 15.24 28 55.78 266.0% 2.6%
Ghana 96.15 106.3 102.4 6.5% 0.1% 65.49 78.42 94.9 44.9% 0.7% 23.36 38.68 57.68 146.9% 1.8%
Burkina Faso 68.07 109.6 103.9 52.6% 0.8% 22.79 50.77 82.12 260.3% 2.6% 8.082 18.44 47.34 485.7% 3.6%
Mali 87.12 110.5 105.2 20.8% 0.4% 43.1 64.77 89.84 108.4% 1.5% 16.4 26.87 51.85 216.2% 2.3%
Senegal 87.18 102.3 101.3 16.2% 0.3% 33.62 56.88 85.69 154.9% 1.9% 14.79 27.11 53.2 259.7% 2.6%
Guinea 93.53 103.4 105.8 13.1% 0.2% 43.55 60 81.64 87.5% 1.3% 22.11 33.32 54.61 147.0% 1.8%
Benin 100.8 104.7 102.3 1.5% 0.0% 44.87 59.08 79.77 77.8% 1.2% 21.66 28.51 47.61 119.8% 1.6%
Togo 104.3 110 103.2 -1.1% 0.0% 57 64.31 81.63 43.2% 0.7% 21.65 25.38 37.24 72.0% 1.1%
Sierra Leone 145 153.4 122.9 -15.2% -0.3% 29.32 54.69 80.24 173.7% 2.0% 26.66 35.55 59.38 122.7% 1.6%
Liberia 100.8 122.4 108.2 7.3% 0.1% 37.5 55.09 64.99 73.3% 1.1% 30.43 36.37 41.45 36.2% 0.6%
Mauritania 105.1 107.3 104.3 -0.8% 0.0% 30.9 49.34 66.42 115.0% 1.5% 22.6 35.4 49.5 119.0% 1.6%
Guinea-Bissau 77.28 106.5 105.2 36.1% 0.6% 25.43 46.67 61.93 143.5% 1.8% 12.13 21.36 32.28 166.1% 2.0%
Gambia 82.73 104.5 112.7 36.2% 0.6% 58.93 65.39 85.21 44.6% 0.7% 33.19 42.23 52.97 59.6% 0.9%
Cape Verde 108.1 101.4 99.71 -7.8% -0.2% 92.18 110.9 108 17.2% 0.3% 46.25 63.15 85.27 84.4% 1.2%
Africa-Western 95.77 110 104.3 8.9% 0.2% 40.15 60.67 74.53 85.6% 1.2% 24.82 37.05 50.16 102.1% 1.4%
VOL2_15 Forecast Tables rev.indd 269 21/08/2009 09:17

Patterns of Potential Hum
an Progress Volume 2: Enhancing Global Education
270
Patterns of Potential Human Progress Multination Regional Analysis Measures of Poverty, Health, Education, Infrastructure, and Governance
Base Case: Countries in Year 2060
Descending Population Sequence
EducationPrimary Education Enrollment Rate, Gross Lower Secondary Enrollment Rate, Gross Upper Secondary Enrollment Rate, Gross
Percent Percent Percent
2010 2035 2060 % Chg % An Chg 2010 2035 2060 % Chg % An Chg 2010 2035 2060 % Chg % An Chg
AMERICASHaiti 112.1 127.1 125.5 12.0% 0.2% 44.75 67.29 80.58 80.1% 1.2% 18.36 28.94 39.52 115.3% 1.5%
Dominican Republic 108.7 109.9 100.5 -7.5% -0.2% 80.77 105.2 101.6 25.8% 0.5% 66.87 100.5 105.8 58.2% 0.9%
Cuba 103 100.1 99.82 -3.1% -0.1% 102.4 99.66 99.31 -3.0% -0.1% 89.57 94.46 98.45 9.9% 0.2%
Puerto Rico 123.8 100.1 100 -19.2% -0.4% 105 98.68 100 -4.8% -0.1% 102.4 96.91 100 -2.3% 0.0%
Jamaica 97.98 103.2 100.4 2.5% 0.0% 96.56 115.2 110.8 14.7% 0.3% 75.93 79.19 81.57 7.4% 0.1%
Trinidad and Tobago 106.1 101.5 100.5 -5.3% -0.1% 90.04 110.2 103.9 15.4% 0.3% 79.01 99.55 99.42 25.8% 0.5%
Bahamas 105.1 101.3 100.3 -4.6% -0.1% 96.53 98.42 98.81 2.4% 0.0% 83.5 94.31 97.26 16.5% 0.3%
Barbados 103 100.2 100 -2.9% -0.1% 103.8 97.05 98.8 -4.8% -0.1% 105.8 91.88 96.43 -8.9% -0.2%
St. Vincent & the Grenadines 118.1 110.7 100.5 -14.9% -0.3% 88.07 98.3 100.6 14.2% 0.3% 56.01 86.71 96.99 73.2% 1.1%
Grenada 101 102 100.4 -0.6% 0.0% 105.2 119.1 112 6.5% 0.1% 97.21 110.8 96.52 -0.7% 0.0%
St. Lucia 110.2 100.1 100 -9.3% -0.2% 89.78 89.96 100.5 11.9% 0.2% 77.43 88 99.72 28.8% 0.5%
America-Caribbean 108.5 110.7 108.7 0.2% 0.0% 82.89 92.86 94.51 14.0% 0.3% 67.23 76.27 79.53 18.3% 0.3%
Guatemala 112.3 105.2 101.6 -9.5% -0.2% 58.48 74.18 94.27 61.2% 1.0% 46.08 61.72 90.25 95.9% 1.4%
Honduras 109.9 101.3 100.3 -8.7% -0.2% 71.34 85.22 98.96 38.7% 0.7% 92.52 90.53 102.3 10.6% 0.2%
El Salvador 116.3 105.7 100.7 -13.4% -0.3% 84.66 101.6 101.5 19.9% 0.4% 51.48 76.65 89.63 74.1% 1.1%
Nicaragua 119.8 107.1 101.7 -15.1% -0.3% 78.04 95.85 98.72 26.5% 0.5% 55.74 70.3 83.52 49.8% 0.8%
Costa Rica 112.5 100.5 100 -11.1% -0.2% 97.48 105.2 106.7 9.5% 0.2% 61.78 87.64 101.7 64.6% 1.0%
Panama 111 100.9 100.1 -9.8% -0.2% 89.02 97.85 99.29 11.5% 0.2% 60.3 84.34 98.51 63.4% 1.0%
Belize 114.7 100.3 100.1 -12.7% -0.3% 98.98 102.4 102.8 3.9% 0.1% 57.46 73.11 96.34 67.7% 1.0%
America-Central 113.4 104.1 101 -10.9% -0.2% 74.65 87.57 97.99 31.3% 0.5% 59.55 74.1 92.94 56.1% 0.9%
United States of America 104.6 100.3 100 -4.4% -0.1% 101.7 100.4 100.1 -1.6% 0.0% 88.48 100.1 100.1 13.1% 0.2%
Mexico 108.9 100.2 100 -8.2% -0.2% 108.6 102.9 102.6 -5.5% -0.1% 62.56 81.83 94.35 50.8% 0.8%
Canada 101.6 100.2 100.1 -1.5% 0.0% 99.9 99.52 100.1 0.2% 0.0% 127.4 98.71 100.1 -21.4% -0.5%
America-North 105.4 100.3 100 -5.1% -0.1% 103.2 101 100.6 -2.5% -0.1% 85.14 95.61 98.75 16.0% 0.3%
Brazil 134.1 102.2 100.5 -25.1% -0.6% 117.1 131.4 116.4 -0.6% 0.0% 89.83 88.65 95.39 6.2% 0.1%
Colombia 114.2 102.4 100.2 -12.3% -0.3% 93.37 94.94 97.1 4.0% 0.1% 66.73 77.61 89.94 34.8% 0.6%
Argentina 111.5 100.7 100.1 -10.2% -0.2% 104.9 109 101.2 -3.5% -0.1% 69.74 86.66 97.48 39.8% 0.7%
Venezuela, RB 106.2 100.6 100.1 -5.7% -0.1% 89.73 101.1 100.3 11.8% 0.2% 59.48 75.87 85.16 43.2% 0.7%
Peru 116.3 102 100.1 -13.9% -0.3% 105.7 103.5 102.4 -3.1% -0.1% 76.26 97.44 101.9 33.6% 0.6%
Chile 107.2 100.9 100.1 -6.6% -0.1% 101 101.5 100.1 -0.9% 0.0% 87.46 99.99 104.9 19.9% 0.4%
Ecuador 113.8 102.7 100.9 -11.3% -0.2% 77.3 80.58 88.07 13.9% 0.3% 55.9 57.55 67.82 21.3% 0.4%
Bolivia 111.9 102.6 100.1 -10.5% -0.2% 96.26 103.6 101 4.9% 0.1% 78.9 96.28 98.24 24.5% 0.4%
Paraguay 110.7 103 100.2 -9.5% -0.2% 83.74 89.91 97.78 16.8% 0.3% 56.43 66.66 82.45 46.1% 0.8%
Uruguay 110.8 99.91 100.1 -9.7% -0.2% 104.9 98.86 101.7 -3.1% -0.1% 94.59 99.04 104.1 10.1% 0.2%
Guyana 126.6 114.5 99.99 -21.0% -0.5% 114.8 85.8 98.76 -14.0% -0.3% 68.97 84.84 92.66 34.3% 0.6%
Suriname 120.2 104 100.5 -16.4% -0.4% 97.5 109.8 105.6 8.3% 0.2% 51.66 76.45 92.85 79.7% 1.2%
America-South 123 101.9 100.4 -18.4% -0.4% 106.8 115.2 107.4 0.6% 0.0% 79.57 85.97 93.87 18.0% 0.3%
VOL2_15 Forecast Tables rev.indd 270 21/08/2009 09:17

271Forecast Tables
Patterns of Potential Human Progress Multination Regional Analysis Measures of Poverty, Health, Education, Infrastructure, and Governance
Base Case: Countries in Year 2060
Descending Population Sequence
EducationPrimary Education Enrollment Rate, Gross Lower Secondary Enrollment Rate, Gross Upper Secondary Enrollment Rate, Gross
Percent Percent Percent
2010 2035 2060 % Chg % An Chg 2010 2035 2060 % Chg % An Chg 2010 2035 2060 % Chg % An Chg
ASIA WITH OCEANIAChina 111.1 101.1 100.5 -9.5% -0.2% 99.59 110.5 99.4 -0.2% 0.0% 57.63 90.89 101.7 76.5% 1.1%
Japan 101.1 100.1 100 -1.1% 0.0% 101.3 98.92 100 -1.3% 0.0% 104.1 102.1 104.1 0.0% 0.0%
Korea, Rep. of 104.3 100.1 100 -4.1% -0.1% 99.64 100 100 0.4% 0.0% 92.13 95.94 103.9 12.8% 0.2%
Taiwan 106.3 100.1 100 -5.9% -0.1% 103.6 99.94 100 -3.5% -0.1% 98.27 95.61 100 1.8% 0.0%
Korea, Dem. Rep. of 102.6 109.5 102.1 -0.5% 0.0% 67.13 90.55 97.08 44.6% 0.7% 45.94 66.45 74.13 61.4% 1.0%
Hong Kong 104.2 100.5 100 -4.0% -0.1% 103.1 100.8 100.1 -2.9% -0.1% 77.49 99.45 104.2 34.5% 0.6%
Mongolia 101.7 101.7 100.1 -1.6% 0.0% 101 101.7 100.2 -0.8% 0.0% 83.37 87.97 96.46 15.7% 0.3%
Asia-East 109.9 101.1 100.4 -8.6% -0.2% 99.34 108.9 99.44 0.1% 0.0% 63.07 91.57 101.5 60.9% 1.0%
India 113.4 105.6 100.6 -11.3% -0.2% 77.16 102 99.83 29.4% 0.5% 44.01 73.52 90.49 105.6% 1.5%
Pakistan 97.16 103.3 102.1 5.1% 0.1% 43.48 61.29 78.05 79.5% 1.2% 23.67 35.75 54.9 131.9% 1.7%
Bangladesh 104.8 102.2 100.7 -3.9% -0.1% 65.31 82.27 91.8 40.6% 0.7% 33.58 54.33 77.81 131.7% 1.7%
Afghanistan 115.3 130.3 111.6 -3.2% -0.1% 28.29 45.15 49.13 73.7% 1.1% 12.71 18.12 22.37 76.0% 1.1%
Iran, Islamic Rep. of 107.4 100.6 100.1 -6.8% -0.1% 93.41 102.1 100.9 8.0% 0.2% 79.9 97.88 97.5 22.0% 0.4%
Nepal 117.2 107.3 101.1 -13.7% -0.3% 74.62 84.04 96.67 29.5% 0.5% 27.68 45.9 72.26 161.1% 1.9%
Uzbekistan 107.3 103.4 100.2 -6.6% -0.1% 99.37 107.4 103.1 3.8% 0.1% 111.2 111.5 104.2 -6.3% -0.1%
Sri Lanka 110.6 101.5 99.95 -9.6% -0.2% 109.9 107 99.18 -9.8% -0.2% 76.54 95.81 95.55 24.8% 0.4%
Kazakhstan 107.8 101.2 100.2 -7.1% -0.1% 99.99 101.8 100.1 0.1% 0.0% 88.67 93.47 94.75 6.9% 0.1%
Tajikistan 102.8 100.3 100 -2.7% -0.1% 95.49 98.56 99.74 4.5% 0.1% 56.44 61.58 75.15 33.2% 0.6%
Turkmenistan 116.1 106.7 101.4 -12.7% -0.3% 68.94 111.3 107.6 56.1% 0.9% 48.33 94.86 92.49 91.4% 1.3%
Kyrgyzstan 100.7 105 100.3 -0.4% 0.0% 92.33 101.5 98.43 6.6% 0.1% 78.15 81.26 85.82 9.8% 0.2%
Bhutan 104.2 107.2 100.5 -3.6% -0.1% 60.68 86.61 95.48 57.4% 0.9% 32.29 58.84 87.78 171.8% 2.0%
Maldives 122.1 101.9 98.96 -19.0% -0.4% 126.2 132.3 99.11 -21.5% -0.5% 24.18 65.76 87.07 260.1% 2.6%
Asia-South Central 110.6 105.6 101.4 -8.3% -0.2% 73.38 92.99 93.26 27.1% 0.5% 43.65 66.69 80.66 84.8% 1.2%
Indonesia 114.8 104.1 100.3 -12.6% -0.3% 80.79 94.85 98.73 22.2% 0.4% 50.19 60.98 76.73 52.9% 0.9%
Philippines 110.1 102.6 101 -8.3% -0.2% 90.75 95.14 99.92 10.1% 0.2% 79.9 81.69 92.93 16.3% 0.3%
Vietnam 107.5 99.57 100.3 -6.7% -0.1% 87.04 101.5 100.2 15.1% 0.3% 47.36 71.78 83.48 76.3% 1.1%
Thailand 108.8 100.4 100 -8.1% -0.2% 99.38 103.7 103 3.6% 0.1% 63.16 81.79 91.72 45.2% 0.7%
Myanmar 115.6 103.9 101.3 -12.4% -0.3% 60.4 73.73 89.52 48.2% 0.8% 40.86 60.85 80.6 97.3% 1.4%
Malaysia 101.2 100 100 -1.2% 0.0% 92.88 96.01 98.05 5.6% 0.1% 57.17 79.52 92.53 61.9% 1.0%
Cambodia 129.9 113.4 104.8 -19.3% -0.4% 52.42 74.54 92.58 76.6% 1.1% 19.41 41.86 65.19 235.9% 2.5%
Lao PDR 122.4 109.9 101 -17.5% -0.4% 57.82 84.1 98 69.5% 1.1% 38.4 63.59 93.13 142.5% 1.8%
Singapore 101.8 100.7 99.99 -1.8% 0.0% 81.72 98.65 99.84 22.2% 0.4% 69.15 97.58 99.64 44.1% 0.7%
Timor-Leste 102.6 106.9 103.7 1.1% 0.0% 71.79 77.85 94.13 31.1% 0.5% 39.45 42.69 64.04 62.3% 1.0%
Brunei Darussalam 108.3 101.1 100.4 -7.3% -0.2% 112.7 99.29 99.48 -11.7% -0.2% 80.54 87.71 92.94 15.4% 0.3%
Asia-South East 112.1 102.9 100.6 -10.3% -0.2% 83.13 94.4 98.64 18.7% 0.3% 54.57 68.99 83.33 52.7% 0.9%
VOL2_15 Forecast Tables rev.indd 271 21/08/2009 09:17

Patterns of Potential Hum
an Progress Volume 2: Enhancing Global Education
272
Patterns of Potential Human Progress Multination Regional Analysis Measures of Poverty, Health, Education, Infrastructure, and Governance
Base Case: Countries in Year 2060
Descending Population Sequence
EducationPrimary Education Enrollment Rate, Gross Lower Secondary Enrollment Rate, Gross Upper Secondary Enrollment Rate, Gross
Percent Percent Percent
2010 2035 2060 % Chg % An Chg 2010 2035 2060 % Chg % An Chg 2010 2035 2060 % Chg % An Chg
ASIA WITH OCEANIA continuedTurkey 98.72 100.6 100.1 1.4% 0.0% 88.59 103.2 100.9 13.9% 0.3% 69.76 89.1 101.1 44.9% 0.7%
Yemen 94.23 101 100.4 6.5% 0.1% 57.5 86.36 99.8 73.6% 1.1% 43.79 71.17 91.19 108.2% 1.5%
Iraq 104.6 103.9 100.1 -4.3% -0.1% 62.6 86.45 101.8 62.6% 1.0% 33.74 52.05 75.96 125.1% 1.6%
Saudi Arabia 90.72 104.3 100.2 10.4% 0.2% 87.18 107.3 99.46 14.1% 0.3% 83.33 106.4 98.12 17.7% 0.3%
Syria 114.4 100.3 100 -12.6% -0.3% 97.47 91.32 95.06 -2.5% -0.1% 36.34 51.18 70.22 93.2% 1.3%
Israel 109.3 100 100 -8.5% -0.2% 80.66 99.47 100 24.0% 0.4% 104.6 98.27 100 -4.4% -0.1%
Azerbaijan 105.9 101.4 100.4 -5.2% -0.1% 93.26 102.1 100.5 7.8% 0.1% 75.28 96.35 96.11 27.7% 0.5%
Jordan 101.6 100.5 100.1 -1.5% 0.0% 94.94 101.6 99.29 4.6% 0.1% 79.15 98.06 101 27.6% 0.5%
Palestine 90.27 105.7 100.4 11.2% 0.2% 100.1 104.3 102.7 2.6% 0.1% 67.07 75.5 89.58 33.6% 0.6%
United Arab Emirates 104.4 101.4 99.99 -4.2% -0.1% 95.15 100.2 97.92 2.9% 0.1% 81.79 89.49 93.98 14.9% 0.3%
Oman 98.8 101.8 100.2 1.4% 0.0% 99.72 100.6 99.56 -0.2% 0.0% 80.03 102.1 101.4 26.7% 0.5%
Kuwait 103.4 100.5 100 -3.3% -0.1% 94.79 100.4 99.57 5.0% 0.1% 99.93 106.6 100.3 0.4% 0.0%
Lebanon 98.01 102.3 100.4 2.4% 0.0% 90.34 101.6 100 10.7% 0.2% 70.11 81.68 95.01 35.5% 0.6%
Georgia 106.1 102.2 100.7 -5.1% -0.1% 101.4 101.6 100.9 -0.5% 0.0% 71.85 86.59 93.01 29.5% 0.5%
Armenia 109.3 101.3 100.1 -8.4% -0.2% 102.8 102.2 100.1 -2.6% -0.1% 86.85 102.8 99.38 14.4% 0.3%
Bahrain 103 100 100 -2.9% -0.1% 106.4 98.44 99.37 -6.6% -0.1% 100.8 100.8 100.5 -0.3% 0.0%
Qatar 106 100.6 100 -5.7% -0.1% 100.6 101.7 100.1 -0.5% 0.0% 95.71 101 99.87 4.3% 0.1%
Cyprus 101 100 99.96 -1.0% 0.0% 99.1 100 99.94 0.8% 0.0% 98.59 96.36 100.4 1.8% 0.0%
Asia-West 100.6 101.8 100.2 -0.4% 0.0% 83.84 97.2 99.95 19.2% 0.4% 63.63 80.18 91.02 43.0% 0.7%
Australia 103.7 100 100 -3.6% -0.1% 111.6 99.23 100 -10.4% -0.2% 132.1 99.78 100 -24.3% -0.6%
Papua New Guniea 66.5 95.4 100 50.4% 0.8% 24.7 51.01 70.63 186.0% 2.1% 25.24 37.52 53.94 113.7% 1.5%
New Zealand 101.2 99.9 100 -1.2% 0.0% 104.6 97.72 100 -4.4% -0.1% 129.8 96.81 99.94 -23.0% -0.5%
Solomon Islands 105.4 116.9 108.7 3.1% 0.1% 49.6 65.2 78.24 57.7% 0.9% 18.17 25.65 37.67 107.3% 1.5%
Fiji 106 105.5 100.6 -5.1% -0.1% 100.5 113.1 108.2 7.7% 0.1% 71.3 89.95 107.5 50.8% 0.8%
Vanuatu 113.8 103.9 100 -12.1% -0.3% 51.13 72.91 99.34 94.3% 1.3% 33.69 51.34 81.25 141.2% 1.8%
Micronesia 116.6 110.9 100.1 -14.2% -0.3% 103.5 110.2 115 11.1% 0.2% 72.22 68.1 84.49 17.0% 0.3%
Tonga 110.9 101.2 100.1 -9.7% -0.2% 93.09 89.05 102.1 9.7% 0.2% 103.5 103.9 122.7 18.6% 0.3%
Samoa 98.99 101.6 100.4 1.4% 0.0% 98.3 104.3 102.8 4.6% 0.1% 71.58 86.43 111.7 56.0% 0.9%
Oceania 96.49 99.48 100.2 3.8% 0.1% 92.36 87.25 91.9 -0.5% 0.0% 106.8 82.63 86.3 -19.2% -0.4%
VOL2_15 Forecast Tables rev.indd 272 21/08/2009 09:17

273Forecast Tables
Patterns of Potential Human Progress Multination Regional Analysis Measures of Poverty, Health, Education, Infrastructure, and Governance
Base Case: Countries in Year 2060
Descending Population Sequence
EducationPrimary Education Enrollment Rate, Gross Lower Secondary Enrollment Rate, Gross Upper Secondary Enrollment Rate, Gross
Percent Percent Percent
2010 2035 2060 % Chg % An Chg 2010 2035 2060 % Chg % An Chg 2010 2035 2060 % Chg % An Chg
EUROPERussian Federation 106.2 101.4 100.4 -5.5% -0.1% 90.83 104.1 102.4 12.7% 0.2% 97.94 107 107 9.3% 0.2%
Ukraine 113 100.6 100.1 -11.4% -0.2% 103.4 101.8 101.1 -2.2% 0.0% 97.71 97.52 100.9 3.3% 0.1%
Poland 100.9 100.2 100.1 -0.8% 0.0% 102.2 97.71 98.78 -3.3% -0.1% 100.4 97.18 98.64 -1.8% 0.0%
Romania 108.7 100.8 100.3 -7.7% -0.2% 100.1 103.6 102 1.9% 0.0% 79.52 97.97 99.21 24.8% 0.4%
Czech Republic 106.3 100.6 100.1 -5.8% -0.1% 101.1 98.97 98.84 -2.2% 0.0% 97.01 99.29 99.29 2.4% 0.0%
Belarus 103.3 100.8 100.2 -3.0% -0.1% 109.7 105.7 102.9 -6.2% -0.1% 73.26 79.55 89.69 22.4% 0.4%
Hungary 104.8 100.8 100.1 -4.5% -0.1% 99.18 100 98.94 -0.2% 0.0% 95.94 100.4 98.58 2.8% 0.1%
Bulgaria 108.2 100.6 100.4 -7.2% -0.1% 97.14 103.9 103 6.0% 0.1% 116.5 93.67 99.17 -14.9% -0.3%
Slovakia 106.3 100.5 100.1 -5.8% -0.1% 102.3 103 100.1 -2.2% 0.0% 96.87 98.17 99.31 2.5% 0.0%
Moldova, Rep. of 108.7 101.2 100.5 -7.5% -0.2% 99.65 100.5 100.4 0.8% 0.0% 81.24 82.51 98.84 21.7% 0.4%
Europe-East 106.7 101 100.3 -6.0% -0.1% 96.71 102.5 101.4 4.8% 0.1% 96.18 101.4 102.8 6.9% 0.1%
United Kingdom 106.6 100.1 100 -6.2% -0.1% 101.5 99.15 100 -1.5% 0.0% 108.1 104 105.4 -2.5% -0.1%
Sweden 103.4 100.4 100.1 -3.2% -0.1% 103.5 100.2 100.1 -3.3% -0.1% 101.8 99.88 100.1 -1.7% 0.0%
Denmark 103.3 100.3 100.1 -3.1% -0.1% 115.1 99.75 100.1 -13.0% -0.3% 122.9 99.67 100 -18.6% -0.4%
Ireland 105.5 100.1 100 -5.2% -0.1% 105.6 99.51 99.21 -6.1% -0.1% 120.6 107.4 107.2 -11.1% -0.2%
Norway 100.5 100.2 100 -0.5% 0.0% 100.8 100.2 100 -0.8% 0.0% 119.9 100 100 -16.6% -0.4%
Finland 101.7 100.1 100 -1.7% 0.0% 102.6 99.34 100 -2.5% -0.1% 118.1 99.4 100 -15.3% -0.3%
Lithuania 105.3 101.3 100.4 -4.7% -0.1% 101.8 100.6 99.83 -1.9% 0.0% 93.93 96.53 102.5 9.1% 0.2%
Latvia 104 100.9 100.4 -3.5% -0.1% 103.8 99.83 99.31 -4.3% -0.1% 94.87 99.28 98.75 4.1% 0.1%
Estonia 103.8 100.5 100.2 -3.5% -0.1% 111.4 99.98 99.62 -10.6% -0.2% 94.66 99.84 99.33 4.9% 0.1%
Iceland 101 100.1 100.1 -0.9% 0.0% 101.4 99.87 100.1 -1.3% 0.0% 113.4 104.7 105 -7.4% -0.2%
Europe-North 105.3 100.2 100.1 -4.9% -0.1% 102.8 99.43 99.99 -2.7% -0.1% 109.1 102.7 103.9 -4.8% -0.1%
Italy 101.7 100 100 -1.7% 0.0% 105.9 100 100 -5.6% -0.1% 96.69 98.59 100 3.4% 0.1%
Spain 103 100 100.1 -2.8% -0.1% 114.3 98.85 98.94 -13.4% -0.3% 121.7 109.7 110.1 -9.5% -0.2%
Greece 102.2 100 100 -2.2% 0.0% 100.6 98.43 99.47 -1.1% 0.0% 104.2 97.59 99.28 -4.7% -0.1%
Portugal 110.5 100 100 -9.5% -0.2% 110.5 99.29 99.42 -10.0% -0.2% 90.95 95.79 98.83 8.7% 0.2%
Serbia 107 101.1 100.1 -6.4% -0.1% 93.6 101.3 100.8 7.7% 0.1% 78.86 92.84 97.56 23.7% 0.4%
Croatia 104.6 100.8 100.1 -4.3% -0.1% 98.79 101.2 100.1 1.3% 0.0% 88.35 100.6 100 13.2% 0.2%
Bosnia and Herzegovina 106.2 102.8 99.6 -6.2% -0.1% 83.69 98.95 99.63 19.0% 0.3% 66.08 79.16 84.02 27.1% 0.5%
Albania 108.4 100.7 100.3 -7.5% -0.2% 99.87 101.5 100.2 0.3% 0.0% 58.02 79.79 91.22 57.2% 0.9%
Macedonia, TFYR 103.5 100.6 100 -3.4% -0.1% 97.52 99.24 100.1 2.6% 0.1% 78.16 93.81 99.89 27.8% 0.5%
Slovenia 101.9 100.2 100.1 -1.8% 0.0% 98.12 100.2 100.2 2.1% 0.0% 99.03 98.78 100 1.0% 0.0%
Montenegro 109 101.1 100.3 -8.0% -0.2% 92.9 101.8 99.23 6.8% 0.1% 75.52 84.69 90.21 19.5% 0.4%
Malta 103.3 100.5 100.3 -2.9% -0.1% 107.2 111.3 104.3 -2.7% -0.1% 91.81 96.57 99.77 8.7% 0.2%
Europe-South 103.4 100.2 100 -3.3% -0.1% 106.5 99.63 99.66 -6.4% -0.1% 101.1 100.4 102.1 1.0% 0.0%
Germany 102.8 100 100 -2.7% -0.1% 106.3 100.8 99.09 -6.8% -0.1% 97.37 102 102.4 5.2% 0.1%
France 109.6 100.1 100 -8.8% -0.2% 112.6 99.49 99.49 -11.6% -0.2% 112 99.43 99.43 -11.2% -0.2%
Netherlands 106.5 100.1 100 -6.1% -0.1% 129.9 128.4 124.9 -3.8% -0.1% 106.3 109.1 111 4.4% 0.1%
Belgium 106.1 100.2 100.1 -5.7% -0.1% 113.1 98.91 100.1 -11.5% -0.2% 104.6 98.94 100 -4.4% -0.1%
Austria 104.9 100.2 100 -4.7% -0.1% 104.5 99.42 100 -4.3% -0.1% 100.1 99.66 100 -0.1% 0.0%
Switzerland 107.5 102.5 101.2 -5.9% -0.1% 105.3 102.8 101.4 -3.7% -0.1% 81.27 101.6 100.7 23.9% 0.4%
Luxembourg 104.9 100.2 100 -4.7% -0.1% 105.5 100.3 99.99 -5.2% -0.1% 89.69 99.75 99.98 11.5% 0.2%
Europe-West 105.8 100.2 100.1 -5.4% -0.1% 110.8 102.9 102 -7.9% -0.2% 102.8 101.5 101.9 -0.9% 0.0%
VOL2_15 Forecast Tables rev.indd 273 21/08/2009 09:18
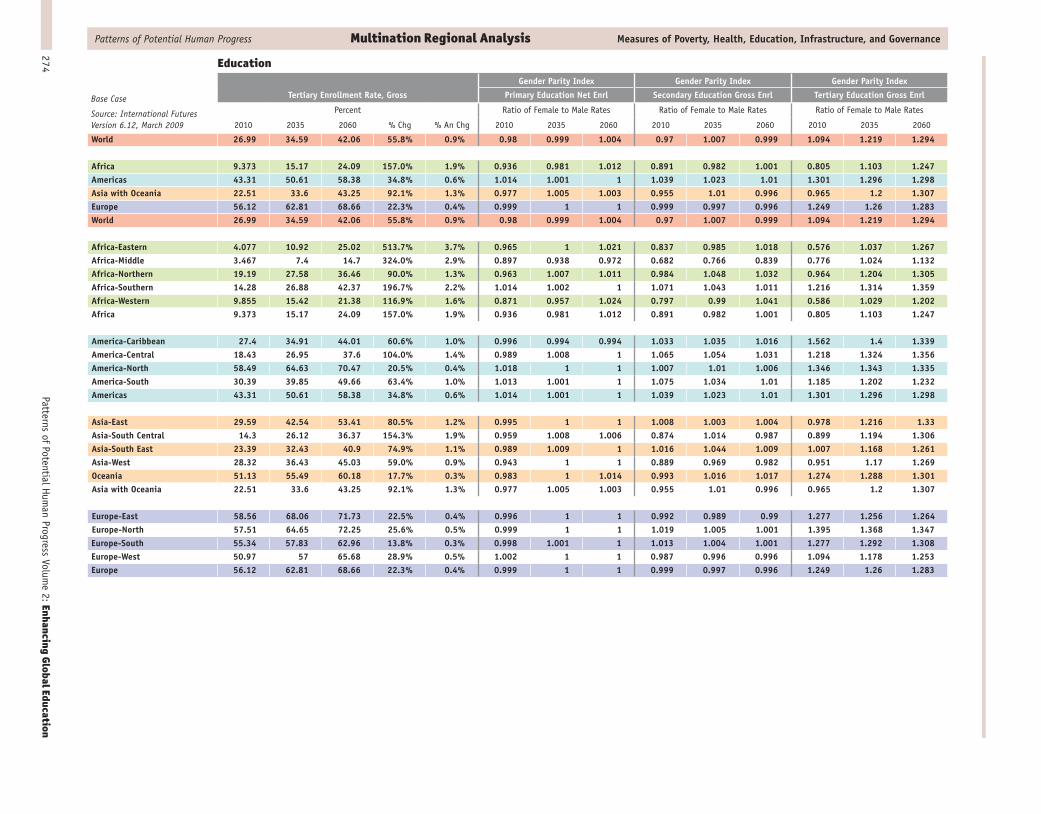
Patterns of Potential Hum
an Progress Volume 2: Enhancing Global Education
274
Patterns of Potential Human Progress Multination Regional Analysis Measures of Poverty, Health, Education, Infrastructure, and Governance
EducationGender Parity Index Gender Parity Index Gender Parity Index
Tertiary Enrollment Rate, Gross Primary Education Net Enrl Secondary Education Gross Enrl Tertiary Education Gross Enrl
Percent Ratio of Female to Male Rates Ratio of Female to Male Rates Ratio of Female to Male Rates
2010 2035 2060 % Chg % An Chg 2010 2035 2060 2010 2035 2060 2010 2035 2060
World 26.99 34.59 42.06 55.8% 0.9% 0.98 0.999 1.004 0.97 1.007 0.999 1.094 1.219 1.294
Africa 9.373 15.17 24.09 157.0% 1.9% 0.936 0.981 1.012 0.891 0.982 1.001 0.805 1.103 1.247Americas 43.31 50.61 58.38 34.8% 0.6% 1.014 1.001 1 1.039 1.023 1.01 1.301 1.296 1.298Asia with Oceania 22.51 33.6 43.25 92.1% 1.3% 0.977 1.005 1.003 0.955 1.01 0.996 0.965 1.2 1.307Europe 56.12 62.81 68.66 22.3% 0.4% 0.999 1 1 0.999 0.997 0.996 1.249 1.26 1.283World 26.99 34.59 42.06 55.8% 0.9% 0.98 0.999 1.004 0.97 1.007 0.999 1.094 1.219 1.294
Africa-Eastern 4.077 10.92 25.02 513.7% 3.7% 0.965 1 1.021 0.837 0.985 1.018 0.576 1.037 1.267Africa-Middle 3.467 7.4 14.7 324.0% 2.9% 0.897 0.938 0.972 0.682 0.766 0.839 0.776 1.024 1.132Africa-Northern 19.19 27.58 36.46 90.0% 1.3% 0.963 1.007 1.011 0.984 1.048 1.032 0.964 1.204 1.305Africa-Southern 14.28 26.88 42.37 196.7% 2.2% 1.014 1.002 1 1.071 1.043 1.011 1.216 1.314 1.359Africa-Western 9.855 15.42 21.38 116.9% 1.6% 0.871 0.957 1.024 0.797 0.99 1.041 0.586 1.029 1.202Africa 9.373 15.17 24.09 157.0% 1.9% 0.936 0.981 1.012 0.891 0.982 1.001 0.805 1.103 1.247
America-Caribbean 27.4 34.91 44.01 60.6% 1.0% 0.996 0.994 0.994 1.033 1.035 1.016 1.562 1.4 1.339America-Central 18.43 26.95 37.6 104.0% 1.4% 0.989 1.008 1 1.065 1.054 1.031 1.218 1.324 1.356America-North 58.49 64.63 70.47 20.5% 0.4% 1.018 1 1 1.007 1.01 1.006 1.346 1.343 1.335America-South 30.39 39.85 49.66 63.4% 1.0% 1.013 1.001 1 1.075 1.034 1.01 1.185 1.202 1.232Americas 43.31 50.61 58.38 34.8% 0.6% 1.014 1.001 1 1.039 1.023 1.01 1.301 1.296 1.298
Asia-East 29.59 42.54 53.41 80.5% 1.2% 0.995 1 1 1.008 1.003 1.004 0.978 1.216 1.33Asia-South Central 14.3 26.12 36.37 154.3% 1.9% 0.959 1.008 1.006 0.874 1.014 0.987 0.899 1.194 1.306Asia-South East 23.39 32.43 40.9 74.9% 1.1% 0.989 1.009 1 1.016 1.044 1.009 1.007 1.168 1.261Asia-West 28.32 36.43 45.03 59.0% 0.9% 0.943 1 1 0.889 0.969 0.982 0.951 1.17 1.269Oceania 51.13 55.49 60.18 17.7% 0.3% 0.983 1 1.014 0.993 1.016 1.017 1.274 1.288 1.301Asia with Oceania 22.51 33.6 43.25 92.1% 1.3% 0.977 1.005 1.003 0.955 1.01 0.996 0.965 1.2 1.307
Europe-East 58.56 68.06 71.73 22.5% 0.4% 0.996 1 1 0.992 0.989 0.99 1.277 1.256 1.264Europe-North 57.51 64.65 72.25 25.6% 0.5% 0.999 1 1 1.019 1.005 1.001 1.395 1.368 1.347Europe-South 55.34 57.83 62.96 13.8% 0.3% 0.998 1.001 1 1.013 1.004 1.001 1.277 1.292 1.308Europe-West 50.97 57 65.68 28.9% 0.5% 1.002 1 1 0.987 0.996 0.996 1.094 1.178 1.253Europe 56.12 62.81 68.66 22.3% 0.4% 0.999 1 1 0.999 0.997 0.996 1.249 1.26 1.283
Base Case
Source: International Futures Version 6.12, March 2009
VOL2_15 Forecast Tables rev.indd 274 21/08/2009 09:18
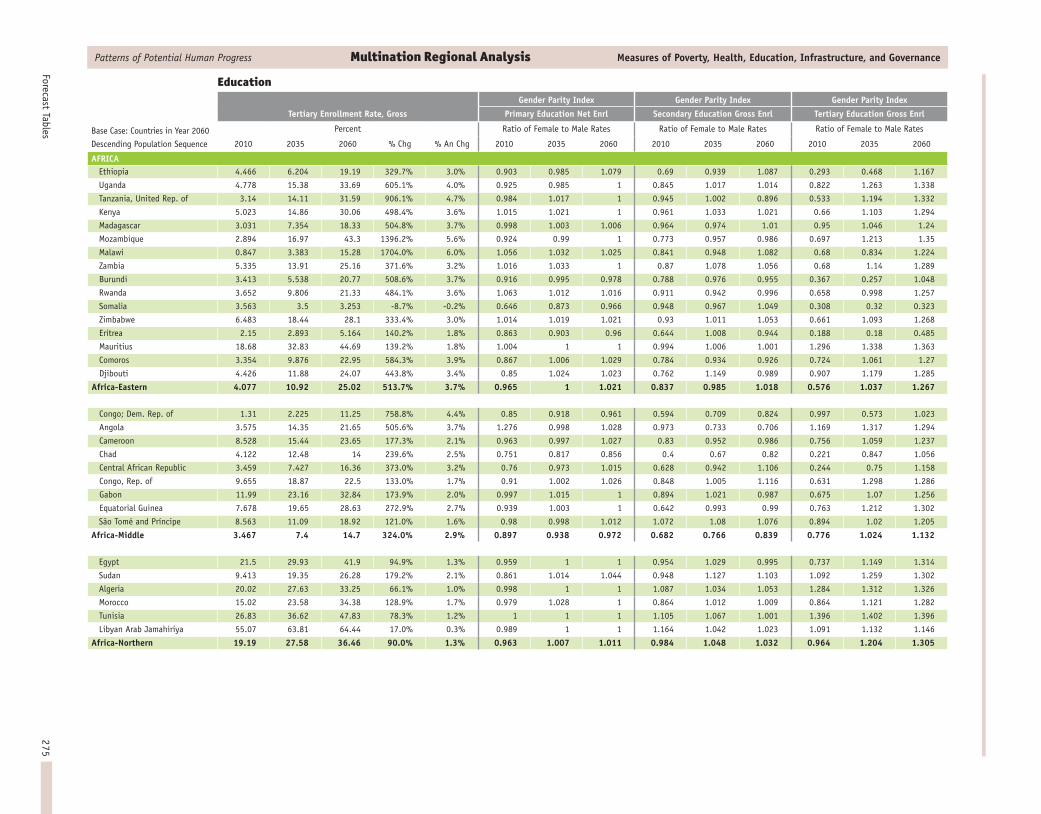
275Forecast Tables
Patterns of Potential Human Progress Multination Regional Analysis Measures of Poverty, Health, Education, Infrastructure, and Governance
EducationGender Parity Index Gender Parity Index Gender Parity Index
Tertiary Enrollment Rate, Gross Primary Education Net Enrl Secondary Education Gross Enrl Tertiary Education Gross Enrl
Percent Ratio of Female to Male Rates Ratio of Female to Male Rates Ratio of Female to Male Rates
2010 2035 2060 % Chg % An Chg 2010 2035 2060 2010 2035 2060 2010 2035 2060
AFRICAEthiopia 4.466 6.204 19.19 329.7% 3.0% 0.903 0.985 1.079 0.69 0.939 1.087 0.293 0.468 1.167
Uganda 4.778 15.38 33.69 605.1% 4.0% 0.925 0.985 1 0.845 1.017 1.014 0.822 1.263 1.338
Tanzania, United Rep. of 3.14 14.11 31.59 906.1% 4.7% 0.984 1.017 1 0.945 1.002 0.896 0.533 1.194 1.332
Kenya 5.023 14.86 30.06 498.4% 3.6% 1.015 1.021 1 0.961 1.033 1.021 0.66 1.103 1.294
Madagascar 3.031 7.354 18.33 504.8% 3.7% 0.998 1.003 1.006 0.964 0.974 1.01 0.95 1.046 1.24
Mozambique 2.894 16.97 43.3 1396.2% 5.6% 0.924 0.99 1 0.773 0.957 0.986 0.697 1.213 1.35
Malawi 0.847 3.383 15.28 1704.0% 6.0% 1.056 1.032 1.025 0.841 0.948 1.082 0.68 0.834 1.224
Zambia 5.335 13.91 25.16 371.6% 3.2% 1.016 1.033 1 0.87 1.078 1.056 0.68 1.14 1.289
Burundi 3.413 5.538 20.77 508.6% 3.7% 0.916 0.995 0.978 0.788 0.976 0.955 0.367 0.257 1.048
Rwanda 3.652 9.806 21.33 484.1% 3.6% 1.063 1.012 1.016 0.911 0.942 0.996 0.658 0.998 1.257
Somalia 3.563 3.5 3.253 -8.7% -0.2% 0.646 0.873 0.966 0.948 0.967 1.049 0.308 0.32 0.323
Zimbabwe 6.483 18.44 28.1 333.4% 3.0% 1.014 1.019 1.021 0.93 1.011 1.053 0.661 1.093 1.268
Eritrea 2.15 2.893 5.164 140.2% 1.8% 0.863 0.903 0.96 0.644 1.008 0.944 0.188 0.18 0.485
Mauritius 18.68 32.83 44.69 139.2% 1.8% 1.004 1 1 0.994 1.006 1.001 1.296 1.338 1.363
Comoros 3.354 9.876 22.95 584.3% 3.9% 0.867 1.006 1.029 0.784 0.934 0.926 0.724 1.061 1.27
Djibouti 4.426 11.88 24.07 443.8% 3.4% 0.85 1.024 1.023 0.762 1.149 0.989 0.907 1.179 1.285
Africa-Eastern 4.077 10.92 25.02 513.7% 3.7% 0.965 1 1.021 0.837 0.985 1.018 0.576 1.037 1.267
Congo; Dem. Rep. of 1.31 2.225 11.25 758.8% 4.4% 0.85 0.918 0.961 0.594 0.709 0.824 0.997 0.573 1.023
Angola 3.575 14.35 21.65 505.6% 3.7% 1.276 0.998 1.028 0.973 0.733 0.706 1.169 1.317 1.294
Cameroon 8.528 15.44 23.65 177.3% 2.1% 0.963 0.997 1.027 0.83 0.952 0.986 0.756 1.059 1.237
Chad 4.122 12.48 14 239.6% 2.5% 0.751 0.817 0.856 0.4 0.67 0.82 0.221 0.847 1.056
Central African Republic 3.459 7.427 16.36 373.0% 3.2% 0.76 0.973 1.015 0.628 0.942 1.106 0.244 0.75 1.158
Congo, Rep. of 9.655 18.87 22.5 133.0% 1.7% 0.91 1.002 1.026 0.848 1.005 1.116 0.631 1.298 1.286
Gabon 11.99 23.16 32.84 173.9% 2.0% 0.997 1.015 1 0.894 1.021 0.987 0.675 1.07 1.256
Equatorial Guinea 7.678 19.65 28.63 272.9% 2.7% 0.939 1.003 1 0.642 0.993 0.99 0.763 1.212 1.302
São Tomé and Príncipe 8.563 11.09 18.92 121.0% 1.6% 0.98 0.998 1.012 1.072 1.08 1.076 0.894 1.02 1.205
Africa-Middle 3.467 7.4 14.7 324.0% 2.9% 0.897 0.938 0.972 0.682 0.766 0.839 0.776 1.024 1.132
Egypt 21.5 29.93 41.9 94.9% 1.3% 0.959 1 1 0.954 1.029 0.995 0.737 1.149 1.314
Sudan 9.413 19.35 26.28 179.2% 2.1% 0.861 1.014 1.044 0.948 1.127 1.103 1.092 1.259 1.302
Algeria 20.02 27.63 33.25 66.1% 1.0% 0.998 1 1 1.087 1.034 1.053 1.284 1.312 1.326
Morocco 15.02 23.58 34.38 128.9% 1.7% 0.979 1.028 1 0.864 1.012 1.009 0.864 1.121 1.282
Tunisia 26.83 36.62 47.83 78.3% 1.2% 1 1 1 1.105 1.067 1.001 1.396 1.402 1.396
Libyan Arab Jamahiriya 55.07 63.81 64.44 17.0% 0.3% 0.989 1 1 1.164 1.042 1.023 1.091 1.132 1.146
Africa-Northern 19.19 27.58 36.46 90.0% 1.3% 0.963 1.007 1.011 0.984 1.048 1.032 0.964 1.204 1.305
Base Case: Countries in Year 2060
Descending Population Sequence
VOL2_15 Forecast Tables rev.indd 275 21/08/2009 09:18

Patterns of Potential Hum
an Progress Volume 2: Enhancing Global Education
276
Patterns of Potential Human Progress Multination Regional Analysis Measures of Poverty, Health, Education, Infrastructure, and Governance
EducationGender Parity Index Gender Parity Index Gender Parity Index
Tertiary Enrollment Rate, Gross Primary Education Net Enrl Secondary Education Gross Enrl Tertiary Education Gross Enrl
Percent Ratio of Female to Male Rates Ratio of Female to Male Rates Ratio of Female to Male Rates
2010 2035 2060 % Chg % An Chg 2010 2035 2060 2010 2035 2060 2010 2035 2060
AFRICA continuedSouth Africa 15.43 27.83 42.95 178.4% 2.1% 1.01 1 1 1.069 1.042 1.011 1.217 1.308 1.357
Namibia 8.208 22.48 42.27 415.0% 3.3% 1.058 1.001 1 1.137 1.081 1.003 0.959 1.276 1.36
Lesotho 4.253 14.65 30.76 623.3% 4.0% 1.051 1.045 1 1.249 1.123 1.036 1.536 1.487 1.377
Botswana 7.207 28.35 46.38 543.5% 3.8% 1.029 1 1 1.024 0.978 1.001 1.372 1.41 1.395
Swaziland 5.704 19.58 36.58 541.3% 3.8% 1.007 1.013 1 1 1.046 1.005 1.065 1.285 1.348
Africa-Southern 14.28 26.88 42.37 196.7% 2.2% 1.014 1.002 1 1.071 1.043 1.011 1.216 1.314 1.359
Nigeria 13.23 19.06 20.61 55.8% 0.9% 0.871 0.946 1.03 0.864 1.044 1.088 0.623 1.093 1.215
Niger 2.296 4.559 17.54 663.9% 4.2% 0.756 0.954 1.012 0.78 1.16 1.122 0.264 0.607 1.178
Côte d’Ivoire 10.33 16.89 24.88 140.9% 1.8% 0.82 0.952 1 0.614 0.9 1.004 0.473 0.964 1.202
Ghana 7.791 11.77 20 156.7% 1.9% 0.988 0.997 1.061 0.914 1.049 1.082 0.653 0.914 1.168
Burkina Faso 4.811 13.39 26.27 446.0% 3.5% 0.826 0.999 1.038 0.752 1.148 1.048 0.628 1.146 1.296
Mali 4.779 10.99 22.67 374.4% 3.2% 0.797 0.939 0.999 0.624 0.832 0.962 0.454 1.021 1.257
Senegal 6.478 13.69 24.91 284.5% 2.7% 0.971 1.022 1.021 0.781 0.92 1.033 0.494 0.951 1.22
Guinea 6.39 14.8 24.06 276.5% 2.7% 0.854 0.931 0.985 0.563 0.72 0.9 0.365 0.942 1.205
Benin 6.563 13.09 24.02 266.0% 2.6% 0.82 0.93 1.017 0.621 0.84 0.964 0.368 0.818 1.159
Togo 6.369 6.722 12.34 93.8% 1.3% 0.865 0.902 1.009 0.527 0.614 0.762 0.235 0.316 0.747
Sierra Leone 3.351 11.15 24.17 621.3% 4.0% 0.815 0.974 1.037 0.732 0.983 0.972 0.356 1.077 1.297
Liberia 17.74 17.47 23.62 33.1% 0.6% 1.013 1.075 1.099 0.744 0.951 0.967 0.746 0.691 0.807
Mauritania 7.06 11.68 19.83 180.9% 2.1% 1.017 1.037 1.025 0.916 0.994 1.037 0.488 0.864 1.173
Guinea-Bissau 0.941 1.955 8.674 821.8% 4.5% 0.733 0.848 0.957 0.585 0.831 0.98 0.53 0.256 0.952
Gambia 2.784 7.903 17.26 520.0% 3.7% 1.076 0.969 0.985 0.882 1.05 0.952 1.007 1.282 1.284
Cape Verde 10.2 24.13 39.63 288.5% 2.8% 0.981 1 1 1.058 1.034 0.948 1.178 1.301 1.357
Africa-Western 9.855 15.42 21.38 116.9% 1.6% 0.871 0.957 1.024 0.797 0.99 1.041 0.586 1.029 1.202
Base Case: Countries in Year 2060
Descending Population Sequence
VOL2_15 Forecast Tables rev.indd 276 21/08/2009 09:18

277Forecast Tables
Patterns of Potential Human Progress Multination Regional Analysis Measures of Poverty, Health, Education, Infrastructure, and Governance
EducationGender Parity Index Gender Parity Index Gender Parity Index
Tertiary Enrollment Rate, Gross Primary Education Net Enrl Secondary Education Gross Enrl Tertiary Education Gross Enrl
Percent Ratio of Female to Male Rates Ratio of Female to Male Rates Ratio of Female to Male Rates
2010 2035 2060 % Chg % An Chg 2010 2035 2060 2010 2035 2060 2010 2035 2060
AMERICASHaiti 2.872 8.658 17.37 504.8% 3.7% 0.967 0.956 0.98 0.811 0.906 1.086 0.695 1.1 1.24
Dominican Republic 28.01 36.53 48.33 72.5% 1.1% 1.01 1.016 1 1.169 1.143 0.986 1.597 1.588 1.562
Cuba 48.75 63.2 78.9 61.8% 1.0% 0.994 1 1 1.008 0.997 0.998 1.603 1.33 1.174
Puerto Rico 36.04 46.28 56.87 57.8% 0.9% 1.003 1 1 1.031 1.006 1 1.414 1.401 1.397
Jamaica 14.24 24.05 35.03 146.0% 1.8% 1.003 1.003 1 1.058 1.117 1.037 1.908 1.433 1.346
Trinidad and Tobago 16.22 37.48 48.71 200.3% 2.2% 1.01 1 1 1.041 0.993 0.992 1.216 1.318 1.358
Bahamas 20.22 33.71 46.48 129.9% 1.7% 1.03 1 1 1.027 1.015 1.005 1.845 1.486 1.406
Barbados 23.21 33.31 48.88 110.6% 1.5% 0.991 1 1 1.017 1.005 0.999 2.39 2.02 1.753
St. Vincent & the Grenadines 29.51 34.23 43.96 49.0% 0.8% 0.967 1 1 1.177 1.082 1.016 1.24 1.304 1.354
Grenada 32 35.53 44.39 38.7% 0.7% 0.991 1 1 1.041 1.054 0.947 1.252 1.288 1.328
St. Lucia 10.73 24.76 40.11 273.8% 2.7% 0.991 1 1 1.188 1.094 0.993 2.211 1.668 1.45
America-Caribbean 27.4 34.91 44.01 60.6% 1.0% 0.996 0.994 0.994 1.033 1.035 1.016 1.562 1.4 1.339
Guatemala 13.56 22.81 34.35 153.3% 1.9% 0.953 0.995 1 0.917 0.989 1.025 0.898 1.266 1.33
Honduras 15.34 22.68 32.43 111.4% 1.5% 1.021 1.046 1 1.267 1.175 1.07 1.39 1.361 1.362
El Salvador 19.83 29.55 40.69 105.2% 1.4% 1.003 1.013 1 1.031 1.073 1.015 1.213 1.281 1.322
Nicaragua 17.89 22.23 29.77 66.4% 1.0% 0.984 1.002 1.001 1.141 1.078 1.063 1.114 1.255 1.34
Costa Rica 26.1 42.33 57.25 119.3% 1.6% 1.025 1 1 1.052 1.008 0.981 1.219 1.247 1.286
Panama 34.38 43.59 53.66 56.1% 0.9% 0.995 1 1 1.072 1.046 1.023 1.647 1.663 1.631
Belize 4.322 22.57 43.59 908.6% 4.7% 1.029 1 1 1.016 1.007 1.01 1.832 1.446 1.397
America-Central 18.43 26.95 37.6 104.0% 1.4% 0.989 1.008 1 1.065 1.054 1.031 1.218 1.324 1.356
United States of America 69.85 75.62 79.81 14.3% 0.3% 1.027 1 1 1.005 1.006 1.001 1.397 1.369 1.339
Mexico 27.05 33.87 42.36 56.6% 0.9% 1.001 1 1 1.027 1.021 1.023 0.981 1.207 1.339
Canada 55.26 63.07 69.91 26.5% 0.5% 0.994 1 1 0.969 1.007 1 1.326 1.286 1.283
America-North 58.49 64.63 70.47 20.5% 0.4% 1.018 1 1 1.007 1.01 1.006 1.346 1.343 1.335
Brazil 21.99 32.11 43.39 97.3% 1.4% 1.017 1 1 1.086 1.034 1.002 1.306 1.328 1.359
Colombia 31.16 42.88 55.97 79.6% 1.2% 1.021 1.002 1 1.082 1.041 1.027 1.019 0.971 1.016
Argentina 54.59 60.76 67.54 23.7% 0.4% 0.992 1 1 1.103 1.022 1.009 1.414 1.392 1.357
Venezuela, RB 39.47 48.74 54.08 37.0% 0.6% 1.012 1 1 1.111 1.034 1.019 1.051 1.04 1.05
Peru 34.69 41.65 48.18 38.9% 0.7% 1.016 1 1 1.016 1.038 1.023 1.024 1.095 1.154
Chile 49.54 58.19 66.39 34.0% 0.6% 0.992 1 1 1.013 1.014 0.999 0.968 1.067 1.137
Ecuador 21.4 25.82 29.88 39.6% 0.7% 1.013 1.012 1.003 1.013 1.053 1.056 0.824 1.149 1.272
Bolivia 43.5 57.73 66.77 53.5% 0.9% 1.012 1 1 0.955 1.015 1.016 0.549 0.693 0.772
Paraguay 22.26 27.53 36.41 63.6% 1.0% 1.009 1.028 1 1.031 1.061 1.005 1.327 1.327 1.343
Uruguay 29.55 40.6 52.93 79.1% 1.2% 1.009 1 1 1.146 1.06 0.996 1.969 1.762 1.636
Guyana 11.48 23.82 36.37 216.8% 2.3% 0.992 1.008 1 0.982 1.075 0.988 1.502 1.375 1.368
Suriname 14.53 28.48 39.98 175.2% 2.0% 1.048 1 1 1.294 1.18 1.071 1.403 1.356 1.362
America-South 30.39 39.85 49.66 63.4% 1.0% 1.013 1.001 1 1.075 1.034 1.01 1.185 1.202 1.232
Base Case: Countries in Year 2060
Descending Population Sequence
VOL2_15 Forecast Tables rev.indd 277 21/08/2009 09:18

Patterns of Potential Hum
an Progress Volume 2: Enhancing Global Education
278
Patterns of Potential Human Progress Multination Regional Analysis Measures of Poverty, Health, Education, Infrastructure, and Governance
EducationGender Parity Index Gender Parity Index Gender Parity Index
Tertiary Enrollment Rate, Gross Primary Education Net Enrl Secondary Education Gross Enrl Tertiary Education Gross Enrl
Percent Ratio of Female to Male Rates Ratio of Female to Male Rates Ratio of Female to Male Rates
2010 2035 2060 % Chg % An Chg 2010 2035 2060 2010 2035 2060 2010 2035 2060
ASIA WITH OCEANIAChina 23.61 38.53 50.9 115.6% 1.5% 0.996 1 1 1.01 1.002 1.004 1.038 1.285 1.379
Japan 60.64 66.54 73.56 21.3% 0.4% 1.002 1 1 1.003 1 0.995 0.9 1.003 1.094
Korea, Rep. of 110.4 111.5 111.9 1.4% 0.0% 0.968 1 1 0.993 1.024 1.005 0.652 0.768 0.852
Taiwan 41.05 48.72 58.51 42.5% 0.7% 0.998 1 1 1.031 0.988 1 1.272 1.312 1.343
Korea, Dem. Rep. of 18.42 23.53 27.98 51.9% 0.8% 0.963 1.01 1.009 0.957 1.059 1.043 1.166 1.252 1.287
Hong Kong 34.75 44.61 51.81 49.1% 0.8% 0.96 1 1 0.995 1.02 0.995 1.142 1.298 1.359
Mongolia 34.77 43.13 53.68 54.4% 0.9% 1.031 1 1 1.112 1.039 1.032 1.581 1.475 1.453
Asia-East 29.59 42.54 53.41 80.5% 1.2% 0.995 1 1 1.008 1.003 1.004 0.978 1.216 1.33
India 15.17 29.17 41.78 175.4% 2.0% 0.972 1.019 1 0.849 1.011 0.976 0.878 1.202 1.327
Pakistan 7.171 15.95 26.24 265.9% 2.6% 0.781 0.94 1.026 0.832 1.098 1.078 0.991 1.189 1.286
Bangladesh 9.621 20.46 30.01 211.9% 2.3% 1.037 1.042 1.016 1.036 1.026 1.002 0.702 1.088 1.22
Afghanistan 1.945 2.691 9.38 382.3% 3.2% 0.432 0.94 1.017 0.397 0.861 0.865 0.281 0.653 1
Iran, Islamic Rep. of 24.8 37.07 41.74 68.3% 1.0% 1.056 1 1 0.983 0.989 0.993 1.138 1.324 1.347
Nepal 8.546 14.24 23.26 172.2% 2.0% 0.885 1.023 1 0.865 1.008 0.976 0.422 0.947 1.195
Uzbekistan 19.05 26.89 32.74 71.9% 1.1% 0.988 0.985 1 0.969 1.016 0.991 0.839 1.022 1.106
Sri Lanka 11.34 26.06 37.92 234.4% 2.4% 1.004 1 1 0.988 0.958 1.008 0.77 1.125 1.294
Kazakhstan 44.88 59.17 59.49 32.6% 0.6% 0.997 1 1 0.984 1.008 1.002 1.424 1.465 1.459
Tajikistan 25.87 30.28 38.34 48.2% 0.8% 0.977 1 1 0.878 0.962 0.963 0.411 0.679 0.918
Turkmenistan 19.23 35.43 35.23 83.2% 1.2% 0.965 1 1 0.942 1.036 1.012 1.131 1.313 1.317
Kyrgyzstan 40.94 50.67 55.92 36.6% 0.6% 0.978 0.992 1 1.008 1.024 1.007 1.179 1.18 1.214
Bhutan 7.714 22.63 41.11 432.9% 3.4% 0.998 1.002 1 0.893 0.949 0.97 0.783 1.226 1.339
Maldives 24.35 37.46 51.33 110.8% 1.5% 1.017 1 1 1.115 1.01 0.977 1.217 1.331 1.379
Asia-South Central 14.3 26.12 36.37 154.3% 1.9% 0.959 1.008 1.006 0.874 1.014 0.987 0.899 1.194 1.306
Indonesia 19.8 26.75 34.26 73.0% 1.1% 0.972 1.014 1 0.997 1.051 0.997 0.838 1.124 1.284
Philippines 26.67 34.97 43.57 63.4% 1.0% 1.036 1.018 1 1.114 1.078 1.017 1.194 1.214 1.27
Vietnam 21.1 33.87 43.82 107.7% 1.5% 0.965 1 1 0.924 0.999 1.005 0.78 1.07 1.172
Thailand 45.09 53.26 60.25 33.6% 0.6% 0.997 1 1 1.062 1.014 1.001 1.109 1.13 1.175
Myanmar 10.96 21.86 31.05 183.3% 2.1% 1.017 1.008 1 1.02 1.117 1.041 1.539 1.552 1.535
Malaysia 30.08 43.34 52.45 74.4% 1.1% 1 1 1 1.089 1.072 1.034 1.23 1.248 1.266
Cambodia 6.731 19.78 30.89 358.9% 3.1% 0.988 0.997 1.005 0.773 0.924 1.03 0.785 1.253 1.328
Lao PDR 10.96 24.89 39.78 263.0% 2.6% 0.953 1.016 1 0.78 0.939 0.955 0.882 1.283 1.355
Singapore 49.64 59.82 63.52 28.0% 0.5% 0.983 1 1 0.929 0.985 1.002 0.882 1.037 1.148
Timor-Leste 9.164 16.83 28.88 215.1% 2.3% 0.962 1.005 1.033 1.015 1.142 1.14 1.228 1.255 1.322
Brunei Darussalam 14.72 31.16 44.27 200.7% 2.2% 1.01 1 1 1.05 1.057 1.032 1.629 1.444 1.404
Asia-South East 23.39 32.43 40.9 74.9% 1.1% 0.989 1.009 1 1.016 1.044 1.009 1.007 1.168 1.261
Base Case: Countries in Year 2060
Descending Population Sequence
VOL2_15 Forecast Tables rev.indd 278 21/08/2009 09:18

279Forecast Tables
Patterns of Potential Human Progress Multination Regional Analysis Measures of Poverty, Health, Education, Infrastructure, and Governance
EducationGender Parity Index Gender Parity Index Gender Parity Index
Tertiary Enrollment Rate, Gross Primary Education Net Enrl Secondary Education Gross Enrl Tertiary Education Gross Enrl
Percent Ratio of Female to Male Rates Ratio of Female to Male Rates Ratio of Female to Male Rates
2010 2035 2060 % Chg % An Chg 2010 2035 2060 2010 2035 2060 2010 2035 2060
ASIA WITH OCEANIA continuedTurkey 36.51 43.84 53.55 46.7% 0.8% 0.957 1 1 0.842 0.966 0.982 0.78 1.04 1.223
Yemen 14.36 23.38 31.36 118.4% 1.6% 0.798 1.007 1 0.54 0.894 0.938 0.461 1.02 1.238
Iraq 20.3 30.18 40.39 99.0% 1.4% 0.874 0.993 1 0.699 0.967 1.008 0.675 1.085 1.198
Saudi Arabia 25.01 37.39 46.43 85.6% 1.2% 0.947 1 1 1.134 1.005 0.982 1.496 1.465 1.404
Syria 18.11 25.03 35.21 94.4% 1.3% 0.986 1 1 0.963 0.985 0.997 0.827 1.163 1.301
Israel 51.85 63.37 72.36 39.6% 0.7% 1.014 1 1 0.998 1.017 1 1.32 1.322 1.327
Azerbaijan 19.45 34.06 39.86 104.9% 1.4% 1.01 1 1 0.985 1.001 1.003 1.09 1.264 1.305
Jordan 39.93 49.42 63.37 58.7% 0.9% 1 1 1 1.024 1.023 0.994 1.06 1.148 1.231
Palestine 37.33 43.56 52.85 41.6% 0.7% 0.991 0.992 1 0.974 0.861 0.938 1.024 1.088 1.157
United Arab Emirates 22.58 37.23 47.45 110.1% 1.5% 0.992 1 1 1.017 1.037 1.024 1.818 1.473 1.418
Oman 19.22 30.44 41.19 114.3% 1.5% 1.014 1 1 0.951 0.949 0.996 1.329 1.612 1.451
Kuwait 15.52 39.75 49.57 219.4% 2.3% 0.99 1 1 1.032 0.941 0.98 2.262 1.677 1.485
Lebanon 45.07 52.44 60.54 34.3% 0.6% 0.991 1 1 1.057 0.967 0.996 1.122 1.185 1.226
Georgia 48.96 55.74 61.54 25.7% 0.5% 1.038 1 1 1.017 1.027 1.012 1.045 1.099 1.144
Armenia 27.92 40.34 47.71 70.9% 1.1% 1.047 1 1 1.038 0.995 0.999 1.233 1.325 1.358
Bahrain 24.73 37.16 46.97 89.9% 1.3% 1.004 1 1 1.054 1.043 1.015 2.03 1.601 1.443
Qatar 12.31 40.08 51.76 320.5% 2.9% 1 1 1 1.017 0.999 1.002 2.954 1.748 1.497
Cyprus 33.66 42.47 51.92 54.2% 0.9% 0.999 1 1 1.026 1.035 0.994 1.191 1.322 1.367
Asia-West 28.32 36.43 45.03 59.0% 0.9% 0.943 1 1 0.889 0.969 0.982 0.951 1.17 1.269
Australia 65.92 71.81 77.17 17.1% 0.3% 1.002 1 1 1.002 1.001 1 1.247 1.264 1.283
Papua New Guniea 3.77 15.37 23.38 520.2% 3.7% 0.86 0.997 1.054 0.788 1.097 1.083 0.694 1.21 1.277
New Zealand 67.82 73.03 80.58 18.8% 0.3% 1 1 1 1.01 1.007 1.001 1.473 1.462 1.411
Solomon Islands 11.71 15.89 22.04 88.2% 1.3% 0.995 0.966 1.007 0.854 0.957 1.021 1.032 1.17 1.251
Fiji 16.4 25.53 37.99 131.6% 1.7% 1.005 1.025 1 1.073 1.087 1.024 1.167 1.224 1.329
Vanuatu 8.369 18.93 32.92 293.4% 2.8% 0.978 1.002 1 0.881 0.947 0.986 0.752 1.103 1.281
Micronesia 16.19 24.46 35.23 117.6% 1.6% 0.981 1.026 1 1.025 0.936 1.037 1.042 1.185 1.314
Tonga 6.589 16.66 32.59 394.6% 3.2% 0.976 1.002 1 1.092 1.13 1.091 1.576 1.389 1.362
Samoa 10.25 21.84 40.49 295.0% 2.8% 1.01 1.002 1 1.131 1.079 1.034 0.998 1.212 1.323
Oceania 51.13 55.49 60.18 17.7% 0.3% 0.983 1 1.014 0.993 1.016 1.017 1.274 1.288 1.301
Base Case: Countries in Year 2060
Descending Population Sequence
VOL2_15 Forecast Tables rev.indd 279 21/08/2009 09:19

Patterns of Potential Hum
an Progress Volume 2: Enhancing Global Education
280
Patterns of Potential Human Progress Multination Regional Analysis Measures of Poverty, Health, Education, Infrastructure, and Governance
EducationGender Parity Index Gender Parity Index Gender Parity Index
Tertiary Enrollment Rate, Gross Primary Education Net Enrl Secondary Education Gross Enrl Tertiary Education Gross Enrl
Percent Ratio of Female to Male Rates Ratio of Female to Male Rates Ratio of Female to Male Rates
2010 2035 2060 % Chg % An Chg 2010 2035 2060 2010 2035 2060 2010 2035 2060
EUROPERussian Federation 62.94 74.12 74.92 19.0% 0.3% 0.993 1 1 0.987 0.983 0.982 1.285 1.243 1.257Ukraine 65.54 74.78 82.05 25.2% 0.5% 0.996 1 1 0.987 0.99 0.99 1.162 1.147 1.127Poland 57 65.06 71.42 25.3% 0.5% 1.002 1 1 0.999 0.999 0.997 1.388 1.386 1.391Romania 41.59 50.41 56.08 34.8% 0.6% 1.005 1 1 0.994 0.968 0.989 1.247 1.257 1.27Czech Republic 46.3 50.45 55.11 19.0% 0.3% 1.025 1 1 1.014 1.007 1 1.164 1.197 1.227Belarus 57.74 66.25 71.86 24.5% 0.4% 0.969 1 1 1.05 1.091 1.052 1.354 1.342 1.349Hungary 54.48 58.99 64.16 17.8% 0.3% 0.986 1 1 0.987 0.988 0.996 1.468 1.474 1.471Bulgaria 43.71 51.56 59.59 36.3% 0.6% 0.992 1 1 0.961 0.977 1.028 1.143 1.185 1.226Slovakia 38.63 46.16 52.95 37.1% 0.6% 1.009 1 1 0.998 0.99 0.997 1.244 1.186 1.188Moldova, Rep. of 30.35 39.64 52.06 71.5% 1.1% 0.981 1 1 1.022 0.992 0.993 1.441 1.345 1.358
Europe-East 58.56 68.06 71.73 22.5% 0.4% 0.996 1 1 0.992 0.989 0.99 1.277 1.256 1.264
United Kingdom 52.28 60.42 69.35 32.7% 0.6% 0.997 1 1 1.021 1.005 1 1.365 1.336 1.327Sweden 66.01 71.95 78.2 18.5% 0.3% 0.996 1 1 0.995 1.004 1 1.529 1.465 1.407Denmark 69.53 76.04 82.72 19.0% 0.3% 1.006 1 1 1.029 1.001 1 1.376 1.377 1.357Ireland 54.63 64.2 68.96 26.2% 0.5% 1.009 1 1 1.062 1.011 1.011 1.251 1.263 1.267Norway 63.32 68.06 72.53 14.5% 0.3% 1.005 1 1 1.005 1 1 1.536 1.531 1.481Finland 85.28 85.34 88.67 4.0% 0.1% 1.003 1 1 1.033 1.003 1 1.204 1.233 1.237Lithuania 63.25 69.93 75.37 19.2% 0.4% 1.001 1 1 0.986 1.002 0.998 1.547 1.522 1.485Latvia 58.45 67.29 74.7 27.8% 0.5% 1.023 1 1 1.001 0.988 0.997 1.744 1.653 1.548Estonia 53.55 59.6 66.34 23.9% 0.4% 0.998 1 1 0.991 1.01 1.014 1.634 1.6 1.572Iceland 51.4 61.05 69.34 34.9% 0.6% 0.982 1 1 1.007 1.007 1.003 1.856 1.714 1.585
Europe-North 57.51 64.65 72.25 25.6% 0.5% 0.999 1 1 1.019 1.005 1.001 1.395 1.368 1.347
Italy 55.71 55.74 59.95 7.6% 0.1% 0.999 1 1 0.988 1.009 1 1.365 1.389 1.404Spain 61.05 63.67 67.94 11.3% 0.2% 1 1 1 1.038 1.002 1.001 1.23 1.27 1.306Greece 86.03 86.31 88.07 2.4% 0.0% 0.999 1 1 0.987 1.016 1.011 1.138 1.139 1.13Portugal 50.3 55.12 63.09 25.4% 0.5% 0.997 1 1 1.077 1.013 0.995 1.269 1.235 1.245Serbia 35.74 45.19 55.28 54.7% 0.9% 0.999 1 1 1.025 0.999 0.994 1.154 1.07 1.072Croatia 37.08 43.37 52.33 41.1% 0.7% 0.995 1 1 1.023 0.999 1 1.191 1.228 1.267Bosnia and Herzegovina 16.99 25.77 35.42 108.5% 1.5% 0.987 1.022 1 0.992 0.985 1.008 1.073 1.258 1.329Albania 16.44 29.21 40.57 146.8% 1.8% 1.004 1 1 0.959 0.944 1.004 1.527 1.396 1.364Macedonia, TFYR 25.93 28.48 36.14 39.4% 0.7% 0.993 1 1 0.979 0.966 1 1.376 1.366 1.369Slovenia 68.42 72.76 79.6 16.3% 0.3% 0.999 1 1 1 0.995 0.999 1.394 1.372 1.325Montenegro 30.77 36.34 44.51 44.7% 0.7% 0.994 1 1 1.017 1.018 0.994 1.246 1.3 1.341Malta 30.04 41.53 53.21 77.1% 1.1% 0.99 1 1 0.99 0.99 1.027 1.314 1.299 1.321
Europe-South 55.34 57.83 62.96 13.8% 0.3% 0.998 1.001 1 1.013 1.004 1.001 1.277 1.292 1.308
Germany 48.46 52.95 61.36 26.6% 0.5% 1 1 1 0.987 0.996 0.997 0.963 1.133 1.269France 51.17 58.08 67.73 32.4% 0.6% 1 1 1 0.999 0.996 0.996 1.259 1.257 1.275Netherlands 57.54 61.3 66.54 15.6% 0.3% 0.997 1 1 0.981 0.99 0.99 1.078 1.124 1.168Belgium 58.85 64.92 73.67 25.2% 0.5% 1.007 1 1 0.975 1 1 1.232 1.265 1.293Austria 52.48 67.8 76.77 46.3% 0.8% 1 1 1 0.964 0.999 1 1.109 1.087 1.144Switzerland 51.53 59.5 68 32.0% 0.6% 1.057 1 1 0.943 1.002 1 0.893 1.035 1.149Luxembourg 16.84 34.12 49.77 195.5% 2.2% 1.032 1 1 1.057 1.003 0.999 1.166 1.302 1.363
Europe-West 50.97 57 65.68 28.9% 0.5% 1.002 1 1 0.987 0.996 0.996 1.094 1.178 1.253
Base Case: Countries in Year 2060
Descending Population Sequence
VOL2_15 Forecast Tables rev.indd 280 21/08/2009 09:19

281Forecast Tables
Patterns of Potential Human Progress Multination Regional Analysis Measures of Poverty, Health, Education, Infrastructure, and Governance
InfrastructureEnergy Demand Ratio to GDP
Water Use per Capita Crop Yield Barrels of Oil Equivalent Carbon Emissions
Annual Thousands of Cubic Meters Annual Metric Tons per Hectare Per Thousand Dollars Billion Tons per Year
2010 2035 2060 % Chg % An Chg 2010 2035 2060 % Chg % An Chg 2010 2035 2060 2010 2035 2060 % Chg % An Chg
World 0.611 0.605 0.59 -3.4% -0.1% 3.213 3.838 4.038 25.7% 0.5% 1.964 1.355 0.753 7.37 11.01 8.344 13.2% 0.2%
Africa 0.234 0.2 0.18 -23.1% -0.5% 2.322 3.074 3.383 45.7% 0.8% 4.076 2.585 1.239 0.351 0.715 0.949 170.4% 2.0%Americas 0.913 0.914 0.867 -5.0% -0.1% 3.166 3.719 3.836 21.2% 0.4% 1.54 1.044 0.631 2.132 3.012 2.447 14.8% 0.3%Asia with Oceania 0.629 0.659 0.693 10.2% 0.2% 3.775 4.431 4.772 26.4% 0.5% 2.52 1.595 0.807 3.343 5.494 3.672 9.8% 0.2%Europe 0.638 0.703 0.726 13.8% 0.3% 3.672 4.119 4.008 9.2% 0.2% 1.744 1.17 0.605 1.535 1.775 1.264 -17.7% -0.4%World 0.611 0.605 0.59 -3.4% -0.1% 3.213 3.838 4.038 25.7% 0.5% 1.964 1.355 0.753 7.37 11.01 8.344 13.2% 0.2%
Africa-Eastern 0.14 0.129 0.123 -12.1% -0.3% 2.571 3.696 3.898 51.6% 0.8% 3.049 2.568 1.106 0.026 0.1 0.258 892.3% 4.7%Africa-Middle 0.022 0.019 0.016 -27.3% -0.6% 2.187 2.749 3.007 37.5% 0.6% 6.34 4.358 2.748 0.039 0.067 0.069 76.9% 1.1%Africa-Northern 0.697 0.698 0.726 4.2% 0.1% 2.685 3.157 3.719 38.5% 0.7% 3.736 2.226 1.077 0.127 0.233 0.216 70.1% 1.1%Africa-Southern 0.264 0.263 0.261 -1.1% 0.0% 1.598 1.862 1.848 15.6% 0.3% 4.046 2.012 0.912 0.102 0.165 0.222 117.6% 1.6%Africa-Western 0.099 0.094 0.092 -7.1% -0.1% 2.239 2.983 3.433 53.3% 0.9% 4.831 3.606 2.041 0.056 0.15 0.184 228.6% 2.4%Africa 0.234 0.2 0.18 -23.1% -0.5% 2.322 3.074 3.383 45.7% 0.8% 4.076 2.585 1.239 0.351 0.715 0.949 170.4% 2.0%
America-Caribbean 0.439 0.417 0.397 -9.6% -0.2% 3.499 3.76 3.541 1.2% 0.0% 1.821 1.199 0.687 0.028 0.046 0.05 78.6% 1.2%America-Central 0.23 0.21 0.195 -15.2% -0.3% 3.087 3.605 3.748 21.4% 0.4% 1.871 1.433 0.816 0.016 0.04 0.05 212.5% 2.3%America-North 1.428 1.45 1.369 -4.1% -0.1% 2.217 2.741 2.743 23.7% 0.4% 1.469 0.977 0.581 1.819 2.419 1.79 -1.6% 0.0%America-South 0.451 0.467 0.466 3.3% 0.1% 3.144 3.993 4.43 40.9% 0.7% 2.055 1.386 0.79 0.269 0.507 0.557 107.1% 1.5%Americas 0.913 0.914 0.867 -5.0% -0.1% 3.166 3.719 3.836 21.2% 0.4% 1.54 1.044 0.631 2.132 3.012 2.447 14.8% 0.3%
Asia-East 0.504 0.52 0.525 4.2% 0.1% 5.212 5.577 5.363 2.9% 0.1% 2.052 1.381 0.722 1.935 2.945 1.344 -30.5% -0.7%Asia-South Central 0.738 0.766 0.815 10.4% 0.2% 2.772 3.699 4.319 55.8% 0.9% 4.38 2.163 0.952 0.571 1.296 1.178 106.3% 1.5%Asia-South East 0.576 0.583 0.58 0.7% 0.0% 3.261 3.979 4.448 36.4% 0.6% 3.339 2.077 1.068 0.315 0.459 0.315 0.0% 0.0%Asia-West 0.781 0.794 0.812 4.0% 0.1% 5.476 6.085 6.357 16.1% 0.3% 3.485 1.799 0.881 0.36 0.595 0.632 75.6% 1.1%Oceania 0.877 0.915 1.034 17.9% 0.3% 1.446 1.92 2.244 55.2% 0.9% 2.33 1.371 0.708 0.162 0.199 0.204 25.9% 0.5%Asia with Oceania 0.629 0.659 0.693 10.2% 0.2% 3.775 4.431 4.772 26.4% 0.5% 2.52 1.595 0.807 3.343 5.494 3.672 9.8% 0.2%
Europe-East 0.591 0.688 0.72 21.8% 0.4% 2.792 3.292 3.231 15.7% 0.3% 6.662 2.688 1.147 0.611 0.725 0.439 -28.2% -0.7%Europe-North 0.279 0.287 0.293 5.0% 0.1% 2.828 3.155 3.057 8.1% 0.2% 1.217 0.806 0.44 0.258 0.277 0.196 -24.0% -0.5%Europe-South 1.138 1.295 1.441 26.6% 0.5% 3.787 4.487 4.692 23.9% 0.4% 1.24 0.957 0.647 0.245 0.289 0.231 -5.7% -0.1%Europe-West 0.519 0.531 0.516 -0.6% 0.0% 5.472 5.726 5.1 -6.8% -0.1% 1.245 0.859 0.492 0.43 0.496 0.409 -4.9% -0.1%Europe 0.638 0.703 0.726 13.8% 0.3% 3.672 4.119 4.008 9.2% 0.2% 1.744 1.17 0.605 1.535 1.775 1.264 -17.7% -0.4%
Base Case
Source: International Futures Version 6.12, March 2009
VOL2_15 Forecast Tables rev.indd 281 21/08/2009 09:19
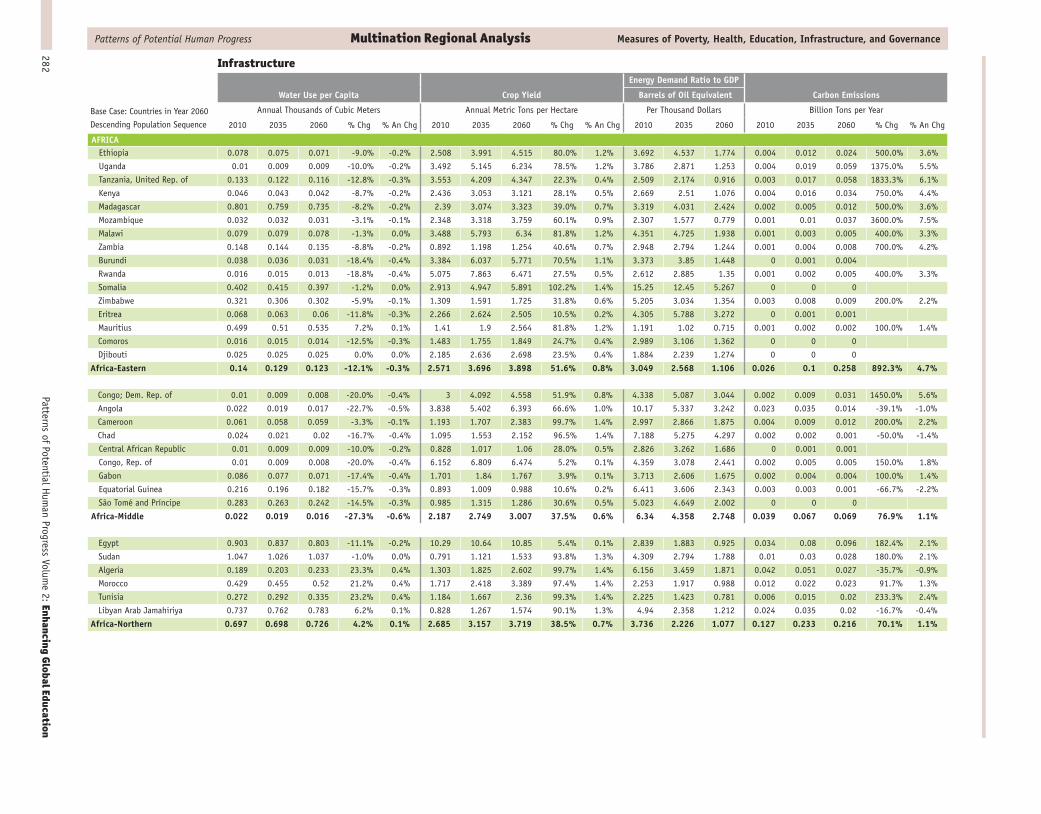
Patterns of Potential Hum
an Progress Volume 2: Enhancing Global Education
282
Patterns of Potential Human Progress Multination Regional Analysis Measures of Poverty, Health, Education, Infrastructure, and Governance
InfrastructureEnergy Demand Ratio to GDP
Water Use per Capita Crop Yield Barrels of Oil Equivalent Carbon Emissions
Annual Thousands of Cubic Meters Annual Metric Tons per Hectare Per Thousand Dollars Billion Tons per Year
2010 2035 2060 % Chg % An Chg 2010 2035 2060 % Chg % An Chg 2010 2035 2060 2010 2035 2060 % Chg % An Chg
AFRICAEthiopia 0.078 0.075 0.071 -9.0% -0.2% 2.508 3.991 4.515 80.0% 1.2% 3.692 4.537 1.774 0.004 0.012 0.024 500.0% 3.6%
Uganda 0.01 0.009 0.009 -10.0% -0.2% 3.492 5.145 6.234 78.5% 1.2% 3.786 2.871 1.253 0.004 0.019 0.059 1375.0% 5.5%
Tanzania, United Rep. of 0.133 0.122 0.116 -12.8% -0.3% 3.553 4.209 4.347 22.3% 0.4% 2.509 2.174 0.916 0.003 0.017 0.058 1833.3% 6.1%
Kenya 0.046 0.043 0.042 -8.7% -0.2% 2.436 3.053 3.121 28.1% 0.5% 2.669 2.51 1.076 0.004 0.016 0.034 750.0% 4.4%
Madagascar 0.801 0.759 0.735 -8.2% -0.2% 2.39 3.074 3.323 39.0% 0.7% 3.319 4.031 2.424 0.002 0.005 0.012 500.0% 3.6%
Mozambique 0.032 0.032 0.031 -3.1% -0.1% 2.348 3.318 3.759 60.1% 0.9% 2.307 1.577 0.779 0.001 0.01 0.037 3600.0% 7.5%
Malawi 0.079 0.079 0.078 -1.3% 0.0% 3.488 5.793 6.34 81.8% 1.2% 4.351 4.725 1.938 0.001 0.003 0.005 400.0% 3.3%
Zambia 0.148 0.144 0.135 -8.8% -0.2% 0.892 1.198 1.254 40.6% 0.7% 2.948 2.794 1.244 0.001 0.004 0.008 700.0% 4.2%
Burundi 0.038 0.036 0.031 -18.4% -0.4% 3.384 6.037 5.771 70.5% 1.1% 3.373 3.85 1.448 0 0.001 0.004
Rwanda 0.016 0.015 0.013 -18.8% -0.4% 5.075 7.863 6.471 27.5% 0.5% 2.612 2.885 1.35 0.001 0.002 0.005 400.0% 3.3%
Somalia 0.402 0.415 0.397 -1.2% 0.0% 2.913 4.947 5.891 102.2% 1.4% 15.25 12.45 5.267 0 0 0
Zimbabwe 0.321 0.306 0.302 -5.9% -0.1% 1.309 1.591 1.725 31.8% 0.6% 5.205 3.034 1.354 0.003 0.008 0.009 200.0% 2.2%
Eritrea 0.068 0.063 0.06 -11.8% -0.3% 2.266 2.624 2.505 10.5% 0.2% 4.305 5.788 3.272 0 0.001 0.001
Mauritius 0.499 0.51 0.535 7.2% 0.1% 1.41 1.9 2.564 81.8% 1.2% 1.191 1.02 0.715 0.001 0.002 0.002 100.0% 1.4%
Comoros 0.016 0.015 0.014 -12.5% -0.3% 1.483 1.755 1.849 24.7% 0.4% 2.989 3.106 1.362 0 0 0
Djibouti 0.025 0.025 0.025 0.0% 0.0% 2.185 2.636 2.698 23.5% 0.4% 1.884 2.239 1.274 0 0 0
Africa-Eastern 0.14 0.129 0.123 -12.1% -0.3% 2.571 3.696 3.898 51.6% 0.8% 3.049 2.568 1.106 0.026 0.1 0.258 892.3% 4.7%
Congo; Dem. Rep. of 0.01 0.009 0.008 -20.0% -0.4% 3 4.092 4.558 51.9% 0.8% 4.338 5.087 3.044 0.002 0.009 0.031 1450.0% 5.6%
Angola 0.022 0.019 0.017 -22.7% -0.5% 3.838 5.402 6.393 66.6% 1.0% 10.17 5.337 3.242 0.023 0.035 0.014 -39.1% -1.0%
Cameroon 0.061 0.058 0.059 -3.3% -0.1% 1.193 1.707 2.383 99.7% 1.4% 2.997 2.866 1.875 0.004 0.009 0.012 200.0% 2.2%
Chad 0.024 0.021 0.02 -16.7% -0.4% 1.095 1.553 2.152 96.5% 1.4% 7.188 5.275 4.297 0.002 0.002 0.001 -50.0% -1.4%
Central African Republic 0.01 0.009 0.009 -10.0% -0.2% 0.828 1.017 1.06 28.0% 0.5% 2.826 3.262 1.686 0 0.001 0.001
Congo, Rep. of 0.01 0.009 0.008 -20.0% -0.4% 6.152 6.809 6.474 5.2% 0.1% 4.359 3.078 2.441 0.002 0.005 0.005 150.0% 1.8%
Gabon 0.086 0.077 0.071 -17.4% -0.4% 1.701 1.84 1.767 3.9% 0.1% 3.713 2.606 1.675 0.002 0.004 0.004 100.0% 1.4%
Equatorial Guinea 0.216 0.196 0.182 -15.7% -0.3% 0.893 1.009 0.988 10.6% 0.2% 6.411 3.606 2.343 0.003 0.003 0.001 -66.7% -2.2%
São Tomé and Príncipe 0.283 0.263 0.242 -14.5% -0.3% 0.985 1.315 1.286 30.6% 0.5% 5.023 4.649 2.002 0 0 0
Africa-Middle 0.022 0.019 0.016 -27.3% -0.6% 2.187 2.749 3.007 37.5% 0.6% 6.34 4.358 2.748 0.039 0.067 0.069 76.9% 1.1%
Egypt 0.903 0.837 0.803 -11.1% -0.2% 10.29 10.64 10.85 5.4% 0.1% 2.839 1.883 0.925 0.034 0.08 0.096 182.4% 2.1%
Sudan 1.047 1.026 1.037 -1.0% 0.0% 0.791 1.121 1.533 93.8% 1.3% 4.309 2.794 1.788 0.01 0.03 0.028 180.0% 2.1%
Algeria 0.189 0.203 0.233 23.3% 0.4% 1.303 1.825 2.602 99.7% 1.4% 6.156 3.459 1.871 0.042 0.051 0.027 -35.7% -0.9%
Morocco 0.429 0.455 0.52 21.2% 0.4% 1.717 2.418 3.389 97.4% 1.4% 2.253 1.917 0.988 0.012 0.022 0.023 91.7% 1.3%
Tunisia 0.272 0.292 0.335 23.2% 0.4% 1.184 1.667 2.36 99.3% 1.4% 2.225 1.423 0.781 0.006 0.015 0.02 233.3% 2.4%
Libyan Arab Jamahiriya 0.737 0.762 0.783 6.2% 0.1% 0.828 1.267 1.574 90.1% 1.3% 4.94 2.358 1.212 0.024 0.035 0.02 -16.7% -0.4%
Africa-Northern 0.697 0.698 0.726 4.2% 0.1% 2.685 3.157 3.719 38.5% 0.7% 3.736 2.226 1.077 0.127 0.233 0.216 70.1% 1.1%
Base Case: Countries in Year 2060
Descending Population Sequence
VOL2_15 Forecast Tables rev.indd 282 21/08/2009 09:19

283Forecast Tables
Patterns of Potential Human Progress Multination Regional Analysis Measures of Poverty, Health, Education, Infrastructure, and Governance
InfrastructureEnergy Demand Ratio to GDP
Water Use per Capita Crop Yield Barrels of Oil Equivalent Carbon Emissions
Annual Thousands of Cubic Meters Annual Metric Tons per Hectare Per Thousand Dollars Billion Tons per Year
2010 2035 2060 % Chg % An Chg 2010 2035 2060 % Chg % An Chg 2010 2035 2060 2010 2035 2060 % Chg % An Chg
AFRICA continuedSouth Africa 0.269 0.269 0.268 -0.4% 0.0% 1.464 1.744 1.826 24.7% 0.4% 4.266 2.139 0.939 0.099 0.156 0.209 111.1% 1.5%
Namibia 0.149 0.145 0.137 -8.1% -0.2% 0.797 0.939 0.884 10.9% 0.2% 2.348 1.516 0.768 0.001 0.003 0.006 500.0% 3.6%
Lesotho 0.028 0.027 0.026 -7.1% -0.1% 1.908 2.215 2.132 11.7% 0.2% 2.051 2.077 1.129 0 0.001 0.001
Botswana 0.108 0.105 0.101 -6.5% -0.1% 1.43 1.68 1.479 3.4% 0.1% 1.341 0.905 0.631 0.001 0.004 0.005 400.0% 3.3%
Swaziland 0.912 0.851 0.834 -8.6% -0.2% 2.394 2.732 2.92 22.0% 0.4% 2.18 1.794 0.929 0 0.001 0.002
Africa-Southern 0.264 0.263 0.261 -1.1% 0.0% 1.598 1.862 1.848 15.6% 0.3% 4.046 2.012 0.912 0.102 0.165 0.222 117.6% 1.6%
Nigeria 0.061 0.055 0.05 -18.0% -0.4% 3.99 5.605 6.617 65.8% 1.0% 6.063 3.892 2.974 0.042 0.105 0.109 159.5% 1.9%
Niger 0.156 0.148 0.145 -7.1% -0.1% 1.261 1.973 2.506 98.7% 1.4% 3.79 4.283 1.775 0.001 0.003 0.007 600.0% 4.0%
Côte d’Ivoire 0.051 0.046 0.043 -15.7% -0.3% 1.344 1.738 1.912 42.3% 0.7% 2.347 2.515 1.489 0.003 0.009 0.011 266.7% 2.6%
Ghana 0.045 0.046 0.044 -2.2% 0.0% 3.769 5.52 6.433 70.7% 1.1% 4.164 4.116 2.05 0.003 0.006 0.007 133.3% 1.7%
Burkina Faso 0.061 0.059 0.06 -1.6% 0.0% 1.329 1.944 2.665 100.5% 1.4% 3.463 3.242 1.317 0.001 0.005 0.011 1000.0% 4.9%
Mali 0.488 0.462 0.469 -3.9% -0.1% 1.167 1.675 2.329 99.6% 1.4% 3.677 3.693 1.567 0.001 0.005 0.008 700.0% 4.2%
Senegal 0.191 0.178 0.167 -12.6% -0.3% 1.374 1.755 1.783 29.8% 0.5% 2.986 2.884 1.423 0.002 0.006 0.01 400.0% 3.3%
Guinea 0.161 0.142 0.128 -20.5% -0.5% 2.847 3.317 3.256 14.4% 0.3% 2.563 2.549 1.289 0.001 0.004 0.006 500.0% 3.6%
Benin 0.016 0.015 0.015 -6.3% -0.1% 3.496 5.068 6.32 80.8% 1.2% 2.756 3.359 1.535 0.001 0.003 0.006 500.0% 3.6%
Togo 0.027 0.024 0.023 -14.8% -0.3% 0.967 1.048 1.024 5.9% 0.1% 3.681 4.65 2.468 0.001 0.001 0.001 0.0% 0.0%
Sierra Leone 0.067 0.065 0.063 -6.0% -0.1% 3.659 4.64 5.441 48.7% 0.8% 2.633 2.457 1.171 0 0.002 0.003
Liberia 0.032 0.028 0.026 -18.8% -0.4% 1.747 1.76 1.683 -3.7% -0.1% 2.726 4.168 1.953 0 0 0.001
Mauritania 0.563 0.539 0.518 -8.0% -0.2% 1.864 2.615 3.13 67.9% 1.0% 3.19 3.687 1.869 0 0.001 0.001
Guinea-Bissau 0.111 0.099 0.09 -18.9% -0.4% 1.075 1.339 1.285 19.5% 0.4% 3.605 4.775 2.366 0 0 0
Gambia 0.02 0.018 0.017 -15.0% -0.3% 1.819 2.03 1.899 4.4% 0.1% 2.945 3.381 1.714 0 0 0.001
Cape Verde 0.04 0.039 0.038 -5.0% -0.1% 4.123 5.707 6.645 61.2% 1.0% 1.418 1.23 0.782 0 0 0.001
Africa-Western 0.099 0.094 0.092 -7.1% -0.1% 2.239 2.983 3.433 53.3% 0.9% 4.831 3.606 2.041 0.056 0.15 0.184 228.6% 2.4%
Base Case: Countries in Year 2060
Descending Population Sequence
VOL2_15 Forecast Tables rev.indd 283 21/08/2009 09:19

Patterns of Potential Hum
an Progress Volume 2: Enhancing Global Education
284
Patterns of Potential Human Progress Multination Regional Analysis Measures of Poverty, Health, Education, Infrastructure, and Governance
InfrastructureEnergy Demand Ratio to GDP
Water Use per Capita Crop Yield Barrels of Oil Equivalent Carbon Emissions
Annual Thousands of Cubic Meters Annual Metric Tons per Hectare Per Thousand Dollars Billion Tons per Year
2010 2035 2060 % Chg % An Chg 2010 2035 2060 % Chg % An Chg 2010 2035 2060 2010 2035 2060 % Chg % An Chg
AMERICASHaiti 0.116 0.109 0.103 -11.2% -0.2% 2.371 2.56 2.335 -1.5% 0.0% 2.427 2.896 1.637 0.001 0.002 0.003 200.0% 2.2%
Dominican Republic 0.384 0.386 0.371 -3.4% -0.1% 1.763 2.219 2.146 21.7% 0.4% 2.43 1.36 0.763 0.007 0.015 0.017 142.9% 1.8%
Cuba 0.744 0.804 0.89 19.6% 0.4% 1.132 1.383 1.607 42.0% 0.7% 2.731 1.685 0.776 0.008 0.012 0.016 100.0% 1.4%
Puerto Rico 0.755 0.725 0.698 -7.5% -0.2% 10.45 10.73 9.609 -8.0% -0.2% 0.424 0.52 0.423 0.002 0.007 0.009 350.0% 3.1%
Jamaica 0.161 0.162 0.159 -1.2% 0.0% 3.32 3.625 3.429 3.3% 0.1% 2.904 2.109 1.017 0.002 0.003 0.002 0.0% 0.0%
Trinidad and Tobago 0.24 0.245 0.249 3.8% 0.1% 1.569 1.813 1.775 13.1% 0.2% 5.41 2.412 1.064 0.007 0.005 0.001 -85.7% -3.8%
Bahamas 0.301 0.289 0.285 -5.3% -0.1% 9.227 9.376 9.197 -0.3% 0.0% 0.529 0.631 0.522 0 0.001 0.001
Barbados 0.338 0.341 0.345 2.1% 0.0% 2.444 2.609 2.217 -9.3% -0.2% 0.77 0.801 0.586 0 0 0
St. Vincent & the Grenadines 0.087 0.09 0.086 -1.1% 0.0% 1.309 1.508 1.347 2.9% 0.1% 1.389 1.332 0.79 0 0 0
Grenada 0.287 0.291 0.276 -3.8% -0.1% 1.689 1.964 1.792 6.1% 0.1% 1.273 1.37 0.815 0 0 0
St. Lucia 0.063 0.066 0.068 7.9% 0.2% 3.225 3.582 3.501 8.6% 0.2% 1.154 1.128 0.758 0 0 0
America-Caribbean 0.439 0.417 0.397 -9.6% -0.2% 3.499 3.76 3.541 1.2% 0.0% 1.821 1.199 0.687 0.028 0.046 0.05 78.6% 1.2%
Guatemala 0.16 0.147 0.139 -13.1% -0.3% 2.545 3.061 3.205 25.9% 0.5% 1.882 1.829 1.018 0.005 0.015 0.021 320.0% 2.9%
Honduras 0.119 0.115 0.108 -9.2% -0.2% 2.155 2.33 2.147 -0.4% 0.0% 3.112 2.483 1.165 0.002 0.006 0.007 250.0% 2.5%
El Salvador 0.186 0.181 0.176 -5.4% -0.1% 1.971 2.351 2.424 23.0% 0.4% 1.974 1.546 0.84 0.003 0.006 0.007 133.3% 1.7%
Nicaragua 0.256 0.248 0.238 -7.0% -0.1% 0.918 1.089 1.047 14.1% 0.3% 3.13 2.52 1.231 0.001 0.003 0.003 200.0% 2.2%
Costa Rica 0.624 0.574 0.559 -10.4% -0.2% 8.024 8.436 8.714 8.6% 0.2% 1.304 0.933 0.591 0.002 0.004 0.003 50.0% 0.8%
Panama 0.262 0.268 0.248 -5.3% -0.1% 2.059 2.487 2.164 5.1% 0.1% 1.64 1.063 0.66 0.003 0.006 0.009 200.0% 2.2%
Belize 0.545 0.552 0.561 2.9% 0.1% 3.939 5.479 6.539 66.0% 1.0% 1.134 0.96 0.68 0 0 0.001
America-Central 0.23 0.21 0.195 -15.2% -0.3% 3.087 3.605 3.748 21.4% 0.4% 1.871 1.433 0.816 0.016 0.04 0.05 212.5% 2.3%
United States of America 1.655 1.672 1.546 -6.6% -0.1% 2.882 3.49 3.388 17.6% 0.3% 1.377 0.923 0.553 1.529 2.051 1.541 0.8% 0.0%
Mexico 0.773 0.803 0.818 5.8% 0.1% 2.228 2.87 3.042 36.5% 0.6% 1.743 1.292 0.803 0.117 0.181 0.161 37.6% 0.6%
Canada 1.444 1.502 1.42 -1.7% 0.0% 1.541 1.864 1.798 16.7% 0.3% 2.48 1.434 0.71 0.173 0.187 0.087 -49.7% -1.4%
America-North 1.428 1.45 1.369 -4.1% -0.1% 2.217 2.741 2.743 23.7% 0.4% 1.469 0.977 0.581 1.819 2.419 1.79 -1.6% 0.0%
Brazil 0.324 0.328 0.319 -1.5% 0.0% 2.152 2.513 2.53 17.6% 0.3% 1.924 1.368 0.777 0.1 0.198 0.246 146.0% 1.8%
Colombia 0.235 0.235 0.235 0.0% 0.0% 4.174 4.881 5.327 27.6% 0.5% 2.939 1.958 0.934 0.036 0.07 0.073 102.8% 1.4%
Argentina 0.795 0.881 0.879 10.6% 0.2% 1.639 2.271 2.447 49.3% 0.8% 1.329 0.986 0.648 0.037 0.063 0.07 89.2% 1.3%
Venezuela, RB 0.32 0.329 0.357 11.6% 0.2% 2.896 4.091 5.702 96.9% 1.4% 3.41 1.879 1.023 0.049 0.075 0.062 26.5% 0.5%
Peru 0.741 0.783 0.844 13.9% 0.3% 3.522 4.992 6.415 82.1% 1.2% 1.919 1.504 0.885 0.012 0.028 0.031 158.3% 1.9%
Chile 0.798 0.803 0.806 1.0% 0.0% 5.638 6.775 7.057 25.2% 0.4% 1.946 1.079 0.63 0.016 0.041 0.048 200.0% 2.2%
Ecuador 1.332 1.35 1.276 -4.2% -0.1% 4.694 6.153 5.915 26.0% 0.5% 5.423 3.707 2.238 0.012 0.014 0.004 -66.7% -2.2%
Bolivia 0.157 0.17 0.178 13.4% 0.3% 1.397 1.878 2.291 64.0% 1.0% 4.686 2.451 1.184 0.004 0.011 0.012 200.0% 2.2%
Paraguay 0.084 0.077 0.076 -9.5% -0.2% 2.648 3.165 3.509 32.5% 0.6% 2.44 2.315 1.358 0 0.001 0.004
Uruguay 0.97 1.143 1.228 26.6% 0.5% 2.925 4.113 4.708 61.0% 1.0% 1.128 0.916 0.639 0.002 0.005 0.006 200.0% 2.2%
Guyana 2.369 2.999 3.622 52.9% 0.9% 1.345 1.853 2.194 63.1% 1.0% 2.348 1.971 0.969 0 0 0.001
Suriname 1.542 1.65 1.705 10.6% 0.2% 4.701 5.234 5.069 7.8% 0.2% 1.644 1.437 0.897 0 0 0.001
America-South 0.451 0.467 0.466 3.3% 0.1% 3.144 3.993 4.43 40.9% 0.7% 2.055 1.386 0.79 0.269 0.507 0.557 107.1% 1.5%
Base Case: Countries in Year 2060
Descending Population Sequence
VOL2_15 Forecast Tables rev.indd 284 21/08/2009 09:20

285Forecast Tables
Patterns of Potential Human Progress Multination Regional Analysis Measures of Poverty, Health, Education, Infrastructure, and Governance
InfrastructureEnergy Demand Ratio to GDP
Water Use per Capita Crop Yield Barrels of Oil Equivalent Carbon Emissions
Annual Thousands of Cubic Meters Annual Metric Tons per Hectare Per Thousand Dollars Billion Tons per Year
2010 2035 2060 % Chg % An Chg 2010 2035 2060 % Chg % An Chg 2010 2035 2060 2010 2035 2060 % Chg % An Chg
ASIA WITH OCEANIAChina 0.444 0.459 0.465 4.7% 0.1% 6.307 7.197 7.498 18.9% 0.3% 4.344 1.682 0.771 1.379 2.3 0.915 -33.6% -0.8%
Japan 0.698 0.731 0.772 10.6% 0.2% 10.28 10.33 9.285 -9.7% -0.2% 0.777 0.619 0.404 0.302 0.297 0.196 -35.1% -0.9%
Korea, Rep. of 0.388 0.391 0.42 8.2% 0.2% 10.37 10.67 10.1 -2.6% -0.1% 2.2 1.161 0.641 0.136 0.202 0.121 -11.0% -0.2%
Taiwan 3.159 3.276 3.273 3.6% 0.1% 2.234 2.818 2.747 23.0% 0.4% 1.769 1.128 0.614 0.056 0.085 0.082 46.4% 0.8%
Korea, Dem. Rep. of 0.413 0.429 0.447 8.2% 0.2% 4.414 4.859 4.97 12.6% 0.2% 15.01 7.934 3.229 0.046 0.039 0.013 -71.7% -2.5%
Hong Kong 0.683 0.677 0.668 -2.2% 0.0% 2.224 2.428 2.268 2.0% 0.0% 0.681 0.55 0.396 0.015 0.019 0.012 -20.0% -0.4%
Mongolia 0.173 0.171 0.163 -5.8% -0.1% 0.648 0.733 0.68 4.9% 0.1% 5.483 3.441 1.415 0.001 0.003 0.005 400.0% 3.3%
Asia-East 0.504 0.52 0.525 4.2% 0.1% 5.212 5.577 5.363 2.9% 0.1% 2.052 1.381 0.722 1.935 2.945 1.344 -30.5% -0.7%
India 0.602 0.635 0.699 16.1% 0.3% 2.708 3.866 5.394 99.2% 1.4% 4.013 1.99 0.883 0.366 0.848 0.76 107.7% 1.5%
Pakistan 1.101 1.064 1.074 -2.5% 0.0% 3.014 4.295 5.867 94.7% 1.3% 3.973 3.025 1.443 0.033 0.092 0.082 148.5% 1.8%
Bangladesh 0.562 0.547 0.544 -3.2% -0.1% 6.176 7.085 7.51 21.6% 0.4% 2.414 2.003 1.099 0.015 0.054 0.06 300.0% 2.8%
Afghanistan 0.75 0.7 0.608 -18.9% -0.4% 1.411 2.196 1.723 22.1% 0.4% 5.596 6.285 3.012 0.002 0.006 0.01 400.0% 3.3%
Iran, Islamic Rep. of 1.104 1.156 1.285 16.4% 0.3% 3.465 4.804 6.291 81.6% 1.2% 5.299 2.459 1.418 0.077 0.15 0.153 98.7% 1.4%
Nepal 0.386 0.389 0.4 3.6% 0.1% 4.01 5.651 6.57 63.8% 1.0% 3.361 3.375 1.658 0.002 0.007 0.008 300.0% 2.8%
Uzbekistan 2.279 2.404 2.583 13.3% 0.3% 2.616 3.729 4.536 73.4% 1.1% 8.577 4.834 2.338 0.014 0.021 0.025 78.6% 1.2%
Sri Lanka 0.649 0.69 0.713 9.9% 0.2% 3.057 3.504 3.737 22.2% 0.4% 2.32 1.726 0.897 0.005 0.015 0.018 260.0% 2.6%
Kazakhstan 2.4 2.332 2.553 6.4% 0.1% 0.825 0.797 0.837 1.5% 0.0% 11.52 3.303 1.515 0.052 0.09 0.051 -1.9% 0.0%
Tajikistan 1.892 1.978 2.172 14.8% 0.3% 2.567 3.66 4.812 87.5% 1.3% 6.523 4.54 1.791 0 0.002 0.001
Turkmenistan 5.302 5.616 5.846 10.3% 0.2% 2.45 3.522 4.119 68.1% 1.0% 8.39 2.849 1.958 0.004 0.01 0.006 50.0% 0.8%
Kyrgyzstan 2.037 2.218 2.443 19.9% 0.4% 2.537 3.603 4.294 69.3% 1.1% 7.09 4.806 2.111 0.001 0.001 0.001 0.0% 0.0%
Bhutan 0.702 0.767 0.727 3.6% 0.1% 1.775 2.286 2.286 28.8% 0.5% 2.313 1.648 0.881 0 0.001 0.001
Maldives 0.01 0.01 0.009 -10.0% -0.2% 2.201 2.791 2.496 13.4% 0.3% 1.095 0.895 0.585 0 0 0.001
Asia-South Central 0.738 0.766 0.815 10.4% 0.2% 2.772 3.699 4.319 55.8% 0.9% 4.38 2.163 0.952 0.571 1.296 1.178 106.3% 1.5%
Indonesia 0.385 0.412 0.415 7.8% 0.2% 3.215 4.169 4.288 33.4% 0.6% 4.068 2.71 1.45 0.109 0.109 0.042 -61.5% -1.9%
Philippines 0.344 0.338 0.335 -2.6% -0.1% 3.702 4.224 4.466 20.6% 0.4% 2.746 1.963 0.956 0.024 0.068 0.082 241.7% 2.5%
Vietnam 0.873 0.868 0.88 0.8% 0.0% 6.999 7.469 7.77 11.0% 0.2% 4.832 2.365 1.096 0.032 0.041 0.003 -90.6% -4.6%
Thailand 1.313 1.405 1.412 7.5% 0.1% 3.276 3.716 3.651 11.4% 0.2% 3.529 1.917 0.883 0.06 0.096 0.088 46.7% 0.8%
Myanmar 0.662 0.69 0.717 8.3% 0.2% 3.142 3.5 3.595 14.4% 0.3% 1.155 1.601 1.327 0.008 0.015 0.019 137.5% 1.7%
Malaysia 0.358 0.351 0.338 -5.6% -0.1% 0.642 0.757 0.664 3.4% 0.1% 3.703 1.713 0.851 0.043 0.079 0.044 2.3% 0.0%
Cambodia 0.294 0.296 0.323 9.9% 0.2% 1.682 2.388 3.404 102.4% 1.4% 2.739 1.852 0.969 0.002 0.009 0.011 450.0% 3.5%
Lao PDR 0.517 0.577 0.607 17.4% 0.3% 3.753 5.335 6.499 73.2% 1.1% 3.393 1.959 0.948 0.001 0.004 0.008 700.0% 4.2%
Singapore 0.044 0.044 0.046 4.5% 0.1% 2.269 2.576 3.032 33.6% 0.6% 2.397 1.454 0.831 0.032 0.033 0.015 -53.1% -1.5%
Timor-Leste 0.373 0.354 0.335 -10.2% -0.2% 4.957 6.527 7.159 44.4% 0.7% 4.881 4.216 1.525 0 0.001 0.001
Brunei Darussalam 0.241 0.239 0.25 3.7% 0.1% 2.229 3.11 4.399 97.4% 1.4% 6.295 2.881 1.291 0.004 0.005 0.002 -50.0% -1.4%
Asia-South East 0.576 0.583 0.58 0.7% 0.0% 3.261 3.979 4.448 36.4% 0.6% 3.339 2.077 1.068 0.315 0.459 0.315 0.0% 0.0%
Base Case: Countries in Year 2060
Descending Population Sequence
VOL2_15 Forecast Tables rev.indd 285 21/08/2009 09:20

Patterns of Potential Hum
an Progress Volume 2: Enhancing Global Education
286
Patterns of Potential Human Progress Multination Regional Analysis Measures of Poverty, Health, Education, Infrastructure, and Governance
InfrastructureEnergy Demand Ratio to GDP
Water Use per Capita Crop Yield Barrels of Oil Equivalent Carbon Emissions
Annual Thousands of Cubic Meters Annual Metric Tons per Hectare Per Thousand Dollars Billion Tons per Year
2010 2035 2060 % Chg % An Chg 2010 2035 2060 % Chg % An Chg 2010 2035 2060 2010 2035 2060 % Chg % An Chg
ASIA WITH OCEANIA continuedTurkey 0.57 0.63 0.702 23.2% 0.4% 3.041 4.326 5.503 81.0% 1.2% 2.342 1.33 0.723 0.062 0.134 0.179 188.7% 2.1%
Yemen 0.314 0.287 0.272 -13.4% -0.3% 3.685 4.382 4.469 21.3% 0.4% 5.257 3.23 1.761 0.007 0.021 0.034 385.7% 3.2%
Iraq 1.613 1.622 1.673 3.7% 0.1% 1.216 1.633 2.054 68.9% 1.1% 3.274 2.057 1.131 0.008 0.032 0.076 850.0% 4.6%
Saudi Arabia 0.755 0.73 0.746 -1.2% 0.0% 2.002 2.755 3.782 88.9% 1.3% 5.105 2.458 1.094 0.129 0.183 0.161 24.8% 0.4%
Syria 1.027 0.918 0.868 -15.5% -0.3% 1.927 2.136 2.2 14.2% 0.3% 4.793 3.115 1.408 0.012 0.024 0.027 125.0% 1.6%
Israel 0.29 0.252 0.226 -22.1% -0.5% 10.53 10.63 9.07 -13.9% -0.3% 1.135 0.798 0.504 0.016 0.036 0.039 143.8% 1.8%
Azerbaijan 2.106 2.235 2.326 10.4% 0.2% 2.391 3.227 3.524 47.4% 0.8% 6.52 2.999 1.587 0.01 0.014 0.005 -50.0% -1.4%
Jordan 0.189 0.183 0.175 -7.4% -0.2% 5.302 6.483 6.773 27.7% 0.5% 3.092 1.553 0.749 0.004 0.01 0.019 375.0% 3.2%
Palestine 0.495 0.458 0.445 -10.1% -0.2% 10.82 12.05 13.08 20.9% 0.4% 2.415 2.086 1.106 0.001 0.004 0.006 500.0% 3.6%
United Arab Emirates 0.506 0.465 0.461 -8.9% -0.2% 7.829 7.582 7.488 -4.4% -0.1% 2.733 1.568 0.858 0.03 0.035 0.029 -3.3% -0.1%
Oman 0.528 0.495 0.484 -8.3% -0.2% 7.094 7.69 8.304 17.1% 0.3% 3.398 1.891 0.991 0.009 0.013 0.007 -22.2% -0.5%
Kuwait 0.172 0.162 0.159 -7.6% -0.2% 10.7 10.97 11.14 4.1% 0.1% 4.956 2.307 1.206 0.031 0.043 0.025 -19.4% -0.4%
Lebanon 0.383 0.358 0.357 -6.8% -0.1% 10.49 11.01 11.59 10.5% 0.2% 2.078 1.305 0.752 0.004 0.007 0.006 50.0% 0.8%
Georgia 0.858 1.109 1.372 59.9% 0.9% 2.722 3.558 4.125 51.5% 0.8% 3.338 2.401 1.217 0.001 0.002 0.002 100.0% 1.4%
Armenia 1.003 1.171 1.338 33.4% 0.6% 3.237 4.467 5.38 66.2% 1.0% 3.228 1.554 0.847 0.001 0.003 0.003 200.0% 2.2%
Bahrain 0.412 0.401 0.394 -4.4% -0.1% 2.186 2.596 2.617 19.7% 0.4% 2.668 1.637 0.84 0.003 0.004 0.002 -33.3% -0.8%
Qatar 0.357 0.347 0.347 -2.8% -0.1% 7.088 7.324 7.251 2.3% 0.0% 17.74 6.278 2.447 0.029 0.03 0.009 -69.0% -2.3%
Cyprus 0.285 0.287 0.29 1.8% 0.0% 6.3 6.704 6.071 -3.6% -0.1% 1.415 0.937 0.599 0.002 0.002 0.001 -50.0% -1.4%
Asia-West 0.781 0.794 0.812 4.0% 0.1% 5.476 6.085 6.357 16.1% 0.3% 3.485 1.799 0.881 0.36 0.595 0.632 75.6% 1.1%
Australia 1.27 1.406 1.655 30.3% 0.5% 0.943 1.284 1.726 83.0% 1.2% 2.419 1.394 0.707 0.153 0.181 0.185 20.9% 0.4%
Papua New Guniea 0.017 0.018 0.018 5.9% 0.1% 3.484 4.487 5.128 47.2% 0.8% 4.51 2.865 1.952 0.002 0.004 0.004 100.0% 1.4%
New Zealand 0.541 0.603 0.735 35.9% 0.6% 1.15 1.602 2.237 94.5% 1.3% 1.552 1.005 0.552 0.006 0.013 0.014 133.3% 1.7%
Solomon Islands 0.326 0.317 0.296 -9.2% -0.2% 2.538 3.436 3.572 40.7% 0.7% 2.112 2.515 1.552 0 0 0
Fiji 0.085 0.092 0.108 27.1% 0.5% 0.951 1.326 1.855 95.1% 1.3% 1.343 1.433 0.878 0 0.001 0.001
Vanuatu 0.287 0.278 0.271 -5.6% -0.1% 0.537 0.731 0.824 53.4% 0.9% 2.245 2.215 1.109 0 0 0
Micronesia 0.291 0.292 0.282 -3.1% -0.1% 2.23 2.88 3.105 39.2% 0.7% 1.996 2.011 0.998 0 0 0
Tonga 0.276 0.259 0.243 -12.0% -0.3% 0.7 0.857 0.812 16.0% 0.3% 2.618 2.426 1.112 0 0 0
Samoa 0.294 0.308 0.348 18.4% 0.3% 0.479 0.678 0.935 95.2% 1.3% 2.219 1.935 0.945 0 0 0
Oceania 0.877 0.915 1.034 17.9% 0.3% 1.446 1.92 2.244 55.2% 0.9% 2.33 1.371 0.708 0.162 0.199 0.204 25.9% 0.5%
Base Case: Countries in Year 2060
Descending Population Sequence
VOL2_15 Forecast Tables rev.indd 286 21/08/2009 09:20

287Forecast Tables
Patterns of Potential Human Progress Multination Regional Analysis Measures of Poverty, Health, Education, Infrastructure, and Governance
InfrastructureEnergy Demand Ratio to GDP
Water Use per Capita Crop Yield Barrels of Oil Equivalent Carbon Emissions
Annual Thousands of Cubic Meters Annual Metric Tons per Hectare Per Thousand Dollars Billion Tons per Year
2010 2035 2060 % Chg % An Chg 2010 2035 2060 % Chg % An Chg 2010 2035 2060 2010 2035 2060 % Chg % An Chg
EUROPERussian Federation 0.556 0.624 0.628 12.9% 0.2% 1.083 1.219 1.038 -4.2% -0.1% 10.24 3.265 1.417 0.405 0.442 0.181 -55.3% -1.6%Ukraine 0.842 1.114 1.193 41.7% 0.7% 2.118 2.579 2.36 11.4% 0.2% 10.36 3.758 1.274 0.047 0.06 0.058 23.4% 0.4%Poland 0.32 0.371 0.397 24.1% 0.4% 3.58 4.252 3.915 9.4% 0.2% 2.695 1.393 0.753 0.077 0.118 0.122 58.4% 0.9%Romania 0.312 0.365 0.393 26.0% 0.5% 3.247 3.637 3.407 4.9% 0.1% 4.056 2.299 1.074 0.018 0.029 0.019 5.6% 0.1%Czech Republic 0.199 0.259 0.334 67.8% 1.0% 2.433 3.439 4.151 70.6% 1.1% 3.272 1.931 0.923 0.025 0.024 0.017 -32.0% -0.8%Belarus 0.3 0.359 0.39 30.0% 0.5% 2.751 3.208 3.129 13.7% 0.3% 3.813 2.041 0.991 0.009 0.014 0.012 33.3% 0.6%Hungary 2.193 2.526 2.78 26.8% 0.5% 4.466 4.789 4.441 -0.6% 0.0% 3.091 1.715 0.846 0.017 0.02 0.014 -17.6% -0.4%Bulgaria 0.97 1.229 1.334 37.5% 0.6% 2.127 2.366 2.154 1.3% 0.0% 4.133 2.338 1 0.005 0.007 0.009 80.0% 1.2%Slovakia 0.204 0.241 0.272 33.3% 0.6% 3.49 4.427 4.538 30.0% 0.5% 3.507 2.121 0.995 0.007 0.009 0.006 -14.3% -0.3%Moldova, Rep. of 0.577 0.678 0.754 30.7% 0.5% 2.622 3.006 3.174 21.1% 0.4% 3.83 3.11 1.25 0.001 0.001 0.002 100.0% 1.4%
Europe-East 0.591 0.688 0.72 21.8% 0.4% 2.792 3.292 3.231 15.7% 0.3% 6.662 2.688 1.147 0.611 0.725 0.439 -28.2% -0.7%
United Kingdom 0.197 0.195 0.188 -4.6% -0.1% 5.978 6.22 5.553 -7.1% -0.1% 0.808 0.597 0.361 0.116 0.136 0.113 -2.6% -0.1%Sweden 0.303 0.304 0.287 -5.3% -0.1% 2.635 2.729 2.306 -12.5% -0.3% 1.459 0.971 0.543 0.02 0.022 0.012 -40.0% -1.0%Denmark 0.131 0.144 0.143 9.2% 0.2% 5.382 6.431 6.272 16.5% 0.3% 0.901 0.67 0.404 0.015 0.01 0.006 -60.0% -1.8%Ireland 0.285 0.266 0.256 -10.2% -0.2% 2.984 3.022 2.933 -1.7% 0.0% 0.913 0.654 0.432 0.013 0.019 0.012 -7.7% -0.2%Norway 0.525 0.545 0.577 9.9% 0.2% 2.412 2.934 3.436 42.5% 0.7% 4.034 2.159 0.882 0.065 0.054 0.025 -61.5% -1.9%Finland 0.454 0.467 0.449 -1.1% 0.0% 2.351 2.5 2.18 -7.3% -0.2% 1.72 1.128 0.604 0.019 0.022 0.017 -10.5% -0.2%Lithuania 1.066 1.441 2.1 97.0% 1.4% 1.727 2.427 3.304 91.3% 1.3% 3.119 1.696 0.823 0.004 0.006 0.005 25.0% 0.4%Latvia 0.114 0.131 0.139 21.9% 0.4% 1.111 1.291 1.187 6.8% 0.1% 2.027 1.163 0.687 0.003 0.004 0.004 33.3% 0.6%Estonia 1.107 1.319 1.402 26.6% 0.5% 1.514 1.732 1.604 5.9% 0.1% 3.176 1.521 0.785 0.004 0.004 0.003 -25.0% -0.6%Iceland 0.58 0.57 0.546 -5.9% -0.1% 2.185 2.262 1.796 -17.8% -0.4% 2.166 1.21 0.644 0 0 0
Europe-North 0.279 0.287 0.293 5.0% 0.1% 2.828 3.155 3.057 8.1% 0.2% 1.217 0.806 0.44 0.258 0.277 0.196 -24.0% -0.5%
Italy 0.737 0.791 0.847 14.9% 0.3% 5.447 5.63 5.192 -4.7% -0.1% 1.202 0.95 0.649 0.119 0.122 0.091 -23.5% -0.5%Spain 0.887 0.941 0.977 10.1% 0.2% 2.825 3.013 2.715 -3.9% -0.1% 1.127 0.847 0.578 0.067 0.092 0.069 3.0% 0.1%Greece 0.807 0.859 0.902 11.8% 0.2% 3.671 3.868 3.605 -1.8% 0.0% 1.047 0.849 0.611 0.021 0.026 0.02 -4.8% -0.1%Portugal 1.084 1.135 1.147 5.8% 0.1% 2.517 2.691 2.471 -1.8% 0.0% 1.623 1.168 0.69 0.017 0.02 0.018 5.9% 0.1%Serbia 6.474 8.279 9.434 45.7% 0.8% 5.027 6.338 6.624 31.8% 0.6% 4.905 3.005 1.284 0.007 0.01 0.015 114.3% 1.5%Croatia 1.975 2.639 3.099 56.9% 0.9% 3.309 4.693 5.07 53.2% 0.9% 2.031 1.419 0.771 0.004 0.006 0.006 50.0% 0.8%Bosnia and Herzegovina 1.138 1.412 1.838 61.5% 1.0% 3.296 4.67 6.023 82.7% 1.2% 2.576 2.277 1.131 0.002 0.002 0.002 0.0% 0.0%Albania 0.559 0.617 0.642 14.8% 0.3% 2.193 2.628 2.729 24.4% 0.4% 2.589 1.671 0.883 0.001 0.003 0.004 300.0% 2.8%Macedonia, TFYR 1.151 1.257 1.443 25.4% 0.5% 3.127 3.521 3.862 23.5% 0.4% 4.551 3.267 1.382 0.002 0.002 0.001 -50.0% -1.4%Slovenia 0.471 0.518 0.593 25.9% 0.5% 6.112 7.001 7.341 20.1% 0.4% 1.693 1.083 0.663 0.004 0.005 0.004 0.0% 0.0%Montenegro 0.357 0.407 0.45 26.1% 0.5% 2.205 3.111 3.679 66.8% 1.0% 2.452 1.962 0.949 0 0.001 0.001Malta 0.05 0.052 0.057 14.0% 0.3% 5.719 6.686 6.988 22.2% 0.4% 2.262 1.309 0.722 0.001 0.001 0.001 0.0% 0.0%
Europe-South 1.138 1.295 1.441 26.6% 0.5% 3.787 4.487 4.692 23.9% 0.4% 1.24 0.957 0.647 0.245 0.289 0.231 -5.7% -0.1%
Germany 0.473 0.494 0.492 4.0% 0.1% 6.032 6.201 5.237 -13.2% -0.3% 1.159 0.794 0.454 0.202 0.206 0.161 -20.3% -0.5%France 0.563 0.567 0.535 -5.0% -0.1% 5.159 5.436 4.743 -8.1% -0.2% 1.255 0.868 0.492 0.101 0.15 0.145 43.6% 0.7%Netherlands 0.554 0.535 0.513 -7.4% -0.2% 10.78 10.8 9.48 -12.1% -0.3% 1.642 1.132 0.662 0.06 0.067 0.048 -20.0% -0.4%Belgium 0.752 0.751 0.699 -7.0% -0.1% 2.289 2.32 1.868 -18.4% -0.4% 1.81 1.18 0.653 0.036 0.037 0.029 -19.4% -0.4%Austria 0.459 0.483 0.501 9.2% 0.2% 4.947 5.128 4.522 -8.6% -0.2% 1.14 0.795 0.471 0.018 0.019 0.013 -27.8% -0.6%Switzerland 0.344 0.352 0.353 2.6% 0.1% 6.821 7.087 5.958 -12.7% -0.3% 0.712 0.558 0.357 0.01 0.015 0.011 10.0% 0.2%Luxembourg 0.134 0.136 0.136 1.5% 0.0% 2.276 3.11 3.891 71.0% 1.1% 1.319 0.981 0.612 0.003 0.004 0.003 0.0% 0.0%
Europe-West 0.519 0.531 0.516 -0.6% 0.0% 5.472 5.726 5.1 -6.8% -0.1% 1.245 0.859 0.492 0.43 0.496 0.409 -4.9% -0.1%
Base Case: Countries in Year 2060
Descending Population Sequence
VOL2_15 Forecast Tables rev.indd 287 21/08/2009 09:20

Patterns of Potential Hum
an Progress Volume 2: Enhancing Global Education
288
Patterns of Potential Human Progress Multination Regional Analysis Measures of Poverty, Health, Education, Infrastructure, and Governance
Base Case
Source: International Futures Version 6.12, March 2009
InfrastructureRoad Density Electricity Use Telephone Density
Kilometers per 1000 Hectares Annual KWH per Capita Lines per 1000 Persons
2010 2035 2060 % Chg % An Chg 2010 2035 2060 % Chg % An Chg 2010 2035 2060 % Chg % An Chg
World 8.339 13.91 22.9 174.6% 2.0% 2314 4398 7976 244.7% 2.5% 213 353.2 510.4 139.6% 1.8%
Africa 3.635 5.302 8.115 123.2% 1.6% 567.4 1104 2707 377.1% 3.2% 35.46 72.51 176.8 398.6% 3.3%Americas 7.079 14.14 26.45 273.6% 2.7% 5976 7806 11498 92.4% 1.3% 361.9 490.6 700.7 93.6% 1.3%Asia with Oceania 10.09 16.82 28.05 178.0% 2.1% 1322 3881 8867 570.7% 3.9% 179.4 367 578.7 222.6% 2.4%Europe 6.622 13.9 28.56 331.3% 3.0% 5659 10537 13580 140.0% 1.8% 459.2 714.5 827.1 80.1% 1.2%World 8.339 13.91 22.9 174.6% 2.0% 2314 4398 7976 244.7% 2.5% 213 353.2 510.4 139.6% 1.8%
Africa-Eastern 9.11 10.36 13.53 48.5% 0.8% 229.7 602.1 2719 1083.7% 5.1% 11.49 38.14 177.6 1445.7% 5.6%Africa-Middle 0.92 1.67 2.916 217.0% 2.3% 218.2 560.5 1060 385.8% 3.2% 7.999 37.66 76.74 859.4% 4.6%Africa-Northern 1.027 3.106 7.906 669.8% 4.2% 934.9 2318 5908 531.9% 3.8% 99.99 178.3 370.2 270.2% 2.7%Africa-Southern 0.979 4.724 14.22 1352.5% 5.5% 3702 5994 11604 213.5% 2.3% 110.6 274.9 714.4 545.9% 3.8%Africa-Western 1.224 2.754 4.801 292.2% 2.8% 228.5 625.5 1387 507.0% 3.7% 14.05 44.15 97.14 591.4% 3.9%Africa 3.635 5.302 8.115 123.2% 1.6% 567.4 1104 2707 377.1% 3.2% 35.46 72.51 176.8 398.6% 3.3%
America-Caribbean 50.97 52.49 56.02 9.9% 0.2% 1813 3910 8052 344.1% 3.0% 118.9 250.3 500 320.5% 2.9%America-Central 7.138 8.804 13.84 93.9% 1.3% 825.7 2563 6628 702.7% 4.3% 129.5 223.4 422 225.9% 2.4%America-North 6.094 18.11 37.73 519.1% 3.7% 10457 11795 13625 30.3% 0.5% 547.4 677.9 819.5 49.7% 0.8%America-South 3.851 6.765 13.19 242.5% 2.5% 1866 4494 10229 448.2% 3.5% 200.7 343.4 631.7 214.7% 2.3%Americas 7.079 14.14 26.45 273.6% 2.7% 5976 7806 11498 92.4% 1.3% 361.9 490.6 700.7 93.6% 1.3%
Asia-East 1.615 7.601 25.29 1465.9% 5.7% 2024 6538 13997 591.6% 3.9% 333.5 716 952.4 185.6% 2.1%Asia-South Central 3.73 6.834 13.07 250.4% 2.5% 564.4 2049 6247 1006.8% 4.9% 60.25 153.7 391.1 549.1% 3.8%Asia-South East 9.818 11.3 14.15 44.1% 0.7% 829.7 2287 5655 581.6% 3.9% 93.76 184.2 355 278.6% 2.7%Asia-West 117.3 143.2 158.6 35.2% 0.6% 2444 4846 9057 270.6% 2.7% 189.1 332.4 560.2 196.2% 2.2%Oceania 5.039 12.98 28.23 460.2% 3.5% 7622 9893 10356 35.9% 0.6% 412.3 575.3 635.4 54.1% 0.9%Asia with Oceania 10.09 16.82 28.05 178.0% 2.1% 1322 3881 8867 570.7% 3.9% 179.4 367 578.7 222.6% 2.4%
Europe-East 2.294 7.939 15.25 564.8% 3.9% 3981 8886 12324 209.6% 2.3% 314.4 601.4 758.9 141.4% 1.8%Europe-North 14.58 22.8 41.53 184.8% 2.1% 8771 13315 15441 76.0% 1.1% 594.1 819.9 870.3 46.5% 0.8%Europe-South 8.749 14.43 25.22 188.3% 2.1% 4896 8941 13450 174.7% 2.0% 449.5 635.4 826.1 83.8% 1.2%Europe-West 7.196 16.55 39.94 455.0% 3.5% 7175 12348 14174 97.5% 1.4% 616.8 864 889.2 44.2% 0.7%Europe 6.622 13.9 28.56 331.3% 3.0% 5659 10537 13580 140.0% 1.8% 459.2 714.5 827.1 80.1% 1.2%
VOL2_15 Forecast Tables rev.indd 288 21/08/2009 09:21

289Forecast Tables
Patterns of Potential Human Progress Multination Regional Analysis Measures of Poverty, Health, Education, Infrastructure, and Governance
Base Case: Countries in Year 2060
Descending Population Sequence
InfrastructureRoad Density Electricity Use Telephone Density
Kilometers per 1000 Hectares Annual KWH per Capita Lines per 1000 Persons
2010 2035 2060 % Chg % An Chg 2010 2035 2060 % Chg % An Chg 2010 2035 2060 % Chg % An Chg
AFRICAEthiopia 0.63 1.711 3.701 487.5% 3.6% 45.72 189.5 1012 2113.5% 6.4% 10.34 22.69 74.46 620.1% 4.0%
Uganda 2.005 4.177 9.749 386.2% 3.2% 395.2 1038 4762 1105.0% 5.1% 7.222 49.58 301 4067.8% 7.7%
Tanzania, United Rep. of 1.058 2.171 7.108 571.8% 3.9% 93.48 601 4839 5076.5% 8.2% 7.62 43.88 305.7 3911.8% 7.7%
Kenya 1.956 2.952 5.7 191.4% 2.2% 165.6 673.4 3214 1840.8% 6.1% 12.52 48.68 207.5 1557.3% 5.8%
Madagascar 0.288 1.163 2.832 883.3% 4.7% 274.4 413 1137 314.4% 2.9% 8.032 26.22 82.01 921.0% 4.8%
Mozambique 0.824 2.046 9.099 1004.2% 4.9% 315.2 1202 7088 2148.7% 6.4% 6.901 53.46 441.6 6299.1% 8.7%
Malawi 4.287 4.676 4.85 13.1% 0.2% 216.8 323 988.1 355.8% 3.1% 10.3 24.24 73.03 609.0% 4.0%
Zambia 0.965 1.646 3.715 285.0% 2.7% 604.2 949.5 2422 300.9% 2.8% 11.99 42.55 159.7 1231.9% 5.3%
Burundi 5.529 7.346 9.342 69.0% 1.1% 107.8 221.9 1093 913.9% 4.7% 6.099 18.76 79.39 1201.7% 5.3%
Rwanda 199.4 199.4 199.4 0.0% 0.0% 234.3 465.6 1484 533.4% 3.8% 5.673 27.26 103 1715.6% 6.0%
Somalia 0.099 0.528 1.132 1043.4% 5.0% 37.16 63.92 126.7 241.0% 2.5% 12.61 15.79 20.99 66.5% 1.0%
Zimbabwe 1.999 2.867 4.419 121.1% 1.6% 814.3 1491 2856 250.7% 2.5% 30.36 75.47 185.9 512.3% 3.7%
Eritrea 0.382 1.146 2.133 458.4% 3.5% 218 218 321 47.2% 0.8% 10.55 19.42 32.73 210.2% 2.3%
Mauritius 37.55 37.55 37.55 0.0% 0.0% 3367 6611 12868 282.2% 2.7% 297.4 477.9 790.8 165.9% 2.0%
Comoros 506.7 506.7 506.7 0.0% 0.0% 367 584.7 1807 392.4% 3.2% 23.37 41.48 122.5 424.2% 3.4%
Djibouti 30.8 30.8 30.8 0.0% 0.0% 624.3 980.9 2131 241.3% 2.5% 20.55 53.86 142.1 591.5% 3.9%
Africa-Eastern 9.11 10.36 13.53 48.5% 0.8% 229.7 602.1 2719 1083.7% 5.1% 11.49 38.14 177.6 1445.7% 5.6%
Congo; Dem. Rep. of 0.117 0.909 2.481 2020.5% 6.3% 57.8 148.5 589.6 920.1% 4.8% 2.453 15.05 48.96 1895.9% 6.2%
Angola 0.678 2.277 3.419 404.3% 3.3% 273.3 1420 2131 679.7% 4.2% 18.13 93.85 142.1 683.8% 4.2%
Cameroon 0.88 1.913 3.761 327.4% 2.9% 238.6 733.2 1998 737.4% 4.3% 12.08 49.65 134.1 1010.1% 4.9%
Chad 0.356 1.079 1.762 394.9% 3.3% 462 753 818.4 77.1% 1.2% 6.117 37.21 62.78 926.3% 4.8%
Central African Republic 0.437 0.836 1.767 304.3% 2.8% 219.5 388.3 985.1 348.8% 3.0% 5.437 24.15 72.85 1239.9% 5.3%
Congo, Rep. of 4.597 4.713 4.713 2.5% 0.0% 197.5 1131 1927 875.7% 4.7% 12.99 76.02 129.8 899.2% 4.7%
Gabon 33.38 33.38 33.38 0.0% 0.0% 1211 3600 5822 380.8% 3.2% 56.77 216.2 365.1 543.1% 3.8%
Equatorial Guinea 4.635 8.945 9.149 97.4% 1.4% 9518 10946 10946 15.0% 0.3% 88.18 391.9 455 416.0% 3.3%
São Tomé and Príncipe 2.084 3.593 5.733 175.1% 2.0% 446 514.9 1120 151.1% 1.9% 45.44 46.75 81.02 78.3% 1.2%
Africa-Middle 0.92 1.67 2.916 217.0% 2.3% 218.2 560.5 1060 385.8% 3.2% 7.999 37.66 76.74 859.4% 4.6%
Egypt 0.8 3.533 11.38 1322.5% 5.5% 1204 2809 8549 610.0% 4.0% 152.5 237.6 529.9 247.5% 2.5%
Sudan 0.165 1.506 3.823 2217.0% 6.5% 147.9 985 2631 1678.9% 5.9% 22.57 77.37 172.3 663.4% 4.1%
Algeria 0.729 2.686 5.081 597.0% 4.0% 811.7 2206 3971 389.2% 3.2% 86.26 163.2 253.3 193.6% 2.2%
Morocco 2.91 3.918 6.423 120.7% 1.6% 588.4 1581 4349 639.1% 4.1% 52.3 112.9 276.1 427.9% 3.4%
Tunisia 1.575 5.16 15.02 853.7% 4.6% 1252 3982 12227 876.6% 4.7% 140.5 302.8 752 435.2% 3.4%
Libyan Arab Jamahiriya 0.605 5.16 9.413 1455.9% 5.6% 4355 7561 8129 86.7% 1.3% 169.5 384.9 504.5 197.6% 2.2%
Africa-Northern 1.027 3.106 7.906 669.8% 4.2% 934.9 2318 5908 531.9% 3.8% 99.99 178.3 370.2 270.2% 2.7%
VOL2_15 Forecast Tables rev.indd 289 21/08/2009 09:21

Patterns of Potential Hum
an Progress Volume 2: Enhancing Global Education
290
Patterns of Potential Human Progress Multination Regional Analysis Measures of Poverty, Health, Education, Infrastructure, and Governance
Base Case: Countries in Year 2060
Descending Population Sequence
InfrastructureRoad Density Electricity Use Telephone Density
Kilometers per 1000 Hectares Annual KWH per Capita Lines per 1000 Persons
2010 2035 2060 % Chg % An Chg 2010 2035 2060 % Chg % An Chg 2010 2035 2060 % Chg % An Chg
AFRICA continuedSouth Africa 0.674 4.492 14.42 2039.5% 6.3% 3961 6242 12018 203.4% 2.2% 117 283.2 739.4 532.0% 3.8%
Namibia 0.578 2.91 13.48 2232.2% 6.5% 1592 3485 11832 643.2% 4.1% 78.63 196.6 728.1 826.0% 4.6%
Lesotho 2.468 3.072 5.538 124.4% 1.6% 458.8 987.8 3493 661.3% 4.1% 30.18 64.66 224.4 643.5% 4.1%
Botswana 6.735 14.48 23.88 254.6% 2.6% 4165 11013 14174 240.3% 2.5% 106.4 503.4 869.7 717.4% 4.3%
Swaziland 2.742 4.734 9.554 248.4% 2.5% 1450 2877 6950 379.3% 3.2% 42.68 140.6 433.2 915.0% 4.7%
Africa-Southern 0.979 4.724 14.22 1352.5% 5.5% 3702 5994 11604 213.5% 2.3% 110.6 274.9 714.4 545.9% 3.8%
Nigeria 0.45 2.801 5.506 1123.6% 5.1% 138.3 682.8 1222 783.6% 4.5% 13.86 51.75 87.16 528.9% 3.7%
Niger 0.234 0.787 2.119 805.6% 4.5% 197.8 306.3 1004 407.6% 3.3% 4.543 20.59 74 1528.9% 5.7%
Côte d’Ivoire 1.265 2.416 4.122 225.8% 2.4% 527.7 913.9 1724 226.7% 2.4% 18.32 50.94 117.5 541.4% 3.8%
Ghana 1.888 2.681 3.768 99.6% 1.4% 373.2 515.4 1052 181.9% 2.1% 17.95 35.14 76.91 328.5% 3.0%
Burkina Faso 0.624 1.864 4.861 679.0% 4.2% 355.7 695.5 2324 553.4% 3.8% 10.5 38.67 153.7 1363.8% 5.5%
Mali 1.668 1.841 2.787 67.1% 1.0% 331.9 566.2 1679 405.9% 3.3% 10.03 33.2 114.8 1044.6% 5.0%
Senegal 7.7 7.7 7.7 0.0% 0.0% 180.3 585.8 1908 958.2% 4.8% 26.02 51.38 128.6 394.2% 3.2%
Guinea 0.703 1.77 4.07 478.9% 3.6% 367.1 753 2007 446.7% 3.5% 7.247 38.63 134.6 1757.3% 6.0%
Benin 1.908 2.843 4.687 145.6% 1.8% 110.7 421.3 1694 1430.3% 5.6% 13.88 36.64 115.7 733.6% 4.3%
Togo 1.52 2.631 3.931 158.6% 1.9% 243.8 262.4 472 93.6% 1.3% 14.43 23.09 41.86 190.1% 2.2%
Sierra Leone 1.639 2.68 4.916 199.9% 2.2% 207.3 562.5 1941 836.3% 4.6% 7.666 32.93 130.6 1603.6% 5.8%
Liberia 0.635 1.295 2.599 309.3% 2.9% 107.2 153.2 506.5 372.5% 3.2% 2.856 14.25 43.94 1438.5% 5.6%
Mauritania 1.997 1.997 2.054 2.9% 0.1% 569.1 708.4 1417 149.0% 1.8% 17.78 41.08 98.93 456.4% 3.5%
Guinea-Bissau 8.444 8.444 8.444 0.0% 0.0% 153 204.5 477.7 212.2% 2.3% 9.188 19.11 42.2 359.3% 3.1%
Gambia 7.377 7.377 7.377 0.0% 0.0% 355.4 522.3 1219 243.0% 2.5% 30.34 42.47 86.97 186.7% 2.1%
Cape Verde 2.998 5.283 12.5 316.9% 2.9% 900.1 2385 8529 847.6% 4.6% 154.8 244.7 528.6 241.5% 2.5%
Africa-Western 1.224 2.754 4.801 292.2% 2.8% 228.5 625.5 1387 507.0% 3.7% 14.05 44.15 97.14 591.4% 3.9%
VOL2_15 Forecast Tables rev.indd 290 21/08/2009 09:21

291Forecast Tables
Patterns of Potential Human Progress Multination Regional Analysis Measures of Poverty, Health, Education, Infrastructure, and Governance
Base Case: Countries in Year 2060
Descending Population Sequence
InfrastructureRoad Density Electricity Use Telephone Density
Kilometers per 1000 Hectares Annual KWH per Capita Lines per 1000 Persons
2010 2035 2060 % Chg % An Chg 2010 2035 2060 % Chg % An Chg 2010 2035 2060 % Chg % An Chg
AMERICASHaiti 3.184 4.967 7.072 122.1% 1.6% 80.71 389.7 1243 1440.1% 5.6% 20.01 39.41 88.45 342.0% 3.0%
Dominican Republic 1.15 5.568 15.01 1205.2% 5.3% 1086 3874 10683 883.7% 4.7% 118.2 290.1 658.7 457.3% 3.5%
Cuba 2.768 5.07 15.78 470.1% 3.5% 1228 3102 12817 943.7% 4.8% 85.98 201.1 787.7 816.1% 4.5%
Puerto Rico 76.8 76.8 76.8 0.0% 0.0% 7101 14174 14174 99.6% 1.4% 311.2 758.3 869.7 179.5% 2.1%
Jamaica 436.5 436.5 436.5 0.0% 0.0% 2425 3026 5406 122.9% 1.6% 127.6 179.2 339.9 166.4% 2.0%
Trinidad and Tobago 17.28 22.16 22.16 28.2% 0.5% 4727 10792 14174 199.9% 2.2% 302.5 669.5 869.7 187.5% 2.1%
Bahamas 2.722 7.845 18.99 597.6% 4.0% 6324 9108 14174 124.1% 1.6% 427.8 583.5 869.7 103.3% 1.4%
Barbados 37.21 37.21 37.21 0.0% 0.0% 4611 7538 14174 207.4% 2.3% 507.1 617.9 907.6 79.0% 1.2%
St. Vincent & the Grenadines 31.03 31.03 31.03 0.0% 0.0% 2262 3682 9007 298.2% 2.8% 193.2 265.2 557.5 188.6% 2.1%
Grenada 3426 3426 3426 0.0% 0.0% 3016 4098 9364 210.5% 2.3% 267.2 302.2 579.1 116.7% 1.6%
St. Lucia 5.624 8.284 14.65 160.5% 1.9% 3150 5041 10400 230.2% 2.4% 203.6 317.9 641.7 215.2% 2.3%
America-Caribbean 50.97 52.49 56.02 9.9% 0.2% 1813 3910 8052 344.1% 3.0% 118.9 250.3 500 320.5% 2.9%
Guatemala 0.556 3.602 9.304 1573.4% 5.8% 525.8 1827 5311 910.1% 4.7% 104.4 164.6 334.2 220.1% 2.4%
Honduras 0.662 2.56 6.416 869.2% 4.6% 611.7 1517 4139 576.6% 3.9% 73.44 122.3 263.4 258.7% 2.6%
El Salvador 30.42 30.42 30.42 0.0% 0.0% 791.7 2661 8166 931.5% 4.8% 148.8 245.2 506.7 240.5% 2.5%
Nicaragua 7.083 7.083 7.083 0.0% 0.0% 358.6 1099 3141 775.9% 4.4% 43.13 86.95 203.1 370.9% 3.1%
Costa Rica 3.075 8.926 27.61 797.9% 4.5% 1958 6750 14174 623.9% 4.0% 346.7 652.5 966.4 178.7% 2.1%
Panama 5.277 9.892 21.1 299.8% 2.8% 1708 5813 14174 729.9% 4.3% 168.4 418.7 869.7 416.4% 3.3%
Belize 1.607 5.456 16.06 899.4% 4.7% 2540 5772 13867 445.9% 3.5% 140.1 337 851.1 507.5% 3.7%
America-Central 7.138 8.804 13.84 93.9% 1.3% 825.7 2563 6628 702.7% 4.3% 129.5 223.4 422 225.9% 2.4%
United States of America 8.388 23.12 45.85 446.6% 3.5% 12816 13588 14174 10.6% 0.2% 661 779.6 869.7 31.6% 0.6%
Mexico 0.666 4.96 13.01 1853.5% 6.1% 2026 4795 10572 421.8% 3.4% 202.2 348.4 652 222.5% 2.4%
Canada 2.463 14.51 38.12 1447.7% 5.6% 15952 18136 18136 13.7% 0.3% 615.6 812.3 869.7 41.3% 0.7%
America-North 6.094 18.11 37.73 519.1% 3.7% 10457 11795 13625 30.3% 0.5% 547.4 677.9 819.5 49.7% 0.8%
Brazil 2.359 5.377 13.06 453.6% 3.5% 1972 4443 11052 460.4% 3.5% 222.7 350.9 681.1 205.8% 2.3%
Colombia 11.89 11.89 11.89 0.0% 0.0% 1032 2823 9170 788.6% 4.5% 177.2 260.2 567.3 220.1% 2.4%
Argentina 6.411 11.11 20.87 225.5% 2.4% 2594 7096 14174 446.4% 3.5% 274.9 537.6 873.8 217.9% 2.3%
Venezuela, RB 1.549 5.264 10.2 558.5% 3.8% 2884 5409 8263 186.5% 2.1% 155.3 317.4 512.5 230.0% 2.4%
Peru 0.614 3.607 9.484 1444.6% 5.6% 955.3 3197 7790 715.5% 4.3% 96.61 229 484 401.0% 3.3%
Chile 7.047 14.03 27.48 290.0% 2.8% 3085 9310 14174 359.4% 3.1% 252.5 632.1 869.7 244.4% 2.5%
Ecuador 0.832 2.946 5.218 527.2% 3.7% 835.3 2052 3493 318.2% 2.9% 132.4 175.4 224.4 69.5% 1.1%
Bolivia 0.705 2.804 7.514 965.8% 4.8% 553.4 2240 6243 1028.1% 5.0% 79.18 181.6 390.5 393.2% 3.2%
Paraguay 0.688 1.966 5.022 629.9% 4.1% 921 1614 3841 317.0% 2.9% 58.45 105.1 245.4 319.8% 2.9%
Uruguay 5.567 9.366 19.18 244.5% 2.5% 2292 5989 14174 518.4% 3.7% 329.4 532.7 869.7 164.0% 2.0%
Guyana 2.696 3.673 6.93 157.0% 1.9% 1131 2261 5943 425.5% 3.4% 149.9 203.4 372.4 148.4% 1.8%
Suriname 1.084 3.82 9.642 789.5% 4.5% 2541 4499 8404 230.7% 2.4% 194.8 305.8 521 167.5% 2.0%
America-South 3.851 6.765 13.19 242.5% 2.5% 1866 4494 10229 448.2% 3.5% 200.7 343.4 631.7 214.7% 2.3%
VOL2_15 Forecast Tables rev.indd 291 21/08/2009 09:21

Patterns of Potential Hum
an Progress Volume 2: Enhancing Global Education
292
Patterns of Potential Human Progress Multination Regional Analysis Measures of Poverty, Health, Education, Infrastructure, and Governance
Base Case: Countries in Year 2060
Descending Population Sequence
InfrastructureRoad Density Electricity Use Telephone Density
Kilometers per 1000 Hectares Annual KWH per Capita Lines per 1000 Persons
2010 2035 2060 % Chg % An Chg 2010 2035 2060 % Chg % An Chg 2010 2035 2060 % Chg % An Chg
ASIA WITH OCEANIAChina 0.557 5.952 23.59 4135.2% 7.8% 1219 5786 14174 1062.8% 5.0% 307.5 708.1 969.2 215.2% 2.3%
Japan 2.233 13.83 38.83 1638.9% 5.9% 7945 12881 14174 78.4% 1.2% 496.1 793.6 869.7 75.3% 1.1%
Korea, Rep. of 4.682 17.7 40.07 755.8% 4.4% 6369 13047 14174 122.5% 1.6% 564.3 957 957 69.6% 1.1%
Taiwan 9.742 17.91 38.78 298.1% 2.8% 6053 12095 14174 134.2% 1.7% 651 974.6 1068 64.1% 1.0%
Korea, Dem. Rep. of 5.305 5.416 5.416 2.1% 0.0% 1018 1471 2256 121.6% 1.6% 51.65 88.48 149.6 189.6% 2.1%
Hong Kong 127.1 127.1 127.1 0.0% 0.0% 7206 11448 14174 96.7% 1.4% 643.3 796.7 869.7 35.2% 0.6%
Mongolia 0.239 1.453 5.613 2248.5% 6.5% 917.2 1730 4769 420.0% 3.4% 64.97 115.1 301.5 364.1% 3.1%
Asia-East 1.615 7.601 25.29 1465.9% 5.7% 2024 6538 13997 591.6% 3.9% 333.5 716 952.4 185.6% 2.1%
India 0.616 4.627 13.73 2128.9% 6.4% 493.7 2224 8203 1561.5% 5.8% 54.45 165.3 508.9 834.6% 4.6%
Pakistan 0.828 3.442 7.267 777.7% 4.4% 442.4 1025 2503 465.8% 3.5% 39.58 76.18 164.6 315.9% 2.9%
Bangladesh 14.55 14.74 14.74 1.3% 0.0% 147.2 769.2 2584 1655.4% 5.9% 11.94 54.53 169.4 1318.8% 5.4%
Afghanistan 0.478 1.547 3.32 594.6% 4.0% 236.1 283 514.9 118.1% 1.6% 6.214 20.27 44.45 615.3% 4.0%
Iran, Islamic Rep. of 2.504 7.015 10.53 320.5% 2.9% 1874 5597 8399 348.2% 3.0% 301.6 510.4 531.4 76.2% 1.1%
Nepal 4.541 4.831 5.175 14.0% 0.3% 97.36 423.4 1496 1436.6% 5.6% 20.44 41.79 103.7 407.3% 3.3%
Uzbekistan 1.976 2.804 3.903 97.5% 1.4% 1735 2200 2241 29.2% 0.5% 72.63 102.7 148.7 104.7% 1.4%
Sri Lanka 101.2 101.2 101.2 0.0% 0.0% 435.8 2082 7145 1539.5% 5.8% 69.78 171.2 445 537.7% 3.8%
Kazakhstan 0.55 7.222 12.33 2141.8% 6.4% 3670 10265 10779 193.7% 2.2% 231.8 629.2 664.6 186.7% 2.1%
Tajikistan 1.995 2.568 3.961 98.5% 1.4% 2232 2326 2326 4.2% 0.1% 47.09 70.86 151.2 221.1% 2.4%
Turkmenistan 0.663 3.793 4.74 614.9% 4.0% 1303 4609 4690 259.9% 2.6% 86.77 279.5 289.5 233.6% 2.4%
Kyrgyzstan 0.38 1.26 2.623 590.3% 3.9% 1351 1357 1575 16.6% 0.3% 83.68 86.05 108.5 29.7% 0.5%
Bhutan 3.044 5.238 10.96 260.1% 2.6% 1360 3358 9257 580.7% 3.9% 52.89 174.6 572.6 982.6% 4.9%
Maldives 2196 2196 2196 0.0% 0.0% 1502 5127 14174 843.7% 4.6% 122 347.1 876.5 618.4% 4.0%
Asia-South Central 3.73 6.834 13.07 250.4% 2.5% 564.4 2049 6247 1006.8% 4.9% 60.25 153.7 391.1 549.1% 3.8%
Indonesia 17.31 17.31 17.31 0.0% 0.0% 533 1629 4167 681.8% 4.2% 68.32 131 265.1 288.0% 2.7%
Philippines 3.02 5.612 9.902 227.9% 2.4% 598.2 1727 4808 703.7% 4.3% 47.18 117.9 303.8 543.9% 3.8%
Vietnam 2.522 5.277 10.61 320.7% 2.9% 448.7 1991 6218 1285.8% 5.4% 200.9 316.8 389 93.6% 1.3%
Thailand 1.743 5.311 12.41 612.0% 4.0% 1752 4136 9376 435.2% 3.4% 124.4 268.7 579.8 366.1% 3.1%
Myanmar 0.647 1.727 3.501 441.1% 3.4% 144.9 614.3 1863 1185.7% 5.2% 13.82 46.72 125.9 811.0% 4.5%
Malaysia 6.785 11.65 18.22 168.5% 2.0% 3201 7605 14174 342.8% 3.0% 196.8 465.6 869.7 341.9% 3.0%
Cambodia 2.041 3.873 7.204 253.0% 2.6% 547.9 1830 4567 733.5% 4.3% 7.923 79.49 289.2 3550.1% 7.5%
Lao PDR 0.933 2.962 10.56 1031.8% 5.0% 650.4 2343 8585 1220.0% 5.3% 21.18 115 532 2411.8% 6.7%
Singapore 182.7 182.7 182.7 0.0% 0.0% 8567 11753 14174 65.4% 1.0% 509.3 714 869.7 70.8% 1.1%
Timor-Leste 2.417 3.778 7.147 195.7% 2.2% 702.7 1205 3621 415.3% 3.3% 8.807 54.85 232.1 2535.4% 6.8%
Brunei Darussalam 3.952 15.56 27.34 591.8% 3.9% 7365 11234 14174 92.5% 1.3% 301.7 624.4 869.7 188.3% 2.1%
Asia-South East 9.818 11.3 14.15 44.1% 0.7% 829.7 2287 5655 581.6% 3.9% 93.76 184.2 355 278.6% 2.7%
VOL2_15 Forecast Tables rev.indd 292 21/08/2009 09:21

293Forecast Tables
Patterns of Potential Human Progress Multination Regional Analysis Measures of Poverty, Health, Education, Infrastructure, and Governance
Base Case: Countries in Year 2060
Descending Population Sequence
InfrastructureRoad Density Electricity Use Telephone Density
Kilometers per 1000 Hectares Annual KWH per Capita Lines per 1000 Persons
2010 2035 2060 % Chg % An Chg 2010 2035 2060 % Chg % An Chg 2010 2035 2060 % Chg % An Chg
ASIA WITH OCEANIA continuedTurkey 5.318 9.236 19.92 274.6% 2.7% 1690 5179 14174 738.7% 4.3% 273.3 477.3 869.7 218.2% 2.3%
Yemen 1.365 2.857 5.301 288.4% 2.8% 181 1024 3021 1569.1% 5.8% 44.89 95.69 195.9 336.4% 3.0%
Iraq 2.42 4.32 7.751 220.3% 2.4% 1475 2836 5022 240.5% 2.5% 44.12 122.7 316.7 617.8% 4.0%
Saudi Arabia 0.96 7.131 15.05 1467.7% 5.7% 5343 8923 12936 142.1% 1.8% 189 461.3 794.9 320.6% 2.9%
Syria 3.997 5.197 7.986 99.8% 1.4% 1057 1930 4723 346.8% 3.0% 153.1 178.8 298.7 95.1% 1.3%
Israel 45.44 54.94 55.57 22.3% 0.4% 6502 13211 14174 118.0% 1.6% 463 856.6 869.7 87.8% 1.3%
Azerbaijan 3.721 6.297 7.963 114.0% 1.5% 2366 4596 5491 132.1% 1.7% 161.2 294.4 345.1 114.1% 1.5%
Jordan 130.2 130.2 130.2 0.0% 0.0% 1417 3937 14174 900.3% 4.7% 119.6 273.6 869.7 627.2% 4.0%
Palestine 5919 5919 5919 0.0% 0.0% 1159 2210 5585 381.9% 3.2% 95.39 155.6 350.8 267.8% 2.6%
United Arab Emirates 1.692 11.48 24.49 1347.4% 5.5% 10978 14328 14328 30.5% 0.5% 326.5 679.2 869.7 166.4% 2.0%
Oman 3.557 8.148 13.78 287.4% 2.7% 3538 7273 11864 235.3% 2.4% 138.9 401.3 730.1 425.6% 3.4%
Kuwait 48.82 53.39 53.39 9.4% 0.2% 10957 12821 14174 29.4% 0.5% 273.4 613.1 869.7 218.1% 2.3%
Lebanon 5.733 9.668 16.82 193.4% 2.2% 2021 4811 11043 446.4% 3.5% 185.7 343 680.5 266.5% 2.6%
Georgia 0.698 2.554 5.831 735.4% 4.3% 909.8 2058 4353 378.5% 3.2% 141.1 191.9 276.3 95.8% 1.4%
Armenia 3.344 7.206 12.39 270.5% 2.7% 1395 4815 9745 598.6% 4.0% 218.4 458.4 602.1 175.7% 2.0%
Bahrain 45.41 45.41 45.41 0.0% 0.0% 9399 12685 14174 50.8% 0.8% 328.7 646.8 869.7 164.6% 2.0%
Qatar 34.23 59.26 59.26 73.1% 1.1% 15308 15308 15308 0.0% 0.0% 336.7 639.5 869.7 158.3% 1.9%
Cyprus 65.79 65.79 65.79 0.0% 0.0% 4820 10662 14174 194.1% 2.2% 537.1 812.6 882.6 64.3% 1.0%
Asia-West 117.3 143.2 158.6 35.2% 0.6% 2444 4846 9057 270.6% 2.7% 189.1 332.4 560.2 196.2% 2.2%
Australia 2.539 13.84 36.68 1344.7% 5.5% 10082 13456 14174 40.6% 0.7% 554.6 790.2 869.7 56.8% 0.9%
Papua New Guniea 0.371 1.499 3.097 734.8% 4.3% 562.3 1277 2050 264.6% 2.6% 15.34 64.08 137.2 794.4% 4.5%
New Zealand 5.171 12.01 32.57 529.9% 3.7% 9190 13684 14763 60.6% 1.0% 461 766.6 869.7 88.7% 1.3%
Solomon Islands 2.003 2.202 2.671 33.3% 0.6% 581.6 862.2 1523 161.9% 1.9% 20.18 48.93 105.4 422.3% 3.4%
Fiji 15.68 15.68 15.68 0.0% 0.0% 1423 2357 6425 351.5% 3.1% 135.7 179.5 401.5 195.9% 2.2%
Vanuatu 1.056 2.268 5.403 411.6% 3.3% 1166 1789 4014 244.3% 2.5% 39.75 93.88 255.8 543.5% 3.8%
Micronesia 568.1 568.1 568.1 0.0% 0.0% 1785 2477 5869 228.8% 2.4% 121.2 163 367.9 203.5% 2.2%
Tonga 9.067 9.067 9.126 0.7% 0.0% 1639 2208 5106 211.5% 2.3% 137.3 159.3 321.8 134.4% 1.7%
Samoa 42.25 42.25 42.25 0.0% 0.0% 1651 2795 7327 343.8% 3.0% 115.2 183.6 456 295.8% 2.8%
Oceania 5.039 12.98 28.23 460.2% 3.5% 7622 9893 10356 35.9% 0.6% 412.3 575.3 635.4 54.1% 0.9%
VOL2_15 Forecast Tables rev.indd 293 21/08/2009 09:21

Patterns of Potential Hum
an Progress Volume 2: Enhancing Global Education
294
Patterns of Potential Human Progress Multination Regional Analysis Measures of Poverty, Health, Education, Infrastructure, and Governance
Base Case: Countries in Year 2060
Descending Population Sequence
InfrastructureRoad Density Electricity Use Telephone Density
Kilometers per 1000 Hectares Annual KWH per Capita Lines per 1000 Persons
2010 2035 2060 % Chg % An Chg 2010 2035 2060 % Chg % An Chg 2010 2035 2060 % Chg % An Chg
EUROPERussian Federation 0.766 7.726 14.44 1785.1% 6.0% 5024 11271 12663 152.1% 1.9% 325 701.5 778.3 139.5% 1.8%
Ukraine 3.122 6.4 13.16 321.5% 2.9% 2576 5597 10870 322.0% 2.9% 275.3 455.1 670.1 143.4% 1.8%
Poland 7.121 12.46 22.03 209.4% 2.3% 3112 8204 14174 355.5% 3.1% 346.5 632.8 876.8 153.0% 1.9%
Romania 0.683 5 12.08 1668.7% 5.9% 2009 4879 9692 382.4% 3.2% 225.7 377.3 598.9 165.4% 2.0%
Czech Republic 1.899 7.928 16.99 794.7% 4.5% 5550 8796 14174 155.4% 1.9% 349.6 545.7 869.7 148.8% 1.8%
Belarus 5.427 8.951 13.83 154.8% 1.9% 3174 6567 11636 266.6% 2.6% 371.7 553.8 716.3 92.7% 1.3%
Hungary 1.168 7.472 19.21 1544.7% 5.8% 3558 7687 14174 298.4% 2.8% 365.5 572 869.7 137.9% 1.7%
Bulgaria 5.575 8.079 14.29 156.3% 1.9% 3436 5991 11972 248.4% 2.5% 342.5 466.2 736.6 115.1% 1.5%
Slovakia 1.548 6.719 14.69 849.0% 4.6% 4924 7343 11836 140.4% 1.8% 257.4 425.4 728.4 183.0% 2.1%
Moldova, Rep. of 0.401 2.13 6.363 1486.8% 5.7% 876.5 1521 4291 389.6% 3.2% 221.4 222.5 272.6 23.1% 0.4%
Europe-East 2.294 7.939 15.25 564.8% 3.9% 3981 8886 12324 209.6% 2.3% 314.4 601.4 758.9 141.4% 1.8%
United Kingdom 16.72 24.06 42.49 154.1% 1.9% 6595 11875 14174 114.9% 1.5% 615.5 848.9 869.7 41.3% 0.7%
Sweden 1.654 15.35 46.16 2690.8% 6.9% 16157 18828 18828 16.5% 0.3% 700.6 871.4 871.4 24.4% 0.4%
Denmark 29.89 33.14 43.39 45.2% 0.7% 7193 11925 14174 97.1% 1.4% 666.6 851.5 869.7 30.5% 0.5%
Ireland 8.831 22.73 38.64 337.5% 3.0% 7372 11237 14174 92.3% 1.3% 620.9 762.2 869.7 40.1% 0.7%
Norway 23.12 31.82 44.67 93.2% 1.3% 24881 24881 24881 0.0% 0.0% 509.9 714.3 869.7 70.6% 1.1%
Finland 1.617 12.69 39.77 2359.5% 6.6% 16181 18900 18900 16.8% 0.3% 482.6 764.7 869.7 80.2% 1.2%
Lithuania 13.35 15.06 18.3 37.1% 0.6% 2475 6696 14174 472.7% 3.6% 272.8 498.9 869.7 218.8% 2.3%
Latvia 4.139 10.24 23.64 471.2% 3.5% 2591 8049 14174 447.0% 3.5% 361.7 670 893.9 147.1% 1.8%
Estonia 1.853 8.989 24.97 1247.5% 5.3% 4753 10239 14174 198.2% 2.2% 398.1 708.9 873.3 119.4% 1.6%
Iceland 17 27.38 45.53 167.8% 2.0% 27029 28149 28149 4.1% 0.1% 747.3 856.4 869.7 16.4% 0.3%
Europe-North 14.58 22.8 41.53 184.8% 2.1% 8771 13315 15441 76.0% 1.1% 594.1 819.9 870.3 46.5% 0.8%
Italy 1.942 9.351 23.63 1116.8% 5.1% 5337 9170 14174 165.6% 2.0% 453.1 628.8 869.7 91.9% 1.3%
Spain 7.853 13.63 25.25 221.5% 2.4% 5542 10775 14174 155.8% 1.9% 484.4 747.1 869.7 79.5% 1.2%
Greece 4.237 11.37 22.33 427.0% 3.4% 5081 10316 14174 179.0% 2.1% 604.8 797.7 869.7 43.8% 0.7%
Portugal 41.43 41.43 41.43 0.0% 0.0% 4286 7526 14174 230.7% 2.4% 413.5 549 869.7 110.3% 1.5%
Serbia 1.927 5.039 12.24 535.2% 3.8% 3042 4927 9947 227.0% 2.4% 320.4 395 614.3 91.7% 1.3%
Croatia 9.174 10.9 17.24 87.9% 1.3% 3128 6158 14174 353.1% 3.1% 430.8 538.2 869.7 101.9% 1.4%
Bosnia and Herzegovina 4.382 4.898 7.596 73.3% 1.1% 1594 2565 5709 258.2% 2.6% 251.6 251.6 358.3 42.4% 0.7%
Albania 6.433 8.613 11.97 86.1% 1.2% 1370 3875 9189 570.7% 3.9% 128.3 279.1 568.5 343.1% 3.0%
Macedonia, TFYR 2.324 3.684 7.047 203.2% 2.2% 2413 2794 5153 113.6% 1.5% 262.4 262.4 324.7 23.7% 0.4%
Slovenia 11.53 15.78 28.65 148.5% 1.8% 6263 11086 14174 126.3% 1.6% 456.7 727 869.7 90.4% 1.3%
Montenegro 63.51 63.51 63.51 0.0% 0.0% 2544 4423 10811 325.0% 2.9% 587 587 666.5 13.5% 0.3%
Malta 471.9 471.9 471.9 0.0% 0.0% 4573 9210 14174 209.9% 2.3% 527.2 729.3 909.1 72.4% 1.1%
Europe-South 8.749 14.43 25.22 188.3% 2.1% 4896 8941 13450 174.7% 2.0% 449.5 635.4 826.1 83.8% 1.2%
Germany 2.175 12.72 39.82 1730.8% 6.0% 6724 12217 14174 110.8% 1.5% 678 917.7 917.7 35.4% 0.6%
France 2.84 12.13 37.44 1218.3% 5.3% 7330 12530 14174 93.4% 1.3% 584.7 849 869.7 48.7% 0.8%
Netherlands 4.961 15.61 35 605.5% 4.0% 7131 11867 14174 98.8% 1.4% 517 769.6 869.7 68.2% 1.0%
Belgium 48.22 48.22 48.22 0.0% 0.0% 8166 12893 14174 73.6% 1.1% 489.2 782.7 869.7 77.8% 1.2%
Austria 16.3 21.95 36.44 123.6% 1.6% 7778 12323 14174 82.2% 1.2% 501 768 869.7 73.6% 1.1%
Switzerland 17.12 23.87 40.05 133.9% 1.7% 8514 12427 14174 66.5% 1.0% 741.5 877.6 877.6 18.4% 0.3%
Luxembourg 289.8 289.8 289.8 0.0% 0.0% 12967 13653 14174 9.3% 0.2% 567.1 739 869.7 53.4% 0.9%
Europe-West 7.196 16.55 39.94 455.0% 3.5% 7175 12348 14174 97.5% 1.4% 616.8 864 889.2 44.2% 0.7%
VOL2_15 Forecast Tables rev.indd 294 21/08/2009 09:22
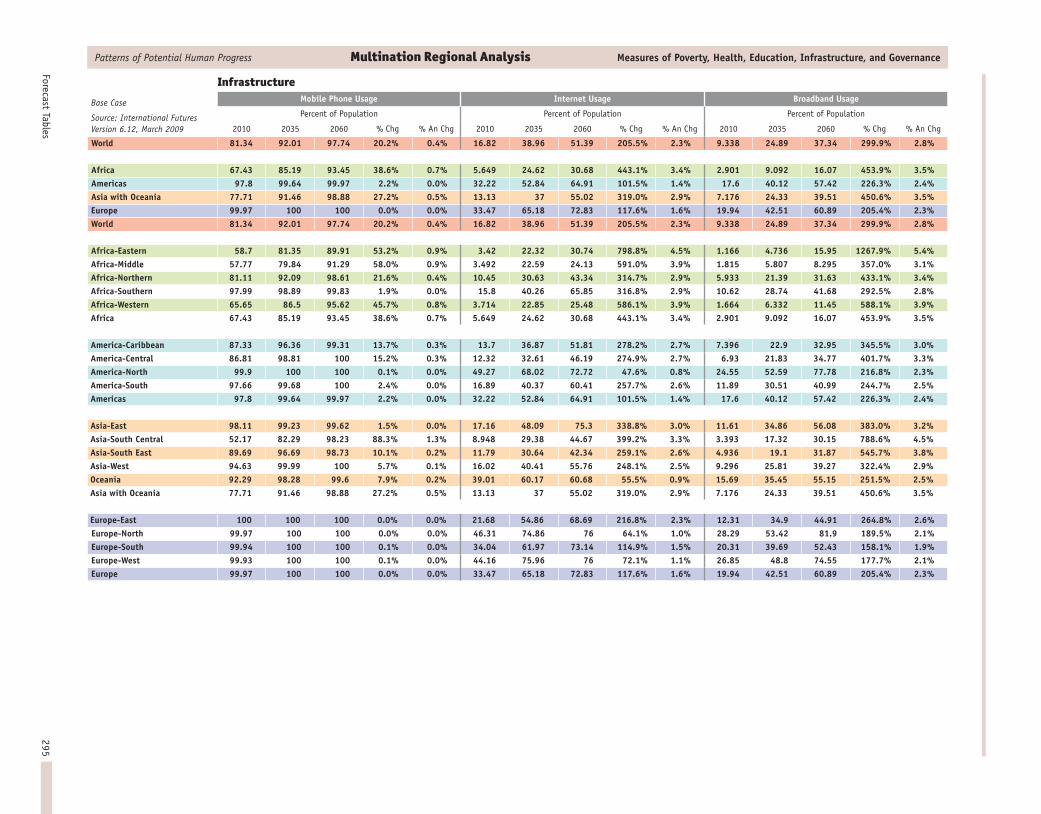
295Forecast Tables
Patterns of Potential Human Progress Multination Regional Analysis Measures of Poverty, Health, Education, Infrastructure, and Governance
Base Case
Source: International Futures Version 6.12, March 2009
InfrastructureMobile Phone Usage Internet Usage Broadband Usage
Percent of Population Percent of Population Percent of Population
2010 2035 2060 % Chg % An Chg 2010 2035 2060 % Chg % An Chg 2010 2035 2060 % Chg % An Chg
World 81.34 92.01 97.74 20.2% 0.4% 16.82 38.96 51.39 205.5% 2.3% 9.338 24.89 37.34 299.9% 2.8%
Africa 67.43 85.19 93.45 38.6% 0.7% 5.649 24.62 30.68 443.1% 3.4% 2.901 9.092 16.07 453.9% 3.5%Americas 97.8 99.64 99.97 2.2% 0.0% 32.22 52.84 64.91 101.5% 1.4% 17.6 40.12 57.42 226.3% 2.4%Asia with Oceania 77.71 91.46 98.88 27.2% 0.5% 13.13 37 55.02 319.0% 2.9% 7.176 24.33 39.51 450.6% 3.5%Europe 99.97 100 100 0.0% 0.0% 33.47 65.18 72.83 117.6% 1.6% 19.94 42.51 60.89 205.4% 2.3%World 81.34 92.01 97.74 20.2% 0.4% 16.82 38.96 51.39 205.5% 2.3% 9.338 24.89 37.34 299.9% 2.8%
Africa-Eastern 58.7 81.35 89.91 53.2% 0.9% 3.42 22.32 30.74 798.8% 4.5% 1.166 4.736 15.95 1267.9% 5.4%Africa-Middle 57.77 79.84 91.29 58.0% 0.9% 3.492 22.59 24.13 591.0% 3.9% 1.815 5.807 8.295 357.0% 3.1%Africa-Northern 81.11 92.09 98.61 21.6% 0.4% 10.45 30.63 43.34 314.7% 2.9% 5.933 21.39 31.63 433.1% 3.4%Africa-Southern 97.99 98.89 99.83 1.9% 0.0% 15.8 40.26 65.85 316.8% 2.9% 10.62 28.74 41.68 292.5% 2.8%Africa-Western 65.65 86.5 95.62 45.7% 0.8% 3.714 22.85 25.48 586.1% 3.9% 1.664 6.332 11.45 588.1% 3.9%Africa 67.43 85.19 93.45 38.6% 0.7% 5.649 24.62 30.68 443.1% 3.4% 2.901 9.092 16.07 453.9% 3.5%
America-Caribbean 87.33 96.36 99.31 13.7% 0.3% 13.7 36.87 51.81 278.2% 2.7% 7.396 22.9 32.95 345.5% 3.0%America-Central 86.81 98.81 100 15.2% 0.3% 12.32 32.61 46.19 274.9% 2.7% 6.93 21.83 34.77 401.7% 3.3%America-North 99.9 100 100 0.1% 0.0% 49.27 68.02 72.72 47.6% 0.8% 24.55 52.59 77.78 216.8% 2.3%America-South 97.66 99.68 100 2.4% 0.0% 16.89 40.37 60.41 257.7% 2.6% 11.89 30.51 40.99 244.7% 2.5%Americas 97.8 99.64 99.97 2.2% 0.0% 32.22 52.84 64.91 101.5% 1.4% 17.6 40.12 57.42 226.3% 2.4%
Asia-East 98.11 99.23 99.62 1.5% 0.0% 17.16 48.09 75.3 338.8% 3.0% 11.61 34.86 56.08 383.0% 3.2%Asia-South Central 52.17 82.29 98.23 88.3% 1.3% 8.948 29.38 44.67 399.2% 3.3% 3.393 17.32 30.15 788.6% 4.5%Asia-South East 89.69 96.69 98.73 10.1% 0.2% 11.79 30.64 42.34 259.1% 2.6% 4.936 19.1 31.87 545.7% 3.8%Asia-West 94.63 99.99 100 5.7% 0.1% 16.02 40.41 55.76 248.1% 2.5% 9.296 25.81 39.27 322.4% 2.9%Oceania 92.29 98.28 99.6 7.9% 0.2% 39.01 60.17 60.68 55.5% 0.9% 15.69 35.45 55.15 251.5% 2.5%Asia with Oceania 77.71 91.46 98.88 27.2% 0.5% 13.13 37 55.02 319.0% 2.9% 7.176 24.33 39.51 450.6% 3.5%
Europe-East 100 100 100 0.0% 0.0% 21.68 54.86 68.69 216.8% 2.3% 12.31 34.9 44.91 264.8% 2.6%Europe-North 99.97 100 100 0.0% 0.0% 46.31 74.86 76 64.1% 1.0% 28.29 53.42 81.9 189.5% 2.1%Europe-South 99.94 100 100 0.1% 0.0% 34.04 61.97 73.14 114.9% 1.5% 20.31 39.69 52.43 158.1% 1.9%Europe-West 99.93 100 100 0.1% 0.0% 44.16 75.96 76 72.1% 1.1% 26.85 48.8 74.55 177.7% 2.1%Europe 99.97 100 100 0.0% 0.0% 33.47 65.18 72.83 117.6% 1.6% 19.94 42.51 60.89 205.4% 2.3%
VOL2_15 Forecast Tables rev.indd 295 21/08/2009 09:22

Patterns of Potential Hum
an Progress Volume 2: Enhancing Global Education
296
Patterns of Potential Human Progress Multination Regional Analysis Measures of Poverty, Health, Education, Infrastructure, and Governance
Base Case: Countries in Year 2060
Descending Population Sequence
InfrastructureMobile Phone Usage Internet Usage Broadband Usage
Percent of Population Percent of Population Percent of Population
2010 2035 2060 % Chg % An Chg 2010 2035 2060 % Chg % An Chg 2010 2035 2060 % Chg % An Chg
AFRICAEthiopia 22.61 49.76 72.52 220.7% 2.4% 0.783 20.86 24 2965.1% 7.1% 0.751 2.131 6.268 734.6% 4.3%
Uganda 81.42 100 100 22.8% 0.4% 3.44 23.66 38.81 1028.2% 5.0% 1.489 7.486 26.14 1655.5% 5.9%
Tanzania, United Rep. of 76.61 99.38 100 30.5% 0.5% 3.53 23.06 39.12 1008.2% 4.9% 1.187 5.911 26.94 2169.6% 6.4%
Kenya 73.73 95.14 100 35.6% 0.6% 7.652 23.37 32.7 327.3% 2.9% 1.753 6.794 23.11 1218.3% 5.3%
Madagascar 35.15 60.44 80.36 128.6% 1.7% 3.007 21.38 24.49 714.4% 4.3% 1.024 3.086 8.052 686.3% 4.2%
Mozambique 55.4 87.86 100 80.5% 1.2% 1.907 23.93 48 2417.0% 6.7% 0.94 7.275 31.25 3224.5% 7.3%
Malawi 81.34 96.13 100 22.9% 0.4% 3.629 20.99 23.9 558.6% 3.8% 0.802 2.314 6.402 698.3% 4.2%
Zambia 76.66 97.06 100 30.4% 0.5% 6.136 22.73 29.57 381.9% 3.2% 1.498 5.764 18.43 1130.3% 5.1%
Burundi 93.06 100 100 7.5% 0.1% 1.536 20.56 24.32 1483.3% 5.7% 0.386 1.404 6.72 1640.9% 5.9%
Rwanda 86.35 100 100 15.8% 0.3% 2.636 21.55 25.86 881.0% 4.7% 0.887 3.332 10.3 1061.2% 5.0%
Somalia 31.95 52.69 63.07 97.4% 1.4% 0.254 20.04 20.5 7970.9% 9.2% 0.11 0.153 0.195 77.3% 1.2%
Zimbabwe 81.44 100 100 22.8% 0.4% 8.624 24.7 31.28 262.7% 2.6% 2.184 9.458 24.19 1007.6% 4.9%
Eritrea 61.27 75.89 79.82 30.3% 0.5% 2.904 20.6 21.27 632.4% 4.1% 0.786 1.57 1.887 140.1% 1.8%
Mauritius 100 100 100 0.0% 0.0% 20.32 45.63 70.84 248.6% 2.5% 11.33 31.02 43.22 281.5% 2.7%
Comoros 51.81 74.8 93.29 80.1% 1.2% 5.995 22.06 27.14 352.7% 3.1% 1.365 4.378 12.91 845.8% 4.6%
Djibouti 86.63 100 100 15.4% 0.3% 6.867 23.75 28.42 313.9% 2.9% 2.395 7.933 17.1 614.0% 4.0%
Africa-Eastern 58.7 81.35 89.91 53.2% 0.9% 3.42 22.32 30.74 798.8% 4.5% 1.166 4.736 15.95 1267.9% 5.4%
Congo; Dem. Rep. of 61.68 80.96 92.26 49.6% 0.8% 2.849 20.33 22.33 683.8% 4.2% 0.328 1.04 3.441 949.1% 4.8%
Angola 52.86 81.84 92.67 75.3% 1.1% 4.322 28.16 28.36 556.2% 3.8% 5.279 19.43 21.97 316.2% 2.9%
Cameroon 65.88 88.09 100 51.8% 0.8% 2.26 23.73 27.9 1134.5% 5.2% 2.514 8.374 16.45 554.3% 3.8%
Chad 35.8 63.43 76.28 113.1% 1.5% 1.787 22.62 23.23 1199.9% 5.3% 1.734 6.012 7.43 328.5% 3.0%
Central African Republic 31.57 58.82 78.3 148.0% 1.8% 6.711 21.26 23.89 256.0% 2.6% 0.816 2.813 6.897 745.2% 4.4%
Congo, Rep. of 51.25 79.09 91.26 78.1% 1.2% 11.25 26.58 27.61 145.4% 1.8% 4.106 15.06 19.16 366.6% 3.1%
Gabon 89.61 100 100 11.6% 0.2% 14.88 40.24 43 189.0% 2.1% 11.05 28.1 32.14 190.9% 2.2%
Equatorial Guinea 100 100 100 0.0% 0.0% 6.626 59.26 47.31 614.0% 4.0% 11.55 31.59 32.32 179.8% 2.1%
São Tomé and Príncipe 69.98 86.77 95.49 36.5% 0.6% 12.64 21.79 24.43 93.3% 1.3% 1.675 4.222 7.972 375.9% 3.2%
Africa-Middle 57.77 79.84 91.29 58.0% 0.9% 3.492 22.59 24.13 591.0% 3.9% 1.815 5.807 8.295 357.0% 3.1%
Egypt 100 100 100 0.0% 0.0% 13.31 31.98 53.78 304.1% 2.8% 6.128 24.77 36.29 492.2% 3.6%
Sudan 46.75 78.43 96.17 105.7% 1.5% 3.791 25.51 30.4 701.9% 4.3% 2.404 11.93 23.77 888.8% 4.7%
Algeria 53.77 81.99 97.5 81.3% 1.2% 10.6 31.51 35.69 236.7% 2.5% 8.094 26.13 30.86 281.3% 2.7%
Morocco 100 100 100 0.0% 0.0% 10.73 27.88 37.18 246.5% 2.5% 5.54 17.58 30.28 446.6% 3.5%
Tunisia 100 100 100 0.0% 0.0% 14.92 39 68.31 357.8% 3.1% 8.676 29.21 41.76 381.3% 3.2%
Libyan Arab Jamahiriya 82.89 100 100 20.6% 0.4% 6.715 47.41 52.12 676.2% 4.2% 11.15 31.39 36.85 230.5% 2.4%
Africa-Northern 81.11 92.09 98.61 21.6% 0.4% 10.45 30.63 43.34 314.7% 2.9% 5.933 21.39 31.63 433.1% 3.4%
VOL2_15 Forecast Tables rev.indd 296 21/08/2009 09:22

297Forecast Tables
Patterns of Potential Human Progress Multination Regional Analysis Measures of Poverty, Health, Education, Infrastructure, and Governance
Base Case: Countries in Year 2060
Descending Population Sequence
InfrastructureMobile Phone Usage Internet Usage Broadband Usage
Percent of Population Percent of Population Percent of Population
2010 2035 2060 % Chg % An Chg 2010 2035 2060 % Chg % An Chg 2010 2035 2060 % Chg % An Chg
AFRICA continuedSouth Africa 100 100 100 0.0% 0.0% 16.13 40.75 67.48 318.4% 2.9% 11.28 29.79 42.22 274.3% 2.7%
Namibia 99.62 100 100 0.4% 0.0% 12.34 33.22 66.75 440.9% 3.4% 5.97 25.21 40.63 580.6% 3.9%
Lesotho 41.5 71.05 95.69 130.6% 1.7% 6.19 23.69 33.8 446.0% 3.5% 1.741 7.392 24.16 1287.7% 5.4%
Botswana 100 100 100 0.0% 0.0% 23.74 62.37 76 220.1% 2.4% 11.23 35.67 55.76 396.5% 3.3%
Swaziland 100 100 100 0.0% 0.0% 11.74 30.94 47.46 304.3% 2.8% 5.551 22.57 34.31 518.1% 3.7%
Africa-Southern 97.99 98.89 99.83 1.9% 0.0% 15.8 40.26 65.85 316.8% 2.9% 10.62 28.74 41.68 292.5% 2.8%
Nigeria 69.78 93.37 100 43.3% 0.7% 2.887 23.64 24.83 760.1% 4.4% 1.924 8.111 11.61 503.4% 3.7%
Niger 27.17 53.38 75.48 177.8% 2.1% 1.667 20.89 23.97 1337.9% 5.5% 0.728 2.164 6.494 792.0% 4.5%
Côte d’Ivoire 66.67 89.02 100 50.0% 0.8% 6.926 23.31 26.81 287.1% 2.7% 1.984 7.231 14.42 626.8% 4.0%
Ghana 70.8 88.14 97.43 37.6% 0.6% 2.864 21.88 24.16 743.6% 4.4% 1.5 3.967 8.094 439.6% 3.4%
Burkina Faso 38.27 66.7 89.07 132.7% 1.7% 3.127 22.4 29.18 833.2% 4.6% 1.345 5.288 15.94 1085.1% 5.1%
Mali 33.74 61.45 83.55 147.6% 1.8% 3.756 21.93 26.63 609.0% 4.0% 1.244 4.351 12.14 875.9% 4.7%
Senegal 96.21 100 100 3.9% 0.1% 8.397 22.86 27.54 228.0% 2.4% 2.061 6.293 14.72 614.2% 4.0%
Guinea 91.29 100 100 9.5% 0.2% 4.07 22.63 27.93 586.2% 3.9% 1.381 5.709 15.85 1047.7% 5.0%
Benin 54.95 77.55 93.46 70.1% 1.1% 4.539 22.14 26.69 488.0% 3.6% 1.523 4.805 11.98 686.6% 4.2%
Togo 96.04 100 100 4.1% 0.1% 10.81 20.85 21.86 102.2% 1.4% 0.907 1.993 2.921 222.1% 2.4%
Sierra Leone 81.59 100 100 22.6% 0.4% 2.006 21.91 27.67 1279.4% 5.4% 0.759 3.865 14.32 1786.7% 6.1%
Liberia 28.62 52.06 70.57 146.6% 1.8% 0.588 20.3 22 3641.5% 7.5% 0.383 0.894 2.703 605.7% 4.0%
Mauritania 58.07 79.14 92.11 58.6% 0.9% 5.407 22.53 25.6 373.5% 3.2% 2.165 5.853 11.21 417.8% 3.3%
Guinea-Bissau 76.34 90.72 93.95 23.1% 0.4% 4.615 20.49 21.89 374.3% 3.2% 0.556 1.446 2.694 384.5% 3.2%
Gambia 81.42 97.47 100 22.8% 0.4% 8.304 21.8 24.82 198.9% 2.2% 1.343 3.997 9.18 583.5% 3.9%
Cape Verde 96.72 100 100 3.4% 0.1% 11.72 28.99 53.7 358.2% 3.1% 3.568 17.95 36.12 912.3% 4.7%
Africa-Western 65.65 86.5 95.62 45.7% 0.8% 3.714 22.85 25.48 586.1% 3.9% 1.664 6.332 11.45 588.1% 3.9%
VOL2_15 Forecast Tables rev.indd 297 21/08/2009 09:22

Patterns of Potential Hum
an Progress Volume 2: Enhancing Global Education
298
Patterns of Potential Human Progress Multination Regional Analysis Measures of Poverty, Health, Education, Infrastructure, and Governance
Base Case: Countries in Year 2060
Descending Population Sequence
InfrastructureMobile Phone Usage Internet Usage Broadband Usage
Percent of Population Percent of Population Percent of Population
2010 2035 2060 % Chg % An Chg 2010 2035 2060 % Chg % An Chg 2010 2035 2060 % Chg % An Chg
AMERICASHaiti 67.6 87.48 97.97 44.9% 0.7% 6.902 22.15 24.91 260.9% 2.6% 1.476 4.661 9.672 555.3% 3.8%
Dominican Republic 100 100 100 0.0% 0.0% 14.47 38.35 62.21 329.9% 3.0% 8.047 29.42 40.97 409.1% 3.3%
Cuba 82.92 100 100 20.6% 0.4% 10.78 34.15 70.64 555.3% 3.8% 7.046 26.64 40.72 477.9% 3.6%
Puerto Rico 100 100 100 0.0% 0.0% 28.65 75.6 76 165.3% 2.0% 14.43 40.99 70.89 391.3% 3.2%
Jamaica 100 100 100 0.0% 0.0% 15.61 31.67 41.36 165.0% 2.0% 10.65 27.27 32.77 207.7% 2.3%
Trinidad and Tobago 100 100 100 0.0% 0.0% 23.73 66.11 76 220.3% 2.4% 12.37 37.81 48.03 288.3% 2.8%
Bahamas 95.96 100 100 4.2% 0.1% 33.66 55.44 76 125.8% 1.6% 15.28 34.74 48.49 217.3% 2.3%
Barbados 100 100 100 0.0% 0.0% 19.24 49.3 76 295.0% 2.8% 21.91 39.24 56 155.6% 1.9%
St. Vincent & the Grenadines 100 100 100 0.0% 0.0% 15.28 34.19 55.58 263.7% 2.6% 11.63 29.47 38.18 228.3% 2.4%
Grenada 76.97 100 100 29.9% 0.5% 16.49 35.84 57 245.7% 2.5% 13.97 30.01 38.21 173.5% 2.0%
St. Lucia 99.23 100 100 0.8% 0.0% 20.49 39.67 61.09 198.1% 2.2% 11.08 28.91 38.8 250.2% 2.5%
America-Caribbean 87.33 96.36 99.31 13.7% 0.3% 13.7 36.87 51.81 278.2% 2.7% 7.396 22.9 32.95 345.5% 3.0%
Guatemala 87.69 100 100 14.0% 0.3% 11 29.73 40.98 272.5% 2.7% 6.402 21.16 31.93 398.8% 3.3%
Honduras 69.05 93.21 100 44.8% 0.7% 10.84 27.2 36.35 235.3% 2.4% 4.257 15.44 29.27 587.6% 3.9%
El Salvador 100 100 100 0.0% 0.0% 12.62 33.6 52.26 314.1% 2.9% 7.647 26.75 36.39 375.9% 3.2%
Nicaragua 81.72 100 100 22.4% 0.4% 10.57 25.66 32.41 206.6% 2.3% 3.555 12.14 25.65 621.5% 4.0%
Costa Rica 98.46 100 100 1.6% 0.0% 18.43 50.83 76 312.4% 2.9% 12.23 33.28 57.49 370.1% 3.1%
Panama 87.44 100 100 14.4% 0.3% 14.67 47.51 76 418.1% 3.3% 11.67 32.21 49.99 328.4% 3.0%
Belize 95.66 100 100 4.5% 0.1% 17.07 42.06 74.79 338.1% 3.0% 11.37 31.37 45.4 299.3% 2.8%
America-Central 86.81 98.81 100 15.2% 0.3% 12.32 32.61 46.19 274.9% 2.7% 6.93 21.83 34.77 401.7% 3.3%
United States of America 100 100 100 0.0% 0.0% 59.87 75.82 76 26.9% 0.5% 27.9 59.65 89.81 221.9% 2.4%
Mexico 100 100 100 0.0% 0.0% 17.62 43.49 61.77 250.6% 2.5% 12.96 31.27 40.09 209.3% 2.3%
Canada 98.72 100 100 1.3% 0.0% 53.73 75.9 76 41.4% 0.7% 31.17 56.78 81.81 162.5% 1.9%
America-North 99.9 100 100 0.1% 0.0% 49.27 68.02 72.72 47.6% 0.8% 24.55 52.59 77.78 216.8% 2.3%
Brazil 100 100 100 0.0% 0.0% 16.21 39.86 63.67 292.8% 2.8% 13.14 31.1 40.93 211.5% 2.3%
Colombia 93.85 100 100 6.6% 0.1% 14.04 33.85 56.23 300.5% 2.8% 8.405 27.76 37.65 347.9% 3.0%
Argentina 100 100 100 0.0% 0.0% 20.9 51.98 76 263.6% 2.6% 13.62 34.7 51.63 279.1% 2.7%
Venezuela, RB 100 100 100 0.0% 0.0% 20.68 42.39 52.65 154.6% 1.9% 12.44 31.06 37.52 201.6% 2.2%
Peru 100 100 100 0.0% 0.0% 15.28 36.49 50.78 232.3% 2.4% 9.907 29.42 36.74 270.8% 2.7%
Chile 100 100 100 0.0% 0.0% 27.17 61.12 76 179.7% 2.1% 15.5 38.64 61.57 297.2% 2.8%
Ecuador 91.63 100 100 9.1% 0.2% 13.64 30.91 33.8 147.8% 1.8% 8.582 25.43 29.63 245.3% 2.5%
Bolivia 58.25 89 100 71.7% 1.1% 12.16 31.44 44.67 267.4% 2.6% 4.989 23.87 33.52 571.9% 3.9%
Paraguay 85.5 100 100 17.0% 0.3% 10.75 27 35.17 227.2% 2.4% 4.914 15.19 28.45 479.0% 3.6%
Uruguay 100 100 100 0.0% 0.0% 19.79 46.54 76 284.0% 2.7% 12.98 32.54 49.37 280.4% 2.7%
Guyana 100 100 100 0.0% 0.0% 15.52 28.85 43.48 180.2% 2.1% 4.577 18.18 32.58 611.8% 4.0%
Suriname 95.62 100 100 4.6% 0.1% 13.3 37.56 53.2 300.0% 2.8% 10.01 28.82 36.9 268.6% 2.6%
America-South 97.66 99.68 100 2.4% 0.0% 16.89 40.37 60.41 257.7% 2.6% 11.89 30.51 40.99 244.7% 2.5%
VOL2_15 Forecast Tables rev.indd 298 21/08/2009 09:22

299Forecast Tables
Patterns of Potential Human Progress Multination Regional Analysis Measures of Poverty, Health, Education, Infrastructure, and Governance
Base Case: Countries in Year 2060
Descending Population Sequence
InfrastructureMobile Phone Usage Internet Usage Broadband Usage
Percent of Population Percent of Population Percent of Population
2010 2035 2060 % Chg % An Chg 2010 2035 2060 % Chg % An Chg 2010 2035 2060 % Chg % An Chg
ASIA WITH OCEANIAChina 100 100 100 0.0% 0.0% 13.2 44.88 76 475.8% 3.6% 8.919 32.73 54.32 509.0% 3.7%
Japan 100 100 100 0.0% 0.0% 46.65 76 76 62.9% 1.0% 28.77 51.86 76.59 166.2% 2.0%
Korea, Rep. of 82.98 100 100 20.5% 0.4% 38.26 76 76 98.6% 1.4% 36.47 62.33 85.8 135.3% 1.7%
Taiwan 100 100 100 0.0% 0.0% 32.03 66.82 76 137.3% 1.7% 20.15 42.48 68.73 241.1% 2.5%
Korea, Dem. Rep. of 13.06 48.46 71.86 450.2% 3.5% 11.37 25.81 28.91 154.3% 1.9% 3.797 13.42 20 426.7% 3.4%
Hong Kong 100 100 100 0.0% 0.0% 57.46 75.91 76 32.3% 0.6% 36.22 59.77 68.71 89.7% 1.3%
Mongolia 41.65 72.26 96.3 131.2% 1.7% 11.02 26.65 38.84 252.5% 2.6% 3.547 13.84 29.71 737.6% 4.3%
Asia-East 98.11 99.23 99.62 1.5% 0.0% 17.16 48.09 75.3 338.8% 3.0% 11.61 34.86 56.08 383.0% 3.2%
India 43.41 79.64 100 130.4% 1.7% 9.621 30.35 52.41 444.7% 3.4% 3.269 20.16 36.18 1006.8% 4.9%
Pakistan 48.24 75.53 93.2 93.2% 1.3% 6.779 24.68 29.89 340.9% 3.0% 2.908 10.23 20.7 611.8% 4.0%
Bangladesh 91.77 100 100 9.0% 0.2% 2.699 24.03 30.21 1019.3% 4.9% 1.469 7.906 21.26 1347.2% 5.5%
Afghanistan 83.01 95.1 96.54 16.3% 0.3% 7.06 20.76 22.03 212.0% 2.3% 0.872 2.063 3.269 274.9% 2.7%
Iran, Islamic Rep. of 86.96 100 100 15.0% 0.3% 20.11 46.4 53.18 164.4% 2.0% 11.09 31.6 38.03 242.9% 2.5%
Nepal 22.54 53.64 77.36 243.2% 2.5% 4.15 22.25 25.91 524.3% 3.7% 1.216 4.61 11.52 847.4% 4.6%
Uzbekistan 86.88 100 100 15.1% 0.3% 9.192 25.06 28.85 213.9% 2.3% 2.745 11.21 19.14 597.3% 4.0%
Sri Lanka 96.85 100 100 3.3% 0.1% 9.606 31.19 48.23 402.1% 3.3% 4.784 22.71 34.91 629.7% 4.1%
Kazakhstan 93.61 100 100 6.8% 0.1% 10.58 59.56 62.59 491.6% 3.6% 11.37 36.43 43.2 279.9% 2.7%
Tajikistan 13.05 47.72 75.41 477.9% 3.6% 0.461 23.53 29.02 6195.0% 8.6% 1.976 7.534 18.51 836.7% 4.6%
Turkmenistan 26.43 68.32 88.62 235.3% 2.4% 1.575 35.88 33.58 2032.1% 6.3% 3.858 25.35 31.57 718.3% 4.3%
Kyrgyzstan 36.65 63.96 82.5 125.1% 1.6% 9.434 23.36 26.22 177.9% 2.1% 2.22 6.916 13.03 486.9% 3.6%
Bhutan 18.75 58.73 91.65 388.8% 3.2% 8.817 32.8 56.57 541.6% 3.8% 5.068 24.82 37.74 644.7% 4.1%
Maldives 100 100 100 0.0% 0.0% 13.15 39.28 76 477.9% 3.6% 6.777 28.77 53.59 690.8% 4.2%
Asia-South Central 52.17 82.29 98.23 88.3% 1.3% 8.948 29.38 44.67 399.2% 3.3% 3.393 17.32 30.15 788.6% 4.5%
Indonesia 100 100 100 0.0% 0.0% 11.34 28.22 36.46 221.5% 2.4% 4.292 17.97 30.01 599.2% 4.0%
Philippines 100 100 100 0.0% 0.0% 12.16 28.07 39 220.7% 2.4% 4.014 16.93 31 672.3% 4.2%
Vietnam 82.18 100 100 21.7% 0.4% 10.17 29.46 44.57 338.2% 3.0% 3.26 18.77 33.94 941.1% 4.8%
Thailand 100 100 100 0.0% 0.0% 16.35 38.33 57.04 248.9% 2.5% 9.501 29.17 38.18 301.9% 2.8%
Myanmar 23.41 58.81 82.23 251.3% 2.5% 0.252 23.22 27.36 10757.1% 9.8% 1.268 6.322 15.09 1090.1% 5.1%
Malaysia 100 100 100 0.0% 0.0% 28.49 52.53 76 166.8% 2.0% 13.14 34.45 47.27 259.7% 2.6%
Cambodia 87.05 100 100 14.9% 0.3% 2.119 26.87 38.04 1695.2% 5.9% 2.043 13.33 30.75 1405.1% 5.6%
Lao PDR 67.15 97.91 100 48.9% 0.8% 9.492 28.79 53.92 468.1% 3.5% 2.431 16.42 36.65 1407.6% 5.6%
Singapore 100 100 100 0.0% 0.0% 54.62 75.99 76 39.1% 0.7% 27.36 55.49 67.65 147.3% 1.8%
Timor-Leste 61.7 85.86 100 62.1% 1.0% 9.292 24.38 34.31 269.2% 2.6% 2.662 9.815 24.7 827.9% 4.6%
Brunei Darussalam 100 100 100 0.0% 0.0% 64.89 75.55 76 17.1% 0.3% 13.64 41.73 55.02 303.4% 2.8%
Asia-South East 89.69 96.69 98.73 10.1% 0.2% 11.79 30.64 42.34 259.1% 2.6% 4.936 19.1 31.87 545.7% 3.8%
VOL2_15 Forecast Tables rev.indd 299 21/08/2009 09:23

Patterns of Potential Hum
an Progress Volume 2: Enhancing Global Education
300
Patterns of Potential Human Progress Multination Regional Analysis Measures of Poverty, Health, Education, Infrastructure, and Governance
Base Case: Countries in Year 2060
Descending Population Sequence
InfrastructureMobile Phone Usage Internet Usage Broadband Usage
Percent of Population Percent of Population Percent of Population
2010 2035 2060 % Chg % An Chg 2010 2035 2060 % Chg % An Chg 2010 2035 2060 % Chg % An Chg
ASIA WITH OCEANIA continuedTurkey 100 100 100 0.0% 0.0% 16.09 43.82 76 372.3% 3.2% 12.52 32.28 48.44 286.9% 2.7%
Yemen 79.44 100 100 25.9% 0.5% 9.709 25.54 31.94 229.0% 2.4% 2.647 11.61 24.99 844.1% 4.6%
Iraq 79.72 100 100 25.4% 0.5% 10.13 27.79 39.84 293.3% 2.8% 3.057 15.06 31.13 918.3% 4.8%
Saudi Arabia 96.35 100 100 3.8% 0.1% 21.7 58.19 71.11 227.7% 2.4% 11.4 32.73 41.69 265.7% 2.6%
Syria 100 100 100 0.0% 0.0% 12.29 28.03 38.66 214.6% 2.3% 5.032 17.66 30.55 507.1% 3.7%
Israel 100 100 100 0.0% 0.0% 35.03 75.6 76 117.0% 1.6% 28.92 56.93 92.3 219.2% 2.3%
Azerbaijan 100 100 100 0.0% 0.0% 5.783 35.87 41.69 620.9% 4.0% 7.219 29.09 33.77 367.8% 3.1%
Jordan 100 100 100 0.0% 0.0% 13.37 35.36 76 468.4% 3.5% 6.227 26.38 45.84 636.1% 4.1%
Palestine 100 100 100 0.0% 0.0% 11.57 28.3 42.07 263.6% 2.6% 4.616 17.76 31.97 592.6% 3.9%
United Arab Emirates 100 100 100 0.0% 0.0% 43.74 75.69 76 73.8% 1.1% 14.43 37.44 54.19 275.5% 2.7%
Oman 92.52 99.43 100 8.1% 0.2% 22.81 55.27 66.87 193.2% 2.2% 11.45 31.96 39.42 244.3% 2.5%
Kuwait 100 100 100 0.0% 0.0% 36.62 75.48 76 107.5% 1.5% 12.41 46.45 54.3 337.6% 3.0%
Lebanon 100 100 100 0.0% 0.0% 19.73 41.99 63.63 222.5% 2.4% 14.18 32.26 41.97 196.0% 2.2%
Georgia 100 100 100 0.0% 0.0% 10.04 29.38 37.2 270.5% 2.7% 5.016 19.92 30.9 516.0% 3.7%
Armenia 97.34 100 100 2.7% 0.1% 11.13 39.65 58.5 425.6% 3.4% 6.037 28.93 40.56 571.9% 3.9%
Bahrain 100 100 100 0.0% 0.0% 32.88 73.35 76 131.1% 1.7% 14.38 36.99 47.72 231.8% 2.4%
Qatar 100 100 100 0.0% 0.0% 37.69 75.84 76 101.6% 1.4% 15.92 77.35 82.13 415.9% 3.3%
Cyprus 100 100 100 0.0% 0.0% 35.96 70.92 76 111.3% 1.5% 15.59 38.95 55.98 259.1% 2.6%
Asia-West 94.63 99.99 100 5.7% 0.1% 16.02 40.41 55.76 248.1% 2.5% 9.296 25.81 39.27 322.4% 2.9%
Australia 99.52 100 100 0.5% 0.0% 49.43 75.81 76 53.8% 0.9% 20.15 46.77 74.06 267.5% 2.6%
Papua New Guniea 73.49 96.75 100 36.1% 0.6% 9.354 24.77 28.1 200.4% 2.2% 2.143 9.52 18.04 741.8% 4.4%
New Zealand 99.15 100 100 0.9% 0.0% 46.05 70.54 76 65.0% 1.0% 19.19 41.26 66.28 245.4% 2.5%
Solomon Islands 47.29 72.84 87.82 85.7% 1.2% 4.016 23.15 26.02 547.9% 3.8% 2.31 7.225 12.65 447.6% 3.5%
Fiji 72.02 95.79 100 38.9% 0.7% 12.65 29.18 45.39 258.8% 2.6% 6.315 19.85 33.21 425.9% 3.4%
Vanuatu 32.65 63.48 87.65 168.5% 2.0% 12.22 26.76 35.86 193.5% 2.2% 4.489 14.88 28.45 533.8% 3.8%
Micronesia 91 100 100 9.9% 0.2% 14.4 29.47 43.19 199.9% 2.2% 6.805 21.29 31.9 368.8% 3.1%
Tonga 81.57 100 100 22.6% 0.4% 11.39 28.34 40.17 252.7% 2.6% 6.88 18.7 30.98 350.3% 3.1%
Samoa 72.01 96.83 100 38.9% 0.7% 10.79 30.8 48.95 353.7% 3.1% 6.279 23.1 34.46 448.8% 3.5%
Oceania 92.29 98.28 99.6 7.9% 0.2% 39.01 60.17 60.68 55.5% 0.9% 15.69 35.45 55.15 251.5% 2.5%
VOL2_15 Forecast Tables rev.indd 300 21/08/2009 09:23

301Forecast Tables
Patterns of Potential Human Progress Multination Regional Analysis Measures of Poverty, Health, Education, Infrastructure, and Governance
Base Case: Countries in Year 2060
Descending Population Sequence
InfrastructureMobile Phone Usage Internet Usage Broadband Usage
Percent of Population Percent of Population Percent of Population
2010 2035 2060 % Chg % An Chg 2010 2035 2060 % Chg % An Chg 2010 2035 2060 % Chg % An Chg
EUROPERussian Federation 100 100 100 0.0% 0.0% 25.15 61.91 70.03 178.4% 2.1% 12.43 37.27 45.31 264.5% 2.6%
Ukraine 100 100 100 0.0% 0.0% 12.23 39.82 62.95 414.7% 3.3% 7.78 29.37 40.85 425.1% 3.4%
Poland 100 100 100 0.0% 0.0% 22.02 58.01 76 245.1% 2.5% 13.77 35.85 51.57 274.5% 2.7%
Romania 100 100 100 0.0% 0.0% 17.94 43.1 58.29 224.9% 2.4% 14.58 32.8 40.48 177.6% 2.1%
Czech Republic 100 100 100 0.0% 0.0% 28.82 57.75 76 163.7% 2.0% 18.18 37.39 46.69 156.8% 1.9%
Belarus 100 100 100 0.0% 0.0% 16.13 45.68 65.97 309.0% 2.9% 11.24 31.26 42.3 276.3% 2.7%
Hungary 100 100 100 0.0% 0.0% 25.19 56.29 76 201.7% 2.2% 17.63 37.56 49.18 179.0% 2.1%
Bulgaria 100 100 100 0.0% 0.0% 19.32 43.09 67.3 248.3% 2.5% 13.25 31.6 42.47 220.5% 2.4%
Slovakia 100 100 100 0.0% 0.0% 25.99 50.39 66.76 156.9% 1.9% 14.66 33.6 42.29 188.5% 2.1%
Moldova, Rep. of 100 100 100 0.0% 0.0% 8.946 25.71 36.96 313.1% 2.9% 3.174 11.34 28.6 801.1% 4.5%
Europe-East 100 100 100 0.0% 0.0% 21.68 54.86 68.69 216.8% 2.3% 12.31 34.9 44.91 264.8% 2.6%
United Kingdom 100 100 100 0.0% 0.0% 45.2 76 76 68.1% 1.0% 27.74 51.9 81.37 193.3% 2.2%
Sweden 100 100 100 0.0% 0.0% 55.63 76 76 36.6% 0.6% 32.77 60.71 93.81 186.3% 2.1%
Denmark 100 100 100 0.0% 0.0% 52.44 76 76 44.9% 0.7% 36.15 59.66 88.21 144.0% 1.8%
Ireland 100 100 100 0.0% 0.0% 45.88 75.84 76 65.6% 1.0% 20.21 54.72 77.76 284.8% 2.7%
Norway 99.42 100 100 0.6% 0.0% 59.73 75.94 76 27.2% 0.5% 33.22 63.45 90.56 172.6% 2.0%
Finland 100 100 100 0.0% 0.0% 51.04 76 76 48.9% 0.8% 33.95 57.59 84.37 148.5% 1.8%
Lithuania 100 100 100 0.0% 0.0% 22.99 53.77 76 230.6% 2.4% 18.11 37.92 49.86 175.3% 2.0%
Latvia 100 100 100 0.0% 0.0% 22.76 59.4 76 233.9% 2.4% 14.04 36.6 55 291.7% 2.8%
Estonia 100 100 100 0.0% 0.0% 37.37 64.77 76 103.4% 1.4% 24.74 46.2 62.13 151.1% 1.9%
Iceland 100 100 100 0.0% 0.0% 63.49 75.96 76 19.7% 0.4% 37.79 64.86 95.76 153.4% 1.9%
Europe-North 99.97 100 100 0.0% 0.0% 46.31 74.86 76 64.1% 1.0% 28.29 53.42 81.9 189.5% 2.1%
Italy 100 100 100 0.0% 0.0% 39.96 63.67 76 90.2% 1.3% 22.69 41.23 53.71 136.7% 1.7%
Spain 99.94 100 100 0.1% 0.0% 34.31 70.5 76 121.5% 1.6% 22.8 43.72 58.28 155.6% 1.9%
Greece 100 100 100 0.0% 0.0% 33.73 71.29 76 125.3% 1.6% 12.95 35.52 49.04 278.7% 2.7%
Portugal 99.43 100 100 0.6% 0.0% 36.31 54.46 76 109.3% 1.5% 22.19 39.61 51.95 134.1% 1.7%
Serbia 100 100 100 0.0% 0.0% 20.09 39.2 59.3 195.2% 2.2% 14.48 31.47 40.32 178.5% 2.1%
Croatia 100 100 100 0.0% 0.0% 22.52 47.96 76 237.5% 2.5% 13.78 32.71 45.2 228.0% 2.4%
Bosnia and Herzegovina 100 100 100 0.0% 0.0% 12.75 31.1 42.56 233.8% 2.4% 8.021 24.11 32.48 304.9% 2.8%
Albania 100 100 100 0.0% 0.0% 4.013 37.33 56.31 1303.2% 5.4% 7.385 28.36 38.49 421.2% 3.4%
Macedonia, TFYR 100 100 100 0.0% 0.0% 17.77 31.04 40.36 127.1% 1.7% 9.874 25.01 31.59 219.9% 2.4%
Slovenia 100 100 100 0.0% 0.0% 33.75 67.48 76 125.2% 1.6% 21.15 42.52 62.03 193.3% 2.2%
Montenegro 100 100 100 0.0% 0.0% 17.99 37.2 62.71 248.6% 2.5% 12.46 30.37 40.91 228.3% 2.4%
Malta 100 100 100 0.0% 0.0% 30.82 62.18 76 146.6% 1.8% 22.21 42 58.65 164.1% 2.0%
Europe-South 99.94 100 100 0.1% 0.0% 34.04 61.97 73.14 114.9% 1.5% 20.31 39.69 52.43 158.1% 1.9%
Germany 99.88 100 100 0.1% 0.0% 46.28 76 76 64.2% 1.0% 24.14 46.91 75.07 211.0% 2.3%
France 100 100 100 0.0% 0.0% 37.49 75.91 76 102.7% 1.4% 26.68 47.61 74.01 177.4% 2.1%
Netherlands 100 100 100 0.0% 0.0% 54.97 76 76 38.3% 0.6% 36.23 56.76 74.02 104.3% 1.4%
Belgium 99.99 100 100 0.0% 0.0% 43.69 75.89 76 74.0% 1.1% 30.3 50.01 70.94 134.1% 1.7%
Austria 99.64 100 100 0.4% 0.0% 49.76 76 76 52.7% 0.9% 25.56 49.42 73.66 188.2% 2.1%
Switzerland 100 100 100 0.0% 0.0% 45.92 76 76 65.5% 1.0% 33.67 57.36 82.14 144.0% 1.8%
Luxembourg 100 100 100 0.0% 0.0% 49.76 75.64 76 52.7% 0.9% 28.31 57.96 76.82 171.4% 2.0%
Europe-West 99.93 100 100 0.1% 0.0% 44.16 75.96 76 72.1% 1.1% 26.85 48.8 74.55 177.7% 2.1%
VOL2_15 Forecast Tables rev.indd 301 21/08/2009 09:23

Patterns of Potential Hum
an Progress Volume 2: Enhancing Global Education
302
Patterns of Potential Human Progress Multination Regional Analysis Measures of Poverty, Health, Education, Infrastructure, and Governance
Base Case
Source: International Futures Version 6.12, March 2009
Infrastructure GovernanceR&D Expenditures Freedom House Index (Inverted) Polity Democracy Index
Percent of GDP Index Range: 2-14 Index Range: 1-20
2010 2035 2060 % Chg % An Chg 2010 2035 2060 % Chg % An Chg 2010 2035 2060 % Chg % An Chg
World 2.18 2.512 3.11 42.7% 0.7% 8.401 9.467 10.12 20.5% 0.4% 12.95 13.81 14.94 15.4% 0.3%
Africa 0.424 0.742 1.542 263.7% 2.6% 7.209 8.443 9.74 35.1% 0.6% 10.94 11.81 13.1 19.7% 0.4%Americas 2.477 2.57 2.786 12.5% 0.2% 11.95 12.65 13.28 11.1% 0.2% 18.42 18.94 19.43 5.5% 0.1%Asia with Oceania 2.097 2.472 3.421 63.1% 1.0% 7.319 8.721 9.296 27.0% 0.5% 11.18 12.57 14.21 27.1% 0.5%Europe 1.985 2.775 3.027 52.5% 0.8% 11.59 12.04 12.3 6.1% 0.1% 18.74 19.17 19.41 3.6% 0.1%World 2.18 2.512 3.11 42.7% 0.7% 8.401 9.467 10.12 20.5% 0.4% 12.95 13.81 14.94 15.4% 0.3%
Africa-Eastern 0.235 0.452 1.274 442.1% 3.4% 7.595 9.313 11.42 50.4% 0.8% 11.78 12.37 13.78 17.0% 0.3%Africa-Middle 0.339 0.434 0.37 9.1% 0.2% 4.556 5.392 6.779 48.8% 0.8% 6.715 7.702 9.364 39.4% 0.7%Africa-Northern 0.387 0.742 1.685 335.4% 3.0% 4.734 5.251 5.851 23.6% 0.4% 5.834 7.823 10.38 77.9% 1.2%Africa-Southern 0.796 1.417 2.808 252.8% 2.6% 12.85 13.7 13.76 7.1% 0.1% 18.51 19.27 19.54 5.6% 0.1%Africa-Western 0.106 0.201 0.384 262.3% 2.6% 8.555 9.945 10.9 27.4% 0.5% 13.91 14.28 15.02 8.0% 0.2%Africa 0.424 0.742 1.542 263.7% 2.6% 7.209 8.443 9.74 35.1% 0.6% 10.94 11.81 13.1 19.7% 0.4%
America-Caribbean 0.987 1.954 2.767 180.3% 2.1% 6.24 6.987 7.452 19.4% 0.4% 11.46 12.74 14.3 24.8% 0.4%America-Central 0.278 0.955 2.017 625.5% 4.0% 10.36 11.17 12.25 18.2% 0.3% 17.93 18.43 19.09 6.5% 0.1%America-North 2.734 2.808 2.872 5.0% 0.1% 13.56 13.82 14 3.2% 0.1% 19.53 19.7 19.92 2.0% 0.0%America-South 0.708 1.383 2.55 260.2% 2.6% 10.86 12.1 13.2 21.5% 0.4% 17.89 18.77 19.45 8.7% 0.2%Americas 2.477 2.57 2.786 12.5% 0.2% 11.95 12.65 13.28 11.1% 0.2% 18.42 18.94 19.43 5.5% 0.1%
Asia-East 2.543 2.998 4.107 61.5% 1.0% 4.429 5.085 5.491 24.0% 0.4% 5.601 7.798 10.4 85.7% 1.2%Asia-South Central 0.736 1.208 2.264 207.6% 2.3% 9.739 11.51 11.68 19.9% 0.4% 15.47 15.71 16.43 6.2% 0.1%Asia-South East 0.587 0.903 1.576 168.5% 2.0% 7.991 9.305 10.44 30.6% 0.5% 13.91 14.94 16.19 16.4% 0.3%Asia-West 1.602 2.212 3.07 91.6% 1.3% 6.621 7.255 8.007 20.9% 0.4% 9.418 10.43 12.31 30.7% 0.5%Oceania 1.785 2.476 2.549 42.8% 0.7% 13.03 13.4 13.8 5.9% 0.1% 19.69 19.61 19.67 -0.1% 0.0%Asia with Oceania 2.097 2.472 3.421 63.1% 1.0% 7.319 8.721 9.296 27.0% 0.5% 11.18 12.57 14.21 27.1% 0.5%
Europe-East 1.071 2.263 2.934 173.9% 2.0% 8.372 9.089 9.492 13.4% 0.3% 17.34 18.16 18.73 8.0% 0.2%Europe-North 2.355 3.027 3.071 30.4% 0.5% 13.93 13.99 14 0.5% 0.0% 19.91 19.95 19.96 0.3% 0.0%Europe-South 1.106 1.842 2.463 122.7% 1.6% 13.45 13.66 13.85 3.0% 0.1% 19.45 19.61 19.74 1.5% 0.0%Europe-West 2.375 3.241 3.244 36.6% 0.6% 14 14 14 0.0% 0.0% 19.73 19.85 19.77 0.2% 0.0%Europe 1.985 2.775 3.027 52.5% 0.8% 11.59 12.04 12.3 6.1% 0.1% 18.74 19.17 19.41 3.6% 0.1%
VOL2_15 Forecast Tables rev.indd 302 21/08/2009 09:23

303Forecast Tables
Patterns of Potential Human Progress Multination Regional Analysis Measures of Poverty, Health, Education, Infrastructure, and Governance
Base Case: Countries in Year 2060
Descending Population Sequence
Infrastructure GovernanceR&D Expenditures Freedom House Index (Inverted) Polity Democracy Index
Percent of GDP Index Range: 2-14 Index Range: 1-20
2010 2035 2060 % Chg % An Chg 2010 2035 2060 % Chg % An Chg 2010 2035 2060 % Chg % An Chg
AFRICAEthiopia 0.064 0.083 0.245 282.8% 2.7% 6.201 7.049 9.731 56.9% 0.9% 10.94 11.34 12.78 16.8% 0.3%
Uganda 0.804 0.902 1.69 110.2% 1.5% 7.123 9.053 11.95 67.8% 1.0% 6.254 7.939 10.79 72.5% 1.1%
Tanzania, United Rep. of 0.09 0.212 1.1 1122.2% 5.1% 9.274 12.09 14 51.0% 0.8% 12.13 13.15 15.13 24.7% 0.4%
Kenya 0.123 0.227 0.738 500.0% 3.6% 10.22 12.23 14 37.0% 0.6% 17.96 18.24 19.09 6.3% 0.1%
Madagascar 0.121 0.15 0.309 155.4% 1.9% 10.14 11.6 14 38.1% 0.6% 16.81 16.61 16.86 0.3% 0.0%
Mozambique 0.589 0.741 2.046 247.4% 2.5% 9.56 13.84 14 46.4% 0.8% 15.87 16.33 18.1 14.1% 0.3%
Malawi 0.067 0.091 0.24 258.2% 2.6% 8.164 9.464 12.22 49.7% 0.8% 16 16.16 16.37 2.3% 0.0%
Zambia 0.018 0.108 0.482 2577.8% 6.8% 8.177 9.604 12.01 46.9% 0.8% 14.96 15.15 16.26 8.7% 0.2%
Burundi 0.307 0.316 0.493 60.6% 1.0% 6.191 8.066 12.12 95.8% 1.4% 8.984 9.533 11.41 27.0% 0.5%
Rwanda 0.044 0.097 0.326 640.9% 4.1% 5.101 6.234 8.09 58.6% 0.9% 7.102 8.159 10.16 43.1% 0.7%
Somalia 0.028 0.034 0.047 67.9% 1.0% 3.089 4.266 5.749 86.1% 1.3% 3.107 3.754 4.933 58.8% 0.9%
Zimbabwe 0.143 0.299 0.657 359.4% 3.1% 3.044 3.673 4.283 40.7% 0.7% 3.411 5.555 8.349 144.8% 1.8%
Eritrea 0.066 0.067 0.091 37.9% 0.6% 2.982 3.071 3.545 18.9% 0.3% 3.242 4.397 6.061 87.0% 1.3%
Mauritius 0.412 1.16 2.581 526.5% 3.7% 14 14 14 0.0% 0.0% 19.97 20 20 0.2% 0.0%
Comoros 0.101 0.15 0.423 318.8% 2.9% 8.078 9.151 11.74 45.3% 0.8% 15.78 15.51 16.44 4.2% 0.1%
Djibouti 0.159 0.238 0.495 211.3% 2.3% 6.088 6.786 8.055 32.3% 0.6% 11.97 12.48 14.01 17.0% 0.3%
Africa-Eastern 0.235 0.452 1.274 442.1% 3.4% 7.595 9.313 11.42 50.4% 0.8% 11.78 12.37 13.78 17.0% 0.3%
Congo; Dem. Rep. of 0.04 0.059 0.15 275.0% 2.7% 4.187 5.279 7.283 73.9% 1.1% 6.082 6.883 8.639 42.0% 0.7%
Angola 0.333 0.505 0.492 47.7% 0.8% 5.165 5.661 5.79 12.1% 0.2% 8.227 9.663 11.37 38.2% 0.6%
Cameroon 0.168 0.245 0.465 176.8% 2.1% 4.061 4.512 5.218 28.5% 0.5% 6.252 7.661 9.739 55.8% 0.9%
Chad 0.123 0.186 0.2 62.6% 1.0% 4.996 5.651 5.874 17.6% 0.3% 8.102 9.05 10.18 25.6% 0.5%
Central African Republic 0.25 0.276 0.398 59.2% 0.9% 5.094 6.009 7.511 47.4% 0.8% 9.002 9.517 10.84 20.4% 0.4%
Congo, Rep. of 0.025 0.19 0.246 884.0% 4.7% 7.063 7.813 8.143 15.3% 0.3% 6.283 7.865 9.786 55.8% 0.9%
Gabon 0.003 0.279 0.477 15800.0% 10.7% 6.972 7.265 7.571 8.6% 0.2% 6.424 8.531 11.1 72.8% 1.1%
Equatorial Guinea 2.128 2.252 1.561 -26.6% -0.6% 3.011 3.063 2.976 -1.2% 0.0% 5.536 8.036 10.55 90.6% 1.3%
São Tomé and Príncipe 0.119 0.134 0.269 126.1% 1.6% 12.05 12.63 14 16.2% 0.3% 10.17 10.62 11.78 15.8% 0.3%
Africa-Middle 0.339 0.434 0.37 9.1% 0.2% 4.556 5.392 6.779 48.8% 0.8% 6.715 7.702 9.364 39.4% 0.7%
Egypt 0.228 0.584 1.804 691.2% 4.2% 5.126 5.94 6.961 35.8% 0.6% 4.479 6.977 10.21 128.0% 1.7%
Sudan 0.358 0.531 0.776 116.8% 1.6% 2.088 2.532 2.885 38.2% 0.6% 4.304 6.156 8.666 101.3% 1.4%
Algeria 0.459 0.679 0.906 97.4% 1.4% 5.051 5.543 5.913 17.1% 0.3% 12.24 13.56 14.97 22.3% 0.4%
Morocco 0.632 0.794 1.29 104.1% 1.4% 7.123 7.935 9.114 28.0% 0.5% 4.385 6.387 9.131 108.2% 1.5%
Tunisia 0.685 1.274 2.895 322.6% 2.9% 5.136 5.967 6.879 33.9% 0.6% 6.435 8.756 11.63 80.7% 1.2%
Libyan Arab Jamahiriya 0.308 1.084 1.351 338.6% 3.0% 2.041 2.287 2.369 16.1% 0.3% 3.581 6.44 9.484 164.8% 2.0%
Africa-Northern 0.387 0.742 1.685 335.4% 3.0% 4.734 5.251 5.851 23.6% 0.4% 5.834 7.823 10.38 77.9% 1.2%
VOL2_15 Forecast Tables rev.indd 303 21/08/2009 09:23

Patterns of Potential Hum
an Progress Volume 2: Enhancing Global Education
304
Patterns of Potential Human Progress Multination Regional Analysis Measures of Poverty, Health, Education, Infrastructure, and Governance
Base Case: Countries in Year 2060
Descending Population Sequence
Infrastructure GovernanceR&D Expenditures Freedom House Index (Inverted) Polity Democracy Index
Percent of GDP Index Range: 2-14 Index Range: 1-20
2010 2035 2060 % Chg % An Chg 2010 2035 2060 % Chg % An Chg 2010 2035 2060 % Chg % An Chg
AFRICA continuedSouth Africa 0.809 1.357 2.833 250.2% 2.5% 13.23 14 14 5.8% 0.1% 19.05 19.88 20 5.0% 0.1%
Namibia 0.375 0.798 2.665 610.7% 4.0% 11.21 13.04 14 24.9% 0.4% 15.99 16.81 18.48 15.6% 0.3%
Lesotho 0.022 0.147 0.713 3140.9% 7.2% 11.32 13.71 14 23.7% 0.4% 17.88 18.15 19.07 6.7% 0.1%
Botswana 0.95 2.482 3.192 236.0% 2.5% 12.22 14 14 14.6% 0.3% 19.04 20 19.59 2.9% 0.1%
Swaziland 0.342 0.662 1.573 359.9% 3.1% 4.03 4.643 5.415 34.4% 0.6% 1.532 4.248 7.917 416.8% 3.3%
Africa-Southern 0.796 1.417 2.808 252.8% 2.6% 12.85 13.7 13.76 7.1% 0.1% 18.51 19.27 19.54 5.6% 0.1%
Nigeria 0.098 0.209 0.261 166.3% 2.0% 8.166 9.68 10.3 26.1% 0.5% 14.04 14.68 15.21 8.3% 0.2%
Niger 0.063 0.088 0.243 285.7% 2.7% 10.11 11.77 14 38.5% 0.7% 13.83 13.66 14.53 5.1% 0.1%
Côte d’Ivoire 0.137 0.223 0.404 194.9% 2.2% 4.039 4.636 5.406 33.8% 0.6% 13.9 14.29 15.55 11.9% 0.2%
Ghana 0.108 0.138 0.255 136.1% 1.7% 12.28 13.46 14 14.0% 0.3% 17.83 17.6 17.87 0.2% 0.0%
Burkina Faso 0.174 0.245 0.604 247.1% 2.5% 7.121 8.463 10.95 53.8% 0.9% 10.01 10.69 12.61 26.0% 0.5%
Mali 0.093 0.145 0.394 323.7% 2.9% 12.2 14 14 14.8% 0.3% 15.9 15.99 16.77 5.5% 0.1%
Senegal 0.026 0.101 0.353 1257.7% 5.4% 11.13 12.64 14 25.8% 0.5% 17.78 17.6 18.28 2.8% 0.1%
Guinea 0.101 0.187 0.467 362.4% 3.1% 5.079 6.115 7.551 48.7% 0.8% 9.085 10.01 11.83 30.2% 0.5%
Benin 0.11 0.156 0.398 261.8% 2.6% 12.26 13.9 14 14.2% 0.3% 15.94 16.13 16.81 5.5% 0.1%
Togo 0.476 0.453 0.476 0.0% 0.0% 5.086 5.345 6.289 23.7% 0.4% 8.155 8.907 10.04 23.1% 0.4%
Sierra Leone 0.065 0.145 0.453 596.9% 4.0% 9.34 12.25 14 49.9% 0.8% 14.81 14.74 15.79 6.6% 0.1%
Liberia 0.043 0.053 0.132 207.0% 2.3% 7.218 8.414 11.72 62.4% 1.0% 9.985 10.25 11.19 12.1% 0.2%
Mauritania 0.143 0.178 0.336 135.0% 1.7% 5.063 5.491 6.477 27.9% 0.5% 4.283 5.825 8.099 89.1% 1.3%
Guinea-Bissau 0.053 0.065 0.126 137.7% 1.7% 8.2 9.257 11.83 44.3% 0.7% 9.023 9.45 10.37 14.9% 0.3%
Gambia 0.098 0.136 0.291 196.9% 2.2% 8.129 9.139 11.05 35.9% 0.6% 5.254 6.551 8.488 61.6% 1.0%
Cape Verde 0.22 0.552 1.925 775.0% 4.4% 14 14 14 0.0% 0.0% 11.81 13.1 15.13 28.1% 0.5%
Africa-Western 0.106 0.201 0.384 262.3% 2.6% 8.555 9.945 10.9 27.4% 0.5% 13.91 14.28 15.02 8.0% 0.2%
VOL2_15 Forecast Tables rev.indd 304 21/08/2009 09:23

305Forecast Tables
Patterns of Potential Human Progress Multination Regional Analysis Measures of Poverty, Health, Education, Infrastructure, and Governance
Base Case: Countries in Year 2060
Descending Population Sequence
Infrastructure GovernanceR&D Expenditures Freedom House Index (Inverted) Polity Democracy Index
Percent of GDP Index Range: 2-14 Index Range: 1-20
2010 2035 2060 % Chg % An Chg 2010 2035 2060 % Chg % An Chg 2010 2035 2060 % Chg % An Chg
AMERICASHaiti 0.107 0.151 0.296 176.6% 2.1% 3.042 3.391 4.022 32.2% 0.6% 8.078 8.834 10.33 27.9% 0.5%
Dominican Republic 0.451 1.086 2.406 433.5% 3.4% 12.39 14 14 13.0% 0.2% 17.97 18.68 19.87 10.6% 0.2%
Cuba 0.671 1.055 3.097 361.5% 3.1% 2.032 2.311 2.78 36.8% 0.6% 3.519 6.128 9.438 168.2% 2.0%
Puerto Rico 1.607 3.194 3.196 98.9% 1.4% 4.374 4.917 5.456 24.7% 0.4% 17.08 17.73 18.05 5.7% 0.1%
Jamaica 0.084 0.267 0.837 896.4% 4.7% 11.08 11.83 13.12 18.4% 0.3% 19 19.3 19.7 3.7% 0.1%
Trinidad and Tobago 0.352 1.738 2.349 567.3% 3.9% 10.28 11.53 12.24 19.1% 0.3% 20 20 20 0.0% 0.0%
Bahamas 1.432 2.055 3.186 122.5% 1.6% 14 14 14 0.0% 0.0% 16.89 17.91 18.05 6.9% 0.1%
Barbados 1.05 1.706 3.19 203.8% 2.2% 14 14 14 0.0% 0.0% 16.08 17.14 17.46 8.6% 0.2%
St. Vincent & the Grenadines 0.187 0.526 1.738 829.4% 4.6% 13.2 14 14 6.1% 0.1% 14.36 15.64 17.25 20.1% 0.4%
Grenada 0.693 0.935 2.112 204.8% 2.3% 13.12 14 14 6.7% 0.1% 15.04 16.13 17.72 17.8% 0.3%
St. Lucia 0.43 0.871 2.089 385.8% 3.2% 13.22 14 14 5.9% 0.1% 15.16 16.32 17.66 16.5% 0.3%
America-Caribbean 0.987 1.954 2.767 180.3% 2.1% 6.24 6.987 7.452 19.4% 0.4% 11.46 12.74 14.3 24.8% 0.4%
Guatemala 0.18 0.406 1.029 471.7% 3.5% 8.116 9.044 10.33 27.3% 0.5% 18.03 18.53 19.28 6.9% 0.1%
Honduras 0.069 0.254 0.771 1017.4% 4.9% 10.21 11.57 13.33 30.6% 0.5% 17.12 17.77 18.5 8.1% 0.2%
El Salvador 0.118 0.513 1.568 1228.8% 5.3% 11.19 12.72 14 25.1% 0.4% 16.98 17.69 18.91 11.4% 0.2%
Nicaragua 0.061 0.203 0.585 859.0% 4.6% 10.18 11.51 13.27 30.4% 0.5% 17.95 18.27 18.76 4.5% 0.1%
Costa Rica 0.484 1.599 2.978 515.3% 3.7% 14 14 14 0.0% 0.0% 19.98 20 20 0.1% 0.0%
Panama 0.428 1.369 2.954 590.2% 3.9% 13.3 14 14 5.3% 0.1% 19.02 19.62 19.37 1.8% 0.0%
Belize 0.587 1.309 3.121 431.7% 3.4% 13.23 14 14 5.8% 0.1% 14.44 15.58 17.03 17.9% 0.3%
America-Central 0.278 0.955 2.017 625.5% 4.0% 10.36 11.17 12.25 18.2% 0.3% 17.93 18.43 19.09 6.5% 0.1%
United States of America 2.914 2.933 2.951 1.3% 0.0% 14 14 14 0.0% 0.0% 20 20 20 0.0% 0.0%
Mexico 0.468 0.981 2.021 331.8% 3.0% 12.18 13.24 14 14.9% 0.3% 18.06 18.75 19.64 8.7% 0.2%
Canada 2.119 2.684 2.718 28.3% 0.5% 14 14 14 0.0% 0.0% 20 20 20 0.0% 0.0%
America-North 2.734 2.808 2.872 5.0% 0.1% 13.56 13.82 14 3.2% 0.1% 19.53 19.7 19.92 2.0% 0.0%
Brazil 1.017 1.503 2.805 175.8% 2.0% 11.19 12.62 14 25.1% 0.4% 18.1 19.09 20 10.5% 0.2%
Colombia 0.211 0.576 1.842 773.0% 4.4% 8.168 9.177 10.64 30.3% 0.5% 17.08 17.81 18.9 10.7% 0.2%
Argentina 0.527 1.533 2.87 444.6% 3.4% 12.29 13.89 14 13.9% 0.3% 18.1 19.02 18.75 3.6% 0.1%
Venezuela, RB 0.348 0.911 1.497 330.2% 3.0% 9.152 10.15 10.84 18.4% 0.3% 16.15 17.22 18.27 13.1% 0.2%
Peru 0.165 0.633 1.444 775.2% 4.4% 11.26 12.7 14 24.3% 0.4% 19.06 19.72 20 4.9% 0.1%
Chile 0.728 2.153 2.953 305.6% 2.8% 14 14 14 0.0% 0.0% 19.12 20 19.37 1.3% 0.0%
Ecuador 0.09 0.253 0.434 382.2% 3.2% 10.1 10.72 11.25 11.4% 0.2% 16.11 16.74 17.32 7.5% 0.1%
Bolivia 0.311 0.685 1.414 354.7% 3.1% 10.27 12.19 13.87 35.1% 0.6% 18.07 18.94 19.85 9.9% 0.2%
Paraguay 0.112 0.251 0.713 536.6% 3.8% 10.16 11.17 12.76 25.6% 0.5% 18.09 18.65 19.22 6.2% 0.1%
Uruguay 0.351 1.182 2.837 708.3% 4.3% 14 14 14 0.0% 0.0% 20 20 20 0.0% 0.0%
Guyana 0.253 0.506 1.33 425.7% 3.4% 12.25 14 14 14.3% 0.3% 16.01 16.58 17.79 11.1% 0.2%
Suriname 0.587 1.025 1.898 223.3% 2.4% 13.24 14 14 5.7% 0.1% 14.39 15.35 16.89 17.4% 0.3%
America-South 0.708 1.383 2.55 260.2% 2.6% 10.86 12.1 13.2 21.5% 0.4% 17.89 18.77 19.45 8.7% 0.2%
VOL2_15 Forecast Tables rev.indd 305 21/08/2009 09:24

Patterns of Potential Hum
an Progress Volume 2: Enhancing Global Education
306
Patterns of Potential Human Progress Multination Regional Analysis Measures of Poverty, Health, Education, Infrastructure, and Governance
Base Case: Countries in Year 2060
Descending Population Sequence
Infrastructure GovernanceR&D Expenditures Freedom House Index (Inverted) Polity Democracy Index
Percent of GDP Index Range: 2-14 Index Range: 1-20
2010 2035 2060 % Chg % An Chg 2010 2035 2060 % Chg % An Chg 2010 2035 2060 % Chg % An Chg
ASIA WITH OCEANIAChina 1.509 2.528 4.162 175.8% 2.0% 3.15 3.961 4.624 46.8% 0.8% 3.483 6.239 9.404 170.0% 2.0%
Japan 3.236 4.108 4.046 25.0% 0.4% 13.12 14 14 6.7% 0.1% 20 20 20 0.0% 0.0%
Korea, Rep. of 2.877 4.235 4.164 44.7% 0.7% 13.28 14 14 5.4% 0.1% 18.11 18.41 18.75 3.5% 0.1%
Taiwan 1.373 2.725 3.19 132.3% 1.7% 13.2 14 14 6.1% 0.1% 20 20 20 0.0% 0.0%
Korea, Dem. Rep. of 0.247 0.348 0.524 112.1% 1.5% 2.047 2.235 2.451 19.7% 0.4% 1.48 3.763 6.533 341.4% 3.0%
Hong Kong 1.03 1.415 1.534 48.9% 0.8% 3.266 3.43 3.573 9.4% 0.2% 18.39 18.68 18.96 3.1% 0.1%
Mongolia 0.305 0.482 1.157 279.3% 2.7% 12.43 14 14 12.6% 0.2% 20 20 20 0.0% 0.0%
Asia-East 2.543 2.998 4.107 61.5% 1.0% 4.429 5.085 5.491 24.0% 0.4% 5.601 7.798 10.4 85.7% 1.2%
India 0.869 1.245 2.431 179.7% 2.1% 11.49 14 14 21.8% 0.4% 18.91 19.35 20 5.8% 0.1%
Pakistan 0.239 0.345 0.621 159.8% 1.9% 5.11 5.703 6.586 28.9% 0.5% 5.27 6.801 9.106 72.8% 1.1%
Bangladesh 0.628 0.741 1.046 66.6% 1.0% 8.392 10.59 12.71 51.5% 0.8% 15.89 16.08 16.87 6.2% 0.1%
Afghanistan 0.071 0.083 0.134 88.7% 1.3% 4.981 5.34 6.349 27.5% 0.5% 3.23 4.41 6.249 93.5% 1.3%
Iran, Islamic Rep. of 0.726 1.536 1.893 160.7% 1.9% 4.08 4.686 4.921 20.6% 0.4% 4.53 7.19 10.1 123.0% 1.6%
Nepal 0.661 0.687 0.848 28.3% 0.5% 6.121 7.205 8.856 44.7% 0.7% 4.226 5.638 7.981 88.9% 1.3%
Uzbekistan 0.181 0.31 0.52 187.3% 2.1% 3.104 3.576 4.007 29.1% 0.5% 1.448 3.722 6.542 351.8% 3.1%
Sri Lanka 0.181 0.558 1.516 737.6% 4.3% 10.3 12.2 14 35.9% 0.6% 15.12 16.24 17.87 18.2% 0.3%
Kazakhstan 0.407 1.899 2.075 409.8% 3.3% 5.227 6.166 6.327 21.0% 0.4% 4.567 7.478 10.09 120.9% 1.6%
Tajikistan 0.138 0.228 0.529 283.3% 2.7% 5.156 5.833 6.836 32.6% 0.6% 7.299 8.88 11.1 52.1% 0.8%
Turkmenistan 0.251 0.939 0.789 214.3% 2.3% 2.033 2.606 2.599 27.8% 0.5% 1.474 4.155 6.871 366.1% 3.1%
Kyrgyzstan 0.205 0.266 0.421 105.4% 1.4% 5.108 5.738 6.531 27.9% 0.5% 7.282 8.717 10.48 43.9% 0.7%
Bhutan 0.323 0.769 2.087 546.1% 3.8% 5.155 6.104 7.258 40.8% 0.7% 2.461 4.952 8.548 247.3% 2.5%
Maldives 0.355 1.165 3.185 797.2% 4.5% 5.168 6.422 7.879 52.5% 0.8% 12.86 14.18 15.85 23.3% 0.4%
Asia-South Central 0.736 1.208 2.264 207.6% 2.3% 9.739 11.51 11.68 19.9% 0.4% 15.47 15.71 16.43 6.2% 0.1%
Indonesia 0.083 0.314 0.786 847.0% 4.6% 9.246 10.61 12.01 29.9% 0.5% 18.03 18.53 19.1 5.9% 0.1%
Philippines 0.135 0.384 0.995 637.0% 4.1% 11.23 12.89 14 24.7% 0.4% 17.94 18.18 18.84 5.0% 0.1%
Vietnam 0.226 0.594 1.428 531.9% 3.8% 3.154 3.992 4.69 48.7% 0.8% 3.421 5.826 9.006 163.3% 2.0%
Thailand 0.314 0.837 1.896 503.8% 3.7% 11.21 12.69 14 24.9% 0.4% 19 19.61 20 5.3% 0.1%
Myanmar 0.093 0.199 0.432 364.5% 3.1% 2.168 2.722 3.249 49.9% 0.8% 2.355 4.369 7.128 202.7% 2.2%
Malaysia 0.797 1.766 3.061 284.1% 2.7% 8.176 9.236 10.1 23.5% 0.4% 13.26 14.83 16.01 20.7% 0.4%
Cambodia 0.142 0.427 1.038 631.0% 4.1% 5.228 6.76 8.012 53.3% 0.9% 12 12.88 14.5 20.8% 0.4%
Lao PDR 0.165 0.543 1.937 1073.9% 5.0% 3.1 4.05 5.023 62.0% 1.0% 3.372 5.661 9.061 168.7% 2.0%
Singapore 2.513 2.556 2.599 3.4% 0.1% 7.119 7.57 7.828 10.0% 0.2% 8.496 10.51 12.48 46.9% 0.8%
Timor-Leste 0.175 0.288 0.827 372.6% 3.2% 10.03 11.41 14 39.6% 0.7% 15.97 16.18 17.23 7.9% 0.2%
Brunei Darussalam 0.073 0.271 0.468 541.1% 3.8% 5.017 5.241 5.38 7.2% 0.1% 19.08 19.24 19.4 1.7% 0.0%
Asia-South East 0.587 0.903 1.576 168.5% 2.0% 7.991 9.305 10.44 30.6% 0.5% 13.91 14.94 16.19 16.4% 0.3%
VOL2_15 Forecast Tables rev.indd 306 21/08/2009 09:24

307Forecast Tables
Patterns of Potential Human Progress Multination Regional Analysis Measures of Poverty, Health, Education, Infrastructure, and Governance
Base Case: Countries in Year 2060
Descending Population Sequence
Infrastructure GovernanceR&D Expenditures Freedom House Index (Inverted) Polity Democracy Index
Percent of GDP Index Range: 2-14 Index Range: 1-20
2010 2035 2060 % Chg % An Chg 2010 2035 2060 % Chg % An Chg 2010 2035 2060 % Chg % An Chg
ASIA WITH OCEANIA continuedTurkey 0.725 1.495 3.272 351.3% 3.1% 10.22 11.81 13.58 32.9% 0.6% 17.08 17.89 18.91 10.7% 0.2%
Yemen 0.175 0.356 0.695 297.1% 2.8% 6.051 7.27 8.42 39.2% 0.7% 8.232 9.821 11.99 45.7% 0.8%
Iraq 0.201 0.49 1.143 468.7% 3.5% 4.065 4.986 5.849 43.9% 0.7% 1.46 3.959 7.329 402.0% 3.3%
Saudi Arabia 1.525 2.212 2.919 91.4% 1.3% 2.004 2.155 2.279 13.7% 0.3% 0.728 4.107 7.467 925.7% 4.8%
Syria 0.315 0.492 1.076 241.6% 2.5% 2.025 2.242 2.578 27.3% 0.5% 3.458 5.708 8.681 151.0% 1.9%
Israel 4.552 5.824 5.649 24.1% 0.4% 12.18 13.92 14 14.9% 0.3% 20 20 20 0.0% 0.0%
Azerbaijan 0.405 0.885 1.213 199.5% 2.2% 5.276 6.129 6.561 24.4% 0.4% 3.501 6.11 9.093 159.7% 1.9%
Jordan 0.297 0.868 3.131 954.2% 4.8% 7.194 8.675 10.48 45.7% 0.8% 8.394 10.6 12.67 50.9% 0.8%
Palestine 0.277 0.512 1.266 357.0% 3.1% 7.653 8.908 10.47 36.8% 0.6% 12.79 14.25 16.03 25.3% 0.5%
United Arab Emirates 2.424 3.189 3.186 31.4% 0.5% 4.024 4.293 4.557 13.2% 0.2% 2.718 5.72 8.72 220.8% 2.4%
Oman 1.477 2.045 2.672 80.9% 1.2% 5.017 5.336 5.609 11.8% 0.2% 2.648 5.674 8.767 231.1% 2.4%
Kuwait 0.323 0.527 0.707 118.9% 1.6% 7.036 7.642 7.634 8.5% 0.2% 3.643 6.541 9.408 158.2% 1.9%
Lebanon 0.709 1.283 2.487 250.8% 2.5% 5.043 5.643 6.274 24.4% 0.4% 15.17 16.37 17.62 16.2% 0.3%
Georgia 0.335 0.57 1.011 201.8% 2.2% 9.332 10.55 11.77 26.1% 0.5% 17.01 17.41 18.02 5.9% 0.1%
Armenia 0.317 1.101 2.146 577.0% 3.9% 7.289 8.992 9.988 37.0% 0.6% 15.14 16.31 17.62 16.4% 0.3%
Bahrain 2.498 3.055 3.188 27.6% 0.5% 6.053 6.298 6.599 9.0% 0.2% 3.677 6.522 9.347 154.2% 1.9%
Qatar 0.087 0.284 0.481 452.9% 3.5% 5.065 5.491 5.356 5.7% 0.1% 0.8 4.133 7.467 833.4% 4.6%
Cyprus 0.504 1.655 2.007 298.2% 2.8% 14 14 14 0.0% 0.0% 20 20 20 0.0% 0.0%
Asia-West 1.602 2.212 3.07 91.6% 1.3% 6.621 7.255 8.007 20.9% 0.4% 9.418 10.43 12.31 30.7% 0.5%
Australia 1.873 2.533 2.578 37.6% 0.6% 14 14 14 0.0% 0.0% 20 20 20 0.0% 0.0%
Papua New Guniea 0.145 0.304 0.477 229.0% 2.4% 10.09 12.16 13.57 34.5% 0.6% 19.8 19.46 19.52 -1.4% 0.0%
New Zealand 1.276 2.391 2.69 110.8% 1.5% 14 14 14 0.0% 0.0% 20 20 20 0.0% 0.0%
Solomon Islands 0.149 0.211 0.359 140.9% 1.8% 10.18 11.21 12.72 25.0% 0.4% 17.81 17.35 17.42 -2.2% 0.0%
Fiji 0.337 0.546 1.456 332.0% 3.0% 9.128 10.17 12.04 31.9% 0.6% 16.05 16.64 17.89 11.5% 0.2%
Vanuatu 0.28 0.419 0.917 227.5% 2.4% 12.18 13.46 14 14.9% 0.3% 12.57 13.52 15.17 20.7% 0.4%
Micronesia 0.418 0.572 1.33 218.2% 2.3% 14 14 14 0.0% 0.0% 13.75 14.56 16.06 16.8% 0.3%
Tonga 0.385 0.512 1.16 201.3% 2.2% 8.021 8.552 9.899 23.4% 0.4% 13.53 14.19 15.64 15.6% 0.3%
Samoa 0.388 0.643 1.656 326.8% 2.9% 12.19 13.59 14 14.8% 0.3% 13.47 14.48 16.23 20.5% 0.4%
Oceania 1.785 2.476 2.549 42.8% 0.7% 13.03 13.4 13.8 5.9% 0.1% 19.69 19.61 19.67 -0.1% 0.0%
VOL2_15 Forecast Tables rev.indd 307 21/08/2009 09:24

Patterns of Potential Hum
an Progress Volume 2: Enhancing Global Education
308
Patterns of Potential Human Progress Multination Regional Analysis Measures of Poverty, Health, Education, Infrastructure, and Governance
Base Case: Countries in Year 2060
Descending Population Sequence
Infrastructure GovernanceR&D Expenditures Freedom House Index (Inverted) Polity Democracy Index
Percent of GDP Index Range: 2-14 Index Range: 1-20
2010 2035 2060 % Chg % An Chg 2010 2035 2060 % Chg % An Chg 2010 2035 2060 % Chg % An Chg
EUROPERussian Federation 1.333 2.706 3.131 134.9% 1.7% 5.151 5.901 6.114 18.7% 0.3% 17.13 18.11 18.71 9.2% 0.2%
Ukraine 1.223 1.85 3.098 153.3% 1.9% 9.307 10.9 12.28 31.9% 0.6% 16.09 16.99 18.27 13.5% 0.3%
Poland 0.731 1.839 2.855 290.6% 2.8% 14 14 14 0.0% 0.0% 20 20 20 0.0% 0.0%
Romania 0.492 1.082 1.95 296.3% 2.8% 11.26 12.52 13.61 20.9% 0.4% 19.12 20 19.89 4.0% 0.1%
Czech Republic 1.395 2.013 3.047 118.4% 1.6% 14 14 14 0.0% 0.0% 20 20 20 0.0% 0.0%
Belarus 0.733 1.491 2.623 257.8% 2.6% 3.092 3.499 3.827 23.8% 0.4% 3.544 6.256 9.493 167.9% 2.0%
Hungary 0.986 1.774 2.9 194.1% 2.2% 14 14 14 0.0% 0.0% 20 20 20 0.0% 0.0%
Bulgaria 0.596 1.185 2.555 328.7% 3.0% 13.29 14 14 5.3% 0.1% 19.08 19.83 19.6 2.7% 0.1%
Slovakia 0.662 1.185 2.145 224.0% 2.4% 14 14 14 0.0% 0.0% 19.2 20 19.66 2.4% 0.0%
Moldova, Rep. of 0.819 0.929 1.525 86.2% 1.3% 9.263 10.6 12.71 37.2% 0.6% 18.01 18.46 19.4 7.7% 0.1%
Europe-East 1.071 2.263 2.934 173.9% 2.0% 8.372 9.089 9.492 13.4% 0.3% 17.34 18.16 18.73 8.0% 0.2%
United Kingdom 2.056 2.884 2.905 41.3% 0.7% 14 14 14 0.0% 0.0% 20 20 20 0.0% 0.0%
Sweden 4.004 4.545 4.453 11.2% 0.2% 14 14 14 0.0% 0.0% 20 20 20 0.0% 0.0%
Denmark 2.806 3.419 3.404 21.3% 0.4% 14 14 14 0.0% 0.0% 20 20 20 0.0% 0.0%
Ireland 1.738 1.83 1.922 10.6% 0.2% 14 14 14 0.0% 0.0% 20 20 20 0.0% 0.0%
Norway 1.769 1.86 1.951 10.3% 0.2% 14 14 14 0.0% 0.0% 20 20 20 0.0% 0.0%
Finland 3.729 4.388 4.307 15.5% 0.3% 14 14 14 0.0% 0.0% 20 20 20 0.0% 0.0%
Lithuania 0.908 1.712 2.974 227.5% 2.4% 12.3 13.55 14 13.8% 0.3% 20 20 20 0.0% 0.0%
Latvia 0.589 1.788 2.734 364.2% 3.1% 13.39 14 14 4.6% 0.1% 18.23 19.01 18.75 2.9% 0.1%
Estonia 1.155 2.328 2.96 156.3% 1.9% 14 14 14 0.0% 0.0% 16.26 17.31 17.49 7.6% 0.1%
Iceland 3.327 3.651 3.621 8.8% 0.2% 14 14 14 0.0% 0.0% 20 20 20 0.0% 0.0%
Europe-North 2.355 3.027 3.071 30.4% 0.5% 13.93 13.99 14 0.5% 0.0% 19.91 19.95 19.96 0.3% 0.0%
Italy 1.152 1.726 2.475 114.8% 1.5% 14 14 14 0.0% 0.0% 20 20 20 0.0% 0.0%
Spain 1.179 2.129 2.479 110.3% 1.5% 14 14 14 0.0% 0.0% 20 20 20 0.0% 0.0%
Greece 0.721 1.546 1.902 163.8% 2.0% 13.14 13.89 14 6.5% 0.1% 20 20 20 0.0% 0.0%
Portugal 0.792 1.387 2.636 232.8% 2.4% 14 14 14 0.0% 0.0% 20 20 20 0.0% 0.0%
Serbia 1.236 1.624 2.713 119.5% 1.6% 11.24 12.39 13.87 23.4% 0.4% 16.15 17.27 18.31 13.4% 0.3%
Croatia 1.228 1.791 3.357 173.4% 2.0% 12.22 13.44 14 14.6% 0.3% 17.17 18.43 18.81 9.6% 0.2%
Bosnia and Herzegovina 0.465 0.647 1.294 178.3% 2.1% 9.124 9.857 11.17 22.4% 0.4% 13.92 14.87 16.36 17.5% 0.3%
Albania 0.46 1.016 2.072 350.4% 3.1% 10.29 11.98 13.49 31.1% 0.5% 17.08 17.92 19.08 11.7% 0.2%
Macedonia, TFYR 0.283 0.385 0.93 228.6% 2.4% 10.13 10.74 12.04 18.9% 0.3% 19.11 19.91 20 4.7% 0.1%
Slovenia 1.76 2.731 3.198 81.7% 1.2% 14 14 14 0.0% 0.0% 20 20 20 0.0% 0.0%
Montenegro 0.588 1.008 2.433 313.8% 2.9% 6.28 7.032 8.097 28.9% 0.5% 14.55 15.87 17.32 19.0% 0.3%
Malta 0.41 1.351 2.183 432.4% 3.4% 14 14 14 0.0% 0.0% 17.08 18.09 18.08 5.9% 0.1%
Europe-South 1.106 1.842 2.463 122.7% 1.6% 13.45 13.66 13.85 3.0% 0.1% 19.45 19.61 19.74 1.5% 0.0%
Germany 2.555 3.494 3.473 35.9% 0.6% 14 14 14 0.0% 0.0% 20 20 20 0.0% 0.0%
France 2.25 3.181 3.183 41.5% 0.7% 14 14 14 0.0% 0.0% 19.18 19.57 19.37 1.0% 0.0%
Netherlands 1.991 2.639 2.676 34.4% 0.6% 14 14 14 0.0% 0.0% 20 20 20 0.0% 0.0%
Belgium 1.968 2.87 2.892 47.0% 0.8% 14 14 14 0.0% 0.0% 20 20 20 0.0% 0.0%
Austria 2.429 3.111 3.116 28.3% 0.5% 14 14 14 0.0% 0.0% 20 20 20 0.0% 0.0%
Switzerland 2.756 3.258 3.253 18.0% 0.3% 14 14 14 0.0% 0.0% 20 20 20 0.0% 0.0%
Luxembourg 1.834 1.92 2.006 9.4% 0.2% 14 14 14 0.0% 0.0% 20 20 20 0.0% 0.0%
Europe-West 2.375 3.241 3.244 36.6% 0.6% 14 14 14 0.0% 0.0% 19.73 19.85 19.77 0.2% 0.0%
VOL2_15 Forecast Tables rev.indd 308 21/08/2009 09:24
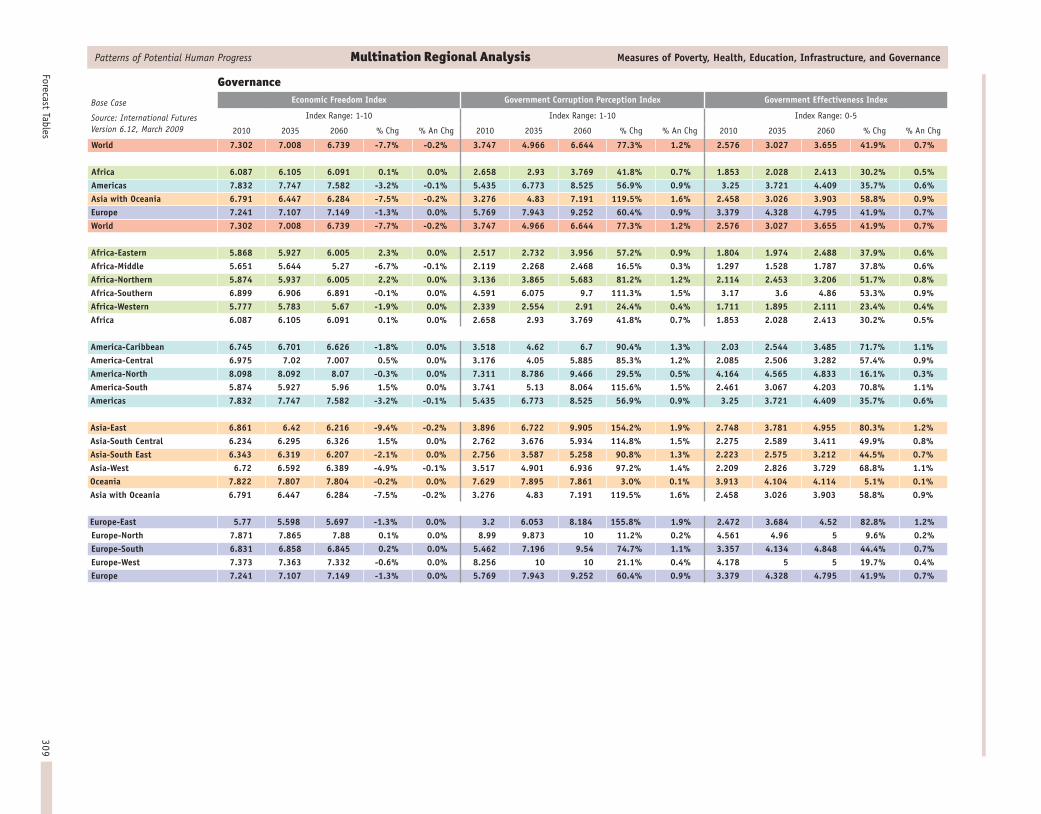
309Forecast Tables
Patterns of Potential Human Progress Multination Regional Analysis Measures of Poverty, Health, Education, Infrastructure, and Governance
Base Case
Source: International Futures Version 6.12, March 2009
GovernanceEconomic Freedom Index Government Corruption Perception Index Government Effectiveness Index
Index Range: 1-10 Index Range: 1-10 Index Range: 0-5
2010 2035 2060 % Chg % An Chg 2010 2035 2060 % Chg % An Chg 2010 2035 2060 % Chg % An Chg
World 7.302 7.008 6.739 -7.7% -0.2% 3.747 4.966 6.644 77.3% 1.2% 2.576 3.027 3.655 41.9% 0.7%
Africa 6.087 6.105 6.091 0.1% 0.0% 2.658 2.93 3.769 41.8% 0.7% 1.853 2.028 2.413 30.2% 0.5%Americas 7.832 7.747 7.582 -3.2% -0.1% 5.435 6.773 8.525 56.9% 0.9% 3.25 3.721 4.409 35.7% 0.6%Asia with Oceania 6.791 6.447 6.284 -7.5% -0.2% 3.276 4.83 7.191 119.5% 1.6% 2.458 3.026 3.903 58.8% 0.9%Europe 7.241 7.107 7.149 -1.3% 0.0% 5.769 7.943 9.252 60.4% 0.9% 3.379 4.328 4.795 41.9% 0.7%World 7.302 7.008 6.739 -7.7% -0.2% 3.747 4.966 6.644 77.3% 1.2% 2.576 3.027 3.655 41.9% 0.7%
Africa-Eastern 5.868 5.927 6.005 2.3% 0.0% 2.517 2.732 3.956 57.2% 0.9% 1.804 1.974 2.488 37.9% 0.6%Africa-Middle 5.651 5.644 5.27 -6.7% -0.1% 2.119 2.268 2.468 16.5% 0.3% 1.297 1.528 1.787 37.8% 0.6%Africa-Northern 5.874 5.937 6.005 2.2% 0.0% 3.136 3.865 5.683 81.2% 1.2% 2.114 2.453 3.206 51.7% 0.8%Africa-Southern 6.899 6.906 6.891 -0.1% 0.0% 4.591 6.075 9.7 111.3% 1.5% 3.17 3.6 4.86 53.3% 0.9%Africa-Western 5.777 5.783 5.67 -1.9% 0.0% 2.339 2.554 2.91 24.4% 0.4% 1.711 1.895 2.111 23.4% 0.4%Africa 6.087 6.105 6.091 0.1% 0.0% 2.658 2.93 3.769 41.8% 0.7% 1.853 2.028 2.413 30.2% 0.5%
America-Caribbean 6.745 6.701 6.626 -1.8% 0.0% 3.518 4.62 6.7 90.4% 1.3% 2.03 2.544 3.485 71.7% 1.1%America-Central 6.975 7.02 7.007 0.5% 0.0% 3.176 4.05 5.885 85.3% 1.2% 2.085 2.506 3.282 57.4% 0.9%America-North 8.098 8.092 8.07 -0.3% 0.0% 7.311 8.786 9.466 29.5% 0.5% 4.164 4.565 4.833 16.1% 0.3%America-South 5.874 5.927 5.96 1.5% 0.0% 3.741 5.13 8.064 115.6% 1.5% 2.461 3.067 4.203 70.8% 1.1%Americas 7.832 7.747 7.582 -3.2% -0.1% 5.435 6.773 8.525 56.9% 0.9% 3.25 3.721 4.409 35.7% 0.6%
Asia-East 6.861 6.42 6.216 -9.4% -0.2% 3.896 6.722 9.905 154.2% 1.9% 2.748 3.781 4.955 80.3% 1.2%Asia-South Central 6.234 6.295 6.326 1.5% 0.0% 2.762 3.676 5.934 114.8% 1.5% 2.275 2.589 3.411 49.9% 0.8%Asia-South East 6.343 6.319 6.207 -2.1% 0.0% 2.756 3.587 5.258 90.8% 1.3% 2.223 2.575 3.212 44.5% 0.7%Asia-West 6.72 6.592 6.389 -4.9% -0.1% 3.517 4.901 6.936 97.2% 1.4% 2.209 2.826 3.729 68.8% 1.1%Oceania 7.822 7.807 7.804 -0.2% 0.0% 7.629 7.895 7.861 3.0% 0.1% 3.913 4.104 4.114 5.1% 0.1%Asia with Oceania 6.791 6.447 6.284 -7.5% -0.2% 3.276 4.83 7.191 119.5% 1.6% 2.458 3.026 3.903 58.8% 0.9%
Europe-East 5.77 5.598 5.697 -1.3% 0.0% 3.2 6.053 8.184 155.8% 1.9% 2.472 3.684 4.52 82.8% 1.2%Europe-North 7.871 7.865 7.88 0.1% 0.0% 8.99 9.873 10 11.2% 0.2% 4.561 4.96 5 9.6% 0.2%Europe-South 6.831 6.858 6.845 0.2% 0.0% 5.462 7.196 9.54 74.7% 1.1% 3.357 4.134 4.848 44.4% 0.7%Europe-West 7.373 7.363 7.332 -0.6% 0.0% 8.256 10 10 21.1% 0.4% 4.178 5 5 19.7% 0.4%Europe 7.241 7.107 7.149 -1.3% 0.0% 5.769 7.943 9.252 60.4% 0.9% 3.379 4.328 4.795 41.9% 0.7%
VOL2_15 Forecast Tables rev.indd 309 21/08/2009 09:24

Patterns of Potential Hum
an Progress Volume 2: Enhancing Global Education
310
Patterns of Potential Human Progress Multination Regional Analysis Measures of Poverty, Health, Education, Infrastructure, and Governance
Base Case: Countries in Year 2060
Descending Population Sequence
GovernanceEconomic Freedom Index Government Corruption Perception Index Government Effectiveness Index
Index Range: 1-10 Index Range: 1-10 Index Range: 0-5
2010 2035 2060 % Chg % An Chg 2010 2035 2060 % Chg % An Chg 2010 2035 2060 % Chg % An Chg
AFRICAEthiopia 5.014 5.014 5.014 0.0% 0.0% 2.212 2.261 2.696 21.9% 0.4% 1.642 1.778 2.043 24.4% 0.4%
Uganda 6.5 6.5 6.5 0.0% 0.0% 2.511 2.895 5.123 104.0% 1.4% 2.055 2.227 3.068 49.3% 0.8%
Tanzania, United Rep. of 6.3 6.3 6.3 0.0% 0.0% 2.915 3.242 5.62 92.8% 1.3% 2.124 2.266 3.138 47.7% 0.8%
Kenya 6.5 6.5 6.5 0.0% 0.0% 2.118 2.399 3.764 77.7% 1.2% 1.807 2.003 2.59 43.3% 0.7%
Madagascar 5.9 5.9 5.9 0.0% 0.0% 2.806 2.89 3.323 18.4% 0.3% 2.099 2.118 2.239 6.7% 0.1%
Mozambique 5.5 5.5 5.5 0.0% 0.0% 2.827 3.329 6.913 144.5% 1.8% 2.092 2.335 3.679 75.9% 1.1%
Malawi 5.5 5.5 5.5 0.0% 0.0% 2.805 2.871 3.269 16.5% 0.3% 1.707 1.828 2.032 19.0% 0.3%
Zambia 6.7 6.7 6.7 0.0% 0.0% 2.618 2.844 3.829 46.3% 0.8% 1.705 1.873 2.339 37.2% 0.6%
Burundi 4.5 4.5 4.5 0.0% 0.0% 2.305 2.373 2.894 25.6% 0.5% 1.21 1.461 1.875 55.0% 0.9%
Rwanda 5.1 5.1 5.1 0.0% 0.0% 3.109 3.248 3.857 24.1% 0.4% 1.904 1.986 2.237 17.5% 0.3%
Somalia 4.046 4.046 4.046 0.0% 0.0% 2.101 2.117 2.154 2.5% 0.0% 0.713 1.119 1.389 94.8% 1.3%
Zimbabwe 3.3 3.3 3.3 0.0% 0.0% 2.609 3.027 3.986 52.8% 0.9% 1.433 1.78 2.306 60.9% 1.0%
Eritrea 5.118 5.118 5.118 0.0% 0.0% 2.596 2.597 2.662 2.5% 0.1% 1.558 1.669 1.795 15.2% 0.3%
Mauritius 7 7 7 0.0% 0.0% 4.338 6.279 10 130.5% 1.7% 3.219 3.836 5 55.3% 0.9%
Comoros 5.41 5.41 5.41 0.0% 0.0% 2.387 2.517 3.248 36.1% 0.6% 1.011 1.309 1.869 84.9% 1.2%
Djibouti 5.705 5.705 5.705 0.0% 0.0% 2.54 2.754 3.442 35.5% 0.6% 1.762 1.913 2.279 29.3% 0.5%
Africa-Eastern 5.868 5.927 6.005 2.3% 0.0% 2.517 2.732 3.956 57.2% 0.9% 1.804 1.974 2.488 37.9% 0.6%
Congo; Dem. Rep. of 4.3 4.3 4.3 0.0% 0.0% 2.106 2.156 2.402 14.1% 0.3% 1.086 1.32 1.635 50.6% 0.8%
Angola 6.124 6.124 6.124 0.0% 0.0% 2.137 2.601 2.565 20.0% 0.4% 1.451 1.836 2.048 41.1% 0.7%
Cameroon 5.6 5.6 5.6 0.0% 0.0% 2.223 2.432 3.021 35.9% 0.6% 1.818 1.966 2.259 24.3% 0.4%
Chad 5.4 5.4 5.4 0.0% 0.0% 1.699 1.874 1.913 12.6% 0.2% 1.533 1.717 1.852 20.8% 0.4%
Central African Republic 4.9 4.9 4.9 0.0% 0.0% 2.408 2.509 2.866 19.0% 0.3% 0.912 1.207 1.614 77.0% 1.1%
Congo, Rep. of 4.8 4.8 4.8 0.0% 0.0% 2.329 2.733 2.842 22.0% 0.4% 1.296 1.67 1.953 50.7% 0.8%
Gabon 5 5 5 0.0% 0.0% 2.843 3.417 3.784 33.1% 0.6% 1.903 2.386 2.814 47.9% 0.8%
Equatorial Guinea 7.339 7.339 7.339 0.0% 0.0% 2.164 2.526 1 -53.8% -1.5% 1.391 2.24 2.268 63.0% 1.0%
São Tomé and Príncipe 5.54 5.54 5.54 0.0% 0.0% 2.434 2.475 2.837 16.6% 0.3% 1.661 1.751 1.974 18.8% 0.3%
Africa-Middle 5.651 5.644 5.27 -6.7% -0.1% 2.119 2.268 2.468 16.5% 0.3% 1.297 1.528 1.787 37.8% 0.6%
Egypt 6.1 6.1 6.1 0.0% 0.0% 3.487 4.415 7.655 119.5% 1.6% 2.313 2.705 3.926 69.7% 1.1%
Sudan 5.659 5.659 5.659 0.0% 0.0% 2.164 2.661 3.352 54.9% 0.9% 1.364 1.775 2.233 63.7% 1.0%
Algeria 4.6 4.6 4.6 0.0% 0.0% 2.831 3.426 4.036 42.6% 0.7% 2.02 2.367 2.695 33.4% 0.6%
Morocco 6.1 6.1 6.1 0.0% 0.0% 3.26 3.75 5.133 57.5% 0.9% 2.394 2.531 3.009 25.7% 0.5%
Tunisia 6.3 6.3 6.3 0.0% 0.0% 5.055 6.652 10 97.8% 1.4% 3.059 3.539 5 63.5% 1.0%
Libyan Arab Jamahiriya 6.764 6.764 6.764 0.0% 0.0% 2.711 4.695 5.317 96.1% 1.4% 1.857 2.885 3.375 81.7% 1.2%
Africa-Northern 5.874 5.937 6.005 2.2% 0.0% 3.136 3.865 5.683 81.2% 1.2% 2.114 2.453 3.206 51.7% 0.8%
VOL2_15 Forecast Tables rev.indd 310 21/08/2009 09:25

311Forecast Tables
Patterns of Potential Human Progress Multination Regional Analysis Measures of Poverty, Health, Education, Infrastructure, and Governance
Base Case: Countries in Year 2060
Descending Population Sequence
GovernanceEconomic Freedom Index Government Corruption Perception Index Government Effectiveness Index
Index Range: 1-10 Index Range: 1-10 Index Range: 0-5
2010 2035 2060 % Chg % An Chg 2010 2035 2060 % Chg % An Chg 2010 2035 2060 % Chg % An Chg
AFRICA continuedSouth Africa 6.9 6.9 6.9 0.0% 0.0% 4.632 6.122 10 115.9% 1.6% 3.252 3.676 5 53.8% 0.9%
Namibia 6.8 6.8 6.8 0.0% 0.0% 4.387 5.52 10 127.9% 1.7% 2.665 3.016 4.817 80.8% 1.2%
Lesotho 5.5 5.5 5.5 0.0% 0.0% 3.428 3.744 5.243 52.9% 0.9% 2.265 2.35 2.867 26.6% 0.5%
Botswana 7.2 7.2 7.2 0.0% 0.0% 6.132 10 10 63.1% 1.0% 3.406 4.844 5 46.8% 0.8%
Swaziland 6.231 6.231 6.231 0.0% 0.0% 2.725 3.582 6.019 120.9% 1.6% 1.834 2.3 3.355 82.9% 1.2%
Africa-Southern 6.899 6.906 6.891 -0.1% 0.0% 4.591 6.075 9.7 111.3% 1.5% 3.17 3.6 4.86 53.3% 0.9%
Nigeria 5.9 5.9 5.9 0.0% 0.0% 1.919 2.21 2.345 22.2% 0.4% 1.59 1.848 2.009 26.4% 0.5%
Niger 5.3 5.3 5.3 0.0% 0.0% 2.403 2.47 2.887 20.1% 0.4% 1.724 1.828 2.06 19.5% 0.4%
Côte d’Ivoire 5.5 5.5 5.5 0.0% 0.0% 1.912 2.143 2.628 37.4% 0.6% 1.261 1.564 1.983 57.3% 0.9%
Ghana 6.2 6.2 6.2 0.0% 0.0% 3.519 3.598 3.911 11.1% 0.2% 2.277 2.245 2.301 1.1% 0.0%
Burkina Faso 5.373 5.373 5.373 0.0% 0.0% 3.414 3.617 4.591 34.5% 0.6% 1.895 1.995 2.418 27.6% 0.5%
Mali 5.6 5.6 5.6 0.0% 0.0% 2.908 3.05 3.716 27.8% 0.5% 2.247 2.302 2.486 10.6% 0.2%
Senegal 5.8 5.8 5.8 0.0% 0.0% 3.213 3.396 4.052 26.1% 0.5% 2.326 2.331 2.522 8.4% 0.2%
Guinea 5.398 5.398 5.398 0.0% 0.0% 1.911 2.143 2.893 51.4% 0.8% 1.516 1.741 2.164 42.7% 0.7%
Benin 5.5 5.5 5.5 0.0% 0.0% 2.915 3.039 3.686 26.4% 0.5% 2.17 2.206 2.407 10.9% 0.2%
Togo 5.1 5.1 5.1 0.0% 0.0% 2.406 2.418 2.543 5.7% 0.1% 1.222 1.432 1.666 36.3% 0.6%
Sierra Leone 5.4 5.4 5.4 0.0% 0.0% 2.414 2.626 3.451 43.0% 0.7% 1.117 1.415 1.969 76.3% 1.1%
Liberia 4.643 4.643 4.643 0.0% 0.0% 2.204 2.233 2.444 10.9% 0.2% 0.827 1.131 1.486 79.7% 1.2%
Mauritania 5.65 5.65 5.65 0.0% 0.0% 3.115 3.207 3.631 16.6% 0.3% 2.374 2.345 2.423 2.1% 0.0%
Guinea-Bissau 4.5 4.5 4.5 0.0% 0.0% 2.259 2.289 2.453 8.6% 0.2% 1.282 1.511 1.716 33.9% 0.6%
Gambia 5.383 5.383 5.383 0.0% 0.0% 2.709 2.81 3.226 19.1% 0.3% 1.875 1.953 2.124 13.3% 0.2%
Cape Verde 5.89 5.89 5.89 0.0% 0.0% 2.706 3.595 7.27 168.7% 2.0% 2.376 2.679 4.004 68.5% 1.0%
Africa-Western 5.777 5.783 5.67 -1.9% 0.0% 2.339 2.554 2.91 24.4% 0.4% 1.711 1.895 2.111 23.4% 0.4%
VOL2_15 Forecast Tables rev.indd 311 21/08/2009 09:25

Patterns of Potential Hum
an Progress Volume 2: Enhancing Global Education
312
Patterns of Potential Human Progress Multination Regional Analysis Measures of Poverty, Health, Education, Infrastructure, and Governance
Base Case: Countries in Year 2060
Descending Population Sequence
GovernanceEconomic Freedom Index Government Corruption Perception Index Government Effectiveness Index
Index Range: 1-10 Index Range: 1-10 Index Range: 0-5
2010 2035 2060 % Chg % An Chg 2010 2035 2060 % Chg % An Chg 2010 2035 2060 % Chg % An Chg
AMERICASHaiti 5.9 5.9 5.9 0.0% 0.0% 1.813 1.933 2.322 28.1% 0.5% 0.839 1.167 1.62 93.1% 1.3%
Dominican Republic 6.3 6.3 6.3 0.0% 0.0% 3.177 4.878 8.411 164.7% 2.0% 2.065 2.817 4.245 105.6% 1.5%
Cuba 6.353 6.353 6.353 0.0% 0.0% 3.873 4.938 10 158.2% 1.9% 1.947 2.481 4.677 140.2% 1.8%
Puerto Rico 7.131 7.131 7.131 0.0% 0.0% 6.416 10 10 55.9% 0.9% 3.774 5 5 32.5% 0.6%
Jamaica 6.9 6.9 6.9 0.0% 0.0% 3.619 4.034 5.482 51.5% 0.8% 2.639 2.764 3.258 23.5% 0.4%
Trinidad and Tobago 6.8 6.8 6.8 0.0% 0.0% 4.369 7.918 10 128.9% 1.7% 3.255 4.62 5 53.6% 0.9%
Bahamas 6.7 6.7 6.7 0.0% 0.0% 5.951 7.616 10 68.0% 1.0% 3.661 4.232 5 36.6% 0.6%
Barbados 6.1 6.1 6.1 0.0% 0.0% 7.089 8.84 10 41.1% 0.7% 3.605 4.119 5 38.7% 0.7%
St. Vincent & the Grenadines 6.483 6.483 6.483 0.0% 0.0% 3.52 4.37 7.556 114.7% 1.5% 2.86 3.106 4.205 47.0% 0.8%
Grenada 6.663 6.663 6.663 0.0% 0.0% 3.573 4.221 7.372 106.3% 1.5% 2.731 2.971 4.143 51.7% 0.8%
St. Lucia 6.672 6.672 6.672 0.0% 0.0% 4.052 5.183 8.389 107.0% 1.5% 2.75 3.176 4.366 58.8% 0.9%
America-Caribbean 6.745 6.701 6.626 -1.8% 0.0% 3.518 4.62 6.7 90.4% 1.3% 2.03 2.544 3.485 71.7% 1.1%
Guatemala 6.5 6.5 6.5 0.0% 0.0% 2.546 3.119 4.752 86.6% 1.3% 1.722 2.127 2.898 68.3% 1.0%
Honduras 6.5 6.5 6.5 0.0% 0.0% 2.644 3.105 4.455 68.5% 1.0% 1.896 2.18 2.765 45.8% 0.8%
El Salvador 7.2 7.2 7.2 0.0% 0.0% 4.288 5.294 8.063 88.0% 1.3% 2.285 2.707 3.782 65.5% 1.0%
Nicaragua 6.3 6.3 6.3 0.0% 0.0% 2.634 2.989 3.983 51.2% 0.8% 1.861 2.091 2.537 36.3% 0.6%
Costa Rica 7.4 7.4 7.4 0.0% 0.0% 4.45 7.392 10 124.7% 1.6% 3.088 4.107 5 61.9% 1.0%
Panama 7.3 7.3 7.3 0.0% 0.0% 3.723 6.196 10 168.6% 2.0% 2.56 3.527 5 95.3% 1.3%
Belize 6.6 6.6 6.6 0.0% 0.0% 3.838 5.772 10 160.6% 1.9% 2.604 3.325 5 92.0% 1.3%
America-Central 6.975 7.02 7.007 0.5% 0.0% 3.176 4.05 5.885 85.3% 1.2% 2.085 2.506 3.282 57.4% 0.9%
United States of America 8.2 8.2 8.2 0.0% 0.0% 8.416 10 10 18.8% 0.3% 4.638 5 5 7.8% 0.2%
Mexico 6.5 6.5 6.5 0.0% 0.0% 3.672 4.97 7.683 109.2% 1.5% 2.647 3.199 4.275 61.5% 1.0%
Canada 8 8 8 0.0% 0.0% 8.884 10 10 12.6% 0.2% 4.691 5 5 6.6% 0.1%
America-North 8.098 8.092 8.07 -0.3% 0.0% 7.311 8.786 9.466 29.5% 0.5% 4.164 4.565 4.833 16.1% 0.3%
Brazil 5.9 5.9 5.9 0.0% 0.0% 3.813 5.174 8.719 128.7% 1.7% 2.628 3.173 4.508 71.5% 1.1%
Colombia 5.5 5.5 5.5 0.0% 0.0% 4.107 5.039 8.382 104.1% 1.4% 2.414 2.786 4.043 67.5% 1.0%
Argentina 5.8 5.8 5.8 0.0% 0.0% 3.099 5.728 10 222.7% 2.4% 2.403 3.53 5 108.1% 1.5%
Venezuela, RB 4.3 4.3 4.3 0.0% 0.0% 2.453 3.889 5.386 119.6% 1.6% 1.649 2.498 3.344 102.8% 1.4%
Peru 6.9 6.9 6.9 0.0% 0.0% 3.646 4.838 6.947 90.5% 1.3% 2.112 2.681 3.573 69.2% 1.1%
Chile 7.4 7.4 7.4 0.0% 0.0% 7.617 10 10 31.3% 0.5% 3.866 5 5 29.3% 0.5%
Ecuador 5.9 5.9 5.9 0.0% 0.0% 2.54 2.908 3.323 30.8% 0.5% 1.733 2.072 2.41 39.1% 0.7%
Bolivia 6.5 6.5 6.5 0.0% 0.0% 2.583 3.585 5.536 114.3% 1.5% 2.032 2.505 3.302 62.5% 1.0%
Paraguay 6.4 6.4 6.4 0.0% 0.0% 2.136 2.474 3.678 72.2% 1.1% 1.536 1.876 2.515 63.7% 1.0%
Uruguay 6.8 6.8 6.8 0.0% 0.0% 6.118 8.275 10 63.5% 1.0% 3.063 3.809 5 63.2% 1.0%
Guyana 6.4 6.4 6.4 0.0% 0.0% 2.56 3.236 5.439 112.5% 1.5% 2.389 2.604 3.391 41.9% 0.7%
Suriname 6.523 6.523 6.523 0.0% 0.0% 3.351 4.523 6.859 104.7% 1.4% 2.521 2.97 3.862 53.2% 0.9%
America-South 5.874 5.927 5.96 1.5% 0.0% 3.741 5.13 8.064 115.6% 1.5% 2.461 3.067 4.203 70.8% 1.1%
VOL2_15 Forecast Tables rev.indd 312 21/08/2009 09:25
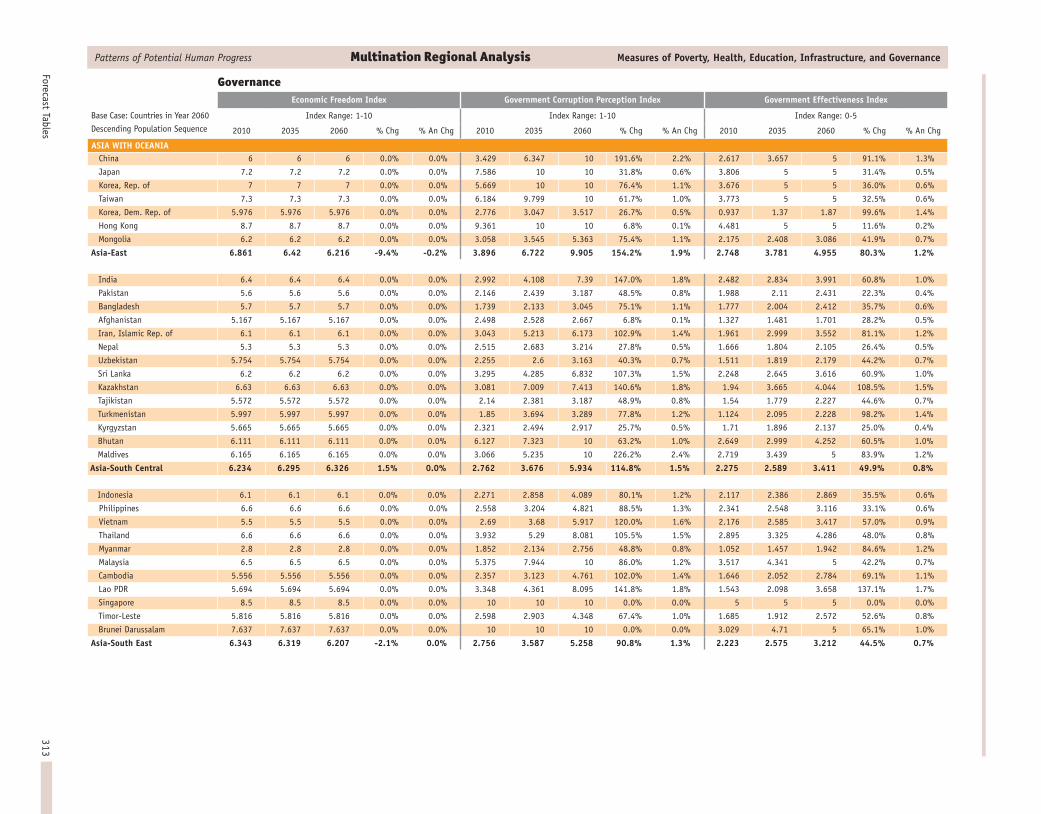
313Forecast Tables
Patterns of Potential Human Progress Multination Regional Analysis Measures of Poverty, Health, Education, Infrastructure, and Governance
Base Case: Countries in Year 2060
Descending Population Sequence
GovernanceEconomic Freedom Index Government Corruption Perception Index Government Effectiveness Index
Index Range: 1-10 Index Range: 1-10 Index Range: 0-5
2010 2035 2060 % Chg % An Chg 2010 2035 2060 % Chg % An Chg 2010 2035 2060 % Chg % An Chg
ASIA WITH OCEANIAChina 6 6 6 0.0% 0.0% 3.429 6.347 10 191.6% 2.2% 2.617 3.657 5 91.1% 1.3%
Japan 7.2 7.2 7.2 0.0% 0.0% 7.586 10 10 31.8% 0.6% 3.806 5 5 31.4% 0.5%
Korea, Rep. of 7 7 7 0.0% 0.0% 5.669 10 10 76.4% 1.1% 3.676 5 5 36.0% 0.6%
Taiwan 7.3 7.3 7.3 0.0% 0.0% 6.184 9.799 10 61.7% 1.0% 3.773 5 5 32.5% 0.6%
Korea, Dem. Rep. of 5.976 5.976 5.976 0.0% 0.0% 2.776 3.047 3.517 26.7% 0.5% 0.937 1.37 1.87 99.6% 1.4%
Hong Kong 8.7 8.7 8.7 0.0% 0.0% 9.361 10 10 6.8% 0.1% 4.481 5 5 11.6% 0.2%
Mongolia 6.2 6.2 6.2 0.0% 0.0% 3.058 3.545 5.363 75.4% 1.1% 2.175 2.408 3.086 41.9% 0.7%
Asia-East 6.861 6.42 6.216 -9.4% -0.2% 3.896 6.722 9.905 154.2% 1.9% 2.748 3.781 4.955 80.3% 1.2%
India 6.4 6.4 6.4 0.0% 0.0% 2.992 4.108 7.39 147.0% 1.8% 2.482 2.834 3.991 60.8% 1.0%
Pakistan 5.6 5.6 5.6 0.0% 0.0% 2.146 2.439 3.187 48.5% 0.8% 1.988 2.11 2.431 22.3% 0.4%
Bangladesh 5.7 5.7 5.7 0.0% 0.0% 1.739 2.133 3.045 75.1% 1.1% 1.777 2.004 2.412 35.7% 0.6%
Afghanistan 5.167 5.167 5.167 0.0% 0.0% 2.498 2.528 2.667 6.8% 0.1% 1.327 1.481 1.701 28.2% 0.5%
Iran, Islamic Rep. of 6.1 6.1 6.1 0.0% 0.0% 3.043 5.213 6.173 102.9% 1.4% 1.961 2.999 3.552 81.1% 1.2%
Nepal 5.3 5.3 5.3 0.0% 0.0% 2.515 2.683 3.214 27.8% 0.5% 1.666 1.804 2.105 26.4% 0.5%
Uzbekistan 5.754 5.754 5.754 0.0% 0.0% 2.255 2.6 3.163 40.3% 0.7% 1.511 1.819 2.179 44.2% 0.7%
Sri Lanka 6.2 6.2 6.2 0.0% 0.0% 3.295 4.285 6.832 107.3% 1.5% 2.248 2.645 3.616 60.9% 1.0%
Kazakhstan 6.63 6.63 6.63 0.0% 0.0% 3.081 7.009 7.413 140.6% 1.8% 1.94 3.665 4.044 108.5% 1.5%
Tajikistan 5.572 5.572 5.572 0.0% 0.0% 2.14 2.381 3.187 48.9% 0.8% 1.54 1.779 2.227 44.6% 0.7%
Turkmenistan 5.997 5.997 5.997 0.0% 0.0% 1.85 3.694 3.289 77.8% 1.2% 1.124 2.095 2.228 98.2% 1.4%
Kyrgyzstan 5.665 5.665 5.665 0.0% 0.0% 2.321 2.494 2.917 25.7% 0.5% 1.71 1.896 2.137 25.0% 0.4%
Bhutan 6.111 6.111 6.111 0.0% 0.0% 6.127 7.323 10 63.2% 1.0% 2.649 2.999 4.252 60.5% 1.0%
Maldives 6.165 6.165 6.165 0.0% 0.0% 3.066 5.235 10 226.2% 2.4% 2.719 3.439 5 83.9% 1.2%
Asia-South Central 6.234 6.295 6.326 1.5% 0.0% 2.762 3.676 5.934 114.8% 1.5% 2.275 2.589 3.411 49.9% 0.8%
Indonesia 6.1 6.1 6.1 0.0% 0.0% 2.271 2.858 4.089 80.1% 1.2% 2.117 2.386 2.869 35.5% 0.6%
Philippines 6.6 6.6 6.6 0.0% 0.0% 2.558 3.204 4.821 88.5% 1.3% 2.341 2.548 3.116 33.1% 0.6%
Vietnam 5.5 5.5 5.5 0.0% 0.0% 2.69 3.68 5.917 120.0% 1.6% 2.176 2.585 3.417 57.0% 0.9%
Thailand 6.6 6.6 6.6 0.0% 0.0% 3.932 5.29 8.081 105.5% 1.5% 2.895 3.325 4.286 48.0% 0.8%
Myanmar 2.8 2.8 2.8 0.0% 0.0% 1.852 2.134 2.756 48.8% 0.8% 1.052 1.457 1.942 84.6% 1.2%
Malaysia 6.5 6.5 6.5 0.0% 0.0% 5.375 7.944 10 86.0% 1.2% 3.517 4.341 5 42.2% 0.7%
Cambodia 5.556 5.556 5.556 0.0% 0.0% 2.357 3.123 4.761 102.0% 1.4% 1.646 2.052 2.784 69.1% 1.1%
Lao PDR 5.694 5.694 5.694 0.0% 0.0% 3.348 4.361 8.095 141.8% 1.8% 1.543 2.098 3.658 137.1% 1.7%
Singapore 8.5 8.5 8.5 0.0% 0.0% 10 10 10 0.0% 0.0% 5 5 5 0.0% 0.0%
Timor-Leste 5.816 5.816 5.816 0.0% 0.0% 2.598 2.903 4.348 67.4% 1.0% 1.685 1.912 2.572 52.6% 0.8%
Brunei Darussalam 7.637 7.637 7.637 0.0% 0.0% 10 10 10 0.0% 0.0% 3.029 4.71 5 65.1% 1.0%
Asia-South East 6.343 6.319 6.207 -2.1% 0.0% 2.756 3.587 5.258 90.8% 1.3% 2.223 2.575 3.212 44.5% 0.7%
VOL2_15 Forecast Tables rev.indd 313 21/08/2009 09:25
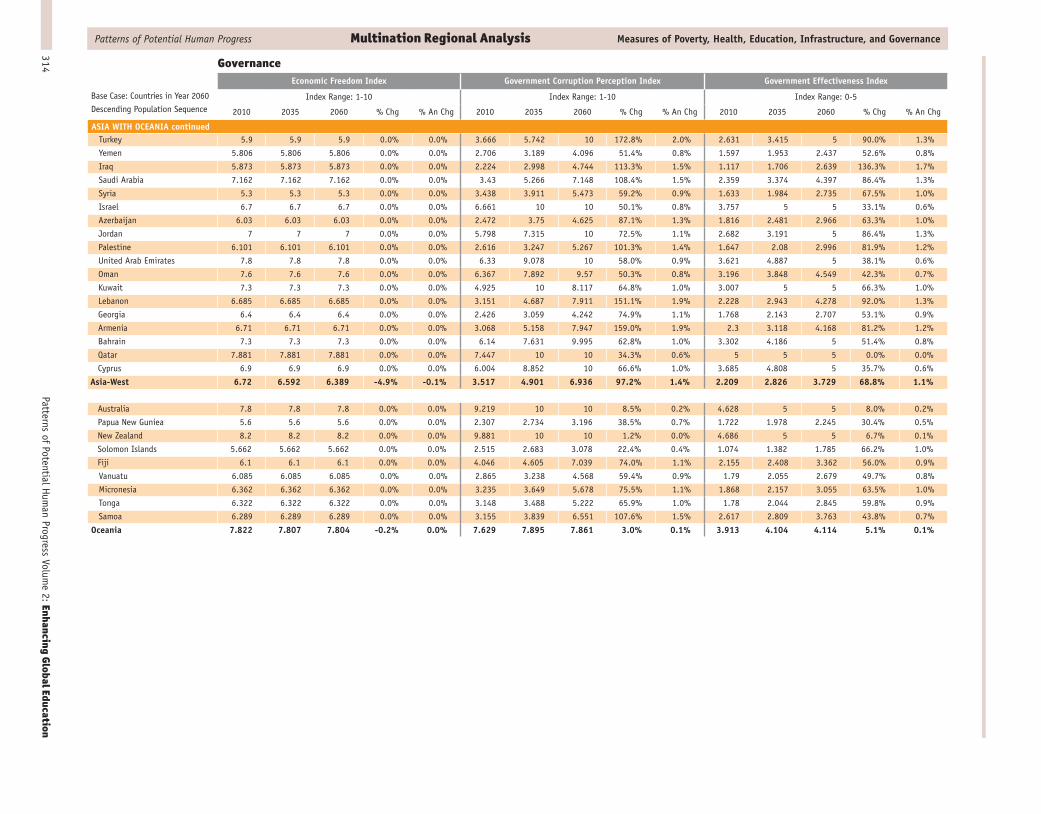
Patterns of Potential Hum
an Progress Volume 2: Enhancing Global Education
314
Patterns of Potential Human Progress Multination Regional Analysis Measures of Poverty, Health, Education, Infrastructure, and Governance
Base Case: Countries in Year 2060
Descending Population Sequence
GovernanceEconomic Freedom Index Government Corruption Perception Index Government Effectiveness Index
Index Range: 1-10 Index Range: 1-10 Index Range: 0-5
2010 2035 2060 % Chg % An Chg 2010 2035 2060 % Chg % An Chg 2010 2035 2060 % Chg % An Chg
ASIA WITH OCEANIA continuedTurkey 5.9 5.9 5.9 0.0% 0.0% 3.666 5.742 10 172.8% 2.0% 2.631 3.415 5 90.0% 1.3%
Yemen 5.806 5.806 5.806 0.0% 0.0% 2.706 3.189 4.096 51.4% 0.8% 1.597 1.953 2.437 52.6% 0.8%
Iraq 5.873 5.873 5.873 0.0% 0.0% 2.224 2.998 4.744 113.3% 1.5% 1.117 1.706 2.639 136.3% 1.7%
Saudi Arabia 7.162 7.162 7.162 0.0% 0.0% 3.43 5.266 7.148 108.4% 1.5% 2.359 3.374 4.397 86.4% 1.3%
Syria 5.3 5.3 5.3 0.0% 0.0% 3.438 3.911 5.473 59.2% 0.9% 1.633 1.984 2.735 67.5% 1.0%
Israel 6.7 6.7 6.7 0.0% 0.0% 6.661 10 10 50.1% 0.8% 3.757 5 5 33.1% 0.6%
Azerbaijan 6.03 6.03 6.03 0.0% 0.0% 2.472 3.75 4.625 87.1% 1.3% 1.816 2.481 2.966 63.3% 1.0%
Jordan 7 7 7 0.0% 0.0% 5.798 7.315 10 72.5% 1.1% 2.682 3.191 5 86.4% 1.3%
Palestine 6.101 6.101 6.101 0.0% 0.0% 2.616 3.247 5.267 101.3% 1.4% 1.647 2.08 2.996 81.9% 1.2%
United Arab Emirates 7.8 7.8 7.8 0.0% 0.0% 6.33 9.078 10 58.0% 0.9% 3.621 4.887 5 38.1% 0.6%
Oman 7.6 7.6 7.6 0.0% 0.0% 6.367 7.892 9.57 50.3% 0.8% 3.196 3.848 4.549 42.3% 0.7%
Kuwait 7.3 7.3 7.3 0.0% 0.0% 4.925 10 8.117 64.8% 1.0% 3.007 5 5 66.3% 1.0%
Lebanon 6.685 6.685 6.685 0.0% 0.0% 3.151 4.687 7.911 151.1% 1.9% 2.228 2.943 4.278 92.0% 1.3%
Georgia 6.4 6.4 6.4 0.0% 0.0% 2.426 3.059 4.242 74.9% 1.1% 1.768 2.143 2.707 53.1% 0.9%
Armenia 6.71 6.71 6.71 0.0% 0.0% 3.068 5.158 7.947 159.0% 1.9% 2.3 3.118 4.168 81.2% 1.2%
Bahrain 7.3 7.3 7.3 0.0% 0.0% 6.14 7.631 9.995 62.8% 1.0% 3.302 4.186 5 51.4% 0.8%
Qatar 7.881 7.881 7.881 0.0% 0.0% 7.447 10 10 34.3% 0.6% 5 5 5 0.0% 0.0%
Cyprus 6.9 6.9 6.9 0.0% 0.0% 6.004 8.852 10 66.6% 1.0% 3.685 4.808 5 35.7% 0.6%
Asia-West 6.72 6.592 6.389 -4.9% -0.1% 3.517 4.901 6.936 97.2% 1.4% 2.209 2.826 3.729 68.8% 1.1%
Australia 7.8 7.8 7.8 0.0% 0.0% 9.219 10 10 8.5% 0.2% 4.628 5 5 8.0% 0.2%
Papua New Guniea 5.6 5.6 5.6 0.0% 0.0% 2.307 2.734 3.196 38.5% 0.7% 1.722 1.978 2.245 30.4% 0.5%
New Zealand 8.2 8.2 8.2 0.0% 0.0% 9.881 10 10 1.2% 0.0% 4.686 5 5 6.7% 0.1%
Solomon Islands 5.662 5.662 5.662 0.0% 0.0% 2.515 2.683 3.078 22.4% 0.4% 1.074 1.382 1.785 66.2% 1.0%
Fiji 6.1 6.1 6.1 0.0% 0.0% 4.046 4.605 7.039 74.0% 1.1% 2.155 2.408 3.362 56.0% 0.9%
Vanuatu 6.085 6.085 6.085 0.0% 0.0% 2.865 3.238 4.568 59.4% 0.9% 1.79 2.055 2.679 49.7% 0.8%
Micronesia 6.362 6.362 6.362 0.0% 0.0% 3.235 3.649 5.678 75.5% 1.1% 1.868 2.157 3.055 63.5% 1.0%
Tonga 6.322 6.322 6.322 0.0% 0.0% 3.148 3.488 5.222 65.9% 1.0% 1.78 2.044 2.845 59.8% 0.9%
Samoa 6.289 6.289 6.289 0.0% 0.0% 3.155 3.839 6.551 107.6% 1.5% 2.617 2.809 3.763 43.8% 0.7%
Oceania 7.822 7.807 7.804 -0.2% 0.0% 7.629 7.895 7.861 3.0% 0.1% 3.913 4.104 4.114 5.1% 0.1%
VOL2_15 Forecast Tables rev.indd 314 21/08/2009 09:25

315Forecast Tables
Patterns of Potential Human Progress Multination Regional Analysis Measures of Poverty, Health, Education, Infrastructure, and Governance
Base Case: Countries in Year 2060
Descending Population Sequence
GovernanceEconomic Freedom Index Government Corruption Perception Index Government Effectiveness Index
Index Range: 1-10 Index Range: 1-10 Index Range: 0-5
2010 2035 2060 % Chg % An Chg 2010 2035 2060 % Chg % An Chg 2010 2035 2060 % Chg % An Chg
EUROPERussian Federation 5.1 5.1 5.1 0.0% 0.0% 2.835 6.56 7.745 173.2% 2.0% 2.336 3.921 4.534 94.1% 1.3%
Ukraine 5.5 5.5 5.5 0.0% 0.0% 2.801 4.594 8.053 187.5% 2.1% 1.976 2.787 4.212 113.2% 1.5%
Poland 6.1 6.1 6.1 0.0% 0.0% 3.787 6.681 10 164.1% 2.0% 3.24 4.312 5 54.3% 0.9%
Romania 5.7 5.7 5.7 0.0% 0.0% 3.228 4.759 7.037 118.0% 1.6% 2.495 3.159 4.091 64.0% 1.0%
Czech Republic 6.8 6.8 6.8 0.0% 0.0% 4.6 6.226 8.975 95.1% 1.3% 3.36 4.05 5 48.8% 0.8%
Belarus 6.619 6.619 6.619 0.0% 0.0% 2.898 4.927 7.955 174.5% 2.0% 1.593 2.658 4.087 156.6% 1.9%
Hungary 7.4 7.4 7.4 0.0% 0.0% 5.271 7.321 10 89.7% 1.3% 3.307 4.11 5 51.2% 0.8%
Bulgaria 6.3 6.3 6.3 0.0% 0.0% 4.222 5.769 9.408 122.8% 1.6% 2.594 3.23 4.642 79.0% 1.2%
Slovakia 6.6 6.6 6.6 0.0% 0.0% 4.629 5.928 8.394 81.3% 1.2% 3.353 3.842 4.753 41.8% 0.7%
Moldova, Rep. of 5.806 5.806 5.806 0.0% 0.0% 2.955 3.352 5.056 71.1% 1.1% 1.758 2.027 2.779 58.1% 0.9%
Europe-East 5.77 5.598 5.697 -1.3% 0.0% 3.2 6.053 8.184 155.8% 1.9% 2.472 3.684 4.52 82.8% 1.2%
United Kingdom 8.1 8.1 8.1 0.0% 0.0% 9.019 10 10 10.9% 0.2% 4.569 5 5 9.4% 0.2%
Sweden 7.3 7.3 7.3 0.0% 0.0% 9.966 10 10 0.3% 0.0% 4.767 5 5 4.9% 0.1%
Denmark 7.7 7.7 7.7 0.0% 0.0% 9.976 10 10 0.2% 0.0% 4.871 5 5 2.6% 0.1%
Ireland 7.9 7.9 7.9 0.0% 0.0% 8.846 10 10 13.0% 0.2% 4.644 5 5 7.7% 0.1%
Norway 7.3 7.3 7.3 0.0% 0.0% 9.829 10 10 1.7% 0.0% 5 5 5 0.0% 0.0%
Finland 7.6 7.6 7.6 0.0% 0.0% 10 10 10 0.0% 0.0% 4.829 5 5 3.5% 0.1%
Lithuania 6.8 6.8 6.8 0.0% 0.0% 5.186 7.295 10 92.8% 1.3% 3.357 4.117 5 48.9% 0.8%
Latvia 6.8 6.8 6.8 0.0% 0.0% 4.631 7.751 10 115.9% 1.6% 3.297 4.451 5 51.7% 0.8%
Estonia 7.8 7.8 7.8 0.0% 0.0% 7.045 10 10 41.9% 0.7% 3.68 4.797 5 35.9% 0.6%
Iceland 7.7 7.7 7.7 0.0% 0.0% 10 10 10 0.0% 0.0% 5 5 5 0.0% 0.0%
Europe-North 7.871 7.865 7.88 0.1% 0.0% 8.99 9.873 10 11.2% 0.2% 4.561 4.96 5 9.6% 0.2%
Italy 6.6 6.6 6.6 0.0% 0.0% 5.001 6.394 10 100.0% 1.4% 3.212 3.967 5 55.7% 0.9%
Spain 7.2 7.2 7.2 0.0% 0.0% 7.166 9.568 10 39.5% 0.7% 3.918 4.855 5 27.6% 0.5%
Greece 6.9 6.9 6.9 0.0% 0.0% 4.617 6.572 10 116.6% 1.6% 3.466 4.407 5 44.3% 0.7%
Portugal 7.1 7.1 7.1 0.0% 0.0% 6.511 7.994 10 53.6% 0.9% 3.547 4.09 5 41.0% 0.7%
Serbia 6.626 6.626 6.626 0.0% 0.0% 2.995 4.122 7.125 137.9% 1.7% 2.468 2.967 4.156 68.4% 1.0%
Croatia 6 6 6 0.0% 0.0% 3.633 5.17 9.555 163.0% 2.0% 2.909 3.548 5 71.9% 1.1%
Bosnia and Herzegovina 6.403 6.403 6.403 0.0% 0.0% 2.974 3.461 5.197 74.7% 1.1% 2.001 2.304 3.072 53.5% 0.9%
Albania 6.1 6.1 6.1 0.0% 0.0% 2.551 4.042 6.87 169.3% 2.0% 2.306 2.916 4.012 74.0% 1.1%
Macedonia, TFYR 5.6 5.6 5.6 0.0% 0.0% 2.753 2.98 4.392 59.5% 0.9% 2.375 2.533 3.109 30.9% 0.5%
Slovenia 6.3 6.3 6.3 0.0% 0.0% 6.502 9.098 10 53.8% 0.9% 3.617 4.661 5 38.2% 0.6%
Montenegro 6.537 6.537 6.537 0.0% 0.0% 3.689 4.813 8.635 134.1% 1.7% 2.346 2.849 4.349 85.4% 1.2%
Malta 6.7 6.7 6.7 0.0% 0.0% 6.875 9.197 10 45.5% 0.8% 3.627 4.487 5 37.9% 0.6%
Europe-South 6.831 6.858 6.845 0.2% 0.0% 5.462 7.196 9.54 74.7% 1.1% 3.357 4.134 4.848 44.4% 0.7%
Germany 7.5 7.5 7.5 0.0% 0.0% 8.388 10 10 19.2% 0.4% 4.024 5 5 24.3% 0.4%
France 6.9 6.9 6.9 0.0% 0.0% 7.742 10 10 29.2% 0.5% 4.095 5 5 22.1% 0.4%
Netherlands 7.7 7.7 7.7 0.0% 0.0% 8.96 10 10 11.6% 0.2% 4.687 5 5 6.7% 0.1%
Belgium 7.4 7.4 7.4 0.0% 0.0% 7.559 10 10 32.3% 0.6% 4.331 5 5 15.4% 0.3%
Austria 7.7 7.7 7.7 0.0% 0.0% 8.961 10 10 11.6% 0.2% 4.37 5 5 14.4% 0.3%
Switzerland 8.2 8.2 8.2 0.0% 0.0% 9.61 10 10 4.1% 0.1% 4.954 5 5 0.9% 0.0%
Luxembourg 7.8 7.8 7.8 0.0% 0.0% 9.841 10 10 1.6% 0.0% 5 5 5 0.0% 0.0%
Europe-West 7.373 7.363 7.332 -0.6% 0.0% 8.256 10 10 21.1% 0.4% 4.178 5 5 19.7% 0.4%
VOL2_15 Forecast Tables rev.indd 315 21/08/2009 09:25
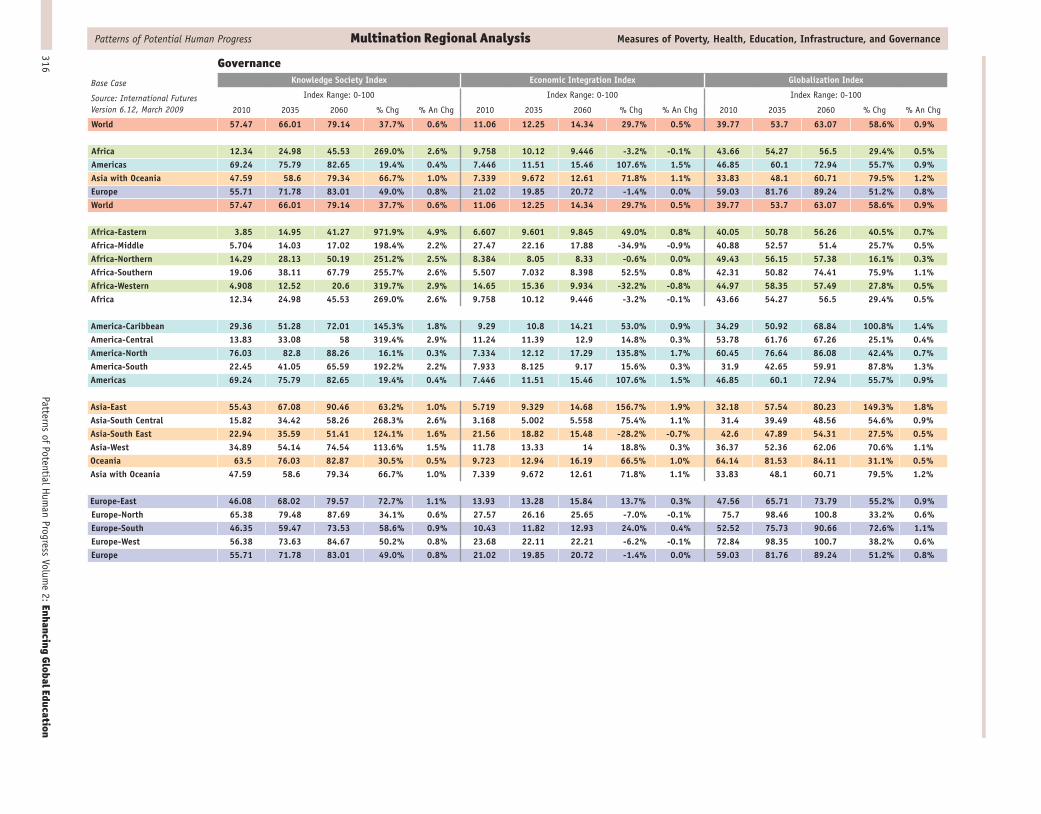
Patterns of Potential Hum
an Progress Volume 2: Enhancing Global Education
316
Patterns of Potential Human Progress Multination Regional Analysis Measures of Poverty, Health, Education, Infrastructure, and Governance
Base Case
Source: International Futures Version 6.12, March 2009
GovernanceKnowledge Society Index Economic Integration Index Globalization Index
Index Range: 0-100 Index Range: 0-100 Index Range: 0-100
2010 2035 2060 % Chg % An Chg 2010 2035 2060 % Chg % An Chg 2010 2035 2060 % Chg % An Chg
World 57.47 66.01 79.14 37.7% 0.6% 11.06 12.25 14.34 29.7% 0.5% 39.77 53.7 63.07 58.6% 0.9%
Africa 12.34 24.98 45.53 269.0% 2.6% 9.758 10.12 9.446 -3.2% -0.1% 43.66 54.27 56.5 29.4% 0.5%Americas 69.24 75.79 82.65 19.4% 0.4% 7.446 11.51 15.46 107.6% 1.5% 46.85 60.1 72.94 55.7% 0.9%Asia with Oceania 47.59 58.6 79.34 66.7% 1.0% 7.339 9.672 12.61 71.8% 1.1% 33.83 48.1 60.71 79.5% 1.2%Europe 55.71 71.78 83.01 49.0% 0.8% 21.02 19.85 20.72 -1.4% 0.0% 59.03 81.76 89.24 51.2% 0.8%World 57.47 66.01 79.14 37.7% 0.6% 11.06 12.25 14.34 29.7% 0.5% 39.77 53.7 63.07 58.6% 0.9%
Africa-Eastern 3.85 14.95 41.27 971.9% 4.9% 6.607 9.601 9.845 49.0% 0.8% 40.05 50.78 56.26 40.5% 0.7%Africa-Middle 5.704 14.03 17.02 198.4% 2.2% 27.47 22.16 17.88 -34.9% -0.9% 40.88 52.57 51.4 25.7% 0.5%Africa-Northern 14.29 28.13 50.19 251.2% 2.5% 8.384 8.05 8.33 -0.6% 0.0% 49.43 56.15 57.38 16.1% 0.3%Africa-Southern 19.06 38.11 67.79 255.7% 2.6% 5.507 7.032 8.398 52.5% 0.8% 42.31 50.82 74.41 75.9% 1.1%Africa-Western 4.908 12.52 20.6 319.7% 2.9% 14.65 15.36 9.934 -32.2% -0.8% 44.97 58.35 57.49 27.8% 0.5%Africa 12.34 24.98 45.53 269.0% 2.6% 9.758 10.12 9.446 -3.2% -0.1% 43.66 54.27 56.5 29.4% 0.5%
America-Caribbean 29.36 51.28 72.01 145.3% 1.8% 9.29 10.8 14.21 53.0% 0.9% 34.29 50.92 68.84 100.8% 1.4%America-Central 13.83 33.08 58 319.4% 2.9% 11.24 11.39 12.9 14.8% 0.3% 53.78 61.76 67.26 25.1% 0.4%America-North 76.03 82.8 88.26 16.1% 0.3% 7.334 12.12 17.29 135.8% 1.7% 60.45 76.64 86.08 42.4% 0.7%America-South 22.45 41.05 65.59 192.2% 2.2% 7.933 8.125 9.17 15.6% 0.3% 31.9 42.65 59.91 87.8% 1.3%Americas 69.24 75.79 82.65 19.4% 0.4% 7.446 11.51 15.46 107.6% 1.5% 46.85 60.1 72.94 55.7% 0.9%
Asia-East 55.43 67.08 90.46 63.2% 1.0% 5.719 9.329 14.68 156.7% 1.9% 32.18 57.54 80.23 149.3% 1.8%Asia-South Central 15.82 34.42 58.26 268.3% 2.6% 3.168 5.002 5.558 75.4% 1.1% 31.4 39.49 48.56 54.6% 0.9%Asia-South East 22.94 35.59 51.41 124.1% 1.6% 21.56 18.82 15.48 -28.2% -0.7% 42.6 47.89 54.31 27.5% 0.5%Asia-West 34.89 54.14 74.54 113.6% 1.5% 11.78 13.33 14 18.8% 0.3% 36.37 52.36 62.06 70.6% 1.1%Oceania 63.5 76.03 82.87 30.5% 0.5% 9.723 12.94 16.19 66.5% 1.0% 64.14 81.53 84.11 31.1% 0.5%Asia with Oceania 47.59 58.6 79.34 66.7% 1.0% 7.339 9.672 12.61 71.8% 1.1% 33.83 48.1 60.71 79.5% 1.2%
Europe-East 46.08 68.02 79.57 72.7% 1.1% 13.93 13.28 15.84 13.7% 0.3% 47.56 65.71 73.79 55.2% 0.9%Europe-North 65.38 79.48 87.69 34.1% 0.6% 27.57 26.16 25.65 -7.0% -0.1% 75.7 98.46 100.8 33.2% 0.6%Europe-South 46.35 59.47 73.53 58.6% 0.9% 10.43 11.82 12.93 24.0% 0.4% 52.52 75.73 90.66 72.6% 1.1%Europe-West 56.38 73.63 84.67 50.2% 0.8% 23.68 22.11 22.21 -6.2% -0.1% 72.84 98.35 100.7 38.2% 0.6%Europe 55.71 71.78 83.01 49.0% 0.8% 21.02 19.85 20.72 -1.4% 0.0% 59.03 81.76 89.24 51.2% 0.8%
VOL2_15 Forecast Tables rev.indd 316 21/08/2009 09:26

317Forecast Tables
Patterns of Potential Human Progress Multination Regional Analysis Measures of Poverty, Health, Education, Infrastructure, and Governance
Base Case: Countries in Year 2060
Descending Population Sequence
GovernanceKnowledge Society Index Economic Integration Index Globalization Index
Index Range: 0-100 Index Range: 0-100 Index Range: 0-100
2010 2035 2060 % Chg % An Chg 2010 2035 2060 % Chg % An Chg 2010 2035 2060 % Chg % An Chg
AFRICAEthiopia 1.599 1.821 15.88 893.1% 4.7% 6.071 11.33 7.867 29.6% 0.5% 45.99 54.2 50.35 9.5% 0.2%
Uganda 10.89 21.86 47.87 339.6% 3.0% 4.782 8.201 5.88 23.0% 0.4% 48.27 61.65 67.98 40.8% 0.7%
Tanzania, United Rep. of 1.566 12.37 38.95 2387.2% 6.6% 6.66 7.948 7.914 18.8% 0.3% 35.01 47.13 65.05 85.8% 1.2%
Kenya 2.585 12.34 32.39 1153.0% 5.2% 3.53 5.812 5.147 45.8% 0.8% 36.39 46.79 52.09 43.1% 0.7%
Madagascar 2.584 5.328 17.23 566.8% 3.9% 3.982 9.595 8.606 116.1% 1.6% 35.63 46.93 49.64 39.3% 0.7%
Mozambique 6.872 20.36 59.11 760.2% 4.4% 11.33 13.86 19.51 72.2% 1.1% 41.79 50.73 78.46 87.7% 1.3%
Malawi 0.692 1.256 13.43 1840.8% 6.1% 3.307 6.984 5.124 54.9% 0.9% 34.38 45.21 47.79 39.0% 0.7%
Zambia 2.245 9.655 24.81 1005.1% 4.9% 15.51 15.95 14.49 -6.6% -0.1% 39.38 49.46 56.83 44.3% 0.7%
Burundi 3.9 3.968 18.26 368.2% 3.1% 1.831 10.19 6.359 247.3% 2.5% 32.39 45.63 48.57 50.0% 0.8%
Rwanda 1.526 5.757 19.84 1200.1% 5.3% 1.697 5.05 6.512 283.7% 2.7% 32.88 44.81 50.28 52.9% 0.9%
Somalia 0.459 0.498 0.631 37.5% 0.6% 19.44 34.48 33.02 69.9% 1.1% 19.55 35.01 34.98 78.9% 1.2%
Zimbabwe 2.22 14.58 28.49 1183.3% 5.2% 8.182 10.4 8.286 1.3% 0.0% 44.25 51.85 57.63 30.2% 0.5%
Eritrea 1.128 1.094 1.651 46.4% 0.8% 14.54 15.99 18.54 27.5% 0.5% 41.53 50.97 50.88 22.5% 0.4%
Mauritius 9.095 32.69 63.78 601.3% 4.0% 9.282 11.74 14.88 60.3% 0.9% 49.29 60.82 77.28 56.8% 0.9%
Comoros 1.784 7.397 22.48 1160.1% 5.2% 1.834 5.754 4.909 167.7% 2.0% 49.27 57.86 53.48 8.5% 0.2%
Djibouti 2.901 10.24 24.05 729.0% 4.3% 7.199 8.988 8.844 22.9% 0.4% 37.43 48.19 53.79 43.7% 0.7%
Africa-Eastern 3.85 14.95 41.27 971.9% 4.9% 6.607 9.601 9.845 49.0% 0.8% 40.05 50.78 56.26 40.5% 0.7%
Congo; Dem. Rep. of 0.448 0.638 7.192 1505.4% 5.7% 26.01 33.58 24.5 -5.8% -0.1% 40.63 52.82 52.2 28.5% 0.5%
Angola 6.513 16.99 21.71 233.3% 2.4% 36.35 23.43 19.2 -47.2% -1.3% 45.79 56.75 46.98 2.6% 0.1%
Cameroon 3.303 10.68 22.1 569.1% 3.9% 5.085 6.465 5.552 9.2% 0.2% 33.99 47.22 52.17 53.5% 0.9%
Chad 2.115 8.302 10.24 384.2% 3.2% 33.34 22.35 15.91 -52.3% -1.5% 43.15 51.42 50.54 17.1% 0.3%
Central African Republic 3.351 5.368 15.59 365.2% 3.1% 1.564 7.32 5.523 253.1% 2.6% 35.01 45.27 47.84 36.6% 0.6%
Congo, Rep. of 1.82 12.31 17.83 879.7% 4.7% 32.85 27.04 19.59 -40.4% -1.0% 47.67 56.25 56.34 18.2% 0.3%
Gabon 1.995 16.31 29.93 1400.3% 5.6% 22.35 19 23.47 5.0% 0.1% 48.83 56.27 59.05 20.9% 0.4%
Equatorial Guinea 26.9 39.59 40.26 49.7% 0.8% 56.3 45.42 43.44 -22.8% -0.5% 60.33 84.62 65.09 7.9% 0.2%
São Tomé and Príncipe 4.667 6.454 16.05 243.9% 2.5% 6.655 9.85 7.651 15.0% 0.3% 41.22 47.16 49.1 19.1% 0.4%
Africa-Middle 5.704 14.03 17.02 198.4% 2.2% 27.47 22.16 17.88 -34.9% -0.9% 40.88 52.57 51.4 25.7% 0.5%
Egypt 9.876 25.13 53.41 440.8% 3.4% 7.205 7.34 8.692 20.6% 0.4% 59.5 64.98 64.94 9.1% 0.2%
Sudan 6.543 18.14 28.2 331.0% 3.0% 7.806 5.217 6.082 -22.1% -0.5% 36.05 48.77 55.04 52.7% 0.8%
Algeria 13.7 24.98 34.88 154.6% 1.9% 10.78 6.591 5.88 -45.5% -1.2% 40.09 40.04 40.22 0.3% 0.0%
Morocco 13.32 24.04 41.29 210.0% 2.3% 5.435 6.193 6.535 20.2% 0.4% 53.97 59.18 53.39 -1.1% 0.0%
Tunisia 19.49 38.23 69.97 259.0% 2.6% 11.55 11.31 13.12 13.6% 0.3% 61.31 74.47 81.39 32.8% 0.6%
Libyan Arab Jamahiriya 29.89 45.83 50 67.3% 1.0% 9.8 13.52 5.506 -43.8% -1.1% 15.45 43.98 47.24 205.8% 2.3%
Africa-Northern 14.29 28.13 50.19 251.2% 2.5% 8.384 8.05 8.33 -0.6% 0.0% 49.43 56.15 57.38 16.1% 0.3%
VOL2_15 Forecast Tables rev.indd 317 21/08/2009 09:26
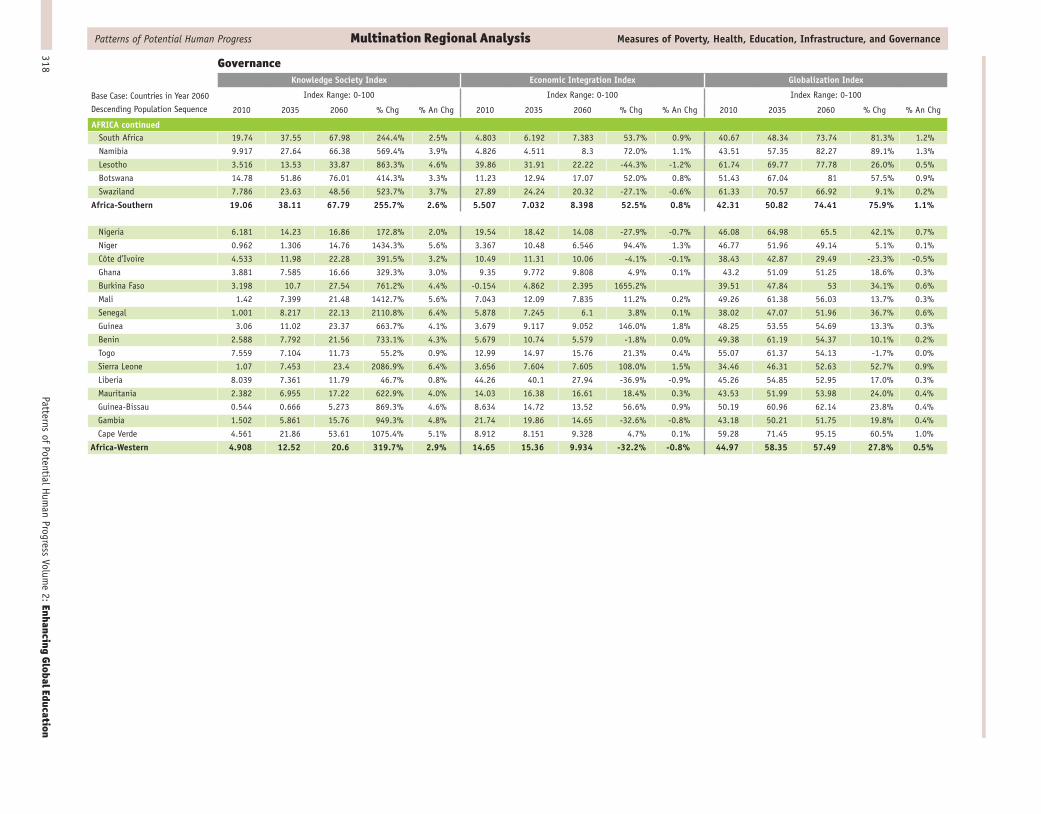
Patterns of Potential Hum
an Progress Volume 2: Enhancing Global Education
318
Patterns of Potential Human Progress Multination Regional Analysis Measures of Poverty, Health, Education, Infrastructure, and Governance
Base Case: Countries in Year 2060
Descending Population Sequence
GovernanceKnowledge Society Index Economic Integration Index Globalization Index
Index Range: 0-100 Index Range: 0-100 Index Range: 0-100
2010 2035 2060 % Chg % An Chg 2010 2035 2060 % Chg % An Chg 2010 2035 2060 % Chg % An Chg
AFRICA continuedSouth Africa 19.74 37.55 67.98 244.4% 2.5% 4.803 6.192 7.383 53.7% 0.9% 40.67 48.34 73.74 81.3% 1.2%
Namibia 9.917 27.64 66.38 569.4% 3.9% 4.826 4.511 8.3 72.0% 1.1% 43.51 57.35 82.27 89.1% 1.3%
Lesotho 3.516 13.53 33.87 863.3% 4.6% 39.86 31.91 22.22 -44.3% -1.2% 61.74 69.77 77.78 26.0% 0.5%
Botswana 14.78 51.86 76.01 414.3% 3.3% 11.23 12.94 17.07 52.0% 0.8% 51.43 67.04 81 57.5% 0.9%
Swaziland 7.786 23.63 48.56 523.7% 3.7% 27.89 24.24 20.32 -27.1% -0.6% 61.33 70.57 66.92 9.1% 0.2%
Africa-Southern 19.06 38.11 67.79 255.7% 2.6% 5.507 7.032 8.398 52.5% 0.8% 42.31 50.82 74.41 75.9% 1.1%
Nigeria 6.181 14.23 16.86 172.8% 2.0% 19.54 18.42 14.08 -27.9% -0.7% 46.08 64.98 65.5 42.1% 0.7%
Niger 0.962 1.306 14.76 1434.3% 5.6% 3.367 10.48 6.546 94.4% 1.3% 46.77 51.96 49.14 5.1% 0.1%
Côte d’Ivoire 4.533 11.98 22.28 391.5% 3.2% 10.49 11.31 10.06 -4.1% -0.1% 38.43 42.87 29.49 -23.3% -0.5%
Ghana 3.881 7.585 16.66 329.3% 3.0% 9.35 9.772 9.808 4.9% 0.1% 43.2 51.09 51.25 18.6% 0.3%
Burkina Faso 3.198 10.7 27.54 761.2% 4.4% -0.154 4.862 2.395 1655.2% 39.51 47.84 53 34.1% 0.6%
Mali 1.42 7.399 21.48 1412.7% 5.6% 7.043 12.09 7.835 11.2% 0.2% 49.26 61.38 56.03 13.7% 0.3%
Senegal 1.001 8.217 22.13 2110.8% 6.4% 5.878 7.245 6.1 3.8% 0.1% 38.02 47.07 51.96 36.7% 0.6%
Guinea 3.06 11.02 23.37 663.7% 4.1% 3.679 9.117 9.052 146.0% 1.8% 48.25 53.55 54.69 13.3% 0.3%
Benin 2.588 7.792 21.56 733.1% 4.3% 5.679 10.74 5.579 -1.8% 0.0% 49.38 61.19 54.37 10.1% 0.2%
Togo 7.559 7.104 11.73 55.2% 0.9% 12.99 14.97 15.76 21.3% 0.4% 55.07 61.37 54.13 -1.7% 0.0%
Sierra Leone 1.07 7.453 23.4 2086.9% 6.4% 3.656 7.604 7.605 108.0% 1.5% 34.46 46.31 52.63 52.7% 0.9%
Liberia 8.039 7.361 11.79 46.7% 0.8% 44.26 40.1 27.94 -36.9% -0.9% 45.26 54.85 52.95 17.0% 0.3%
Mauritania 2.382 6.955 17.22 622.9% 4.0% 14.03 16.38 16.61 18.4% 0.3% 43.53 51.99 53.98 24.0% 0.4%
Guinea-Bissau 0.544 0.666 5.273 869.3% 4.6% 8.634 14.72 13.52 56.6% 0.9% 50.19 60.96 62.14 23.8% 0.4%
Gambia 1.502 5.861 15.76 949.3% 4.8% 21.74 19.86 14.65 -32.6% -0.8% 43.18 50.21 51.75 19.8% 0.4%
Cape Verde 4.561 21.86 53.61 1075.4% 5.1% 8.912 8.151 9.328 4.7% 0.1% 59.28 71.45 95.15 60.5% 1.0%
Africa-Western 4.908 12.52 20.6 319.7% 2.9% 14.65 15.36 9.934 -32.2% -0.8% 44.97 58.35 57.49 27.8% 0.5%
VOL2_15 Forecast Tables rev.indd 318 21/08/2009 09:26

319Forecast Tables
Patterns of Potential Human Progress Multination Regional Analysis Measures of Poverty, Health, Education, Infrastructure, and Governance
Base Case: Countries in Year 2060
Descending Population Sequence
GovernanceKnowledge Society Index Economic Integration Index Globalization Index
Index Range: 0-100 Index Range: 0-100 Index Range: 0-100
2010 2035 2060 % Chg % An Chg 2010 2035 2060 % Chg % An Chg 2010 2035 2060 % Chg % An Chg
AMERICASHaiti 1.81 6.77 15.89 777.9% 4.4% 3.818 5.812 5.575 46.0% 0.8% 50.26 59.73 62.87 25.1% 0.4%
Dominican Republic 24 39.77 65.38 172.4% 2.0% 11.99 11.45 12.61 5.2% 0.1% 44.55 54.27 75.93 70.4% 1.1%
Cuba 21.17 34.79 73.64 247.9% 2.5% 3.324 5.07 10.4 212.9% 2.3% 8.731 25.87 67.99 678.7% 4.2%
Puerto Rico 43.76 72.77 84.14 92.3% 1.3% 4.272 9.017 17.01 298.2% 2.8% 26.62 69.14 75.89 185.1% 2.1%
Jamaica 8.902 18.79 36.7 312.3% 2.9% 20.63 17.38 14.19 -31.2% -0.7% 53.03 50.74 54.69 3.1% 0.1%
Trinidad and Tobago 9.124 44.49 65.68 619.9% 4.0% 30.45 24.54 27.4 -10.0% -0.2% 36.87 68.63 82.02 122.5% 1.6%
Bahamas 23.85 44.05 72.44 203.7% 2.2% 9.381 11.25 14.65 56.2% 0.9% 47.16 59.88 79.82 69.3% 1.1%
Barbados 30.53 47.16 78.13 155.9% 1.9% 9.934 11.69 16.77 68.8% 1.1% 71.16 76.49 94.87 33.3% 0.6%
St. Vincent & the Grenadines 23.63 32.8 56.26 138.1% 1.8% 39 30.48 23.58 -39.5% -1.0% 58.22 68.16 68.52 17.7% 0.3%
Grenada 31.75 37.92 60.05 89.1% 1.3% 33.86 26.9 21.43 -36.7% -0.9% 59.87 69.22 88.66 48.1% 0.8%
St. Lucia 9.71 27.26 56.34 480.2% 3.6% 35.79 29.53 24.13 -32.6% -0.8% 38.2 45.99 64.5 68.8% 1.1%
America-Caribbean 29.36 51.28 72.01 145.3% 1.8% 9.29 10.8 14.21 53.0% 0.9% 34.29 50.92 68.84 100.8% 1.4%
Guatemala 5.912 17.56 38.45 550.4% 3.8% 4.169 5.185 5.409 29.7% 0.5% 55.58 56.19 54.27 -2.4% 0.0%
Honduras 6.06 16.7 33.68 455.8% 3.5% 12.58 11.68 10.63 -15.5% -0.3% 57.07 67.25 76.84 34.6% 0.6%
El Salvador 9.976 24.65 48.93 390.5% 3.2% 7.602 7.48 8.159 7.3% 0.1% 59.12 65.77 69.53 17.6% 0.3%
Nicaragua 6.562 15.25 29.23 345.4% 3.0% 13.75 12.04 9.545 -30.6% -0.7% 56.21 65.28 72.24 28.5% 0.5%
Costa Rica 17.77 45.19 76.91 332.8% 3.0% 13.2 12.56 17.08 29.4% 0.5% 45.1 69.77 91.36 102.6% 1.4%
Panama 29.59 49.6 77.4 161.6% 1.9% 20.44 19.64 22.38 9.5% 0.2% 34.14 52.25 80.79 136.6% 1.7%
Belize 9.057 34.29 72.69 702.6% 4.3% 15.91 15.69 17.6 10.6% 0.2% 63.83 69.38 86.75 35.9% 0.6%
America-Central 13.83 33.08 58 319.4% 2.9% 11.24 11.39 12.9 14.8% 0.3% 53.78 61.76 67.26 25.1% 0.4%
United States of America 80.27 86.3 91.07 13.5% 0.3% 6.362 11.74 17.58 176.3% 2.1% 68.13 83.18 89.1 30.8% 0.5%
Mexico 19.2 34.6 57.19 197.9% 2.2% 9.58 9.535 9.735 1.6% 0.0% 33.45 51.89 72.27 116.1% 1.6%
Canada 64.24 76.97 83.98 30.7% 0.5% 18.47 19.52 21.24 15.0% 0.3% 76.92 97.09 101.2 31.6% 0.6%
America-North 76.03 82.8 88.26 16.1% 0.3% 7.334 12.12 17.29 135.8% 1.7% 60.45 76.64 86.08 42.4% 0.7%
Brazil 24.56 40.22 67.04 173.0% 2.0% 5.448 5.251 6.586 20.9% 0.4% 18.24 34.78 59.4 225.7% 2.4%
Colombia 11.27 25.72 54.14 380.4% 3.2% 10.03 8.747 6.989 -30.3% -0.7% 59.58 50 58.08 -2.5% -0.1%
Argentina 18.17 43.13 72.22 297.5% 2.8% 7.314 8.269 11.04 50.9% 0.8% 29.48 52.85 77.19 161.8% 1.9%
Venezuela, RB 22.6 37.33 50.32 122.7% 1.6% 12 11.54 8.186 -31.8% -0.8% 34.5 44.36 52.46 52.1% 0.8%
Peru 22.68 34.53 50.07 120.8% 1.6% 6.437 5.107 5.318 -17.4% -0.4% 57.87 47.92 52.81 -8.7% -0.2%
Chile 38.1 63.54 81.23 113.2% 1.5% 19.42 19.4 23.72 22.1% 0.4% 33.03 62.14 78.69 138.2% 1.8%
Ecuador 7.044 16.58 26.03 269.5% 2.6% 13.66 9.331 7.547 -44.8% -1.2% 41.36 35.74 31.19 -24.6% -0.6%
Bolivia 16.2 30.12 46.99 190.1% 2.2% 16.66 11.5 9.421 -43.5% -1.1% 59.28 64.36 73.79 24.5% 0.4%
Paraguay 13.39 19.84 33.94 153.5% 1.9% 9.004 9.487 9.13 1.4% 0.0% 52.42 46.56 38.99 -25.6% -0.6%
Uruguay 16.9 38.47 70.91 319.6% 2.9% 6.772 7.303 10.37 53.1% 0.9% 33.28 49.64 75.71 127.5% 1.7%
Guyana 7.675 21.44 43.86 471.5% 3.5% 35.95 31.54 26.74 -25.6% -0.6% 69.74 77.36 89.67 28.6% 0.5%
Suriname 9.551 28.08 51.93 443.7% 3.4% 1.981 3.247 6.388 222.5% 2.4% 47.3 63.96 62.6 32.3% 0.6%
America-South 22.45 41.05 65.59 192.2% 2.2% 7.933 8.125 9.17 15.6% 0.3% 31.9 42.65 59.91 87.8% 1.3%
VOL2_15 Forecast Tables rev.indd 319 21/08/2009 09:26

Patterns of Potential Hum
an Progress Volume 2: Enhancing Global Education
320
Patterns of Potential Human Progress Multination Regional Analysis Measures of Poverty, Health, Education, Infrastructure, and Governance
Base Case: Countries in Year 2060
Descending Population Sequence
GovernanceKnowledge Society Index Economic Integration Index Globalization Index
Index Range: 0-100 Index Range: 0-100 Index Range: 0-100
2010 2035 2060 % Chg % An Chg 2010 2035 2060 % Chg % An Chg 2010 2035 2060 % Chg % An Chg
ASIA WITH OCEANIAChina 27.94 56.69 89.43 220.1% 2.4% 8.028 9.587 14.61 82.0% 1.2% 29.97 55.37 80.76 169.5% 2.0%
Japan 68.48 85.42 94.17 37.5% 0.6% 1.678 5.65 12.33 634.8% 4.1% 50.39 78.26 83.56 65.8% 1.0%
Korea, Rep. of 84.4 107.2 112 32.7% 0.6% 7.054 11.24 18.29 159.3% 1.9% 42.53 77.6 79.75 87.5% 1.3%
Taiwan 47.12 69.99 84.84 80.1% 1.2% 4.228 7.507 15.34 262.8% 2.6% 40.55 71.71 82.45 103.3% 1.4%
Korea, Dem. Rep. of 15.12 20.35 26.93 78.1% 1.2% 6.46 6.421 11.55 78.8% 1.2% 8.821 17.82 23.3 164.1% 2.0%
Hong Kong 24.05 42.94 57.29 138.2% 1.8% 58.56 50.69 41.24 -29.6% -0.7% 83.96 97.16 97.55 16.2% 0.3%
Mongolia 29.48 37.31 54.91 86.3% 1.3% 16.31 17.48 20.93 28.3% 0.5% 58.05 68.55 76.32 31.5% 0.5%
Asia-East 55.43 67.08 90.46 63.2% 1.0% 5.719 9.329 14.68 156.7% 1.9% 32.18 57.54 80.23 149.3% 1.8%
India 16.62 34.67 61.21 268.3% 2.6% 1.558 2.647 5.292 239.7% 2.5% 27.38 32.89 51.21 87.0% 1.3%
Pakistan 4.448 13.41 26.74 501.2% 3.7% 1.348 3 2.548 89.0% 1.3% 36.19 44.42 31.32 -13.5% -0.3%
Bangladesh 11.56 22.82 35.32 205.5% 2.3% 0.451 2.408 2.94 551.9% 3.8% 46.66 60.18 51 9.3% 0.2%
Afghanistan 0.695 0.819 6.005 764.0% 4.4% 2.005 6.366 13 548.4% 3.8% 35.36 44.56 48.22 36.4% 0.6%
Iran, Islamic Rep. of 21.05 43.12 53.82 155.7% 1.9% 7.382 15.64 7.367 -0.2% 0.0% 26.43 48.44 49.11 85.8% 1.2%
Nepal 8.992 15.47 26.67 196.6% 2.2% 0.844 3.353 3.481 312.4% 2.9% 47.86 59.08 63.29 32.2% 0.6%
Uzbekistan 10.82 18.83 27.17 151.1% 1.9% 5.658 4.275 6.518 15.2% 0.3% 40.03 46.9 31.88 -20.4% -0.5%
Sri Lanka 4.424 22.5 46.78 957.4% 4.8% 6.426 7.448 8.909 38.6% 0.7% 54.31 69.78 81.78 50.6% 0.8%
Kazakhstan 30.17 59.45 61.34 103.3% 1.4% 23.88 28.61 32.25 35.1% 0.6% 48.97 74.58 71.64 46.3% 0.8%
Tajikistan 8.27 15.26 28.15 240.4% 2.5% 10.09 9.167 6.043 -40.1% -1.0% 49.79 62.65 67.45 35.5% 0.6%
Turkmenistan 15.39 40.72 35.97 133.7% 1.7% 23.08 29.06 44.53 92.9% 1.3% 29.15 45.51 44.13 51.4% 0.8%
Kyrgyzstan 25.35 29.77 36.94 45.7% 0.8% 11.96 12.38 11.27 -5.8% -0.1% 56.48 64.13 66.1 17.0% 0.3%
Bhutan 6.398 25.52 57.73 802.3% 4.5% 3.524 6.247 8.781 149.2% 1.8% 38.45 56.46 84.17 118.9% 1.6%
Maldives 21.21 43.99 79.9 276.7% 2.7% 14.27 14.27 22.1 54.9% 0.9% 47.24 68.93 109.8 132.4% 1.7%
Asia-South Central 15.82 34.42 58.26 268.3% 2.6% 3.168 5.002 5.558 75.4% 1.1% 31.4 39.49 48.56 54.6% 0.9%
Indonesia 12.16 22.32 35.81 194.5% 2.2% 4.394 4.331 5.061 15.2% 0.3% 47.43 44.67 46.98 -0.9% 0.0%
Philippines 20.81 30.73 45.94 120.8% 1.6% 9.953 10 9.717 -2.4% 0.0% 50.02 46.38 51.4 2.8% 0.1%
Vietnam 12.65 28.29 47.24 273.4% 2.7% 17.63 16.32 15.59 -11.6% -0.2% 62.88 76.19 72.68 15.6% 0.3%
Thailand 31.28 43.68 62.67 100.4% 1.4% 16.64 15.98 16.2 -2.6% -0.1% 17.32 33.99 55.16 218.5% 2.3%
Myanmar 3.331 13.41 24.69 641.2% 4.1% 1.96 5.181 7.888 302.4% 2.8% 0.103 14.55 20.46 19764.1% 11.2%
Malaysia 24.43 47.63 72.8 198.0% 2.2% 27.04 28.15 27.03 0.0% 0.0% 43.72 57.46 81.06 85.4% 1.2%
Cambodia 5.062 20.48 36.84 627.8% 4.0% 14.22 15.82 14.99 5.4% 0.1% 50.6 56.23 67.03 32.5% 0.6%
Lao PDR 5.735 24.13 54.3 846.8% 4.6% 6.279 9.97 11.2 78.4% 1.2% 38.79 53.41 82.08 111.6% 1.5%
Singapore 49.73 62.96 72.54 45.9% 0.8% 76.93 70.68 58.94 -23.4% -0.5% 85 100.9 103.2 21.4% 0.4%
Timor-Leste 3.913 12.75 31.79 712.4% 4.3% 3.382 9.729 7.357 117.5% 1.6% 37.08 48.8 59.67 60.9% 1.0%
Brunei Darussalam 6.984 24.74 41.64 496.2% 3.6% 14.71 19.69 19.82 34.7% 0.6% 63.23 80.54 87.18 37.9% 0.6%
Asia-South East 22.94 35.59 51.41 124.1% 1.6% 21.56 18.82 15.48 -28.2% -0.7% 42.6 47.89 54.31 27.5% 0.5%
VOL2_15 Forecast Tables rev.indd 320 21/08/2009 09:26

321Forecast Tables
Patterns of Potential Human Progress Multination Regional Analysis Measures of Poverty, Health, Education, Infrastructure, and Governance
Base Case: Countries in Year 2060
Descending Population Sequence
GovernanceKnowledge Society Index Economic Integration Index Globalization Index
Index Range: 0-100 Index Range: 0-100 Index Range: 0-100
2010 2035 2060 % Chg % An Chg 2010 2035 2060 % Chg % An Chg 2010 2035 2060 % Chg % An Chg
ASIA WITH OCEANIA continuedTurkey 25.46 45.1 77.61 204.8% 2.3% 4.298 5.613 9.718 126.1% 1.6% 25.41 44.05 74.74 194.1% 2.2%
Yemen 6.484 18.48 31.39 384.1% 3.2% 8.988 7.102 6.743 -25.0% -0.6% 54.3 62.8 42.6 -21.5% -0.5%
Iraq 12.5 26.14 43.5 248.0% 2.5% 6.183 12.78 10.36 67.6% 1.0% 7.8 22.13 34.72 345.1% 3.0%
Saudi Arabia 33.04 53.02 70.83 114.4% 1.5% 15.19 16.21 15.48 1.9% 0.0% 36.26 65.6 82.72 128.1% 1.7%
Syria 8.911 19.86 38.93 336.9% 3.0% 5.332 5.451 7.005 31.4% 0.5% 42.08 38.05 37.76 -10.3% -0.2%
Israel 84.77 109.2 115.9 36.7% 0.6% 12.17 14.97 22.52 85.0% 1.2% 69.69 96.38 91.88 31.8% 0.6%
Azerbaijan 10.99 31.07 42.85 289.9% 2.8% 42.34 40.52 32.11 -24.2% -0.6% 67 85.27 71.13 6.2% 0.1%
Jordan 29.78 46.09 85.05 185.6% 2.1% 16.68 13.66 17.07 2.3% 0.0% 47.45 63.72 107.8 127.2% 1.7%
Palestine 17.52 25.85 43.73 149.6% 1.8% 2.612 4.169 5.026 92.4% 1.3% 55.06 66.63 71.17 29.3% 0.5%
United Arab Emirates 33.92 58.53 72.48 113.7% 1.5% 13.7 19.92 25.38 85.3% 1.2% 52.38 83.87 92.51 76.6% 1.1%
Oman 27.99 45.69 64.16 129.2% 1.7% 14.7 10.91 11.25 -23.5% -0.5% 40.55 60.41 72.18 78.0% 1.2%
Kuwait 8.075 32.75 47.43 487.4% 3.6% 14.66 24.88 25.24 72.2% 1.1% 47.02 82.99 92.47 96.7% 1.4%
Lebanon 34.85 47.35 69.05 98.1% 1.4% 15.98 13.12 13.03 -18.5% -0.4% 66.9 83.48 86.69 29.6% 0.5%
Georgia 29.81 38.54 49.61 66.4% 1.0% 11.94 11.07 11.11 -7.0% -0.1% 58.85 70.71 77.9 32.4% 0.6%
Armenia 21.5 43.01 62.08 188.7% 2.1% 34.45 28.25 23.23 -32.6% -0.8% 55.46 77.27 90.86 63.8% 1.0%
Bahrain 43.02 60.48 73.55 71.0% 1.1% 27.2 24.4 19.18 -29.5% -0.7% 82.31 96.54 95.19 15.6% 0.3%
Qatar 16.49 41.93 51.63 213.1% 2.3% 18.53 36.61 55.64 200.3% 2.2% 50.81 87.74 102.1 100.9% 1.4%
Cyprus 28.05 50.74 65.6 133.9% 1.7% 22.69 22 22.17 -2.3% 0.0% 63.71 82.14 83.15 30.5% 0.5%
Asia-West 34.89 54.14 74.54 113.6% 1.5% 11.78 13.33 14 18.8% 0.3% 36.37 52.36 62.06 70.6% 1.1%
Australia 64.2 76.72 82.95 29.2% 0.5% 8.97 12.56 16.05 78.9% 1.2% 72.56 94.83 98.92 36.3% 0.6%
Papua New Guniea 2.177 14.13 23.01 957.0% 4.8% 18.48 17.67 11.43 -38.1% -1.0% 42.95 52.07 54.37 26.6% 0.5%
New Zealand 64.28 80.84 92.04 43.2% 0.7% 14.7 15.12 17.89 21.7% 0.4% 58.22 83 91.32 56.9% 0.9%
Solomon Islands 7.826 12.23 19.8 153.0% 1.9% 19.27 14.89 11.87 -38.4% -1.0% 53.66 58.84 56.17 4.7% 0.1%
Fiji 10.32 21.68 46.21 347.8% 3.0% 17.05 15.78 14.41 -15.5% -0.3% 61.68 71.66 70.47 14.3% 0.3%
Vanuatu 4.776 15.98 35.84 650.4% 4.1% 33.77 27.64 19.57 -42.0% -1.1% 63.35 71.09 72.78 14.9% 0.3%
Micronesia 9.827 19.66 41.92 326.6% 2.9% 4.539 4.999 7.052 55.4% 0.9% 44.19 53.87 69.16 56.5% 0.9%
Tonga 5.746 16.36 39.17 581.7% 3.9% 2.157 4.106 5.328 147.0% 1.8% 42.4 52.85 65.36 54.2% 0.9%
Samoa 6.412 20.23 50.45 686.8% 4.2% 7.117 7.807 9.156 28.6% 0.5% 44.53 57.28 76.51 71.8% 1.1%
Oceania 63.5 76.03 82.87 30.5% 0.5% 9.723 12.94 16.19 66.5% 1.0% 64.14 81.53 84.11 31.1% 0.5%
VOL2_15 Forecast Tables rev.indd 321 21/08/2009 09:26

Patterns of Potential Hum
an Progress Volume 2: Enhancing Global Education
322
Patterns of Potential Human Progress Multination Regional Analysis Measures of Poverty, Health, Education, Infrastructure, and Governance
Base Case: Countries in Year 2060
Descending Population Sequence
GovernanceKnowledge Society Index Economic Integration Index Globalization Index
Index Range: 0-100 Index Range: 0-100 Index Range: 0-100
2010 2035 2060 % Chg % An Chg 2010 2035 2060 % Chg % An Chg 2010 2035 2060 % Chg % An Chg
EUROPERussian Federation 48.65 73.91 80.21 64.9% 1.0% 14.37 13.82 17.86 24.3% 0.4% 40.54 66.61 71.51 76.4% 1.1%
Ukraine 43.7 60.05 81.95 87.5% 1.3% 10.79 10.65 13.24 22.7% 0.4% 43.09 50.39 64.22 49.0% 0.8%
Poland 46.88 66.29 84.22 79.7% 1.2% 9.542 10.39 13.45 41.0% 0.7% 62.95 73.51 82.88 31.7% 0.6%
Romania 30.29 43.37 58.82 94.2% 1.3% 9.571 9.448 9.971 4.2% 0.1% 65.33 75.16 74.1 13.4% 0.3%
Czech Republic 45.53 57.45 74.65 64.0% 1.0% 20.71 19.21 18.62 -10.1% -0.2% 49.46 67.34 87.81 77.5% 1.2%
Belarus 50.98 66.4 84.45 65.7% 1.0% 9.751 9.489 11.29 15.8% 0.3% 39.94 55.79 78.56 96.7% 1.4%
Hungary 51.12 64.43 82.61 61.6% 1.0% 22.27 20.62 20.39 -8.4% -0.2% 48.84 63.18 79.79 63.4% 1.0%
Bulgaria 30.81 44.29 67.93 120.5% 1.6% 20.45 18.31 18.94 -7.4% -0.2% 73.72 90.13 96.52 30.9% 0.5%
Slovakia 33.24 44.59 61.97 86.4% 1.3% 20.42 18.7 18.05 -11.6% -0.2% 59.23 59.44 69.89 18.0% 0.3%
Moldova, Rep. of 28.53 36.39 54.78 92.0% 1.3% 15.07 14.03 11.34 -24.8% -0.6% 48.22 56.87 63.8 32.3% 0.6%
Europe-East 46.08 68.02 79.57 72.7% 1.1% 13.93 13.28 15.84 13.7% 0.3% 47.56 65.71 73.79 55.2% 0.9%
United Kingdom 57.59 73.72 82.83 43.8% 0.7% 29.16 26.52 24.87 -14.7% -0.3% 71.1 95.97 97.52 37.2% 0.6%
Sweden 92.77 105.6 111.1 19.8% 0.4% 31.97 30.22 29.68 -7.2% -0.1% 98.96 115.3 115.2 16.4% 0.3%
Denmark 80.43 92.85 99.62 23.9% 0.4% 23.43 23.65 25.7 9.7% 0.2% 91.93 112.1 114.1 24.1% 0.4%
Ireland 54.49 64.08 70.76 29.9% 0.5% 30.63 33.56 34.36 12.2% 0.2% 73.57 94.83 100.9 37.1% 0.6%
Norway 68.52 74.2 79.81 16.5% 0.3% 16.98 19.14 25.04 47.5% 0.8% 87.81 105.2 113.3 29.0% 0.5%
Finland 89.89 102.2 108.2 20.4% 0.4% 20.79 20.99 23.09 11.1% 0.2% 67.61 89.84 97.4 44.1% 0.7%
Lithuania 58.02 71.83 91.7 58.0% 0.9% 12.8 12.14 14.03 9.6% 0.2% 69.56 90.39 94.13 35.3% 0.6%
Latvia 54.69 74.31 91.99 68.2% 1.0% 12.16 13.11 16.69 37.3% 0.6% 73.59 94.38 96.27 30.8% 0.5%
Estonia 57.91 77.03 90.7 56.6% 0.9% 26.27 24.46 25.21 -4.0% -0.1% 77.33 94.08 90.12 16.5% 0.3%
Iceland 78.36 89.49 96.96 23.7% 0.4% 24.25 23.66 27.27 12.5% 0.2% 71.65 80.26 80.98 13.0% 0.2%
Europe-North 65.38 79.48 87.69 34.1% 0.6% 27.57 26.16 25.65 -7.0% -0.1% 75.7 98.46 100.8 33.2% 0.6%
Italy 43.17 54.09 70.91 64.3% 1.0% 6.581 8.265 10.59 60.9% 1.0% 45.34 66.2 83.74 84.7% 1.2%
Spain 55.62 69.85 79.19 42.4% 0.7% 17.16 16.66 15.82 -7.8% -0.2% 51.12 84.29 95.76 87.3% 1.3%
Greece 35.61 51.38 63.21 77.5% 1.2% 3.325 7.011 10.33 210.7% 2.3% 52.99 83.55 92.05 73.7% 1.1%
Portugal 44.24 53.78 75.85 71.5% 1.1% 15.83 14.25 13.76 -13.1% -0.3% 79 86.74 105.1 33.0% 0.6%
Serbia 28.7 41.98 65.48 128.2% 1.7% 6.952 7.172 7.958 14.5% 0.3% 69.03 81.96 100.8 46.0% 0.8%
Croatia 34.84 48.96 77.21 121.6% 1.6% 14.46 13.94 15.53 7.4% 0.1% 49.46 56.19 78.37 58.5% 0.9%
Bosnia and Herzegovina 9.63 21.47 41.29 328.8% 3.0% 9.543 8.858 10.86 13.8% 0.3% 63.48 73.05 83.61 31.7% 0.6%
Albania 15.48 33.68 56.63 265.8% 2.6% 8.175 8.55 10.79 32.0% 0.6% 53.98 77.26 95.67 77.2% 1.2%
Macedonia, TFYR 16.82 22.73 38.61 129.5% 1.7% 11.32 9.8 9.031 -20.2% -0.5% 67.11 73.7 78.65 17.2% 0.3%
Slovenia 63.4 78.35 90.98 43.5% 0.7% 12.6 14.88 19.73 56.6% 0.9% 53.48 75.7 84.76 58.5% 0.9%
Montenegro 29.21 39.92 64.09 119.4% 1.6% 5.082 7.835 10.84 113.3% 1.5% 62.93 74.05 86.12 36.9% 0.6%
Malta 20.86 42.7 66.15 217.1% 2.3% 33.26 29.47 28.62 -14.0% -0.3% 56.21 72.96 83.55 48.6% 0.8%
Europe-South 46.35 59.47 73.53 58.6% 0.9% 10.43 11.82 12.93 24.0% 0.4% 52.52 75.73 90.66 72.6% 1.1%
Germany 55.77 74.98 87.12 56.2% 0.9% 13.36 14.82 19.27 44.2% 0.7% 70.04 95.56 98.77 41.0% 0.7%
France 57.16 73.84 84.25 47.4% 0.8% 18.29 17.41 19.08 4.3% 0.1% 67.55 96.12 97.83 44.8% 0.7%
Netherlands 62.91 73.9 79.92 27.0% 0.5% 51.21 43.02 32.58 -36.4% -0.9% 98.46 116.2 117.8 19.6% 0.4%
Belgium 51.76 68.38 79.34 53.3% 0.9% 81.65 64.87 45.21 -44.6% -1.2% 85.7 108.6 106.8 24.6% 0.4%
Austria 52.25 69.66 81.67 56.3% 0.9% 14.7 17.2 21.34 45.2% 0.7% 61.64 85.57 91 47.6% 0.8%
Switzerland 56.7 72.49 84.45 48.9% 0.8% 30.63 28.57 26.17 -14.6% -0.3% 81.74 101 100.5 23.0% 0.4%
Luxembourg 25.92 44.25 63.4 144.6% 1.8% 92.94 82.44 63.93 -31.2% -0.7% 113.7 130.9 130.6 14.9% 0.3%
Europe-West 56.38 73.63 84.67 50.2% 0.8% 23.68 22.11 22.21 -6.2% -0.1% 72.84 98.35 100.7 38.2% 0.6%
VOL2_15 Forecast Tables rev.indd 322 21/08/2009 09:27

Index 323
IndexPage numbers followed by the letter n indicate entries in notes.
Acemoglu, Daron, 156, 160(n16)
Achieving Universal Primary Education by 2015: A Chance for Every Child (Bruns, Mingat, and Rakotomalala), 72–73, 110–111, 114–115, 137–138
Adult population: attainment levels, 48–51, 49(table); average years of education, 48(fig.); base case forecast for adult education attainment, 86–87, 88(fig.); base case forecast of highest education attainment level of adults, 164(fig.); gender balance in attainment, 50; gender parity and years of education, 51(fig.); gender parity ratio in adult populations, 50(fig.); global advance of education, 162; history and forecast of adult attainment, 90(table); literacy in the adult population, 50–51, 51(fig.); multistate demographic method, 74–75; parental education affecting student success, 120
Afghanistan: gender parity ratio, 111; tertiary level gross enrollment rate, 2
Age: adjusted primary net intake, 70(box); age/sex/education distribution for Albania and Bolivia, 20(fig.); attainment levels, 19–20; base case forecast of dependent age categories as percent of total global population, 165(fig.); decline of youth share in population, 165–166; population effects of fertility and mortality rates, 154; primary intake rates by age categories, 70(table). See also Adult population
AIDS: 10
Albania: age/sex/education distribution, 20(fig.)
Allison, Graham, 77(n20)
Alva, Soumya, 160(n13)
Alvarez, Benjamin, 9(n11)
American Academy of Arts and Sciences, 5
Anastasion, Daniele, 154
Angola: calculated incremental costs of education acceleration, 135
Appiah, Elizabeth, 77(n26), 157
Arab States: adult attainment, 49; base case forecast for adult attainment, 87; base case forecast for education spending, 85–86; child mortality rate, 35; comparing costs and benefits of the normative scenario with the base case, 145–146; distribution of female and male gender parity and gaps, 32(fig.); enrollment analysis, 42; enrollment rate expansion, 25; history and forecast for education progress, 91; literacy in the adult population, 51; public spending, 44; pursuing gender parity in enrollment rates, 29; role of economic development in expanding participation, 35; sociopolitical context, 36–37; state instability, 37; UPE target dates, 133. See also Regional data
Assessing quality of education. See Quality of education
At-risk children, 14
Attainment: adult attainment in sub-Saharan Africa and DRC in 2060: normative scenario relative to base case, 130(fig.); adult populations, 48–51; affecting sociopolitical change, 166; age/sex/education distribution for Albania and Bolivia, 20(fig.); assessing education quality
through, 109(box); attainment differences between the normative scenario and the base case for South and West Asia and sub-Saharan Africa, 126(fig.); base case and normative scenario differences, 126–127; base case forecast for adult education attainment, 86–87, 88(fig.); base case forecast of average years of education under optimistic and pessimistic dynamic assumptions, 102(fig.); base case forecast of highest completed level of education by those age 12, 163(fig.); base case forecast of highest education attainment level of adults, 164(fig.); characteristics and measures of, 19–20; conceptual foundations, 16–17; defining attainment, 53(n24); education flows, 17(fig.); forecasts of, 86–87, 88(fig.), 95–96, 102(fig.); gender balance in adult education attainment, 50; global advance, 162; history and forecast of adult attainment, 90(table); IFs education model approach, 60–61, 63; multistate demographic method, 75; student flow patterns, 18(fig.); sub-Saharan attainment gap, 167
Baldacci, Emanuele, 144
Bangladesh: high enrollment rate growth, 110; IFs grade flow data and simulation, 62, 62(fig.); survival rates, 131
Barrera, Albino, 160(n13)
Barro, Robert, 20(fig.), 23(n12), 48–49, 53(n26), 143–144
Barrow, Karima, 24, 52(n1), 56, 74, 77(n31), 92–93, 103(n16, n17), 110
Base case forecasts of IFs: adult education attainment, 86–87; analysis of Burkina Faso as example of IFs integrated approach, 94–95; comparing IFs forecasts with those of others: 89, 91–94; countries missing current MDG goals, 82–83, 83(table); dependent age categories as percent of total global population, 165(fig.); economic growth, 97; education spending as percent of GDP, 85–86; education spending by education level, 86; enrollment rates for countries outside sub-Saharan Africa with low secondary enrollment, 83(fig.); expansion of education, 79–81; exploring major dimensions of uncertainty, 86–92; gender parity, 83–85; gender parity enrollment rate ratios, 84(fig.), global advance of education, 162; gross enrollment rates by region and education level, 80(fig.); highest completed level of education by those age 12, 163(fig.); highest education attainment level of adults, 164(fig.); human development–education linkage, 78–79; lifetime educational prospects of African children, 162; optimistic and pessimistic framing scenarios, 100–102; population by age, sex, and level of completed education in India and China, 88(fig.); primary and secondary net enrollment rates by region, 81(table); primary net enrollment rates in sub-Saharan country clusters, 82(fig.); sociopolitical effects of education advance, 156; targeting countries with below 50 percent primary enrollment, 81–82; UPE by 2015 not a feasible goal, 82
VOL2_16 Index.indd 323 21/8/09 08:20:20

Patterns of Potential Human Progress Volume 2: Advancing Global Education324
Basic education: defining, 5; duration of primary and secondary levels of education, 22(table); global advance of, 162; Jomtien Declaration, 3; Latin America and the Caribbean, 132; literacy and, 89. See also Primary level education; Secondary level education, lower
Bates, Robert, 37
Batra, Poonam, 4(box), 15(box), 47(box)
Becker, Gary, 23(n3), 150
Benin: low intake/high survival rates, 107–108, 107(fig.); rapidly closing gender gap, 111
Binder, Melissa, 98, 116
Birdsall, Nancy, 11, 52(n17), 120
Bloom, David, 5, 23(n11, n12), 52(n1), 103(n12), 153
Bolivia: age/sex/education distribution, 20(fig.)
Bosworth, Barry, 144
Botswana: high enrollment rate growth, 110; rapidly closing gender gap, 111
Bottom-up spending analysis, 114–115
Boys. See Gender
Bradsher, Monica, 9(n11)
Brazil, 132
Bruns, Barbara, 56, 72–73, 77(n27), 98, 110–111, 114–115, 121(n12, n13), 137–138, 141(n5)
Brundtland, Gro, 57
Buchmann, Claudia, 15–16, 23(n7), 147–148, 150, 156, 160(n1, n16)
Burkina Faso: comparing forecasts of primary net enrollment rates in 2025, 93(table); history and forecast of enrollment rates, 93–95; rapidly closing gender gap, 111; teacher salaries, 115
Burundi: comparing forecasts of primary net enrollment rates in 2025, 93(table); history and forecast of enrollment rates, 93; state instability leading to slowing or reversal of enrollment gains, 82
Caldwell, John, 23(n17), 151–152, 155
Cambodia: gender parity ratio, 29
Canning, David, 153
Carrol, Bidemi, 24, 52(n1), 56, 74, 77(n31), 92–93, 103(n16, n17), 110
Case, Anne, 152
Castelló-Climent, Amparo, 160(n17)
Castro-Martín, Teresa, 150–151
Center for Global Development, 73–74
Central African Republic: gender parity ratio, 111; state instability leading to slowing or reversal of enrollment gains, 82
Central and Eastern Europe: base case forecast for adult attainment, 87; base case forecast for declining education spending, 85; Cold War expansion of education, 34; distribution of female and male gender parity and gaps, 32(fig); duration of primary and secondary education, 23; gender parity in secondary levels, 53(n3); literacy in the adult population, 50; public spending, 44; role of economic development in expanding participation, 35–36. See also Regional data
Central Asia: distribution of female and male gender parity and gaps, 32(fig.); enrollment rate patterns, 27–28; literacy in the adult population, 50; role of economic development in expanding participation, 35–36; spending bubbles in the normative scenario, 135. See also Regional data
Chad: gender parity ratio, 111; low intake/low survival rates, 107(fig.), 108
Chandola, Tarani, 160(n13)
Chen, Derek, 143
China: base case forecast for adult attainment, 87, 88(fig.); base case forecast for education spending, 86; forecasting economic growth, 97; government effectiveness as benefit of education, 157; public spending, 53(n16), 118; sociopolitical effects of education advance, 156; UPE strategy, 4
Cincotta, Richard, 154
Clemens, Michael, 9(n9), 23(n1, n5), 24, 52(n1), 56, 65, 73–74, 92, 92(table), 103(n17), 104–105, 110
Cohen, Daniel, 23(n12), 48–49, 53(n26), 143
Cohen, Joel, 5, 103(n12)
Cold War, 78
Collins, Susan, 144
Colonialism, 12–13, 78
Commission on Macroeconomics and Health (CMH), 138–139
Comoros: gender parity ratio, 111; low intake/high survival rates, 107–108, 107(fig.)
Completion rates: assessing education quality through, 109(box); entry and completion analysis, 74; intake rates in high-growth countries, 110; per student spending across low-income countries, 115; student flow patterns, 17–18. See also Attainment
Compulsory education, 11, 22(table), 23(n15, n16, n17)
Coombs, Philip, 52(n15), 121(n9)
Corruption: disappearance of education funds, 115–116; perception of corruption in sub-Saharan Africa, 41–42; relationships of sociopolitical variables with GDP per capita at PPP and education, 155(table); sociopolitical benefits of education, 157–158; sociopolitical measures, 36–37
Corruption Perceptions Index, 158
Costa Rica: military spending, 147
Cost-benefit analysis: accounting-centric approach to education analysis, 56; estimating break-even point of costs of accelerating education’s advance, 147; exploratory model desirable characteristics, 55; increased domestic and foreign spending, 138–140; normative scenario, 105, 145–147, 166; targeting primary at the cost of secondary education, 107. See also Normative scenario of education advancement
Costs of education: education costs as percent of GDP: history and forecasts, 136(fig.); IFs education model, 60; opportunity costs, 14. See also Public spending
Côte d’Ivoire: gender parity ratio, 111; state instability leading to slowing or reversal of enrollment gains, 82
Country-level analysis, 6–7, 65–67
Cowell, Richard, 9(n11)
Crespo-Cuaresma, Jesús, 23(n11)
Cross-sectional analyses of education (uses of), 56, 65
Cuadra, Ernesto, 9(n11), 98, 107, 116, 121(n16)
Cuba: high intake rate despite low GDP per capita, 65(fig.), 66; primary level spending, 115–116
Cultural change through education’s advance, 155
Currais, Luis, 153
Curry, Helen, 103(n12)
Cutright, Phillips, 156
Dahlman, Carl, 143
Dakar Framework for Action (2000), 3, 5, 9(n7), 45, 108
Data collection, 3, 27, 69-71, 77(n11, n12, n13, n22)
Delamonica, Enrique, 56, 72, 77(n27)
Demand for education: balancing supply and, 61; forecasting models and tools, 55–56; IFs education model, 60(fig.), 63–64, 68, 94; impact of human development system on, 13–14; limiting education expansion, 79
Democratic Republic of Congo: adult attainment in sub-Saharan Africa and DRC in 2060: normative scenario relative to base case, 130(fig.); calculated incremental costs of education acceleration, 135; enrollment rates: normative scenario relative to base case, 129(table); gender parity ratio, 111; impact of education on fertility rates, 151; low intake/high survival rates, 107–108, 107(fig.); political turmoil reversing education gains, 128–129; state instability leading to slowing or reversal of enrollment gains, 82
Democratization: as benefit of education advance, 155–156; IFs sociopolitical model, 59; outside sub-Saharan Africa, 42; polity measure of democracy, 37(fig.); relationships of sociopolitical variables with GDP per capita at PPP and education, 155(table); sociopolitical and demographic benefits of education’s advance, 15, 36–37
Demographics: affecting education supply and demand, 14; bidirectional connections with education, 13; demographic transition, 10–11; education impact on fertility, 150–152;
VOL2_16 Index.indd 324 21/8/09 08:20:22

Index 325
education–human development linkage, 165–166; exploratory model desirable characteristics, 55; facilitating education advancement, 52; IFs demographic model, 57–58, 68; need for extra funding for low-income societies, 166; role in expanding participation, 34–35; student headcount, 123, 125(table)
Demographic transition: dependent age categories as percent of total global population, 165(fig.); shaping education progress, 34–35, 79; sociopolitical, demographic, and economic links to education, 11(fig.)
Desai, Sonalde, 160(n13)
Development economics, 12
Development policy, 105
Development studies, 12
Dewey, John, 155
Diamond, Ian, 151
Djibouti: gender parity ratio, 29, 111; tertiary level gross enrollment rate, 2
Dominican Republic: private funding for primary education, 116
Dropout rate, 17, 18(fig.), 75
Duration of education by level, 22–23
Durkheim, Emile, 156
Durlauf, Steven, 143
East Asia and the Pacific (poorer): base case forecast for education spending, 86; cost-benefit comparison of the normative scenario with the base case, 145–146; distribution of female and male gender parity and gaps, 32(fig.); enrollment analysis, 42; enrollment growth across levels, 112; enrollment rate expansion, 25; enrollment rate patterns, 27–28; incremental spending needs, 135–136; literacy in the adult population, 51; public spending, 44–45, 118; regionalization of country-level data, 25(box); role of economic development in expanding participation, 35. See also Regional data
East Asia and the Pacific (richer): base case forecast for declining education spending, 85; distribution of female and male gender parity and gaps, 32(fig.);
literacy in the adult population, 51; regionalization of country-level data, 25(box); years of education completed by adult populations, 49. See also Regional data
Easterlin, Richard, 150
Easterly, William, 143
Economic development: development economics and development studies, 12; policymaking, 105; productivity and growth as benefit of education advance, 143–147; role in expanding participation, 35–36; sociopolitical and demographic benefits of education’s advance, 15
Economic factors and consequences: affecting education supply and demand, 14; IFs economic model, 58–59; 68; socially excluded populations, 15(box); sociopolitical, demographic, and economic links to education, 11(fig.). See also Public spending
Economic growth and well-being: aggregate impact of the normative scenario, 144–145; capability approach to development, 12–13; demographic transition shaping education progress, 33–34; economic and development benefits of education’s advance, 166; economic cost-benefit comparison of the normative scenario with the base case, 145–146; economic distribution within societies, 147–148; education and economic distribution across societies, 148–149; education–economic growth–mortality linkages, 153–154; estimating break-even point of costs of accelerating education’s advance, 147; global economic growth scenarios, 97(fig.); slow growth affecting participation and attainment rates, 165–167; uncertainties in forecasting, 97
Education and Development: Measuring the Social Benefits (McMahon), 71–72
Education and economic distribution, 147–148
Education Development Index (EDI), 109
Education for All Global Monitoring Report (2008), 75–76, 93, 107
Education Policy and Data Center, 56, 74–75, 77(n), 92–93, 95
Efficiency, 107–108
Empowerment, 4, 13
Engelman, Robert, 154
Enrollment numbers (student headcount): relationship to enrollment dynamics, 123; student headcount differences between the normative scenario and the base case, 125(fig.)
Enrollment rates: balancing lower and upper secondary rates, 111–112, 111(fig.); comparing the normative scenario and the base case, 124(fig.); compulsory education, 23; countries with gender parity and gender gaps by education level, 32(fig.); by country income, level of education, and sex, 2(table); data and information streams, 110; developing countries, 2; DRC enrollment rates: normative scenario relative to base case, 129(table); entry and completion analysis, 74; exploratory model characteristics, 55; factors slowing progress toward universal enrollment, 52; gender parity, 28–33; global advance, 162; global regions’ attainment of various enrollment rates: normative scenario relative to base case, 134(fig.); growth since 1960, 24; high-growth countries, 110–111; history and forecast, 91–92; human development framework of education, 13–14; IFs education model, 62, 64–67; Latin America and the Caribbean normative forecasts, 132; normative scenario for South and West Asia, 129–131; normative scenario with unconstrained budgets, 123; outside sub-Saharan Africa, 41–43, 41(fig.); per student spending, 46, 115; progression of enrollment expansion, 24–28; secondary gross enrollment rates, 2000 and 2005, 29(fig.); student flow patterns, 17–18, 19(box); subregional and cross-regional analyses of, 38–42; sub-Saharan Africa, 39–41, 40(fig.), 127–129, 127(fig.), 127(table)–128(table); tertiary-level reverse gender gap, 52; UNESCO and IFs forecasts of student enrollment numbers in 2025, 91(table); universal primary education goals, 3–4. See also Gross enrollment; Intake rate; Net enrollment rate; Transition rate
Environmental quality, 158–159
Environmental sustainability, 57
Equatorial Guinea: high intake/low survival rates, 107, 107(fig.)
Eritrea: comparing forecasts of primary net enrollment rates in 2025, 93(table); gender parity ratio, 111; history and forecast of enrollment rates, 93; low intake/high survival rates, 107–108, 107(fig.)
Ethiopia: comparing forecasts of primary net enrollment rates in 2025, 93(table); political turmoil reversing education gains, 128; rapidly closing gender gap, 111
Failed-state index, 158, 159(fig.)
Fast Track Initiative (FTI), 7, 9(n14)
Feasibility, 104–105
Fertility rate: Burkina Faso, 94; global decline, 10; greater workforce participation and, 142; health and fertility benefits of education expansion, 15, 150–152, 151(fig.); IFs demographic and sociopolitical models, 58–59; multistate demographic method, 75; population effects of fertility and mortality rates, 154–155; uncertainties in forecasting, 96
Financial crises or downturns: low-growth economic scenario, 97; slow growth or reversal of enrollment gains, 82; slowing progress toward universal enrollment, 52
Financial flows: IFs education model, 63–64
Forecasting tools and models: “best practices” approach of Bruns, Mingat, and Rakotomalala, 56, 72–73; characteristics of ideal education tools and models, 55; cohort-projection approach, 76, 93, 95; Clemens’s historical analysis of rates of enrollment change (“transition pathway”), 56, 73–74, 92; comparing forecasts of primary net enrollment rates for sub-Saharan African countries in 2025 from different tools, 93(table); early UNESCO extrapolative forecasts, 74, 77(n34), 89, 91–92; education module in PHOENIX dynamic population and health model, 56, 75; EPDC extrapolative analysis of entry and completion rates
VOL2_16 Index.indd 325 21/8/09 08:20:24

Patterns of Potential Human Progress Volume 2: Advancing Global Education326
to project growth paths, 56, 74, 92–93; exploratory compared with normative purposes and approaches, 54–55, 76(n1); extrapolation compared to causal analysis, 64; forecasting as opposed to prediction, 71; grade-flow models, 62–63; IFs modeling system defining features, 7–8; inherent uncertainties in, 96; McMahon’s econometric interactive macrodynamic model, 56, 71–72; multistate demographic projection methodology (developed by IIASA), 74–75, 77(n32), 95; ProEnrol cohort projection model, 56, 75–76, 93; recent approaches, 55–57, 92–95; UIS Global Age-Specific Literacy Projections model, 95; UNICEF study of modeled costs of UPE (Delamonica, Mehrotra, and Vandemoortele), 56, 72. See also International Futures (IFs) global modeling system
Fredriksen, Birger, 9(n5), 33, 52(n1)
Funding. See Costs of education; Gross domestic product (GDP); Private education; Public spending
Future of education, 8
G-8 meeting, 140
Gabon: enrollment rates since 1960, 24
Gambia: compulsory education, 23
Gender: age/sex/education distribution for Albania and Bolivia, 20(fig.); base case forecast for gender ratios in enrollment rates, 83–85, 89; changing status of women as ideational force for increased participation of women and girls in education, 134; countries with gender parity and gender gaps by education level, 32(fig.); countries with rapidly closing gaps, 111; definition of gender parity in enrollment, 28; differences in female and male enrollment dynamics, 83, 112–113; education impact on fertility rate, 150–152, 151(fig.); enrollment rate expansion, 27; enrollment rates by country income, level of education, and sex, 2(table); enrollment rates pursuing gender parity, 28–33; female gaps decreasing across levels, 112; gender parity and years of education in adult populations,
51(fig.); gender parity in secondary levels, 53(n3); gender parity ratio in adult populations, 50(fig.); global advance of female gender parity, 28, 162; gross gender parity indices by education level and region, 30(fig.); historical causes of female underrepresentation in education systems, 32, 162; human capital and human capability approaches to gender, 12; IFs sex-differentiated intake and survival rates, 65; increasing intake/transition and survival rates, 113; lower survival and transition rates of males, 32–33; low gender gap ratio countries, 111; male gender gaps at upper levels of education, 29–33, 52, 85; masking of country-level female disparities by regional aggregations, 33; multistate demographic method, 74–75; net gender parity indices by level 1970–2005, 31(table); net gender parity ratio for primary level in sub-Saharan Africa, 128(fig.); parity as Millennium Development Goal, 4–5; pursuing gender parity in the IFs normative scenario, 104–105, 112–113, 113(fig.); quality assessment measures, 119–120; sexual revolution challenging patriarchal patterns, 34; social benefits of education expansion to women, 142; socially excluded groups, 14; sociopolitical and demographic benefits of education’s advance, 15; subregional and cross-regional analysis of gender parity, 38–39; sub-Saharan Africa’s gender imbalances, 128; target rate summary in the normative scenario, 113(table); women’s attainment levels, 19–20
Gershberg, Alec, 98
Ghana: comparing forecasts of primary net enrollment rates in 2025, 93(table); low intake/high survival rates, 107–108, 107(fig.)
Gillies, John, 9(n11)
Gini coefficient: income distribution, 148–149, 148(fig.); literacy, 89
Girls. See Gender
Glaeser, Edward, 156
Global Burden of Disease (GBD) project, 153
Global Environment Outlook–4, 59
Globalization, 167–168
Global University Network for Innovation (GUNI), 6
Goals of education expansion, 2–6, 104–105
Goldman, Charles, 4, 23(n6)
Good practice spending, 116–117
Goujon, Anne, 52(n1), 56, 74–75, 77(n32), 95
Government effectiveness as benefit of education, 157–158
Government spending. See Public spending
Green, Andy, 156
Groot, Wim, 160(n12)
Gross domestic product (GDP): acceleration costs for the normative scenario, 135; adjusted primary net intake and GDP per capita at PPP, 67(fig.); base case forecast for education spending as percent of, 85(fig.); benefits of growth in response to education advances, 139, 143; Burkina Faso, 94; economic development level and rate, 35–36; economic growth forecasting, 99–100; education costs as percent of GDP: history and forecasts, 136(fig.); education demand forecasts, 166; enrollment rates correlating to, 41–42; impact on fertility rates, 151–152; intake and survival rate relationship with GDP per capita at PPP, 66(fig.); intake rate forecast, 65; per capita GDP at PPP across regions, 36(fig.); per student public spending as percent of GDP, 114(table), 115(fig.); public spending and, 43(fig.), 45, 115–116; relationship of female adjusted primary net intake and, 65(fig.); relationships of sociopolitical variables with GDP per capita at PPP and education, 155(table); secondary level public spending, 116, 117(fig.); sociopolitical outcomes of education expenditure, 105, 156; teacher salaries correlating with, 114; tertiary level spending, 117(fig.); UNICEF study on education costs, 72; upper secondary public spending, 117(fig.). See also Economic growth and well-being; Public spending
Gross enrollment rate: base case forecast by region and education level, 80(fig.); data availability, 19(box), 27(box); defined, 9(n3),
17; forecasting enrollment based on economic growth, 99(fig.); IFs grade-flow model, 62–63; midcentury predictions, 79; rates by education level since 1960, 26(fig.); regional tertiary gross enrollment rates, 112(fig.); subregional and cross-regional analysis of, 38. See also Enrollment rates; Net enrollment rate
Grossman, Michael, 23(n4)
Guinea: comparing forecasts of primary net enrollment rates in 2025, 93(table); gender parity ratio, 111
Guinea-Bissau: gender parity ratio, 111; low intake/low survival rates, 107(fig.), 108; state instability leading to slow growth or reversal of enrollment gains, 82
Gurr, Ted, 52(n7)
Gurria, Martin, 98
Gwartney, James, 156
Haiti: tertiary level gross enrollment rate, 2
Hannum, Emily, 15–16, 23(n7), 147–148, 150, 156, 160(n1, n16)
Hanushek, Eric, 16(box), 153, 160(n6)
Haveman, Robert, 12
Health benefits of education expansion, 15, 148, 152–154. See also Mortality rate
Health spending, 138–139
High-income countries. See East Asia and the Pacific (richer); North America and Western Europe
Hilderink, Henk, 56, 75
Hill, M. Anne, 52(n2)
Hillebrand, Evan, 36
History of education: analyses, 52(n1); data collection, 27(box); progression of enrollment expansion, 24–28
Holsinger, Donald, 9(n11)
Hough, J. R., 160(n2)
Hughes, Barry, 36, 58, 95, 97, 149, 156, 160(n8)
Human capabilities approach to development and education, 12–13
Human capital approach to development and education, 12–13
Human capital stock, 75
Human development: analyzing educational change and, 16; base case forecast, 78–79; demographic
VOL2_16 Index.indd 326 21/8/09 08:20:26

Index 327
transition, 10–11; economic and development benefits of education’s advance, 166; education and broader human development, 165–167; education in a human development framework, 13–16; education’s impact on, 14–15; IFs modeling system, 57, 68; sociopolitical, demographic, and economic links to education, 11(fig.); universal postprimary education, 5–6. See also Demographics; Economic factors and consequences; Normative scenario of education advancement
Human Development Index, 150
Hungerford, Thomas, 67
Huntington, Samuel, 36, 157
Ibrahim, Amina, 11, 52(n17), 120
Impacts of education: complications in assessing, 16(box); direct and indirect impacts, 13
Income level, country: demographic transition, 10; education and economic distribution across societies, 148–149; enrollment rates by country income, level of education, and sex, 2(table); global enrollment rates, 2; global patterns of public spending, 43–44, 44(fig.); per-student public spending as percent of GDP per capita at PPP, 114(table); quality of education and, 120
Incremental funding, 72–73, 105, 137(fig.)
India: base case forecast for adult attainment, 87, 88(fig.); percentage point enrollment rate advantages over Pakistan in the normative scenario, 131(fig.); rapidly closing gender gap, 111; survival rates, 131; UPE strategy, 4
Indigenous population, 132
Indonesia: enrollment rates since 1960, 24; public spending, 53(n16)
Industrialization, compulsory education and, 11
Inequality, social: education and economic distribution within societies, 147–148; sociopolitical and demographic benefits of education’s advance, 15
Information and communication technology (ICT), 97, 167–168
Information streams for intake/transition and survival rates, 109–113
Inglehart, Ronald, 156
Intake rate: adjusted primary net intake, 70(box); adjusted primary net intake and GDP per capita at PPP, 67(fig.); Burkina Faso, 94–95; data and information streams for setting targets, 109–113; defining, 17–18; gender gaps decreasing across levels, 112–113; gender patterns, 33; gross intake rate, 17; IFs education model, 60, 64–67, 65(fig.); increased intake/transition rates correlated with decreased survival rates, 107–108; intake and survival rate relationship with GDP per capita at PPP, 66, 66(fig.); as leverage point for normative scenario, 105–106; PHOENIX education module, 75; primary intake rates by age, 70(table); targeting primary at the cost of secondary education, 107; target rate summary for the normative scenario, 113(table). See also Enrollment rates
Interaction effects across education levels, 106–107
Interaction effects within education levels, 107
International assistance, 139–140
International Association for the Evaluation of Educational Achievement (IEA), 109(box)
International Futures (IFs) global modeling system: accounting system of the educational model, 55, 61(table), 61–64; algorithmic structures of IFs model, 61; balancing supply and demand, 61, 68–69; capability for developing scenarios, 59; causal analysis approach, 64–65; correlating education advancement with economic productivity and growth, 143–144; data extension, cleaning, and reconciliation, 69–71; demand and supply drivers, 60(fig.); demographic, economic, and sociopolitical models, 58–59; dominant relationships in, 61, 65–68; education attainment, 63; education costs and public spending, 67–68; education–human development linkages, 68–69; education model, 60–71; features of, 7–8, 9(n12); financial flows, 63–64; foundational elements of, 61(table); gender-specific flow rate functions, 65; general design considerations,
57–58; initializing the model, 69–71; intake and survival rates, 60, 64–67, 65(fig.); key dynamics of IFs, 60–61, 61(table), 68–69; levels of education, 57; private spending, 48; research and policy analysis use, 59; saturation effects of enrollment gains (S-shaped curves), 52; student flows, 62–63; treatment of incongruent student flow values, 71; use of cross-sectional functions and convergence processes, 65–67. See also Base case forecast; Normative scenario accelerating education’s advance in IFs; Normative scenario impacts relative to base case forecasts in IFs
International Institute for Applied Systems Analysis (IIASA), 56, 75, 95
International learning assessments, 108, 119–120
International Standard Classification of Education (ISCED), 21–22, 63
Iran: enrollment and survival rates, 131
Iraq: gender parity ratio, 111
Irfan, Mohammod, 18(fig.), 60
Jamison, Dean, 16(box), 153, 160(n6, n7)
Jamison, Eliot, 16(box), 153, 160(n6)
Johnson, Paul, 143
Jomtien Declaration (1990), 3, 5
Jordan: enrollment rates since 1960, 24
Juárez, Fátima, 150–151
Kaufmann, Daniel, 37, 120, 157
Kenya: comparing forecasts of primary net enrollment rates in 2025, 93(table); impact of education on fertility rates, 151; net enrollment rate, 94
Key, V. O., 77(n20)
King, Elizabeth, 52(n2)
Knight, Jane, 168
Kornhauser, William, 156
Kraay, Aart, 37, 120, 157
Krueger, Alan, 160(n5)
Kumar, Krishna, 4, 23(n6)
Kunst, A. E., 148
Kurzweil, Raymond, 168(n2)
Lambsdorff, Johann, 37, 158
Latin America and the Caribbean: adult literacy, 51; base case forecast for declining education spending, 85; base case forecast for gender parity, 85; comparing costs and benefits of the normative scenario with the base case, 146; decrease in tertiary level public spending, 117; distribution of female and male gender parity and gaps, 32(fig.); economic development and expanding participation, 35; enrollment analysis, 42; enrollment growth across levels, 112; enrollment rate expansion, 25; enrollment rate forecasts in the normative scenario, 132(fig.); enrollment rates history and forecast, 91; forecasting economic growth, 97; government effectiveness as benefit of education, 157–158; normative scenario enrollment rates, 123; normative scenario for education transition acceleration, 131–133; public spending, 44; spending bubbles in the normative scenario, 135; state instability, 37. See also Regional data
Lau, Lawrence, 160(n7)
Least Developed Countries (LDCs), 139–140, 140(table), 149–150
Lee, Jong-Wha, 20(f), 23(n12), 48–49, 53(n26)
Lesotho: comparing forecasts of primary net enrollment rates in 2025, 93(table); high enrollment, survival, and transition rates, 111; rapidly closing gender gap, 111
Levels of education: adult education by completed level, 49–50; base case forecast of highest completed level of education by those age 12, 163(fig.); base case gross enrollment rates by region and education level, 80(fig.); countries missing current MDG goals, 83(table); countries with gender parity and gender gaps by education level, 32(fig.); data and information streams on intake and survival, 110; duration of education, 22–23, 22(tables); enrollment rates by country income, level of education, and sex, 2(table); expenditure allocations, 44; female gender gaps decreasing
VOL2_16 Index.indd 327 21/8/09 08:20:28

Patterns of Potential Human Progress Volume 2: Advancing Global Education328
across levels, 112; global regions’ attainment of various enrollment rates: normative scenario relative to base case, 134(fig.); gross enrollment rates since 1960, 26(fig.); gross gender parity indices, 30(fig.); history and forecast of adult attainment, 90(table); IFs modeling system, 57; male gender gaps at upper levels, 32, 112; net gender parity indices by level 1970–2005, 31(table); normative scenario targeting change across, 106–107; normative scenario targeting change within, 107–108; per-student public spending as percent of GDP, 114(table); primary and secondary net enrollment rates, 1970–2005, 28(table); system elements, 21–22; uncertainties in forecasting models, 100. See also Primary level education; Secondary level; Secondary level education, lower; Secondary level education, upper; Tertiary level
Levine, Ruth, 11, 52(n17), 120
Lewin, Keith, 107
Lewis, Maureen, 52(n2)
Liberia: gender parity ratio, 111
Life expectancy, 10, 153–154, 153(fig.)
Lindahl, Mikael, 160(n5)
Lindblom, Charles, 77(n20)
Lipset, Seymour, 155–156
Literacy: adult populations, 50–51, 51(fig.); base case forecast for universal literacy, 89; data collection methods, 53(n28); democratization as benefit of, 156; UIS Global Age-Specific Literacy Projections model, 95; UNESCO and IFs approaches and forecasts, 95–96
Liu, Ying, 4, 23(n6)
Lockwood, Marlaine, 52(n2)
Loncar, Dejan, 153
López-Casanovas, Guillem, 153
Lutz, Wolfgang, 23(n11), 52(n1), 56, 74–75, 77(n32, n33), 95, 103(n21)
Maassen van den Brink, Henriette, 160(n12)
Machenbach, J. P., 148
Madagascar: high intake/low survival rates, 107, 107(fig.)
Maddox, Brian, 13
Mali: gender parity ratio, 111
Malin, Martin, 103(n12)
Marshall, Monty, 52(n7), 160(n18)
Mass education, 2, 151, 155–156
Mastruzzi, Massimo, 37, 120, 157
Mathers, Colin, 153
Mauritania: low intake/low survival rates, 107(fig.), 108
Mauritius: comparing forecasts of primary net enrollment rates in 2025, 93(table)
McMahon, Walter, 56, 71–72, 76(n4), 77(n17, n25, n26), 144, 157, 160(n3, n10, n22)
Mehrotra, Santosh, 56, 72
Men. See Gender
Meyer, John W., 9(n2), 52(n1), 103(n13)
Milanovic, Branko, 103(n9)
Military spending, 147
Millennium Declaration (2000), 3
Millennium Development Goals (MDGs): base case forecast, 82; Clemens’s normative analysis of transition speeds, 73–74; creation of, 3; emphasizing primary over secondary level education, 107; gender parity, 4–5, 94; poverty reduction, 149; sub-Saharan Africa in the normative scenario, 127
Millennium Project Task Force on Education and Gender Equality, 11–12, 73–74, 138
Millennium Summit (2000), 3
Mingat, Alain, 56, 72–73, 98, 107, 110, 114–115, 121(n12, n13), 137, 141(n5), 160(n5)
Minimum adequate educational cost, 56
Models. See Forecasting tools and models
Modernization theory, 166–167
Monetary value of education, 105
Moore’s Law, 167
Moreno, Juan, 9(n11), 98, 107, 116, 121(n16)
Mortality rate: education and income distribution affecting, 148; IFs demographic model, 58; mortality reduction through education advance, 148, 152–154; multistate demographic method, 75; population effects of fertility and mortality rates, 154–155; youth dependency ratio, 35–36
Mozambique: comparing forecasts
of primary net enrollment rates in 2025, 93(table)
Multistate demographic method, 74–75, 95
Namibia: comparing forecasts of primary net enrollment rates in 2025, 93(table); history and forecast of enrollment rates, 93
Nepal: rapidly closing gender gap, 111
Net enrollment rate: base case forecast for primary and secondary net enrollment rates, 81(table); comparing the speed of transition in primary net enrollment rates, 92(table); countries missing current MDG goals, 83(table); data and information streams, 110; definition, 17; expansion since 1960, 25; gross enrollment rates and, 17; lower secondary gross and primary net enrollment rates, 106–107, 106(fig.); primary and secondary rates, 1970–2005, 28(table); subregional and cross-regional analysis of, 38; UPE target dates, 133. See also Enrollment rates; Gross enrollment rate
Netherlands Ministry of Health and Environment, 75
Newby, Margaret, 151
Niger: comparing forecasts of primary net enrollment rates in 2025, 93(table); gender parity ratio, 111; history and forecast of enrollment rates, 93–94; state instability leading to slowing or reversal of enrollment gains, 82
Nigeria: gender parity ratio, 111; political turmoil slowing or reversing education gains, 128
Nonformal education, 9(n12)
Nonmarket economic effects of education, 12
Normative scenario accelerating education’s advance in IFs: assessing quality of education, 108–109; change across levels, 106–107; change within levels, 107–108; cross-sectional analysis of target variables, 111–112; dynamics across levels, 112–113; financial targets, 118–119; intake/transition rates, survival rates, and resources, 105–106, 109–113; public spending targets, 114–119; regional and country data, 112; student flows, 113; target rate summary, 113(table)
Normative scenario impacts relative to base case forecasts using IFs: adult attainment, 126–127; adult attainment in sub-Saharan Africa and DRC in 2060, 130(fig.); age distribution of the population, 154; aggregate impact of the normative scenario, 144–145; attainment differences for South and West Asia and sub-Saharan Africa, 126(fig.); comparing costs and benefits, 135–138, 145–146; domestic funding sources, 138–139; DRC enrollment rates, 129(table); economic distribution across societies, 148–149; education costs as percent of GDP, 136(fig.); education spending in the Least Developed Countries, 140(table); enrollment rate differences, 123, 124(fig.), 126; enrollment rates in Latin America and the Caribbean, 132(fig.); extent of freedom (selected regions), 157(fig.); GDP per capita at PPP, 145(table); global regions’ attainment of various enrollment rates, 134(fig.); government effectiveness, 157–158; impact of education on fertility rates, 151–152; incremental costs, 137(fig.); India’s percentage point enrollment rate advantages over Pakistan, 131(fig.); interim costs of spending diversion, 147; international funding sources for, 139–140; Latin America and the Caribbean, 131–133; population size in sub-Saharan Africa and South and West Asia, 154–155; poverty reduction, 149; South and West Asia, 129–131, 131(fig.); student headcount differences, 123, 125(fig.), 126; sub-Saharan Africa, 127–129; sub-Saharan low primary enrollment countries, 128(table); UPE target dates, 133; years when target and benchmark enrollment rates are reached, 134 (fig.)
Normative scenarios (purposes and other approaches): Bruns, Mingat, and Rakotomalala study, 72–73, 110–111, 114–115, 137–138; Clemens’s transition pathway approach, 73–74; combining aggressive goal-setting and feasibility, 104–105; methodological characteristics, 54–55; relationship to policy development, 119
VOL2_16 Index.indd 328 21/8/09 08:20:30
Index 329
North America and Western Europe: base case forecast for adult attainment, 87; base case forecast for declining education spending, 85; Cold War expansion of education, 34; comparing costs and benefits of the normative scenario with the base case, 146; decrease in tertiary level public spending, 117; distribution of female and male gender parity and gaps, 32(fig.); enrollment rate expansion, 25; health and mortality, 152; literacy in the adult population, 51; years of education completed by adult populations, 49. See also Regional data
Notestein, Frank, 150
Nussbaum, Martha, 13
Oman: IFs model of intake and survival rates, 65(fig.), 66
Omran, Abdel, 152
Oneal, John, 157
Pakistan: gender parity ratio, 111; India’s percentage point enrollment rate advantages over Pakistan in the normative scenario forecasts, 131(fig.); sociopolitical effects of education advance, 156; survival rates, 131
Papua New Guinea: tertiary level gross enrollment rate, 2
Parental education, 14
Participation in education: adult population, 48; conceptual foundations, 16–17; IFs education model, 60–61; literacy in the adult population, 50–51; normative scenario targeting, 104–105; subregional and cross-regional patterns, 38–42. See also Student flows
Patrinos, Harry, 143
Personal freedoms, 12
Pessoa, José, 52(n28)
PHOENIX dynamic population and health model, 75
PIRLS (Progress in International Reading Literacy Study), 109(box), 120–121, 120(table)
PISA assessment program, 109(box), 119, 120(table)
Policy development, 119
Political economy: slowing progress toward universal enrollment, 52
Political Instability Task Force, 37
Polity Project, 36, 156
Ponzetto, Giacomo, 156
Population growth and statistics: creating greater demand for education, 13–14; decline of youth share in population, 165–166; demography and expanding participation, 34–35; dependent age categories as percent of total global population, 165(fig.); education funding and demographic transition, 133–135; effect on student flows, 98–99; global growth rate scenarios, 97(fig.); growth as obstacle to universal primary education goals, 3–4; impact of fertility and mortality effects of education, 154–155; overwhelming education growth, 94; uncertainties in forecasting, 96–97
Porta, Emilio, 77(n35)
Postprimary education. See Secondary level education, lower; Secondary level education, upper; Tertiary level
Poverty rate: as barrier to participation in education, 13–14; demographic transition, 10; global poverty, 149–150
Poverty Reduction Strategy Papers, 6
Preston, John, 156
Primary level education: base case forecast for adult attainment, 89; base case forecast for education spending, 86; base case forecast for low-enrollment countries, 82; compulsory education, 23; financial targets for public spending, 118; gender parity as MDG, 5; Gini coefficient of income distribution, 148(fig.); global enrollment rate expansion, 25; ICT use, 167; IFs base case forecast for enrollment, 79; IFs grade flow data and simulation for Bangladesh, 62, 62(fig.); impact on fertility, 150–151; per-student public spending, 114; public spending analysis, 115–116, 115(fig.); pursuing gender parity in enrollment rates, 29; South and West Asia’s UPE goal, 129, 131; student flows and stocks, 17, 17(fig.)–18(fig.); survival rate as measure of education quality, 108–109; universal primary education goals, 3–4; western spread of compulsory education,
11. See also Enrollment rates; Transition rate
Pritchett, Lant, 143
Private education: distinction between auspices and funding, 46–47; enrollment rates, 46; IFs limitations, 8; private spending, 46–48, 116; public spending, 53(n22); relationship to public responsibility, 47(box)
ProEnrol, 56, 75–76, 93(fig.)
Przeworski, Adam, 160(n19)
Psacharopoulos, George, 143
Public spending: affecting quality of education, 120; base case forecast, 85–86; Burkina Faso, 95; change in per student public spending, 118; diversion of military funds, 147; domestic sources, 138–139; economic growth and, 144; education–human development link, 166; enrollment rates and numbers with unconstrained budgets, 123–127; financial targets, 118–119; forecast variables, 98, 100; geographic variations in spending per student, 117–118; global patterns of, 43–44; good practice scenario, 115–117; IFs education model, 60–61, 63–64, 68–69; IFs sociopolitical model, 59; international funding sources for LDCs, 139–140; Least Developed Countries, 140(table); limiting education expansion, 79; lower secondary public spending, 116; normative scenario costs, 135–137; as a percentage of GDP, 45(table); per-student public spending as percent of GDP, 114(table); per-student spending, 45–46, 46(table); per-student spending targets by education level, 114–119; primary level spending across countries, 115–116; on private schools, 53(n22), 108–109; regional patterns, 44–45; secondary level spending, 116, 117(fig.); tertiary level, 116–117, 117(fig.); upper secondary public spending, 117(fig.). See also Social benefits of education
Purchasing power parity (PPP), 35–36, 36(fig.), 42, 97
Qu, Weishuang, 77(n24)
Quality of education, 161; adjusted R-squared of possible
determinants of quality with PIRLS scores, 120(table); assessing, 108–109; Education Development Index (EDI), 109, 121(n5); global spread of assessment instruments, 162, 165; IFs limitations, 8; likely determinants of, 120–121; relationships between assessment measures, 119–120; R-squared of countries across quality tests, 120(table); secondary level public spending and, 116; socially excluded populations, 15(box); sociopolitical decisions shaping education, 14; survival rate as proxy measure, 108–109, 120; temporal goals ignoring, 4(box)
Rakotomalala, Ramahatra, 56, 72–73, 98, 110, 114–115, 121(n12, n13), 137, 141(n5)
Ramirez, Francisco, 103(n13)
RAND Corporation study, 4
Rawls, John, 57
Regional data: average years of education in adult populations, 48(fig.); base case forecast for education spending as percent of GDP, 85(fig.); base case forecast for gender parity, 84(fig.); base case forecast for primary and secondary net enrollment rates, 81(table); base case forecast of highest completed level of education by those age 12, 163(fig.); base case forecast of highest education attainment level of adults, 164(fig.); base case gross enrollment rates by region and education level, 80(fig.); completed level of education by adult populations, 49(table); compulsory education, 22(table); democracy measures, 37(fig.); duration of primary and secondary education, 22(table); education costs as percent of GDP: history and forecasts, 136(fig.); enrollment rate differences between the normative scenario and the base case, 124(fig.); GDP per capita at PPP, 36(fig.); GDP per capita at PPP in the normative scenario relative to base case, 145(table); gender parity and gender gaps by education level, 32(fig.); gender parity indices by level 1970–2005, 31(table); gender parity ratio in adult populations, 50(fig.); global
VOL2_16 Index.indd 329 21/8/09 08:20:32

Patterns of Potential Human Progress Volume 2: Advancing Global Education330
regions’ attainment of various enrollment rates: normative scenario relative to base case, 134(fig.); gross enrollment rates, secondary, 2000 and 2005, 29(fig.); gross enrollment rates since 1960, 26(fig.); gross gender parity indices, 30(fig.); history and forecast of adult attainment, 90(table); history and forecast of enrollment rates, 101(fig.); incremental costs: normative scenario relative to base case, 137(fig.); literacy in adult populations, 51(fig.); net enrollment rates, primary and secondary, 1970–2005, 28(table); primary intake rates by age, 70(table); private education, 47(table); public spending as a percentage of GDP, 45(table); public spending per student, 46(table); public spending per student as a percent of GDP per capita at PPP, 118(table); state stability/instability, 38(fig.); student headcount differences between the normative scenario and the base case, 125(fig.); tertiary gross enrollment rates, 112(fig.); UNESCO and IFs forecasts of student enrollment numbers in 2025, 91(table); youth dependency ratio, 35(fig.)
Regional expansion of education participation, 79
Regional universal primary education goals (history), 3
Repayment of education investment, 8
Repetition rate, 17, 25, 62
Republic of Congo: impact of education on fertility rates, 151; state instability leading to slowing or reversal of enrollment gains, 82
Resources: economic strength and, 14; per-student spending targets, 114; as point of leverage for normative scenario, 105–106; targeting primary at the cost of secondary education, 107. See also Public spending; Supply side of educational resources
Revenue mobilization, 139
Right, education as a, 1, 11
Rivera, Berta, 153
Robeyns, Ingrid, 13
Russett, Bruce, 157
Rwanda: enrollment rate, 94; high intake/low survival rates, 107, 107(fig.); impact of education on fertility rates, 151
Sachs, Jeffrey, 138
Sala-i-Martin, Xavier, 143–144
Scenario development, IFs capability for, 59
Schleifer, Andrei, 156
Schultz, Theodore, 23(n3)
Secondary Education in Africa (SEIA) project, 6
Secondary level education: base case forecast for adult attainment, 89; base case forecast for education spending, 86; basic education, 5; enrollment rates in sub-Saharan Africa, 40(fig.); gender parity as MDG, 5; global enrollment compared to developing countries, 2; global enrollment rate expansion, 25; gross enrollment rates, 2000 and 2005, 29(fig.); ICT use, 167; IFs education model of intake and survival rates, 65; impact on fertility, 150–151; postprimary education goals, 5–6; pursuing gender parity in enrollment rates, 29; student flows and stocks, 17(fig.); sub-Saharan Africa’s enrollment gains, 41(fig.); years when target and “benchmark” regional enrollment rates are reached: normative scenario relative to base case, 134 (fig.). See also Basic education; Secondary level education, lower; Secondary level education, upper; Transition rate
Secondary level education, lower: balancing lower and upper secondary enrollment rates, 111–112, 111(fig.); base case forecast for low-enrollment countries, 82; basic education, 5; degree to which is compulsory, 23; duration, 22(table); enrollment rates outside sub-Saharan Africa, 41–43, 41(fig.); financial targets for public spending, 118; global advance of, 162; IFs base case forecast for enrollment, 79; lower secondary gross and primary net enrollment rates, 106–107, 106(fig.); per-student public spending, 114; public spending, 116; rationale for, 5
Secondary level education, upper: balancing lower and upper secondary enrollment rates, 111–112, 111(fig.); base case forecast for low-enrollment countries, 82; basic education, 5; degree to which is compulsory, 23; duration, 22(table); enrollment rates in Latin America and the Caribbean: normative scenario relative to base case, 132(fig.); financial targets for public spending, 118; normative scenario targeting change across, 106; public spending, 116; public spending per student as percentage of GDP per capita at PPP, 117(fig.); rationale for, 5; South and West Asia’s advance in the normative scenario, 129; uncertainty concerning global enrollment growth, 123
Sen, Amartya, 12, 57
Senegal: comparing forecasts of primary net enrollment rates in 2025, 93(table)
Shkolnikov, Vladimir, 160(n12)
Sierra Leone: gender parity ratio, 111; impact of education on fertility rates, 151
Social benefits of education: democratization, 155–156; economic productivity, growth, and development, 143–147; family size and workforce participation, 142; fertility rate decline, 150–152; forecasting and modeling approaches, 56; government effectiveness and corruption reduction, 157–158; health and mortality benefits, 152–154; IFs education model, 65; justifying increased domestic and international spending, 138–140; maximizing returns on incremental spending, 105; McMahon’s econometric interactive macrodynamic model, 71–72; population effects of fertility and mortality rates, 154–155; poverty reduction, 149–150; sociopolitical change, 155–159
Social exclusion: as barrier to participation in education, 13–14; dynamics of educational exclusion, 15(box); limiting education expansion, 27, 79; saturation effects slowing progress toward universal enrollment, 52
Social fairness and security, 57
Social purpose, education as expression of, 11–13
Socioeconomic conditions: enrollment rates by country income, level of education, and sex, 2(table)
Sociopolitical factors and consequences: democratization as benefit of education advance, 155–156; demographic and economic environments, 14; demographic transition shaping education progress, 33–34; education and sociopolitical change, 155–159; environmental quality, 158–159; human development–education linkages, 166; IFs sociopolitical model, 58-59, 68; Lesotho’s high enrollment, survival, and transition rates, 111; normative scenario of human development, 8, 105; relationships of sociopolitical variables with GDP per capita at PPP and education, 155(table); sociopolitical, demographic, and economic links to education, 11(fig.); sociopolitical context of education transition, 36–38; state failure, 158; turmoil causing slowing or reversal of education gains, 128–129. See also State stability/instability
Solon, Gary, 67
Somalia: gender parity ratio, 111; state instability leading to slowing or reversal of enrollment gains, 82
Soto, Marcelo, 23(n12), 48–49, 53(n26), 143
South and West Asia: aggregate impact of the normative scenario on economic well-being, 144–145; attainment differences between the normative scenario and the base case, 126(fig.); base case forecast for adult attainment, 89; base case forecast for gender parity, 85; cost-benefit comparison of the normative scenario with the base case, 145–146; decline of youth share in population, 165–166; distribution of female and male parity and gender gaps, 32(fig.); domestic funding sources, 138–139; enrollment analysis, 42; enrollment rate expansion, 25; enrollment rate forecasts in the normative scenario, 131(fig.);
VOL2_16 Index.indd 330 21/8/09 08:20:35

Index 331
forecasting economic growth, 97; forecasting population growth and fertility rate, 96–97; government effectiveness as benefit of education, 157; life expectancy, 153–154, 153(fig.); literacy in the adult population, 51; normative scenario enrollment rates, 123; normative scenario of education acceleration, 129–131; population effects of fertility and mortality rates, 154; poverty levels, 150; primary student headcount in the normative scenario, 126; private education, 46; public spending, 44, 118; pursuing gender parity in enrollment rates, 29; role of economic development in expanding participation, 35; spending bubbles in the normative scenario, 135; spread of reverse gender gaps, 162; state instability, 37–38; tertiary level public spending, 117; UPE target date, 133; years of education completed by adult populations, 49. See also Regional data; history and forecast for education progress, 91
Soysal, Yasemin, 103(n12)
Spending. See Public spending
Sperling, Gene, 5
S-shaped expectations for education’s advance, 56, 60, 74, 76 (n9), 92, 103(n11, n13)
State failure, 158, 159(fig.)
State stability/instability: extent of political instability in selected regions, 38(fig.); failed-state index, 158; gender gap and, 111; government effectiveness as benefit of education, 157–158; IFs sociopolitical model, 59; instability slowing or reversing education gains, 82, 128–129; Political Instability Task Force, 37–38; Polity Project data, 36; quality of education and, 120; relationships of sociopolitical variables with GDP per capita at PPP and education, 155(table); Transparency International project, 37
Stocks, 17, 17(fig.). See also Attainment
Student flows: base case forecast for education expansion, 79–81; complexity of student flow patterns, 17–19; entry and completion analysis,
74; IFs education model, 61–63; normative scenario, 113; uncertainties in forecasting, 96. See also Participation
Student headcount forecasts, 91–92, 123, 125(fig.), 125(table), 127
Sub-Saharan Africa: adult attainment in sub-Saharan African and DRC in 2060: normative scenario relative to base case, 130(fig.); advance of education, 162; aggregate impact of the normative scenario on economic well-being, 144–145; assessing quality of education, 108; attainment differences between the normative scenario and the base case, 126(fig.); base case forecast for adult attainment, 86–87, 89; base case forecast for education spending, 86; base case forecast for enrollment, 79; base case forecast for gender parity, 83, 85; child mortality rate, 35; comparing costs and benefits of the normative scenario with the base case, 145–146; decline of youth share in population, 165–166; democratization as effect of education, 156–157; demographic transition, 10; distribution of female and male gender parity and gaps, 32(fig.), 33; diversion of military funds, 147; domestic funding sources, 138–139; duration of primary and secondary education, 23; enrollment expansion since 1960, 27; enrollment patterns, 39–41; enrollment rates in the low primary enrollment countries: normative scenario relative to base case, 128(table); estimating break-even points of costs of accelerating education’s advance, 147; fertility rates, education and, 96–97, 151, 154–155; forecasting economic growth, 97; health spending, 138–139; history and forecast for education progress, 91–92; international funding, 140; literacy in the adult population, 51; normative scenario and 2015 UPE goal, 127–129; normative scenario enrollment rates, 123; per-student public spending, 118; population effects of fertility and mortality rates, 154–155; population growth and fertility rate forecasting, 96–97; poverty reduction, 149; primary net gender parity ratio: history and forecasts,
128(fig.); primary student headcount in the normative scenario, 126; public spending, 44; regional universal primary education goals, 3; spending bubbles in the normative scenario, 135; state instability, 37; tertiary level gross enrollment rate, 2; tertiary level public spending, 117; UPE target dates, 133; years of education completed by adult populations, 49. See also Regional data
Sudan: gender parity ratio, 111; similarities in primary net and secondary gross enrollment rates, 106, 106(fig.)
Supply side of educational resources: human development factors affecting, 13–14; IFs education model, 60(fig.), 61, 63–64, 68, 94. See also Resources
Survival rate: Burkina Faso, 94; data and information streams for setting targets, 109–113; defining, 18, 23(n9); gender balance, 33; IFs education model, 60–61, 64–67; increased intake/transition rates correlated with decreased survival rates, 107–108; intake and survival rate relationship with GDP per capita at PPP, 66, 66(fig.); as leverage point for normative scenario, 105–106; as measure of education quality, 108–109, 120; South and West Asia, 129, 131; target rate summary for the normative scenario, 113(table);
System dynamics, 17
Tan, Jee-Peng, 160(n5)
Tanzania: comparing forecasts of primary net enrollment rates in 2025, 93(table); lower secondary gross and primary net enrollment rates, 106, 106(fig.)
Teacher salaries: Burkina Faso, 115–116; correlating with GDP, 114
Technology, 154, 167–168
Temple, Jonathan, 143
Tertiary level education: base case forecast for adult attainment, 87, 89; base case forecast for education spending, 86; base case forecast for gender parity, 85; decline in public spending, 167; enrollment growth across
levels, 112; female gender gaps decreasing across levels, 112–113; financial targets for public spending, 119; global enrollment rates, 2, 25; history and forecast for education progress, 91–92; IFs education model, 63; India’s education strategy, 4; male gender gaps, 31–32, 52; normative scenario enrollment rates, 123; normative scenario targeting change across levels, 106; postprimary education goals, 5–6; public spending, 46, 116–118; public spending per student as percentage of GDP per capita at PPP, 117(fig.); pursuing gender parity in enrollment rates, 29; regional gross enrollment rates, 112(fig.); South and West Asia’s advance in the normative scenario, 129; student flows and stocks, 17(fig.); sub-Saharan Africa’s enrollment gains, 53(n13); uncertainty concerning global enrollment growth, 123
Threshold effects within and across education levels, 106–107
TIMSS (Trends in Math and Science Study) assessment, 109(box), 119, 120(table)
Togo: comparing forecasts of primary net enrollment rates in 2025, 93(table); gender parity ratio, 111; history and forecast of enrollment rates, 93
Transition between education levels: as point of leverage for normative scenario, 105–106; female gender gaps decreasing across levels, 112; gender parity and, 33; IFs education model, 61, 92(table); increased intake/transition rates correlated with lower survival rates, 107–108; interaction effects across levels, 106–107; student flow patterns, 18–19. See also Enrollment rates
Transition to widespread global participation in education: Clemen’s normative analysis of transition speeds, 73–74. See also Attainment; Mass education; Millennium Development Goals (MDGs); Participation
Transparency International, 37, 115–116, 158
Tuition fees, 45–47
VOL2_16 Index.indd 331 21/8/09 08:20:37

Patterns of Potential Human Progress Volume 2: Advancing Global Education332
Uganda: high intake/low survival rates, 107, 107(fig.); impact of education on fertility rates, 151; lower secondary gross and primary net enrollment rates, 106, 106(fig.)
ul Haq, Mahbub, 12
Uncertainties in forecasting, 96–101, 132
UNESCO Institute for Statistics (UIS): data modification for IFs model, 69–70; IFs and UNESCO enrollment and literacy forecasts, 89, 91–92, 95–96; IFs grade-flow model data, 62–63; regionalization of country-level data, 25(box); role in global monitoring and reporting, 3; student flow data, 19, 19(box)
UNICEF (United Nations International Children’s Emergency Fund), 72
United Nations. See also Headings beginning with Millennium
United Nations Development Program (UNDP), 150
United Nations Education, Scientific, and Cultural Organization (UNESCO), 3
United Nations Population Division, 151
United Nations Universal Declaration of Human Rights, 1, 11
United States: compulsory primary education, 11; decline in tertiary level public spending, 167; education-associated mortality, 148; health and mortality benefits of education, 152
Universal Basic and Secondary Education (UBASE) project, 5
Universal primary education (UPE): base case forecasts, 81; demography role in, 34; length of time to achieve, 27; “nearing universal enrollment,” 27, 81, 133; targeting countries with below 50 percent enrollment, 81–82; years when target and “benchmark” regional enrollment rates are reached: normative scenario relative to base case, 134 (fig.)
Unterhalter, Elaine, 52(n2)
Vandemoortele, Jan, 56, 72
Varle, Sarah, 151
Vocational and technical programs, 33
Walker, Melanie, 13
Wang, Jia, 160(n7)
Welzel, Christian, 156
Wildavsky, Aaron, 77(n)
Wils, Annababette, 24, 47, 52(n1), 53(n), 56, 74–76, 77(n30, n31, n32, n35), 92–93, 95, 103(n16, n17), 110
Wolfe, Barbara, 12
Women. See Gender
Woodhall, Maureen, 12, 160(n)
Woolf, S. H., 148
World Bank, 6, 73, 158
World Conference on Education for All, 3
World Education Forum (2000), 3
World Education Indicators (WEI) project, 7, 9(n15)
World Health Organization (WHO), 153
Years of education completed: adult populations, 48–49; correlating with economic productivity and growth, 144; gender parity and years of education, 51(fig.); government effectiveness as a function of, 158(fig.); impact on fertility rate, 151(fig.). See also Attainment
Yemen: gender parity ratio, 111
Youth bulge in the population, 154–155
Youth dependency ratio, 34–35, 35(fig.), 36, 40–41, 40(fig.), 142
Zambia: comparing forecasts of primary net enrollment rates in 2025, 93(table)
Zero population growth, 133
VOL2_16 Index.indd 332 21/8/09 08:20:38

Author Notes 333
Janet R. Dickson is a Research Associate at the Frederick S. Pardee Center for International Futures at the Josef Korbel School of International Studies, University of Denver. She has focused for many years on education research, analysis, and planning in a university setting, and has a particular interest in women’s education and advancement.
Barry B. Hughes is Johns Evans Professor at the Josef Korbel School of International Studies and Director of the Frederick S. Pardee Center for International Futures, University of Denver. He initiated and leads the development of the International Futures (IFs) forecasting system.
Mohammod T. Irfan is a Post-Doctoral Fellow at the Frederick S. Pardee Center for International Futures at the Josef Korbel School of International Studies, University of Denver. His research focus is on long-term computer simulation of education systems around the world.
Author Notes
VOL2_17 Authors.indd 333 21/8/09 08:19:30

VOL2_17 Authors.indd 334 21/8/09 08:19:31

PATTERNS OF POTENTIAL HUMAN PROGRESS
Paradigm Publishers3360 Mitchell Lane, Suite E Boulder, CO 80301 USAwww.paradigmpublishers.com
Oxford University Press India1 Jai Singh Road, Post Box 43New Delhi 110001 Indiawww.oup.co.in
ADVANCIN
G GLOBAL EDUCATION
PATTERNS OF POTENTIAL HUMAN PROGRESS VOLUME 2
ADVANCING GLOBAL EDUCATIONJanet R. Dickson, Barry B. Hughes, and Mohammod T. Irfan
“This look at the future—the potential for human progress—based on a massive collection of data and a rigorous projections model produces instructive scenarios of both likely and ideal trends in population, education fi nance, and education outcomes, including attainment and gender equity. This study can serve as a valuable guide for planning and policymaking in order to enhance the
benefi ts and avoid pitfalls of anticipated trends. The study makes a strong case that investment in education today will return positive economic and social benefi ts tomorrow.”
—Annababette Wils, Research Director, and George M. Ingram, Executive Director,
Education Policy and Data Center, Academy for Educational Development
“A beautiful blend of data presentation and analysis for planning educational growth and its potential consequences.”
—Henry M. Levin, William Heard Kilpatrick Professor of Economics and Education, Teachers College, Columbia University
and Past President of the Comparative and International Education Society
“This volume presents an insightful, in-depth analysis of the outlook for global education and the implications of a more highly educated population on society.
This provocative text is a must read for policymakers around the world.”
—Fred Swaniker, Founder and CEO, African Leadership Academy
Advancing Global Education is the second in a series of volumes that explores prospects for human development—how development appears to be unfolding globally and locally, how we would like it to evolve, and how better to assure that we move it in desired directions.
The fi rst volume addressed the reduction of global poverty. Questions that this volume addresses include:
• How rapidly are education enrollments and adult attainment levels advancing around the world?• Which countries will hit the goal of universal primary education by 2015 and, for those that miss, when might they reach it?
• How rapidly can countries realistically expect to reach the next big goal of universal lower secondary education?• What are the fi nancial costs of accelerating progress in enrollment and attainment, and do expected benefi ts ultimately exceed those costs?
Barry B. Hughes, series editor, is Director of the Frederick S. Pardee Center for International Futures and Professor at the University of Denver’s Josef Korbel School of International Studies. He is coauthor of numerous books and founder of
the International Futures computer model accessible at www.ifs.du.edu.
Volume 1 in the series has received an “Essential” CHOICE review.
Frederick S. Pardee Center for International FuturesJosef Korbel School of International StudiesUniversity of Denverwww.ifs.du.edu
PATTERNS OF POTENTIAL HUMAN PROGRESS BARRY B. HUGHES, SERIES EDITOR
VOLUME 2: ADVANCING GLOBAL EDUCATION
COVER ART COURTESY OF MARGARET LAWLESS
Janet R. DicksonBarry B. HughesMohammod T. Irfan
EDUCATION • POLITICS CURRENT AFFAIRS ADVANCING GLOBAL EDUCATION
VOLUME 2
PARADIGM
PARADIGMPRINTED IN CANADA
VOL2_00 PPHP RGP cover.indd 1 21/8/09 16:18:34