the future of preserved farmland: ownership succession in
TRANSCRIPT

Journal of Agriculture, Food Systems, and Community Development ISSN: 2152-0801 online www.AgDevJournal.com
Volume 5, Issue 2 / Winter 2014–2015 129
The future of preserved farmland: Ownership succession in three mid-Atlantic states Brian J. Schilling a * Rutgers University, Department of Agricultural, Food and Resource Economics
J. Dixon Esseks b University of Nebraska-Lincoln, Center for Great Plains Studies
Joshua M. Duke c University of Delaware, Department of Applied Economics and Statistics
Paul D. Gottlieb d Rutgers University, Department of Agricultural, Food and Resource Economics
Lori Lynch e University of Maryland, Department of Agricultural and Resource Economics
Submitted June 2, 2014 / Revised August 29, October 24, and November 3, 2014 / Accepted December 18, 2014 / Published online February 24, 2015
Citation: Schilling, B. J., Esseks, J. D., Duke, J. M., Gottlieb, P. D., & Lynch, L. (2015). The future of preserved farmland: Ownership succession in three mid-Atlantic states. Journal of Agriculture, Food Systems, and Community Development, 5(2), 129–153. http://dx.doi.org/10.5304/jafscd.2015.052.008
Copyright © 2015 by New Leaf Associates, Inc.
“Our whole family is involved with our farm, including a son in college who is majoring in agriculture. They [the family heirs] who own it will farm it.” (farm owner and operator in New Jersey)
“My biggest worry now is that I don’t know what my son will do with the land. He might farm it or might lease it out…” (Maryland farmer-owner nearing retirement)
“My kids are not interested. I’d like to sell the
farm to someone local who will appreciate the [renovated farm] buildings for what they are. It will be the highest bidder, unless there is a reason for someone else to have it.” (owner of a preserved Maryland farm)
Abstract This paper examines the uses and succession of farmland preserved under state-sponsored pur-
a * Corresponding author: Brian J. Schilling, Department of Agricultural, Food and Resource Economics, 108 Cook Office Building; Rutgers University; New Brunswick, New Jersey 08901 USA; +1-848-932-9127; [email protected]
b Center for Great Plains Studies, Q Street; University of Nebraska-Lincoln; Lincoln, Nebraska 68508 USA; +1-402-472-3082; [email protected]
c Department of Applied Economics and Statistics, 205 Townsend Hall; University of Delaware; Newark, Delaware 19717 USA; +1-302-831-1309; [email protected]
d Department of Agricultural, Food and Resource Economics, 103 Cook Office Building, Rutgers University, New Brunswick, New Jersey 08901 USA; +1-848-932-9122; [email protected]
e 2117 Symons Hall, Department of Agricultural and Resource Economics, University of Maryland, College Park, Maryland 20742 USA; +1-301-405-1264; [email protected]
Author note This research was supported by a grant from the Agriculture and Food Research Initiative (Competitive Grant No. 2010-85211-20515) from the USDA National Institute of Food and Agriculture.

Journal of Agriculture, Food Systems, and Community Development ISSN: 2152-0801 online
www.AgDevJournal.com
130 Volume 5, Issue 2 / Winter 2014–2015
chase of agricultural conservation easements (PACE) programs in Delaware, Maryland, and New Jersey. Preservation programs in these states have been operating long enough to observe and assess actual transfers of preserved farmland ownership over time. The analysis is based on a survey of 507 owners of preserved agricultural land. Nearly one-third of surveyed preserved-farmland owners had purchased or inherited properties under already existing conservation easements. These individuals (“second-generation” owners) are contrasted from “first-generation” owners, people who sold or donated their land’s development rights. Descriptive and regression analysis is used to compare these two generations of owners on aspects of their preserved land’s management that administrators and other stakeholders of farmland preservation programs have regarded as important. Specifically examined is (1) the percentage of the protected land that is actively farmed, rather than being idle or used solely for residential enjoyment; (2) the proportion of owners of preserved land who were “young farmers” when they first ac-quired preserved farmland; and (3) the percentage of owners who have succession plans to transfer land to a farmer expected to use the preserved land for agricultural production. Results provide opti-mism that deed-restricted farmland is not being diverted from agricultural use through succession in ownership.
Keywords preserved farmland, ownership succession, policy evaluation, young farmers
Introduction The intergenerational transfer of farm assets is an important challenge facing the American farm sector. Farm real estate is the largest asset class, accounting for 84% of all farm assets according to Nickerson, Morehart, Kuethe, Beckman, Ifft, and Williams (2012), and farmer demographics suggest that farmland ownership transitions will accelerate in coming years. The 2012 Census of Agriculture found that roughly 289 million acres (117 million hectares) of agricultural land, 31.6% of all of the nation’s land in farms, were owned or rented by
operators at least 65 years old (USDA-NASS, 2014). As the current generation of farmers advances toward its retirement years, to whom will their land be transferred? Will it be farmed? Regarding the 2.4 million acres (1.0 million ha) of American farmland that have been protected from development through land conservation easements acquired by state-sponsored farmland preservation programs, these questions have special relevance to the taxpayers who paid for the easements or the owners who donated them. Will land conserved so that it could raise food and other agricultural prod-ucts cease to be farmed because the new owners prefer to use only its scenic or recreational ameni-ties (Bastian, McLeod, Germino, Reiners, & Blasko, 2002), or because they lack the economic incen-tives to farm it or rent it out? For many farm families both questions are met with uncertainty and angst, as reflected in two of the quotations at the opening of this article. Unlike the New Jersey owner who has his family succes-sion plans in place, an elderly farmer of preserved land in Maryland expresses as his “biggest worry” the uncertainty over his son’s intentions for the land currently being farmed. Another owner of preserved Maryland farmland laments the lack of a family heir who will continue his farming legacy and capitalize on the investments made to improve the operation. In addition to the cessation of a family legacy on the lands, there is concern that accumulated knowledge of the land and its agricul-tural capabilities will not be fully understood or appreciated by subsequent owners. The lack of interest shown by these owners’ children is understandable. Farming is a challenging occupation, fraught with economic perils stemming from market dynamics increasingly shaped at a global level, rising production costs, and the ines-capable vicissitudes of nature (Dimitri, Effland, & Conklin, 2005). Urban expansion and exurban development patterns bring prospects of significant economic gain to farmland owners considering the sale of their land holdings. Younger individuals in farm households may look over the proverbial fence and wonder whether nonfarm jobs hold promises of a better future. At the same time, the value Americans place on farming and farmland resources is evident.

Journal of Agriculture, Food Systems, and Community Development ISSN: 2152-0801 online www.AgDevJournal.com
Volume 5, Issue 2 / Winter 2014–2015 131
Extensive academic research has documented the importance the public places on—and their willing-ness to fund—the retention of farmland and asso-ciated amenities (for a review see Bergstrom & Ready, 2009). Consequently, the U.S. has a large and growing acreage of farm and ranch land that is protected from nonagricultural development by conservation easements sold or donated by landowners to either a conservation organization (e.g., land trust) or government entity.1 The latter is the focus of this paper. Twenty-eight states have authorized purchase of agricultural conservation easements (PACE) programs to protect farmland resources from nonagricultural development.2 Enrollment in these state-sponsored programs has risen sharply since early 2000, when the total farmland acreage preserved under state PACE programs was roughly 620,000 acres (251,000 ha) (Bowers, 2000). By early 2005, the total was 1.1 million acres (0.45 million ha) (Bowers, 2005) and by January 2013 it had grown to 2.37 million acres (0.96 million ha), preserved at a public expense of at least US$5.97 billion (American Farmland Trust [AFT], 2013). The most aggressive farmland preservation activity is concentrated in states in the mid-Atlantic and northeast regions. This paper explores issues of farm succession in three leading agricultural preservation states through a survey of 507 owners of farmland pro-tected by conservation easements held by a state program. Enrollment statistics show that, as of 2012, the states with the highest percentages of total farmland under conservation easements were New Jersey (28%), Delaware (21%), and Maryland (18%) (AFT, 2014; Delaware Agricultural Land
1 These lands have been preserved in perpetuity (or, in some cases, a specified term) to ensure their continued availability for farming. The basic mechanism is the severance of develop-ment rights through the establishment of a conservation ease-ment, a legally binding agreement between a landowner and a land conservation organization that prohibits nonagricultural development on the property. In exchange, the landowner receives compensation in the form of an easement payment or tax benefit if there has been a donation of land value. 2 Some farmland preservation programs use the term “purchase of development rights” (PDR) to describe their activities. In this paper, we use the term PACE or, more generally, conservation easements.
Preservation Foundation, 2013; State Agricultural Development Committee, 2013). Collectively, these states have preserved over 672,000 acres (272,000 ha) within a region largely characterized as “urban influenced” (USDA, 2013). Maryland’s primary farmland preservation program acquired its first conservation easement in 1980, while its counterparts in New Jersey and Delaware started preserving land in 1985 and 1996, respectively. The maturity of these programs allows observation and assessment of the transfers in ownership of preserved farmland over time. When our interviews were conducted (July 2011 to January 2012), preservation programs in these states had been operating long enough that nearly one-third (31.4%) of the surveyed owners of preserved farmland had purchased or inherited properties already under conservation easements. In this study, we call them “second-generation owners.” These individuals are contrasted with “first-generation” owners, people who sold or donated their land’s development rights. The significant numbers of respondents who are exclusively first-generation or second-genera-tion owners in our sample (346 and 113, respec-tively)3 allow us to compare the two generations of owners and test causal hypotheses about how they have managed their protected land. Guiding our choices of hypotheses were statements by leaders and other stakeholders of the preservation pro-grams concerning three desired aspects of the long-term management of protected land: (1) that it continue to be actively farmed, (2) that “young farmers” be able to own preserved farmland, and (3) that current owners plan for the transfer of ownership to another farmer after they retire or die. For these three desired outcomes we use regression analysis to test for differences attributable to owner’s generation, occupation, and other surveyed traits.
3 The exclusively first-generation owners sold or donated easements, but did not also purchase or inherit land already under easements (hereafter referred to as “first-generation owners” for simplicity). Exclusively second-generation owners bought or inherited eased land, but did not in addition sell or donate easements. The terms “second-generation owner” and “later-generation owner” are used interchangeably to refer to these individuals.

Journal of Agriculture, Food Systems, and Community Development ISSN: 2152-0801 online
www.AgDevJournal.com
132 Volume 5, Issue 2 / Winter 2014–2015
A Brief Background on Farmland Preservation Farming at the fringe of urban areas is often viewed through a fatalistic lens, framed by expec-tations of declining agricultural support infrastruc-ture, more numerous conflicts with nonfarmer neighbors, and heightened competition for increasingly scarce, fragmented, and expensive farmland (Berry, 1978; Daniels & Bowers, 1997; Lopez, Adelaja & Andrews, 1988). This cycle of agricultural decline culminates with the conversion of farmland to nonagricultural “highest-and-best” developed uses. The USDA National Resources Inventory found that between 1982 and 2007, 14 million acres (5.7 million ha) of farmland and ranchland were lost to development across the United States (USDA NRCS, 2009). Roughly 38% of the area converted between 1982 and 2007 was classified as prime farmland (AFT, 2014). State and local governments have responded to farmland loss by developing a number of retention mechanisms, including differential tax assessment policies, right-to-farm laws, and agricultural zoning, that, while effective in supporting agricultural operations, do not afford permanent land protec-tions (Daniels & Bowers, 1997). In contrast, agri-cultural conservation easement programs retire development rights and usually aim to ensure that enrolled properties will be available for farming in perpetuity. While costly to implement, these pro-grams are also popular because landowner partici-pation is voluntary and compensated (through an easement payment or tax deduction), thus avoiding potential “takings” concerns that may accompany regulatory-based land use controls (Liu & Lynch, 2011a). Farmland preservation programs have attracted considerable academic attention over the past few decades. The economic rationale and the measurement of public preferences for farmland preservation have been particularly well studied (Bergstrom & Ready, 2009; Bromley & Hodge, 1990; Duke & Ilvento, 2004; Gardner 1977; Hellerstein et al., 2005; Kline & Wichelns, 1996; Nickerson & Hellerstein, 2003). Liu and Lynch (2011b) evaluated whether farmland preservation programs affect the rate of farmland conversion to nonagricultural uses. Several studies have examined
the effects of easement restrictions on preserved farmland value, yielding mixed findings as to whether conservation easements reduce farmland values (Anderson & Weinhold, 2008; Lynch, Gray, & Geoghegan, 2007; Nickerson & Lynch, 2001). In similar research, Schilling, Sullivan, and Duke (2013) have examined the impact of residual devel-opment opportunities written into New Jersey’s deeds of easement on the market value of pre-served farmland. Schilling, Attavanich, Sullivan, and Marxen (2014) estimate the extent and distri-bution of farm profitability impacts of PDR participation. Postpreservation behaviors of farmland owners who have sold or donated development rights, or acquired deed-restricted farmland through purchase or inheritance, have been less comprehensively examined. A few studies examine how owners of preserved farmland have used the money received from their sales of easements (Duke & Invento, 2004; Lynch 2007; Lynch & Duke, 2007). Two extensive studies of owners of land which was preserved, at least in part, under the federal Farm and Ranch Lands Protection Program were published in 2006 and 2013 (Esseks, Nelson & Stroe, 2006; Esseks & Schilling, 2013). Both examined the attributes of landowners and the uses of protected lands.
Research Methods The study team developed a computer-assisted telephone interview (CATI) survey instrument, using suggestions from senior staff of the five state-level preservation programs in Delaware, Maryland, and New Jersey, administrators of several prominent county-level programs in the region, and individual owners across the three states who agreed to open-ended interviews. The survey was pretested with owners of preserved farmland in the study area and approved by the institutional review boards at Rutgers University and the University of Nebraska–Lincoln. The sampling pools for this study consisted of owners of farmland preserved under the Delaware Agricultural Land Preservation Foundation (DALPF), Maryland Agricultural Land Preserva-tion Foundation (MALPF), Maryland Environ-mental Trust (MET), Maryland Rural Legacy

Journal of Agriculture, Food Systems, and Community Development ISSN: 2152-0801 online www.AgDevJournal.com
Volume 5, Issue 2 / Winter 2014–2015 133
Program (MRLP), and New Jersey Farmland Preservation Program (NJFPP). We chose these five programs because they operate at the state level, rather than being limited to one county or region of their state, and because they are either the sole statewide program (as in Delaware and New Jersey), or they have made significant contributions to their states’ total farmland under conservation easements. It is important to note that MET and MRLP have goals that extend beyond preserving land for agricultural use; i.e., in MET’s case, pro-tecting lands with historical, environmental, or scenic importance, and for MRLP, preserving forestland. MET also differs from the other pro-grams because it relies primarily on donations of easements, while the others purchase conservation easements from willing landowners. Stakeholder interviews conducted prior to the initiation of this study and reviews of Maryland’s county land preservation programs, however, indicated that the MET and MRLP programs are important parts of the state’s approach to farmland preservation. To develop the sampling frames from which to draw random samples from the Delaware, New Jersey, and MALPF programs, the authors com-piled lists of all easements that the programs held as of early 2011. For the two other Maryland programs, MET and MRLP, which protect types of natural resources (e.g., forestland and shorelines) in addition to farmland, we enlisted the help of program staff to identify the protected properties that had at least 10 acres (4 ha) of agricultural land as of the time of the easement’s closing. Since our unit of analysis was the owner of preserved land in a program, members of the research team removed duplicate cases from within and across programs.
A simple random sample was then drawn for every program, with the size of each sample being proportional to its program’s share of the 5,319 total owners across the five sampling frames. The University of Nebraska–Lincoln’s Bureau of Sociological Research conducted the survey’s telephone interviews from mid-July 2011 to Janu-ary 15, 2012. A total of 507 interviews were com-pleted. All 507 interviewed owners answered “yes” to an introductory eligibility question about whether at the end of 2010 they owned “any farmland in [the particular state] for which all or some of its development rights had been sold or donated to a farmland preservation program.” The interviews lasted an average of 31.7 minutes. As shown in Table 1, each program’s share of the 507 completed interviews was close—within 0.2 to 2.6 percentage points—to its proportion of the sampling frame. Samplewide statistical analysis used weightings that adjusted for those differences. Applying guidelines developed by the American Association for Public Opinion Research, we calculated the response rate to be 53.8% (AAPOR, 2012). This rate is high compared to many other surveys conducted in the same period (Pew Research Center for the People & the Press, 2012). While point estimates of individual variables may suffer from nonresponse bias if individuals who respond to a survey systematically differ from those who do not, Dey (1997) finds that relation-ships between variables tend not to be biased. Therefore, in the “Results” section, we emphasize regression findings about relationships such as between an owner’s generation and how he or she managed the protected land.
Table 1. Composition of Sampling Frame and Study Sample
Sampling Frame Sample
Easement Program
No. ofLandowners % of Total
No. of Landowners % of Total
Delaware Agricultural Land Preservation Foundation 627 11.8 59 11.6
Maryland Agricultural Land Preservation Foundation 1,754 33.0 155 30.6
Maryland Environmental Trust 630 11.8 73 14.4
Maryland Rural Legacy Program 374 7.0 29 5.7
New Jersey Farmland Preservation Program 1,934 36.4 191 37.7
Totals 5,319 100.0 507 100.0

Journal of Agriculture, Food Systems, and Community Development ISSN: 2152-0801 online
www.AgDevJournal.com
134 Volume 5, Issue 2 / Winter 2014–2015
Overview of Programs in the Study MALPF, the oldest of the five programs examined, had by June 30, 2013, acquired a cumulative total of 2,102 easements amounting to 285,902 acres (446.7 square miles or 115,700 ha) protected (MALPF, n.d.). MET does not purchase ease-ments, but accepts ones that are donated and holds them in exchange for agreeing to monitor regularly how the land is used in order to ensure compliance with the easements’ terms (Maryland Department of Natural Resources [MDNR], n.d.).4 Although MET focuses on several types of environmentally important land in addition to farmland, protecting the latter has been one of its goals (Maryland Environmental Trust, 2013), and county agricultural land preservation programs in Maryland have regarded it as a significant partner.5 According to data provided by MET staff, the trust held in early 2011 a total of 630 properties under easements with at least 10 acres (4 ha) of agricultural land as of the time they were enrolled. In our final sample of 73 interviewed MET own-ers, their average number of easement acres in a farming operation in 2010 was 97.7 (39.5 ha) and the median was 35 acres (14 ha). The third Maryland program under study, the MRLP, was authorized in 1997 and provides “grants to local governments and land trusts for preservation of forest and farmland across Mary-land” (MDNR, 2009, para. 1). Through early 2013, MRLP had agricultural conservation easements on 532 properties totaling 76,146 acres (30,815 ha) of land (AFT, 2013). As with the MET data, we limited our sample to properties with at least 10 acres (4 ha) of agricultural land at the time the conservation easements were conveyed. In our sample of 29 interviewed MRLP owners, their eased acres in a farm operation during 2010 aver-
4 Nearly 29% of MET cases in our sample reported having sold easements. In the 1990s and 2000s, some of the easements currently held by MET were purchased by the Maryland Department of Natural Resources and Maryland Department of Transportation under special programs such as to protect Rural Legacy Areas and Civil War sites (Maryland Environmental Trust, 2013). 5 See, for examples, the websites of the Baltimore, Calvert, Carroll, Harford, Montgomery, and Washington County governments in Maryland.
aged 175.3 acres (70.9 ha) and the median was 80 acres (32 ha). The New Jersey agricultural conservation easement program was created in 1983 and con-tracted its first easement in 1985. By July 23, 2013, its easements were protecting a total of 2,183 agri-cultural properties, covering 204,452 acres (319.5 square miles or 82,739 ha) (SADC, 2013b). Dela-ware’s program was authorized by state legislation in 1991. As of August 13, 2013, it was protecting 711 agricultural properties with a total of 106,473 acres (166.4 square miles or 43,088 ha) (DALPF, 2013).
Results Results are presented in three sections. First examined is the use of farmland under conserva-tion easements for agricultural production. This is followed by an analysis of access to preserved farmland by young farmers. We conclude with a summary of owners’ reported plans for the future ownership and use of their deed-restricted properties.
Is Preserved Farmland Being Used in Active Agriculture? During the formative stages of this survey project, program administrators and advocates for farmland preservation expressed interest in understanding the uses of farmland under their program ease-ments. The easements do not require that the pro-tected properties be farmed, only that they remain farmable; that is, not converted to buildings, park-ing lots, other impervious surfaces, or to dumping grounds for materials like trash or gravel.6 How-ever, some program goal statements explicitly call for active farming of the land. One of the NJFPP’s main publicized goals is that protected land
6 A sample deed of easement for the New Jersey Farmland Preservation Program is available online at http://www.nj. gov/agriculture/sadc/farmpreserve/resources/DOEtownship-ownedtosadcwithexception.pdf (retrieved August 21, 2013). See also sample deeds of easement provided by the Maryland Agricultural Land Preservation Foundation: http://www. malpf.info/laws.html (retrieved August 21, 2013), and one for the Delaware Agricultural Land Preservation Foundation: http://www.farmlandinfo.org/documents/30749/DE_sample_easement_app.pdf (retrieved August 21, 2013).
Journal of Agriculture, Food Systems, and Community Development ISSN: 2152-0801 online www.AgDevJournal.com
Volume 5, Issue 2 / Winter 2014–2015 135
“provides us with an abundance of locally grown farm products [emphasis added]” (SADC, 2013a, para. 14). Among the goals of Maryland’s largest state-operated program (MALPF) is to “preserve pro-ductive farmland and woodland for the continued production of food and fiber [emphasis added] for all of Maryland’s citizens” (Maryland Department of Agriculture, n.d., bullet 1). The legislation establish-ing Delaware’s state-level program (DALPF) included the statement, “Preservation of the State’s farmlands and forestlands is considered essential to maintaining agriculture as a viable industry [emphasis added] and important contributor to Delaware’s economy” (Delaware Agricultural Lands Preservation Act of 1981, para. 1). Of course, some preserved acres may be too steep, wet, or otherwise unsuitable for farming. Another reason for not farming eased land is when owners prefer to use some or all of it for recrea-tional purposes and/or for an “estate” lifestyle (SADC, n.d.). While program managers might be able to exclude minimally farmed lands from their purchases of easements, they tend not to have formal roles in deciding who receives ownership of land already preserved, such as through a sale, gift, or inheritance.7 7 Exceptions include where the easements give the program (1) the first right of refusal (Vermont Land Trust, n.d.), and/or (2) the option to purchase the land at agricultural value rather than to permit a sale to someone lacking experience in agricul-ture or a “farm plan for immediate and future agricultural use of the APR Parcel” (Massachusetts Agricultural Preservation Restriction Program, 2009, § 22.10(1)).
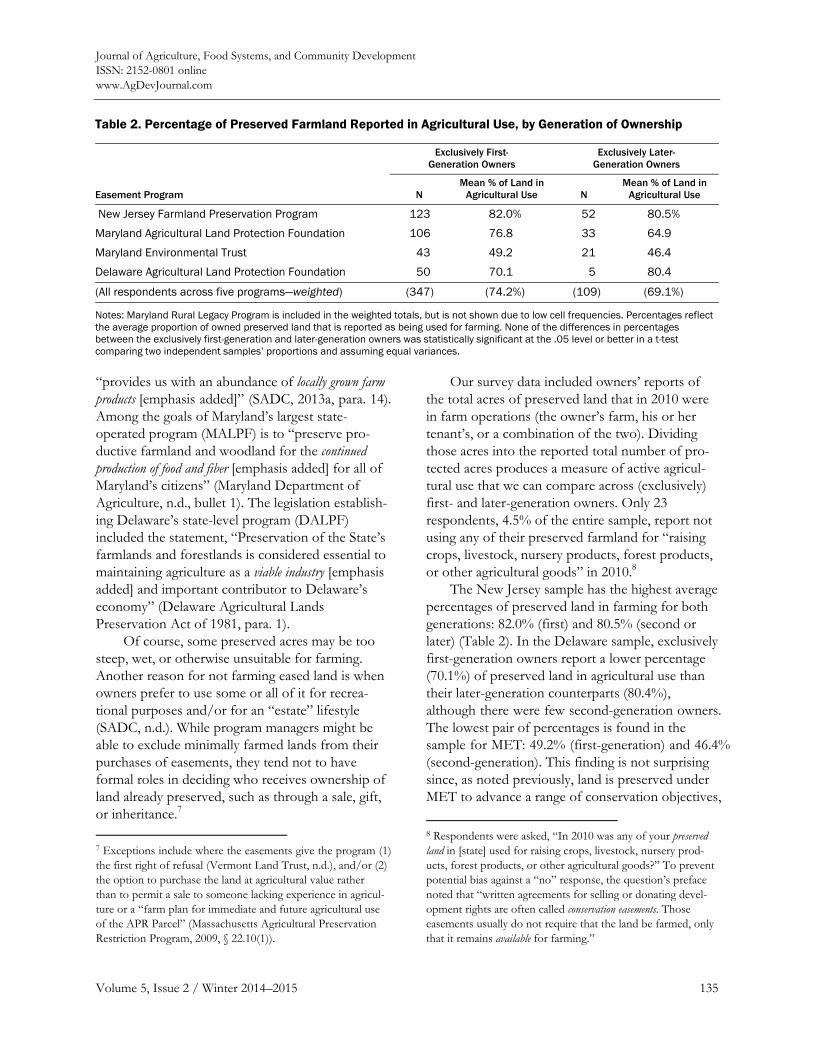
Our survey data included owners’ reports of the total acres of preserved land that in 2010 were in farm operations (the owner’s farm, his or her tenant’s, or a combination of the two). Dividing those acres into the reported total number of pro-tected acres produces a measure of active agricul-tural use that we can compare across (exclusively) first- and later-generation owners. Only 23 respondents, 4.5% of the entire sample, report not using any of their preserved farmland for “raising crops, livestock, nursery products, forest products, or other agricultural goods” in 2010.8 The New Jersey sample has the highest average percentages of preserved land in farming for both generations: 82.0% (first) and 80.5% (second or later) (Table 2). In the Delaware sample, exclusively first-generation owners report a lower percentage (70.1%) of preserved land in agricultural use than their later-generation counterparts (80.4%), although there were few second-generation owners. The lowest pair of percentages is found in the sample for MET: 49.2% (first-generation) and 46.4% (second-generation). This finding is not surprising since, as noted previously, land is preserved under MET to advance a range of conservation objectives,
8 Respondents were asked, “In 2010 was any of your preserved land in [state] used for raising crops, livestock, nursery prod-ucts, forest products, or other agricultural goods?” To prevent potential bias against a “no” response, the question’s preface noted that “written agreements for selling or donating devel-opment rights are often called conservation easements. Those easements usually do not require that the land be farmed, only that it remains available for farming.”
Table 2. Percentage of Preserved Farmland Reported in Agricultural Use, by Generation of Ownership
Exclusively First-
Generation Owners Exclusively Later-
Generation Owners
Easement Program N
Mean % of Land in Agricultural Use
N
Mean % of Land in Agricultural Use
New Jersey Farmland Preservation Program 123 82.0% 52 80.5%
Maryland Agricultural Land Protection Foundation 106 76.8 33 64.9
Maryland Environmental Trust 43 49.2 21 46.4
Delaware Agricultural Land Protection Foundation 50 70.1 5 80.4
(All respondents across five programs—weighted) (347) (74.2%) (109) (69.1%)
Notes: Maryland Rural Legacy Program is included in the weighted totals, but is not shown due to low cell frequencies. Percentages reflect the average proportion of owned preserved land that is reported as being used for farming. None of the differences in percentages between the exclusively first-generation and later-generation owners was statistically significant at the .05 level or better in a t-test comparing two independent samples’ proportions and assuming equal variances.

Journal of Agriculture, Food Systems, and Community Development ISSN: 2152-0801 online
www.AgDevJournal.com
136 Volume 5, Issue 2 / Winter 2014–2015
only one of which is the retention of land for active agricultural use. In addition, the lower commitment of preserved land to farm use among MET land-owners may reflect a selection effect; owners who have greater interest in using their land for agricul-tural production may favor the MALPF program since its primary focus is on agricultural land reten-tion.9 Furthermore, MALPF program staff may encourage owners of lands in active agricultural use to convey conservation easements. It is also con-ceivable that a selection effect may be present, because some owners of Maryland farmland may favor the MALPF or Rural Legacy programs over MET because they provide a capital infusion (an easement payment) that may be used to invest in the farm operation or to satisfy other immediate financial needs. Cases for the Maryland Rural Leg-acy program are not presented in Table 2 because there is only a single later-generation owner in the sample. The weighted percentages for all 507 respondents are 74.2% (first-generation) and 69.1% (later-generation) of preserved land in farming. While the differences (per program and for all respondents) in the percentages reported by first-generation and later-generation owners range from
9 The authors thank an anonymous reviewer for this observation.
10.3 to 11.9 percentage points, none is statistically significant at the .05 level or better. Therefore, Table 2 does not provide definitive evidence that the transfer of ownership to a second or later generation of owners led to less farming of preserved land. Given the likelihood that some surveyed owners (particularly non-operator owners) did not remember or ever know the exact disposition of preserved acres in the production year (2010) pre-vious to their interviews, we tested the genera-tional-differences hypothesis by using two less-precise measures: the percentages of surveyed owners reporting (1) at least three- quarters of their preserved acres being in either their own farming operations and/or those of their tenants, and (2) 100% of their land devoted to farming. Again, the differences are not statistically significant (Table 3), except in the first of the two comparisons for MALPF owners. A substantially higher proportion of first-generation owners report having at least 75% of their preserved land in agriculture, as compared to later-generation owners (65.1% versus 45.5%). With that 19.6-point exception and a statistically insignificant 15.8-point difference in MALPF’s second entry for that table, the percentage differences are relatively small, varying from 3.9 to
Table 3. Percentages of Owners Reporting at Least 75% and 100% of Their Preserved Land in Farming Operations, by Generation of Ownership
At Least 75% of Land is Farmed
100% of Land is Farmed
Easement Program
Exclusively First Generation
Exclusively Later Generation
Exclusively First Generation
ExclusivelyLater Generation
New Jersey Farmland Preservation Program 73.2%
(n=123) 69.2% (n=52)
58.5% (n=123)
57.7% (n=52)
Maryland Agricultural Land Protection Foundation 65.1 a
(n=106) 45.5 a (n=33)
49.1 (n=106)
33.3 (n=33)
Maryland Environmental Trust 37.2
(n=43) 33.3
(n=21) 25.6
(n=43) 23.8
(n=21)
Delaware Agricultural Land Protection Foundation 56.0
(n=50) 60.0 (n=5)
50.0 (n=50)
40.0 (n=5)
All five programs (weighted) 62.9%(n=348)
54.5%(n=110)
49.9% (n=347)
43.1%(n=109)
Notes: Maryland Rural Legacy Program is included in the weighted totals, but is not shown due to low cell frequencies. a Difference is statistically significant at the .044 level in a two-sided Pearson Chi-Square test.
Journal of Agriculture, Food Systems, and Community Development ISSN: 2152-0801 online www.AgDevJournal.com
Volume 5, Issue 2 / Winter 2014–2015 137
8.4 points.10 The proportions of land committed to agricultural use by MET owners are again substan-tially lower than those reported by owners with easements held by the other land preservation programs, paralleling findings reported in Table 2. Two types of multivariate analysis were used to test if owner generation has significant effects that are not observable in these cross-tabulations invol-ving just two variables. With both ordinary least squares (OLS) and binary logistic (BL) regressions, we hypothesized that, compared to later-generation owners, first-generation owners were likely to report higher percentages of their preserved land being in farming operations in 2010, controlling for other plausible causal conditions.11 In neither the OLS nor the BL regressions was the generation variable (defined as 0 for first generation and 1 for later generation) a statistically significant predictor. Therefore, we tested other variables related to being a first- or later-generation owner. One that proved statistically significant in both types of regressions is whether the owner had only sold an easement; that is, the owner did not also donate an easement or purchase or inherit preserved land (full model results are provided in Appendix Table A1). Nearly all (93.4%) of the 346 exclusively first-generation owners fit that descrip-tion. According to the BL regression, being that kind of easement seller increases the odds of having at least three-quarters of one’s preserved land in a farm operation by a factor of 2.123 (or by 123%), with other predictor variables held con-stant.12 The OLS regression has similar findings.
10 Both here and in the remainder of the paper, we report a percentage-point difference or a regression coefficient to be statistically significant when there was no more than a five in 100 chance that the difference or coefficient value was due to chance factors alone (p<.05). 11 For the OLS analysis, the outcome variable was interval-level, from 0.0 to 100%, while for the binary logistic regressions the outcome variable was “1” = 75% or more of the preserved land in the owner’s and/or a tenant’s operations, and “0” = less than 75%. 12 The value, 2.123 is this first predictor’s “odds ratio.” It represents the change (by multiplication) in the estimated odds of an owner reporting three-quarters or more of his or her preserved acres being in a farming operation that is attribut-able to a one-unit increase in the predictor (from 0=did not sell an easement to 1=did sell), with all other predictors held
Compared to other surveyed owners, those that only sold agricultural conservation easements tend to have higher percentages of their preserved acres in farming operations, by an estimated average of 6.2 percentage points (Table A1). One plausible explanation for this observation is that the application process for selling easements likely yielded information on the land’s current agricultural uses, such as acres of crops planted, pasture area, and land devoted to orchards (see, for example, MALPF, 2012). When the farmland pre-servation programs we studied were buying ease-ments, perhaps they gave at least some preference to sellers who offered land that was then being entirely or almost completely farmed. Another statistically significant and substan-tively important predictor of the percentage of conserved land being farmed is when the respond-ent operates (i.e., makes day-to-day management decisions) at least some of that land.13 In both the OLS and BL regressions, the coefficients for the operator variable are larger than those for all other binary variables in the model (Table A1). Indivi-duals for whom farming is a primary occupation (i.e., at least 50% of the respondent’s work time is allocated to farming) also commit a larger percen-tage of their preserved landholdings to farm pro-duction. Intuitively, many farm operators would seem to have a business interest in maximizing the agricultural use of their preserved land, and that incentive tends to be stronger among respondents whose primary occupation is farming. Among the 289 surveyed owners who operate at least some of their preserved land, 67.4% report three-quarters or more of their eased acres to be in a farming operation. Among the 156 whose primary occupa-tion is farming, the same measure increases to 78.6%. Other significant predictors of the amount of preserved land devoted to farming include enroll-
constant; see Menard (2002). The odds of such an outcome would be the probability of that outcome divided by 1 minus that probability. 13 The percentages of owners that are also operators are as follows: NJFPP: 61.8%; MALPF: 61.3%; MET: 32.9%; MRLP: 69%; DALPF: 49.2%. The relatively low percentage of MET owners who report themselves as farm operators may be evidence of the selection effect discussed earlier.

Journal of Agriculture, Food Systems, and Community Development ISSN: 2152-0801 online
www.AgDevJournal.com
138 Volume 5, Issue 2 / Winter 2014–2015
ment in the New Jersey program or MET. The former program is associated with higher percen-tages of total enrolled land being in farming opera-tions, while the OLS regression estimated that lower percentages of properties preserved under MET would be in farming. The latter difference may be due to MET’s preservation program extending to several types of environmentally important land in addition to farmland, and to the previously discussed selection issues arising from landowners having a choice among three Maryland state-sponsored preservation programs. For example, during 2013 MET received a total of 25 easements that “protected 2.8 miles (4.5 km) of Scenic Byway; 921 acres (373 ha) of forest; 892 acres (361 ha) of prime farmland soils; 10.4 miles (16.7 km) of streams and shoreline; and 1,314 acres (532 ha) of Targeted Ecological Area” (MDNR, 2014, para. 1). While all 73 of the MET respond-ents in our sample own “farmland…whose devel-opment rights had been sold or donated to a farm-land preservation program,” these protected farm parcels may include other natural, historic, or scenic resources. Therefore, an owner may have multiple conservation objectives for a single property. Conserving land for ongoing agricultural production may not be the owner’s sole or even primary purpose.14 The last two significant predictors are found only in the binary logistic regression. Not surpris-ingly, having revenue from raising both crops and livestock on eased land increases the odds of at least three-quarters of it being in farm operations. Conversely, receiving income from logging de-creases those odds. Although we specifically listed 14 Conceivably, some MET owners may have mistakenly inflated the denominator of the ratio from which the percentage was derived by including preserved acres associated with nonagricultural purposes of their easements. However, the questions’ wording was designed to avoid that problem. The denominator for the percentage of farmed preserved land was the sum of acres of “agricultural land” that the respondents owned and that became preserved through easements that they had sold or donated, or were already on the land when the respondents bought or inherited it. The numerator for the percentage was derived from three questions about “preserved” acres being farmed by the owner, by a farmer who rented the land, or by a farmer who was paid to do the production work on the preserved land.
timber production as an appropriate activity on preserved land, respondents may not have included acreage used for that purpose as belonging to their own farms and/or their tenants’ farm operations. They may have seen the logging as a completely separate enterprise, especially if they contracted with individuals or companies to do the work.
Access to Preserved Farmland by Young Farmers In all three states, either the governments or important interest groups have promoted loan programs to help young farmers purchase land for their operations. In February 2013, New Jersey’s State Agricultural Convention resolved that the pending federal farm bill “give priority for grants and loans to young farmers determined to sustain agriculture into the next generation” (State of New Jersey, Department of Agriculture, 2013, bullet 11 ). Earlier the State Agricultural Development Com-mittee circulated a paper on farmland affordability and availability, which observed that “24 percent of New Jersey farmers are at or past retirement age and only 3 percent are under age 35” (SADC, n.d., p. 2). In 2006 the Maryland General Assembly authorized (but did not fund) the Next Generation Farmland Acquisition Program to “help aspiring young or beginning farmers to purchase quality rural working land and permanently preserve this land at the same time” (MARBIDCO, 2014, p. 1). Delaware established a similarly purposed program that provided its first loans in 2012. The Farmland Purchase and Preservation Loan Program is tar-geted to applicants 18 to 40 who apply to DALPF for 30-year, no-interest loans to purchase land that will be preserved; they “must actively use the land for agricultural purposes for the term of the loans” (State of Delaware, 2012, para. 20). The nationwide Farm Credit System has a loan program to help “young, beginning, and small farmers and ranchers” and defines its clients as being no more than 35 years of age (Farm Credit Council, 2014). Table 4 uses both the Farm Credit standard and the Delaware program’s age range of 18 to 40.15 Although the 35-and-under measure did
15 Unless otherwise noted, for purposes of analysis and exposition “young farmer” is defined in this paper according to the owner’s age when she or he first preserved farmland or

Journal of Agriculture, Food Systems, and Community Development ISSN: 2152-0801 online www.AgDevJournal.com
Volume 5, Issue 2 / Winter 2014–2015 139
not yield any statistically significant differences between the first- and later-generations across the five programs, the no-more-than-40 standard did. In the full sample, 8.0% of the first generation and 15.2% of the later generation were 40 years old or younger when they first owned and operated preserved farmland. This 7.2-point difference is statistically significant. Among the later-generation young farmers in our sample, most (14 out of 17, or 82.4%) obtained their protected land by purchasing it. In the full group of 59 young (40 or younger) farmers, that percentage was 40.7. Regression analysis confirms the importance of the purchase path for younger farmers.16 It is statistically and substantively the most important predictor of owning eased land before one is older than 40. None of the other three paths to owning preserved farmland (selling or donating easements, or inheriting preserved land) achieves statistical significance in the analysis.
acquired preserved farmland. For example, an owner may have been 50 years old at the time of the survey but 32 years old when she or he purchased a preserved farm. For our current purpose, she or he is classified as a young farmer. 16 Binary logistic regression analysis was used but is not presented herein. For the regression table, please contact the lead author.
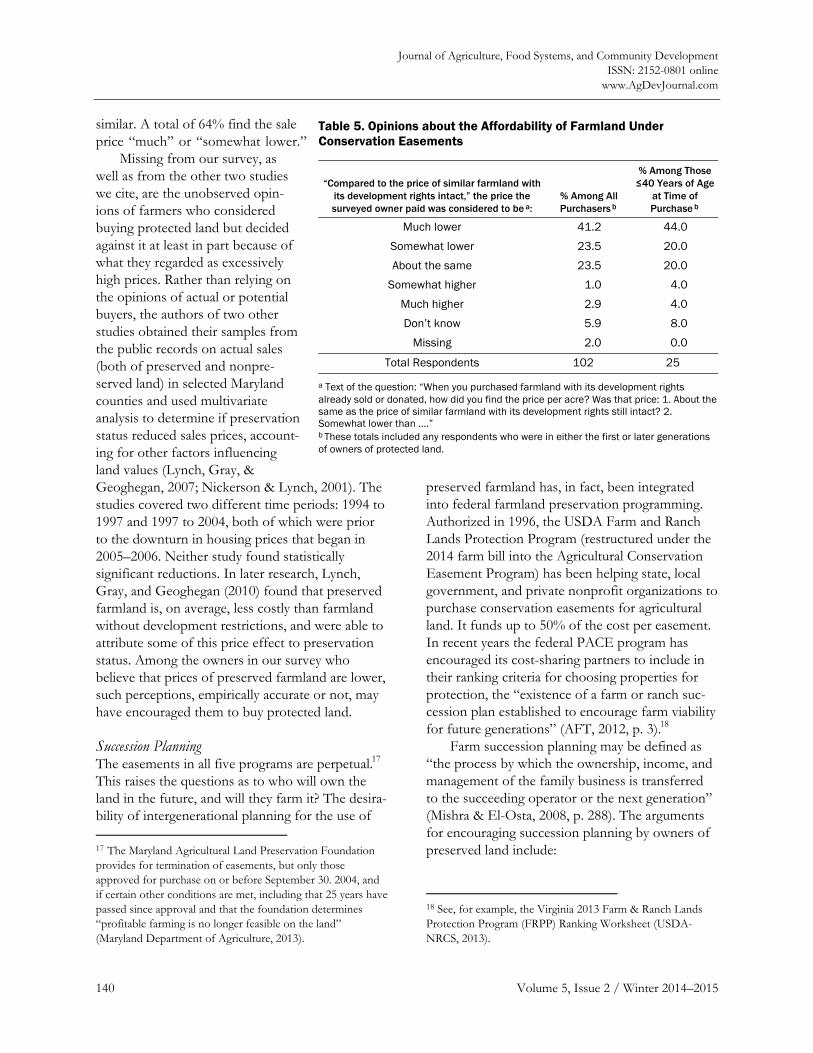
An anticipated benefit of agricultural conser-vation easements is that the price of farmland is lower with the development rights removed or reduced. There is a lively academic debate, how-ever, about whether easements actually do lower land prices. Survey-based evidence suggests that it does, while studies of land markets have had more difficulty finding the lower-price effect. A 1996–1997 survey by Paul Feinberg (1997) reached 61 second-generation owners who had purchased protected farmland; 73% of these respondents felt that easements made their properties more afford-able to purchase. A 1999 survey of 130 farmer participants in Vermont’s farmland preservation program found that it helped younger farmers enter the industry by making land more affordable (Ferguson & Cosgrove, 2000). In our 2011–2012 mid-Atlantic sample, among 106 buyers of pro-tected land, 41.2% consider the sale price “much lower” than the price of similar farmland with development rights intact (Table 5). Another 23.5% regard it as “somewhat lower,” the same percen-tage consider it “about the same,” and just 3.9% report that it is either “somewhat higher” or “much higher.” Among the 25 respondents who were 40 years old or younger when they purchased protected land, the distribution of answers is quite
Table 4. Young Farmer Ownership of Preserved Land, by Generation of Ownership
% of Owner-operators ≤35 Years Old
% of Owner-operators≤40 Years Old
Easement Program
First Generation
LaterGeneration
First Generation
Later Generation
New Jersey Farmland Preservation Program 5.0
(n=121) 3.8
(n=52) 9.1
(n=121 ) 13.5
(n=52)
Maryland Agricultural Land Protection Foundation 6.6
(n=106) 14.7
(n=34) 10.4a
(n=106) 23.5a
(n=34)
Maryland Environmental Trust 2.3
(n=43) 0.0
(n=21) 2.3
(n=43) 4.8
(n=21)
Delaware Agricultural Land Protection Foundation 6.0
(n=50) 0.0
(n=5) 6.0
(n=50) 20.0(n=5)
All five programs (weighted data) 5.4
(n=350) 6.3
(n=112) 8.0b
(n=350) 15.2b
(n=112)
Notes: “Young farmer” status was determined based on the year in which the surveyed owner first owned preserved land, whether through selling or donating easements or by purchasing or inheriting land already preserved. Maryland Rural Legacy Program is included in weighted totals, but is not shown due to low cell frequencies. a A statistically significant difference at the .051 level in a two-sided Pearson Chi-square test. b A statistically significant difference at the .026 level in a two-sided Pearson Chi-Square test.
Journal of Agriculture, Food Systems, and Community Development ISSN: 2152-0801 online
www.AgDevJournal.com
140 Volume 5, Issue 2 / Winter 2014–2015
similar. A total of 64% find the sale price “much” or “somewhat lower.” Missing from our survey, as well as from the other two studies we cite, are the unobserved opin-ions of farmers who considered buying protected land but decided against it at least in part because of what they regarded as excessively high prices. Rather than relying on the opinions of actual or potential buyers, the authors of two other studies obtained their samples from the public records on actual sales (both of preserved and nonpre-served land) in selected Maryland counties and used multivariate analysis to determine if preservation status reduced sales prices, account-ing for other factors influencing land values (Lynch, Gray, & Geoghegan, 2007; Nickerson & Lynch, 2001). The studies covered two different time periods: 1994 to 1997 and 1997 to 2004, both of which were prior to the downturn in housing prices that began in 2005–2006. Neither study found statistically significant reductions. In later research, Lynch, Gray, and Geoghegan (2010) found that preserved farmland is, on average, less costly than farmland without development restrictions, and were able to attribute some of this price effect to preservation status. Among the owners in our survey who believe that prices of preserved farmland are lower, such perceptions, empirically accurate or not, may have encouraged them to buy protected land.
Succession Planning The easements in all five programs are perpetual.17 This raises the questions as to who will own the land in the future, and will they farm it? The desira-bility of intergenerational planning for the use of 17 The Maryland Agricultural Land Preservation Foundation provides for termination of easements, but only those approved for purchase on or before September 30. 2004, and if certain other conditions are met, including that 25 years have passed since approval and that the foundation determines “profitable farming is no longer feasible on the land” (Maryland Department of Agriculture, 2013).
preserved farmland has, in fact, been integrated into federal farmland preservation programming. Authorized in 1996, the USDA Farm and Ranch Lands Protection Program (restructured under the 2014 farm bill into the Agricultural Conservation Easement Program) has been helping state, local government, and private nonprofit organizations to purchase conservation easements for agricultural land. It funds up to 50% of the cost per easement. In recent years the federal PACE program has encouraged its cost-sharing partners to include in their ranking criteria for choosing properties for protection, the “existence of a farm or ranch suc-cession plan established to encourage farm viability for future generations” (AFT, 2012, p. 3).18 Farm succession planning may be defined as “the process by which the ownership, income, and management of the family business is transferred to the succeeding operator or the next generation” (Mishra & El-Osta, 2008, p. 288). The arguments for encouraging succession planning by owners of preserved land include:
18 See, for example, the Virginia 2013 Farm & Ranch Lands Protection Program (FRPP) Ranking Worksheet (USDA-NRCS, 2013).
Table 5. Opinions about the Affordability of Farmland Under Conservation Easements
“Compared to the price of similar farmland with its development rights intact,” the price the surveyed owner paid was considered to be a:
% Among All Purchasers b
% Among Those ≤40 Years of Age
at Time of Purchase b
Much lower 41.2 44.0
Somewhat lower 23.5 20.0
About the same 23.5 20.0
Somewhat higher 1.0 4.0
Much higher 2.9 4.0
Don’t know 5.9 8.0
Missing 2.0 0.0
Total Respondents 102 25
a Text of the question: “When you purchased farmland with its development rights already sold or donated, how did you find the price per acre? Was that price: 1. About the same as the price of similar farmland with its development rights still intact? 2. Somewhat lower than ….” b These totals included any respondents who were in either the first or later generations of owners of protected land.

Journal of Agriculture, Food Systems, and Community Development ISSN: 2152-0801 online www.AgDevJournal.com
Volume 5, Issue 2 / Winter 2014–2015 141
• Using money from the sale of the easement to fund retirement investments for the cur-rent owner rather than waiting until he or she retires and is forced to sell all or part of the farm if retirement resources are inade-quate (Mishra & El-Osta, 2008; O’Neill, Komar, Brumfield, & Mickel, 2014).
• Identifying heirs who wish to farm the land and channeling easement proceeds to meet the inheritance claims of other heirs (Lynch, 2000).
• Whenever possible, arranging for a family member to be the next operator. Harris, Mishra, and Williams (2012) found that when a family successor is in place, the farm operation tends to realize “higher financial performance, both in terms of higher profits margins and returns to equity” (p. 10).
• Being in rural-urban-interface areas, where farmland—preserved or not—tends to be in short supply, operations may need to adapt to survive, such as by intensifying or diversifying on their existing land base. Some adaptation strategies may only be economically feasible over a longer-term planning horizon, which is made possible when an heir has been identified.
• Sharing with the next owner-operator the current farmer’s detailed knowledge of the land, effective production practices, mar-kets, etc. (Miller & Cocciarelli, 2012; USDA-National Research Initiative, 2010).
Our survey instrument contained a series of questions about farm succession. Each owner was asked if he or she had a written plan that “arranges for the transfer of ownership of the land to a relative or other person.” If a written succession plan was not in place, the respondent was asked whether there was an oral agreement to transfer ownership in the future. A significantly higher percentage of first-generation owners in the full sample (68.1%) reported having either written plans or oral agreements compared to later-generation owners (54.5%); see Table 6. The same relationship is observed when the assessment is narrowed to having a written succession plan (58.6%
versus 41.8%). Within specific programs, statisti-cally significant differences in succession planning are only evident among owners of land preserved under the MALPF program; first-generation owners are more likely to have written plans, as well as oral succession agreements. Landowners with either type of succession arrangement were asked two follow-up questions about the identity of the anticipated next owner (e.g., one of the respondent’s children, another kind of relative, or a nonrelative) and whether the successor would be a “farmer who uses the land for agricultural production.” The response options for the second question were: “definitely yes,” “probably yes,” “probably no,” “definitely no,” and “don’t know.” We asked the second question based on the supposition that an owner who also farmed the land will maintain a greater amount of pre-served land in active farming, an assumption supported by data shown in Appendix Table A1. A significantly higher percentage of the full sample’s exclusively first generation of owners report that they had either “definitely” or “probably” identified a successor. The difference was 39.3% versus 27.0% (the second part of Table 6). Because the larger percentage for the first generation might have resulted from relatively more owners being older and, thus, more likely to have lined up successors, binary and ordinal logistic regressions tested for the effects of age and other plausible causal variables (see Appendix Table A2). Using both regressions allowed for the possibility that significant effects would be found in one type, but not in the other. For the binary regression, the dependent variable is defined as “1” if the owner responded “definitely yes” when asked whether the next owner would be a farmer using the land for agricultural production, and “0” for all other responses (including instances where the respond-ent said there was no written or oral agreement about succession). The ordinal logistic regression requires a plausible ordering of the outcome measures (Norusis, 2011), and ranges from having no succession agreement in place to a belief that the next owner would “definitely” farm the preserved land.19 19 The ordering was as follows: “0” stood for the respondent

Journal of Agriculture, Food Systems, and Community Development ISSN: 2152-0801 online
www.AgDevJournal.com
142 Volume 5, Issue 2 / Winter 2014–2015
We began both forms of regression analysis with a single hypothesized causal binary variable, with “0” standing for exclusively first-generation owners and “1” for second- or later-generation owners. In the ordinal regression, “generation” was hypothesized negative (i.e., the later generation were less likely to have lined up a farmer as suc-cessor). Although the result was statistically sig-nificant, when we added other significant predic-
reporting that he or she had no succession agreement (and hence no successor to farm the preserved land); “1” if the respondent reported having a successor but believed he or she would “definitely” not farm the land; “2” if the respondent reported having a successor but believed he or she would “probably” not farm the land; “3” if the respondent reported having a successor but did not know if he or she would farm the land; “4” if the respondent reported having a successor and believed he or she would “probably” farm the land; “5” if the respondent reported having a successor and believed he or she would “definitely” farm the land.
tors (especially the respondent’s age, primary occupation, and a satisfaction measure), the gen-eration variable ceased to have significance at the .05 level. In the binary regression analysis, it never attained significance. Both the binary and ordinal logistic regres-sions found that owner’s age made a significant difference in the likelihood of having a successor who would “definitely” farm the preserved land (see Appendix Table A2).20 Other succession
20 Our final binary regression model estimated that the odds of such an outcome increase by a factor of 1.033 for every additional year of owner age. The corresponding finding from the ordinal regression is an odds ratio of 1.610, which resulted from converting the interval-level age variable to a binary variable, “Older.” That new variable divided the sample into those respondents up to and including 53 years (the 25th percentile value for the whole sample) and those older. Therefore, compared to the younger owners, the odds of those older than 53 having “definitely” lined up a successor who
Table 6. Owner Reports on Succession Planning and Anticipated Successors, by Generation of Ownership: Exclusively First and Exclusively Later
New Jersey Farmland
Preservation Program (NJFPP)
Maryland Agricultural Land
Preservation Foundation (MALPF)
Maryland Environmental
Trust (MET) All Five Programs
Response Categories Generation of Owner (%)
Status of Succession Planning First Later First Later First Later First Later
Has written plan 45.5 42.3 65.4 a 44.1 a 53.5 38.1 58.6 a 41.8 a
Has oral agreement 13.8 5.8 7.5 a 20.6 a 7.0 14.3 9.5 12.7
Has either written plan or oral agreement 59.3 48.1 72.9 64.7 60.5 52.4 68.1 a 54.5 a
Total cases 123 52 107 34 43 21 348 110
Likelihood that Successor Will Farm the Land
Definitely yes 23.6 25.0 27.1 11.8 11.6 4.8 24.7 17.1
Probably yes 14.6 a 3.8 a 13.1 17.6 11.6 14.3 14.6 9.9
Definitely or probably yes 38.2 28.8 40.2 29.4 23.3 19.0 39.3 a 27.0 a
Probably no 6.5 5.8 7.5 5.9 14.0 14.3 9.2 8.1
Definitely no 7.3 5.8 6.5 5.9 16.3 a 0.0 a 8.0 4.5
Don’t know, refused, or not asked because had no written or oral plan
48.0 59.6 45.7 58.8 46.5 66.7 43.4 60.4
Total cases b 123 52 107 34 43 21 348 110
Notes: Maryland Rural Legacy Program and Delaware Agricultural Land Preservation Foundation (DALPF) are not presented due to low cell frequencies (i.e., only one and five later-generation owners), but are included in the weighted totals for all programs. a A statistically significant difference at the .05 level or better in a two-sided Pearson Chi-Square test. b This analysis was limited to respondents who were either exclusively first- or later-generation owners.

Journal of Agriculture, Food Systems, and Community Development ISSN: 2152-0801 online www.AgDevJournal.com
Volume 5, Issue 2 / Winter 2014–2015 143
studies regarding farmland found similar effects for age (Epley, Duffy, & Baker, 2009; Misha, El-Osta, & Shaik, 2010). However, the comparisons to our study are limited by differences in sampling frames. The prior succession research that we cite focuses entirely on owner-operators of farmland, whereas we surveyed a sample of owners, a little more than half of whom (56.4%) are also operators. In our sample, owner-operators are not more likely than nonoperators to have “definitely” lined up a farmer successor, whether or not we take into account their ages (Table A2). Another of our hypotheses was that the number of years elapsed since the respondent first owned land under a conservation easement would be a significant predictor of having lined up a farmer successor. It seemed plausible that, as more years elapsed, an owner would have more time for the preservation status to affect succession think-ing and decisions. Since the land cannot be devel-oped, identifying a farmer successor becomes a practical issue for owning the land, in contrast to a planning strategy where the farm is expected to be sold for development at the time of retirement or death. However, the years-elapsed variable proved statistically insignificant in both the binary and ordinal regressions. In contrast, the number of preserved acres is a significant predictor in both types of regressions (Table A2). There can be substantial costs involved in succession planning (e.g., for developing a retire-ment plan or hiring an outside facilitator), and owners of larger farms may be better positioned to bear these costs. Epley and colleagues (2009) found in their Iowa study that size (in acres) made a posi-tive difference in whether plans had been made, but only “once the size of the farm reached 1,000 acres [405 ha]” (p. 5) . In our pool of plausible predictors we could not include farm size in gross sales, as have other studies (see, for example, Epley et al., 2009; Miller & Cocciarelli, 2012), since 44% of our surveyed owners are not operators. Although being an operator does not increase the likelihood of a farmer successor, having farm-
would farm the land are estimated to be greater by a factor of 1.610 versus the combined odds of the other four types of responses (“probably” having such a successor, etc.).
ing as one’s primary occupation does. Perhaps such owners are more likely to have found another farmer to succeed them because they have greater financial and/or self-esteem stakes in planning for the operation to continue. Also, a primary occu-pation of farming might mean they are better net-worked with other farmers, whom they contact about succession or who approach them. Are owners who rented out their preserved land any more likely to have farmer successors lined up? Family and nonfamily tenants may be advantaged because they know the land well and may learn when the owners are open to including them in succession plans. Although in the binary regression analysis renting out land does not affect the likelihood of having a farmer successor, in the ordinal regression it was close to being a significant predictor. There is a similar pattern when we include variables about owners investing in their land’s agricultural operations, whether they are owner-operators or not. We hypothesized that having lined up a farmer successor or working toward that goal may provide an incentive for current owners to invest in the land’s long-term productivity. Such investment could either help a family successor or make the operation more attractive to a nonfamily purchaser of the farm (Kirkpatrick, 2013; Mishra, El-Osta, & Shaik, 2010). The binary logistic regres-sion analysis finds that the odds of having identi-fied a farmer successor increase for owners in our sample who had “purchased equipment or machin-ery for use on any of the preserved land” in the time since they first owned such land; however, the coefficient’s statistical significance is marginal (p=.067). In contrast, having a college degree is a signifi-cant and substantively important trait in both types of regressions, although in a negative direction. Surveyed owners with college degrees (and higher) are less likely to have identified farmer successors (Table A2). Mishra, El-Osta, and Shaik (2010) report similar findings in their study of farmers based on 2001 national-level Agricultural Resource Management Survey data. They reason that “edu-cated farm operators send their children to schools for higher education, and many of these children may not return to the farm because they secure

Journal of Agriculture, Food Systems, and Community Development ISSN: 2152-0801 online
www.AgDevJournal.com
144 Volume 5, Issue 2 / Winter 2014–2015
higher paying jobs in the nonfarm market” (Mishra et al., 2010, p. 147). Among our 295 first- or second-generation respondents with written or oral succession plans, 234 (or 79.3%) identify a child (or children) as their anticipated successor(s). However, among the 102 of those 234 current owners who had college or graduate degrees, only 25.5% say their successors would “definitely” farm the pre-served land. By comparison, among the 132 owners without higher education degrees, 42.4% report farmer successors. Finally, near the end of the interviews, the owners were asked to look back on their “experi-ences in owning farmland preserved through con-servation easements” and to answer the question, “[H]ow satisfied or dissatisfied are you with being an owner of farmland preserved in that way?” Among the first- and later-generation owners, over half (55.3%) answered “very satisfied.” The odds of members of this subgroup having lined up farmer successors is estimated to be more than three times greater than those for other respond-ents in the binary regression and nearly twice as high in the ordinal model (Table A2). Presumably, high satisfaction with their land having been pre-served for agriculture encourages owners to find successors, and persuades them that owning the land would be to the successors’ benefit.
Summary Farmland preservation programs in Maryland, New Jersey, and Delaware have been operating for sev-eral decades. The maturity of these programs allows empirical observation of the actual succes-sion of preserved farms, from owners who sold or donated development rights on these properties, to second and even later generations of new owners. In light of the public interests served by farmland preservation—and the significant public expendi-tures directed to protect these land resources—program administrators and policy-makers are interested in monitoring the uses of deed-restricted farms now and into the future. Some concerns have emerged, for example, regarding the diversion of preserved farmland from active agriculture into less intensive uses. A common example is the acquisition of preserved farmland for residential enjoyment by those interested in rural lifestyles.
The encouragement of “rural estate” formation, generally perceived as an undesirable outcome (Daniels, 1986), is attributable to deed of easement language that requires that preserved land be kept available for agriculture, as opposed to being kept in active farming. These types of ownership transitions lead peri-odically to questions about the efficacy of agricultural conservation easement programs as a farm retention tool, but such concerns are often based on anecdotes or a high-profile acquisition of a preserved farm by a wealthy individual who then constructed a large home. In some states this type of succession has raised concern about the acces-sibility and affordability of deed-restricted farmland to current and future farmers. Policy reactions have included conditioning preservation of a property on the easement holder’s right to exercise a right-of-first-refusal purchase agreement at the time the farm is proposed for sale (e.g., in Vermont) as well as the imposition of limits on the sizes of new homes built or established ones expanded on pre-served land (e.g., in certain New Jersey counties). Yet at the same time, whether preserved farmland is leaking out of agriculture is not well understood. Little systematic examination of the actual or plan-ned transfer of preserved farmland to second- and later-generation owners has been conducted, making it difficult to generalize about the uses of preserved farmland. Through a survey of preserved farmland own-ers, we examined this issue using several compari-sons between first- and later-generation owners of farmland protected by conservation easements in our tristate study area. We examined the extent to which preserved farmland is reported to be in ac-tive agricultural use, the access to preserved farm-land by young farmers, and, finally, the presence and nature of farm succession plans. Statistical analysis yields mixed, but generally positive, results. First, this research provides some assurance that there is no pervasive disassociation of pre-served farmland from active agriculture as proper-ties transition to new owners. Both first- and later-generation owners report devoting relatively high percentages of their preserved acres to farming, although more nuanced analysis suggests that owners who had sold easements tend to devote

Journal of Agriculture, Food Systems, and Community Development ISSN: 2152-0801 online www.AgDevJournal.com
Volume 5, Issue 2 / Winter 2014–2015 145
more of their landholdings to agriculture than do owners who donated easements or acquired already eased land. Yet the survey finds that some pro-tected acres were not in farm operations (either the owner’s or a tenant’s)—an estimated 26% on average among the first-generation owners and 31% among the second. Next we examine whether the percentages of the total owners who were young farmers when they first owned land under easements differ across first and later generations of owners. No significant differences were found for persons 35 years and under, a threshold common in certain federal programs and among agricultural lenders. However, using the more liberal young farmer definition found in Delaware’s farmland preservation program (40 years and younger), the proportion of later-generation owners who were young farmers when they first owned preserved farmland is nearly double that of the first generation. This suggests that farmland preservation is effectuating access to land among young farmers, presumably because the cost of preserved farmland is perceived by many pur-chasers of development-restricted farmland to be lower than the cost of comparable land without conservation easements (Table 5). Third, approxi-mately two-thirds (68%) of first-generation owners report having a written or oral agreement for land succession, as compared to a little more than half (55%) of later-generation owners. Relatively low proportions of first- and later-generation owners (39% and 27%, respectively) believe that the subsequent owners of their preserved land will likely farm it. While there is disparity between the two generations of owners examined, this genera-tional effect disappears when other factors posi-tively correlated with having a succession plan (e.g., owner age, farm size, primary occupation, and overall satisfaction with owning preserved farm-land) are considered simultaneously. In contrast, owners with college educations are less likely to have a successor interested in farming the preserved land.
Policy Implications and Further Research We conclude with a discussion of the implications of our findings, highlighting potential extensions of this research as well as policy recommendations.
On the whole, our study suggests that acquisitions of agricultural conservation easements in the three study states are advancing stated farmland reten-tion goals. The extent to which plans are in place for the succession of preserved farms to future farmers, however, warrants additional attention. Challenges intrinsic to the succession process are neither unique to preserved farms nor to the three states under examination.21 Despite the hard work and uncertainty inherent in farming, the transfer of a family farm to the next generation of family members is a commonly held desire among farm families (Gasson & Errington, 1993). For example, Laband and Lentz (1983) found that the likelihood of sons entering their fathers’ occupations is con-siderably higher in the farm sector, relative to other professions (presumably a reflection of the transfer of high human capital across generations of farm families). Yet the process of farm succession is wrought with difficulties, including procrastination, the need of the current generation owner to main-tain an adequate livelihood or retirement resources, intrafamily equity, and other family dynamics. The process can be made more challenging if it occurs during a time of high emotion (e.g., a sudden ill-ness or death of a key farm family member). The successful transition of farm management responsibility, physical assets, and less tangible assets (e.g., knowledge of farming and the land) from an aging farm owner to a next- generation owner is critical to farm survival. More broadly, matters of farm succession have important rami-fications for the structure, performance, and adaptability of the farm sector (Gasson &
21 Our findings on farm succession planning are comparable to those from several other studies. In a recent national-level survey, 30% of operator-owners of preserved farmland report having a farmer successor (Esseks & Schilling, 2013). A 2001 national study by the USDA Economic Research Service finds that 23 percent of surveyed farm operators had “identified a successor” (Mishra, Johnson, & Morehart, 2003). A 2000 survey by Iowa State University finds that 29% of farmer respondents had “a potential successor to their operations” (Duffy, Baker & Lamberti, n.d.). A similar 2006 Iowa survey finds 27% of farmers have an identified successor (Iowa State University, n.d.). A 2011 Michigan State University survey finds 45% of farmers had “identified one or more successors who will eventually take over management of your farm” (Miller & Cocciarelli, 2012).

Journal of Agriculture, Food Systems, and Community Development ISSN: 2152-0801 online
www.AgDevJournal.com
146 Volume 5, Issue 2 / Winter 2014–2015
Errington, 1993; Inwood & Sharp, 2012; Mishra & El Osta, 2008). Identifying and engaging next-generation farmers may result in greater invest-ments in modernization, expansion of innovative marketing or production practices, and improved economic vitality (Mishra et al., 2010; Potter & Lobley, 1992). In contrast, a farmer without a known successor may lack incentive to make longer-term farm investments, particularly if the owner is approaching an age where an exit from farming is contemplated. In the case of farmland preserved under state conservation easement programs, farm succession is also of interest to program managers, policy-makers, and the voting public, which hold expectations that such lands are forever kept in (or at minimum available for) farming. Our analysis finds that, in most cases, the pre-served farmland that has been transferred to new owners is being used mostly for farm production. Prospectively, however, there are fewer than four out of 10 first-generation owners, and only a little more than one-quarter of later- generation owners, with plans in place to transfer their preserved land to family members or others with an intention to farm the land. An important caveat to these stated plans for succession is warranted. The timing of, and the extent to which, managerial control over the farm will be transferred to a named successor remains an open area for further inquiry. The idea that a successor may be named but allowed little managerial authority has been identified as a pos-sible impediment to intergenerational transfers of farms (Gasson & Errington, 1993; Lobley, Baker & Whitehead, 2010). Gasson and Errington (1993) dub this a “farmer’s boy” situation, whereby the successor provides little more than hired labor to the operation, does not gain management experi-ence, and essentially accepts the situation in antici-pation of future farm ownership. On a related topic, we do not delve into the important distinc-tion between a transition in farm management responsibility and the actual transfer of farm asset ownership (Errington, 1998; Keating, 1996). Both this issue and that of heirs without significant management experience deserve more academic inquiry within the farmland preservation literature. The following recommendations are offered to
facilitate planning for the succession of preserved farmland and its continued use in agricultural production.
• Easement holders can identify and evaluate administrative or regulatory provisions of their programs, including deed of easement terms, which may constrain agricultural use of preserved lands or farm adaptation. Pro-gram staff visits to preserved farms (e.g., when required for monitoring easement compliance) may be used to advance this purpose. The link identified in our study between owner satisfaction with his or her preservation experience and succession planning suggests the importance of under-standing the types of incongruities that may exist between the views of owners and ease-ment holders as to what uses are appropri-ate on preserved farmland. For example, agritourism and direct marketing are grow-ing in importance, particularly in urbanizing areas (see Schilling, Sullivan & Komar, 2012). This growth is fueled in part by an expanding local food movement and by the economic necessities of a changing agricul-tural business climate. Farmers seeking to capitalize on these opportunities may “push the envelope” in terms of what is conven-tionally interpreted as an accepted agricul-tural use by farmland preservation pro-grams (e.g., hosting weddings at wineries on preserved farms is a current example receiv-ing considerable policy and legislative scrutiny in New Jersey).
• Farm Link and similar programs (see, for example, Vermont’s Land for Good pro-gram) aim to link farmland owners with those seeking to purchase or lease farmland for production. It will be useful to evaluate farmland linking programs systematically to assess their efficacy in aiding farm succes-sion planning and, specifically, matching new and beginning farmers with available farmland. Benchmarking effective programs, or elements thereof, can provide useful information to other programs.
Journal of Agriculture, Food Systems, and Community Development ISSN: 2152-0801 online www.AgDevJournal.com
Volume 5, Issue 2 / Winter 2014–2015 147
• Some private land conservation organiza-tions are working with beginning farmers to create access to affordable agricultural land (see Beckett & Galt, 2014). These types of initiatives can be assessed for replication or expansion by state-sponsored conservation easement programs. One innovative state program example can be found in Delaware. In 2012, the Young Farmers Program helped 10 young farmers purchase 900 acres (364 ha) of unpreserved farmland by providing interest-free loans, provided that the land is farmed. An outgoing owner agrees to a per-petual conservation easement and is com-pensated for it at the time of transfer, there-by preserving the land. Another opportunity may be to set aside a portion of lands pre-served through fee simple acquisitions for beginning farmer access, perhaps in tandem with some form of beginning farmer incubator program.
• Efforts to support the challenging process of farm succession planning should be contin-ued. Mishra, El-Osta, and Shaik (2010) sug-gest that Cooperative Extension profession-als and other agricultural support providers can play an important role in advising farm owners about the importance and process of succession planning. These professionals need the support and training required to provide this assistance effectively, including information and strategies to address com-mon barriers, such as cultural issues (Inwood, 2013), and examples or case studies of suc-cessful farm succession that may be used during client advisement.
References American Association for Public Opinion Research.
(2014). Response rate: An overview. Retrieved from http://www.aapor.org/AAPORKentico/ Education-Resources/For-Researchers/Poll-Survey-FAQ/Response-Rates-An-Overview.aspx
American Farmland Trust [AFT]. (2012). Farm and Ranch Lands Protection Program. Washington, D.C.: Farmland Information Center (FIC). Retrieved from http://www.farmlandinfo.org/sites/default/ files/FIC_FRPP_09-2012.pdf
AFT. (2013). Status of state PACE programs. Washington, D.C.: Farmland Information Center. Retrieved from http://www.farmlandinfo.org/pace-status-state-programs-2013
AFT. (2014). Statistics: 2007 National Resources Inventory. Washington, D.C.: FIC. Retrieved from http://www.farmlandinfo.org/statistics
Anderson, K. & Weinhold, D. (2008). Valuing future development rights: The costs of conservation easements. Ecological Economics, 68(1–2), 437–446. http://dx.doi.org/10.1016/j.ecolecon.2008.04.015
Bastian, C., McLeod, D., Germino, M., Reiners, W., & Blasko, B. (2002). Environmental amenities and agricultural land values: A hedonic model using geographic information system data. Ecological Economics, 40(3), 337–349. http://dx.doi.org/10.1016/S0921-8009(01)00278-6
Beckett, J., & Galt, R. (2014). Land trusts and beginning farmers’ access to land: Exploring the relationship in coastal California. Journal of Agriculture, Food Systems, and Community Development, 4(2), 19–35. http://dx.doi.org/10.5304/jafscd.2014.042.008
Bergstrom, J. & Ready, R. (2009). What have we learned from over 20 years of farmland amenity valuation research in North America? Applied Economic Perspectives and Policy, 31(1), 21–49.
Berry, D. (1978). Effects of suburbanization on agricultural activities. Growth and Change, 9(3), 2–8. http://dx.doi.org/10.1111/j.1468-2257.1978. tb01024.x
Bowers, D. (2000). Nation’s farmland programs vary widely in funding, politics. Farmland Preservation Report, 10(5), 1–5. Street, Maryland: Farmland Preservation Report (FPR). Retrieved from http://www.farmlandpreservationreport.com/wp-content/uploads/2010/03/Farmland_Preservation_Report_1996_2000_BW.pdf
Bowers, D. (2005). State of the states: Progress varies widely among states. Farmland preservation report, 15(5), 1–3, 6. Street, Maryland: FPR. Retrieved from http://www.farmlandpreservationreport. com/wp-content/uploads/2010/03/Farmland_ Preservation_Report_2001_2006_reduced.pdf
Bromley, D., & Hodge, I. (1990). Private property rights and presumptive policy entitlements: Reconsidering the premises of rural policy. European Review of Agricultural Economics, 17 (2), 197–214. http://dx.doi.org/10.1093/erae/17.2.197

Journal of Agriculture, Food Systems, and Community Development ISSN: 2152-0801 online
www.AgDevJournal.com
148 Volume 5, Issue 2 / Winter 2014–2015
Daniels, T. (1986). Hobby farming in America: Rural development or threat to commercial agriculture? Journal of Rural Studies, 2(1), 31–40.
Daniels, T., & Bowers, D. (1997). Holding our ground: Protecting America’s farms and farmland. Washington, D.C.: Island Press.
Delaware Agricultural Lands Preservation Act, 2 DE Code § 901 et seq. (1981). Retrieved from http://delcode.delaware.gov/title3/c009/sc01/ index.shtml
Delaware Agricultural Lands Preservation Foundation. (2013, August). Current situation report. Presented at meeting of DALPF, Delaware Department of Agriculture, Dover, Delaware. Retrieved from http://dda.delaware.gov/aglands/downloads/ CurrentSituationReport.pdf
Dey, E. (1997). Working with low response rates: The efficacy of weighting adjustments. Research in Higher Education, 38(2), 215–227. http://dx.doi.org/10.1023/A:1024985704202
Dimitri, C., Effland, A., & Conklin, N. (2005). The 20th century transformation of U.S. agriculture and farm policy (Economic Information Bulletin No. 3). Washington, D.C.: United States Department of Agriculture.
Duke, J. M. & T. W. Ilvento. (2004). Supplying preservation: Landowner behavior and the Delaware Agricultural Lands Preservation Program (Research Report RR04-01). Newark, Delaware: University of Delaware, Department of Food and Resource Economics.
Duffy, M., Baker, J., & Lamberti, A. (n.d.). Farm succession in Iowa. Ames, Iowa: Iowa State University, Department of Agricultural Economics. Retrieved from http://www2.econ.iastate.edu/faculty/ duffy/Pages/farmsuccession.pdf
Epley, E., Duffy, M., & Baker, J. (2009). Iowa farmers business and transfer plans. Ames, Iowa: Iowa State University Extension, Beginning Farmer Center. Retrieved from http://www.extension.iastate. edu/bfc/sites/www.extension.iastate.edu/files/ bfc/Farm%20Business%20Transfer%20Plan.pdf
Errington, A. (1998). The intergenerational transfer of managerial control in the farm-family business: A comparative study in England, France and Canada. Journal of Agricultural Education and Extension, 5(2), 123–136. http://dx.doi.org/10.1080/13892249885300241
Esseks, J. D., Nelson, J., & Stroe, M. (2006). Evaluation of USDA’s Farm and Ranch Lands Protection Program (FRPP) through surveying a random sample of owners of agricultural land whose development rights were sold in part through the FRPP. Lincoln, Nebraska: University of Nebraska, American Farmland Trust, and Center for Great Plains Studies. Retrieved from http://www.farmlandinfo.org/evaluation-usdas-farm-and-ranch-lands-protection-program-frpp-through-surveying-random-sample-owners
Esseks, J. D., & Schilling, B. (2013). Impacts of the federal Farm and Ranch Lands Protection Program: An assessment based on interviews with participating landowners. Lincoln, Nebraska: University of Nebraska, American Farmland Trust, and Center for Great Plains Studies. Retrieved from http://www.farmlandinfo.org/FRPPImpacts
Farm Credit Council. (2014). How Farm Credit serves young, beginning and small farmers and ranchers. Washington, D.C.: The Farm Credit Council. Retrieved from http://www.fccouncil.com/files/YBS_2014.pdf
Feinberg, P. (1997). An evaluation of landowner satisfaction with conservation restrictions. Master of Science degree thesis. State University of New York, College of Environmental Science and Forestry, Syracuse, New York.
Ferguson, K. & Cosgrove, J. (2000). From the field: What farmers have to say about Vermont’s farmland conservation program. Northampton, Massachusetts: American Farmland Trust.
Gardner, B. D. (1977). The economics of agricultural land preservation. American Journal of Agricultural Economics, 59(5), 1027–1036. http://dx.doi.org/10.2307/1239883
Gasson, R., & Errington, A. (1993). The family farm business. Wallingford, UK: CAB International.
Harris, J., Mishra, A., & Williams, R. (2012, August). The impact of farm succession decisions on the financial performance of the farm. Paper presented at the Agricultural & Applied Economics Association 2012 AAEA, CAES, & WAEA Joint Annual Meeting, Seattle, Washington.
Hellerstein, D., Nickerson, C. J., Feather, P., Gadsby, D., Mullarkey, D., Tegene, A., & Barnard, C. (2005). Farmland protection: The role of public preferences for rural amenities (Report No. AER-815). Washington, D.C.: USDA, Economic Research Service. Retrieved from http://www.ers.usda.gov/publications/aer-agricultural-economic-report/aer815.aspx

Journal of Agriculture, Food Systems, and Community Development ISSN: 2152-0801 online www.AgDevJournal.com
Volume 5, Issue 2 / Winter 2014–2015 149
Inwood, S. (2013). Social forces and cultural factors influencing farm transition. Choices, 28(2), 1–5.
Inwood, S., & Sharp, J. (2012). Farm persistence and adaptation at the rural-urban interface: Succession and farm adjustment. Journal of Rural Studies, 28(1), 107–117. http://dx.doi.org/10.1016/j.jrurstud.2011.07.005
Iowa State University [ISU]. (n.d.). Iowa farmers business and transfer plans. Ames, Iowa: ISU Extension. Retrieved from http://www.extension.iastate.edu/ bfc/sites/www.extension.iastate.edu/files/bfc/ Farm%20Business%20Transfer%20Plan.pdf
Keating, N. (1996). Legacy, aging and succession in farm families. Generations, 20(3), 61–64.
Kirkpatrick, J. (2013). Retired farmer: An elusive concept. Choices, 28(2), 1–5. Retrieved from http://www.choicesmagazine.org/choices-magazine/theme-articles/transitions-in-agriculture/retired-farmer--an-elusive-concept
Kline, J. & D. Wichelns. (1996). Public preferences regarding the goals of farmland preservation programs. Land Economics, 72(4), 538–549. http://dx.doi.org/10.2307/3146914
Laband, D. & Lentz. B. (1983). Occupational inheritance in agriculture. American Journal of Agricultural Economics, 65(2), 311–314. http://dx.doi.org/10.2307/1240880
Liu, X. & Lynch, L. (2011a). Do zoning regulations rob rural landowners’ equity? American Journal of Agricultural Economics, 93(1), 1–25. http://dx.doi.org/10.1093/ajae/aaq164
Liu, X., & Lynch, L. (2011b). Do agricultural land preservation programs reduce farmland loss? Evidence from a propensity score matching estimator. Land Economics, 87(2), 183–201. http://le.uwpress.org/content/87/2/183.abstract
Lobley, M., Baker, J. & Whitehead, I. (2010). Farm succession and retirement: Some international comparisons. Journal of Agriculture, Food Systems, and Community Development, 1(1), 49–64. http://dx.doi.org/10.5304/jafscd.2010.011.009
Lopez, R., Adelaja, A., & Andrews, M. (1988). The effects of suburbanization on agriculture. American Journal of Agricultural Economics, 70(2), 346–358. http://dx.doi.org/10.2307/1242075
Lynch, L. (2000). Farmland preservation: An estate planning tool. (Maryland Cooperative Extension Fact Sheet 779). College Park: University of Maryland, Maryland Cooperative Extension. Retrieved
September 1, 2014, from http://extension.umd. edu/sites/default/files/_docs/programs/woodland-steward/FS779_FarmlandPresEstatePlgTool.pdf
Lynch, L., Gray, W., & Geoghegan, J. (2007). Are farmland preservation easement restrictions capitalized into farmland prices? What can a propensity score matching analysis tell us? Review of Agricultural Economics, 29(3), 502–509. http://dx.doi. org/10.1111/j.1467-9353.2007.00361.x
Lynch, L., Gray, W., & Geoghegan, J. (2010). Evaluation of agricultural land preservation programs. In S. J. Goetz and F. Brouwer (Eds.), New perspectives on agri-environmental policies: A multidisciplinary and transatlantic approach (pp. 72–92). New York: Routledge.
Maryland Agricultural & Resource-Based Industry Development Corporation [MARBIDCO]. (2014). Summary points for the Next Generation Farmland Acquisition Program. Annapolis, Maryland: Author. Retrieved March 17, 2014, from http://www.marbidco.org/land/nextgen.html
Maryland Agricultural Land Preservation Foundation. (2012). Forms: Application to sell an easement. Retrieved from http://www.malpf.info/forms.html
Maryland Agricultural Land Preservation Foundation. (n.d.). Maryland Agricultural Land Preservation annual report, fiscal year 2013. Annapolis, Maryland: Maryland Department of Agriculture, MALPF. Retrieved from http://mda.maryland.gov/ Documents/MALPFar.13.pdf
Maryland Department of Agriculture. (n.d.). Maryland Agricultural Land Preservation Foundation. Retrieved July 16, 2014, from http://mda.maryland.gov/ Pages/Agland_Preservation_Foundation.aspx
Maryland Department of Agriculture. (2013, December 17). State to consider request to terminate farmland preservation easement at public hearing on request by Howard County farmer [News release]. Retrieved from http://news.maryland.gov/mda/ press-release/2013/12/17/state-to-consider-request-to-terminate-farmland-preservation-easement-at-public-hearing-on-request-by-howard-county-farmer/
Maryland Department of Natural Resources [MDNR]. (n.d.). Maryland Environmental Trust: Questions commonly asked about conservation easements. Retrieved from http://www.dnr.state.md.us/met/faq.asp
MDNR. (2009, December 16). Governor O’Malley announces $11 million in proposed rural legacy allocations for FY 2010. Retrieved July 2014 from http://www.dnr.state.md.us/dnrnews/pressrelease2009/sgg_121609.asp

Journal of Agriculture, Food Systems, and Community Development ISSN: 2152-0801 online
www.AgDevJournal.com
150 Volume 5, Issue 2 / Winter 2014–2015
MDNR. (2014, February 24). Maryland Environmental Trust protects 2,361 acres in 2013. Retrieved July 10, 2014, from http://news.maryland.gov/dnr/ 2014/02/24/maryland-environmental-trust-protects-2361-acres-in-2013/
Maryland Environmental Trust. (2013). Long range plan 2014–2020. Crownsville, Maryland: Maryland Department of Natural Resources, MET. Retrieved from http://www.dnr.state.md.us/met/pdfs/ MET_LongRangePlan_2014-2020.pdf
Massachusetts Agricultural Preservation Restriction Program, 330 CRM 22.10. (2009). Retrieved from http://www.mass.gov/eea/docs/agr/legal/regs/ 330-cmr-22-00.pdf
Menard, S. (2002). Applied logistic regression analysis (2nd Ed.) Thousand Oaks, California: Sage Publications.
Miller, S., & Cocciarelli, S. (2012). The Michigan farm succession study: Findings and implications. East Lansing, Michigan: Michigan State University Center for Regional Food Systems. Retrieved from http://foodsystems.msu.edu/uploads/file/CRFS_Farm_Succession_report.pdf
Mishra, A., & El-Osta, H. (2008). Effect of agricultural policy on succession decisions of farm households. Review of Economics of the Household, 6(3), 285–307. http://dx.doi.org/10.1007/s11150-008-9032-7
Mishra, A., El-Osta, H., & Shaik, S. (2010). Succession decisions in U.S. family farm businesses. Journal of Agricultural and Resource Economics, 35(1), 133–152.
Mishra, A., Johnson, J., & Moreheart, M. (2003, September). Retirement and succession planning of farm households: Results from a national survey. Paper presented at the meeting of the National Public Policy Education Committee, Salt Lake City, Utah. Retrieved from http://www.farmfoundation.org/ news/articlefiles/85-Mishrapaper10-1-03_Version3.pdf
Nickerson, C. & Lynch, L. (2001). The effect of farmland preservation programs on farmland prices. American Journal of Agricultural Economics, 83(2), 341–351. http://dx.doi.org/10.1111/0002-9092.00160
Nickerson & Hellerstein. (2003). Protecting rural amenities through farmland preservation programs. Agricultural and Resource Economics Review, 32(1), 129–144.
Nickerson, C., Morehart, N., Kuethe, T., Beckman, J., Ifft, J., & Williams, R. (2012). Trends in U.S. farmland
values and ownership (EIB 92). Washington, D.C.: USDA Economic Research Service. Retrieved from http://www.ers.usda.gov/media/377487/eib92_2_.pdf
Norusis, M. (2011). IBM SPSS statistics 19 advanced statistical procedures companion. Upper Saddle River, New Jersey: Pearson Education.
O’Neill, B., Komar, S., Brumfield, R., & Mickel, R. (2014). Later life farming: Retirement and succession concerns of farm households. Module 9b: Farmland preservation—A source of retirement income? [Online Course] New Brunswick, New Jersey: Rutgers Cooperative Extension. Retrieved from http://laterlifefarming.rutgers.edu/module 09/farmland+preservation+programs.html
Pew Research Center for the People & the Press. (2012). Surveys facing increasing difficulty reaching, persuading potential respondents [Table]. Washington, D.C.: Pew Research Center. Retrieved from http://www.people-press.org/2012/05/15/ assessing-the-representativeness-of-public-opinion-surveys/
Potter, C., & Lobley, M. (1992). Aging and succession on family farms: The impact on decision- making and land use. Sociologia Ruralis, 32(2/3), 317–334. http://dx.doi.org/10.1111/j.1467-9523.1992. tb00935.x
Schilling, B., Attavanich, W., Sullivan, K., & Marxen, L. (2014). Measuring the effect of farmland preservation on farm profitability. Land Use Policy, 41, 84–96. http://dx.doi.org/10.1016/j.landusepol. 2014.04.019
Schilling, B., Sullivan, K., & Duke, J. (2013). Do residual development options increase preserved farmland values? Journal of Agricultural and Resource Economics, 38(3), 327–343.
Schilling, B., Sullivan, K., & Komar, S. (2012). Examining the economic benefits of agritourism: The case of New Jersey. Journal of Agriculture, Food Systems and Community Development, 3(1), 199–214. http://dx.doi.org/10.5304/jafscd.2012.031.011
State Agricultural Development Committee [SADC]. (n.d.). Farmland availability/farmland affordability. Trenton, New Jersey: State of New Jersey Department of Agriculture, SADC. Retrieved from http://www.nj.gov/agriculture/sadc/news/hottopics/farmavailabilityintro.pdf

Journal of Agriculture, Food Systems, and Community Development ISSN: 2152-0801 online www.AgDevJournal.com
Volume 5, Issue 2 / Winter 2014–2015 151
SADC. (2013a). Overview: Farmland preservation. Trenton, New Jersey: State of New Jersey Department of Agriculture, SADC. Retrieved from http://www.nj. gov/agriculture/sadc/farmpreserve/
SADC. (2013b). New Jersey farmland preservation program—Summary of preserved farmland. Trenton, New Jersey: State of New Jersey Department of Agriculture, SADC. Retrieved from http://www.nj.gov/agricul ture/sadc/farmpreserve/progress/stats/preserved summary.pdf
State of Delaware. (2012). Delaware Young Farmers Program helps 10 farm families purchase land in first year. Dover, Delaware: Department of Agriculture. Retrieved from http://news.delaware.gov/2012/ 08/01/delaware-young-farmers/
State of Delaware, Department of Agriculture. (2013). Farmland preservation in Delaware. Dover, Delaware: Department of Agriculture. Retrieved from http://dda.delaware.gov/aglands/lndpres.shtml
State of New Jersey, Department of Agriculture. (2013). 2013 resolutions: Farm bill priorities. Trenton, New Jersey: State of New Jersey Department of Agricul-ture, Retrieved from http://www.nj.gov/agricul ture/conventions/2013/farmbillpriorities.html
U.S. Department of Agriculture. (2013). Urban influence codes. Washington, D.C.: USDA. Retrieved from http://www.ers.usda.gov/data-products/urban-influence-codes.aspx
U.S. Department of Agriculture, National Agricultural Statistics Service. (2014). Washington, D.C.: USDA, NASS. 2012 Census of agriculture, U.S. summary and state reports. Retrieved from http://www.agcensus. usda.gov/Publications/2012/
U.S. Department of Agriculture, National Research Initiative. (2010). Research report and recommendations from the FarmLASTS project. Washington, D.C.: USDA National Department of Agriculture. Retrieved from http://www.uvm.edu/farmlasts/ FarmLASTSResearchReport.pdf
U.S. Department of Agriculture, Natural Resources Conservation Service. (2009). Summary report: 2007 National Resources Inventory. Washington, D.C.: UDSA-NRCS, and Ames, Iowa: Center for Survey Statistics and Methodology, Iowa State University. Retrieved from http://www.nrcs.usda.gov/Inter net/FSE_DOCUMENTS/stdprdb1041379.pdf
USDA, Natural Resources Conservation Service. (2013). Virginia 2013 Farm & Ranch Lands Protection Program (FRPP) ranking worksheet. Retrieved from http://www.nrcs.usda.gov/Internet/FSE_ DOCUMENTS/nrcs142p2_018739.pdf
Vermont Land Trust. (n.d.). Conserving Vermont’s farmland. Retrieved November 15, 2013, from http://www.vlt.org/land-weve-conserved/ farmland

Journal of Agriculture, Food Systems, and Community Development ISSN: 2152-0801 online
www.AgDevJournal.com
152 Volume 5, Issue 2 / Winter 2014–2015
Appendix Table A1. Results of Ordinary Least Squares and Binary Logistic Regressions: Predictors of Percentage of Preserved Land Being in Owners’ and/or Their Tenants’ Farming Operations
Ordinary Least Squares Regression for Predicting
Percent of Total Preserved Land in Farm Operations
Binary Logistic Regression for Predicting Whether at Least 75% of Acres Were Farmed
Predictor Variables Regression
Coefficient a
Level of Statistical
Significance Regression Coefficient
Level of Statistical
Significance Odds Ratio b
Sold easements only 6.191 .040 .753 .002 2.123
Operator of his or her eased land 26.928 .000 1.385 .000 3.996
Primary occupation was farming c 8.758 .008 .827 .004 2.287
Eased land under the NJ program 9.746 .001 .860 .000 2.362
Eased land under MET –12.367 .006 –.274 .447 .761
Eased land produced income from both crops and livestock
6.006 .128 .945 .019 2.573
Eased land produced income from logging –5.132 .307 –.795 .052 .452
Total acres of preserved land .001 .734 .000 .635 1.000
Current age (in years) .088 .432 –.001 .902 .999
Male gender 4.240 .128 .405 .073 1.499
Constant 40.093 .000 –1.479 .021 .228
Total Cases: n=500 d
Goodness of Fit measure Adjusted R Square=0.302 Nagelkerke R Square=0.345
a The predicted change in the percentage of preserved land in a farming operation associated with a one-unit increase in the predictor variable, with other predictor variables in the equation held constant. b The odds ratios result from exponentiating the logistic regression coefficient for each variable. For further information about “odds ratios,” see footnote 12. c And the respondent also farmed at least some of his or her preserved land. d Missing are four respondents who did not report their numbers of protected acres and three who did not report their ages.

Journal of Agriculture, Food Systems, and Community Development ISSN: 2152-0801 online www.AgDevJournal.com
Volume 5, Issue 2 / Winter 2014–2015 153
Table A2. Results of Logistic Regression Analysis: Predictors of a Respondent Having a Successor Who Will Use Preserved Land for Agricultural Production
Binary Logistic Regression Ordinal Logistic Regression
Predictor Variables Regression Coefficient
Level of Statistical
Significance Odds Ratio a Regression Coefficient
Level of Statistical
Significance Odds Ratio a
Generation .144 .663 1.555 –.234 .275 0.791
Age of owner .032 b .007 1.033 .476 b .026 1.610
Median years owned land that was preserved (≥10 years versus fewer)
–.414 .129 .661 –.027 .885 0.973
Median acres preserved (≥115 acres versus fewer)
.961 .000 2.614 .723 .000 2.061
Operated at least some of hisor her preserved land
–.394 .268 .674 .083 .726 1.087
Primary occupation is farming 1.226 .000 3.406 .605 .008 1.831
Rents out preserved land .302 .350 1.352 .412 .055 1.510
Invested in farm equipment or machinery
.569 .067 1.767 .324 .121 1.383
College graduate –.676 .011 .509 –.518 .004 0.596
Male gender –.310 .242 .733 –.209 .260 0.811
Very satisfied owning preserved land
1.147 .000 3.150 .600 .001 1.822
Constant –4.547 .000 .011 — — —
Total Cases n=454 n=454 c
Goodness-of-fit Measure Nagelkerke R Square=0.223 Nagelkerke R Square=0.146
a The odds ratios in these columns result from exponentiating the logistic regression coefficient for each variable. The ordinal logistic regression model passed the “Test of Parallel Lines” (Norusis, 2011). b While the binary regression’s measurement of age was interval level (reported years of age), the ordinal regression used a two-value variable, with 0=that the respondent was in the first quartile of age (up to and including 53 years of age) and 1=that the respondent was older than 53. c The analysis was limited to respondents who were either exclusively first- or later-generation owners.