the future of telecommunication: the ... - new york university
TRANSCRIPT

1
The Future of Telecommunication: The Determinants of
Cellular Network Penetration and their Impact in
Developing Countries
by
Tsz Wai Au
An honors thesis submitted in partial fulfillment
of the requirements for the degree of
Bachelor of Science
Undergraduate College
Leonard N. Stern School of Business
New York University
May 2019
Professor Marti G. Subrahmanyam Professor Ingo Walter Faculty Adviser Thesis Adviser

2
Abstract
In this paper, we investigate how industry-related and macroeconomic variables affect the
diffusion of telecommunications services. We use evidence from 16 developing countries over a
17-year period, from 2000 to 2016, to examine the influences these variables may have had on
cellular network penetration and the variations between countries. We also compare the effects
of the variables on cellular telephony and cellular data markets to recognize any potential
variation in determinants between the two services. We find evidence of significant correlations
with five variables for cellular telephony market penetration, including: Total Revenue, Revenue
per user, GDP per Capita, GSM vs CDMA, and Capital expenditure. Meanwhile, we find weak
correlations with an additional three variables for cellular data market penetration, including: the
percentage of urban population, the initial level of data connectivity infrastructure, and the
presence of international corporations with colonial links.

3
Acknowledgements
First of all, I would like to express my gratitude to my thesis adviser, Professor Ingo
Walter. This thesis paper would not have been possible without his unceasing support and
guidance along the research process. His expertise and passion for infrastructure investments
have made the study so much more interesting.
I would also like to show my appreciation to my parents for letting me study overseas.
The valuable experience has clearly enhanced my knowledge and changed my life trajectory.
I would also like to thank Professor Marti G. Subrahmanyam and Jessica Rosenzweig for
organizing the Stern Honors Thesis Program; the experience has definitely broadened my
perspectives.
Thank you to those in the Honors cohort for making early morning Friday and late night
Thursday classes bearable for the first time. I wish you all the best of luck in your future
endeavors, and I cannot wait to see your achievements.
Last but not least, everything in the world is related one way or another; connectivity just
makes them more accessible.

4
Table of Contents
Introduction ............................................................................................................................... 5
Background ....................................................................................................................................... 5
Research Question ............................................................................................................................. 6
Economic Implications ...................................................................................................................... 7
Literature Review ..................................................................................................................... 16
Research Design ...................................................................................................................... 18
Hypothesis ........................................................................................................................................ 18
Data and Empirical Methods .......................................................................................................... 19
Results ...................................................................................................................................... 21
Graphical Illustrations .................................................................................................................... 21 Initial Analysis ............................................................................................................................................ 21 Regional Analysis ....................................................................................................................................... 24 Determinants Analysis ................................................................................................................................ 27
Model Fitting ................................................................................................................................... 35
Implications for government and industry participants ........................................................... 38
Potential Future Research ....................................................................................................... 41
Conclusion ............................................................................................................................... 43
Appendices ............................................................................................................................... 45
References ................................................................................................................................ 64

5
Introduction
Background At the end of 2019, many markets will begin to implement the fifth generation of cellular
network configuration (5G). The upgrade marks the beginning of a new era in mobile
connectivity. Officially introduced as the IMT-2020 framework by the International
Telecommunication Union in 2015, the technical framework introduces new technologies like
millimeter waves, ultra-low power radios, and higher radio frequency utilization. The new
generation of cellular network systems would improve the mobile telecommunication experience
by introducing three configurations to address different intentions: 1) eMBB will increase speed,
2) URLLC will decrease latency, and 3) mMTC will reduce the power consumption required for
devices to connect to wireless networks. These improvements find substantial applications in
automobiles, automation, the Internet of Things, and more. The innovations and enhancements
are expected to revolutionize our daily lives on the same caliber as how the internet changed
global business operations and our methods of communication.
The ease of transferring information using mobile telecommunication is something that
we have taken for granted. Before the mid nineteenth century, transferring information between
entities was solely determined by one’s travel speed. Before mechanical transportation, the
fastest speed information can travel was around 300 km per day by trained Mongol army
messengers. Sending messages across the Atlantic required an agonizing two weeks. The
invention of the telegraph propelled the world forward by enabling information to be sent to
anywhere around the world in a matter of seconds. The achievement brought us closer to the
instant communication that we have access today. However, it had a limitation regarding the
length of each message. It was fixed-line telecommunication that enabled mass population to

6
access high speed communication without restrictions on message size and cryptography
knowledge. Nowadays, cellular networks allow users to communicate with counterparties on the
fly. Accenture estimates that the cellular industry creates over 4.7 million jobs across the US
economy and contributes at least $475 billion to the country’s output. 1
Cellular telecommunication has only been around for merely four decades. It first began
in the 1980s with the first generation (1G), which was an analogue system that enabled wireless
voice calling. The second generation (2G) was introduced in 1988; the new framework
digitalized cellular communication, utilized the spectrum more efficiently, and introduced text
messaging. The third generation (3G), introduced in 2008, enabled better communication quality
and, in 2010, mobile Internet access. Yet, the information transfer speed was incomparable to
fixed-line broadband connections, so it was only capable of loading simple websites and images.
The current wireless communication standard is the fourth generation (4G); it improved the
reliability of network connections, and it increased the connectivity speed of data services, which
enabled high-speed internet surfing and video streaming. Nowadays, many technology
companies and new economy firms are established on the bedrock of having high speed mobile
broadband connections, which only became technologically viable in 2010. Each generation of
cellular network lasts for around a decade. Ultimately, 5G, to be introduced at the end of 2019,
would enhance the mobile connectivity experience while lowering the cost of telecommunication
infrastructure, making rural cellular connectivity more affordable for consumers and operators.
Research Question This thesis attempts to understand how industry-related and macroeconomic variables
affect the growth of mobile network market penetration in developing countries.
1 Accenture. “U.S. Wireless Industry Contributes $475 Billion Annually to America's Economy and Supports 4.7 Million Jobs, A.” Newsroom Main, Accenture, 5 Apr. 2018, newsroom.accenture.com/news/us-wireless-industry-contributes-475-billion-annually-to-americas-economy-and-supports-4-7-million-jobs-according-to-new-report.htm.

7
Economic Implications Telecommunication has an extensive spillover effect that benefits the economy in
multiple areas. It improves connectivity between principals, agents and other stakeholders in
economies, easing the cost of communicating, cost of transactions, cost of information, and
more. Individuals or corporations are able to communicate more efficiently, increase competition
in almost all industries, and reduce information asymmetry.2 Adeoti and Adeoti reinforces the
notion that mobile telephony decreases information and transaction costs further by enabling a
large proportion of the population, who were previously held back by expensive and inefficient
landlines, access to communication services.3
Furthermore, cellular telecommunication exhibits network effects, where the value of the
network increases as more users enroll into the system. Socially, the additional participation
equates to a lower barrier for communication and better connectivity between entities. It,
therefore, exhibits positive marginal efficiency of connectivity; each additional user increases the
overall social efficiency.
2 Estache, Antonio, and Grégoire Garsous. “The Impact of Infrastructure on Growth in Developing Countries.” IFC Economics Notes, 2012. 3 Adeoti, John Olatunji, and Adetola Ibidunni Adeoti. “Easing the Burden of Fixed Telephone Lines on Small-Scale Entrepreneurs in Nigeria: GSM Lines to the Rescue.” Telematics and Informatics, vol. 25, no. 1, 2008, pp. 1–18.

8
Figure 1: Macro Variable Diagram
The externalities of connectivity are positively and directly impacting consumers in the
economy. With information being more accessible than ever, consumers are able to make more
informed purchasing decisions; it increases consumer surplus and improves consumer welfare.
Additionally, the exposure to more information and products leads to more economic activity
and results in a positive increase in the demand side of the economy; it is shown in Figure 1 by
the step function increase in output.
In addition, connectivity has tertiary effect on businesses in the economy. Entrepreneurs
are now able to conduct businesses in fields that were previously inviable due to operational or
informational constraints. On the one hand, they are able to obtain new inputs. On the other
hand, more interactions produce additional information, innovative products, services, and
inspirations for the market; it creates a positive supply shock and facilitates a tertiary effect on
the economy by generating endogenous technological changes, increasing the potential output of
the economy.4 The supply increases at a slower pace due to the time lag between inspiration and
availability of products.
4 Romer, Paul. “Endogenous Technological Change.” The Journal of Political Economy, vol. 98, no. 5, ser. 2, 1990.

9
Cellular telecommunication also removes the barriers for forming platforms and enables
experts to provide services to consumers without the need of intermediary institutions.5 The
establishment of C2C platforms enables direct contact between providers and customers. The
ease of entry to a platform marketplace stimulates more economic activity.
Businesses also benefit from telecommunication connectivity which facilitates scope
economies. Companies are able to move vertically and horizontally across the value chain and
expand their sources of revenue and opportunities. For example, Uber’s expansion into the food
delivery business, and AT&T’s extension into the media and entertainment markets by acquiring
Time Warner Inc. Conglomerates also benefit from improved connectivity. Chaebols, for
example, are able to reduce transaction and information costs across their business lines by
streamlining communication; they can also utilize their platforms for cross marketing and cross
selling. In fact, connectivity reduces the “distance” between countries and aids the smooth
operations of global commerce and trade. Globalization, in the form of faster technology
diffusion, is said to be a facilitator in innovation for both ends of trading activities. Thus,
connectivity initiates and reinforces innovation on a global scale. 6
From a public policy standpoint, understanding the key effects of improving access to
cellular telephony and mobile data to society is crucial in justifying the investments made in the
area due to the industry’s capital intensive nature. Moreover, the large fixed costs, sunk costs and
capital expenditures compel network operators to understand the essence of maintaining
competitiveness in the industry to generate positive returns.
5 Sundararajan, Arun. “Crowd-Based Capitalism, Digital Automation, and the Future of Work.” University of Chicago Legal Forum, vol. 2017, 19. 2018. 6 Eaton, Jonathan, and Samuel Kortum. “Innovation, Diffusion, and Trade.” 2006.

10
Furthermore, telecommunication exhibits positive marginal product of capital investment
in building the infrastructure; Waverman et al. show that capital used in telecommunication is
subject to increasing returns, suggesting that countries have net positive monetary benefits with
an increase in telecommunication investments. 7
Figure 2: Positive Marginal Product of Capital
In Figure 2, the economy exhibits a kink in marginal efficiency of capital (MEC). If the
status quo of the economy is at point A without any investments in telecommunication, the MEC
curve would be a simple downward sloping curve; this assumes that there is no other
infrastructure investment in the economy. Point B is the normal equilibrium, when there is an
increase in capital. Due to the positive marginal efficiency of connectivity, positive externalities,
and more economic activities, the MEC curve has a positive kink; the MEC slope is flatter after
point A, due to investments in telecommunications. Therefore, an increase in capital (K) in
telecom investments from K1 to K2 would only lead to a slight decrease in returns from R1 to R*,
7 Waverman, Leonard, et al. “The Impact of Telecoms on Economic Growth in Developing Countries.” The Vodafone Policy Paper Series, vol. 2, no. 3, 2005.

11
which is significantly less than the drop from R1 to R2 if the MEC curve does not have a kink.
The new equilibrium after capital investments in telecommunication infrastructure is at point C.
At the new equilibrium, there is additional return on labor in the area represented by the red
region and additional return on capital shown by the blue region. Additional return on capital
incentivizes more investments. Finally, the triangle ABC shows additional return for the
economy.
Roller and Waverman reinforce the proposition of high cellular utilization by establishing
that the benefits of cellular telecommunication to economic growth and development are
maximized when market penetration is near universal (i.e. above 90%) due to network effects;
thus, there is positive marginal product of capital until market penetration reaches the saturation
point.8 It provides a strong incentive for countries to strive for high connectivity coverage.
Telecommunication infrastructure also has macroeconomic impacts on society. Solow
and Swan model long term economic growth by the formula, !" = $"%"&'"()&.9 According to
Rostow, the initial stage of economic growth for a developing nation is to utilize human manual
labor.10 However, the lack of training for manual labor restricts productivity and potential output.
Yet, at an early stage of growth, due to insufficient savings, an economy lacks the capital to
invest in more productive and more capital-intensive activities. Thus, the economy would grow
by increasing labor force participation with its population acting as a constraint. Over time,
savings in the economy will increase.11 As labor market supply decreases over time with more
8 Röller, Lars-Hendrik, and Leonard Waverman. “Telecommunications Infrastructure and Economic Development: A Simultaneous Approach.” American Economic Review, vol. 91, no. 4, 2001, pp. 909–923. 9 Solow, Robert M. “A Contribution to the Theory of Economic Growth.” The Quarterly Journal of Economics, vol. 70, no. 1, 1956, pp. 65–94. 10 Rostow, Walt Whitman. The Stages of Economic Growth: A Non-Communist Manifesto. Cambridge University Press, 1960. 11 Deaton, Angus S., and Christina H. Paxson. “The Effects of Economic and Population Growth on National Saving and Inequality.” Demography, vol. 34, no. 1, 1997, pp. 34–97.

12
employment, labor costs will increase. If labor costs continue to increase while productivity
remains stagnant, firms would move production to another market with lower labor costs.
Therefore, productivity and efficiency of labor and capital need to increase for a country to
remain competitive.
Infrastructure investments could play an important role in promoting further economic
growth by 1) increasing the variety of job opportunities available, and 2) improving productivity.
In fact, infrastructure investment is a self-reinforcing mechanism that enables a sequential impact
on growth. When an economy has grown to a substantial size, it would have a sizable domestic
savings pool or attracted foreign savings flowing in as a form of foreign investment. Capital
provides enormous leverage for potential output by enabling the purchase of more machines,
more raw materials, thus more production. The leverage of capital spending is even more
apparent in infrastructure investments. The nature of telecommunication infrastructure projects
exhibits enormous positive externalities resulting in a bidirectional effect that reinforces
growth.12 The World Bank has found that infrastructure spending of around 5 to 6 percent of
GDP would increase the growth rate of GDP per capita by 0.5 percentage points in the first two
decades and one percentage point in the third decade of implementation.13 Therefore,
infrastructure is both a product and a reinforcer of growth.
Additionally, in the rural context, telecommunication infrastructure has enormous
positive externalities that are hard to capture. It is a critical factor in enabling rural areas to
participate fully in national and international economies. Klonner and Nolen have identified a
12 Pradhan, Rudra P., et al. “Telecommunications Infrastructure and Economic Growth: Comparative Policy Analysis for the G-20 Developed and Developing Countries.” Journal of Comparative Policy Analysis: Research and Practice, vol. 16, no. 5, 2014, pp. 401–423. 13 Odawara, Rei, and Norman V. Loayza. “Infrastructure And Economic Growth In Egypt.” Policy Research Working Papers, 2010.

13
causal effect of cellular network coverage on labor market outcomes in South Africa.
Employment increases by 15 percentage points when a locality receives network coverage. Most
of the increase in the labor market is due to increased female employment.14
Aforementioned, the externalities telecommunication generate cover a wide spectrum of
areas in the economy, from the principal-agent problem and economies of scope, to increasing
demand and economic growth. However, the spillover effect goes as far as improving the
standards of living for many. Cellular telecommunication facilitates the implementation of
socially desirable innovations, including: mobile money services15 (e.g. M-PESA, WeChat Pay),
remote health services, mobile disaster response systems, digital proof of identity 16 (e.g.
Commonwealth Digital Identity Initiative), payment systems for utilities, programs that
encourage female workforce participation, and more.17
For financial services specifically, the spillover effect is recursive. As more people gain
access to banking services and FinTech innovations, there is a greater amount of savings, and
more capital available for investments. This aids future telecommunication investments and
brings socially desirable services to more people. Together with growth, telecommunications is
the engine of the escape from poverty for many.18 Thompson and Garbacz identify that mobile
connectivity has the largest economic impact when compared to other telecommunications
services in developing economies.19
14 Klonner, Stefan, and Patrick Nolen. “Cell Phones and Rural Labor Markets: Evidence from South Africa.” Proceedings of the German Development Economics Conference, Hannover, no. 56, 2010. 15 Yermack, David. “FinTech in Sub-Saharan Africa: What Has Worked Well, and What Hasn't.” 2018. 16 For health and government provision services like cash handout programs 17 GSMA. “GSMA Mobile for Development.” Mobile for Development, 2019, www.gsma.com/mobilefordevelopment/. 18 Reeves, Richard V. “The Economic Case for Social Mobility.” Brookings, Brookings, 28 July 2016, www.brookings.edu/opinions/the-economic-case-for-social-mobility/. 19 Thompson, Herbert G., and Christopher Garbacz. “Economic Impacts of Mobile versus Fixed Broadband.” Telecommunications Policy, vol. 35, no. 11, 2011, pp. 999–1009.
14
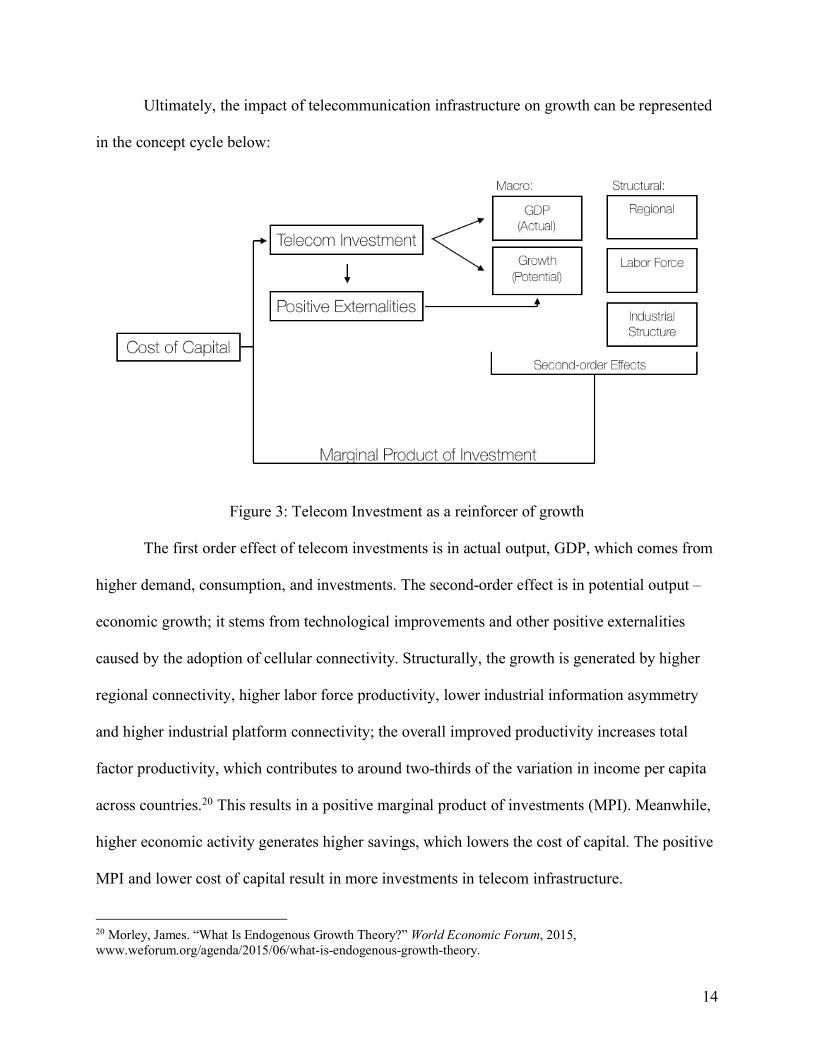
Ultimately, the impact of telecommunication infrastructure on growth can be represented
in the concept cycle below:
Figure 3: Telecom Investment as a reinforcer of growth
The first order effect of telecom investments is in actual output, GDP, which comes from
higher demand, consumption, and investments. The second-order effect is in potential output –
economic growth; it stems from technological improvements and other positive externalities
caused by the adoption of cellular connectivity. Structurally, the growth is generated by higher
regional connectivity, higher labor force productivity, lower industrial information asymmetry
and higher industrial platform connectivity; the overall improved productivity increases total
factor productivity, which contributes to around two-thirds of the variation in income per capita
across countries.20 This results in a positive marginal product of investments (MPI). Meanwhile,
higher economic activity generates higher savings, which lowers the cost of capital. The positive
MPI and lower cost of capital result in more investments in telecom infrastructure.
20 Morley, James. “What Is Endogenous Growth Theory?” World Economic Forum, 2015, www.weforum.org/agenda/2015/06/what-is-endogenous-growth-theory.

15
This paper focuses on a group of developing countries, since the greatest potential for
economic growth and telecommunication investment growth lies in these nations. Nonetheless,
each country may behave differently based on its development level. For developing countries
that lack cellular infrastructure beforehand, a relatively small-scale telecom implementation
could lead to a massive growth in penetration for calling and texting services. Many corporations
rely heavily on public infrastructure in developing countries because such a large portion of their
businesses depend on it.21 Since telecommunications provides connectivity and reduces business
costs, the marginal value for cellular connectivity in developing countries is high.
For wealthier countries, since the marginal efficiency of connectivity results in a
downward sloping demand curve, their consumers will demand fewer additional units of cellular
connections. However, countries with high per capita GDP would likely have greater growth in
penetration for cellular data to provide users the ability to consume online content while mobile.
Developing countries would likely have the highest marginal benefits of connectivity;
they could extract massive positive externalities from cellular networks with the exponential
drop in information and transaction costs. Lower costs result in higher economic activity and
growth. Torero, Chowdhury, and Bedi illustrate a causal link between telecommunication
infrastructure and growth in developing countries, with the effect most pronounced when
penetration rate is between 5-15 percent.22 Economic growth is a high priority for governments
in developing countries. High growth facilitates better standards of living and income.
Lastly, development economics is still controversial with regards to the optimal method
of increasing development. William Easterly, for example, disapproves the idea of technocratic
21 Munshi, Neil. “Groups Adapt to Insurgency to Tap Nigerian Growth.” Financial Times, Financial Times, 11 Dec. 2018, www.ft.com/content/b45be464-f940-11e8-af46-2022a0b02a6c. 22 Cullen Máximo, Torero, and Joachim Von Braun. Information and Communication Technologies for Development and Poverty Reduction: the Potential of Telecommunications. Johns Hopkins University Press, 2006.

16
investments in developing countries; expensive remote toilets do not effectively improve living
standards, and the reliance on foreign aid makes these implementations unsustainable. He
advocates the notion that infrastructure investments should be complemented with policy
reforms for maximum impact.23 Thus, the analysis may shed light on the discussion regarding the
importance of policies in infrastructure investing.
Ultimately, it is valuable to understand how countries can encourage growth in cellular
network penetration to generate higher living standards. With a multitude of benefits, it is
beneficial, especially from a policy standpoint, to find accurate means of projecting the trends in
cellular network penetration.
Literature Review Research on the diffusion of cellular telecommunication has existed for a period of time.
Most research focus mainly on one specific country or region. Telang’s analysis uses cellular
telephony and data service data in Asia to estimate the drivers for cellular services and how
demographic and mobile plan characteristics affect user choice.24 Dekimpe et al. propose an
international diffusion model to the cellular industry. It reveals that the critical factor in
explaining diffusion patterns across countries is the social system size and adoption ceiling. It
suggests that greater research efforts should be made at the early stages of implementation to
develop models that can assist managers in understanding and anticipating variances in diffusion
trends.25 Meanwhile, Jha and Majumdar examine the impact of cellular technology diffusion on
the competitiveness of the telecommunication sector in OECD countries. They identify that the
23 O’Neal, Adam. “The Anti-Bill Gates.” The Wall Street Journal, Dow Jones & Company, 7 Dec. 2018, www.wsj.com/articles/the-anti-bill-gates-1544227025. 24 Telang, Rahul. “An Empirical Analysis of Cellular Voice and Data Services.” SSRN Electronic Journal, 2004. 25 Dekimpe, Marnik G., et al. “Staged Estimation of International Diffusion Models.” Technological Forecasting and Social Change, vol. 57, no. 1-2, 1998, pp. 105–132.

17
liberalization of the competitive environment positively enhances productive efficiency.26 On a
smaller scale, Gruber and Verboven analyze the technological and regulatory determinants of the
diffusion of mobile telecommunications services in the European Union using a logistic model of
diffusion. Their research shows that there is a late mover advantage in penetration rate due to the
convergence effect and technology diffusion. Additionally, the impact of competition in the
market is significant though the effect was smaller than the technology effect, which includes
increasing spectrum capacity and technology advancements.27 A research on the Taiwanese
telecommunication market identifies service plan price as the primary driver of the diffusion rate
of mobile telephony.28
On a domestic scale, Buys et al. investigate the determinants of disparities in coverage by
cellular systems in Sub-Saharan Africa. They use accessibility data as a proxy for cost. The final
simulation shows that an improvement in competition policy could lead to huge improvements in
cell phone area coverage, and to an overall coverage increase of nearly 100%.29 Meanwhile, J.
Wareham et al. investigate the socio-economic factors that determine the diffusion of mobile
telecommunications in hope of understanding the gaps in digital inclusion within America. Their
study shows that income, metropolitan area size, occupation, and ethnic group are positively
correlated with mobile phone adoption.30 Also, Niculescu and Whang explore the parallel market
evolution of voice and data markets, inspecting the differences and interactions between the
26 Jha, Raghbendra, and Sumit K. Majumdar. “A Matter of Connections: OECD Telecommunications Sector Productivity and the Role of Cellular Technology Diffusion.” Information Economics and Policy, vol. 11, no. 3, 1999, pp. 243–269. 27 Gruber, Harald, and Frank Verboven. “The Diffusion of Mobile Telecommunications Services in the European Union.” European Economic Review, vol. 45, no. 3, 2001, pp. 577–588. 28 Chu, Wen-Lin, et al. “Diffusion of Mobile Telephony: An Empirical Study in Taiwan.” Telecommunications Policy, vol. 33, no. 9, 2009, pp. 506–520. 29 Buys, Piet, et al. “Determinants of a Digital Divide in Sub-Saharan Africa: A Spatial Econometric Analysis of Cell Phone Coverage.” World Development, vol. 37, no. 9, 2009, pp. 1494–1505. 30 Wareham, Jonathan, et al. “Wireless Diffusion and Mobile Computing: Implications for the Digital Divide.” Telecommunications Policy, vol. 28, no. 5-6, 2004, pp. 439–457.

18
associated adoption processes. The research shows that there is a two-way co-diffusion effects at
the speed of adoption for voice and data.31
Forecasting cellular connectivity diffusion trends has also been a frequent research
interest. Academics have utilized time-series forecasting methods to project future short to
medium-term mobile penetration trends. C. Christodoulos et al. study the OECD countries using
exponential smoothing and diffusion forecast methods.32
Research Design
Hypothesis
The primary objective of this study is to provide a directional conclusion on the major
determinants of cellular telecommunication. By choosing a selection of relevant variables, we try
to understand how industry and macroeconomic variables correlate with the market penetration
of cellular telephony and cellular data services. A majority of current research focuses on a
specific country or region. However, the trend dismisses the notion that there could be
interregional correlation in network penetration, which is an area this study aims to provide
insight on.
There are several secondary hypotheses the thesis attempt to answer. First, cross section
correlation in market penetration is high, however, the pacing is idiosyncratic to each country.
Second, countries using the Common Law system have better technology implementations
compared to countries using the Civil Law system. Third, economic output and mobile network
31 Niculescu, Marius F., and Seungjin Whang. “Research Note—Codiffusion of Wireless Voice and Data Services: An Empirical Analysis of the Japanese Mobile Telecommunications Market.” Information Systems Research, vol. 23, no. 1, 2012, pp. 260–279. 32 Christodoulos, Charisios, et al. “On the Combination of Exponential Smoothing and Diffusion Forecasts: An Application to Broadband Diffusion in the OECD Area.” Technological Forecasting and Social Change, vol. 78, no. 1, 2011, pp. 163–170.

19
penetration have a bidirectional relationship. Fourth, private network operators are more
innovative than government-run operators, thus countries with majority private operators should
experience faster market penetration growth.
Data and Empirical Methods
Secondary research is used extensively for the core of the analysis. To understand the
impacts of multiple independent variables on mobile network market-penetration, the study
utilizes multiple linear regressions and graphical illustrations. The panel data used for the study
center on 18 independent variables. These include industry-related variables: industry
concentration, mobile network revenues, average revenue per user, the initial level of mobile
telecom infrastructure, total industry capital expenditure, CDMA vs GSM, the presence of
multinational network operators, the presence of multinational network operators with colonial
links, and the level of privatization in the industry. They also include macroeconomic variables
like degree of urbanization, GDP, GDP per capita, total factor productivity, sovereign risk,
investment to GDP ratio, rule of law, national infrastructure development level, and geographical
region. Dependent variables include market penetration rates for cellular telephony subscription
(calling & texting) and cellular data subscription; they address the seemingly disparate reasons
for building cellular telephony networks (2G) and cellular data networks (4G). The annual data
used cover 17 years from 2000 to 2016.
The idea of including the binary variable CDMA versus GSM arises from FinTech in
Sub-Saharan Africa: What Has Worked Well, and What Hasn’t, where Yermack finds a positive
relationship between the legal system and the growth of FinTech platforms.33 When 2G was
introduced, network operators chose to adopt one of the two standards for their cellular voice
33 Yermack, David. “FinTech in Sub-Saharan Africa: What Has Worked Well, and What Hasn't.” 2018
20
networks. The GSM, developed by a European consortium34, was more widespread in Europe
and Africa, while CDMA, developed by Qualcomm, was predominantly used in the US, Latin
America, Japan and South Korea.35 The underlying notion is that countries with the majority of
their operators operating on the GSM framework may adopt future technological changes at a
different pace when compared to those using CDMA.
The analysis includes 16 countries, 6 in Asia (Malaysia, Pakistan, Philippines, Singapore,
South Korea, Thailand), 4 in Africa (Ethiopia, Kenya, Nigeria, South Africa), and 6 in Latin
America (Argentina, Brazil, Chile, Columbia, Mexico, Peru). In total, there are 272 observations
for each variable. Since national telecommunication markets are assumed largely independent of
each other, each country has its own graphical illustration. Industry data are collected from the
industry’s trade body, GSMA. Sovereign risk data is taken from the Economist Intelligence Unit.
The Conference Board offers information for each country’s growth in total factor productivity.
IMF publications contain data points for annual investment to GDP ratios. National
infrastructure development levels are derived using two methods. Tiering method A categorizes
countries by their mobile penetration levels in 2016 (≥ 80%: Tier 1, 50% ≤ MP < 80%: Tier 2,
<50% Tier 3); this tiering method acts as a proxy for the level of development of a country’s
telecommunication industry relative to the continental average. Meanwhile, tiering method B is a
ranking suggested by Professor Ingo Walter; the second tiering method ranks each country based
on its overall infrastructure level relative to the continental average.36
Existing literature presents multiple statistical methods in analyzing the relationship
between variables and cellular market penetration. However, there is a major constraint
34 European Telecommunications Standards Institute 35 Table 1 36 Rankings are shown in Table 1

21
regarding this analysis. Since every generation of cellular telecommunication lasts for around a
decade, the data available only dated to the year 2000 and on an annual interval. The lack of
observations per variable per country leads to insignificant results in multivariate regressions that
do not provide much explanation. Therefore, time series graphics would provide the basis of
analysis.
Results Graphical Illustrations Initial Analysis The time series charts of the dependent variables: cellular telephony penetration and
cellular data penetration have shown some interesting patterns.37 For cellular telephony
penetration, the adoption curves closely resemble the sigmoid curve, which follows the
technology adoption trend proposed by the Rogers’ bell curve and is similar to the trends found
in prior research on the adoption of fixed line telecommunications;38 once early adopters and the
early majority adopt the new technology, mobile penetration growth spikes. After the early
majority adopt the technology, network penetration is followed by a slight decrease in adoption
speed with a flatter slope on the cellular telephony penetration curve (Orange). A closer
examination of the flatter slope shows that half of the countries in the panel experienced a slight
decrease in adoption speed in 2009, which may be caused by the Global Financial Crisis.
37 Figure 8 to Figure 10 38 Figure 7

22
The global financial crisis could have influenced the rate of infrastructure investment.
Since October 2008, the available funding methods had reduced significantly. Hypothetically,
weaker capital markets and bank lending should have significant effects on telecom markets, as
operators have less available funds to build infrastructure. Moreover, since there is a lag between
capital searching and infrastructure implementation, it takes an average of one to two years to
complete the entire process of planning, getting district approval, and finally constructing the cell
tower. Assuming that any decreases in growth rates in cellular telephony market penetration
between 2009 and 2011 could be contributed by the crisis, only four countries were not affected.
Referring to Figures 8 and 10, Malaysia, South Korea, and Mexico did not have decreases in
penetration growth after the crisis. The reason could be the composition of operators in cellular
markets of these countries. If the market has majority multinational players, capital would likely
be heavily reliant on global flows. Meanwhile, if the market is mainly composed of local players,
funding for infrastructure may be easier. Firstly, local banking systems, being mostly exempted
from global capital flows, may not be heavily affected by the financial crisis. Additionally,
private operators may use family funds instead of borrowing or using the capital markets. From
Figure 4 : South Africa cellular telephony penetration rate
Between 2005 to 2008, South Africa has
an average growth rate in market
penetration of 12%. However, the growth
rate drops significantly after 2009,
averaging a growth rate of 1% until 2011;
after 2012, the average annual growth rate
rebounded back to 8%.

23
Table 2, Malaysia has major operators controlled by sovereign wealth fund (SWF), Khazanah
Nasional, or conglomerates, while all operators in South Korea are controlled by chaebol
families, and Mexico practically has a monopoly by America Movil with more than 60% market
share. Therefore, these markets may be less vulnerable to crises when compared to other
markets.
Meanwhile, for data network penetration, majority of the countries show faster growth
trends when compared to cellular telephony market penetration; a reason for such high growth is
the offerings that data connectivity provides. As social media and video streaming become
increasingly popular and indispensable for many, cellular data service becomes an important
service to have. Moreover, data connectivity is attractive when smartphones provide additional
services to their users beyond just calling and texting. The exceptions for this trend are Kenya,
Nigeria, the Philippines, and Colombia. A possible explanation for the difference in growth rates
could be the cost of obtaining a smartphone relative to the income of an average person in Kenya
and Nigeria. In Nigeria, the cost of obtaining a smartphone is 150% of the average monthly
income.39 Another reason could be low urbanization level. In the Philippines, the proportion of
the population living in urban areas has decreased over time; the trend of moving back to the
rural areas could be a disincentive for network operators to invest new capital in building data
connectivity capacity. A study shows that network operators have business advantages in urban
areas compared to rural areas.40 Therefore, the relative profit margins obtained from building
cellular data capacity in rural areas are low. In fact, the situation affects both rural and urban
areas. While people move to rural areas, operators would believe that investing in rural areas
39 Kazeem, Yomi. “Smartphone Prices Have Dropped by More than 50% in Nigeria and Sales Are Up.” Quartz Africa, Quartz, 2 Apr. 2018, qz.com/africa/1242702/jumia-mobile-report-smartphone-prices-in-nigeria/. 40 Velez, Fernando, and Luis Correia. “Cost/Revenue Optimisation in Multi-Service Mobile Broadband Systems.” The 13th IEEE International Symposium on Personal, Indoor and Mobile Radio Communications, 2002

24
does not translate to substantial returns, therefore rural areas would not get new telecom
infrastructure. At the same time, urban areas become less attractive for operators, as the
population density is now lower; with fewer users per square mile, the marginal benefit of an
additional cell tower is lower.
Regional Analysis Overall, Asian and Latin American countries have higher telephony and data penetration
rates when compared to African countries. The observation agrees with the general economic
understanding of these countries. Majority of the African countries in the pool are frontier
economies; therefore they are still at the initial stages of development, and the levels of
sophistication of their mobile industries would reasonably lag behind countries that invested in
the sector much earlier. Since all Latin American and Asian countries are at least in the medium
income level, their network penetration levels are expected to be higher.
There are also several interesting observations regarding countries based on their tiering.
Firstly, out of the 16 countries used in this study, only 9 countries have the same level of
development between its overall infrastructure maturity and its telecommunication infrastructure
maturity. Additionally, there is no apparent trend as to whether a country’s telecommunication
development level would be more or less advanced when compared to the overall infrastructure
development level. On the one hand, Thailand has a relatively bad infrastructure development
level, however, its mobile penetration level is one of the highest. On the other hand, other
nations, like Mexico and South Africa, have mediocre mobile penetration levels, yet their overall
infrastructure development is high; therefore, other industry-related and macroeconomic
variables may have stronger influences on network penetration.
Secondly, countries’ growth trends in cellular data market penetration closely resemble
their growth patterns in cellular telephony market penetration. Countries that started with low

25
initial market penetration levels in cellular telephony in 2000 (e.g. Tier 3 in Method A) would
struggle to grow to levels that match the data penetration levels of higher ranked countries. The
exception in this case is Thailand, which has an initial penetration level in both telephony and
data of a Tier 2 country; the country is able to grow its cellular data market quickly to meet the
penetration levels of Tier 1 countries like Argentina and Chile.
Figure 5 : Chile, Philippines, Nigeria cellular telephony penetration rate
Chile Philippines
Nigeria
Chile is an example of a Tier 1 performer. It
has pretty substantial growth rate from 2000 to
2011. The trend is relatively linear; growth
trend plateaus at 80%.
Philippines is a Tier 2 country with growth in
the early years averaging 30%, but it reaches a
plateau only at 62% penetration.
Nigeria has a slow start in implementation.
After a slow initial rise, it maintains a growth
rate of around 60%, but the average annual
growth rate quickly drops to around 8% by
2009.

26
In addition, the penetration correlation within the region varies across the three regions.
Latin America has a strong regional correlation in implementation. A further analysis of the
operators in the markets shows a striking insight.41 The market compositions are similarly
composed of several large conglomerates (e.g. Claro, Telefonica). The pool of operators in
African and Asian markets is much more diverse among the countries. Therefore, it indicates
how market homogeneity has a role in influencing market penetration rates; theoretically, with
greater competition and opportunities for comparisons, there would be more innovations and
frequent improvements in order to maintain one’s competitiveness in the market.
Compared to the penetration trends in Latin America, those in Africa and Asia have more
dispersed relationship. In Africa, South Africa leads significantly, while Ethiopia lags. The trend
correlates closely to the countries’ economic performance. Out of the four countries, South
Africa has the highest GDP per capita at US$5,274 in 2016, while Ethiopia has the lowest GDP
per capita at US$707 in 2016. However, an additional element may be at play. Ethiopia could
have hindered its mobile penetration growth by having a government-run monopoly cellular
market. Classic microeconomic theories have criticized monopolies for their inefficiencies and
lack of innovations when compared to competitive firms. Lastly in Asia, South Korea and
Singapore lead the group in mobile development. The cause of the phenomenon is similar to that
in Africa, as the two countries have higher per capita GDP. Moreover, these countries are also
former colonies of Japan and the United Kingdom, respectively. For example, there are still
significant economic ties between Japan and South Korea. Therefore, it is possible that such
relationship encourages technology sharing or investments and entry by multinational operators
originating from former metropoles, which could influence innovation and development.
41 Table 2

27
Determinants Analysis While attempting to understand the differences that separate countries’ performance in
the previous section, it became clear that a monopoly market structure reduces a country’s ability
to increase cellular network penetration. In addition to the Ethiopian example, there is also
Mexico. The country’s mediocre penetration rates (61% total, 47% data) raise questions on the
impact of industry organization on market growth, since one operator (America Movil)
commands over 60% of the market share. Its cellular telephony penetration is the worst in Latin
America, concurring with economic theory which asserts that fewer competitors would lead to
greater market power and lower innovation. A variable that classifies market structure is the
Herfindahl-Hirschman Index (HHI). The HHI measures the size of the firms relative to the
industry based on the firms’ market shares. Referring to Figures 16 and 23, there appears to be a
specific region in HHI that maximizes cellular network penetration growth. For example,
Argentina had a steeper penetration growth after an increase in concentration, as HHI increased
from 2,500 to 3,200 in 2005. Meanwhile, from 2008 to 2011, the Philippines had an increase in
HHI from 2,800 to 5,500; however, its market penetration growth rate for telephony dropped
from 17% to 4% per year. Therefore, a highly concentrated market seems to slow network
penetration growth. Meanwhile, Pakistan had a decrease in HHI from 5,500 to 3,500 from 2003
to 2004, and its cellular telephony penetration growth rate grew from 89% to 168%.
Prior literature does not have a conclusion as to the magic number for best market
dynamics. GSMA Intelligence has recommended that the optimal number of firms is between 3
and 4. However, the verdict is independent to each country due to idiosyncratic market
compositions; there are occasions when a merger of weaker participants could empirically create

28
more competition by leveling the playing field.42 Therefore, for some cases, consolidations of
mobile operators would decrease costs and reduce prices for consumers, thus increasing
consumer welfare; an effect that is different from conventional economic theories. Moreover, a
maverick operator, a participant who holds down prices in an industry according to its antitrust
definition, is essential in maintaining the competitiveness of the market by reducing collusion
and the ability to exert market power to consumers.43 44 Therefore, markets within an
approximate HHI range of 3,000 and 4,000 with a maverick operator may maximize its ability to
increase network penetration; the range enables markets to have a good balance between
competition and economies of scale. Ethiopia, for example, has to reduce its market
concentration in order to achieve sustainable growth in network penetration.
Ethiopia is the weakest performing country in the panel. Its rate of adoption significantly
lags behind other frontier markets. To put it into perspective, in 2000, Nigeria had a lower level
in telephony penetration rate (0.02%) when compared to Ethiopia (0.03%), but Nigeria averaged
a 440% growth rate between 2000 and 2004, and Ethiopia only averaged 93%. The slower
adoption resulted in only a 37% adoption rate in 2016. Ethiopia’s nationalized cellular market is
a potential cause of this result. The market is run by a government-operated monopoly – Ethio
Telecom. Theoretically, government-run agencies are highly inefficient and bureaucratic, which
could pose hindrances on innovation and growth. Moreover, there is a clear conflict of interest,
as the government is both the operator and the regulator of the industry. Thus, even though the
objective of the Ethiopian Telecommunication Agency is “to promote the development of high
42 GSMA. “Appendix 1 - Spectrum in Competition Policy.” Competition Policy in the Digital Age: Case Studies from Asia and Sub-Saharan Africa, 2016, www.gsma.com/publicpolicy/wp-content/uploads/2016/12/4.CPITDA_Case_Studies_Asia__Sub-SaharanAfrica_Appendix1-2.pdf. 43 Bork, Robert H. The Antitrust Paradox: a Policy at War with Itself. Free Press, 1993. 44 Fildes, Nic. “Europe's Telecoms Landscape Warms to 'Maverick' Operators.” Financial Times, Financial Times, 12 Aug. 2018, www.ft.com/content/81bee992-901e-11e8-bb8f-a6a2f7bca546.

29
quality, efficient, reliable and affordable telecommunication services”, Ethiopia has one of the
least affordable telecommunication services in the world; it needs a 98% price reduction for
internet plans to be affordable for 80% of the population.45 Finally, highly nationalized markets
theoretically have constraints on investor trust due to concerns regarding corruption, collusion
and incumbents’ price negotiating power, which could potentially deter investments.
Figure 6 shows the levels of privatization of firms. It is apparent that the best performing
markets are those that are both not fully private nor fully government-run. In this context, private
means that the companies in the market are not actively or passively owned by the government
of the country that they are operating in; it does not represent a non-publicly traded company, but
could include such firms.
Figure 6: Level of privatization of cellular telecommunication markets (Telephony / Data)
45 Strategy&. “Ten Mechanisms for Global Inclusion.” Connecting the World, 2016, www.strategyand.pwc.com/media/file/Connecting-the-world.pdf.

30
Singapore and Malaysia are some of the top performers in reaching high cellular
telephony network penetration (Table 1). They also have telecom markets that are not fully
private. According to Table 2, two out of three major operators in Singapore have Temasek as
their major shareholder; Temasek is Singapore’s sovereign wealth fund that invests and passively
manages domestic assets. Similarly in Malaysia, one-third of the cellular telecom market share is
controlled by Khazanah Nasional, Malaysia’s sovereign wealth fund. SWF investment indicates
the governments’ understanding of the importance of cellular telecommunication infrastructure.
It potentially enables the government to coordinate behavior to provide better telecommunication
services. Meanwhile, with such entities as shareholders, operators could likely obtain lower costs
of capital. Moreover, in the event of a crisis, SWF-owned entities could request capital calls to
finance their operations, as SWFs have permanent sources of funds. The effectiveness of markets
seems to go from highest to lowest: 1) private with state investment, 2) private, then 3)
government run. Therefore, an appropriate market structure may facilitate the increase in cellular
network penetration.
Thailand, and Chile are also high performers, but they do not have government capital
invested in major network operators in their markets. However, they do have a strong presence
of multinational corporations. Thailand has dtac owned by Norwegian’s Telenor (the 15th largest
mobile network operator in the world) and AIS owned by Singapore’s SingTel. Chile has Spain’s
Telefonica, and Mexico’s America Movil. During the analysis, it became apparent that there are
several multinational operators that provide network services to multiple countries. These
network operators have substantial experience in operations. Moreover, their sizes enable
economies of scale in both operations as well as obtaining funding. Their lower costs of capital,

31
efficient organization and greater efficiency could make it easier to facilitate adoption in cellular
connectivity.
An additional interesting observation is that there is also a strong presence of operators
from former empires in former colonies. For example, Telefonica in Latin America, Vodafone in
Africa. Research regarding the subject goes both ways. Firms supposedly would prefer to trade
in former colonies due to established trade routes and business relations; however, there is
research that shows that trade volume erodes by over 60% within the first forty years after the
end of a colonial relationship.46 Similarly, our analysis shows no strong correlation. Therefore, it
is hard to determine whether entities’ colonial backgrounds were contributory to the increase in
network penetration. It is highly plausible that their effects on network penetration are similar to
other multinational operators.
Cellular network penetration trends also have a relationship with their country’s
urbanization level. In addition to the relationship between urbanization level and business
advantage, urbanization level also represents the saturation point for market penetration rates.
Referring to Figure 22, the ceiling for cellular telephony market penetration is at around 90%. As
previously mentioned in the cost benefit analysis, urban area is the best location for cellular
networks due to its high utilization and returns.47 The industry is highly capital intensive,
therefore the initial consideration of an operator is to cover areas with the highest potential
traffic; the large amount of solvent consumers per cell site ensures that there is a profitable
exploitation of the network. For example, Singapore, which has 100% urbanization, has a market
penetration rate of 88%; this indicates that the market is still unsaturated at the level where the
46 Head, Keith, et al. “The Erosion of Colonial Trade Linkages after Independence.” Journal of International Economics, vol. 81, no. 1, 2010, pp. 1–14. 47 Velez, Fernando, and Luis Correia. “Cost/Revenue Optimisation in Multi-Service Mobile Broadband Systems.” The 13th IEEE International Symposium on Personal, Indoor and Mobile Radio Communications, 2002

32
costs and returns of telecom infrastructure are at their lowest. Out of the 16 countries, only 6 of
them (Ethiopia, Kenya, Malaysia, Philippines, South Korea, Thailand) have network penetration
levels higher than their urbanization levels. South Korea and Malaysia’s network penetration
rates are only few percentage points higher than their urbanization levels. Therefore, it is
reasonable to estimate that the highest network penetration rate for more mature developing or
developed countries is the urbanization level plus 5 percent. Meanwhile, since the other four
countries are relatively weaker in overall infrastructure development, it may be reasonable to
assume that the percentage of urban population will increase rapidly in the future. Therefore,
they are investing in capacity for future utilization. Currently, these countries are inefficient in
their utilization of telecommunication infrastructure, and it suggests that the phenomenon may
create financial burdens on network operators. Since Nigeria’s urbanization level is 20%, 18% of
its cellular market penetration is generated with infrastructure that is not operating at its optimal
efficiency nor generating large profits. Therefore, theoretically, an accelerated urbanization for
the four countries could make network operations more financially sustainable and facilitate
cellular network penetration. Obviously, it is not viable for everyone to move to the city, which
is why 5G could alleviate the digital divide by reducing the cost of rural network installations.
Revenue is a major driver in any businesses, and, for network operators, it is no
exception. Referring to Figure 18, there is a general positive correlation between total revenue
and market penetration. Theoretically, network operators would use the revenue obtained to
invest in additional infrastructure in the form of capital expenditure. The figures also show that
revenue began to level off or decrease around the year 2011 and 2012 for a majority of the
countries. This trend corresponds to the plateau in cellular telephony penetration growth. A
plausible cause for decreasing revenue is that, after the introduction of data connectivity, the cost

33
per bit on mobile network is lower. The lower costs attract more entrants, who act as mavericks
and hold down the price, leading to price competition and lower revenue.
According to the economics of cellular telecommunication, the industry is supposedly
highly scale sensitive. Cellular telecommunication is inherently a service that has network
effects. The higher the usage, the more valuable cellular service is, as a large portion of the
population would interact using the network. Theoretically, there are two forces at play: cost and
revenue. Regarding cost factors, the industry is scale sensitive. With more users, bigger firms
would theoretically enjoy cost reductions from economies of scale, which should be passed onto
consumers. However, the magnitude of cost reductions depends on the slope and convexity of
the cost function, which are unavailable data. Meanwhile, market power and pricing affect
network operators revenue. With more users, the network would have a higher value, increasing
operators’ market power. Yet, an increase in network value could also increase competitive
pressure, as entrants enter or other incumbents compete more aggressively. Therefore, some
operators have been exploring new methods of pricing by expanding their revenue streams
vertically, like AT&T’s acquisition of Time Warner.
Similar to revenue, empirical data for revenue per user also presents a downward sloping
trend (Figure 19). It has been decreasing in many markets since 2007. In addition to the maverick
reasoning mentioned above, another potential cause is that telecommunication has become a
commodity for many potential customers. During the introductory period of digital
telecommunication, getting network connectivity was a luxury good, therefore users would pay a
premium to get such services. However, as the majority are already a part of the market, the
remaining non-participating population are those who do not view network connectivity as a
necessity. To encourage this group of people to participate, network operators have to reduce the

34
price of services. Moreover, as operating infrastructure becomes more mature, the quality
between operators does not vary much, therefore the products become increasingly
commoditized. Together with the pricing strategy of mavericks, network providers have to
decrease prices to remain competitive, which reduces their revenue. The lower revenue would
shrink operators’ ability to invest in new infrastructure to increase cellular network penetration.
There are variables that do not show a strong correlation with cellular network
penetration graphically. First, countries with high sovereign rankings tend to have high telecom
development (Figure 20). However, there are exceptions, such as Argentina. Theoretically, lower
sovereign risk translates to higher investor confidence and more investments. Nonetheless,
similar to investment to GDP, the variable is not specific enough to correlate with
telecommunication penetration trends (Figure 17). The argument is similar to the discrepancy
that appears in the analysis of infrastructure rankings, as development in telecommunication
differs from average development in the infrastructure sector. Second, total factor productivity
(tfp) does not correspond with network penetration (Figure 21). Cellular connectivity reduces
information costs but probably not as effective in increasing productivity of the manufacturing or
commodity extraction processes; therefore, the effect is not strongly reflected in the tfp value.
The rule of law variable also does not show any significant trends with cellular network
penetration (Table 1). The intuition behind using the Law and Finance framework introduced by
LaPorta et al. (LLSV) is to investigate whether there is a relationship between telecom
infrastructure implementation, law, and finance.48 LLSV finds a relationship between financial
development and legal systems. Since finance is critical to infrastructure implementation, it
justifies the motivation to investigate whether the legal system has any direct, like contracts and
48 Porta, Rafael La, et al. “The Economic Consequences of Legal Origins.” Journal of Economic Literature, vol. 46, no. 2, 2008, pp. 285–332.

35
construction laws, or indirect, such as finance-related issues, influences on infrastructure
implementation and network penetration. Nonetheless, the differences between Common Law
and Civil Law on areas that are relevant to contracts and the physical construction of
infrastructure seem to have no influence on cellular network development.
Lastly, the variable ‘GSM vs CDMA’ does not appear to have a strong correlation with
network penetration. Aforementioned, GSM and CDMA are cellular communication
technological frameworks used in the introduction of digital communication (2G). Intuitively,
the differences in systems may provide some insights regarding each market’s positioning and its
willingness to adopt new technology. Also, the inherent technological differences may influence
consumers’ willingness and ability to obtain better connectivity. For example, CDMA does not
allow a user to switch network operators without purchasing a new device. However, there is no
strong correlation in the analysis (Table 1). There are good and bad performers on both
frameworks. The GSM system has both Singapore and Ethiopia, while the CDMA system is used
in South Korea and Mexico.
Model Fitting The analysis above has provided a directional conclusion on variables that could
influence both cellular telephony and cellular data market penetrations. To better understand
these potential determinants’ relationship with the network penetration rates, I created a model.
First, I used MICE imputation to fill in the gaps in the data for Ethiopia’s Sovereign Risk
ratings from 2000 to 2005. Second, I did some data exploration to understand the relationship
between cellular telephony market penetration and each variable. For the time being, I assumed
no autocorrelation and no idiosyncratic differences between countries in the time-series panel
data in order for me to gain a general understanding of the relationships. Majority of the

36
correlations are identical to the interpretations generated from the graphical illustrations.49
Therefore, there is no significant unexplained variation between countries for network
penetration that demands a country factor. Moreover, three variables show more prominent
correlations, including: CAPEX, Sovereign Risk, and Total Revenue. Referring to Figure 24,
CAPEX has a strong positive relationship with cellular telephony market penetration, reinforcing
the notion that higher revenue corresponds to higher capital expenditures. Sovereign Risk also
shows a more prominent negative relationship in Figure 28. While countries with lower
sovereign ratings have large variances in network penetration, countries with higher sovereign
ratings consistently have high market penetration rates. Lastly, shown in Figure 25, a higher total
revenue correlates to a higher cellular telephony market penetration. The relationship is much
stronger than previously analyzed.
The initial fit of the regression model shows some degree of significance; however, the
model is highly unstable with high VIF values for multiple variables. After removing a number
of anomalies, the model is much more stable with 260 observations. The cleaned data set has a
good fit with the normal curve (Figure 29), while data points have much smaller residuals.
The adjusted R2 versus model index shows that a model with only four variables would
explain over 85% of the variations in cellular telephony market penetration, thus strong
predictive power. The four variables generated by a best subsets regression are: Revenue per
user, GDP Per capita, Capital expenditures, and GSM vs CDMA.
The result strengthens the conjecture that economic output and mobile market penetration
have a bidirectional relationship. A higher GDP per capita value leads to a higher market
penetration rate. Higher capital expenditure also results in higher penetration rate. Meanwhile,
49 Figure 23 to Figure 28 in the Appendix
37
lower revenue per user corresponds to a higher network penetration. Finally, markets that use the
GSM system have higher network penetration rates than those that use CDMA.
The VIF of the final model is less than 3, which indicates low correlation between
variables. The diagnostics strongly suggest that the assumptions of linear regression hold,
therefore, the effect of autocorrelation if any exist is likely accounted for. With such low VIF
values for the variables, they represent that a prediction by the model is based on the values of
the determinants instead of information from prior periods. Additionally, since the model is able
to achieve such a high R2 without a country dummy, it is possible that the cross correlation of
penetration across countries is explained by the variables. Therefore, the pace of the cellular
telephony market penetration, including the leads and lags, would be explained by the four
determinants. The idiosyncrasies between countries would be explained based on the values of
the determinants at time t, as countries have different output levels.
Being affected by the lack of sufficient data, the model fitting exercise has its
weaknesses. However, the results still provide a powerful indication of the importance of each
determinant in influencing a country’s market penetration in both cellular telephony and cellular
data market penetration. I also conducted two additional exercises using 1) data for data cellular
market penetration, as well as the 2) 10-year data for cellular telephony market penetration from
2000 to 2009.
With an established standard that a model with strong predictive power should have an
adjusted R2 of at least 85%, the second exercise shows that the three variables are: Total revenue,
GDP per capita, and GSM vs CDMA. These results closely resemble the original exercise.
Meanwhile, the first exercise with data cellular market penetration shows a strong model
but with high multicollinearity. This is likely the result of having only 7-years’ worth of data for

38
the exercise. The six weak determinants are: Revenue per user, GDP per capita, CAPEX, the
percentage of urban population, the initial level of data connectivity infrastructure, and the
presence of international corporations with colonial links.
Implications for government and industry participants Politics has increasingly played an important role on telecommunication infrastructure
decisions. As countries recognize that their economies depend on cellular connectivity services,
many have identified telecommunication as an important industry to protect. For example,
Amazon cannot operate as Amazon, if there is no network connectivity; the business model will
simply fail. Recently, there have been many discussions regarding the security of
telecommunication infrastructure supplied by Chinese providers, Huawei and ZTE. The
equipment presumably provides these Chinese companies and, indirectly, the Chinese
government the ability to conduct espionage activities. The media and political commentaries
have often identified this as a national security concern that could damage a country’s economy.
From a microeconomic perspective, a blanket ban on these two providers would be unwise.
Huawei and ZTE are two out of the four major telecommunication infrastructure providers in the
world, others being Ericsson and Nokia. A blockade on the technology could lead to an increase
in pricing power in the telecommunication infrastructure market, as the number of participants
drops from four to two. Such changes in market dynamics could decrease competition in
upstream markets, resulting in higher costs for network operators.50 Currently, neither Ericsson
nor Nokia is on the forefront of 5G infrastructure development. Thus, a widescale boycott of
Huawei and ZTE would push back the leap in telecommunication innovation. Governments
50 Hannigan, Robert. “Blanket Bans on Chinese Tech Companies like Huawei Make No Sense.” Financial Times, Financial Times, 12 Feb. 2019, www.ft.com/content/76e846a4-2b9f-11e9-9222-7024d72222bc?emailId=5c6a9c0ada2f840004993d24&segmentId=13b7e341-ed02-2b53-e8c0-d9cb59be8b3b.

39
should find a balance between national security and economic benefits. If governments are
distressed by the national security risks posed by equipment made by Chinese suppliers, they
could restrict Huawei equipment from the critical parts of the national telecom infrastructure,
while continue using Huawei equipment in the noncritical parts of the network; British Telecom
recognizes such arrangement as a viable method.51
Our study shows that urbanization positively impacts the utilization of
telecommunication infrastructure. Nonetheless, it would be foolish to simply recommend that
governments should push for policies that encourage urbanization. From an operational
standpoint, urbanization does enable a higher utilization rate per cell tower as well as a more cost
efficient system; however, it reduces the incentives for network operators to expand into rural
areas. One of the economic justifications of telecommunication is the ability to allow users from
any region to gain connectivity. For example, the benefits gained in agricultural efficiency after
farmers gain connectivity will be lost, if governments push for urbanization; this will worsen the
digital divide. Therefore, the policy could change the dynamics of rural regions as well as the
incentives for network operators; thus, a more organic and natural approach to urbanization
would likely be more appropriate.
With regards to regulation, the government should establish a self-regulating organization
to regulate the industry. Such regulating format enables a continuous analysis of the market
dynamics. From the analysis, appropriate consolidation or increase competition depends on the
level of competition in the industry. To facilitate competition, the regulator could implement
asymmetric regulations to encourage new entrants by reducing incumbents’ market power; it
51 Hern, Alex. “BT Removing Huawei Equipment from Parts of 4G Network.” The Guardian, Guardian News and Media, 6 Dec. 2018, www.theguardian.com/technology/2018/dec/05/bt-removing-huawei-equipment-from-parts-of-4g-network.

40
ensures fairness and not equal treatment. An example would be the Dutch incumbent KPN and
entrant Enertel. In the early period after entry, Enertel would charge an access markup to KPN,
while KPN charged a cost-based access price for inter-network connection charges.52 The
additional costs for KPN reduce its market power, enabling Enertel to gain an sizable footprint in
the market. Nonetheless, the regulator has to monitor the market composition closely to ensure
that asymmetric policies do not benefit entrants after they have become substantial in size.
Additionally, in concession negotiations, the regulating authority can allocate spectrums to
network operators according to the socially desirable market composition.
State investments could also prove beneficial in enhancing telecommunication
implementation. Singapore and Malaysia’s success shows how an allocation of public capital
could align the industry closely with the socially desirable outcome, such as lower prices or
higher rural network penetration. In addition to investments, governments could also provide tax
incentives for particular behavior, e.g. increasing rural cellular connectivity. Policy makers
should remember that state investments would likely tilt the playing field in a private market.
Capital deployment by governments could have serious and imperative impacts on markets; it is
never favorable when governments intervene private markets and pick winners. Therefore,
government-affiliated entities shall take a rather passive, encouraging role in most occasions and
encourage industry development by providing appropriate tailwind. Temasek’s successful
investment strategy stems from its passive involvement in corporate operations, similar to the
behavior of a venture capital investor.
For network operators, they should consider potential vertical consolidation
opportunities. As cellular connectivity services become increasingly commoditize, operators
52 Peitz, Martin. “Asymmetric Access Price Regulation in Telecommunications Markets.” European Economic Review, vol. 49, no. 2, 2005, pp. 341–358.

41
have to differentiate themselves before their services become homogenous. Bundling could
create a market environment where consumers would choose to join a network based on their
desire to consume a complementary product and not simply based on the price of the cellular
packages.
Potential Future Research This study has provided a preliminary understanding of the different determinants and
their effects on cellular network penetration. Further analysis on the specific impact of the
determinants that influence penetration would be helpful in understanding their respective
importance. Specifically, a research on the effect of colonial history or an investigation on how
large mobile network operators have cross-country influences on mobile penetration in countries
other than their originating country is worth studying. Compared to other primary determinants,
the impact of colonial influence is relatively abstract, while having critical influence. Therefore,
it might be worthy to analyze the economic intuition and empirical impact of colonial
relationships in the telecommunication sector.
Moreover, event studies would be an interesting research area. An investigation on the
impact of crisis events on telecommunication infrastructure implementation and utilization may
prove beneficial to the list of prior literature. A crisis (coup, natural disaster, financial crisis)
could significantly alter the dynamics of the telecommunication industry and consumer behavior
regarding relevant services. In the analysis, the Global Financial Crisis has a minor impact on
telecom penetration trend. However, it is expected that the Asian Financial Crisis in 1997 might
have affected the telecom industry on a larger magnitude due to the systemic nature of the crisis,
which hampered multiple pillars of several functioning economies.

42
Further research on market policy is also recommended to improve the industry.
Recently, there have been consolidation attempts in the utilities and the transportation industries
in developed markets, for example, T-Mobile and Sprint in the US and Alstom and Siemens in
Europe. Prior literature has shown that around three to four network operators per market would
be appropriate; however, the final verdict rests on the market composition. This leads to the
question as to whether there is a better model other than the conventional HHI framework for
policy makers to examine the competition between network operators after a merger.
Additionally, market dynamics heavily influence the performance of the cellular market.
Regarding the regulating structure, an analysis of the vetting process or the corruption within the
regulatory structure could explain the market efficiencies in different countries. The motivations
and intentions of the regulators play an extraordinary role in this potential analysis. The
regulator’s habit of having political or industry considerations when auctioning spectrums,
establishing regulations, or negotiating with operators could influence the market dynamics and
thus the network penetration level. Meanwhile, the collusion and the price negotiating power of
operators can also provide insights on whether there are incentives to hinder innovation and
development, thus hampering the growth in telecommunication implementation.
The study did not manage to obtain data for the cost of constructing cell towers and the
cost of capital. These two variables could provide more insights into the cost functions that
network operators face. Furthermore, the dependent variables, cellular telephony market
penetration and cellular data penetration, are only indicative data that provide a proxy to the
usage of mobile connectivity. Since there is always a gap between subscription and usage, it is
preferable to use usage data in future research. Finally, recognizing the fact that data is limited to

43
after the year 2000, quarterly data might be more appropriate in providing a better understanding
of the relationship between the determinants and network penetration rates.
Conclusion Ultimately, this study has found eight determinants that are contributory to the
development of cellular telecommunication by influencing market penetration. The most
important determinants are: total revenue, revenue per user, GDP per capita, GSM vs CDMA,
and capital expenditure. Meanwhile, weaker determinants include: the percentage of urban
population, the initial level of data connectivity infrastructure, and the presence of international
corporations with colonial links.
Revenue variables, GDP per capita and capital expenditure enhance telecommunication
by changing the amount of investments, altering consumer demand, and adjusting
telecommunication’s relative magnitude in being a reinforcer of growth. Meanwhile, GSM vs
CDMA provides an understanding of the level of development and potential strengths and
weaknesses of the cellular infrastructure from a technological standpoint. The percentage of
urban population provides a glimpse of the operators’ profit margins and the operational
difficulties in increasing penetration. The initial level of data connectivity infrastructure indicates
the level of expertise and technological maturity of the industry to facilitate adoption. Lastly, the
presence of international corporations with colonial links displays the market’s level of
operational and technological competence combined with strong, long-lasting business relations.
The introduction of 5G in late 2019 would improve the technological capabilities of
cellular networks, while reducing the costs. Its implementation in rural areas should increase the
coverage of cellular networks, which currently focus heavily on urban areas. Its adoption trends
might be harder to predict, given its intent to provide connectivity to various industries.

44
Macroeconomic competency and firm revenue would likely continue to be the driving
determinants for the next generation of mobile connectivity given per capita GDP’s bi-
directional effects and operators’ business models. However, as telecommunication policy
becomes increasingly important in politics, the implementation progress of 5G connectivity
continues to be clouded by heavy uncertainty.
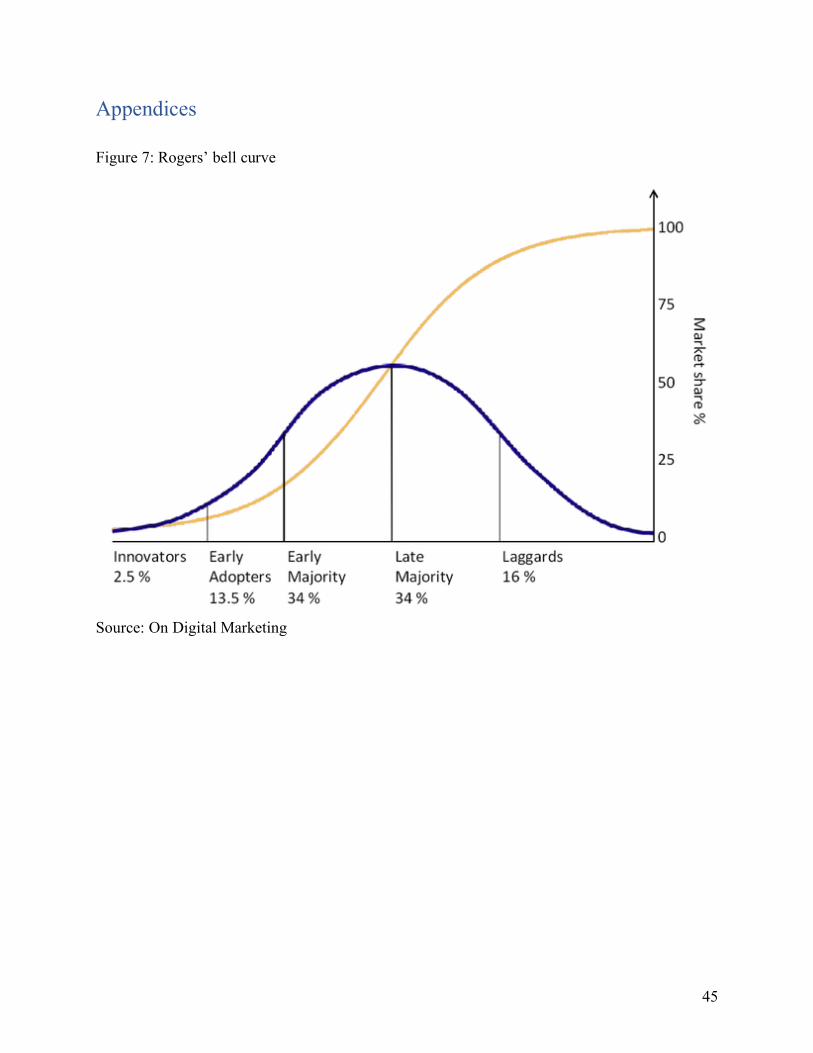
45
Appendices
Figure 7: Rogers’ bell curve
Source: On Digital Marketing

46
Figure 8: Cellular telephony market penetration (Orange) and Data market penetration (Green)
Figure 9: Cellular telephony market penetration (Orange) and Data market penetration (Green)

47
Figure 10: Cellular telephony market penetration (Orange) and Data market penetration (Green)
Figure 11: Cellular telephony market penetration (Orange) and Data market penetration (Green)

48
Figure 12: Cellular telephony market penetration (Orange) and Data market penetration (Green)
Figure 13: Cellular telephony market penetration (Orange) and Data market penetration (Green)

49
Figure 14: GDP Total to Cellular Telephony Market Penetration

50
Figure 15: GDP Per Capita to Cellular Telephony Market Penetration

51
Figure 16: HHI to Cellular Telephony Market Penetration

52
Figure 17: Investment to GDP to Cellular Telephony Market Penetration

53
Figure 18: Total Revenue to Cellular Telephony Market Penetration

54
Figure 19: Revenue per user to Cellular Telephony Market Penetration

55
Figure 20: Sovereign Risk to Cellular Telephony Market Penetration

56
Figure 21: Total Factor Productivity to Cellular Telephony Market Penetration

57
Figure 22: Percentage of population living in urban areas to Cellular Telephony Market Penetration
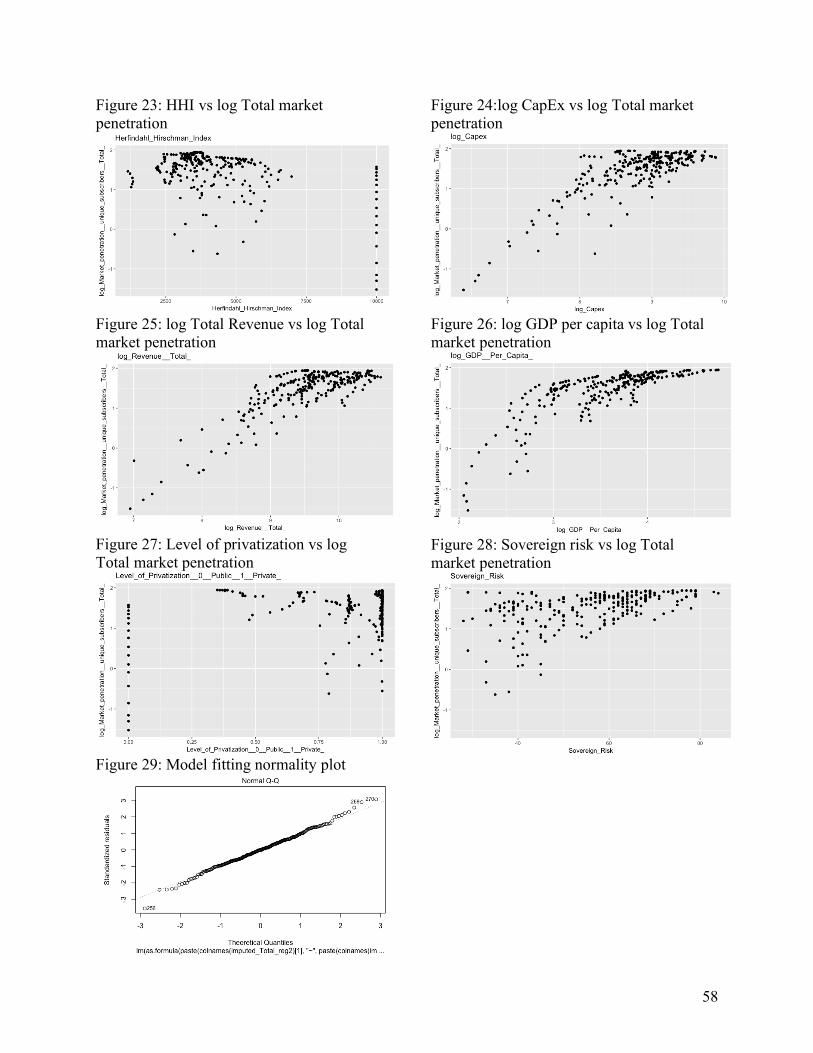
58
Figure 23: HHI vs log Total market penetration
Figure 25: log Total Revenue vs log Total market penetration
Figure 27: Level of privatization vs log Total market penetration
Figure 29: Model fitting normality plot
Figure 24:log CapEx vs log Total market penetration
Figure 26: log GDP per capita vs log Total market penetration
Figure 28: Sovereign risk vs log Total market penetration

59
Table 1: Rule of Law, GSM vs CDMA, Tiers versus Total and Data Market Penetration Change
Country Legal
System GSM or CDMA
Regional Tiering
Method A (Telecom)
Regional Tiering
Method B (Overall)
Market Market Penetration
(2000)
Growth Rate
(2000-2008)
Market Penetration
(2008)
Market Penetration
(2010)
Growth Rate
(2008-2016)
Growth Rate
(2010-2016)
Market Penetration
(2016)
Argentina Civil GSM 1 2 Telephony 14.20% 362.54% 65.68% 22.29% 80.32% Data 33.23% 78.60% 59.35%
Brazil Civil CDMA 2 3 Telephony 11.51% 295.74% 45.55% 46.83% 66.88% Data 24.02% 121.07% 53.10%
Chile Civil GSM 1 1 Telephony 16.76% 247.55% 58.25% 42.76% 83.16% Data 32.99% 71.51% 56.58%
Colombia Civil GSM 2 2 Telephony 4.82% 1040.25% 54.96% 23.71% 67.99% Data 24.31% 78.53% 43.40%
Ethiopia Civil GSM 3 3 Telephony 0.03% 11366.67% 3.44% 985.76% 37.35% Data 1.07% 1515.89% 17.29%
Kenya Common GSM 2 2 Telephony 0.48% 5760.42% 28.13% 69.75% 47.75%
Data 10.50% 103.43% 21.36%
Malaysia Common GSM 1 2 Telephony 16.16% 246.66% 56.02% 39.90% 78.37% Data 16.30% 134.85% 38.28%
Mexico Civil CDMA 3 1 Telephony 11.96% 273.66% 44.69% 36.38% 60.95% Data 13.96% 233.52% 46.56%
Nigeria Common GSM 2 2 Telephony 0.02% 137250.00% 27.47% 71.17% 47.02% Data 10.08% 100.79% 20.24%
Pakistan Common GSM 3 2 Telephony 0.28% 9578.57% 27.10% 40.92% 38.19% Data 4.34% 326.27% 18.50%
Peru Civil GSM 2 3 Telephony 4.97% 788.53% 44.16% 57.40% 69.51%
Data 18.88% 140.47% 45.40%
Philippines Civil GSM 2 2 Telephony 7.19% 538.94% 45.94% 34.98% 62.01% Data 20.98% 71.73% 36.03%
Singapore Common GSM 1 1 Telephony 61.70% 36.34% 84.12% 3.60% 87.15% Data 45.19% 92.85% 87.15%
South Africa Common GSM 1 1 Telephony 13.50% 221.19% 43.36% 48.41% 64.35%
Data 13.83% 197.83% 41.19% South Korea Civil CDMA 1 1 Telephony 43.10% 61.88% 69.77% 23.86% 86.42%
Data 41.97% 92.76% 80.90%
Thailand Civil GSM 1 3 Telephony 6.11% 796.24% 54.76% 52.39% 83.45% Data 23.00% 135.48% 54.16%

60
Table 2: Market composition
Country Firm (2000) Firm (2016) Ownership (2016) Origin Percentage (2000)
Percentage (2016)
Argentina
BellSouth (Merged Q1 2005) AT&T US 4.31%
Claro (America Movil) Claro (America Movil) America Movil Mexico 2.06% 51.88%
Movistar (Telefonica) Movistar (Telefonica) Telefonica Spain 4.71% 45.95%
Nextel (Cablevision) (Merged Q1 2018)
Nextel (Cablevision) (Merged Q1 2018) NII Holdings US 0.36% 2.50%
Personal (Telecom Argentina)
Personal (Telecom Argentina) Telecom Argentina Argentina 5.52% 44.29%
Brazil
Amazonia (Merged Q2 2008) 0.43%
Algar Telecom Algar Telecom Algar S/A Empreendimentos e Participações
Brazil 0.12% 0.64%
Claro - Tess (Merged Q4 2002) 0.52%
Nextel (NII) Nextel (NII) NII Holdings US 0.18% 1.75% Sercomtel Sercomtel Sercomtel Brazil 0.03% 0.03% Claro - Americel (Merged Q4 2002) 0.22%
Claro - ATL/Algar (Merged Q4 2002) 0.92%
Telemig (Merged Q2 2008) 0.70%
TIM (Telecom Italia) TIM (Telecom Italia) Telecom Italia Italy 2.20% 29.69% Claro - BCP (Merged Q4 2003) 0.82%
Claro - BSE (Merged Q2 2003) 0.42%
TIM Maxitel (Merged Q1 2006) 0.54%
TIM TCS (Merged Q1 2006) 0.80%
TIM TNC (Merged Q1 2006) 0.86%
Vivo - CRT (Merged Q1 2006) 0.91%
Vivo - TCO (Merged Q1 2006) 0.97%
Vivo - Tele Leste (Merged Q1 2006) 0.41%
Vivo (Telefonica) Vivo (Telefonica) Telefonica Spain 6.33% 32.99% Vivo - Tele Sudeste (Merged Q1 2006) 1.61%
Vivo - TeleSP (Merged Q1 2006) 2.44%
Claro - Telet (Merged Q4 2002) 0.30%
Claro (America Movil) Claro (America Movil) America Movil Mexico 26.72%
Oi Oi Oi Brazil 19.59% TIM Celular (Merged Q1 2006)
Brasil Telecom (Merged Q1 2009)
aeiou (Unicel) (Closed Q2 2011)

61
Country Firm (2000) Firm (2016) Ownership (2016) Origin Percentage (2000)
Percentage (2016)
Chile
BellSouth (Merged Q1 2005) AT&T US 4.50%
Claro (America Movil) Claro (America Movil) America Movil Mexico 1.93% 36.57%
Entel Entel Entel Chile 8.30% 49.51%
Movistar (Telefonica) Movistar (Telefonica) Telefonica Spain 7.98% 48.52%
WOM (Novator) WOM (Novator) Novator UK 8.67% Interexport Interexport Motorola US 0.00% VTR Movil (Liberty Global) (Closed Q3 2013)
Colombia
Avantel Avantel Avantel Mexico 0.04% 2.47%
Claro (America Movil) Claro (America Movil) America Movil Mexico 2.53% 57.80%
Movistar (Telefonica) Movistar (Telefonica) Telefonica Spain 2.61% 27.11%
Tigo (Millicom) Tigo (Millicom) Millicom Luxembourg 15.89% UNE (EPM) (Merged Q3 2014)
ETB ETB ETB Colombia 1.41% Ethiopia Ethio telecom Ethio telecom Ethio telecom Ethiopia 0.03% 56.01%
Kenya
Airtel (Bharti Airtel) Airtel (Bharti Airtel) Bharti Airtel India 0.30% 13.96%
Safaricom Safaricom Government (35%), Vodafone (40%; 35% via Vodacom)
Kenya 0.19% 56.52%
yuMobile (Essar Telecom) (Merged Q4 2014)
Telkom (Helios) Telkom (Helios) Helios UK 5.90% Faiba (Jamii Telecom)
Malaysia
Celcom (Axiata) Celcom (Axiata) Khazanah Nasional Malaysia 6.55% 33.61% DiGi DiGi Telenor Norway 3.48% 37.66% Maxis Maxis Maxis Malaysia 6.17% 37.97% Telekom Cellular (Merged Q2 2003) 4.07%
Electcoms Electcoms Electcoms Malaysia 0.46% U Mobile U Mobile U Television Sdn. Bhd. Malaysia 15.69% unifi (Telekom Malaysia)
unifi (Telekom Malaysia) Khazanah Nasional Malaysia 1.39%
Yes (YTL Communications)
Yes (YTL Communications) YTL Corporation Malaysia 4.54%
ALTEL (Puncak Semangat)
ALTEL (Puncak Semangat) Puncak Semangat Malaysia 0.72%
TMgo (Telekom Malaysia)
TMgo (Telekom Malaysia) Khazanah Nasional Malaysia 0.46%
Mexico
Nextel (Merged Q2 2015) 0.21%
AT&T AT&T AT&T US 1.64% 9.33%
Movistar (Telefonica) Movistar (Telefonica) Telefonica Spain 1.01% 20.17%
Unefon (Merged Q2 2007) 0.15%
Telcel (America Movil)
Telcel (America Movil) America Movil Spain 10.22% 53.45%

62
Country Firm (2000) Firm (2016) Ownership (2016) Origin Percentage (2000)
Percentage (2016)
Nigeria
ntel (NatCom) ntel (NatCom) NatCom Nigeria 0.02% 0.16% MTN MTN MTN South Africa 32.89% Airtel (Bharti Airtel) Airtel (Bharti Airtel) Bharti Airtel India 18.10% Glo Mobile (Globacom)
Glo Mobile (Globacom) Conpetro Nigeria Nigeria 19.83%
Starcomms (Closed Q1 2014)
Multi-Links (Capcom) (Closed Q2 2016)
ZOOMmobile (RelTel Wireless) (Closed Q2 2012)
Visafone (Merged Q1 2016)
9mobile (EMTS) 9mobile (EMTS) EMTS Nigeria 11.04%
Smile Smile Smile Telecoms Holdings South Africa 0.28%
Bitflux Bitflux Nigeria 0.02% InterC Network InterC Network Sudatel Sudan 0.01% Swift Networks
Pakistan
Instaphone (Pakcom) (Closed Q4 2009) Arfeen Group Pakistan 0.10%
Zong (China Mobile) Zong (China Mobile) China Mobile China 0.07% 13.80%
Jazz (Global Telecom) Jazz (Global Telecom) VEON Netherlands 0.11% 26.43%
PTCL PTCL Majority Government Pakistan 9.94% Special Communications Organization
Special Communications Organization
Fully Government Pakistan 0.41%
Warid Telecom (Abu Dhabi) (Merged Q3 2016)
Abu Dhabi Group & SingTel
UAE & Singapore
Telenor Telenor Telenor Norway 20.21% Wateen Telecom (Abu Dhabi)
Wateen Telecom (Abu Dhabi) Abu Dhabi Group UAE 0.20%
Qubee (Augere) Qubee (Augere) Augere UK 0.05% wi-tribe wi-tribe HB Group Pakistan 0.09%
Peru
BellSouth (Merged Q4 2004) AT&T US 1.44%
Entel Entel Entel Chile 0.26% 15.04%
Movistar (Telefonica) Movistar (Telefonica) Telefonica Spain 3.44% 48.21%
Claro (America Movil) Claro (America Movil) America Movil Mexico 37.21%
Bitel (Viettel) Bitel (Viettel) Viettel Group Vietnam 11.62%
Philippines
Globe Telecom Globe Telecom Majority Ayala, SingTel Philippines, Singapore 3.25% 60.31%
Express Telecom (Closed Q3 2011)
Vega Telecom: Globe Telecom (50%), PLDT (50%)
Philippines 0.07%
Islacom (Merged Q2 2001) Globe Telecom,
Deutsche Telekom Philippines, Germany 0.07%
Next Mobile (NOW Telecom) (Closed Q2 2014)
0.15%
Smart (PLDT) Smart (PLDT) Majority Publc Philippines 3.43% 60.28% Talk 'N Text (Merged Q3 2009) Smart (PLDT) Philippines 0.83%
Sun Cellular (Digitel) (Merged Q4 2011) PLDT Philippines
wi-tribe (Liberty Telecoms) (Closed Q4 2015)
Vega Telecom: Globe Telecom (50%), PLDT (50%)
Philippines
Broadband Everywhere (ice) ice group Norway
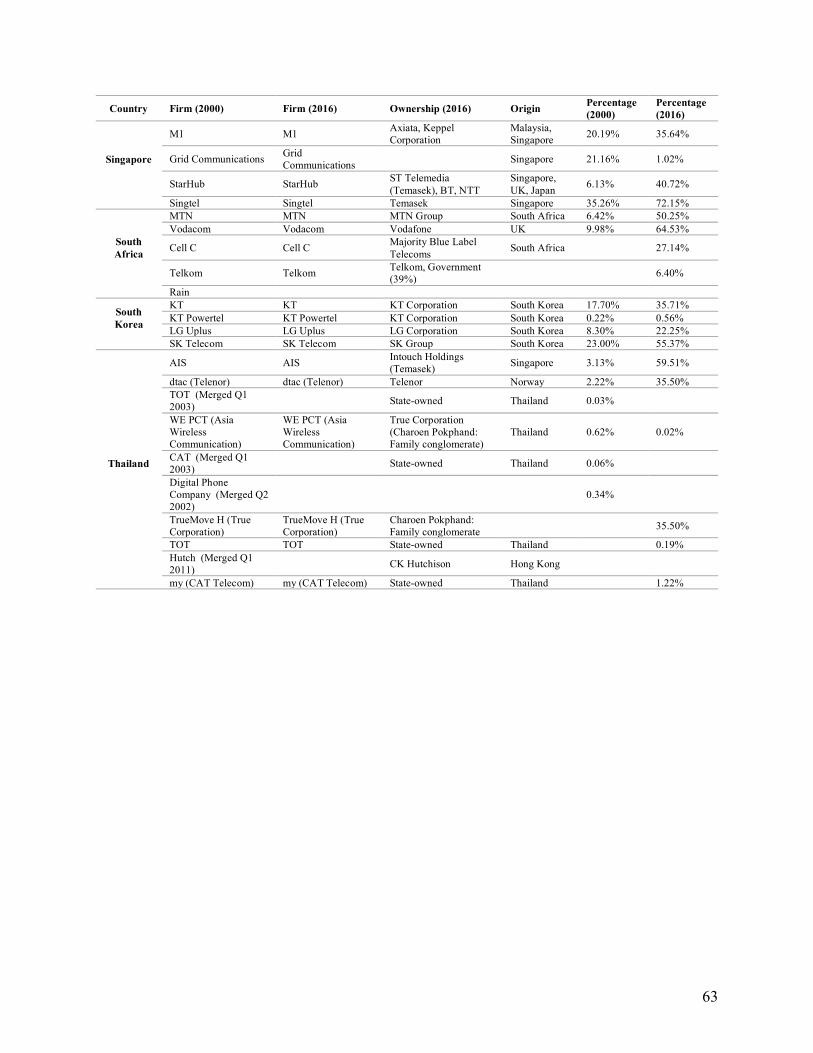
63
Country Firm (2000) Firm (2016) Ownership (2016) Origin Percentage (2000)
Percentage (2016)
Singapore
M1 M1 Axiata, Keppel Corporation
Malaysia, Singapore 20.19% 35.64%
Grid Communications Grid Communications Singapore 21.16% 1.02%
StarHub StarHub ST Telemedia (Temasek), BT, NTT
Singapore, UK, Japan 6.13% 40.72%
Singtel Singtel Temasek Singapore 35.26% 72.15%
South Africa
MTN MTN MTN Group South Africa 6.42% 50.25% Vodacom Vodacom Vodafone UK 9.98% 64.53%
Cell C Cell C Majority Blue Label Telecoms South Africa 27.14%
Telkom Telkom Telkom, Government (39%) 6.40%
Rain
South Korea
KT KT KT Corporation South Korea 17.70% 35.71% KT Powertel KT Powertel KT Corporation South Korea 0.22% 0.56% LG Uplus LG Uplus LG Corporation South Korea 8.30% 22.25% SK Telecom SK Telecom SK Group South Korea 23.00% 55.37%
Thailand
AIS AIS Intouch Holdings (Temasek) Singapore 3.13% 59.51%
dtac (Telenor) dtac (Telenor) Telenor Norway 2.22% 35.50% TOT (Merged Q1 2003) State-owned Thailand 0.03%
WE PCT (Asia Wireless Communication)
WE PCT (Asia Wireless Communication)
True Corporation (Charoen Pokphand: Family conglomerate)
Thailand 0.62% 0.02%
CAT (Merged Q1 2003) State-owned Thailand 0.06%
Digital Phone Company (Merged Q2 2002)
0.34%
TrueMove H (True Corporation)
TrueMove H (True Corporation)
Charoen Pokphand: Family conglomerate 35.50%
TOT TOT State-owned Thailand 0.19% Hutch (Merged Q1 2011) CK Hutchison Hong Kong
my (CAT Telecom) my (CAT Telecom) State-owned Thailand 1.22%
64
References
Accenture. “U.S. Wireless Industry Contributes $475 Billion Annually to America's Economy and Supports 4.7 Million Jobs, A.” Newsroom Main, Accenture, 5 Apr. 2018, newsroom.accenture.com/news/us-wireless-industry-contributes-475-billion-annually-to-americas-economy-and-supports-4-7-million-jobs-according-to-new-report.htm.
Adeoti, John Olatunji, and Adetola Ibidunni Adeoti. “Easing the Burden of Fixed Telephone Lines on Small-Scale Entrepreneurs in Nigeria: GSM Lines to the Rescue.” Telematics and Informatics, vol. 25, no. 1, 2008, pp. 1–18., doi:10.1016/j.tele.2005.12.002.
AFP. “Europe Ignoring Calls for Huawei Boycott.” World, TheNews International, 13 Jan. 2019, www.thenews.com.pk/latest/418545-better-than-ericsson-nokia-and-samsungs-5g-europe-ignoring-calls-for-huawei-boycott.
Bork, Robert H. The Antitrust Paradox: a Policy at War with Itself. Free Press, 1993.
Buys, Piet, et al. “Determinants of a Digital Divide in Sub-Saharan Africa: A Spatial Econometric Analysis of Cell Phone Coverage.” World Development, vol. 37, no. 9, 2009, pp. 1494–1505., doi:10.1016/j.worlddev.2009.01.011.
Christodoulos, Charisios, et al. “On the Combination of Exponential Smoothing and Diffusion Forecasts: An Application to Broadband Diffusion in the OECD Area.” Technological Forecasting and Social Change, vol. 78, no. 1, 2011, pp. 163–170., doi:10.1016/j.techfore.2010.08.007.
Chu, Wen-Lin, et al. “Diffusion of Mobile Telephony: An Empirical Study in Taiwan.” Telecommunications Policy, vol. 33, no. 9, 2009, pp. 506–520., doi:10.1016/j.telpol.2009.07.003.
Cullen Máximo, Torero, and Joachim Von Braun. Information and Communication Technologies for Development and Poverty Reduction: the Potential of Telecommunications. Johns Hopkins University Press, 2006.
Deaton, Angus S., and Christina H. Paxson. “The Effects of Economic and Population Growth on National Saving and Inequality.” Demography, vol. 34, no. 1, 1997, pp. 34–97., doi:10.2307/2061662.
Dekimpe, Marnik G., et al. “Staged Estimation of International Diffusion Models.” Technological Forecasting and Social Change, vol. 57, no. 1-2, 1998, pp. 105–132., doi:10.1016/s0040-1625(97)00085-1.
Eaton, Jonathan, and Samuel Kortum. “Innovation, Diffusion, and Trade.” 2006, doi:10.3386/w12385.

65
Estache, Antonio, and Grégoire Garsous. “The Impact of Infrastructure on Growth in Developing Countries.” IFC Economics Notes, 2012.
Fildes, Nic. “Europe's Telecoms Landscape Warms to 'Maverick' Operators.” Financial Times, Financial Times, 12 Aug. 2018, www.ft.com/content/81bee992-901e-11e8-bb8f-a6a2f7bca546.
Gruber, Harald, and Frank Verboven. “The Diffusion of Mobile Telecommunications Services in the European Union.” European Economic Review, vol. 45, no. 3, 2001, pp. 577–588., doi:10.1016/s0014-2921(00)00068-4.
GSMA. “Appendix 1 - Spectrum in Competition Policy.” Competition Policy in the Digital Age: Case Studies from Asia and Sub-Saharan Africa, 2016, www.gsma.com/publicpolicy/wp-content/uploads/2016/12/4.CPITDA_Case_Studies_Asia__Sub-SaharanAfrica_Appendix1-2.pdf.
GSMA. “GSMA Mobile for Development.” Mobile for Development, 2019, www.gsma.com/mobilefordevelopment/.
Hannigan, Robert. “Blanket Bans on Chinese Tech Companies like Huawei Make No Sense.” Financial Times, Financial Times, 12 Feb. 2019, www.ft.com/content/76e846a4-2b9f-11e9-9222-7024d72222bc?emailId=5c6a9c0ada2f840004993d24&segmentId=13b7e341-ed02-2b53-e8c0-d9cb59be8b3b.
Head, Keith, et al. “The Erosion of Colonial Trade Linkages after Independence.” Journal of International Economics, vol. 81, no. 1, 2010, pp. 1–14., doi:10.1016/j.jinteco.2010.01.002.
Hern, Alex. “BT Removing Huawei Equipment from Parts of 4G Network.” The Guardian, Guardian News and Media, 6 Dec. 2018, www.theguardian.com/technology/2018/dec/05/bt-removing-huawei-equipment-from-parts-of-4g-network.
Jha, Raghbendra, and Sumit K. Majumdar. “A Matter of Connections: OECD Telecommunications Sector Productivity and the Role of Cellular Technology Diffusion.” Information Economics and Policy, vol. 11, no. 3, 1999, pp. 243–269., doi:10.1016/s0167-6245(99)00017-7.
Kazeem, Yomi. “Smartphone Prices Have Dropped by More than 50% in Nigeria and Sales Are Up.” Quartz Africa, Quartz, 2 Apr. 2018, qz.com/africa/1242702/jumia-mobile-report-smartphone-prices-in-nigeria/.
Klonner, Stefan, and Patrick Nolen. “Cell Phones and Rural Labor Markets: Evidence from South Africa.” Proceedings of the German Development Economics Conference, Hannover, no. 56, 2010. www.econstor.eu/handle/10419/39968.

66
Morley, James. “What Is Endogenous Growth Theory?” World Economic Forum, 2015, www.weforum.org/agenda/2015/06/what-is-endogenous-growth-theory.
Munshi, Neil. “Groups Adapt to Insurgency to Tap Nigerian Growth.” Financial Times, Financial Times, 11 Dec. 2018, www.ft.com/content/b45be464-f940-11e8-af46-2022a0b02a6c.
Niculescu, Marius F., and Seungjin Whang. “Research Note—Codiffusion of Wireless Voice and Data Services: An Empirical Analysis of the Japanese Mobile Telecommunications Market.” Information Systems Research, vol. 23, no. 1, 2012, pp. 260–279., doi:10.1287/isre.1100.0346.
Odawara, Rei, and Norman V. Loayza. “Infrastructure And Economic Growth In Egypt.” Policy Research Working Papers, 2010, doi:10.1596/1813-9450-5177.
OnDigitalMarketing. “The 5 Stages of Technology Adoption.” On Digital Marketing, 2018, ondigitalmarketing.com/learn/odm/foundations/5-customer-segments-technology-adoption/.
O’Neal, Adam. “The Anti-Bill Gates.” The Wall Street Journal, Dow Jones & Company, 7 Dec. 2018, www.wsj.com/articles/the-anti-bill-gates-1544227025.
Peitz, Martin. “Asymmetric Access Price Regulation in Telecommunications Markets.” European Economic Review, vol. 49, no. 2, 2005, pp. 341–358., doi:10.1016/s0014-2921(03)00046-1.
Porta, Rafael La, et al. “The Economic Consequences of Legal Origins.” Journal of Economic Literature, vol. 46, no. 2, 2008, pp. 285–332., doi:10.1257/jel.46.2.285.
Pradhan, Rudra P., et al. “Telecommunications Infrastructure and Economic Growth: Comparative Policy Analysis for the G-20 Developed and Developing Countries.” Journal of Comparative Policy Analysis: Research and Practice, vol. 16, no. 5, 2014, pp. 401–423., doi:10.1080/13876988.2014.960227.
Reeves, Richard V. “The Economic Case for Social Mobility.” Brookings, Brookings, 28 July 2016, www.brookings.edu/opinions/the-economic-case-for-social-mobility/.
Romer, Paul. “Endogenous Technological Change.” The Journal of Political Economy, vol. 98, no. 5, ser. 2, 1990. doi:10.3386/w3210.
Rostow, Walt Whitman. The Stages of Economic Growth: A Non-Communist Manifesto. Cambridge University Press, 1960.
Röller, Lars-Hendrik, and Leonard Waverman. “Telecommunications Infrastructure and Economic Development: A Simultaneous Approach.” American Economic Review, vol. 91, no. 4, 2001, pp. 909–923., doi:10.1257/aer.91.4.909.

67
Solow, Robert M. “A Contribution to the Theory of Economic Growth.” The Quarterly Journal of Economics, vol. 70, no. 1, 1956, pp. 65–94., doi:10.2307/1884513.
Strategy&. “Ten Mechanisms for Global Inclusion.” Connecting the World, 2016, www.strategyand.pwc.com/media/file/Connecting-the-world.pdf.
Sundararajan, Arun. “Crowd-Based Capitalism, Digital Automation, and the Future of Work.” University of Chicago Legal Forum, vol. 2017, no. 19, 2018. 19.
Telang, Rahul. “An Empirical Analysis of Cellular Voice and Data Services.” SSRN Electronic Journal, 2004, doi:10.2139/ssrn.618481.
Thompson, Herbert G., and Christopher Garbacz. “Economic Impacts of Mobile versus Fixed Broadband.” Telecommunications Policy, vol. 35, no. 11, 2011, pp. 999–1009., doi:10.1016/j.telpol.2011.07.004.
Velez, Fernando, and Luis Correia. “Cost/Revenue Optimisation in Multi-Service Mobile Broadband Systems.” The 13th IEEE International Symposium on Personal, Indoor and Mobile Radio Communications, 2002, doi:10.1109/pimrc.2002.1046684.
Wareham, Jonathan, et al. “Wireless Diffusion and Mobile Computing: Implications for the Digital Divide.” Telecommunications Policy, vol. 28, no. 5-6, 2004, pp. 439–457., doi:10.1016/j.telpol.2003.11.005.
Waverman, Leonard, et al. “The Impact of Telecoms on Economic Growth in Developing Countries.” The Vodafone Policy Paper Series, vol. 2, no. 3, 2005.
Yermack, David. “FinTech in Sub-Saharan Africa: What Has Worked Well, and What Hasn't.” 2018, doi:10.3386/w25007.