the future of transport vehicles - advisian
TRANSCRIPT
www.advisian.com
The future of
transport vehicles
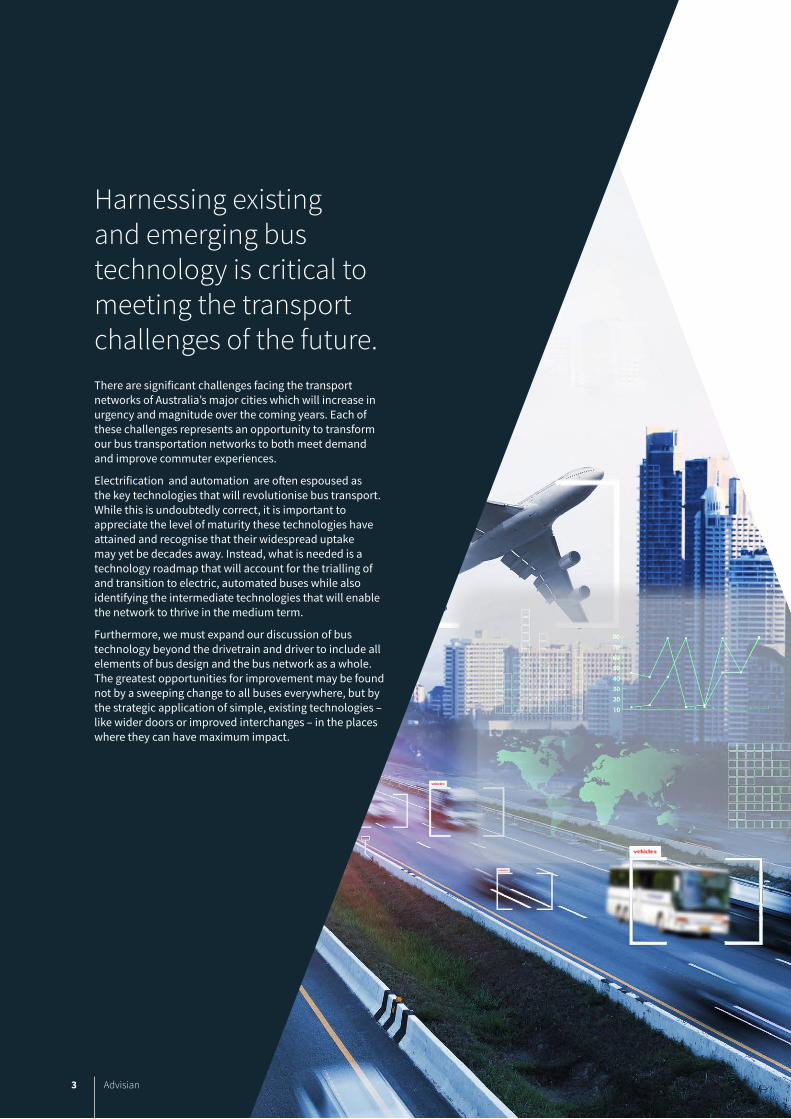
Harnessing existing and emerging bus technology is critical to meeting the transport challenges of the future.There are significant challenges facing the transport networks of Australia’s major cities which will increase in urgency and magnitude over the coming years. Each of these challenges represents an opportunity to transform our bus transportation networks to both meet demand and improve commuter experiences.
Electrification and automation are often espoused as the key technologies that will revolutionise bus transport. While this is undoubtedly correct, it is important to appreciate the level of maturity these technologies have attained and recognise that their widespread uptake may yet be decades away. Instead, what is needed is a technology roadmap that will account for the trialling of and transition to electric, automated buses while also identifying the intermediate technologies that will enable the network to thrive in the medium term.
Furthermore, we must expand our discussion of bus technology beyond the drivetrain and driver to include all elements of bus design and the bus network as a whole. The greatest opportunities for improvement may be found not by a sweeping change to all buses everywhere, but by the strategic application of simple, existing technologies – like wider doors or improved interchanges – in the places where they can have maximum impact.
3 Advisian

4The future of transport vehicles
The overarching challenge for the bus network of the future is to cater for exponential population growth and increasing urban densification while minimising the need for expansive new infrastructure and negative impacts on the environment.
Congestion currently adds on average 0.34 minutes per kilometre travelled, and delays to Sydney and Melbourne’s CBDs regularly increase travel times by up to 60%. The aggregated costs of this congestion to the Australian population are projected to reach $37.3 billion per year by 2030 – more than double the figure of $16.5 billion for 2015. The reform of bus services has been recognised as an effective method of reducing congestion, largely due to the efficiency of buses in their use of road space. A bus priority route in Brighton allows every three buses to replace approximately 200 cars, with buses moving 45% of passengers but taking up just 2% of vehicle traffic. Similarly, studies of Melbourne’s transport system estimate that the bus system reduces travel times by 9.85%.
Public health impacts of congestion must also be accounted for. Lengthy commutes are correlated with ‘hypertension, obesity, decreased cardiovascular fitness, stress, low energy and illness-related work absence’. The health costs associated with death due to local air pollution are valued at $11–24 billion, with 3000 Australians dying each year due to levels of fine particulate matter. While reducing congestion through increased bus patronage can reduce negative health effects of the transport system, the use of diesel fuel limits the extent of this reduction.
Climate change is bringing about changes that are ‘both profound and accelerating’. The current level of greenhouse gas emissions has produced sufficient warming that, without adaption measures, put the world at high risk of severe impacts in the near term, including decreased food production and quality, increased flooding and landslides, and the loss of natural ecosystems such as the Great Barrier Reef. Buses, however, even with diesel fuel technology, produce six times less emissions than cars, and there is a correlation between reduced transport emissions per capita and a higher proportion of trips undertaken by public and active transport in cities around the world. An enhanced bus network, particularly harnessing electric drivetrain technology, will be central to achieving Australia’s 26–28% emission reduction target by 2030, and the net zero emissions by 2050 target in New South Wales, Victoria, Queensland, South Australia, Tasmania and Australian Capital Territory.
Accessibility one of the key issues arising from the concentration of population growth in outer suburbs of Australian cities. These outer-urban ‘fringe’ areas experience higher mass transit commute times relative to private travel, less direct routes, and are less connected to places of employment. Bus services are one of the key ways of overcoming this ‘transport disadvantage’, which particularly affects people who do not have access to a car due to affordability, disability or age.
The bus network will only be effective in addressing these challenges if its efficiency and coverage are improved. Fortunately, there are several existing technologies and techniques to achieve significant gains for the system with minimal cost.
Solutions to present and future problems
5 Advisian
Getting more for lessTargeted changes to the design of bus bodies and networks can significantly improve levels of service.
Features as simple as increasing the width or number of doors can result in drastic gains. It is estimated that having three wide doors rather than one narrow door saves 1.4 seconds per passenger at boarding and alighting. Wide-door buses have been found to reduce boarding times by 40%, regardless of floor height. Moreover, simply altering the use of existing doors can improve bus efficiency. When two-door boarding was implemented in San Francisco, overall dwell times per passenger reduced from 4.3seconds to 2.7 seconds on average.
Bus rapid transit (BRT) involves providing sufficient infrastructure and priority to bus travel for a dedicated length of road to enable a high capacity, high frequency and high speed level of service similar to a light rail system, but at the operational cost of buses and roads. This is achieved through a combination of modifications to the bus network, including dedicated right-of-way, busway alignment, off-board fare collection, priority at intersections, and platform-level boarding. Across 10 BRT sites in Europe (there known as ‘bus with a high level of service), ridership gains ranged from 20 to 134 per cent.
The benefits of enhanced bus networks can be obtained even when all the ‘basic’ feature of BRT are not implemented. Brisbane’s BRT does not have platform-level boarding or alignment of busways at the median but has still achieved estimated travel time reductions of 70%.
These examples illustrate the benefits available from both major reforms of the bus network and minor tweaks to day-to-day operations. Developments in technology open up new opportunities to amplify these results. For example, using Smart Card data in Chengdu, China, researchers were able to design a limited stop service that had the capacity to reduce travel times by 9.23%. Harnessing the power of this data will require years of investment, as has been the case in London, but it has already been used to expand the coverage of the network and has been identified as a necessary component of future long term and real-time route planning.
As we look to a future of electrification and automation, these and countless other existing technologies and techniques have been proven effective in case studies around the world. This is not to mention the significant potential of low-floor buses, strategic use of articulated and double-decker buses, interchange design for integration with other mass transit, and on-demand last-mile transit.
Electrification and automation will almost certainly be part of the bus network of the future. Electrification can cause up to 100% greenhouse gas emission reductions relative to diesel buses, reduce ongoing maintenance costs, reduced local noise and air pollution, enhanced passenger comfort, and enabling independence from fossil fuels. Automation will reduce labour costs, improve safety and enable the expansion of the transport network. However, at present these benefits are just out of reach.
In 2015, the National Center for Transit Research at the University of Southern Florida conducted a review of autonomous vehicle technology in public transport and found: ‘Unlike the automotive industry which has invested a substantial amount of money into AV technology, there have not been similar AV developments in the transit industry.’ Implementations of automation in the US were limited to forms of driver assistance. While a follow-up study found that companies were trialling shuttles, particularly in Europe, it also noted these trials were exposing the limitations of the technology.
Likewise, to be competitive with diesel and other technologies that currently service public transport fleets, electric buses will require a range of 400 km or more, which is not viable with the weight and price of current battery technology and sparsity of charging infrastructure. However, studies tracking the trend of falling battery prices project that that batteries will reach the capacity benchmark of US$150/kWh by 2025, or potentially sooner, and at that point can be effectively commercialised.
A roadmap to electrification and automation

Until these technologies become ripe for widespread implementation, two strategies should be pursued: intermediate technologies and preparatory trials.
Although it may be some time before buses are entirely driverless, there are already lower levels of automation that can be implemented into existing bus fleets. Ecodrive technology which provides feedback to drivers on inefficient driving behaviours can reduce fuel consumption and hence emissions by up to 15%, and also reduce accidents. Lane assistance technology can enable higher speeds and maximise use of road space. Crash avoidance technology MobilEye which has been installed in over 1000 buses in NSW and Victoria has been found effective at reducing lane departure and forward collisions approximately 75% of the time.
Hybrid electric-diesel buses are already a cheaper and more fuel efficient option than diesel buses. Real world studies have found potential fuel and emissions savings of 20–45% and overall life-cycle cost reductions up to US$50,000. A feasibility study of the procurement of buses for Cairns indicated that hybrid buses would have a pay-back period of 3.34 years, compared to 3.9 years for a diesel bus and 4.17 years for CNG buses.
These intermediate technologies can and should be harnessed now. Simultaneously, autonomous shuttles should continue to be trialled as last-mile shuttle solutions, where they can provide greater accessibility in a relatively low-risk environment. Existing and past trials taking place at Flinders University, Perth, Curtin University, Darwin and Olympic Park should be expanded. As many of these shuttles are fully electric, this will also provide a space in which to invest in and test improvements in battery and charging technology. Part of this could involve implementing opportunity charging stations at interchanges that form the destination points for feeder routes (but also form points on the main corridor to be utilised by future electric buses), or constructing charging stations at depots.
6The future of transport vehicles
The future is hereA survey of the challenges and opportunities facing bus transportation in the coming years suggests the following conclusion: the future is here. The challenges of congestion, climate change, health and accessibility are already upon us, but so are proven methods of improving the capacity of the bus network to meet them. In the same way, there is a direct pathway for governments to follow towards complete electrification and automation, harnessing the power of existing technologies in the interim. All that is required is a long-term commitment to investment in this future.

7 Advisian
Mahmoud, M et al 2016, ‘Electric Buses: A Review of Alternative Powertrains’, Renewable and Sustainable Energy Reviews, vol. 62, pp. 673–684, pp. 681–682.
Peters, A 2017, ‘Automated Buses Are Here, Now We Have To Decide How They Will Reshape Our Cities’, Fast Company, 27 July.
Bureau of Infrastructure, Transport and Regional Economics 2015, Traffic and Congestion Cost Trends for Australian Capital Cities, p. 15.
Terrill, M et al 2017, Stuck in Traffic? Road Congestion in Sydney and Melbourne, Grattan Institute, pp. 19–21, 30, 33–34.
Bureau of Infrastructure, Transport and Regional Economics 2015, Traffic and Congestion Cost Trends for Australian Capital Cities, p. 1.
Royal Academy of Engineers 2015, The Transport Congestion Challenge: Getting the Most Out of the UK’s Road and Rail Networks, pp. 14–15, 19–20.
Campaign for Better Transport 2016, House of Commons Transport Committee: Investigation into Urban Traffic Congestion, Submission to House of Commons Transport Committee, p. 2; cf Senate Standing Committee on Rural and Regional Affairs and Transport (Cth) 2014, Role of Public Transport in Delivering Productivity Outcomes, p. 17.
Stanley, J 2010, The Value of Melbourne’s Route Bus Services, BusVic, p. 5.
Hilbrecht, M, Smale, B & Mock, S E 2014, ‘Highway to Health? Commute Time and Well-Being among Canadian Adults’, World Leisure Journal, vol. 56, no. 2, pp. 151–163, p. 151.
Keywood, M D, Emmerson, K M & Hibberd, M F 2016, ‘Ambient Air Quality: Health Impacts of Air Pollution’, in Jackson, W et al 2016, Australia State of the Environment 2016, Australian Government Department of the Environment and Energy, Canberra.
Keywood, M D, Emmerson, K M & Hibberd, M F 2016, ‘Ambient Air Quality: Health Impacts of Air Pollution’, in Jackson, W et al 2016, Australia State of the Environment 2016, Australian Government Department of the Environment and Energy, Canberra.
See also Risbey, T, Cregan, M & De Silva, H 2010, ‘Social Costs of Road Crashes’, paper presented at the Australasian Transport Research Forum, Canberra, 29 September–1 October, p. 13.
Australian Transport Council 2006, Appraisal of Initiatives, National Guidelines for Transport System Management in Australia, vol. 3, p. 101; Stanley, J 2010, The Value of Melbourne’s Route Bus Services, BusVic, pp. 12–13.
Roberts, A J 2016, ‘Editorial’, UNSW Law Journal, vol. 39, no. 4, pp. 1297–1299, p. 1297.
Intergovernmental Panel on Climate Change 2014, ‘Summary for Policymakers’, in Field, C B et al (eds), Climate Change 2014: Impacts, Adaptation, and Vulnerability. Part A: Global and Sectoral Aspects. Contribution of Working Group II to the Fifth Assessment Report of the Intergovernmental Panel on Climate Change, Cambridge University Press, Cambridge, pp. 21–25.
Tourism & Transport Forum Australia 2009, TTF Transport Position Paper: Public Transport & Climate Change, p. 8, citing Garnaut, R 2011, The Garnaut Review 2011: Australia in the Global Response to Climate Change, Cambridge University Press, Port Melbourne,
ch. 21, p. 509; Cosgrove, D et al 2012, Greenhouse Gas Abatement Potential of the Australian Transport Sector: Technical Report from the Australian Low Carbon Transport Forum, CSIRO, p. 69.
Garnaut, R 2011, The Garnaut Review 2011: Australia in the Global Response to Climate Change, Cambridge University Press, Port Melbourne, ch. 21, p. 520.
Department of Environment and Energy (Cth) 2017, Australia’s Emissions Projections 2017, p. 3.
Jewell, C 2017, ‘How States and Territories Compare on Climate Action’, The Fifth Estate, 31 January; Queensland Government 2017, Transition to a Zero Carbon Economy, accessed 8 October 2018.
Bureau of Infrastructure, Transport and Regional Economics 2016, Lengthy Commutes in Australia, Research Report 144, pp. 142–143.
Victorian Auditor-General 2013, Developing Transport Infrastructure and Services for Population Growth Areas, p. 20; Public Transport Users Association 2012, Driven Around the Bend: Melbourne’s Meandering Bus Routes, p. 12.
Bureau of Infrastructure, Transport and Regional Economics 2012, Population Growth, Jobs Growth and Commuting Flows in Sydney , Research Report 132, pp. 222–225.
City of Hobart 2017, City of Hobart Transport Strategy 2018–30 – Consultation Paper 3: Public Transport, p. 111.
EMBARQ 2010, Bus Karo: A Guidebook on Bus Planning & Operations, pp 50–52.
Fernandez, R 2011, ‘Experimental Study of Bus Boarding and Alighting Times’, paper presented at the European Transport Conference, Glasgow, 10–12th October, p. 10.
Jaffe, E 2015, ‘Why Buses Should Let You Board Through Any Door, in 2 Charts’, CityLab, 13 March; San Francisco Municipal Transportation Authority 2014, All-Door Boarding Evaluation: Final Report, pp. 13, 18–19.
See Institute for Transportation and Development Policy 2014, What is BRT?, accessed 18 January 2018.
Institute for Transportation and Development Policy 2016, The BRT Standard: 2016 Edition, pp. 26–37.
Heddebaut, O et al 2010, ‘The European Bus with a High Level of Service (BHLS): Concept and Practice’, Built Environment, vol. 36, no. 3, pp. 307–316.
Neelagama, I 2014, Rapid Transit: Investing in Australia’s Transport Future, Bus Industry Confederation, p. 83.
Luo, X et al 2016, ‘Designing Limited-Stop Transit Service with Fixed Fleet Size in Peak Hours by Exploiting Transit Data’, Transportation Research Record, vol. 2647, pp. 134–141.
JRC 2017, Bus Planning Literature Review, pp. 4–5, 8, 22, 30, 32, 38–40.
Sun, L et al 2014, ‘Models of Bus Boarding and Alighting Dynamics’, Transportation Research Part A: Policy and Practice, vol. 69, pp. 447–460, p. 458; Sadeghpour, M & Öğüt, K S 2017, ‘Analyzing Passenger Boarding and Alighting Service Times for Bus Transportation in Istanbul’, paper presented at the Transportation Research Board 96th Annual Meeting, Washington DC, 8–12th January; Finn, B et al 2011, Buses with High Level of Service, European Cooperation in Science and Technology, pp. 52–53, 98; Kuys, J et al 2016, ‘Developing Industrial Design-led Innovation through a Human-Centred Design Approach for Electric Bus System in Kuala Lumpur, Malaysia 2020’, paper presented at the Australasian Transport
References:

8The future of transport vehicles
Research Forum (ATRF), Melbourne, 16–18th November, pp. 4, 7–8.
Wright, L 2004, Bus Rapid Transit, Deutsche Gesellschaft für Technische Zusammenarbeit, pp. 232–233; World Bank Group and PPIAF, Evaluate Your Bus System: Factors Influencing Bus System Efficiency: Vehicle Size and Type.
Cervero, R 2013, Bus Rapid Transit (BRT): An Efficient and Competitive Mode of Public Transport, Working Paper 2013-01, Institute of Urban and Regional Development, University of California, Berkley, p. 16; Transport for NSW 2013, Sydney City Centre Access Strategy, pp. 7, 21, 50.
Goodall, W et al 2017, ‘The Rise of Mobility as a Service: Reshaping How Urbanites Get Around’, Deloitte Review, no. 20, pp. 112–129, p. 124; 2getthere n.d., Rivium GRT, accessed 19 December 2017; Lohmann, R 2009, Pilot Project: ParkShuttle Kralingse Zoom – Rivium in Capelle a/d IJssel, the Netherlands; Lohmann, R 2007, Personal Rapid Transit: Innovation Lasting, 2getthere.
See Harris, A, Soban, D & Smyth, B 2017, ‘Recommendations for a Whole Life Cycle Economic and Environmental Impact Technology Assessment Tool for Alternative Driveline Bus Fleets’, paper presented at the Irish Transport Research Network Conference 2017, University College, Dublin, 28–29th August, p. 7–8. Figure 10: Mahmoud, M et al 2016, ‘Electric Buses: A Review of Alternative Powertrains’, Renewable and Sustainable Energy Reviews, vol. 62, pp. 673–684, p. 679.
Aber, J 2016, Electric Bus Analysis for New York City Transit, Columbia University, p. 14–17, 20; Grütter, J 2015, Real World Performance of Hybrid and Electric Buses: Environmental and Financial Performance of Hybrid and Battery Electric Transit Buses Based on Real World Performance of Large Operational Fleets, Grütter Consulting AG, pp. 25, 36.
Global Green Growth Institute 2016, Electric Buses in India: Technology, Policy and Benefits, p. 49–55; Tap, M 2017, ‘Factors Affecting Modern Transit Bus Uptake and Network Integration’, presentation presented at EECON 2017, Melbourne Convention Centre, Melbourne, 22–23rd November.
MRCagney 2017, Electric Bus Technology: Transport Research Report, p. 12; SPA Future Thinking 2012, Research Summary: New Bus for London – In Service Evaluation; Advanced Energy 2013, Electric Drive Buses: Report, p. 13.
Stock, P et al 2017, Renewables Ready: States Leading the Charge, p. VI.
Peters, A 2017, ‘Automated Buses Are Here, Now We Have To Decide How They Will Reshape Our Cities’, Fast Company, 27 July; Sisson, P 2017, ‘Buses – Small, Electric, and Automated – May Be Transit’s Future’, Curbed, 2 November; Walker, A 2016, ‘Can Self-Driving Technology Save the Bus?’, Curbed, 28 July.
Pessaro, B, National Center for Transit Research 2015, Evaluation of Automated Vehicle Technology for Transit, Florida Department of Transportation, pp. 1–2, 13.
Pessaro, B, National Center for Transit Research 2016, Evaluation of Automated Vehicle Technology for Transit – 2016 Update, pp. vii–viii.
Ally, J 2015, Life Cycle Assessment and Life Cycle Costing of Hydrogen Fuel Cell, Natural Gas, and Diesel Bus Transportation Systems in Western Australia, PhD Thesis, Murdoch University, p. 143.
MRCagney 2017, Electric Bus Technology: Transport Research Report, p. 24.
Global Green Growth Institute 2016, Electric Buses in India: Technology, Policy and Benefits, pp. 67–68; Berckmans, G et al 2017, ‘Cost Projection of State of the Art Lithium-Ion Batteries for Electric Vehicles Up to 2030’, Energies, vol. 10, no. 9, 1314.
SAE International 2014, Automated Driving.
Ribas, R J G 2014, Ecodrive, Masters Thesis, Universidade de Lisboa; MiX Telematics n.d., BOGESTRA AG; MiX Telematics n.d., AUTOCARS PASCAL; MiX Telematics n.d., RIBAS® DISPLAY.
Jaffe, E 2015, ‘Don’t Expect to Ride in Driverless Buses Anytime Soon’, CityLab, 16 March; Pessaro, B 2013, ‘Impacts of the Cedar Avenue Driver Assist System on Bus Shoulder Operations’, Journal of Public Transportation, vol. 16, no. 1, pp. 83–95. Figure 17: Ibid.
Mobileye, CDC Victoria & CDC NSW 2017, Giant Step in Bus Accident Prevention Across NSW and VIC with New Global Transport Technology, Media Release, 20 June; Mobileye n.d., Transit Bus, accessed 20 December 2017; Kim, J 2016, ‘Effectiveness of Collision Avoidance Technology’, Report, University of Missouri, pp. 4–5, 39. See also Lutin, J M & Kornhauser, A L 2014, Application of Autonomous Driving Technology to Transit – Functional Capabilities for Safety and Capacity, paper presented at the Transportation Research Board 93rd Annual Meeting, Washington DC, 12–16th January, pp. 4–8.
Grütter, J 2015, Real World Performance of Hybrid and Electric Buses: Environmental and Financial Performance of Hybrid and Battery Electric Transit Buses Based on Real World Performance of Large Operational Fleets, Grütter Consulting AG; Global Green Growth Institute 2016, Electric Buses in India: Technology, Policy and Benefits, p. 64. Partridge, J, Wu, W & Bucknall, R 2017, ‘Development of Bus Drive Technology towards Zero Emissions: A Review’, in Donateo, T (ed), Hybrid Electric Vehicles, InTech, pp. 33–59, pp. 37, 40, 44; Wandsworth Council 2016, Putney to Be London’s First ‘Low Emission Bus Zone’, accessed 10 January 2018.
Tap, M 2017, ‘Factors Affecting Modern Transit Bus Uptake and Network Integration’, presentation presented at EECON 2017, Melbourne Convention Centre, Melbourne, 22–23rd November.
Peters, A 2017, ‘Automated Buses Are Here, Now We Have To Decide How They Will Reshape Our Cities’, Fast Company, 27 July; Sisson, P 2017, ‘Buses – Small, Electric, and Automated – May Be Transit’s Future’, Curbed, 2 November; Walker, A 2016, ‘Can Self-Driving Technology Save the Bus?’, Curbed, 28 July.
Department of Planning, Transport and Infrastructure (SA) 2017, Flinders Autonomous Shuttle Trial, accessed 23 January 2018; Flinders University 2017, Driverless Bus, accessed 20 December 2017. Figure 15: Ibid.
Saffioti, R & Kelly, D 2017, Perth One of Three Cities in the World to Trial New Driverless Cars, accessed 4 December 2017.
Ross, H 2017, Autonomous Bus Drives Research at Curtin University, Media Release, Curtin University, 27 March.
Department of Infrastructure, Planning and Logistics (NT) 2017, Driverless Bus, accessed 30 November 2017.
Transport for NSW 2017, Driverless Shuttle Bus Trial, accessed 20 December 2017. Transport for NSW 2017, Smart Shuttle Trial Fact Sheet.
Grütter, J 2015, Real World Performance of Hybrid and Electric Buses: Environmental and Financial Performance of Hybrid and Battery Electric Transit Buses Based on Real World Performance of Large Operational Fleets, Grütter Consulting AG, pp. 25–26.

For more information please contact:Victor Prados-Valerio
Warren Williams
P: +61 2 9495 0589M: +61 4 2935 9608
www.advisian.com
M: +61 4 1205 8519)