the future of value generation
TRANSCRIPT
The Future of Value Generation
Developing Successful and Sustainable Value Propositions Through Situational Awareness, Mapping and Holonomic Thinking
Simon Robinson
Page www.holonomics.co.uk2
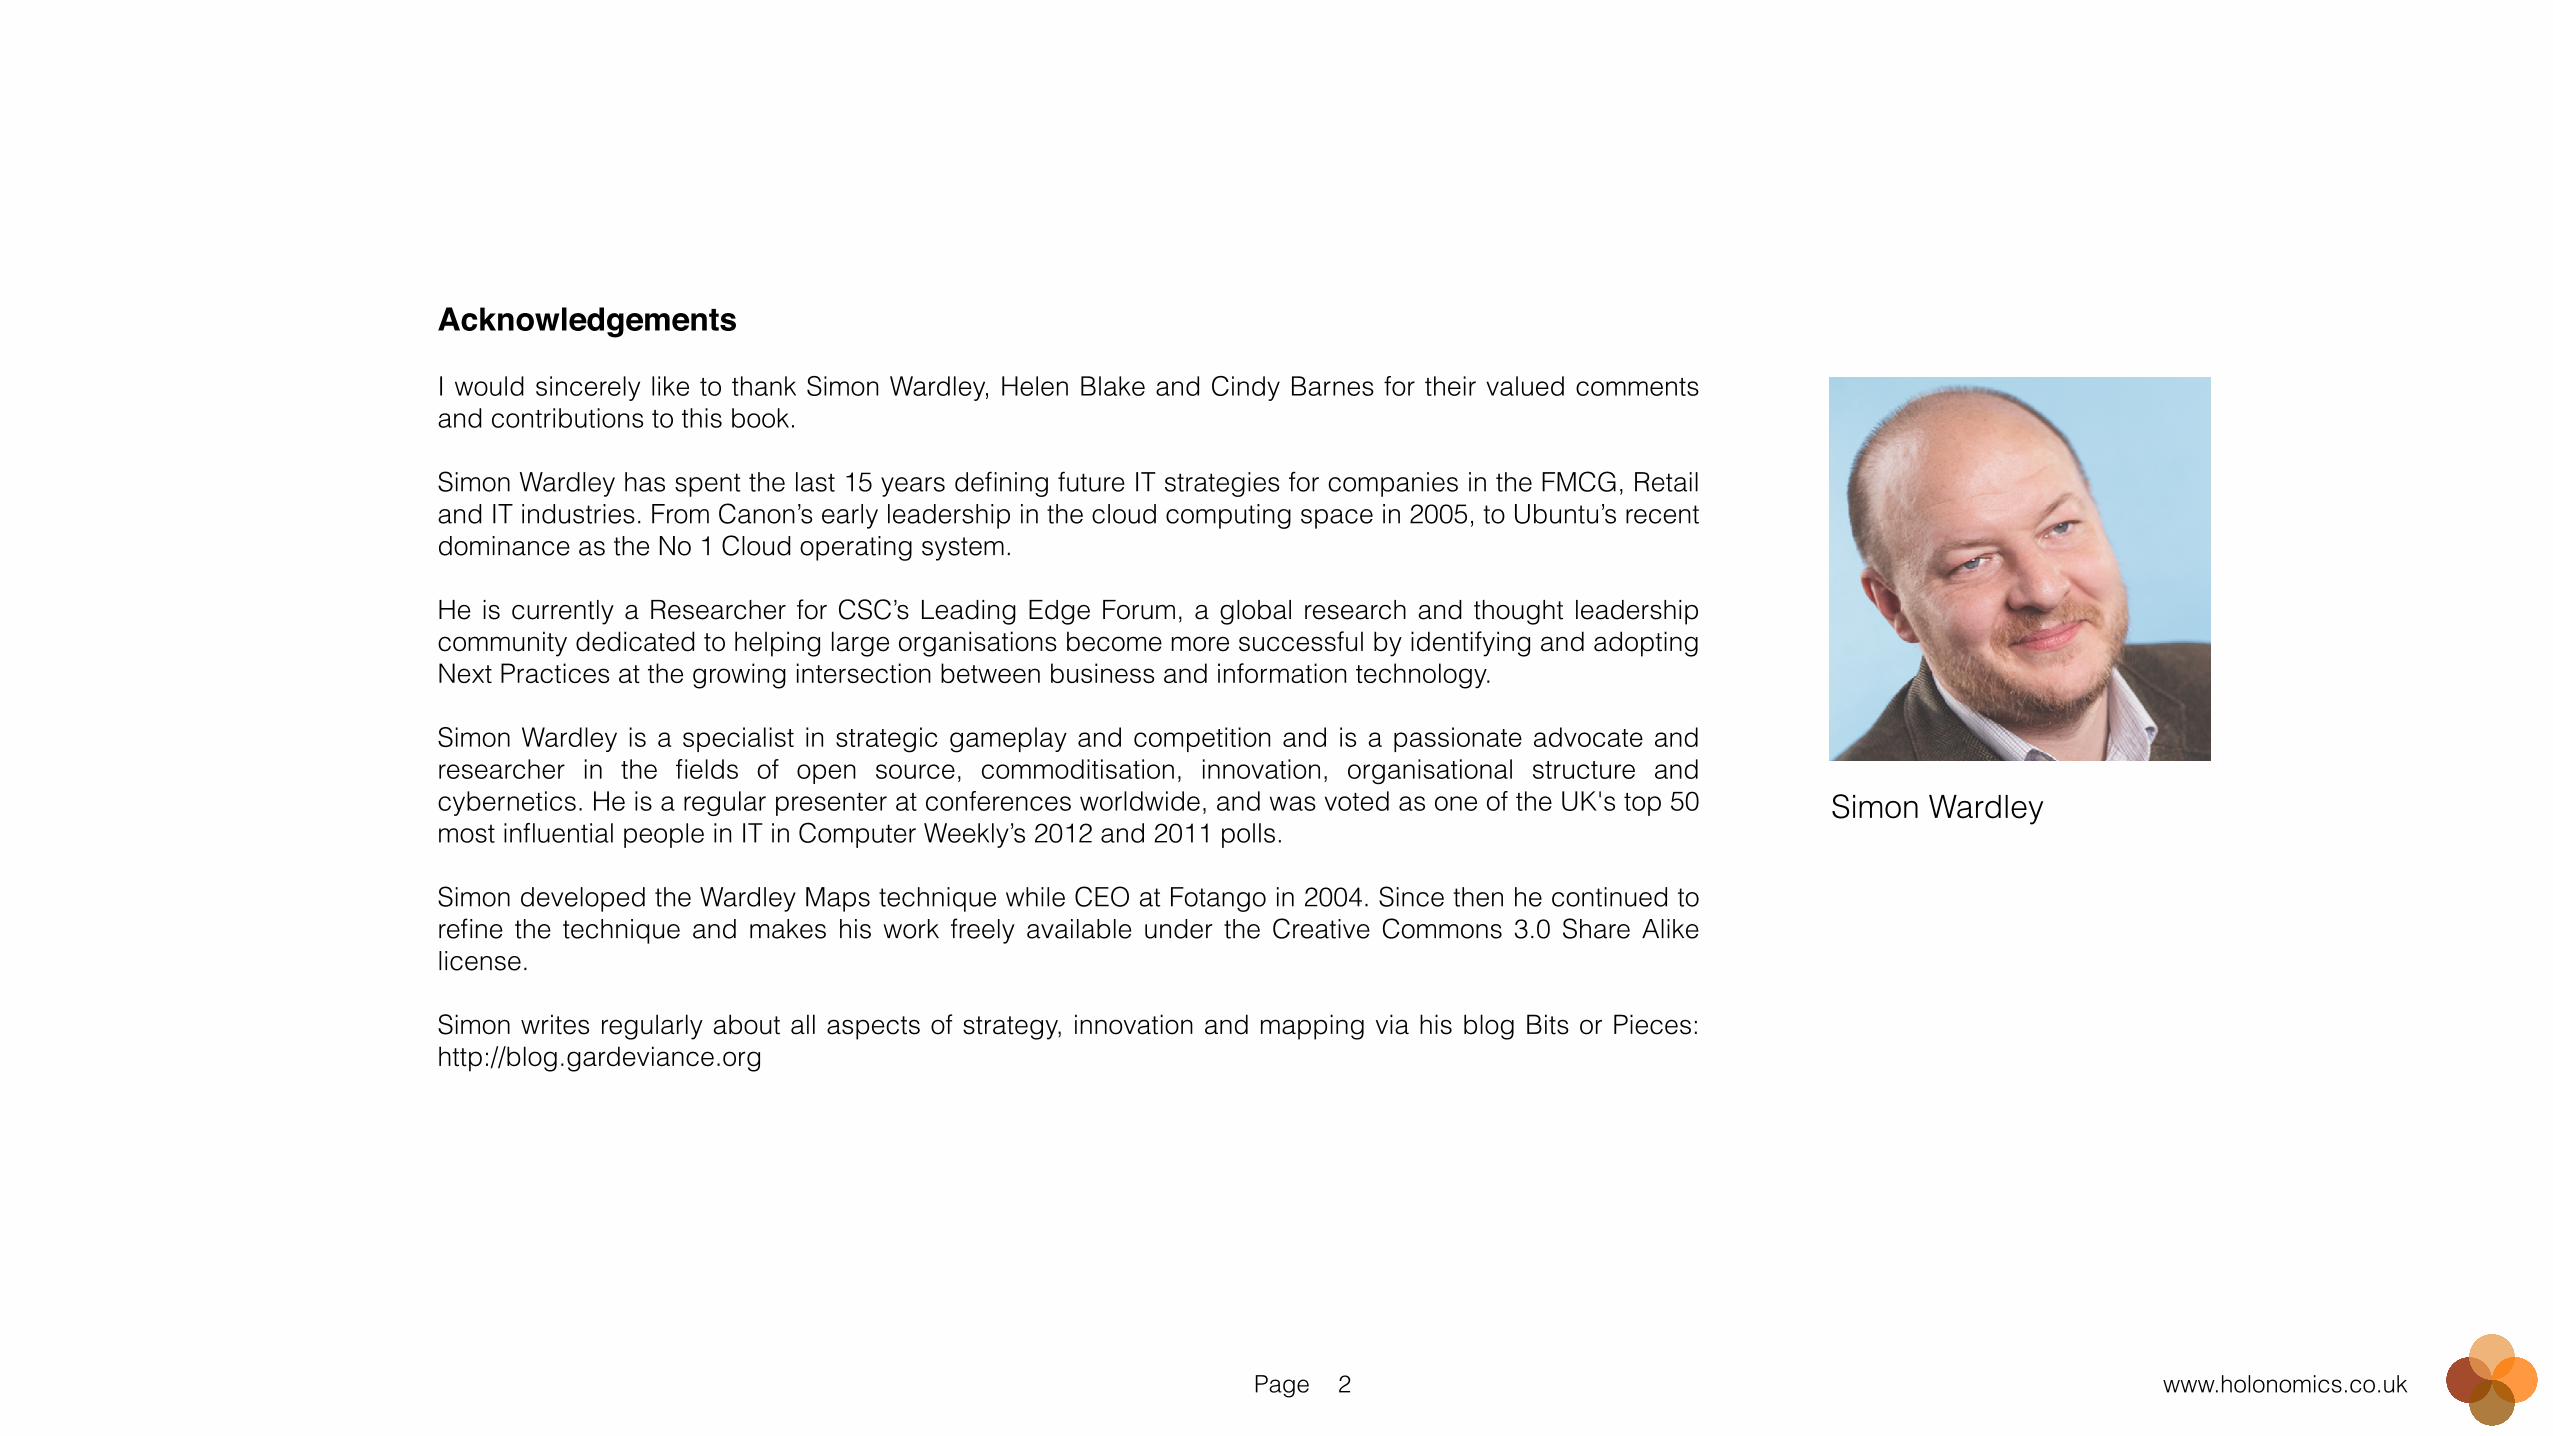
Acknowledgements!!I would sincerely like to thank Simon Wardley, Helen Blake and Cindy Barnes for their valued comments and contributions to this book. !Simon Wardley has spent the last 15 years defining future IT strategies for companies in the FMCG, Retail and IT industries. From Canon’s early leadership in the cloud computing space in 2005, to Ubuntu’s recent dominance as the No 1 Cloud operating system. !He is currently a Researcher for CSC’s Leading Edge Forum, a global research and thought leadership community dedicated to helping large organisations become more successful by identifying and adopting Next Practices at the growing intersection between business and information technology. !Simon Wardley is a specialist in strategic gameplay and competition and is a passionate advocate and researcher in the fields of open source, commoditisation, innovation, organisational structure and cybernetics. He is a regular presenter at conferences worldwide, and was voted as one of the UK's top 50 most influential people in IT in Computer Weekly’s 2012 and 2011 polls. !Simon developed the Wardley Maps technique while CEO at Fotango in 2004. Since then he continued to refine the technique and makes his work freely available under the Creative Commons 3.0 Share Alike license. !Simon writes regularly about all aspects of strategy, innovation and mapping via his blog Bits or Pieces: http://blog.gardeviance.org
Simon Wardley

Page www.holonomics.co.uk3
A Shift in Mindsets!!The business of business isn’t just about creating profits for shareholders — it’s also about improving the state of the world and driving
stakeholder value. !The declaration above comes from Marc Benioff, Chairman and CEO of Salesforce. Wishing to open up a dialogue about stakeholder value, The Aspen Institute in their study Reopening the Question of Corporate Purpose offered these four questions: !• How do we define “long term” and “value creation”? • How can we describe the real world complexity of business while capturing our aspirations for corporations? • When it comes to purpose, does one size fit all? If not, how do we define the roles and responsibilities of business leaders? How
and what do we teach business students? • How do we achieve accountability? !These are excellent questions, and a real indication that we are moving from a primarily financial and shareholder-focused view of business to a values-based view of business. However, this shift is by no means simple for people to make, since it requires an entirely new mindset. !Executives need to upgrade their mental operating systems and developing a dynamic new way of seeing before they can develop radically new strategies. The four major elements of holonomic thinking are: !Systemic – Understanding the organisation as an organic and dynamic system of interrelated organs. !Experiential – Understanding the lived experience of each person – employees, management, leadership, stakeholders and the community. !Meaning – Understanding how shared meaning emerges in the organisation over time, allowing the organisation to be able to become agile, efficient and transparent – an authentic whole. !Ethical – Understanding how human values are the foundation of authenticity, agility and change !These four components – systemic, experiential, meaning and ethical – are exactly what is required to develop future business propositions which both create value and are sustainable. !In executing any profound transformational strategies or implementing change programmes, before we can introduce new business models we require a systems view of the organisation. However, this systems view cannot be mechanistic or Cartesian, since any attempt to introduce the new business model (and value proposition) will still be articulated and understood using the old logic, and therefore likely to fail.
Page www.holonomics.co.uk4
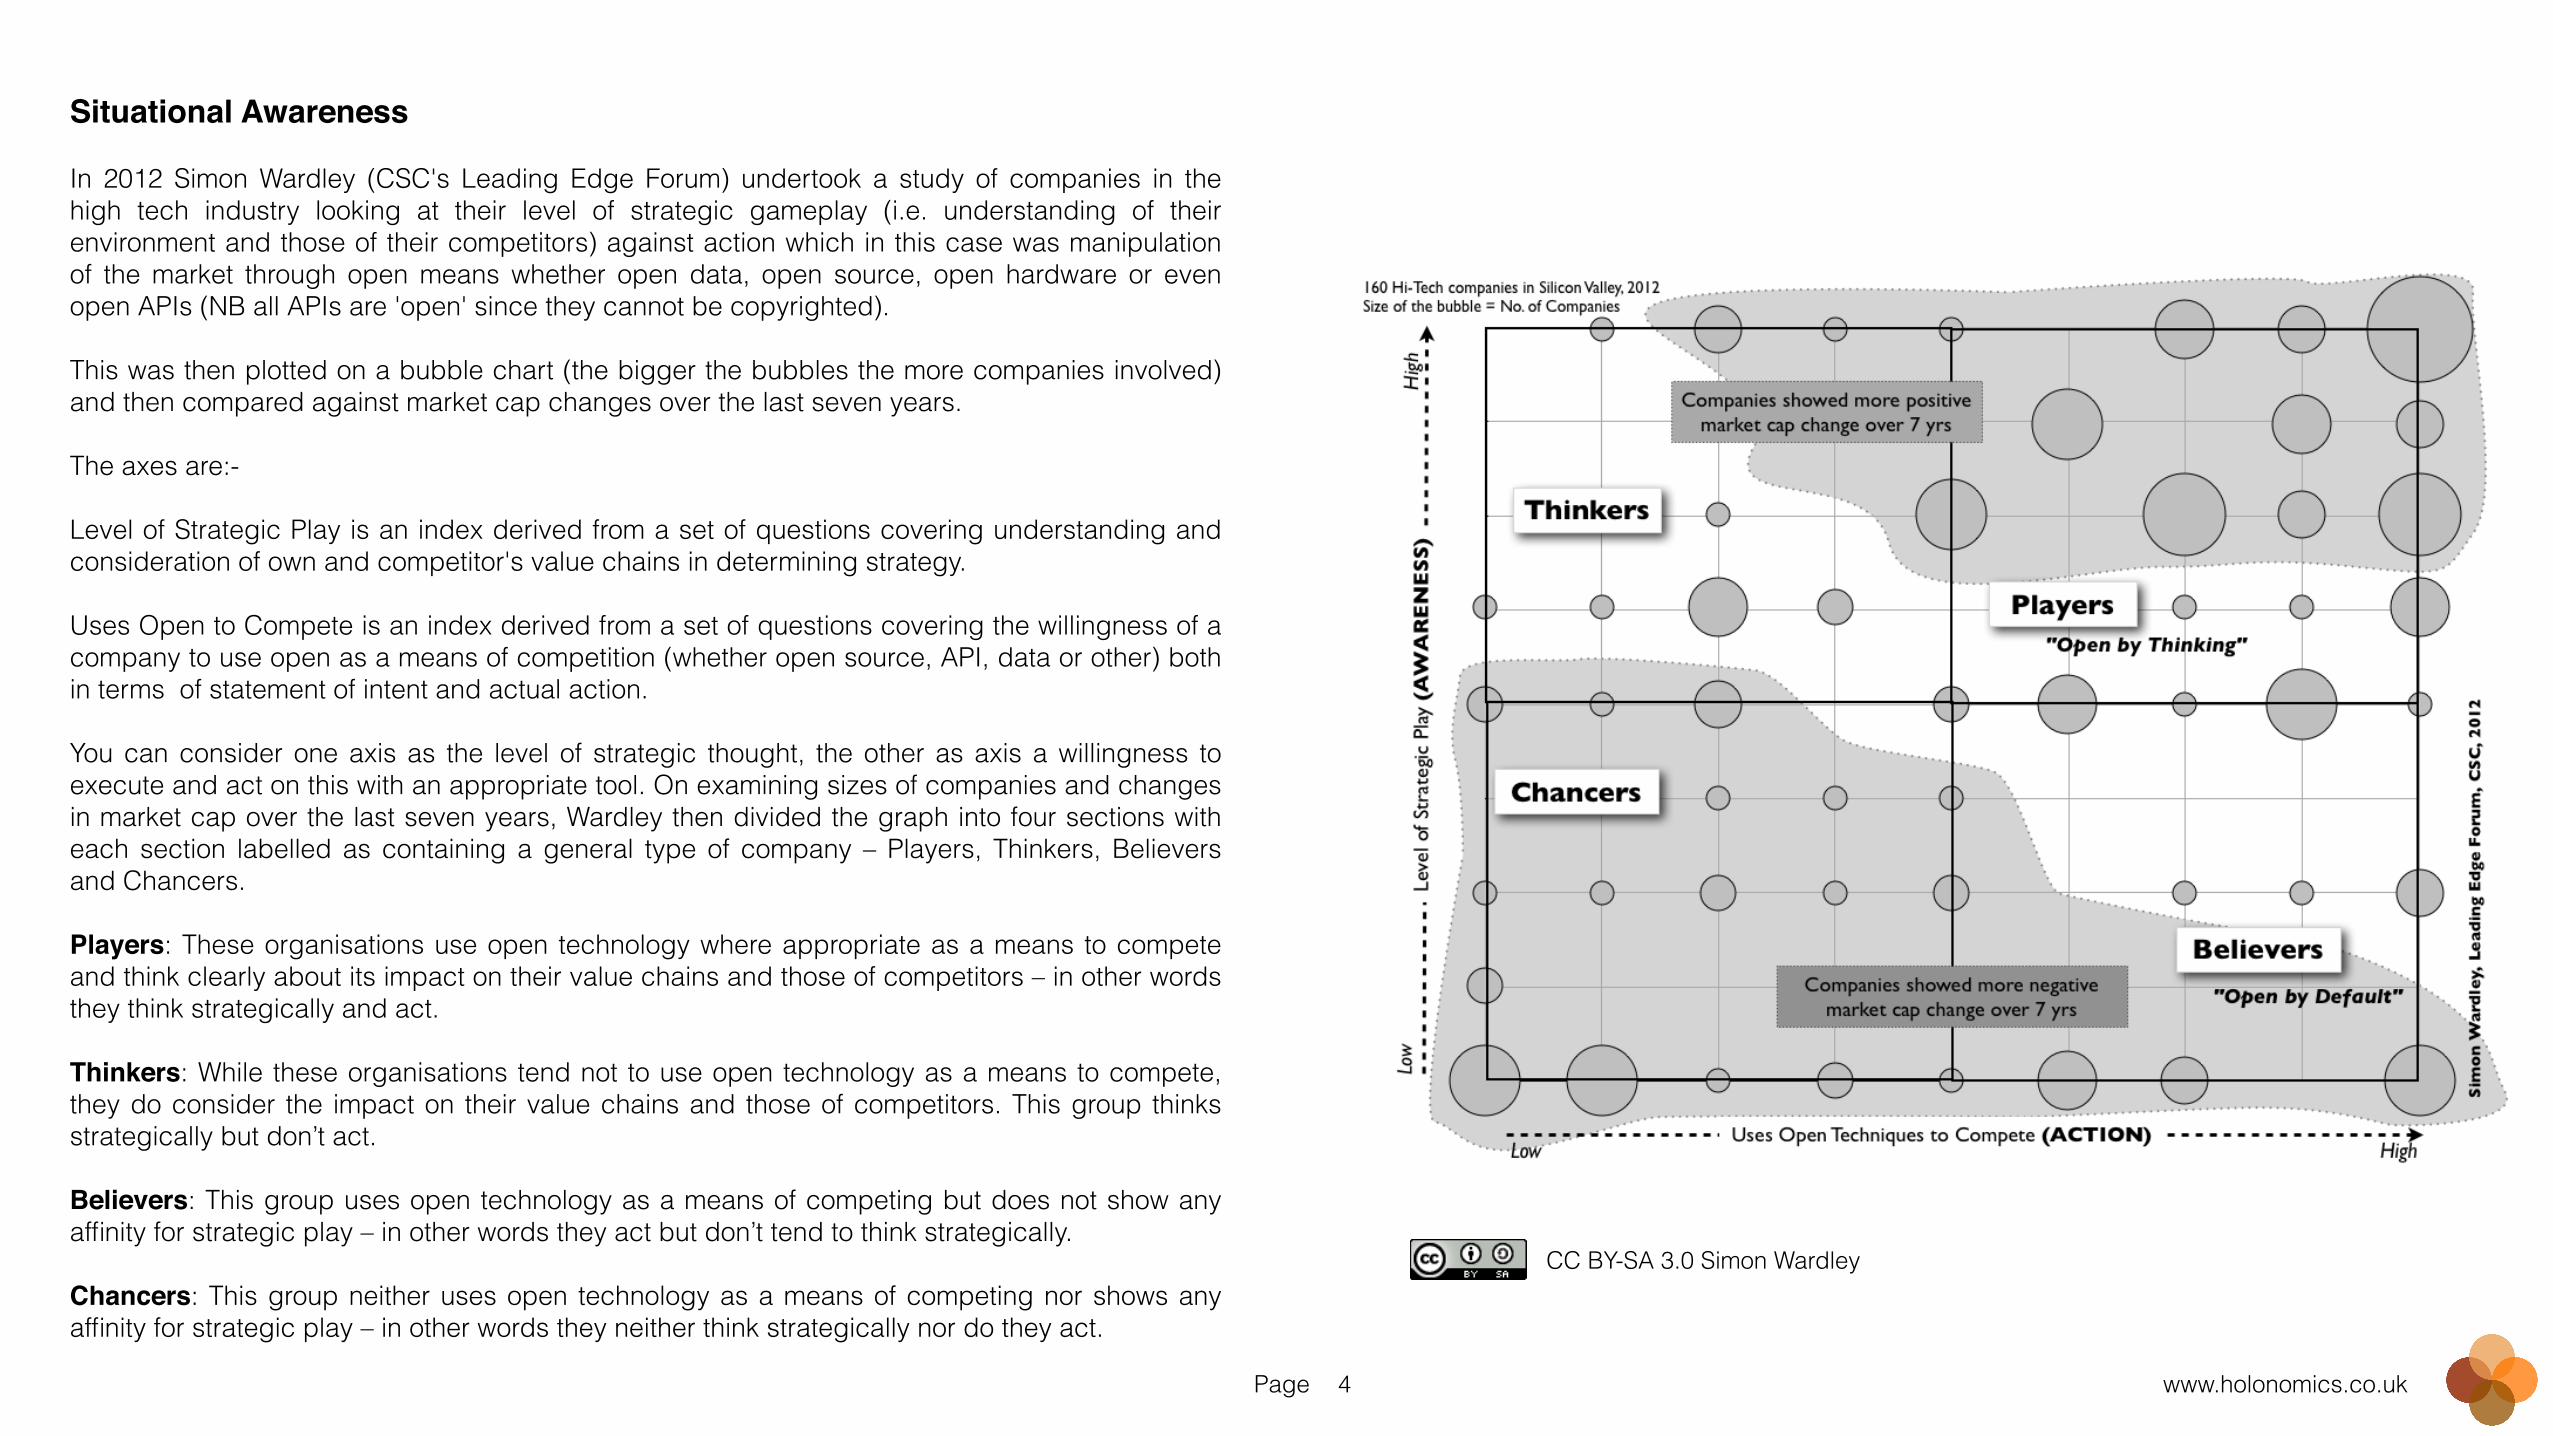
Situational Awareness!!In 2012 Simon Wardley (CSC's Leading Edge Forum) undertook a study of companies in the high tech industry looking at their level of strategic gameplay (i.e. understanding of their environment and those of their competitors) against action which in this case was manipulation of the market through open means whether open data, open source, open hardware or even open APIs (NB all APIs are 'open' since they cannot be copyrighted). !This was then plotted on a bubble chart (the bigger the bubbles the more companies involved) and then compared against market cap changes over the last seven years. !The axes are:- !Level of Strategic Play is an index derived from a set of questions covering understanding and consideration of own and competitor's value chains in determining strategy. !Uses Open to Compete is an index derived from a set of questions covering the willingness of a company to use open as a means of competition (whether open source, API, data or other) both in terms of statement of intent and actual action. !You can consider one axis as the level of strategic thought, the other as axis a willingness to execute and act on this with an appropriate tool. On examining sizes of companies and changes in market cap over the last seven years, Wardley then divided the graph into four sections with each section labelled as containing a general type of company – Players, Thinkers, Believers and Chancers. !Players: These organisations use open technology where appropriate as a means to compete and think clearly about its impact on their value chains and those of competitors – in other words they think strategically and act. !Thinkers: While these organisations tend not to use open technology as a means to compete, they do consider the impact on their value chains and those of competitors. This group thinks strategically but don’t act. !Believers: This group uses open technology as a means of competing but does not show any affinity for strategic play – in other words they act but don’t tend to think strategically. !Chancers: This group neither uses open technology as a means of competing nor shows any affinity for strategic play – in other words they neither think strategically nor do they act.
CC BY-SA 3.0 Simon Wardley
Page www.holonomics.co.uk5
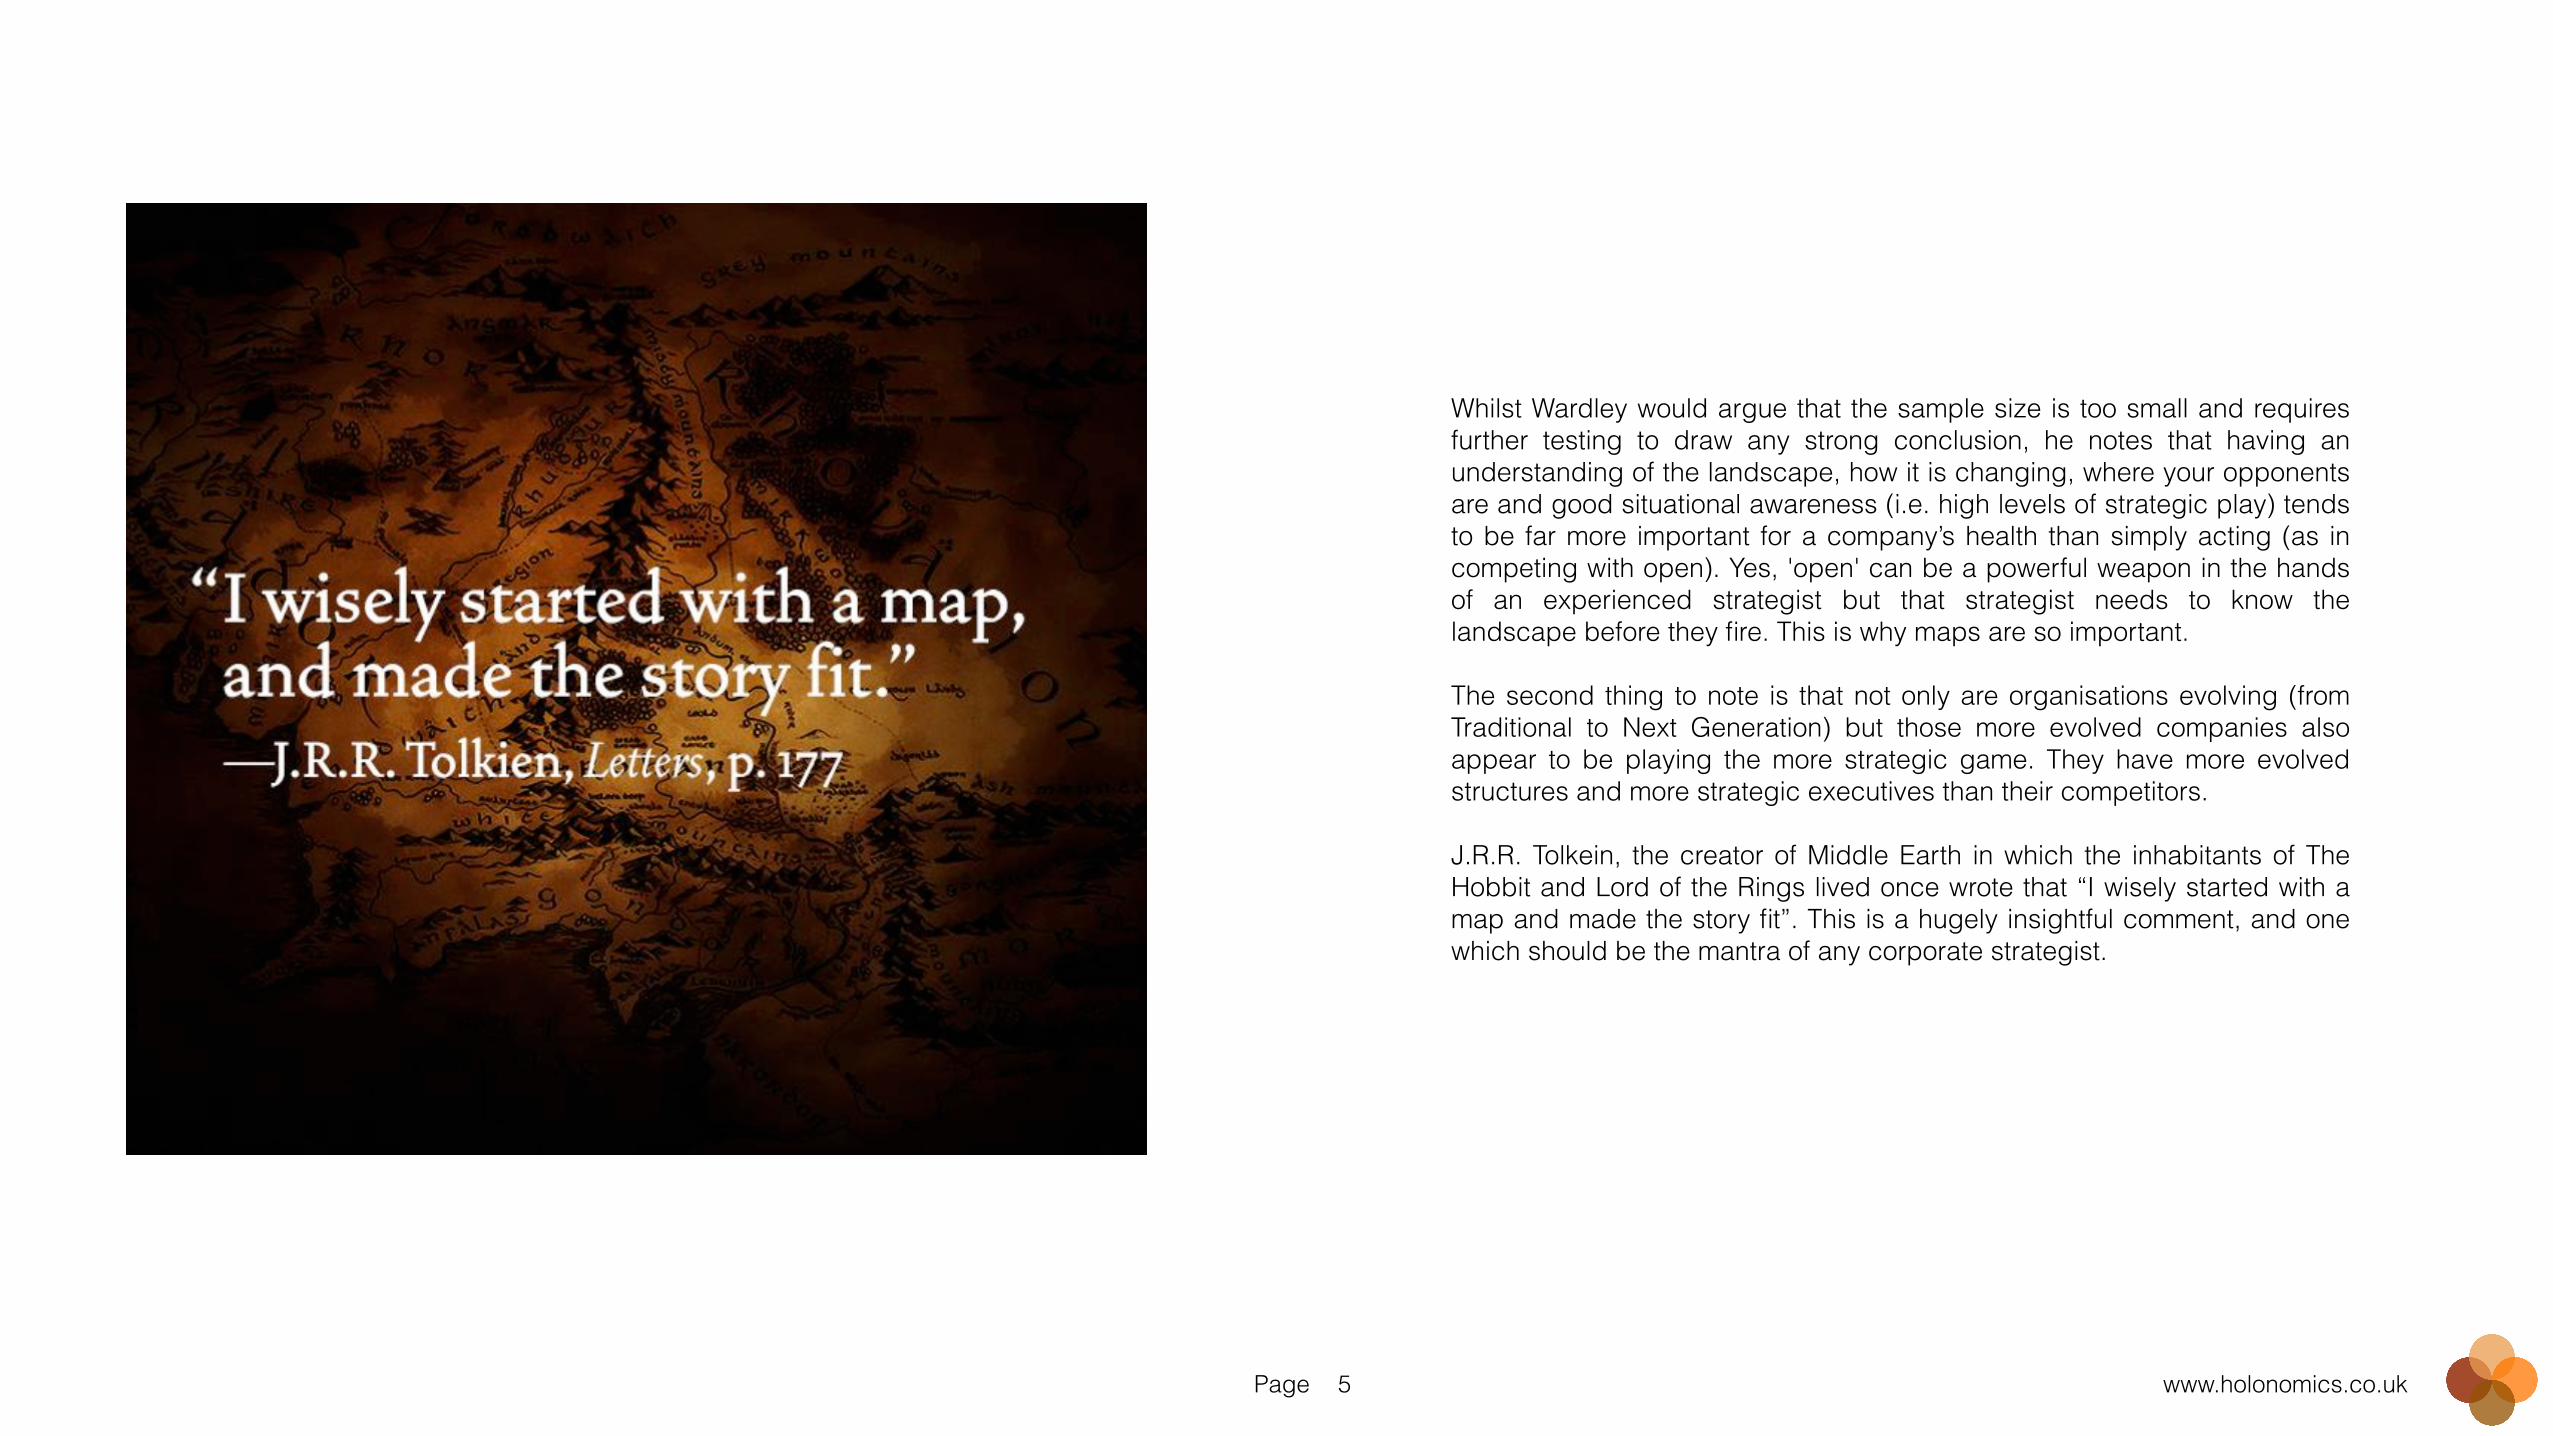
Whilst Wardley would argue that the sample size is too small and requires further testing to draw any strong conclusion, he notes that having an understanding of the landscape, how it is changing, where your opponents are and good situational awareness (i.e. high levels of strategic play) tends to be far more important for a company’s health than simply acting (as in competing with open). Yes, 'open' can be a powerful weapon in the hands of an experienced strategist but that strategist needs to know the landscape before they fire. This is why maps are so important. !The second thing to note is that not only are organisations evolving (from Traditional to Next Generation) but those more evolved companies also appear to be playing the more strategic game. They have more evolved structures and more strategic executives than their competitors. !J.R.R. Tolkein, the creator of Middle Earth in which the inhabitants of The Hobbit and Lord of the Rings lived once wrote that “I wisely started with a map and made the story fit”. This is a hugely insightful comment, and one which should be the mantra of any corporate strategist.
Page www.holonomics.co.uk6
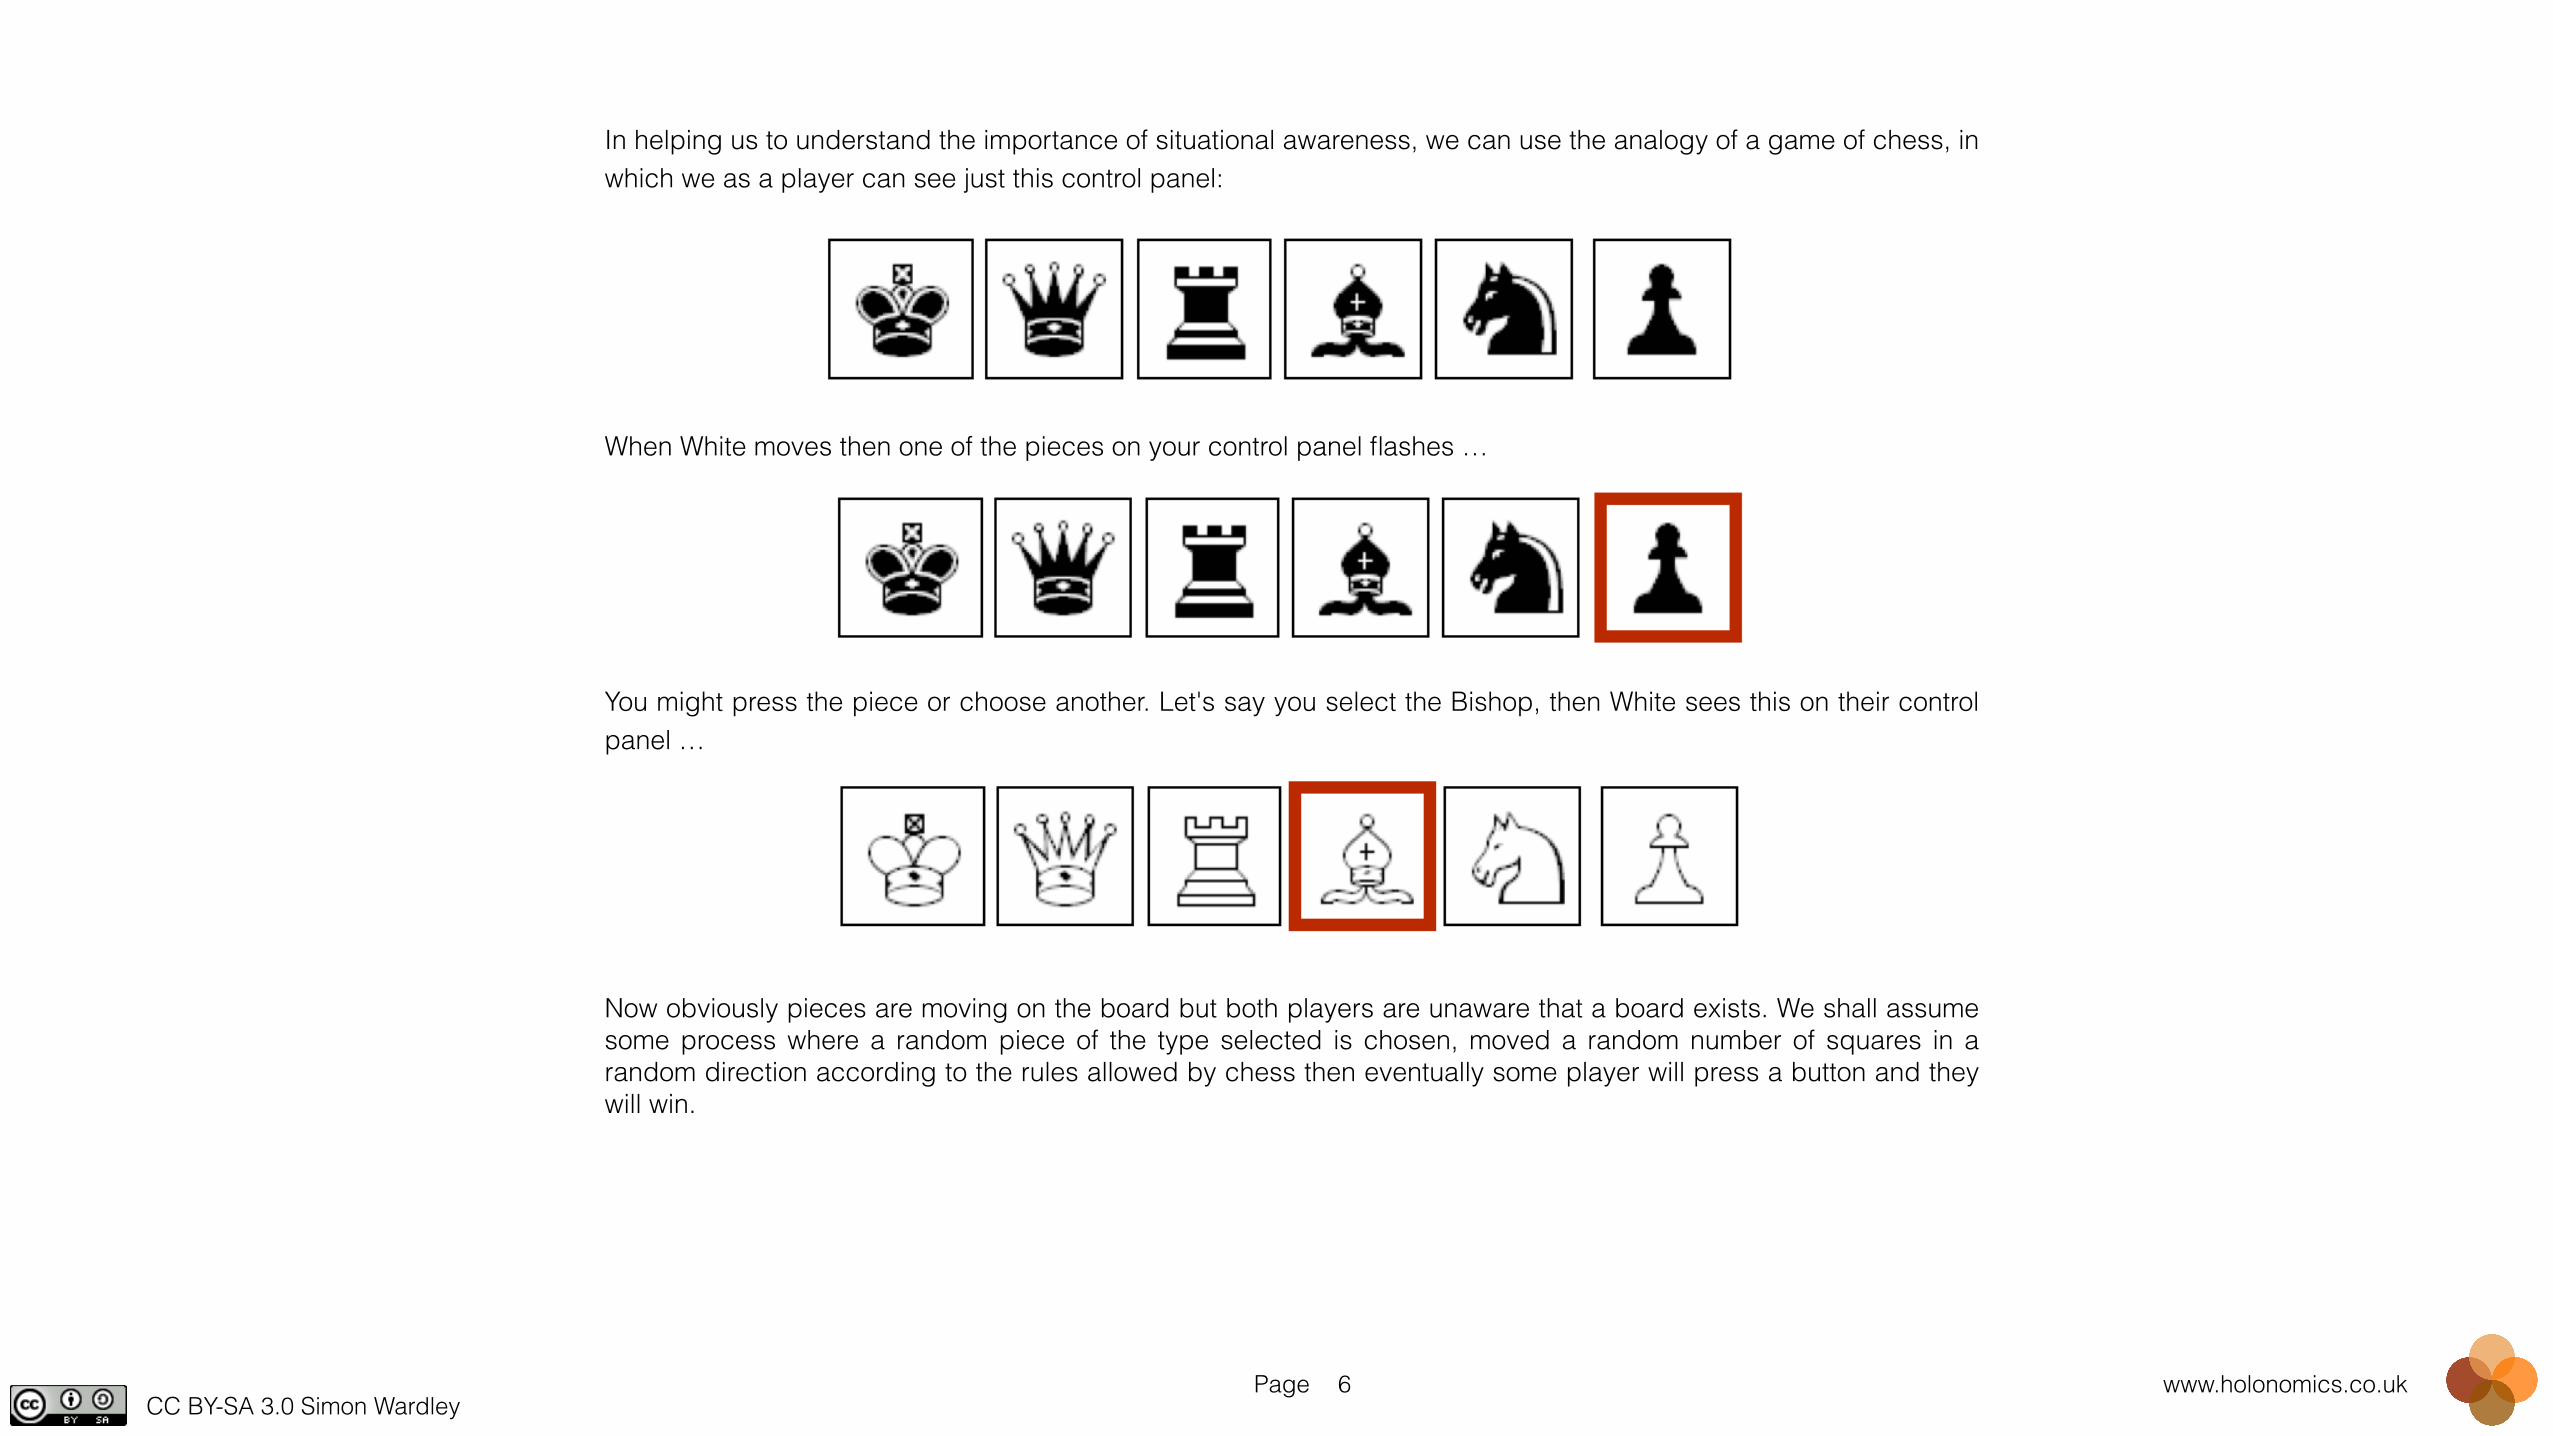
In helping us to understand the importance of situational awareness, we can use the analogy of a game of chess, in which we as a player can see just this control panel: !!!!!!When White moves then one of the pieces on your control panel flashes … !!!!!!!You might press the piece or choose another. Let's say you select the Bishop, then White sees this on their control panel … !!!!!!Now obviously pieces are moving on the board but both players are unaware that a board exists. We shall assume some process where a random piece of the type selected is chosen, moved a random number of squares in a random direction according to the rules allowed by chess then eventually some player will press a button and they will win. !!
CC BY-SA 3.0 Simon Wardley
Page www.holonomics.co.uk7
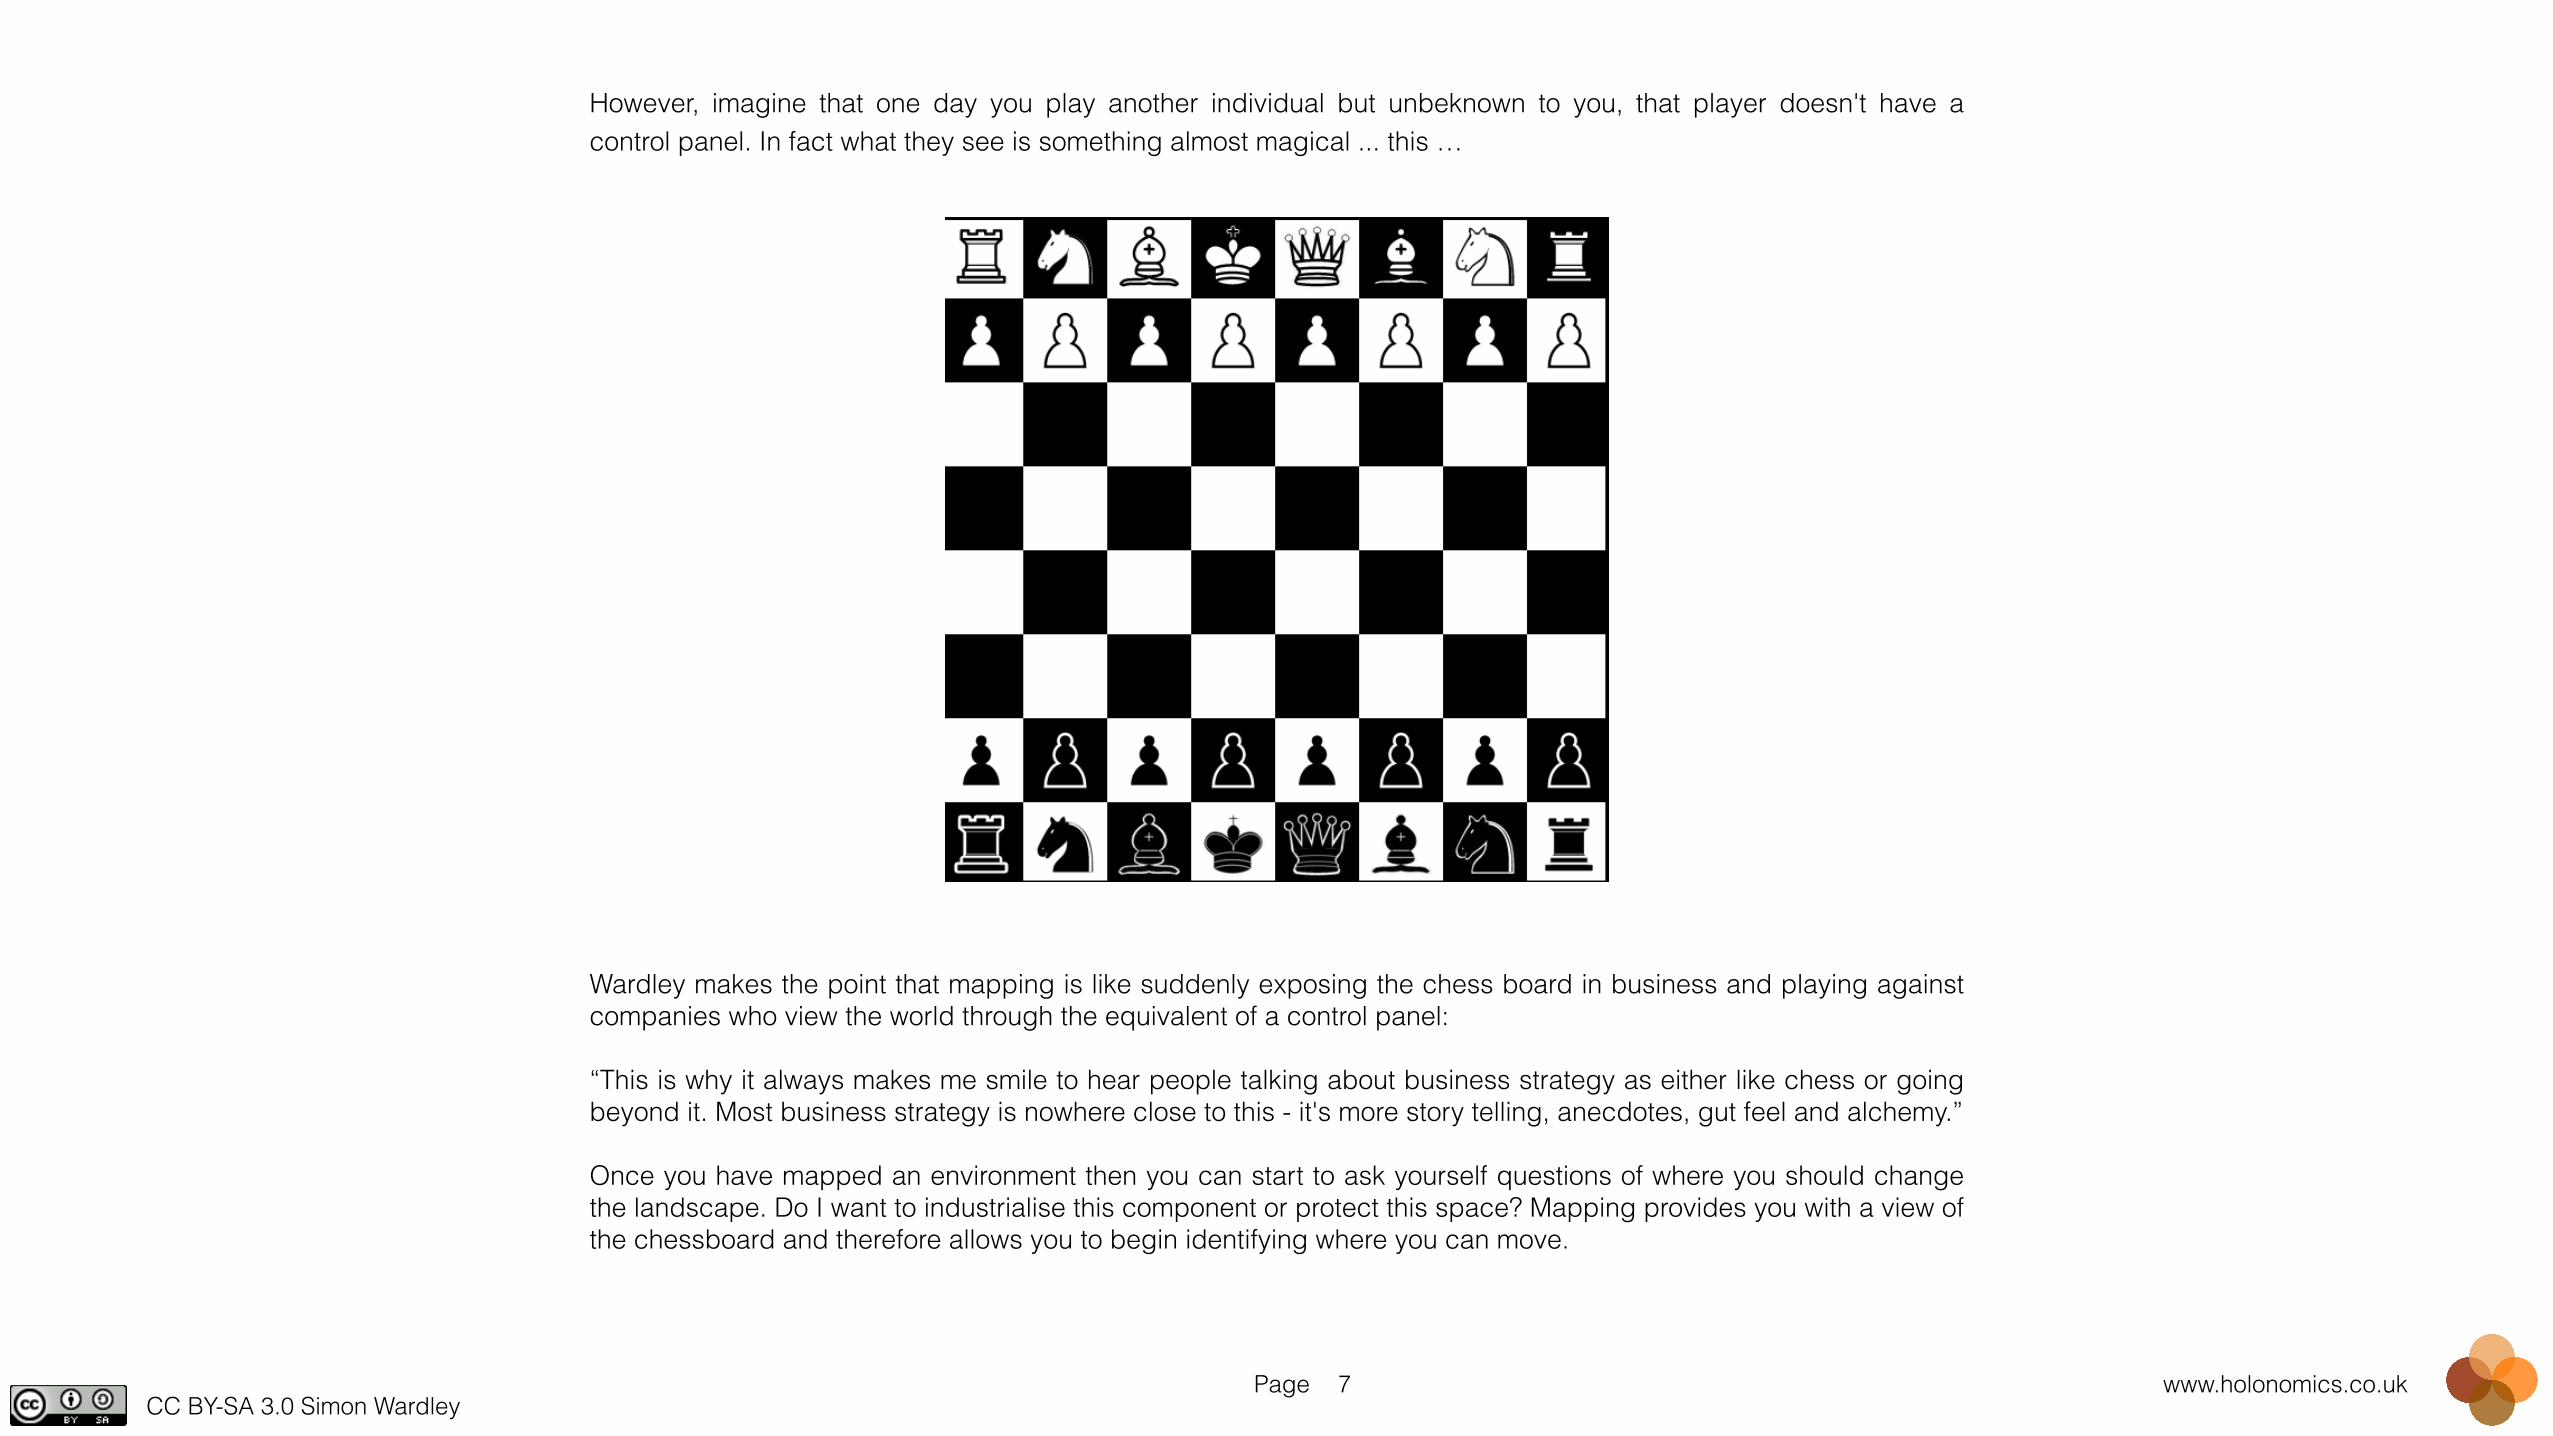
However, imagine that one day you play another individual but unbeknown to you, that player doesn't have a control panel. In fact what they see is something almost magical ... this … !!!!!!!!!!!!!!!!!!!!!Wardley makes the point that mapping is like suddenly exposing the chess board in business and playing against companies who view the world through the equivalent of a control panel: !“This is why it always makes me smile to hear people talking about business strategy as either like chess or going beyond it. Most business strategy is nowhere close to this - it's more story telling, anecdotes, gut feel and alchemy.” !Once you have mapped an environment then you can start to ask yourself questions of where you should change the landscape. Do I want to industrialise this component or protect this space? Mapping provides you with a view of the chessboard and therefore allows you to begin identifying where you can move.
CC BY-SA 3.0 Simon Wardley
Page www.holonomics.co.uk8
Why Map?!!When we ask the question “Does an organisation believe it has an effective Business and IT strategy?” most large organisations will reply that they do in fact have strategy documents. The problem is that these documents will often have purchasing details, implementation details, operational details and tactical choices, for example developing a new IT infrastructure. These are How? What? and When? questions. !The why question, why we do something is often vague, small and we discover that organisations’ strategies are simply copying the strategies of others. For example if a company observes that 67% of successful companies use big data social media clouds in their social strategies, that will lead them to believing that they should as well. !Maps are simply a representation of a particular problem but the act of making a map has some profoundly useful effects: !It encourages you to think about user needs. The map starts from the visible user needs and moves through the components necessary to make that need happen. !It encourages you to think about components. Rather than treating a system as one thing, mapping encourages you to break down complex systems into components and understand that a complex system is in fact many things. !It encourages you to think about change. Evolution is not static, the components evolve due to competition. Mapping teaches you that how you treat something today is not the same as tomorrow. !It encourages you to communicate. One huge advantage of a map is that other people can read it and obviously compare to other systems. Having maps is extremely useful in identifying common components between systems, to avoiding duplication and for sharing plans and strategic direction. !!
It encourages you to challenge. If you can read a map then you challenge the assumptions made especially by comparing a map to the outside world. Is CRM really at the stage of custom built or are we custom building what is in fact common and ubiquitous and suitable for commodity provision? !It encourages gameplay. Once you have a map, you can ask questions about how to change it e.g. using open approaches to drive to an activity, practice or data. !It encourages you to plan. Once you have a map, you can test various scenarios and examine the probability of effectiveness of one scenario over another. !It encourages you to learn. With a map, you examine the effect of a given play before and after. This helps in learning what plays work, how economic forces change the landscape and how force multipliers (e.g. ecosystems) can be used. !It helps you to compete. Mapping can equally be applied to competitors to discover points of weakness, inertia to change and tactical plays. !It helps you to find opportunity. Understanding that the uncharted space is all about differentials and the industrialised is all about operational efficiency enables you to identify potential areas for improvement and how to exploit it. !
Page www.holonomics.co.uk9
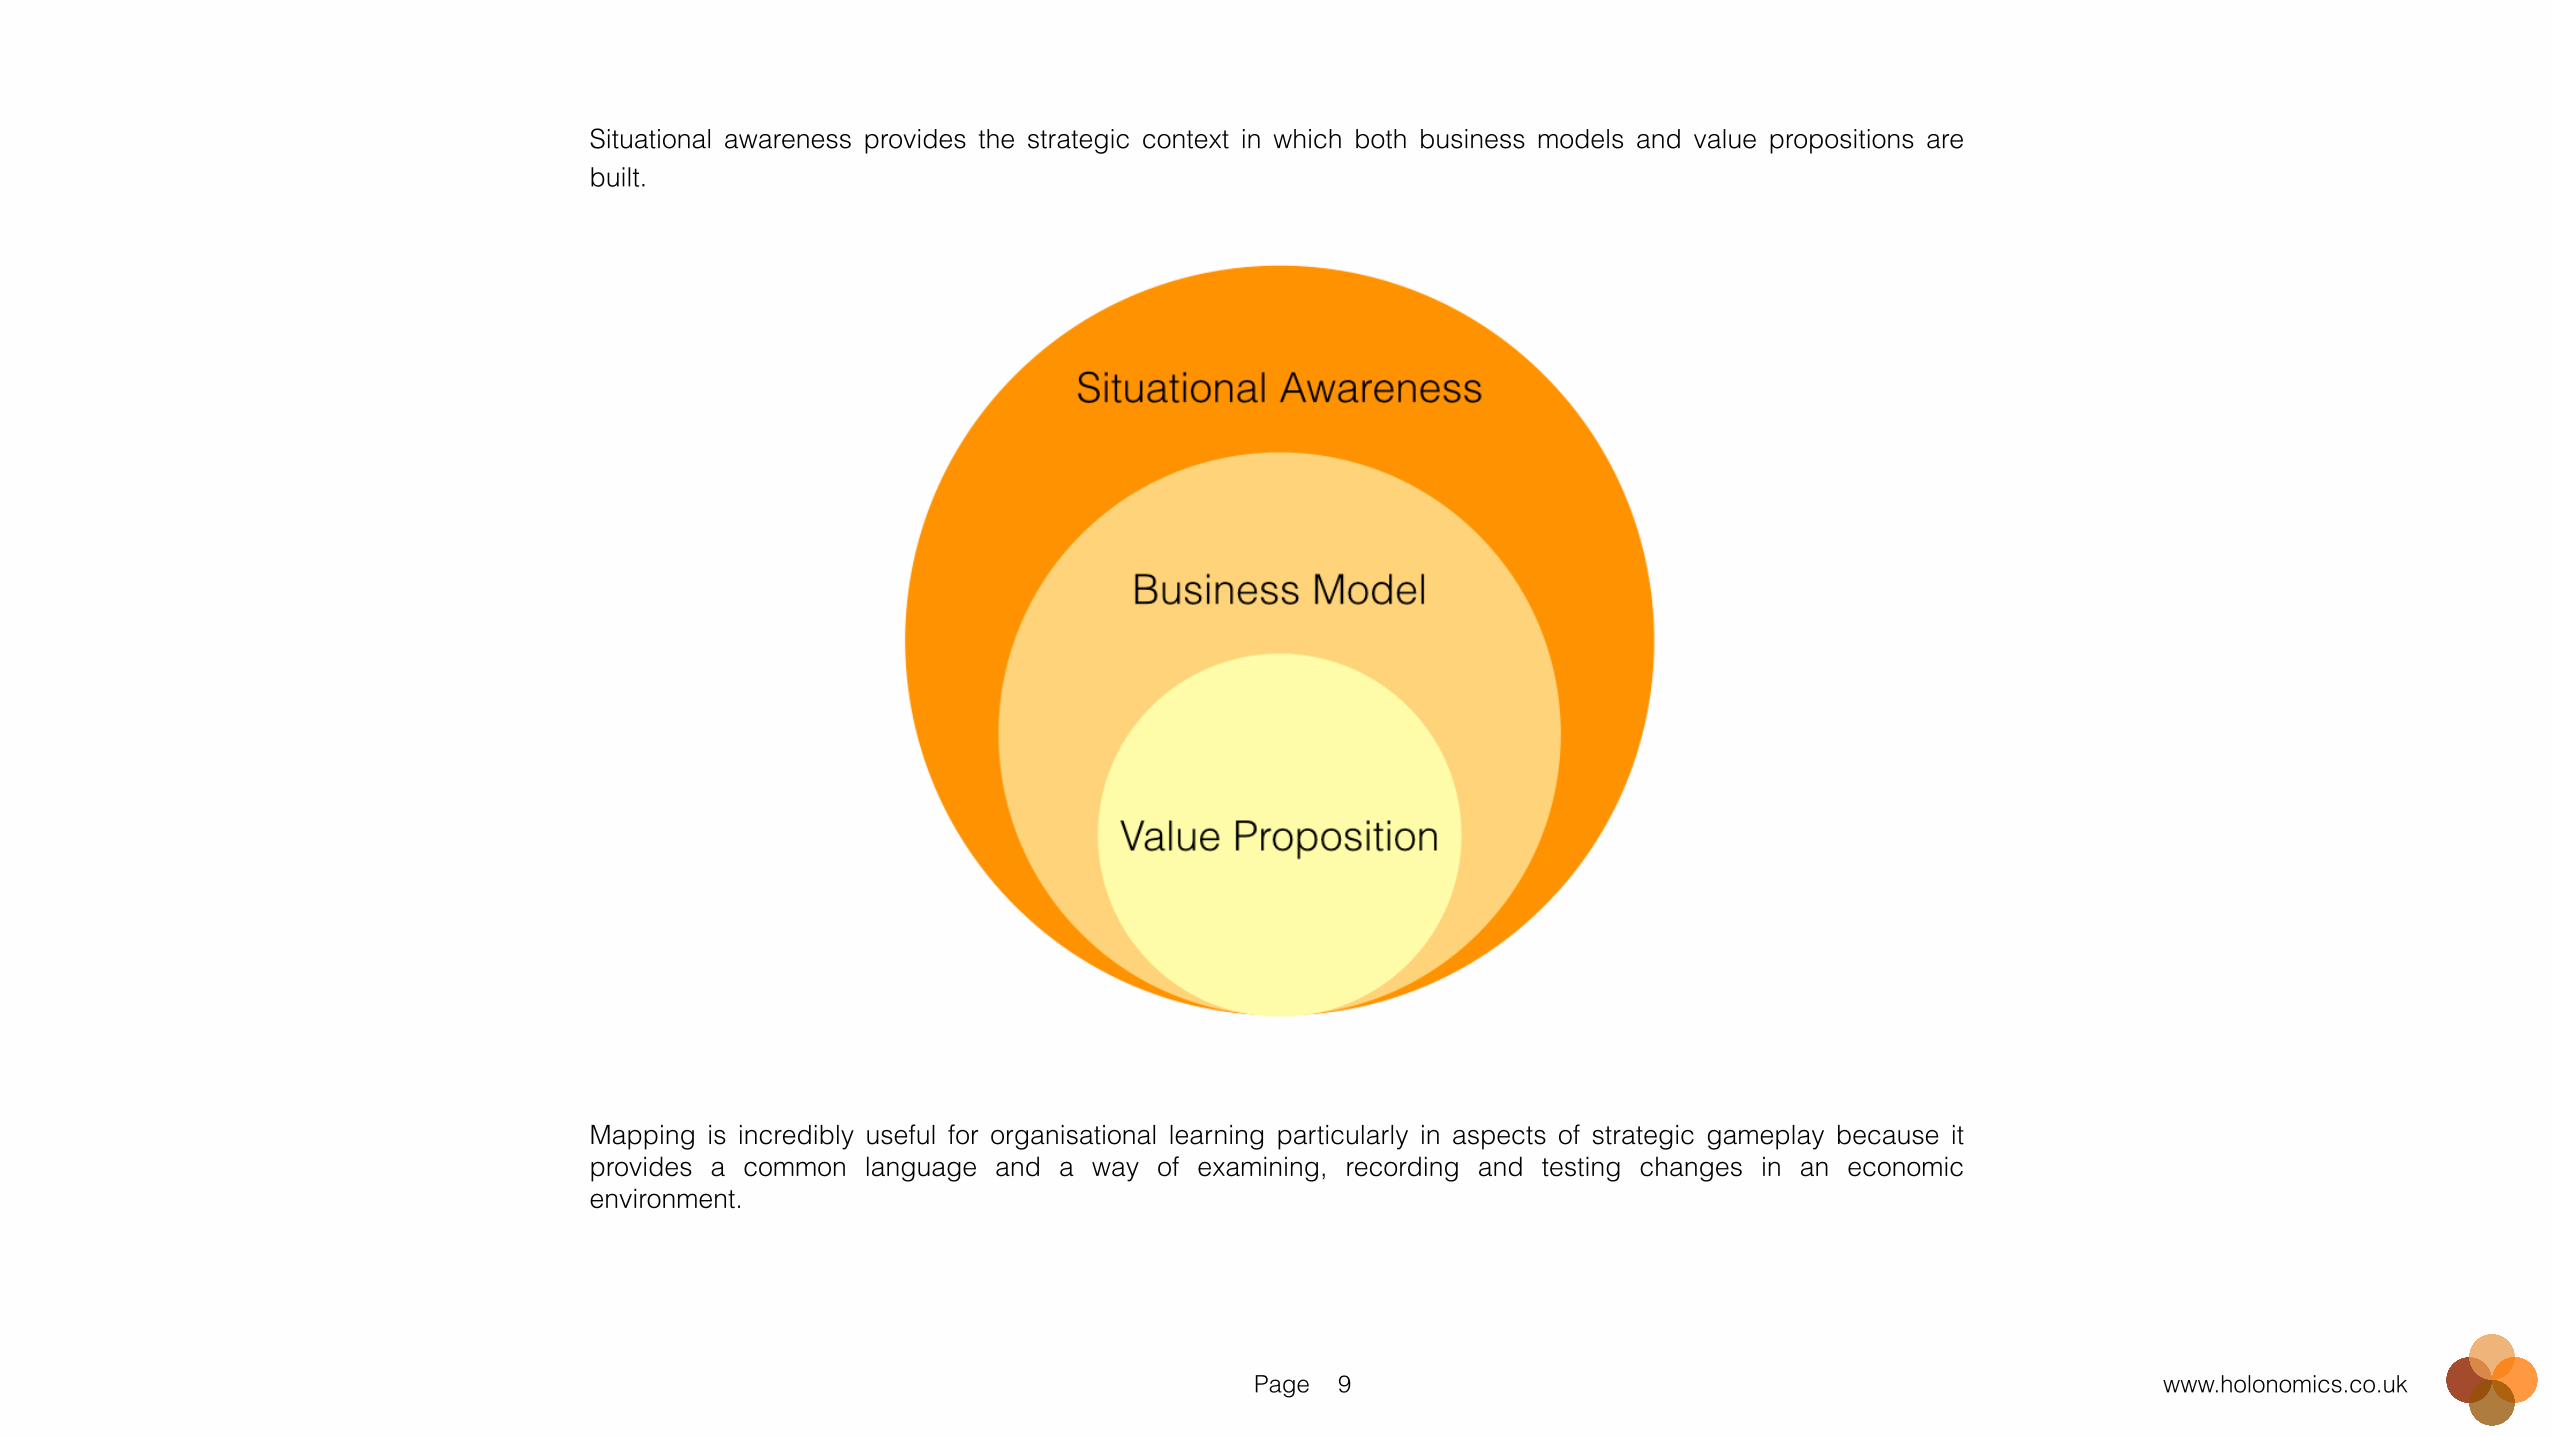
Situational awareness provides the strategic context in which both business models and value propositions are built. !!!!!!!!!!!!!!!!!!!!!!!!Mapping is incredibly useful for organisational learning particularly in aspects of strategic gameplay because it provides a common language and a way of examining, recording and testing changes in an economic environment.
Page www.holonomics.co.uk10
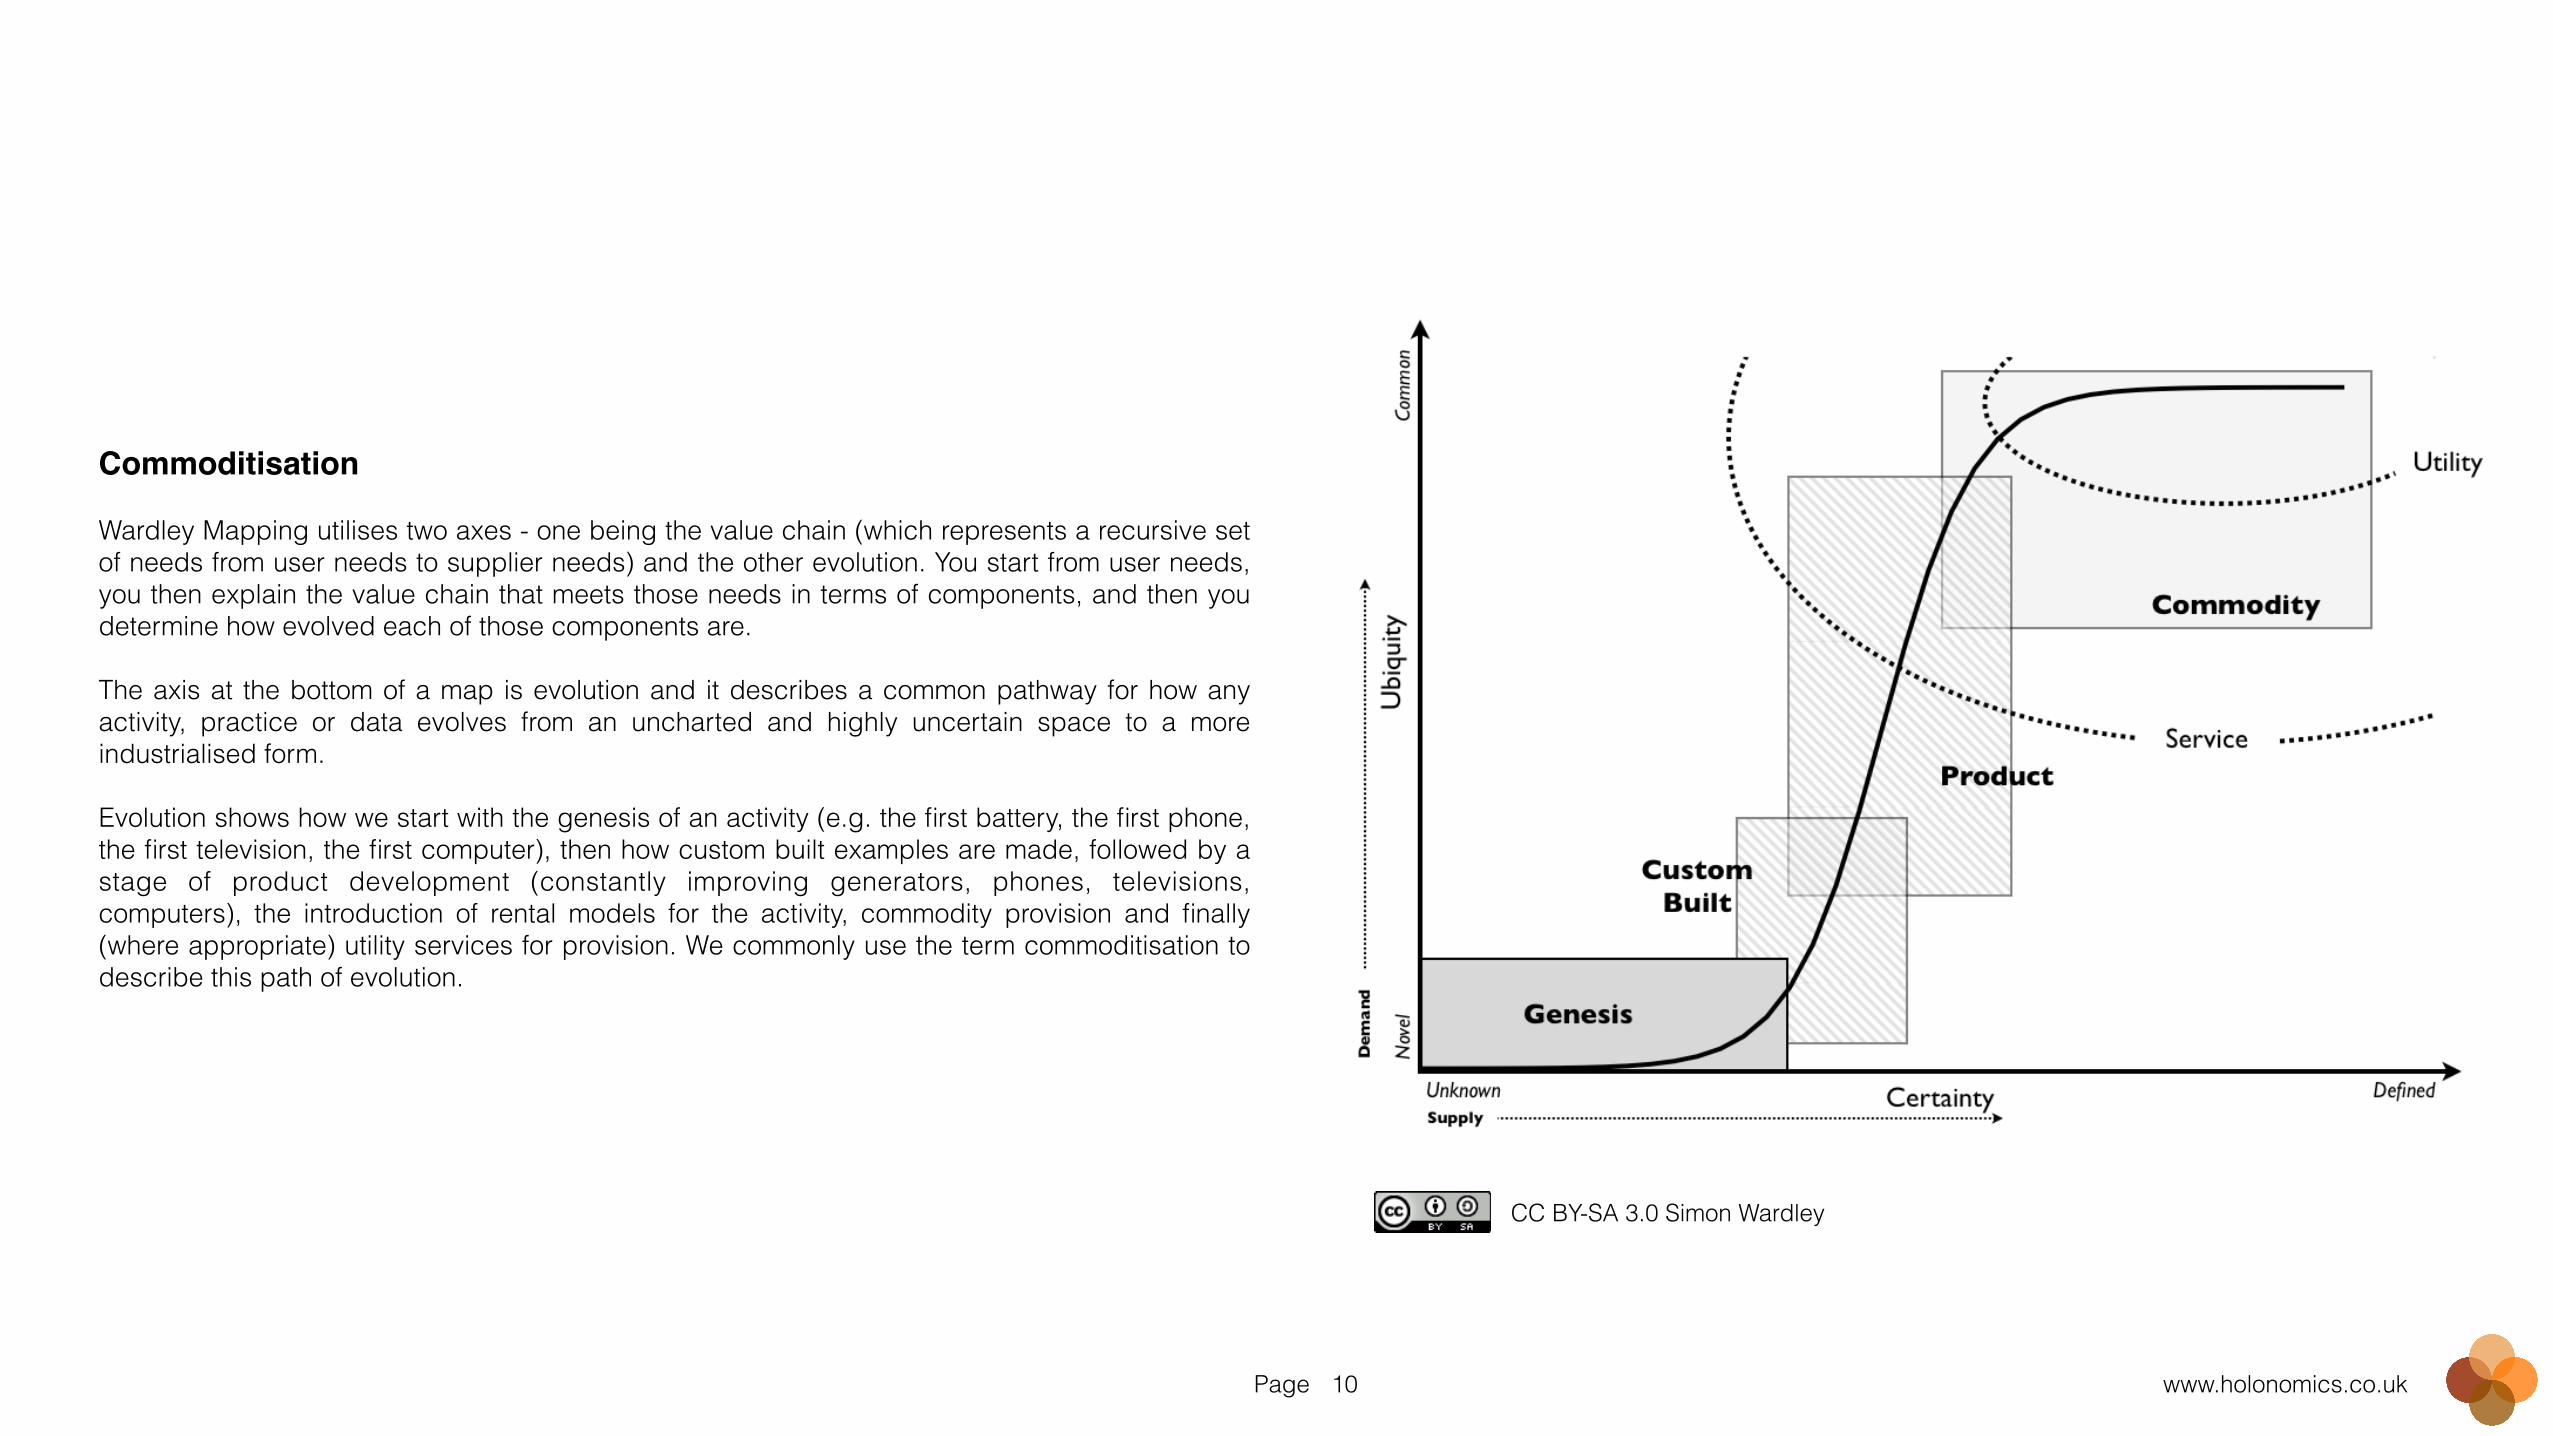
Commoditisation!!Wardley Mapping utilises two axes - one being the value chain (which represents a recursive set of needs from user needs to supplier needs) and the other evolution. You start from user needs, you then explain the value chain that meets those needs in terms of components, and then you determine how evolved each of those components are. !The axis at the bottom of a map is evolution and it describes a common pathway for how any activity, practice or data evolves from an uncharted and highly uncertain space to a more industrialised form. !Evolution shows how we start with the genesis of an activity (e.g. the first battery, the first phone, the first television, the first computer), then how custom built examples are made, followed by a stage of product development (constantly improving generators, phones, televisions, computers), the introduction of rental models for the activity, commodity provision and finally (where appropriate) utility services for provision. We commonly use the term commoditisation to describe this path of evolution.
CC BY-SA 3.0 Simon Wardley
Page www.holonomics.co.uk11
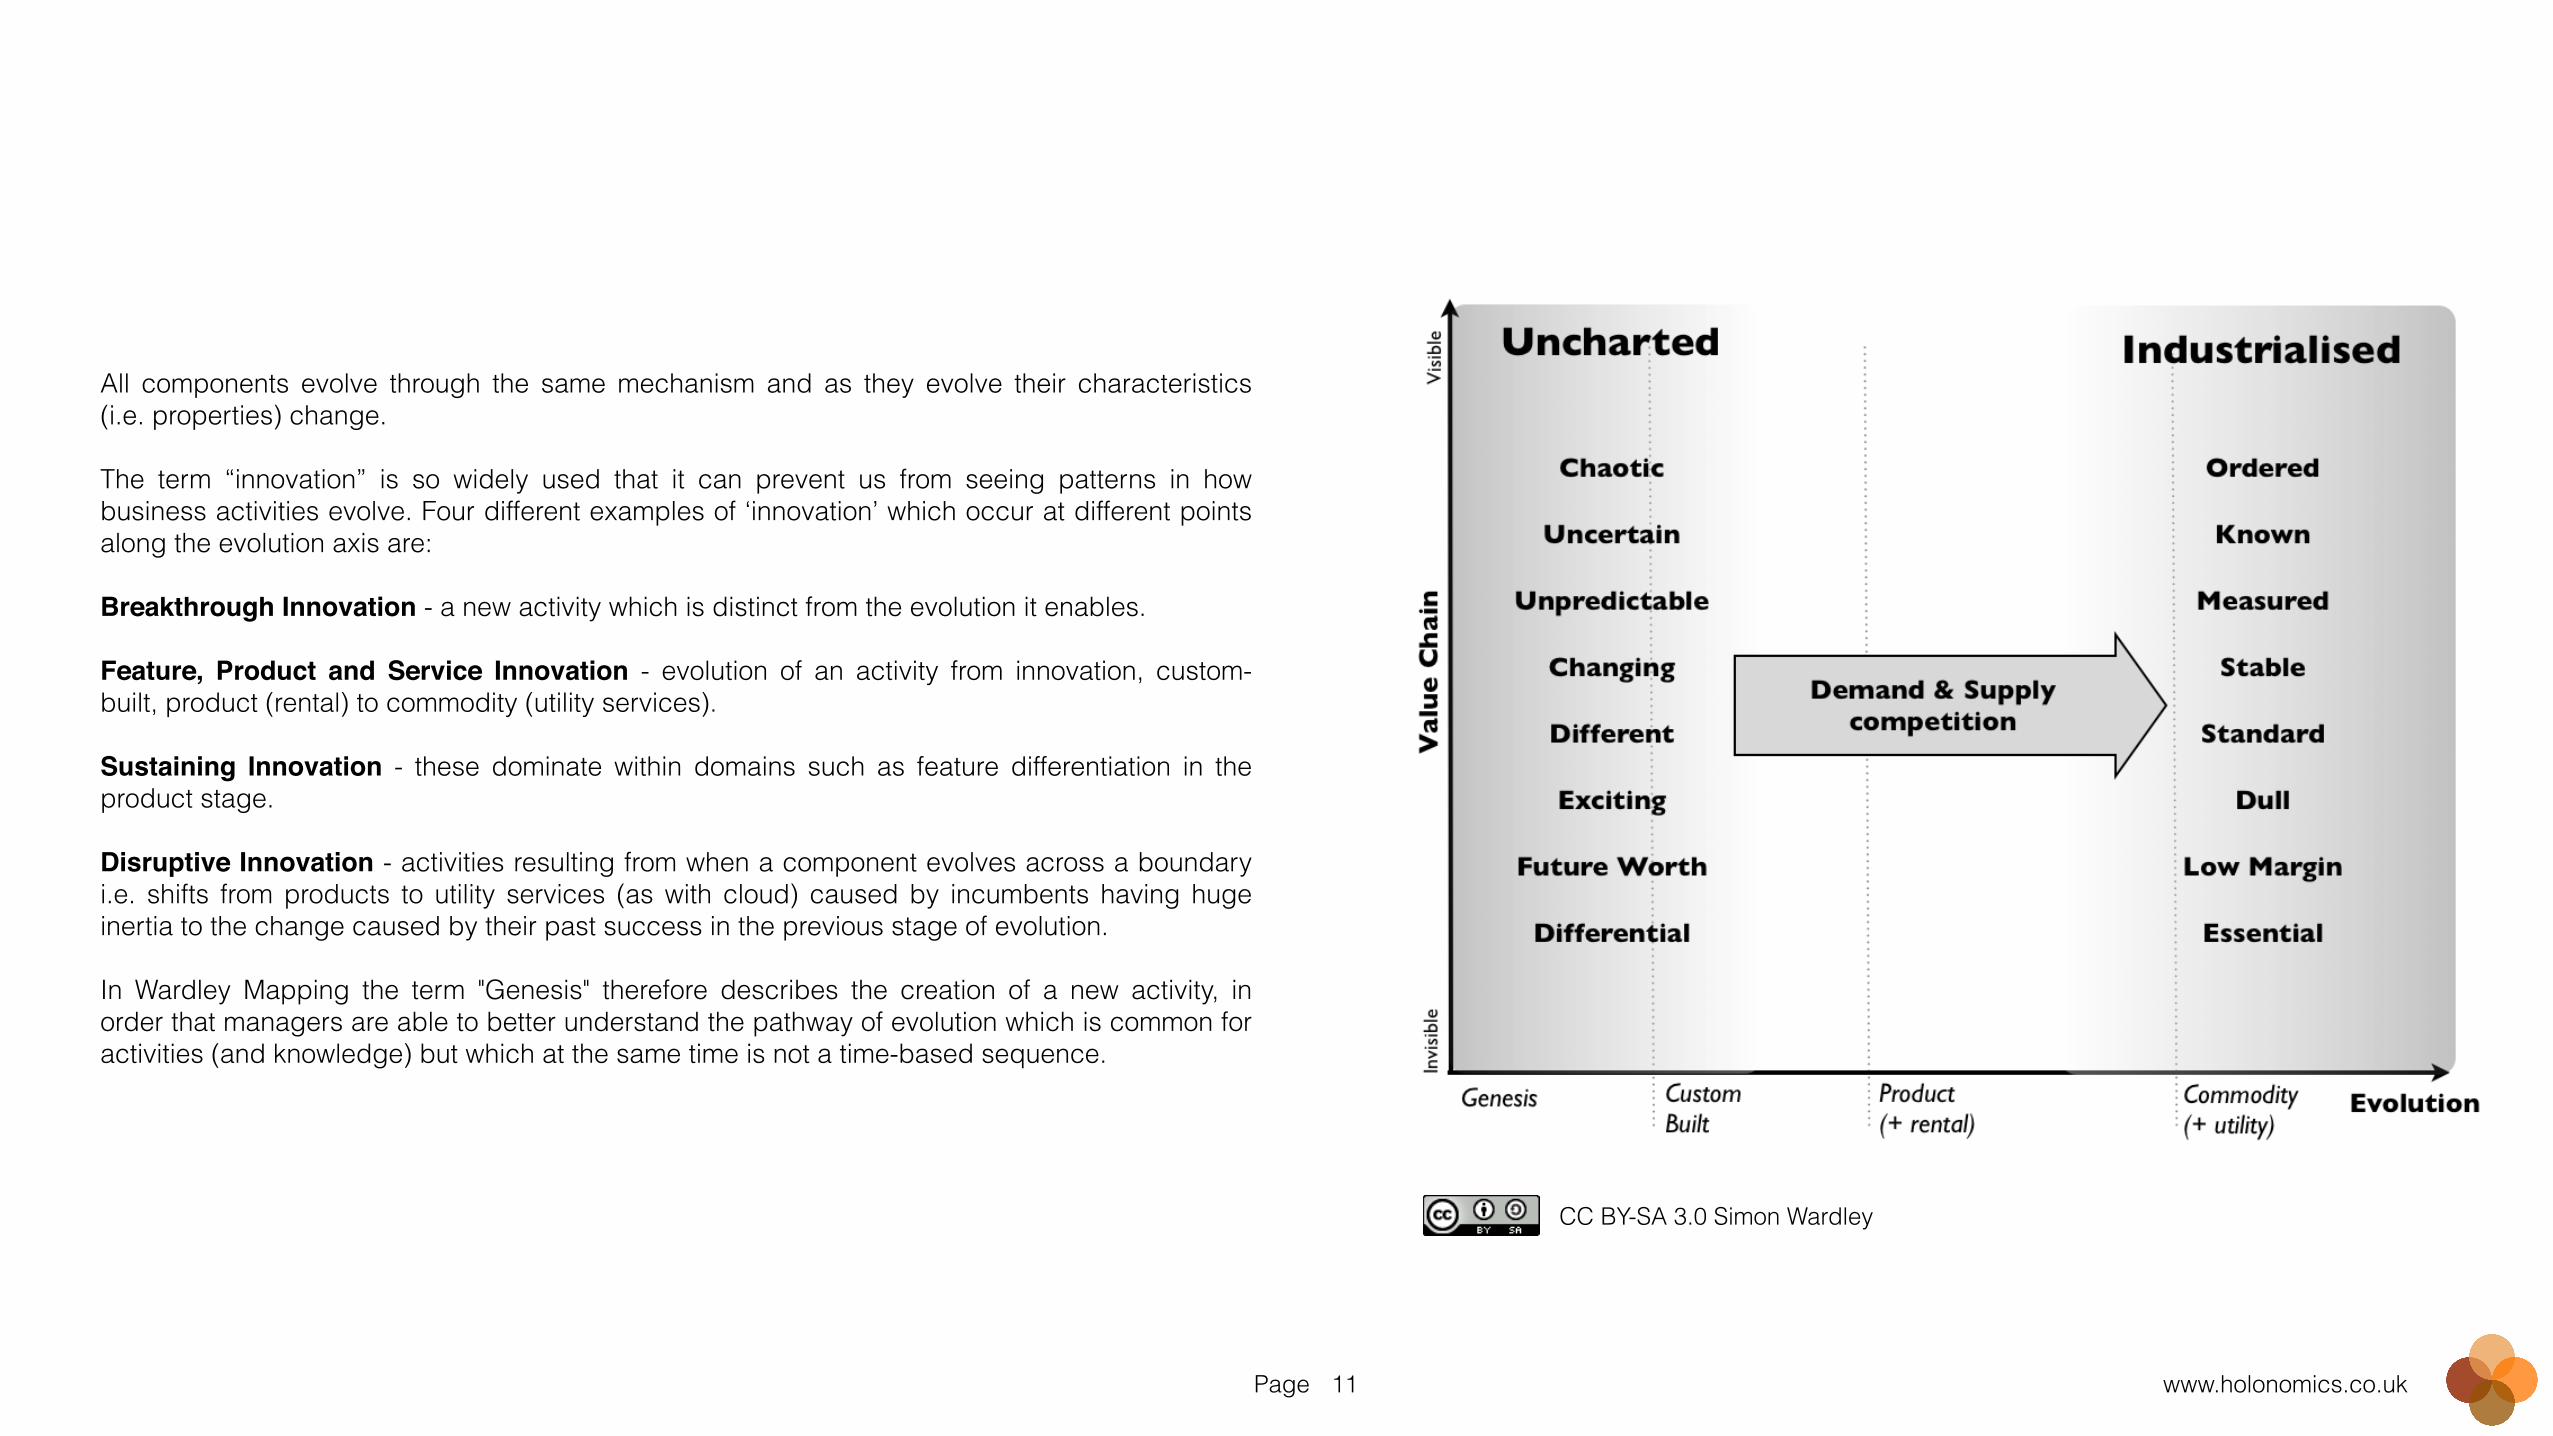
All components evolve through the same mechanism and as they evolve their characteristics (i.e. properties) change. !The term “innovation” is so widely used that it can prevent us from seeing patterns in how business activities evolve. Four different examples of ‘innovation’ which occur at different points along the evolution axis are: !Breakthrough Innovation - a new activity which is distinct from the evolution it enables. !Feature, Product and Service Innovation - evolution of an activity from innovation, custom-built, product (rental) to commodity (utility services). !Sustaining Innovation - these dominate within domains such as feature differentiation in the product stage. !Disruptive Innovation - activities resulting from when a component evolves across a boundary i.e. shifts from products to utility services (as with cloud) caused by incumbents having huge inertia to the change caused by their past success in the previous stage of evolution. !In Wardley Mapping the term "Genesis" therefore describes the creation of a new activity, in order that managers are able to better understand the pathway of evolution which is common for activities (and knowledge) but which at the same time is not a time-based sequence.
CC BY-SA 3.0 Simon Wardley

Page www.holonomics.co.uk12
How To Build A Wardley Map!!"We found mapping useless because it caused arguments over strategy. Then we realised why we could argue. Thank you.” !The quote above comes from a team who first began to map their strategy using Wardley Mapping. Initially there could well be arguments over exactly where a component lies on the evolutionary scale, or how exactly to structure the value chain. However, the initial value comes in the process of mapping, of developing joint understanding across disparate departments and business units, and in developing business-wide situational awareness. !Developing the first map probably requires between one and two days, and given their value and power, is an activity that can make a huge impact on the understanding, development and communication of the various value propositions that an organisation offers. !This following process shows the four main steps.
An example map…it can be quick and easy
CC BY-SA 3.0 Simon Wardley
Page www.holonomics.co.uk13
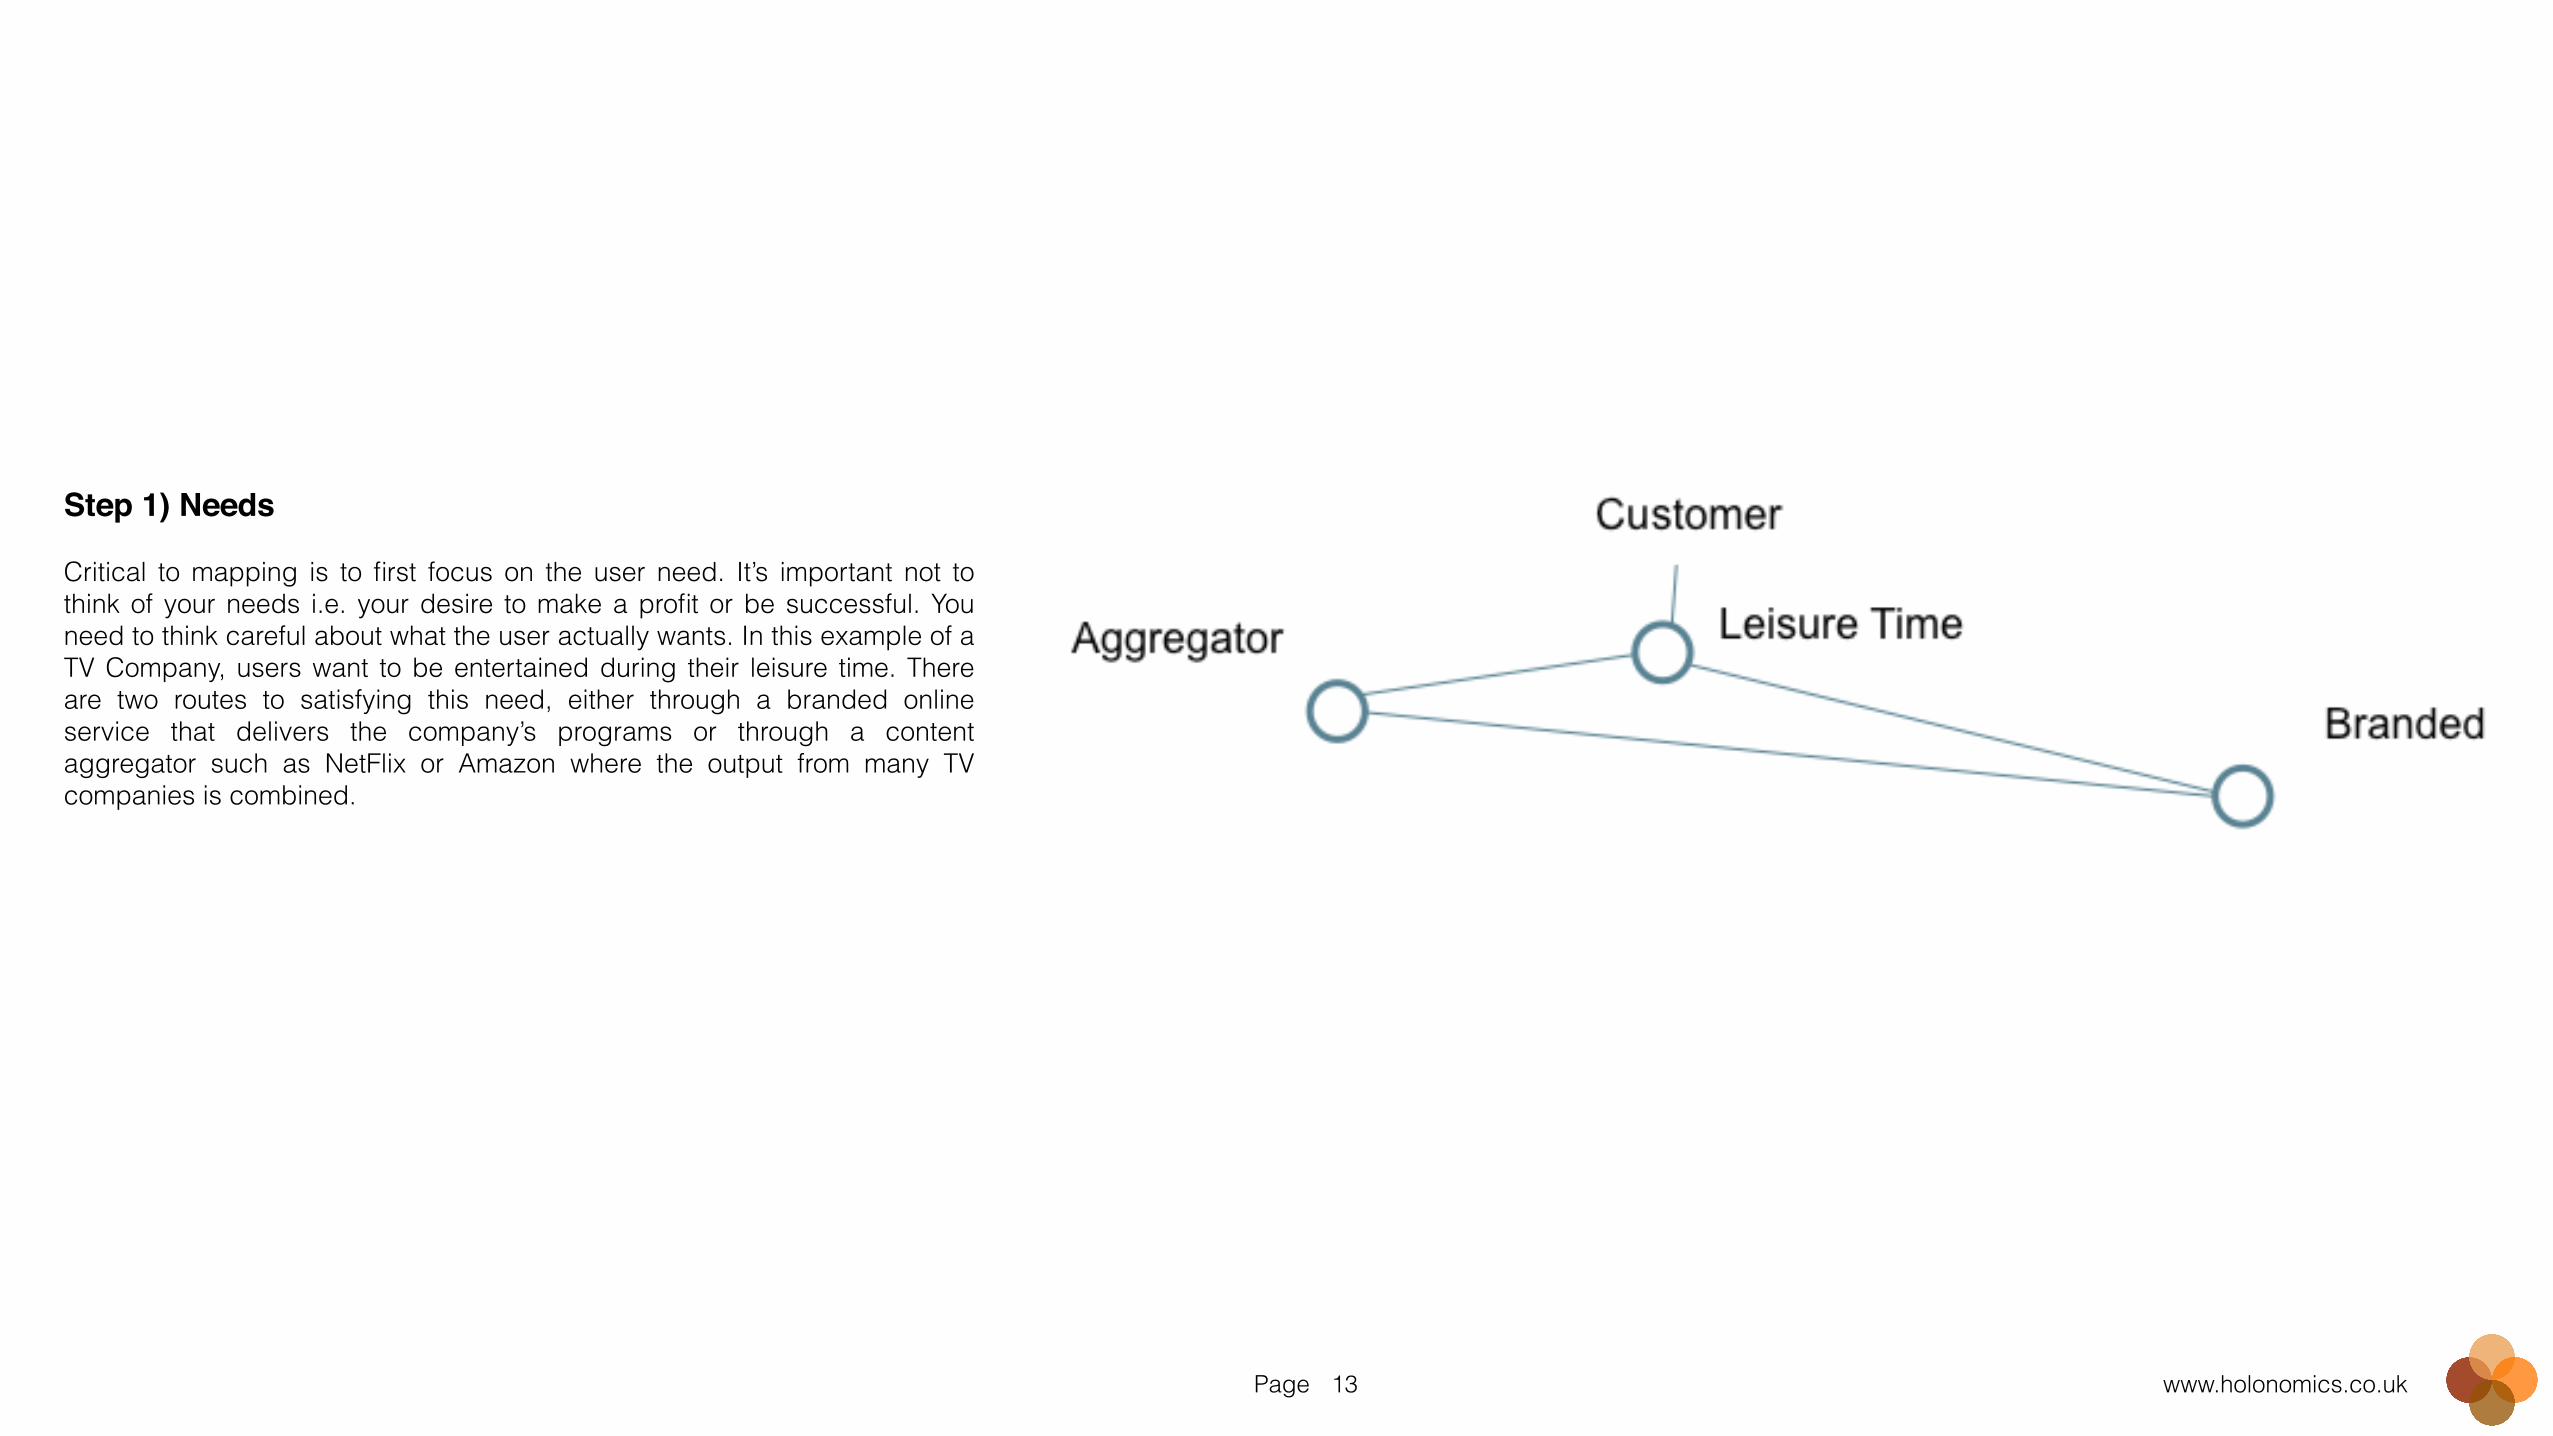
Step 1) Needs!!Critical to mapping is to first focus on the user need. It’s important not to think of your needs i.e. your desire to make a profit or be successful. You need to think careful about what the user actually wants. In this example of a TV Company, users want to be entertained during their leisure time. There are two routes to satisfying this need, either through a branded online service that delivers the company’s programs or through a content aggregator such as NetFlix or Amazon where the output from many TV companies is combined.
Page www.holonomics.co.uk14
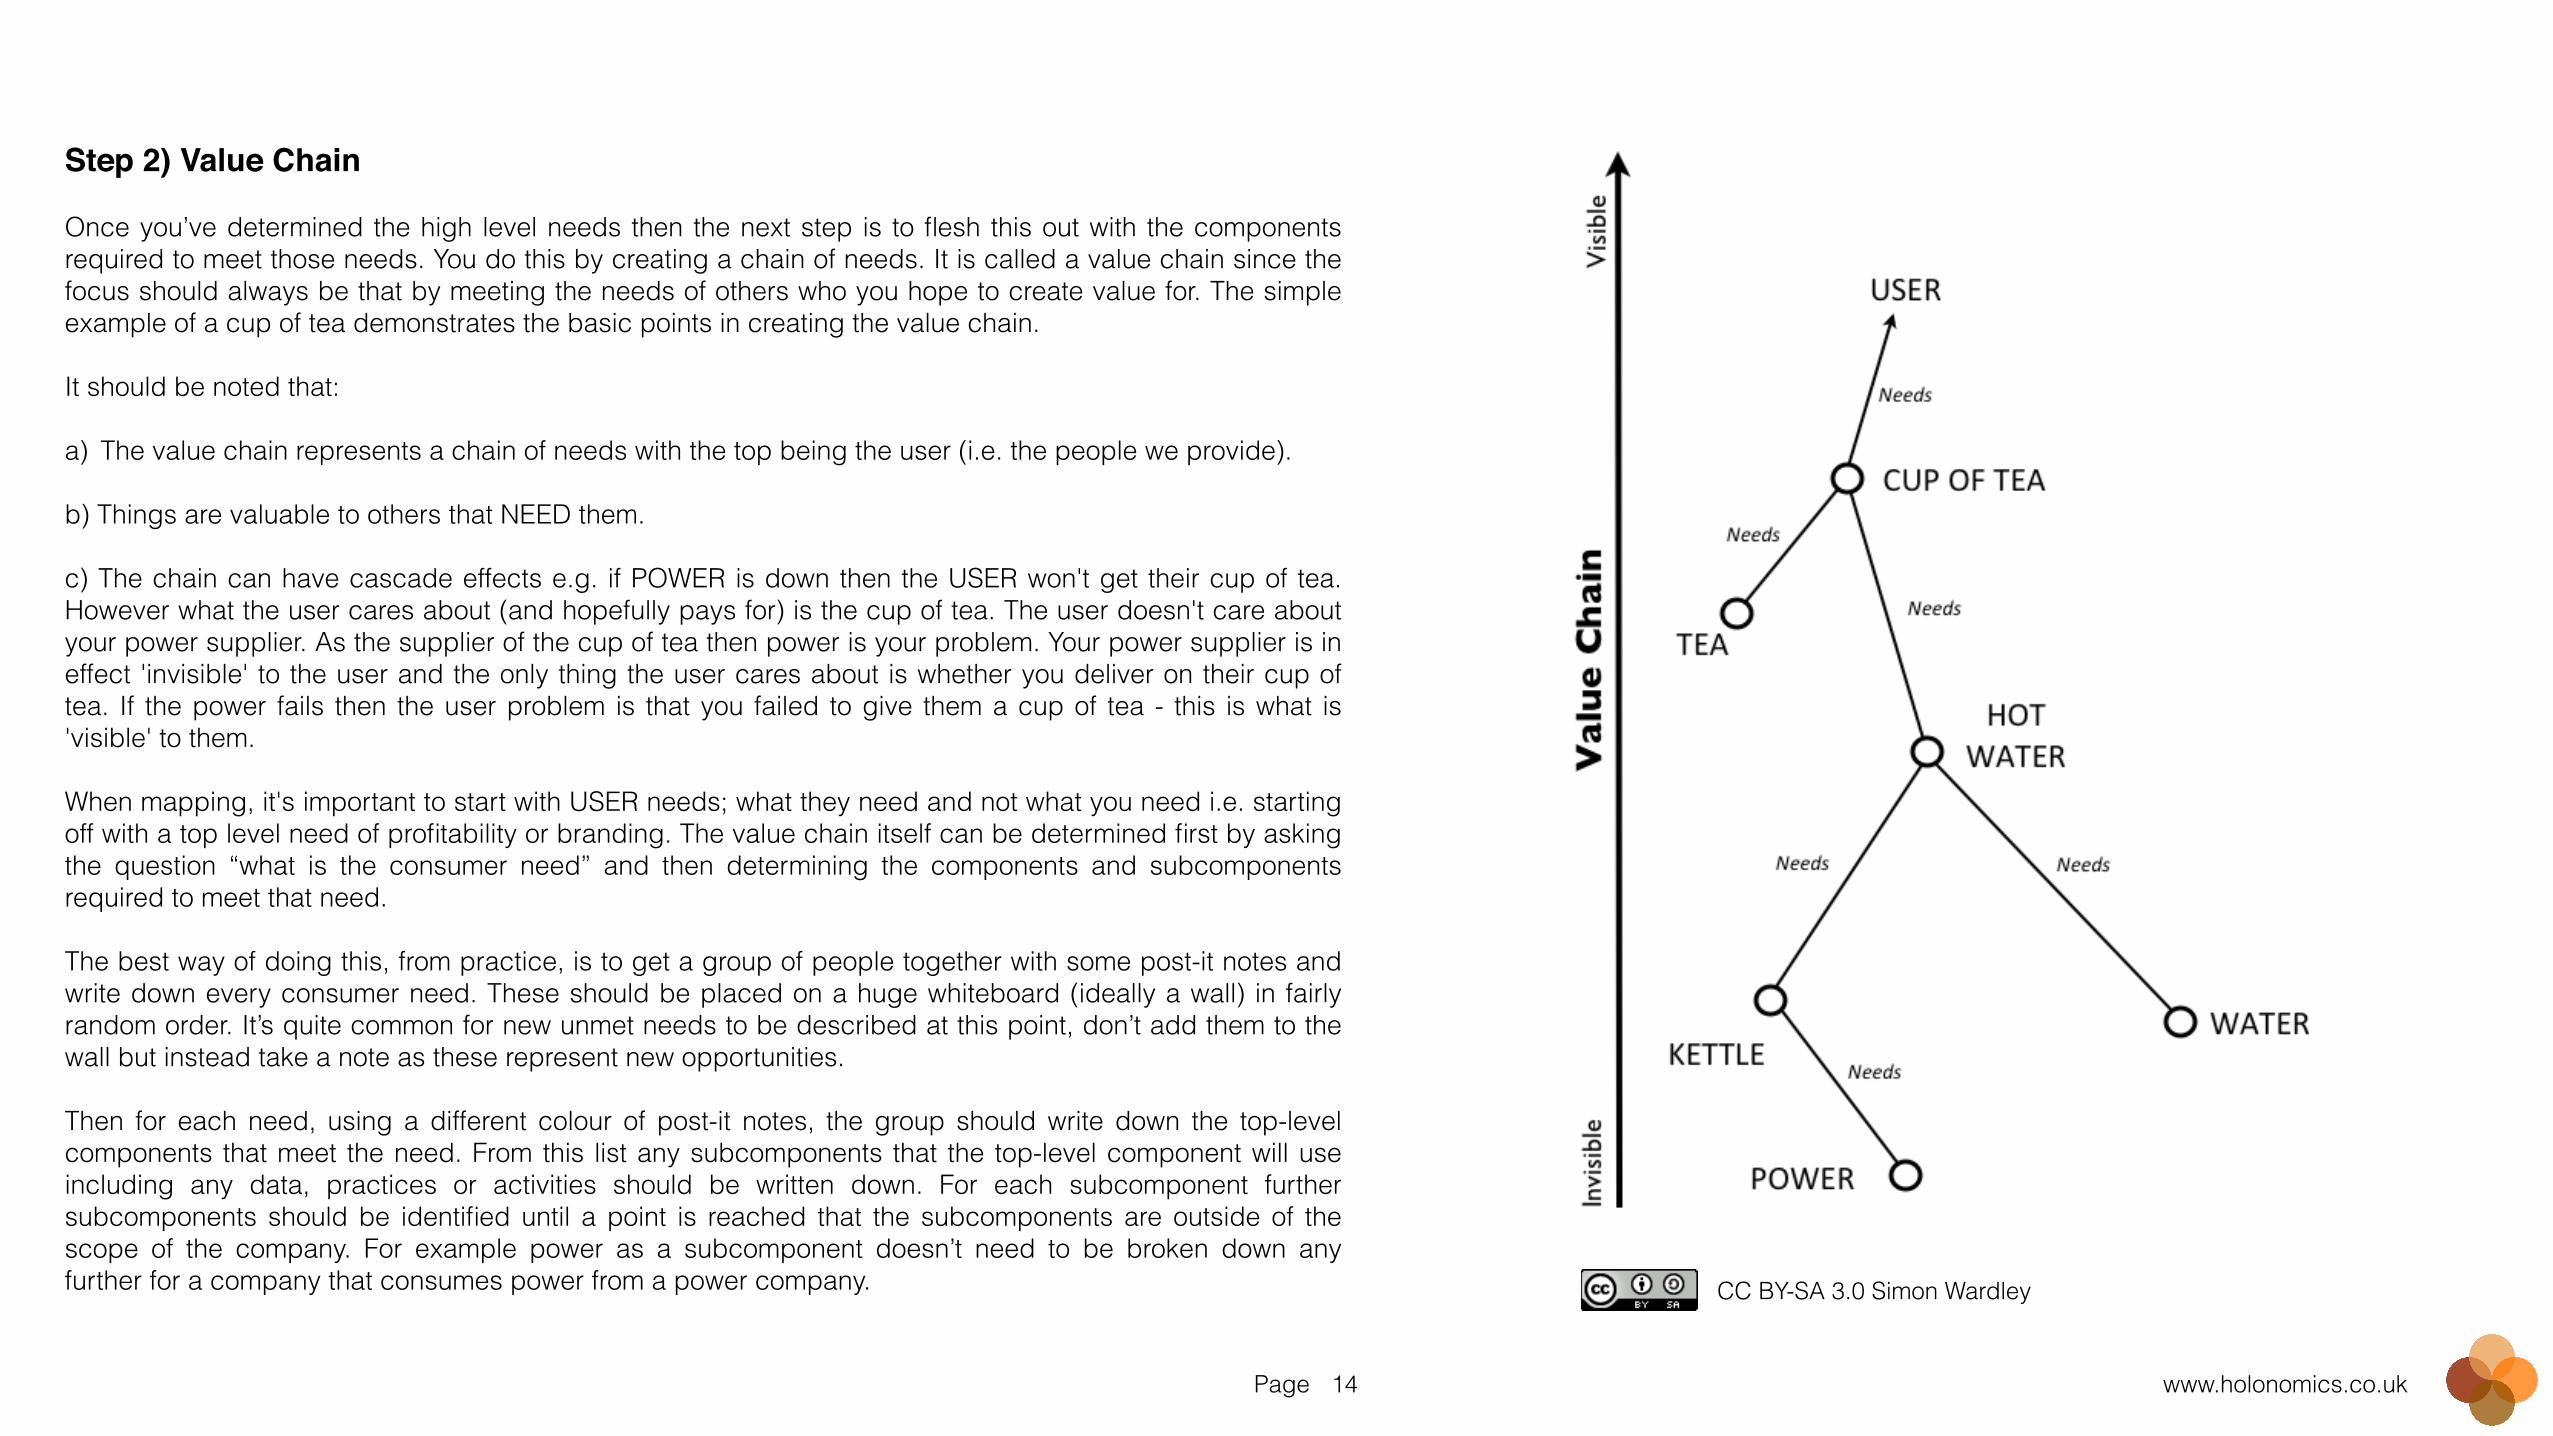
Step 2) Value Chain!!Once you’ve determined the high level needs then the next step is to flesh this out with the components required to meet those needs. You do this by creating a chain of needs. It is called a value chain since the focus should always be that by meeting the needs of others who you hope to create value for. The simple example of a cup of tea demonstrates the basic points in creating the value chain. !It should be noted that: !a) The value chain represents a chain of needs with the top being the user (i.e. the people we provide). !b) Things are valuable to others that NEED them. !c) The chain can have cascade effects e.g. if POWER is down then the USER won't get their cup of tea. However what the user cares about (and hopefully pays for) is the cup of tea. The user doesn't care about your power supplier. As the supplier of the cup of tea then power is your problem. Your power supplier is in effect 'invisible' to the user and the only thing the user cares about is whether you deliver on their cup of tea. If the power fails then the user problem is that you failed to give them a cup of tea - this is what is 'visible' to them. !When mapping, it's important to start with USER needs; what they need and not what you need i.e. starting off with a top level need of profitability or branding. The value chain itself can be determined first by asking the question “what is the consumer need” and then determining the components and subcomponents required to meet that need. !The best way of doing this, from practice, is to get a group of people together with some post-it notes and write down every consumer need. These should be placed on a huge whiteboard (ideally a wall) in fairly random order. It’s quite common for new unmet needs to be described at this point, don’t add them to the wall but instead take a note as these represent new opportunities. !Then for each need, using a different colour of post-it notes, the group should write down the top-level components that meet the need. From this list any subcomponents that the top-level component will use including any data, practices or activities should be written down. For each subcomponent further subcomponents should be identified until a point is reached that the subcomponents are outside of the scope of the company. For example power as a subcomponent doesn’t need to be broken down any further for a company that consumes power from a power company. CC BY-SA 3.0 Simon Wardley
Page www.holonomics.co.uk15
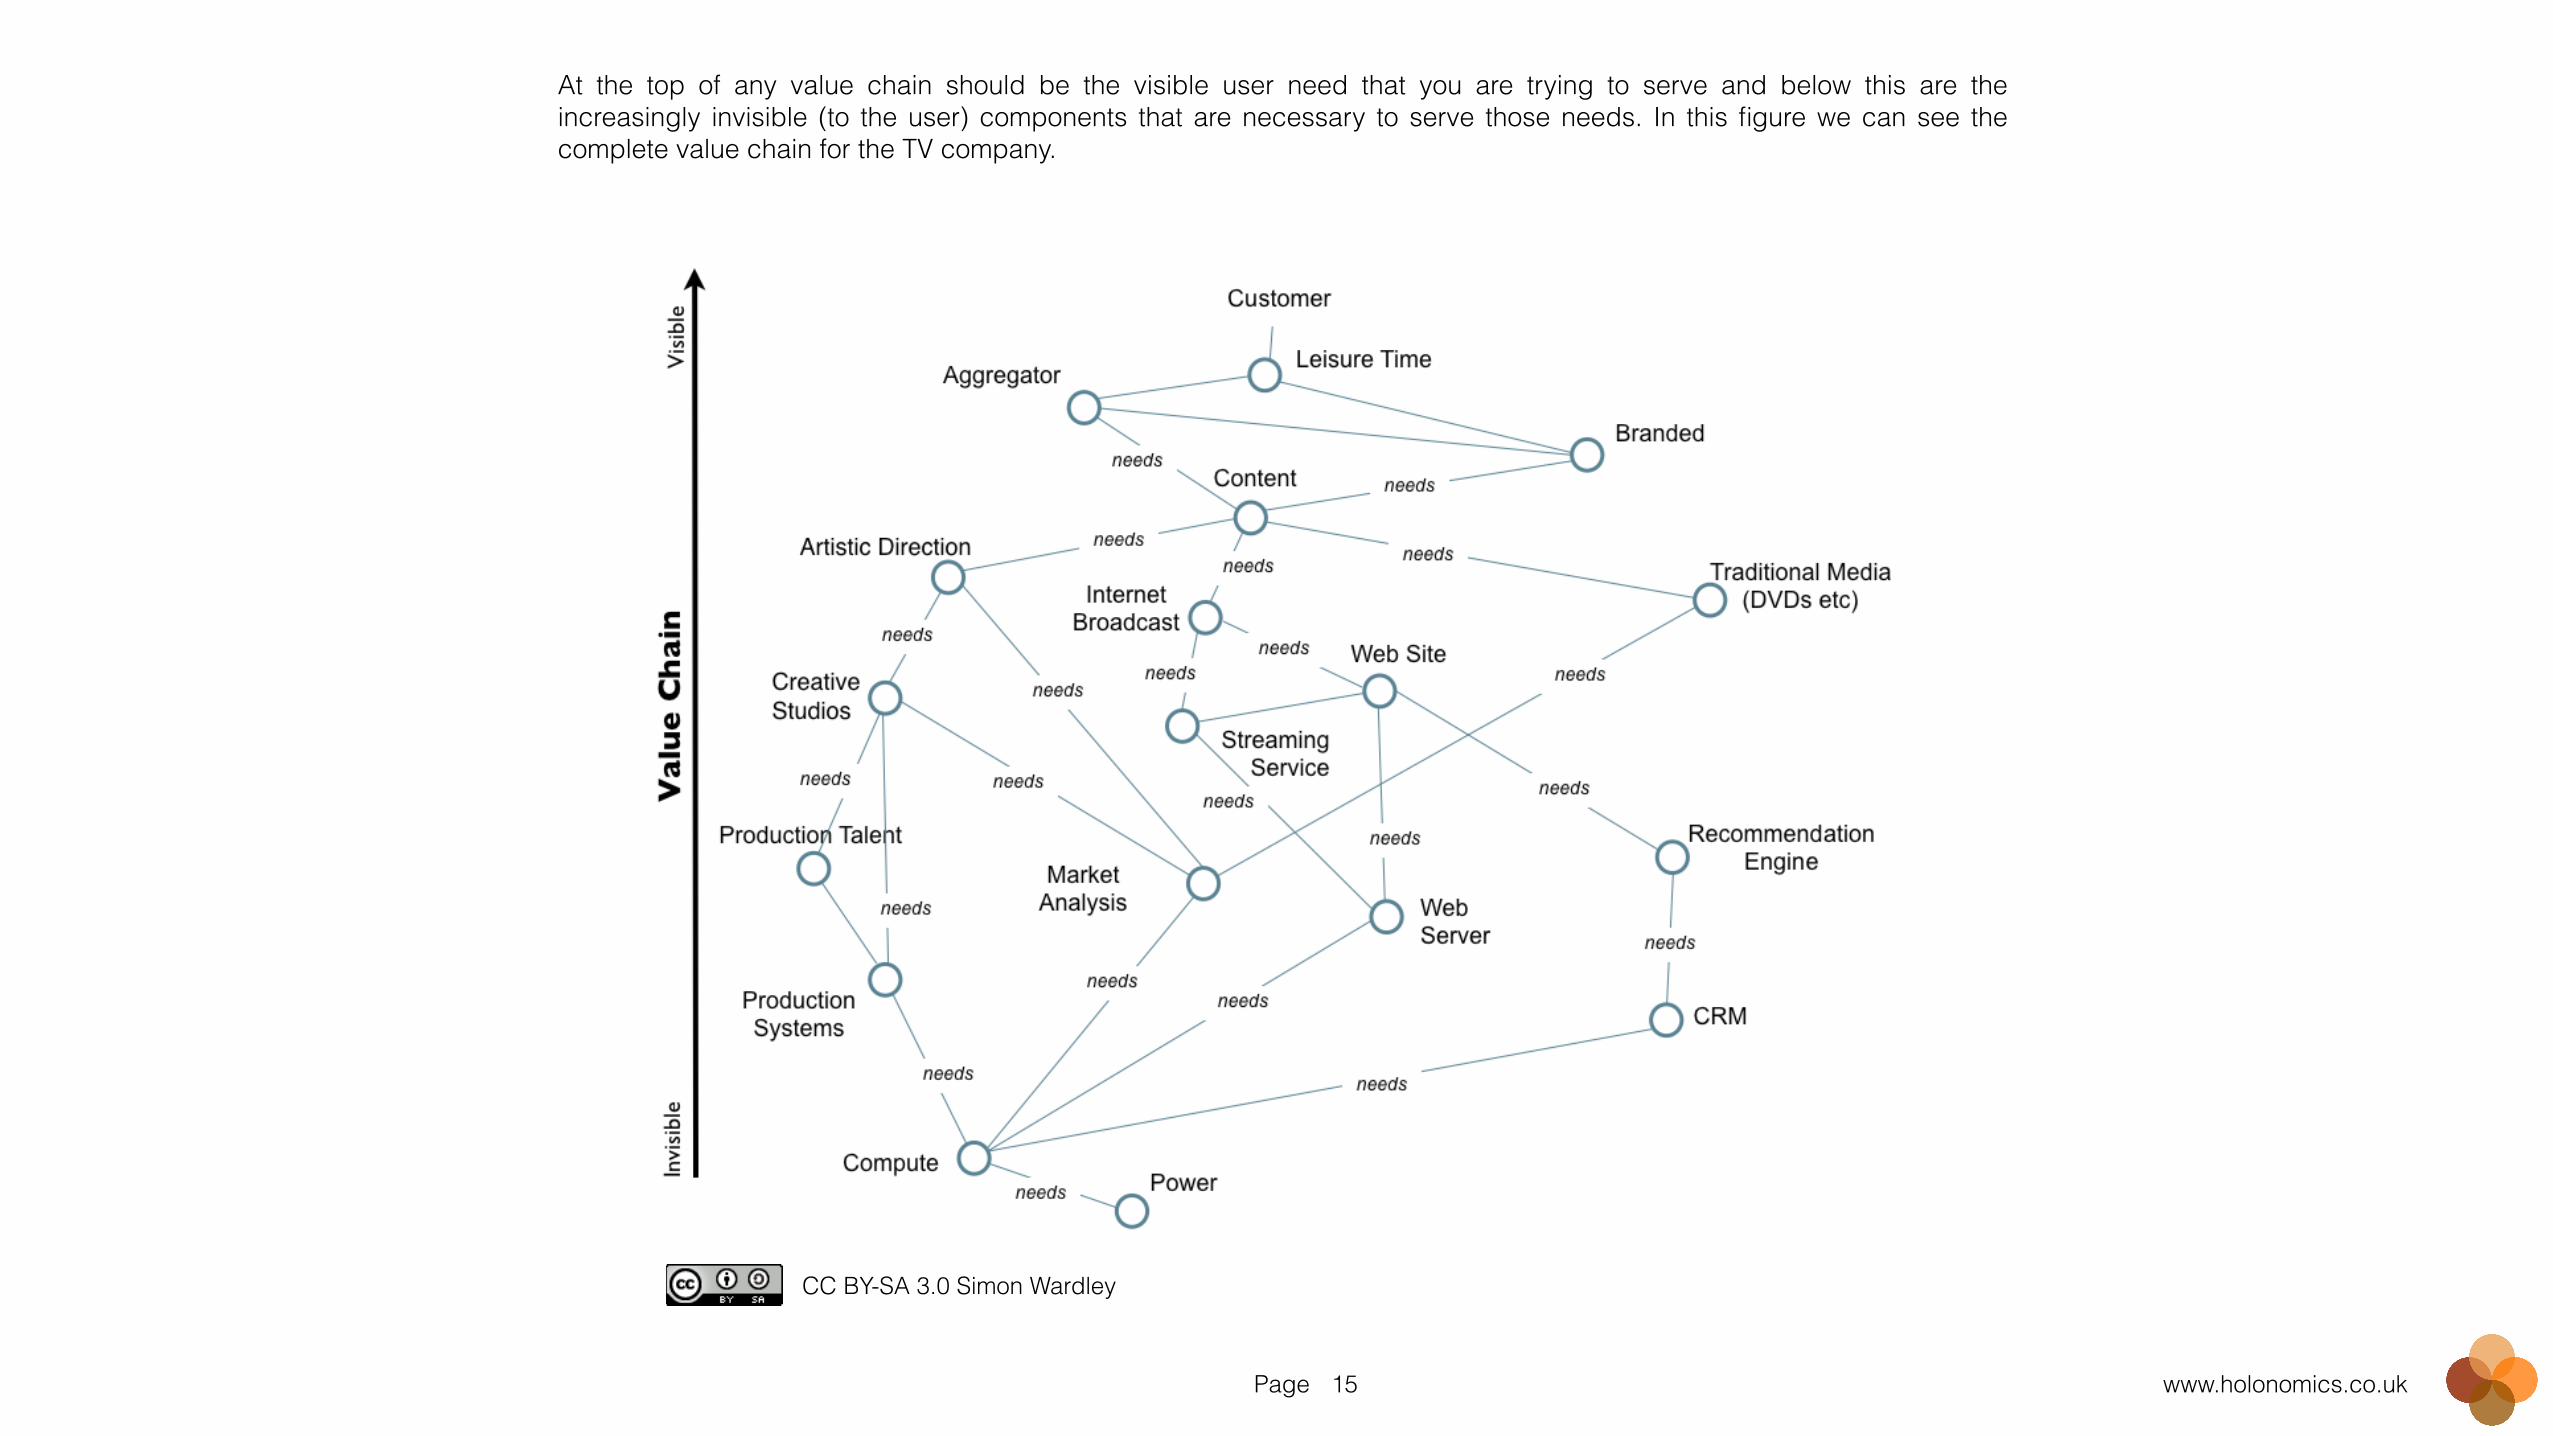
At the top of any value chain should be the visible user need that you are trying to serve and below this are the increasingly invisible (to the user) components that are necessary to serve those needs. In this figure we can see the complete value chain for the TV company.
CC BY-SA 3.0 Simon Wardley
Page www.holonomics.co.uk16
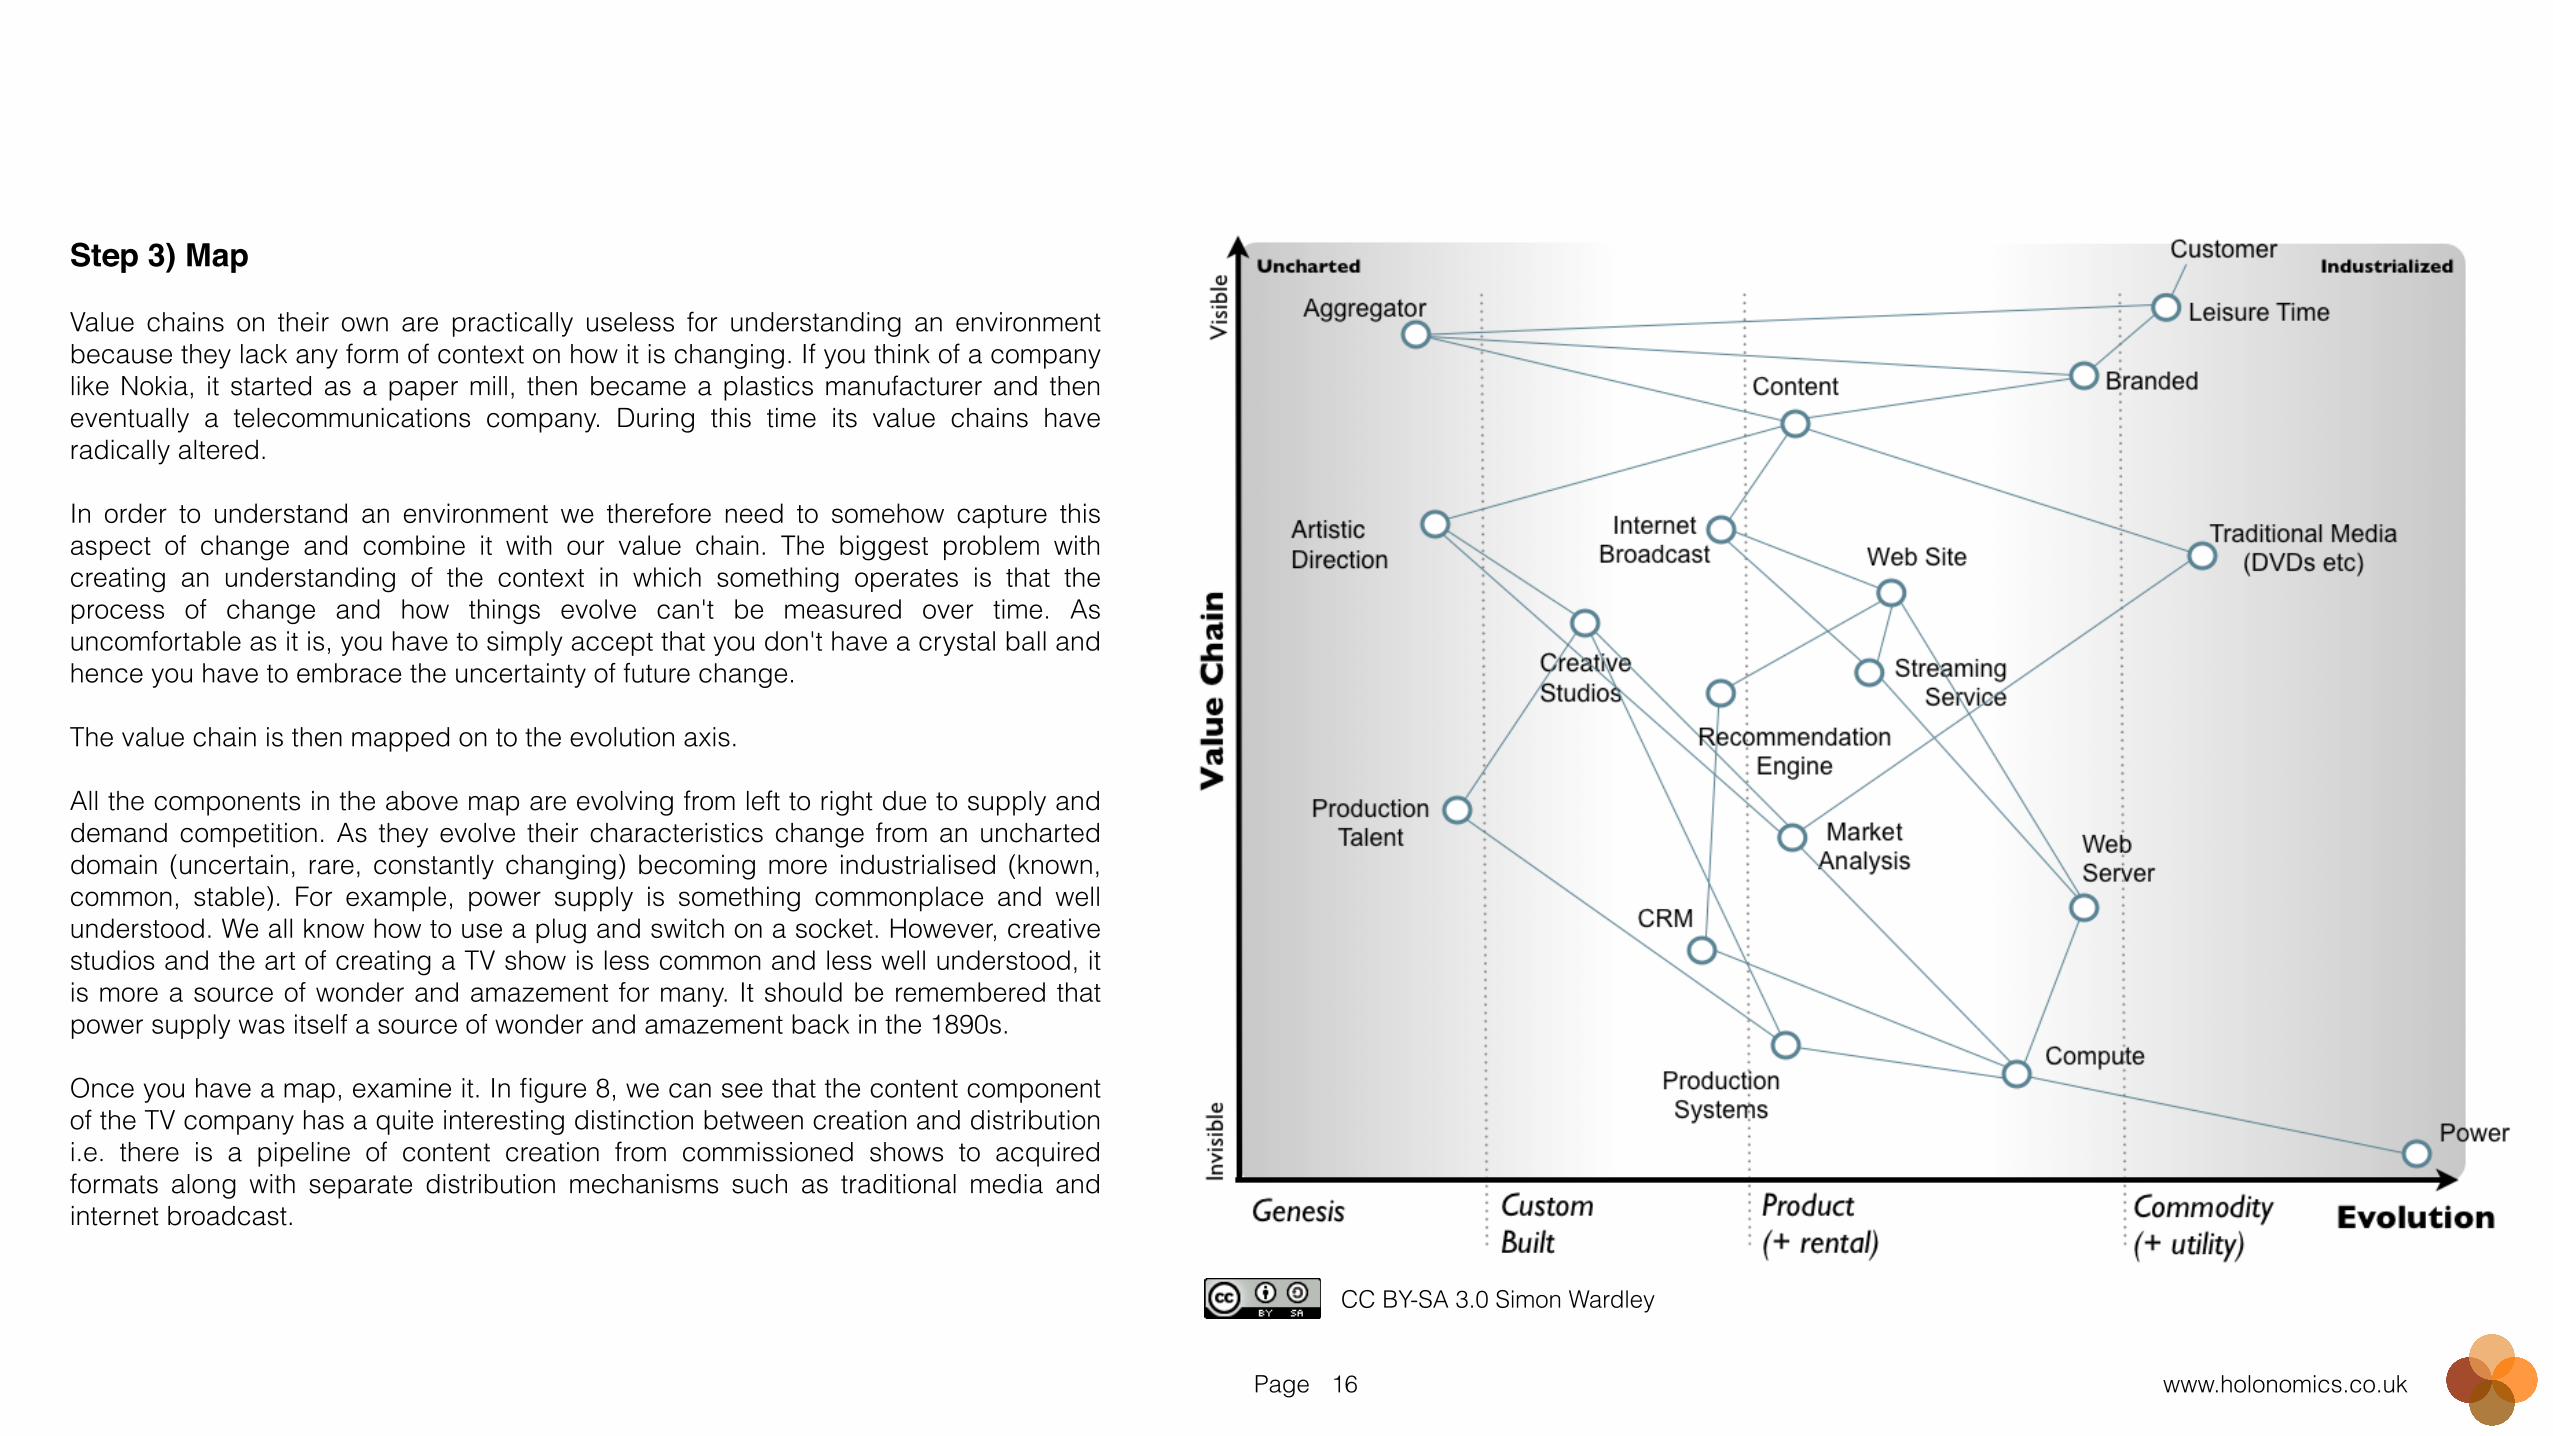
Step 3) Map!!Value chains on their own are practically useless for understanding an environment because they lack any form of context on how it is changing. If you think of a company like Nokia, it started as a paper mill, then became a plastics manufacturer and then eventually a telecommunications company. During this time its value chains have radically altered. !In order to understand an environment we therefore need to somehow capture this aspect of change and combine it with our value chain. The biggest problem with creating an understanding of the context in which something operates is that the process of change and how things evolve can't be measured over time. As uncomfortable as it is, you have to simply accept that you don't have a crystal ball and hence you have to embrace the uncertainty of future change. !The value chain is then mapped on to the evolution axis. !All the components in the above map are evolving from left to right due to supply and demand competition. As they evolve their characteristics change from an uncharted domain (uncertain, rare, constantly changing) becoming more industrialised (known, common, stable). For example, power supply is something commonplace and well understood. We all know how to use a plug and switch on a socket. However, creative studios and the art of creating a TV show is less common and less well understood, it is more a source of wonder and amazement for many. It should be remembered that power supply was itself a source of wonder and amazement back in the 1890s. !Once you have a map, examine it. In figure 8, we can see that the content component of the TV company has a quite interesting distinction between creation and distribution i.e. there is a pipeline of content creation from commissioned shows to acquired formats along with separate distribution mechanisms such as traditional media and internet broadcast.
CC BY-SA 3.0 Simon Wardley
Page www.holonomics.co.uk17
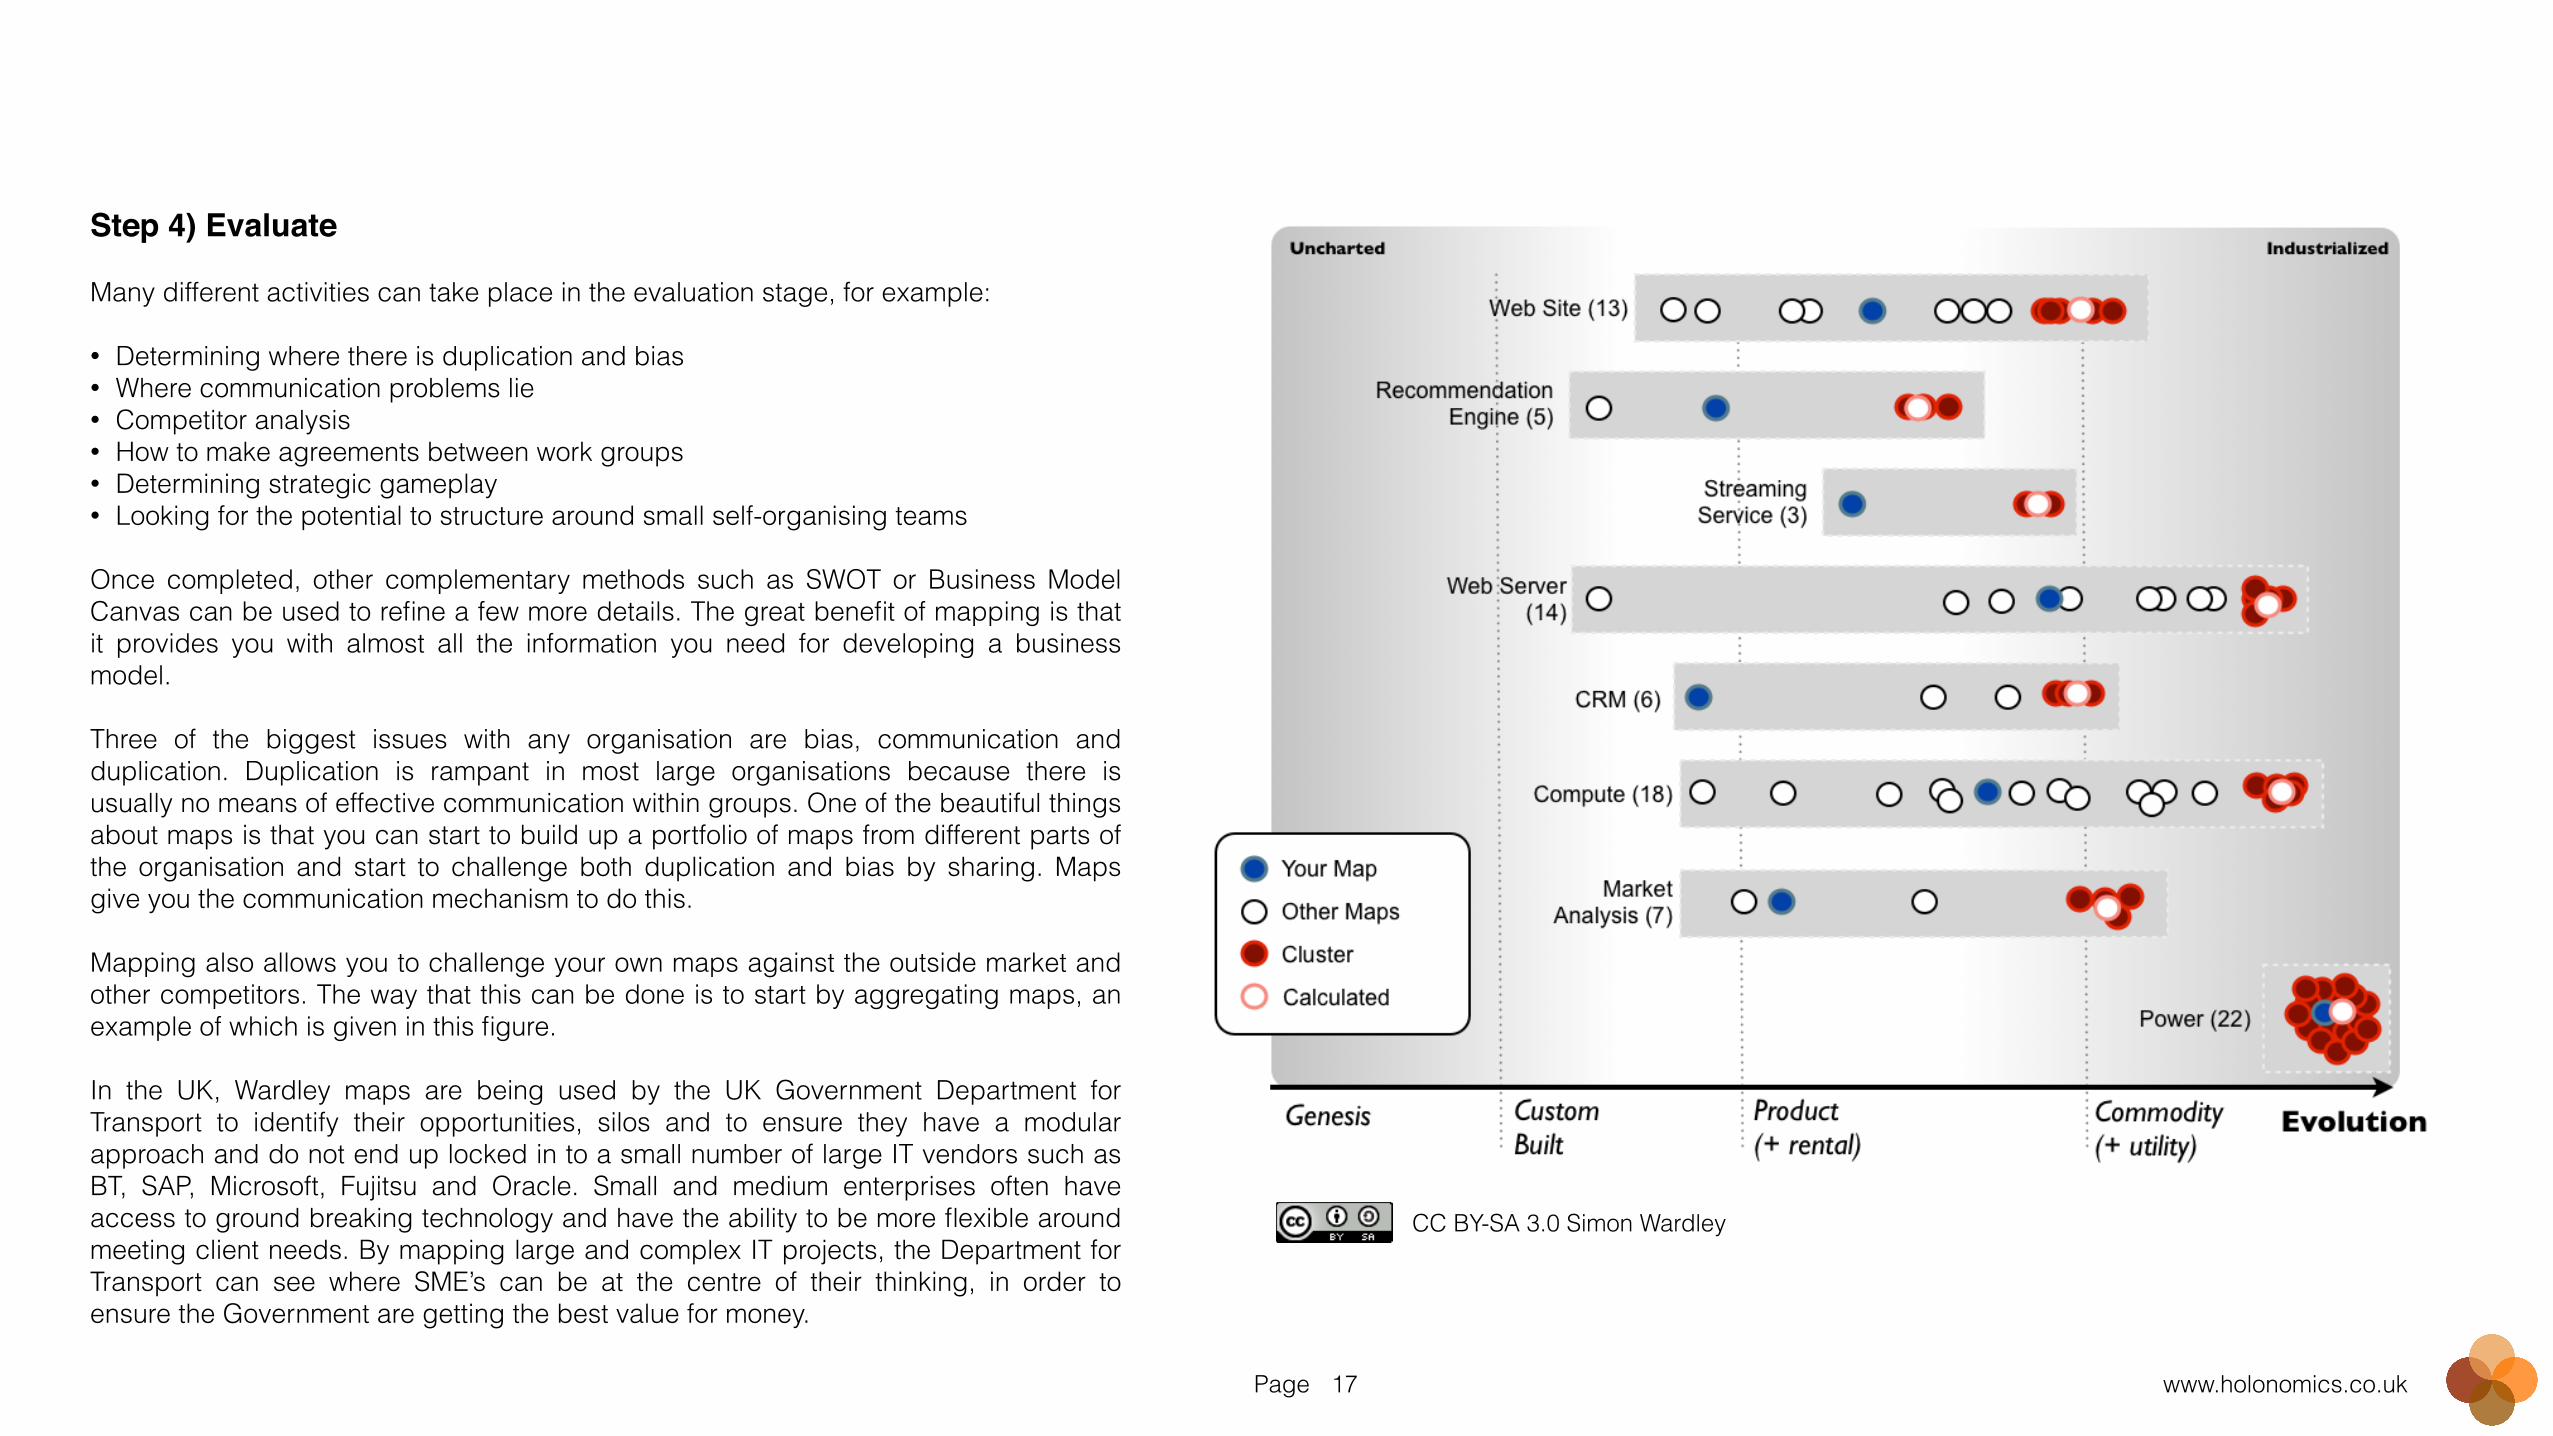
Step 4) Evaluate!!Many different activities can take place in the evaluation stage, for example: !• Determining where there is duplication and bias • Where communication problems lie • Competitor analysis • How to make agreements between work groups • Determining strategic gameplay • Looking for the potential to structure around small self-organising teams Once completed, other complementary methods such as SWOT or Business Model Canvas can be used to refine a few more details. The great benefit of mapping is that it provides you with almost all the information you need for developing a business model. !Three of the biggest issues with any organisation are bias, communication and duplication. Duplication is rampant in most large organisations because there is usually no means of effective communication within groups. One of the beautiful things about maps is that you can start to build up a portfolio of maps from different parts of the organisation and start to challenge both duplication and bias by sharing. Maps give you the communication mechanism to do this. !Mapping also allows you to challenge your own maps against the outside market and other competitors. The way that this can be done is to start by aggregating maps, an example of which is given in this figure. !In the UK, Wardley maps are being used by the UK Government Department for Transport to identify their opportunities, silos and to ensure they have a modular approach and do not end up locked in to a small number of large IT vendors such as BT, SAP, Microsoft, Fujitsu and Oracle. Small and medium enterprises often have access to ground breaking technology and have the ability to be more flexible around meeting client needs. By mapping large and complex IT projects, the Department for Transport can see where SME’s can be at the centre of their thinking, in order to ensure the Government are getting the best value for money.
CC BY-SA 3.0 Simon Wardley
Page www.holonomics.co.uk18
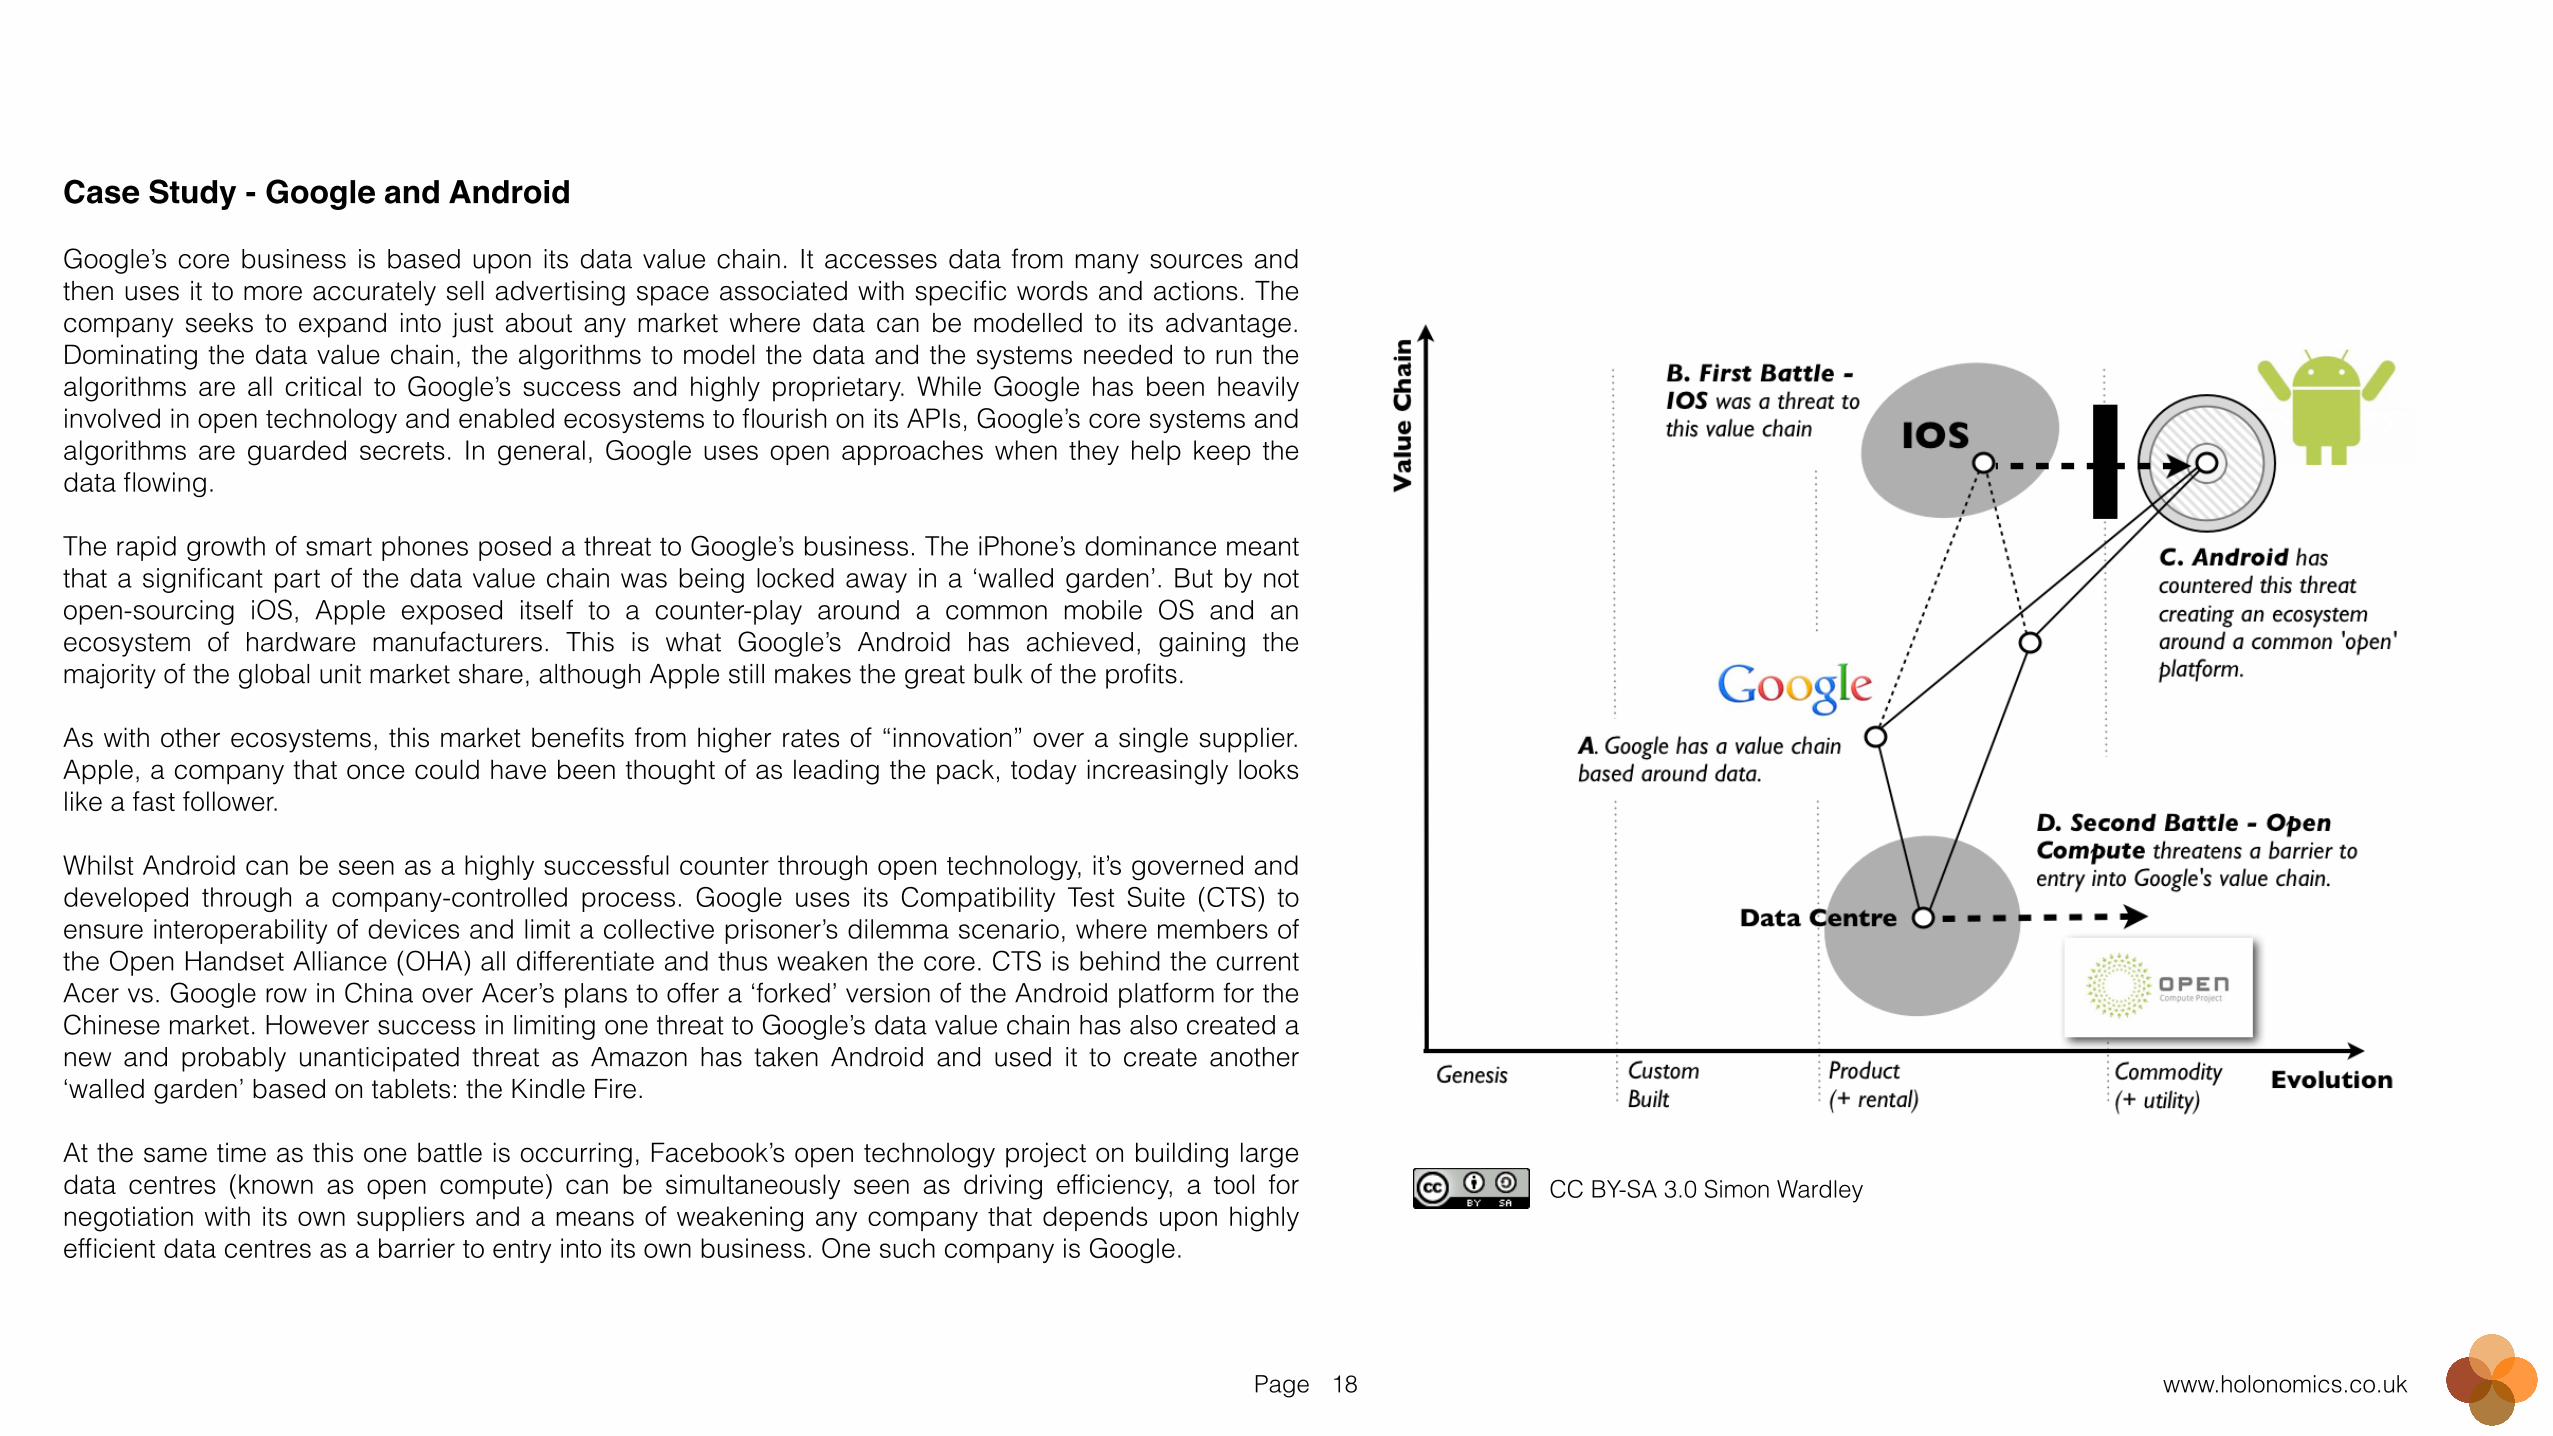
Case Study - Google and Android!!Google’s core business is based upon its data value chain. It accesses data from many sources and then uses it to more accurately sell advertising space associated with specific words and actions. The company seeks to expand into just about any market where data can be modelled to its advantage. Dominating the data value chain, the algorithms to model the data and the systems needed to run the algorithms are all critical to Google’s success and highly proprietary. While Google has been heavily involved in open technology and enabled ecosystems to flourish on its APIs, Google’s core systems and algorithms are guarded secrets. In general, Google uses open approaches when they help keep the data flowing. !The rapid growth of smart phones posed a threat to Google’s business. The iPhone’s dominance meant that a significant part of the data value chain was being locked away in a ‘walled garden’. But by not open-sourcing iOS, Apple exposed itself to a counter-play around a common mobile OS and an ecosystem of hardware manufacturers. This is what Google’s Android has achieved, gaining the majority of the global unit market share, although Apple still makes the great bulk of the profits. !As with other ecosystems, this market benefits from higher rates of “innovation” over a single supplier. Apple, a company that once could have been thought of as leading the pack, today increasingly looks like a fast follower. !Whilst Android can be seen as a highly successful counter through open technology, it’s governed and developed through a company-controlled process. Google uses its Compatibility Test Suite (CTS) to ensure interoperability of devices and limit a collective prisoner’s dilemma scenario, where members of the Open Handset Alliance (OHA) all differentiate and thus weaken the core. CTS is behind the current Acer vs. Google row in China over Acer’s plans to offer a ‘forked’ version of the Android platform for the Chinese market. However success in limiting one threat to Google’s data value chain has also created a new and probably unanticipated threat as Amazon has taken Android and used it to create another ‘walled garden’ based on tablets: the Kindle Fire. !At the same time as this one battle is occurring, Facebook’s open technology project on building large data centres (known as open compute) can be simultaneously seen as driving efficiency, a tool for negotiation with its own suppliers and a means of weakening any company that depends upon highly efficient data centres as a barrier to entry into its own business. One such company is Google.
CC BY-SA 3.0 Simon Wardley
Page www.holonomics.co.uk19
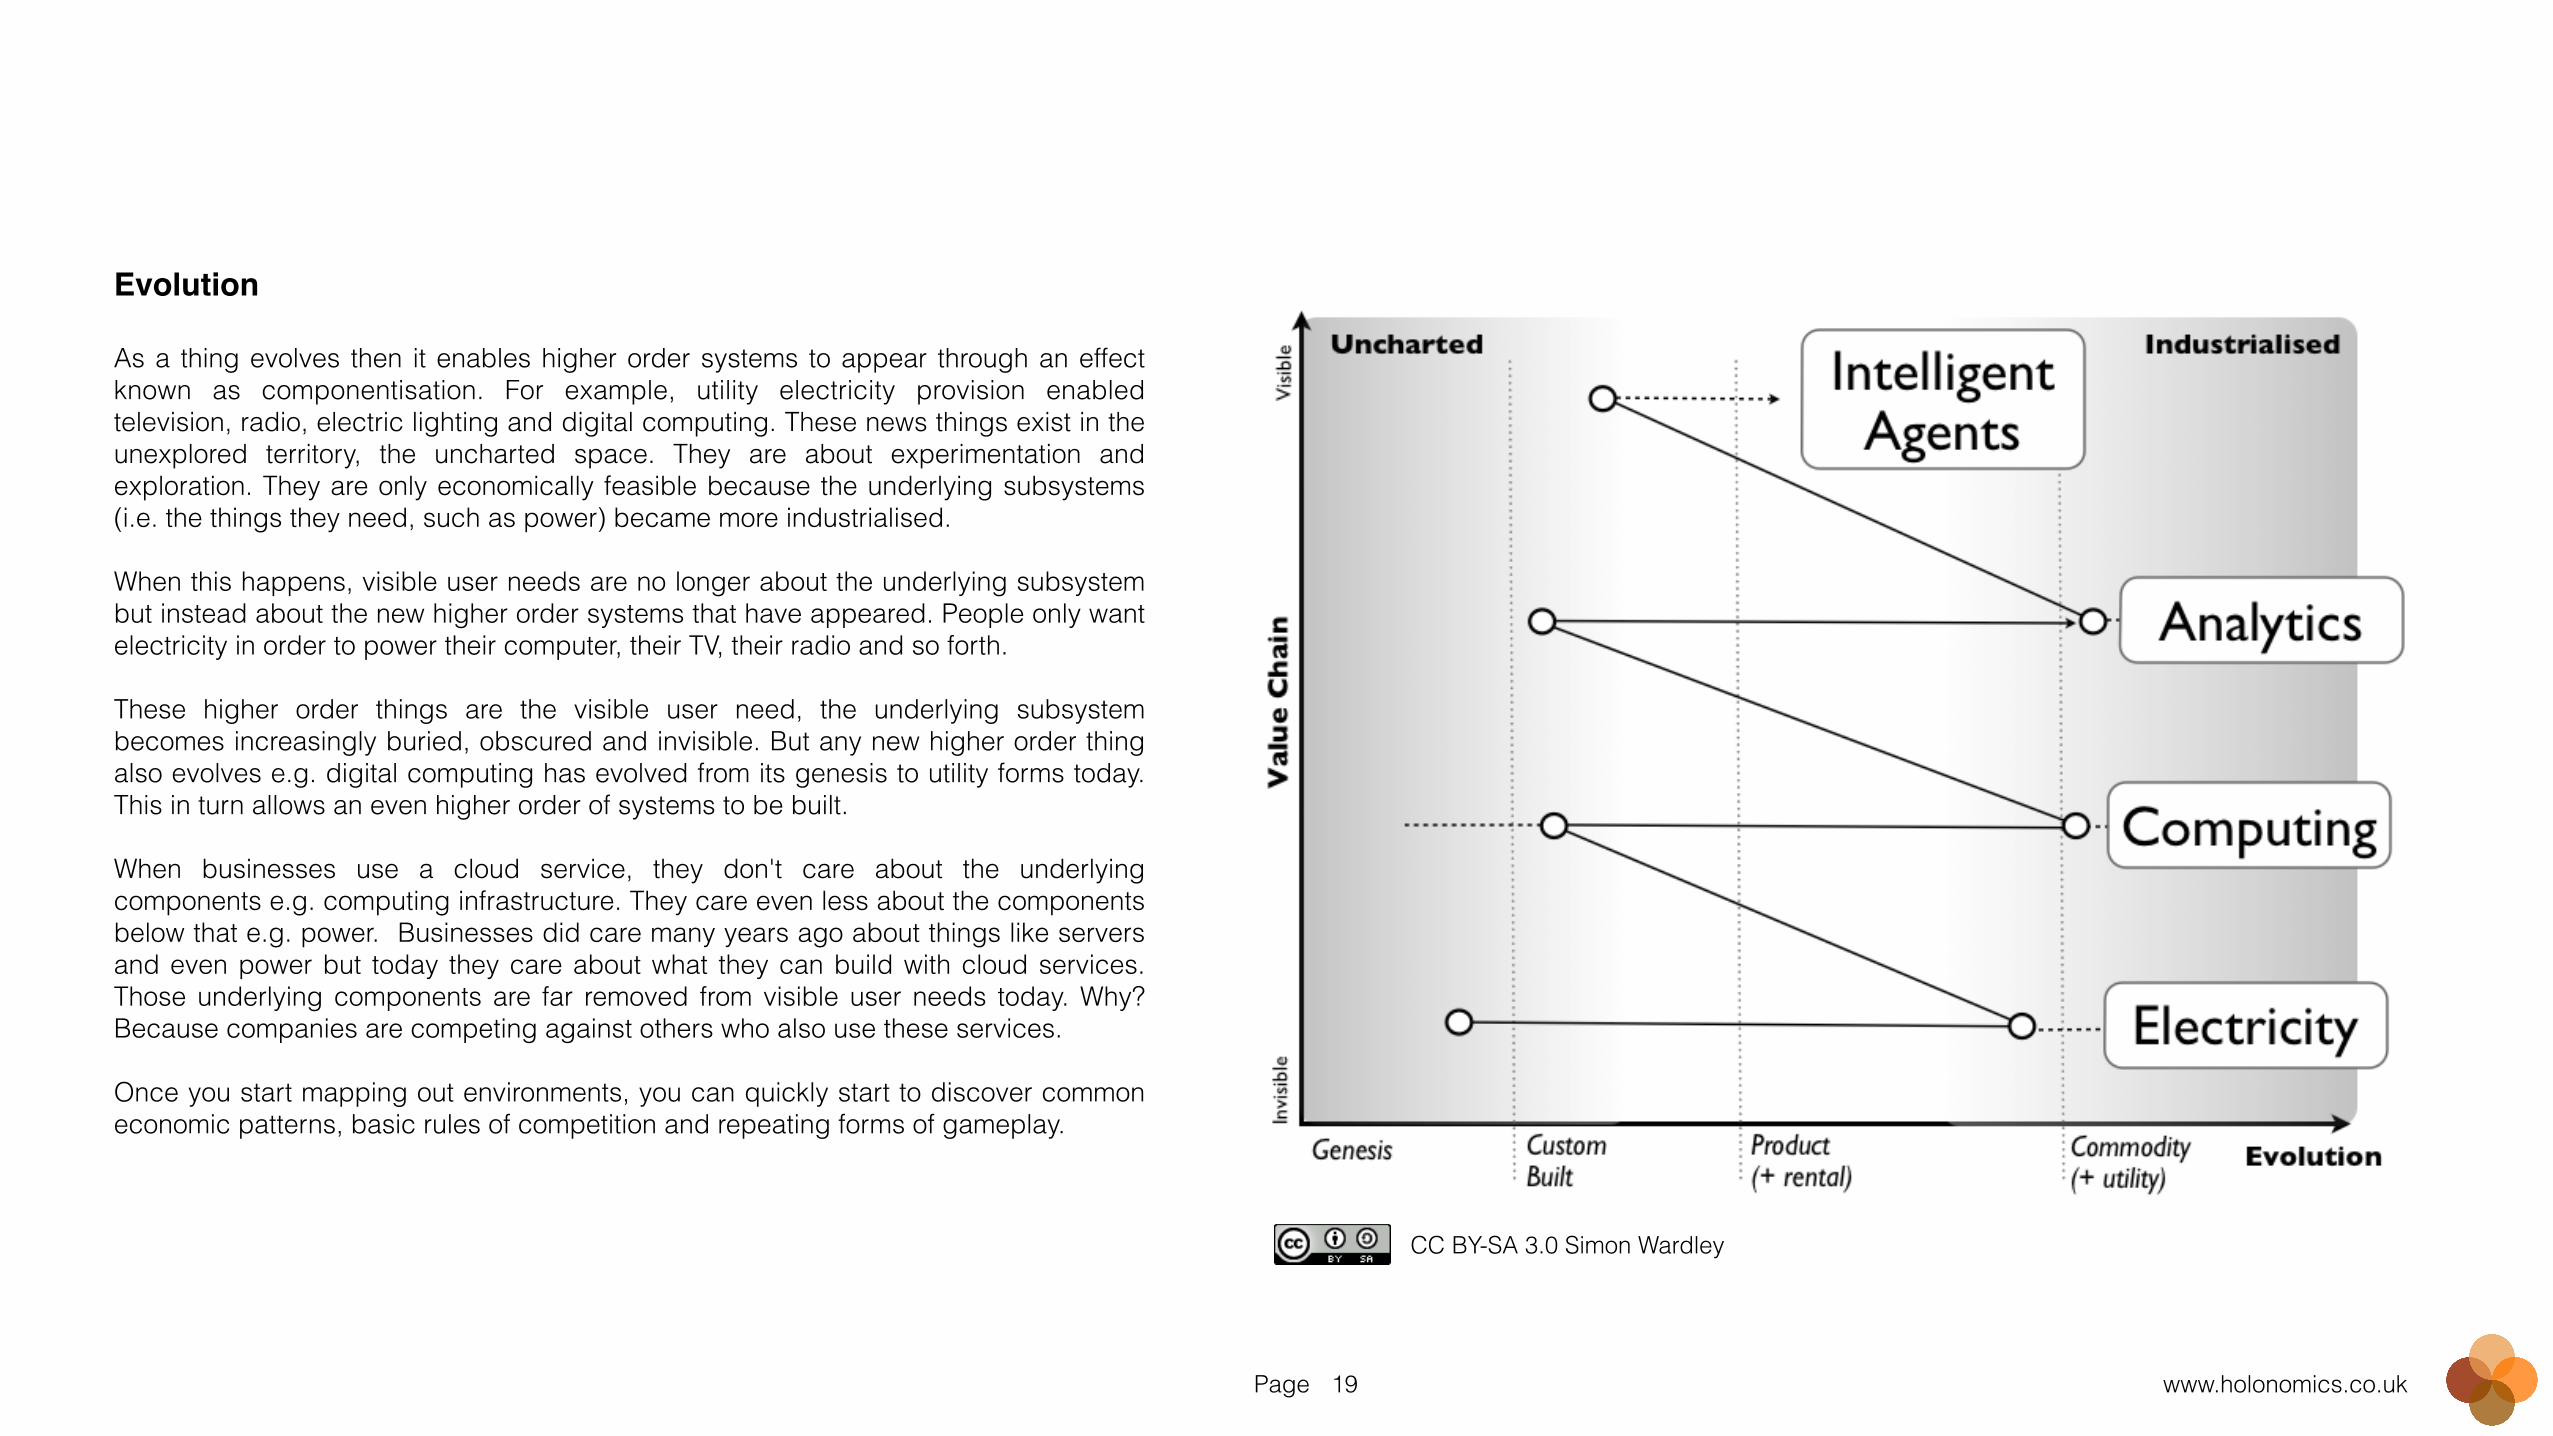
Evolution!!As a thing evolves then it enables higher order systems to appear through an effect known as componentisation. For example, utility electricity provision enabled television, radio, electric lighting and digital computing. These news things exist in the unexplored territory, the uncharted space. They are about experimentation and exploration. They are only economically feasible because the underlying subsystems (i.e. the things they need, such as power) became more industrialised. !When this happens, visible user needs are no longer about the underlying subsystem but instead about the new higher order systems that have appeared. People only want electricity in order to power their computer, their TV, their radio and so forth. !These higher order things are the visible user need, the underlying subsystem becomes increasingly buried, obscured and invisible. But any new higher order thing also evolves e.g. digital computing has evolved from its genesis to utility forms today. This in turn allows an even higher order of systems to be built. !When businesses use a cloud service, they don't care about the underlying components e.g. computing infrastructure. They care even less about the components below that e.g. power. Businesses did care many years ago about things like servers and even power but today they care about what they can build with cloud services. Those underlying components are far removed from visible user needs today. Why? Because companies are competing against others who also use these services. !Once you start mapping out environments, you can quickly start to discover common economic patterns, basic rules of competition and repeating forms of gameplay.
CC BY-SA 3.0 Simon Wardley
Page www.holonomics.co.uk20
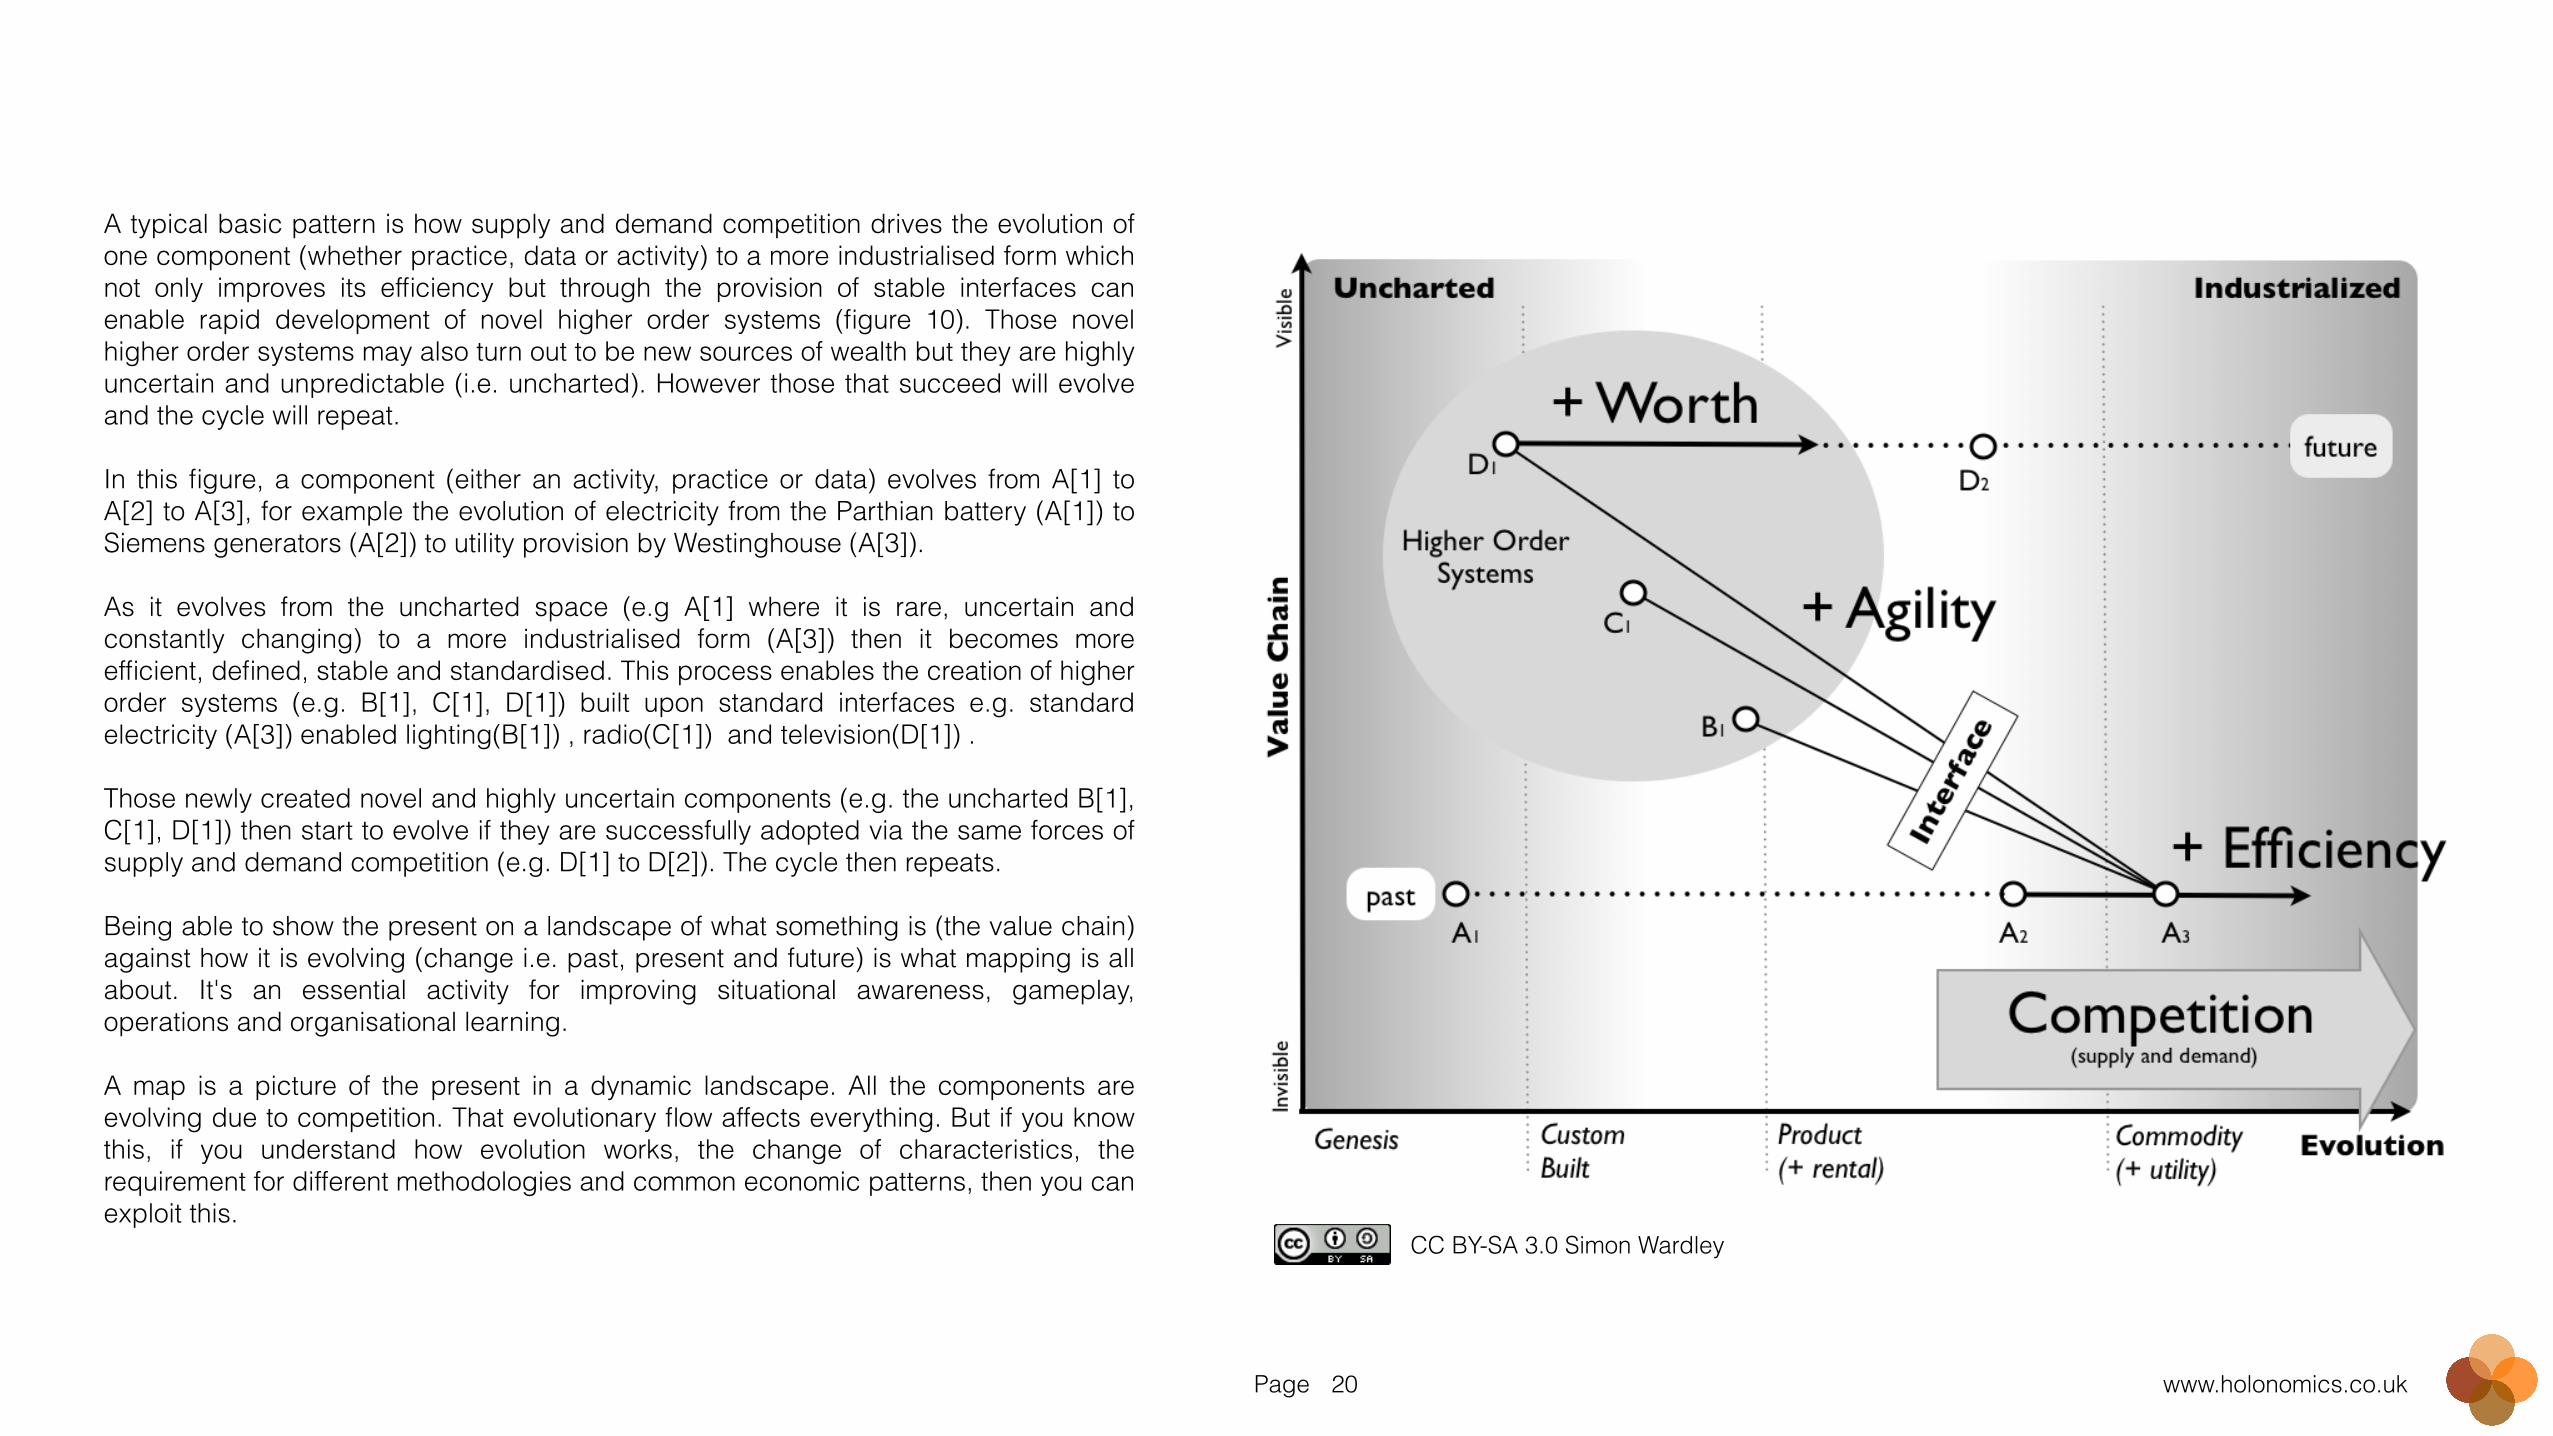
A typical basic pattern is how supply and demand competition drives the evolution of one component (whether practice, data or activity) to a more industrialised form which not only improves its efficiency but through the provision of stable interfaces can enable rapid development of novel higher order systems (figure 10). Those novel higher order systems may also turn out to be new sources of wealth but they are highly uncertain and unpredictable (i.e. uncharted). However those that succeed will evolve and the cycle will repeat. !In this figure, a component (either an activity, practice or data) evolves from A[1] to A[2] to A[3], for example the evolution of electricity from the Parthian battery (A[1]) to Siemens generators (A[2]) to utility provision by Westinghouse (A[3]). !As it evolves from the uncharted space (e.g A[1] where it is rare, uncertain and constantly changing) to a more industrialised form (A[3]) then it becomes more efficient, defined, stable and standardised. This process enables the creation of higher order systems (e.g. B[1], C[1], D[1]) built upon standard interfaces e.g. standard electricity (A[3]) enabled lighting(B[1]) , radio(C[1]) and television(D[1]) . !Those newly created novel and highly uncertain components (e.g. the uncharted B[1], C[1], D[1]) then start to evolve if they are successfully adopted via the same forces of supply and demand competition (e.g. D[1] to D[2]). The cycle then repeats. !Being able to show the present on a landscape of what something is (the value chain) against how it is evolving (change i.e. past, present and future) is what mapping is all about. It's an essential activity for improving situational awareness, gameplay, operations and organisational learning. !A map is a picture of the present in a dynamic landscape. All the components are evolving due to competition. That evolutionary flow affects everything. But if you know this, if you understand how evolution works, the change of characteristics, the requirement for different methodologies and common economic patterns, then you can exploit this.
CC BY-SA 3.0 Simon Wardley
Page www.holonomics.co.uk21
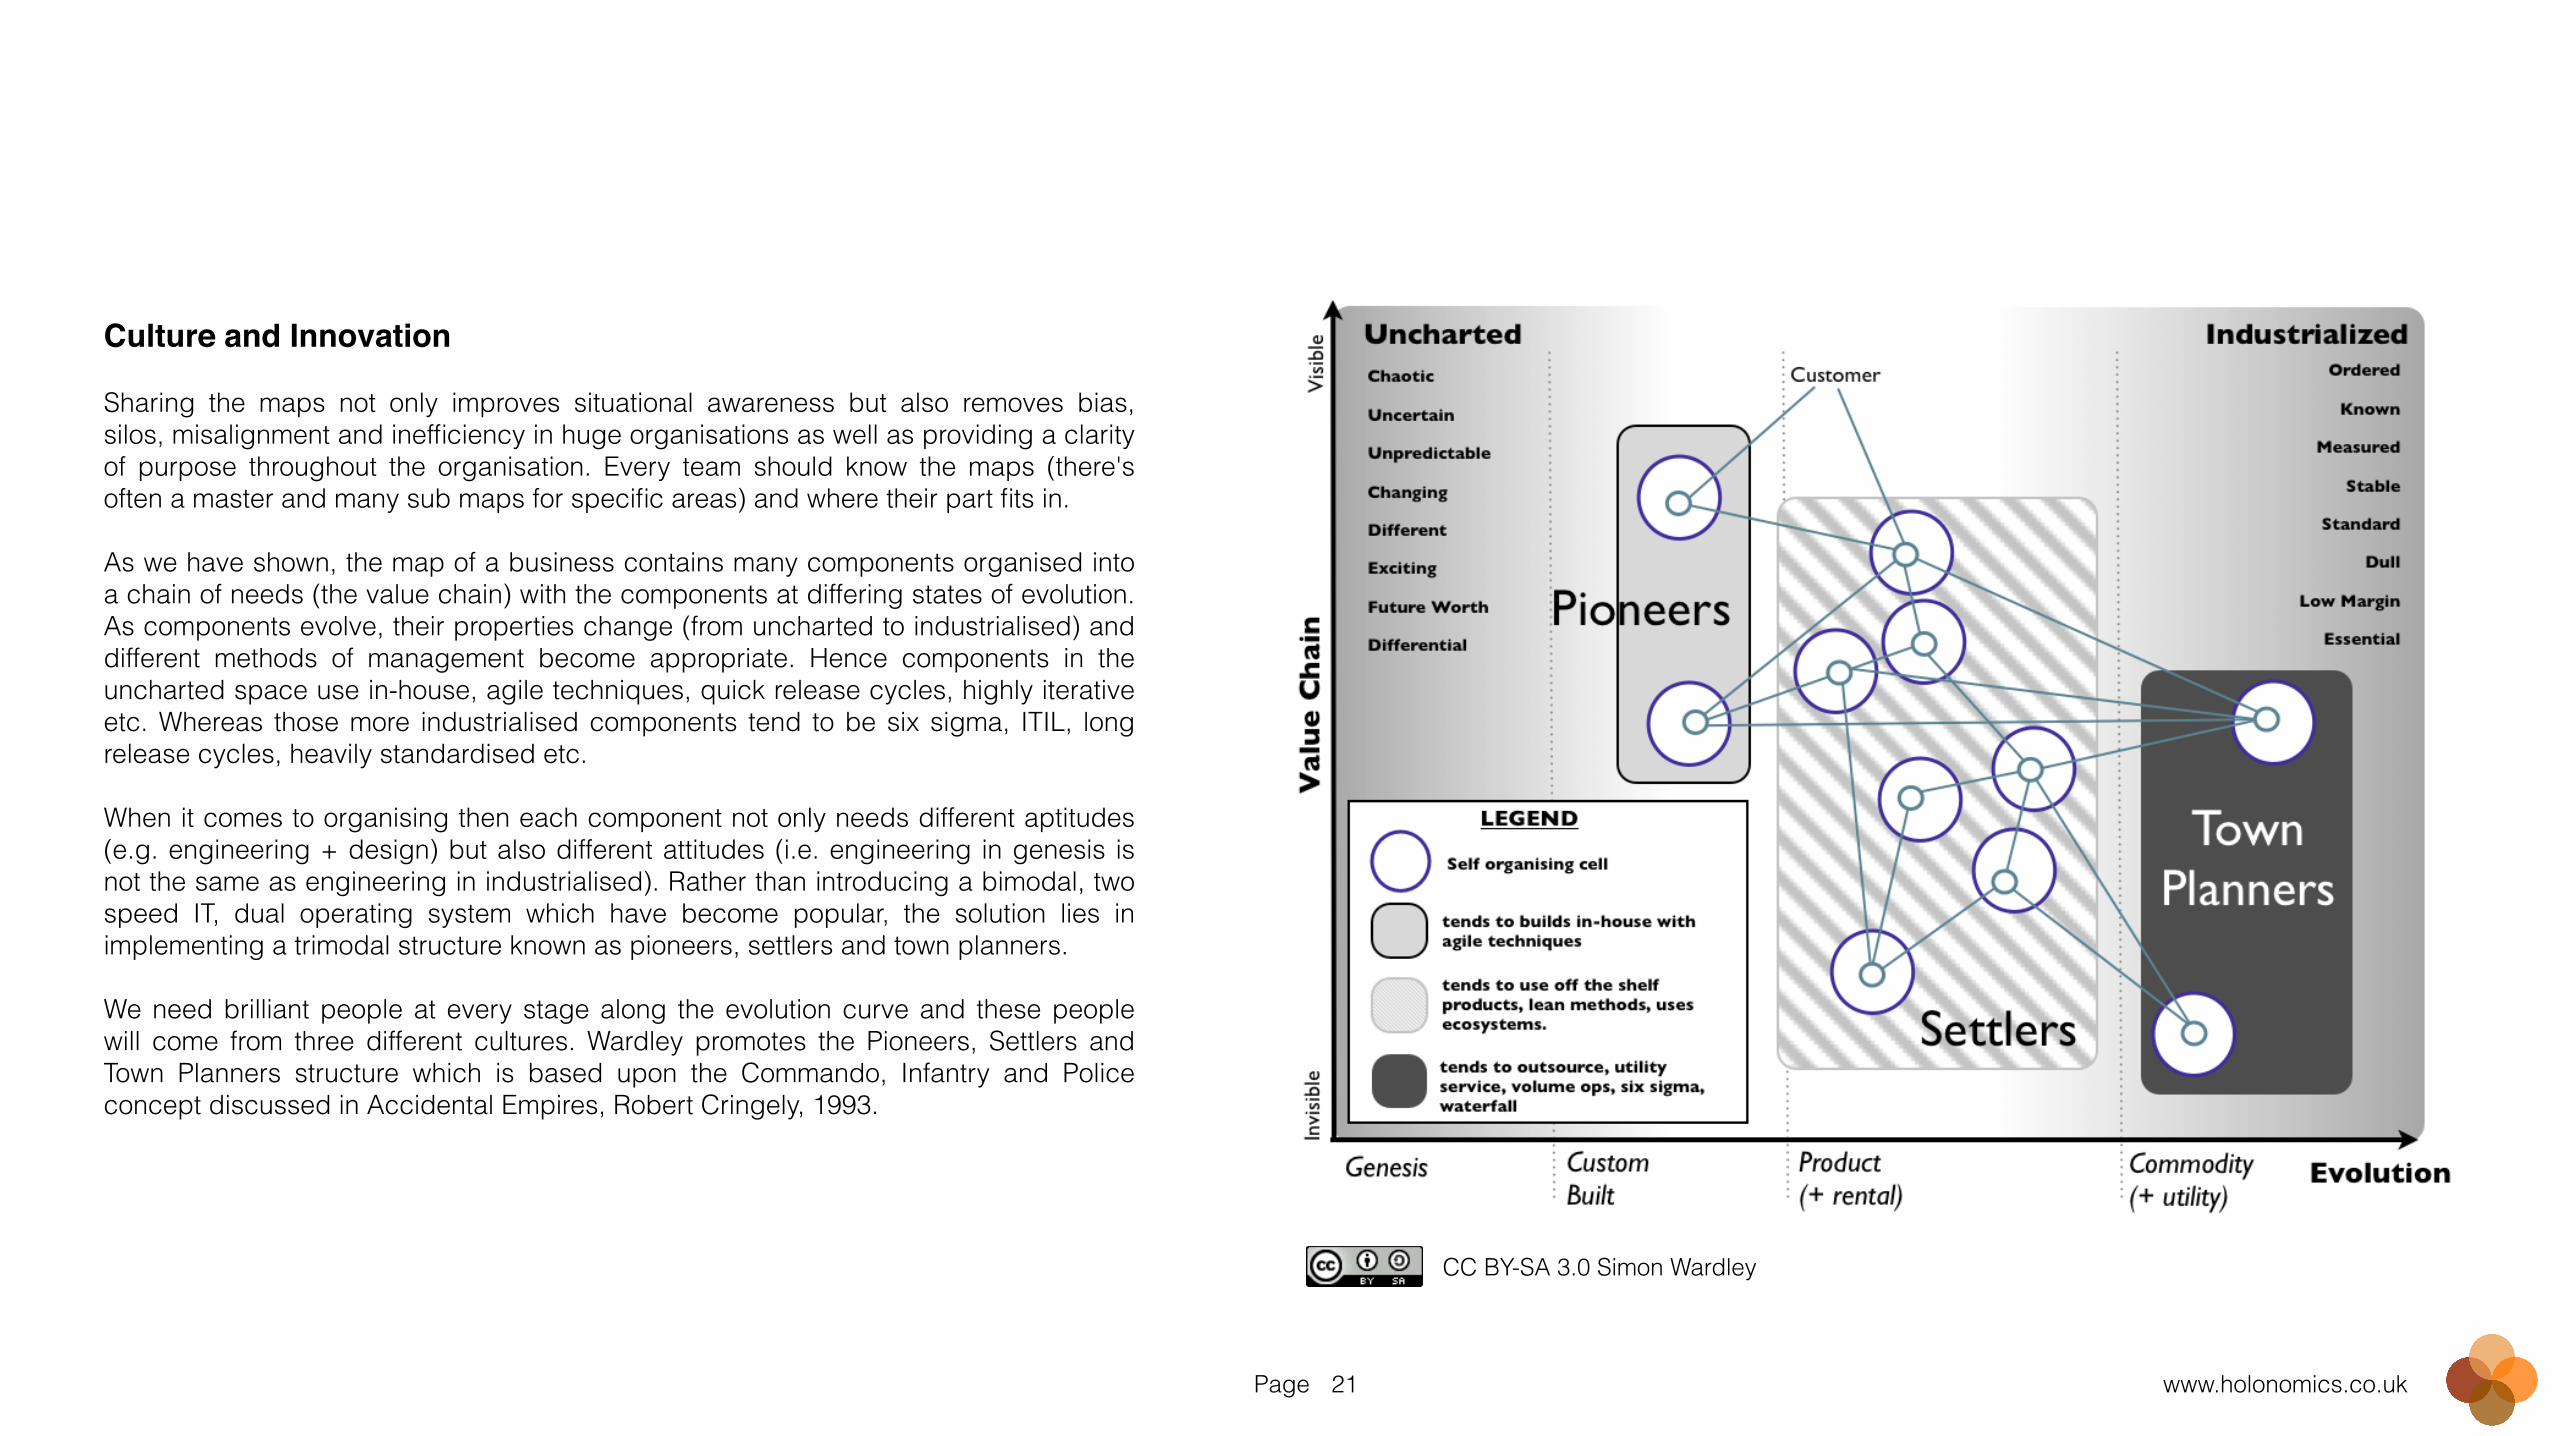
Culture and Innovation!!Sharing the maps not only improves situational awareness but also removes bias, silos, misalignment and inefficiency in huge organisations as well as providing a clarity of purpose throughout the organisation. Every team should know the maps (there's often a master and many sub maps for specific areas) and where their part fits in. !As we have shown, the map of a business contains many components organised into a chain of needs (the value chain) with the components at differing states of evolution. As components evolve, their properties change (from uncharted to industrialised) and different methods of management become appropriate. Hence components in the uncharted space use in-house, agile techniques, quick release cycles, highly iterative etc. Whereas those more industrialised components tend to be six sigma, ITIL, long release cycles, heavily standardised etc. !When it comes to organising then each component not only needs different aptitudes (e.g. engineering + design) but also different attitudes (i.e. engineering in genesis is not the same as engineering in industrialised). Rather than introducing a bimodal, two speed IT, dual operating system which have become popular, the solution lies in implementing a trimodal structure known as pioneers, settlers and town planners. !We need brilliant people at every stage along the evolution curve and these people will come from three different cultures. Wardley promotes the Pioneers, Settlers and Town Planners structure which is based upon the Commando, Infantry and Police concept discussed in Accidental Empires, Robert Cringely, 1993.
CC BY-SA 3.0 Simon Wardley
Page www.holonomics.co.uk22
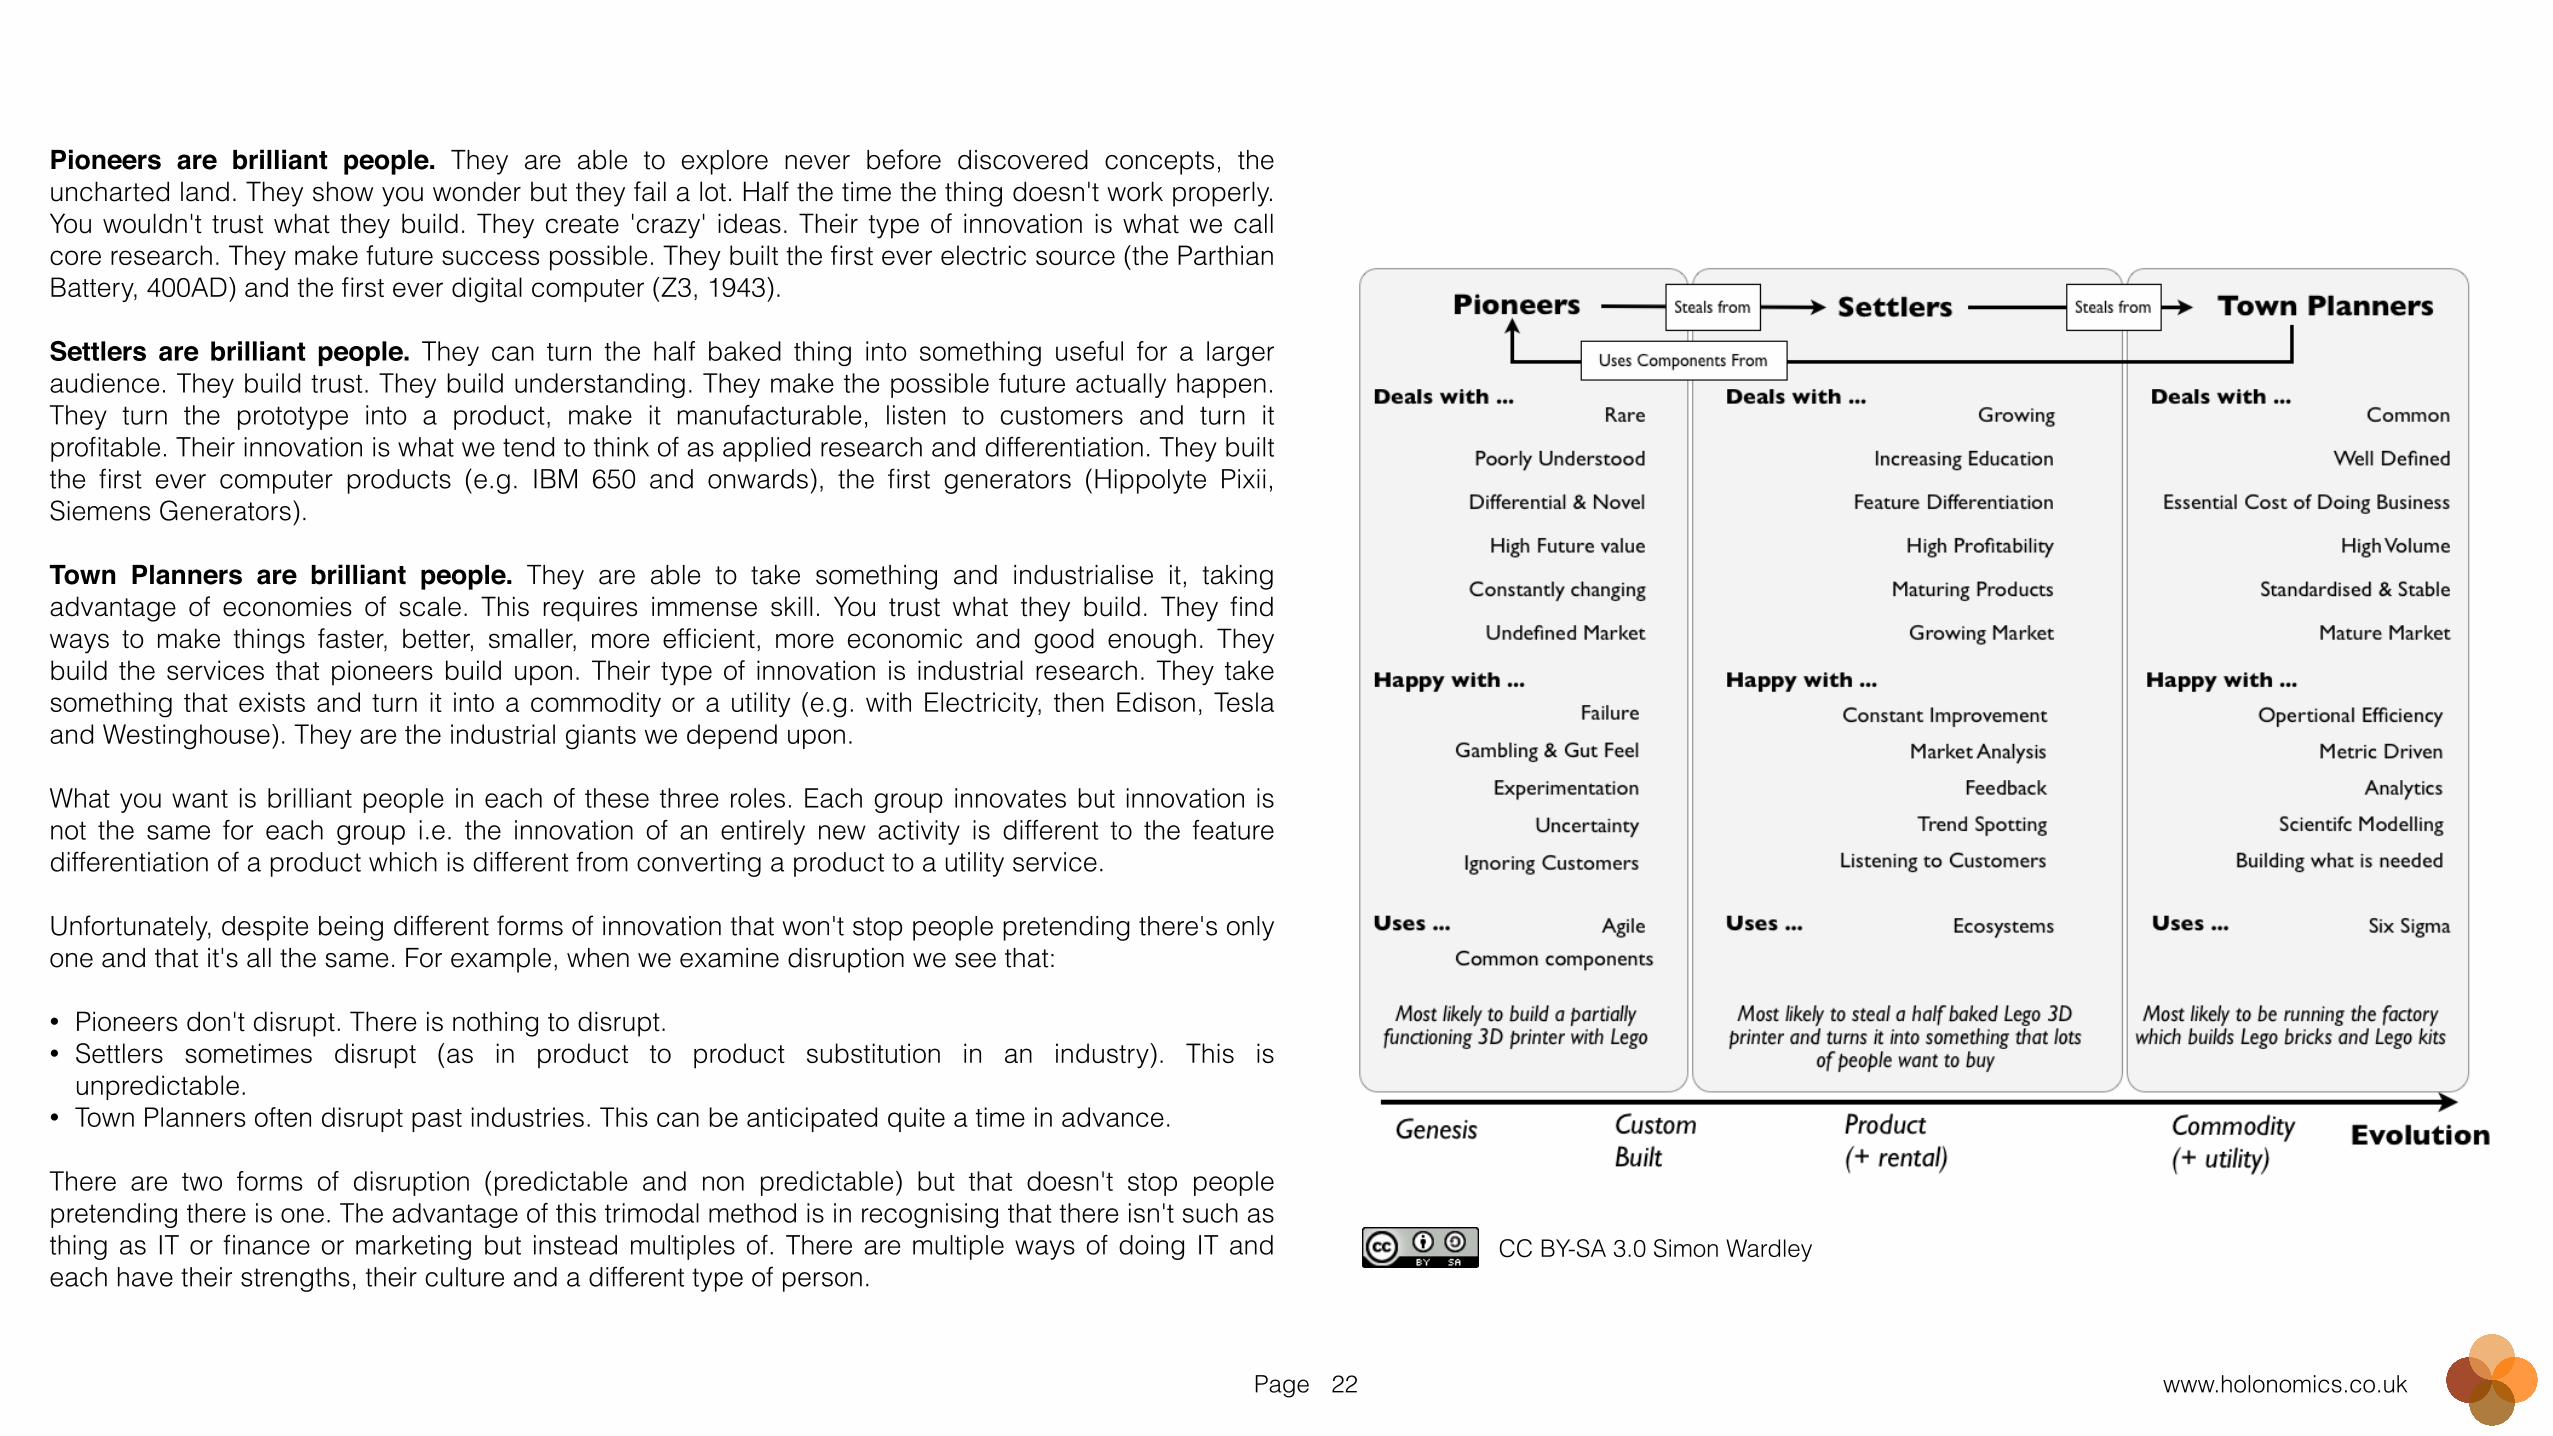
Pioneers are brilliant people. They are able to explore never before discovered concepts, the uncharted land. They show you wonder but they fail a lot. Half the time the thing doesn't work properly. You wouldn't trust what they build. They create 'crazy' ideas. Their type of innovation is what we call core research. They make future success possible. They built the first ever electric source (the Parthian Battery, 400AD) and the first ever digital computer (Z3, 1943). !Settlers are brilliant people. They can turn the half baked thing into something useful for a larger audience. They build trust. They build understanding. They make the possible future actually happen. They turn the prototype into a product, make it manufacturable, listen to customers and turn it profitable. Their innovation is what we tend to think of as applied research and differentiation. They built the first ever computer products (e.g. IBM 650 and onwards), the first generators (Hippolyte Pixii, Siemens Generators). !Town Planners are brilliant people. They are able to take something and industrialise it, taking advantage of economies of scale. This requires immense skill. You trust what they build. They find ways to make things faster, better, smaller, more efficient, more economic and good enough. They build the services that pioneers build upon. Their type of innovation is industrial research. They take something that exists and turn it into a commodity or a utility (e.g. with Electricity, then Edison, Tesla and Westinghouse). They are the industrial giants we depend upon. !What you want is brilliant people in each of these three roles. Each group innovates but innovation is not the same for each group i.e. the innovation of an entirely new activity is different to the feature differentiation of a product which is different from converting a product to a utility service. !Unfortunately, despite being different forms of innovation that won't stop people pretending there's only one and that it's all the same. For example, when we examine disruption we see that: !• Pioneers don't disrupt. There is nothing to disrupt. • Settlers sometimes disrupt (as in product to product substitution in an industry). This is
unpredictable. • Town Planners often disrupt past industries. This can be anticipated quite a time in advance. !There are two forms of disruption (predictable and non predictable) but that doesn't stop people pretending there is one. The advantage of this trimodal method is in recognising that there isn't such as thing as IT or finance or marketing but instead multiples of. There are multiple ways of doing IT and each have their strengths, their culture and a different type of person.
CC BY-SA 3.0 Simon Wardley
Page www.holonomics.co.uk23
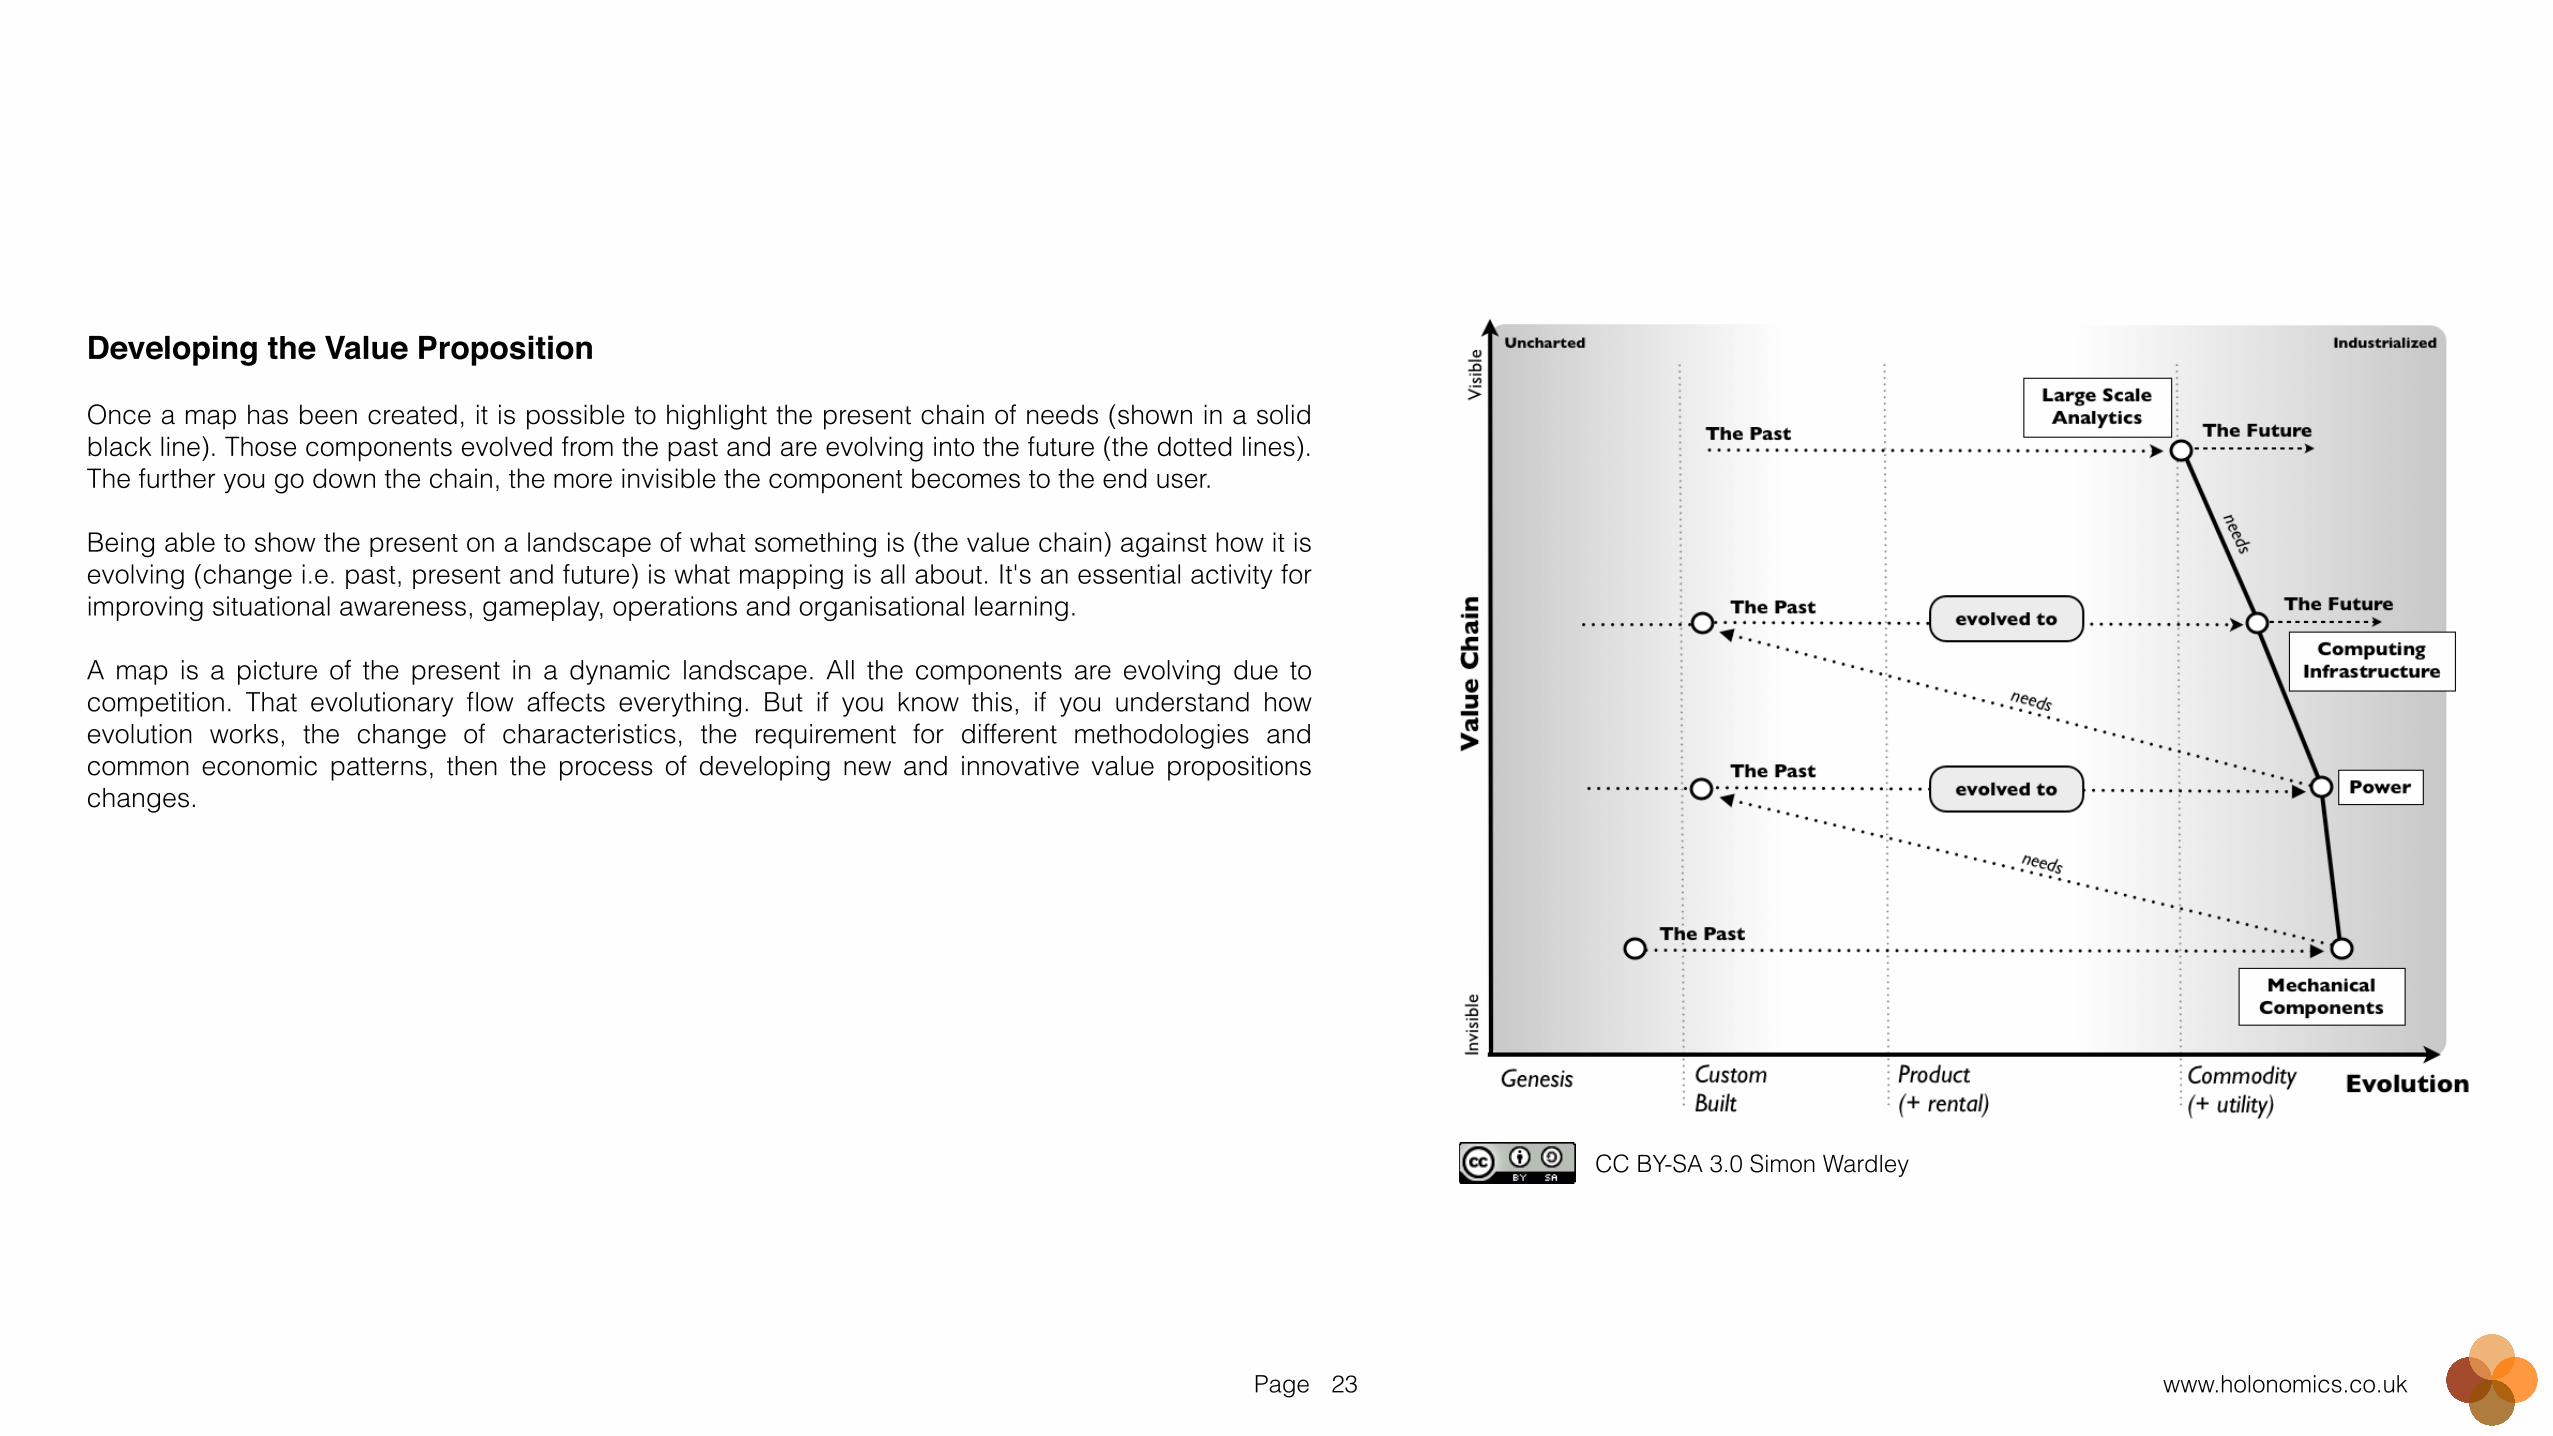
Developing the Value Proposition!!Once a map has been created, it is possible to highlight the present chain of needs (shown in a solid black line). Those components evolved from the past and are evolving into the future (the dotted lines). The further you go down the chain, the more invisible the component becomes to the end user. !Being able to show the present on a landscape of what something is (the value chain) against how it is evolving (change i.e. past, present and future) is what mapping is all about. It's an essential activity for improving situational awareness, gameplay, operations and organisational learning. !A map is a picture of the present in a dynamic landscape. All the components are evolving due to competition. That evolutionary flow affects everything. But if you know this, if you understand how evolution works, the change of characteristics, the requirement for different methodologies and common economic patterns, then the process of developing new and innovative value propositions changes.
CC BY-SA 3.0 Simon Wardley
Page www.holonomics.co.uk24
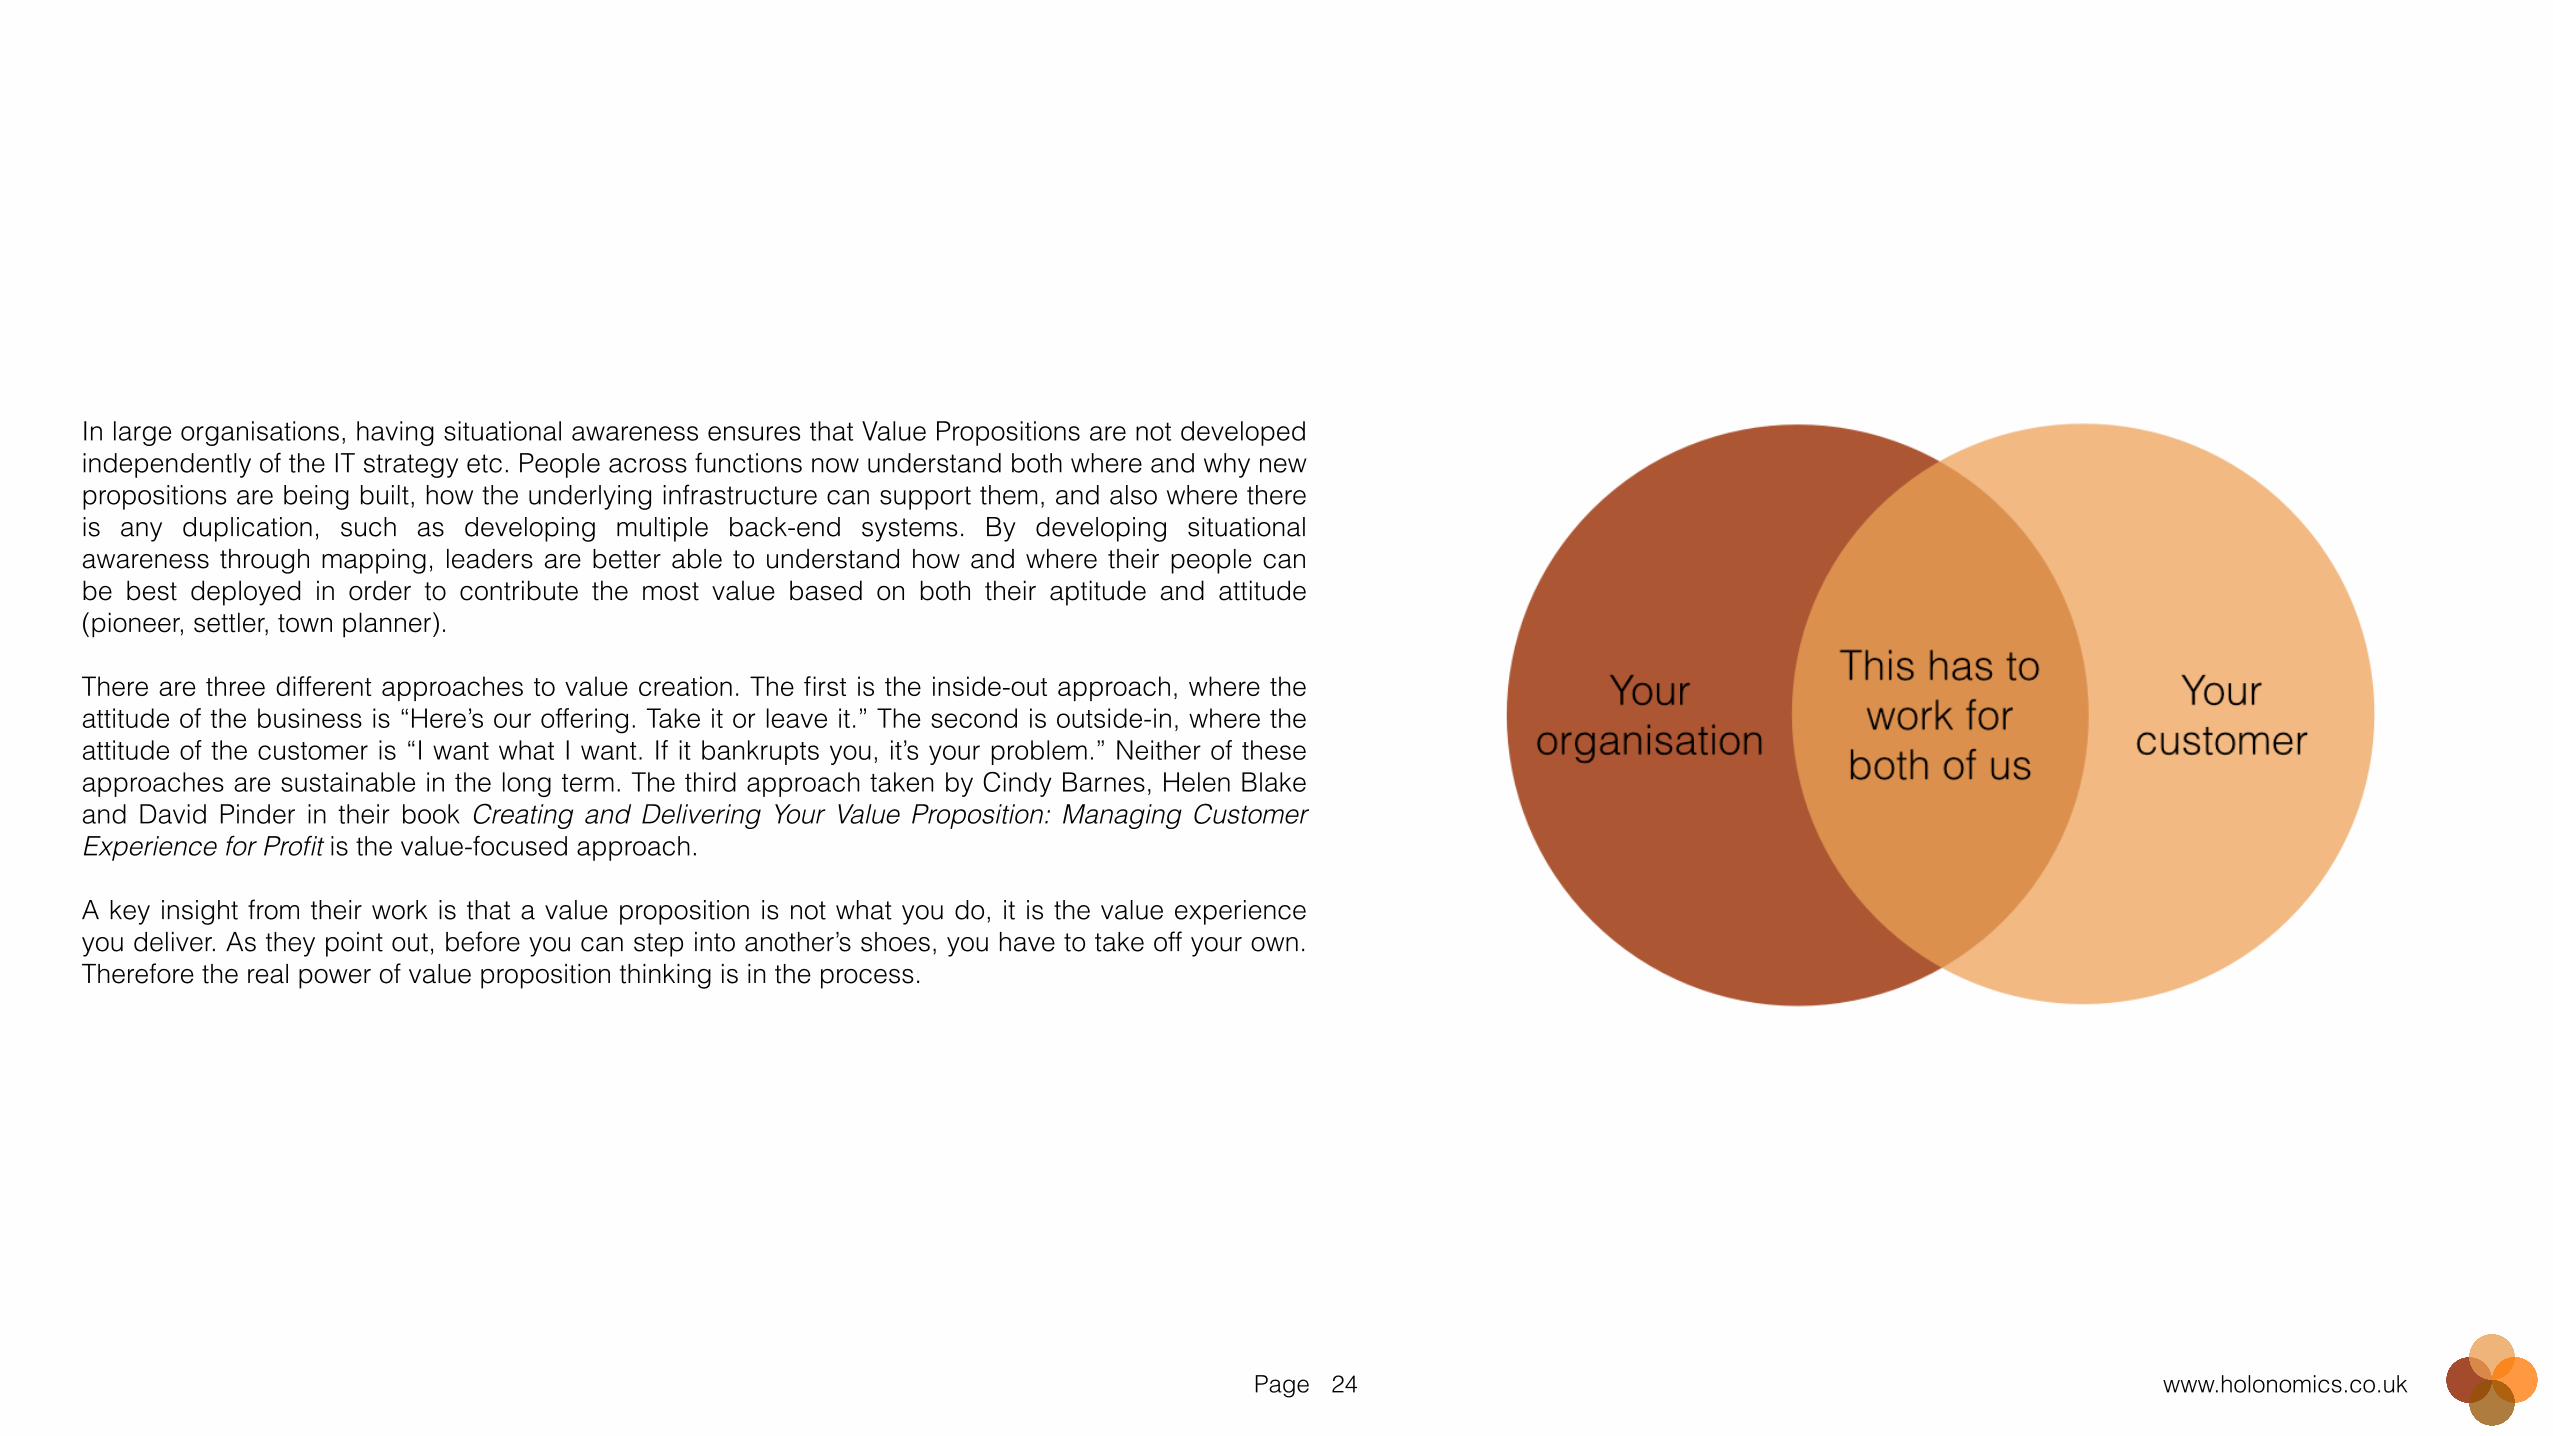
In large organisations, having situational awareness ensures that Value Propositions are not developed independently of the IT strategy etc. People across functions now understand both where and why new propositions are being built, how the underlying infrastructure can support them, and also where there is any duplication, such as developing multiple back-end systems. By developing situational awareness through mapping, leaders are better able to understand how and where their people can be best deployed in order to contribute the most value based on both their aptitude and attitude (pioneer, settler, town planner). !There are three different approaches to value creation. The first is the inside-out approach, where the attitude of the business is “Here’s our offering. Take it or leave it.” The second is outside-in, where the attitude of the customer is “I want what I want. If it bankrupts you, it’s your problem.” Neither of these approaches are sustainable in the long term. The third approach taken by Cindy Barnes, Helen Blake and David Pinder in their book Creating and Delivering Your Value Proposition: Managing Customer Experience for Profit is the value-focused approach. !A key insight from their work is that a value proposition is not what you do, it is the value experience you deliver. As they point out, before you can step into another’s shoes, you have to take off your own. Therefore the real power of value proposition thinking is in the process.
Page www.holonomics.co.uk25
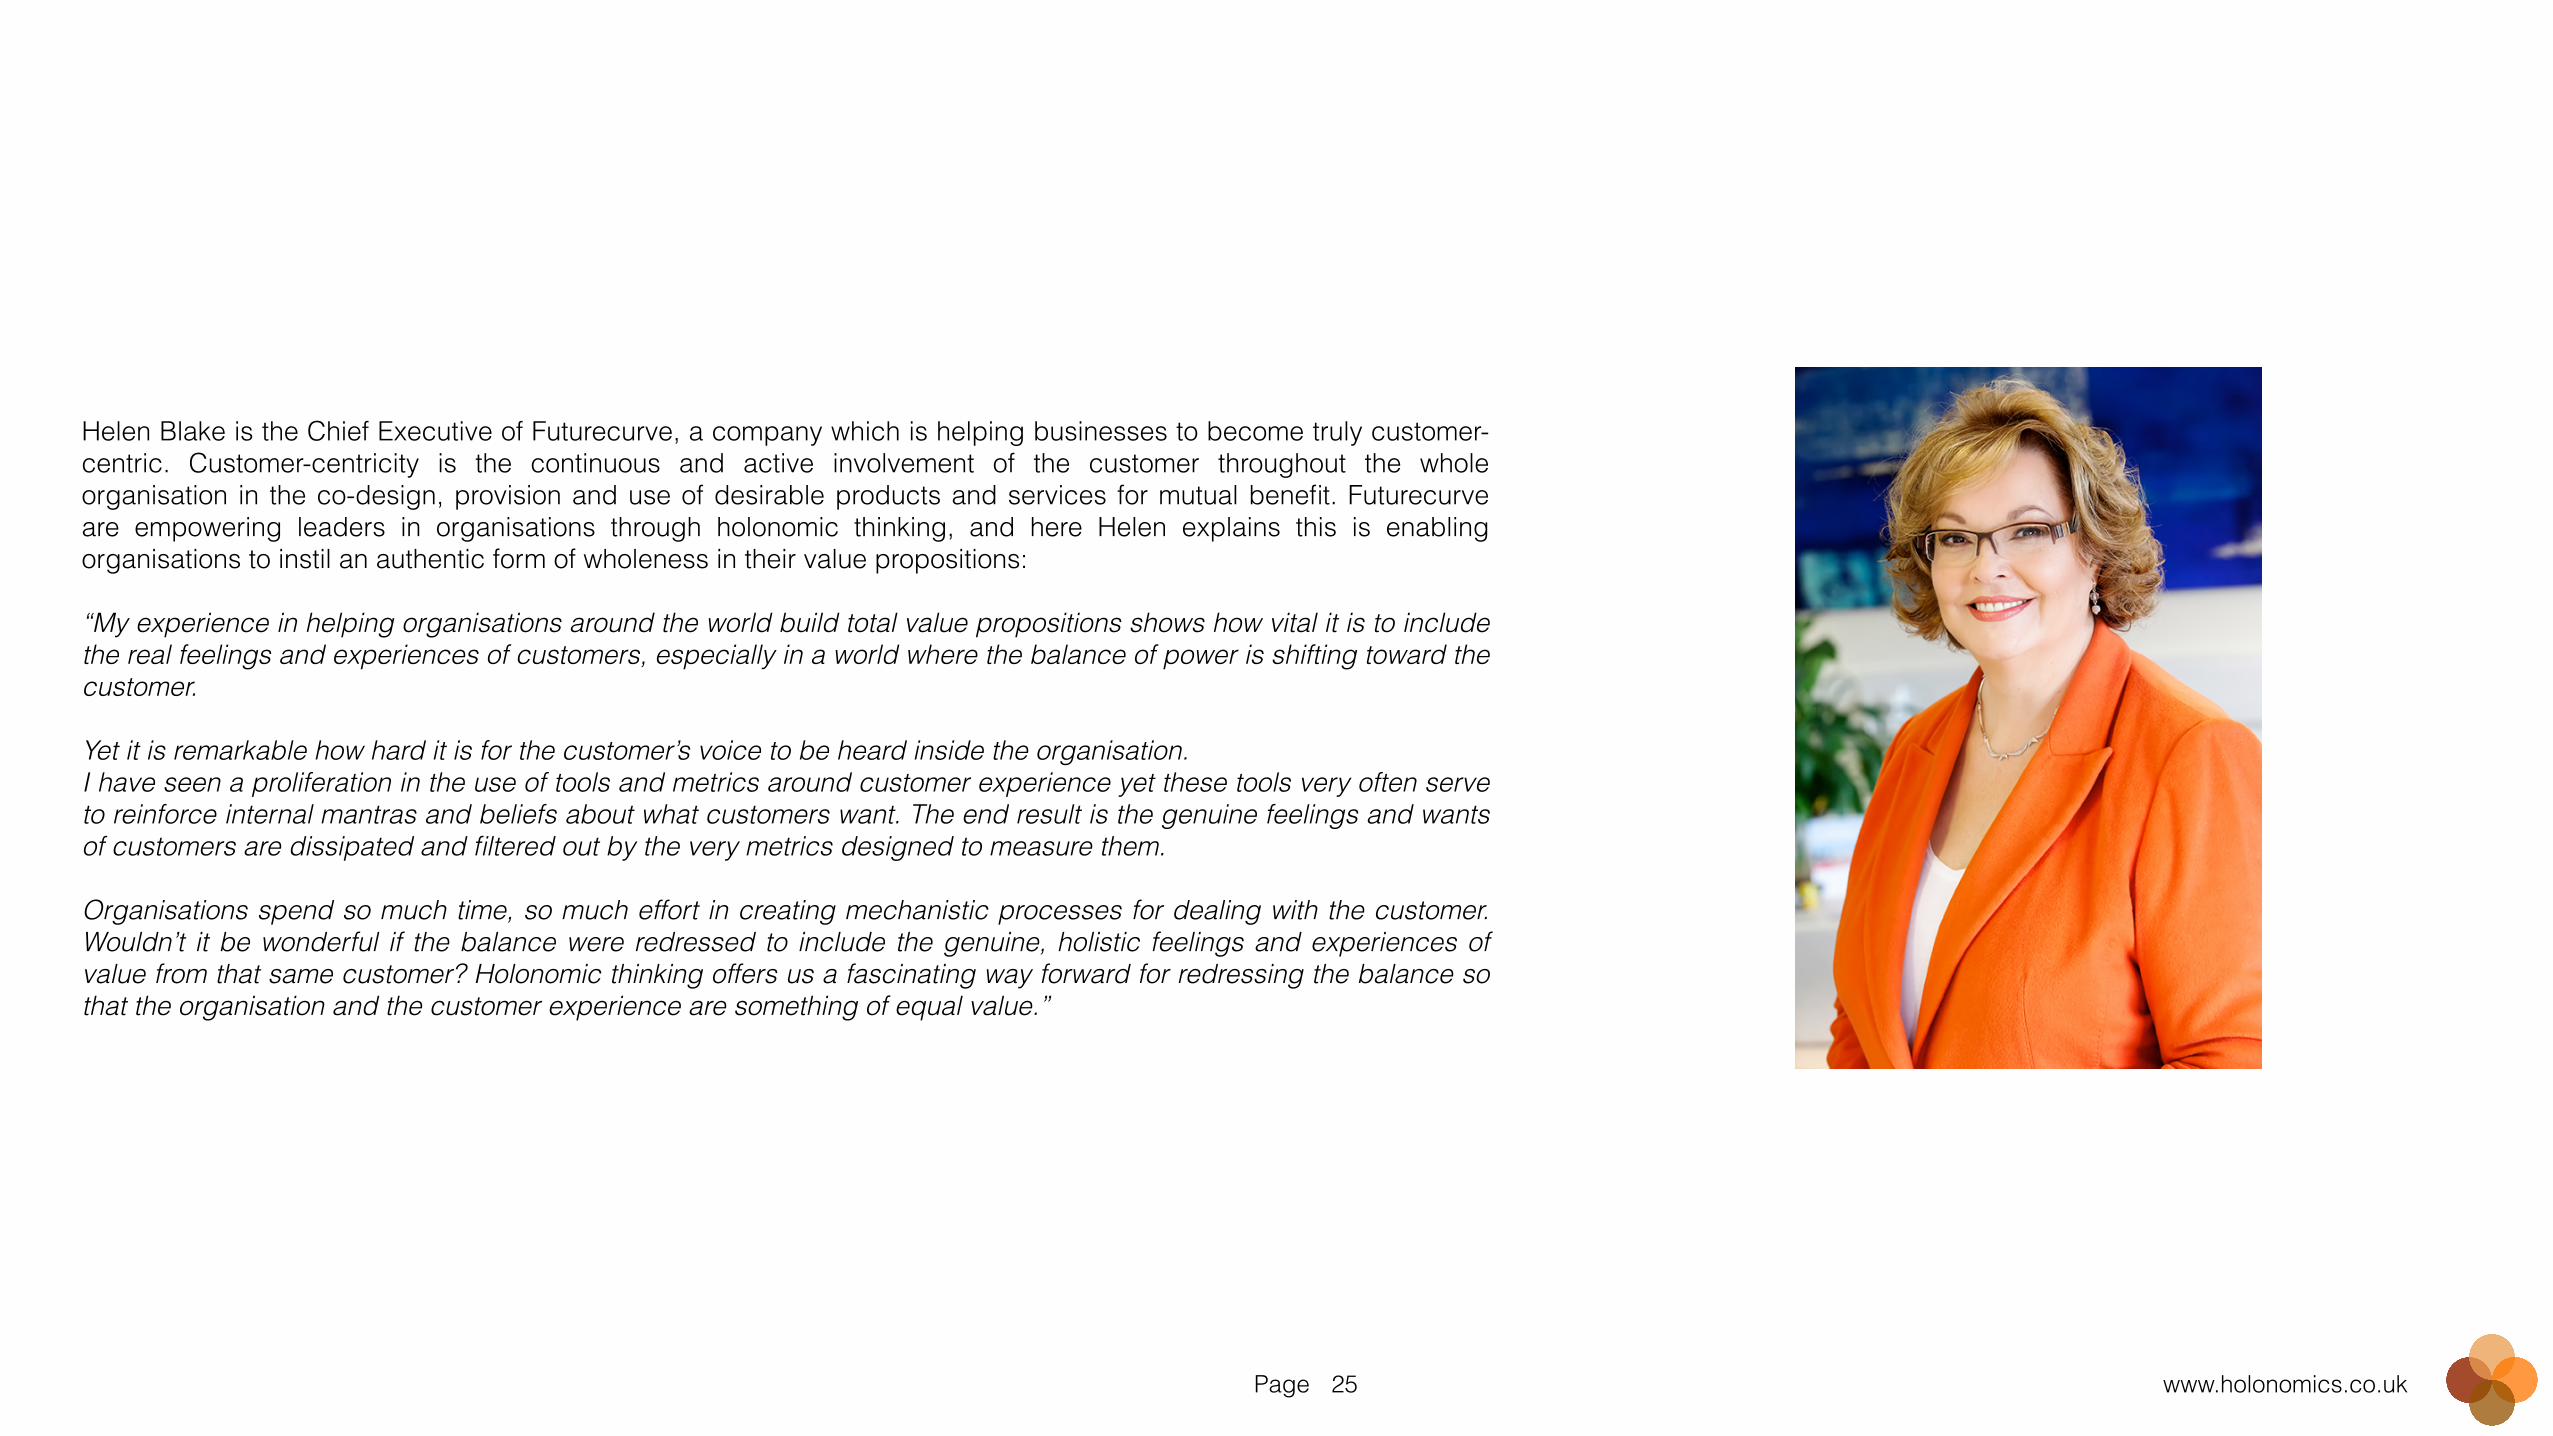
Helen Blake is the Chief Executive of Futurecurve, a company which is helping businesses to become truly customer-centric. Customer-centricity is the continuous and active involvement of the customer throughout the whole organisation in the co-design, provision and use of desirable products and services for mutual benefit. Futurecurve are empowering leaders in organisations through holonomic thinking, and here Helen explains this is enabling organisations to instil an authentic form of wholeness in their value propositions: !“My experience in helping organisations around the world build total value propositions shows how vital it is to include the real feelings and experiences of customers, especially in a world where the balance of power is shifting toward the customer. !Yet it is remarkable how hard it is for the customer’s voice to be heard inside the organisation. I have seen a proliferation in the use of tools and metrics around customer experience yet these tools very often serve to reinforce internal mantras and beliefs about what customers want. The end result is the genuine feelings and wants of customers are dissipated and filtered out by the very metrics designed to measure them. !Organisations spend so much time, so much effort in creating mechanistic processes for dealing with the customer. Wouldn’t it be wonderful if the balance were redressed to include the genuine, holistic feelings and experiences of value from that same customer? Holonomic thinking offers us a fascinating way forward for redressing the balance so that the organisation and the customer experience are something of equal value.”
Page www.holonomics.co.uk26
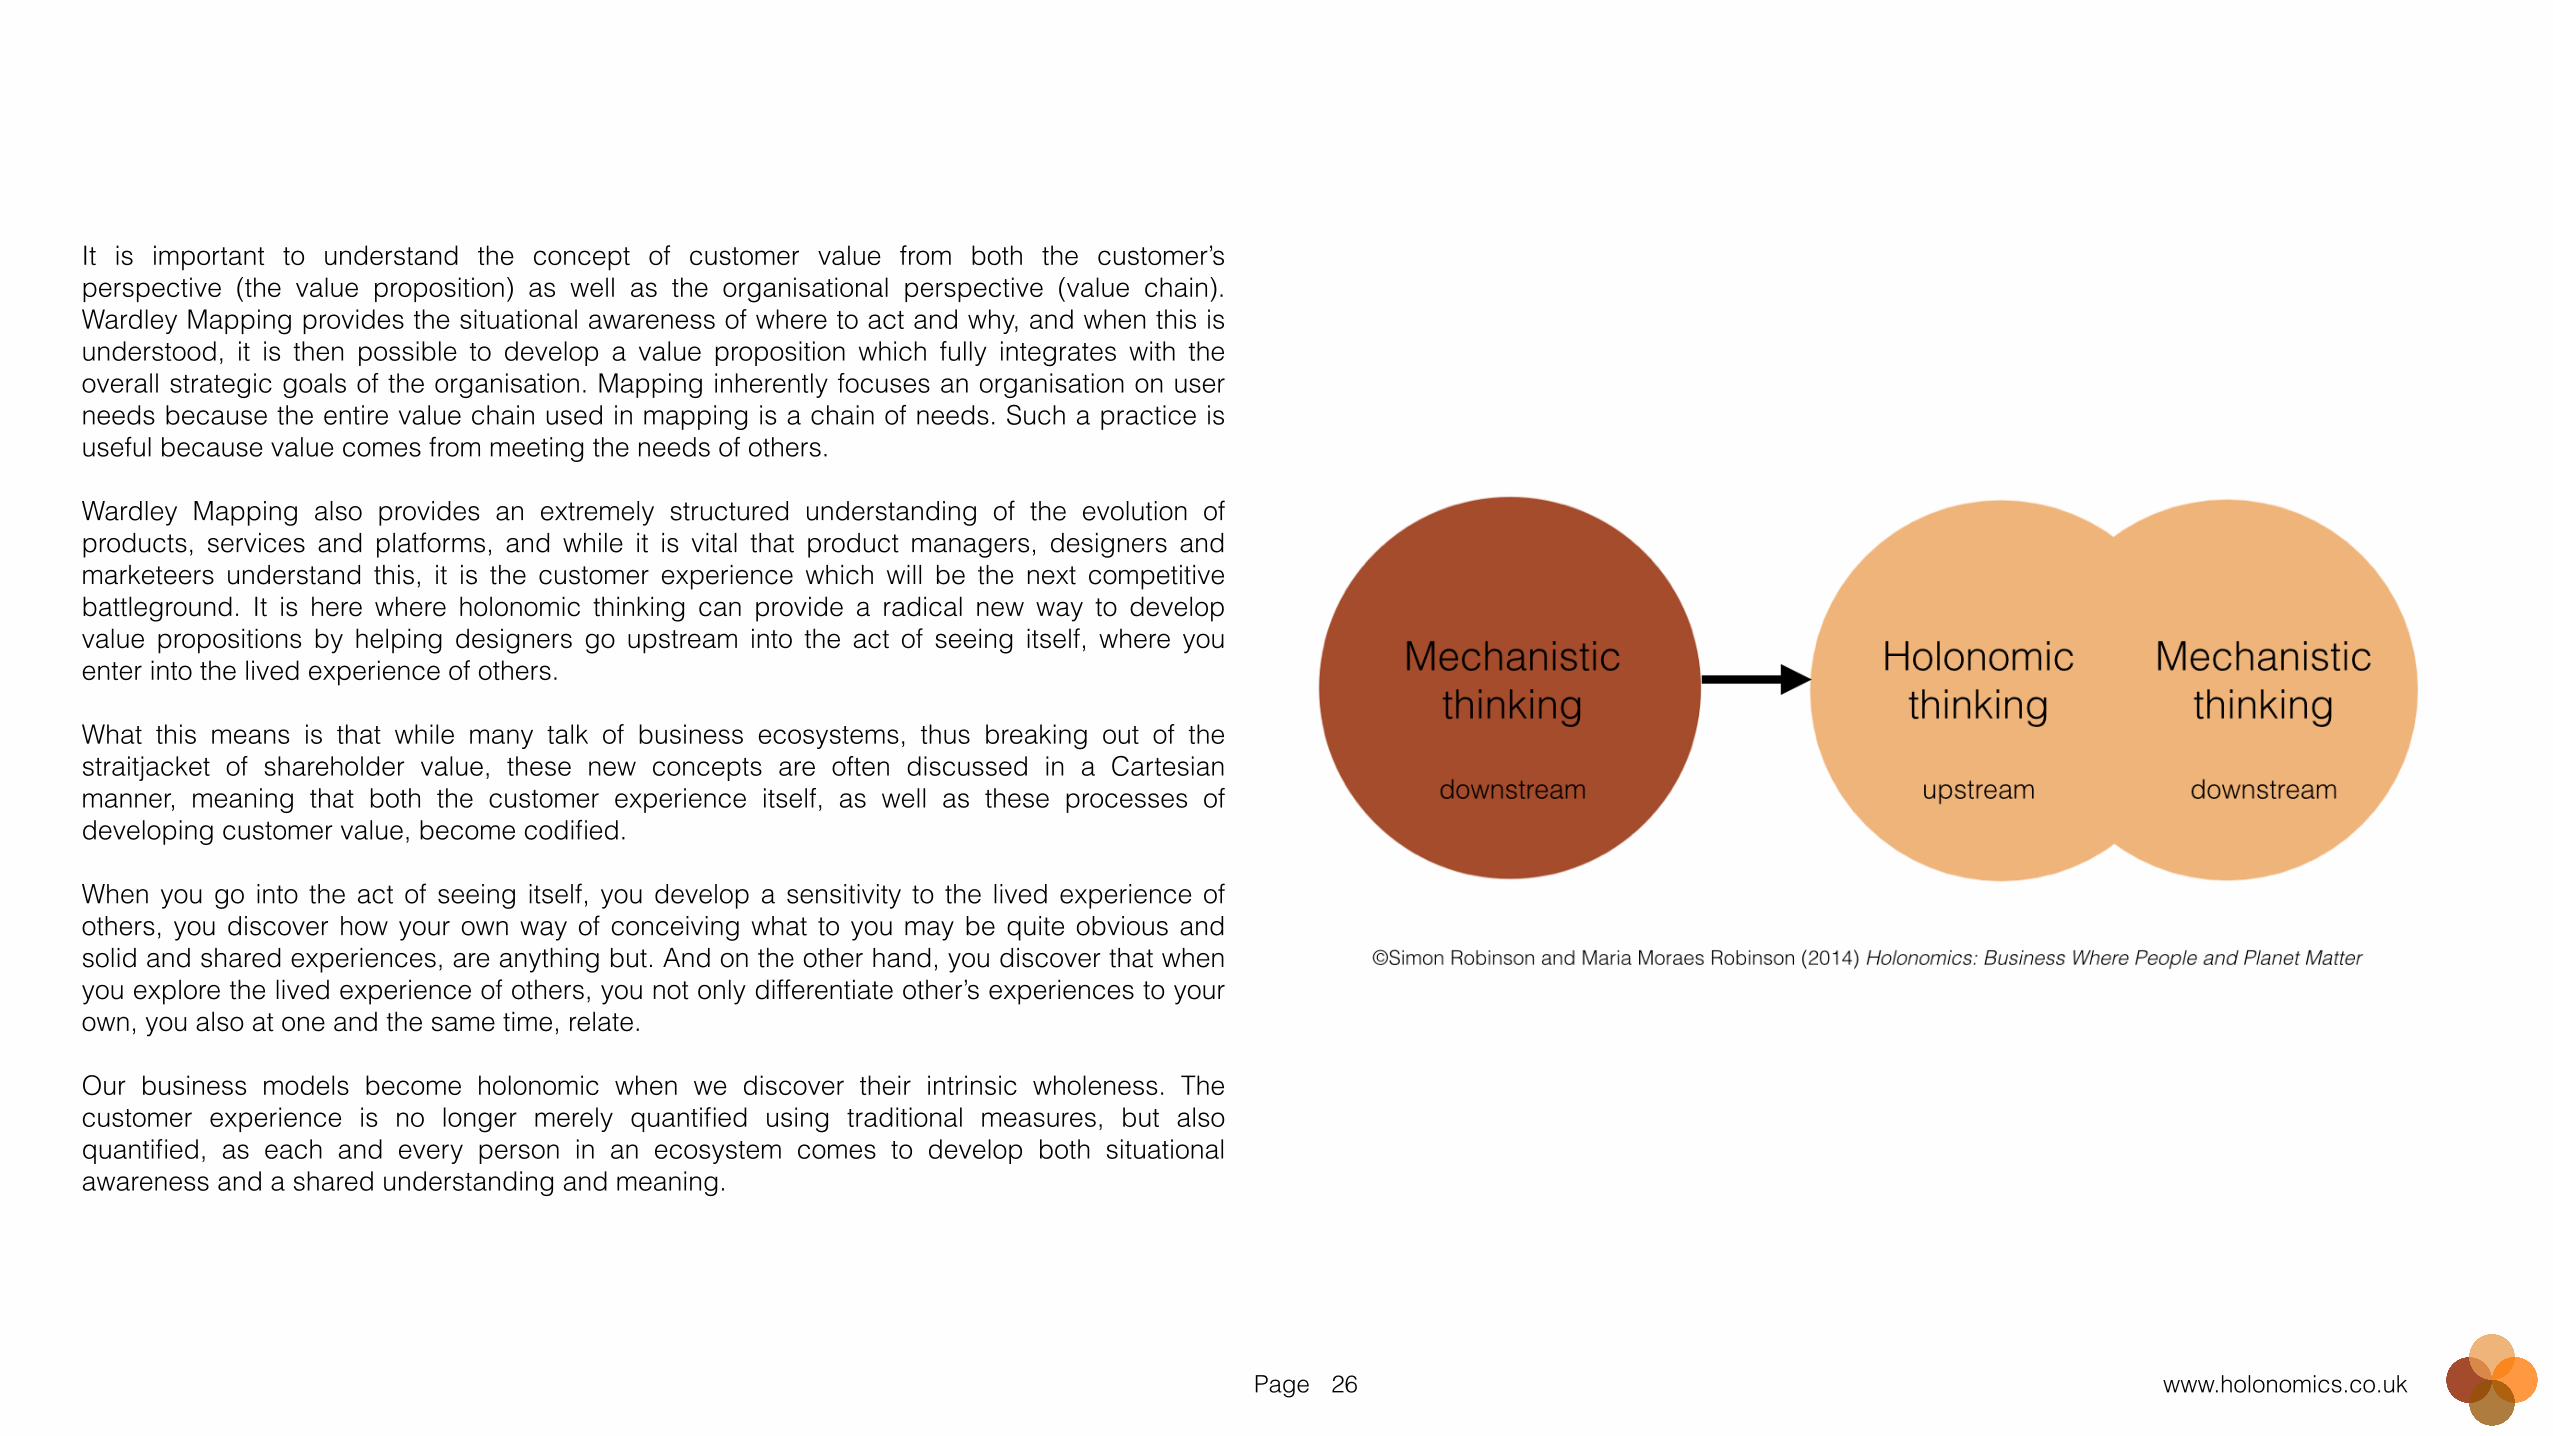
It is important to understand the concept of customer value from both the customer’s perspective (the value proposition) as well as the organisational perspective (value chain). Wardley Mapping provides the situational awareness of where to act and why, and when this is understood, it is then possible to develop a value proposition which fully integrates with the overall strategic goals of the organisation. Mapping inherently focuses an organisation on user needs because the entire value chain used in mapping is a chain of needs. Such a practice is useful because value comes from meeting the needs of others. !Wardley Mapping also provides an extremely structured understanding of the evolution of products, services and platforms, and while it is vital that product managers, designers and marketeers understand this, it is the customer experience which will be the next competitive battleground. It is here where holonomic thinking can provide a radical new way to develop value propositions by helping designers go upstream into the act of seeing itself, where you enter into the lived experience of others. !What this means is that while many talk of business ecosystems, thus breaking out of the straitjacket of shareholder value, these new concepts are often discussed in a Cartesian manner, meaning that both the customer experience itself, as well as these processes of developing customer value, become codified. !When you go into the act of seeing itself, you develop a sensitivity to the lived experience of others, you discover how your own way of conceiving what to you may be quite obvious and solid and shared experiences, are anything but. And on the other hand, you discover that when you explore the lived experience of others, you not only differentiate other’s experiences to your own, you also at one and the same time, relate. !Our business models become holonomic when we discover their intrinsic wholeness. The customer experience is no longer merely quantified using traditional measures, but also quantified, as each and every person in an ecosystem comes to develop both situational awareness and a shared understanding and meaning.
Page www.holonomics.co.uk27
Simon Robinson Holonomics Education
!
!Contact Information!
!!
www.holonomics.co.uk (English) !
www.holonomics.com.br (Portuguese) !
www.transitionconsiousness.org (blog) !
@srerobinson (Twitter) !
https://br.linkedin.com/in/srerobinson (LinkedIn) !