the future saudi cities programme
TRANSCRIPT
The Future Saudi Cities Programme

2
3
CPI PROFILE – Al Baha ©Ministry of Municipal and Rural Affairs , 2019 King Fahd National Library Cataloging-in-Publication Data Ministry of Municipal and Rural Affairs CPI PROFILE Al Baha. / Ministry of Municipal and Rural Affairs .- Riyadh , 2019 ..p ; ..cm ISBN: 978-603-8279-34-2 1- City planning - Al Baha I-Title 309.2625314 dc 1440/8345 L.D. no. 1440/8345 ISBN: 978-603-8279-34-2 © 2018. Ministry of Municipal and Rural Affairs and United Nations Human Settlements Programme. All rights reserved Ministry of Municipal and Rural Affairs P.O. Box : 935 - King Fahd, Riyadh, 11136 Tel: 00966114569999 https://www.momra.gov.sa/ United Nations Human Settlements Programme (UN-Habitat) P.O. Box 30030, 00100 Nairobi GPO KENYA Tel: 254-020-7623120 (Central Office) www.unhabitat.org Disclaimer The designations employed and the presentation of the material in this publication do not imply the expression of any opinion whatsoever on the part of the Secretariat of the United Nations concerning the legal status of any country, territory, city or area or of its authorities, or concerning the delimitation of its frontiers or boundaries. Views expressed in this publication do not necessarily reflect those of the Ministry of Municipal and Rural Affairs, the United Nations Human Settlements Programme, the United Nations or its Member States. Excerpts may be reproduced without authorization, on condition that the source is indicated. ACKNOWLEDGEMENTS Authors: UN-Habitat (Riyadh) Un-Habitat (Nairob) Mr. John Obure Mr. Robert Ndugwa Mr. Mohammed Al Ahmed Mr. Antony Abilla Mr. Bader Al Dawsari Ms. Esther Njiru Mr. Julius Majale Mr. Denis Mwaniki Mr. Dennis Koech Mr. Walter Oriedo The Future Saudi Cities Programme is a jointly implemented project managed by the Deputyship of Town Planning of the Ministry of Municipality and Rural Affairs of the Government of the Kingdom of Saudi Arabia and the United Nations Human Settlements Programme (UN-Habitat).
For UN-Habitat: Mr Robert Lewis-Lettington Mr. Ayman El-Hefnawi Ms Manka Bajaj

4
Introduction
The United Nations Human Settlements Programme (UN-HABITAT) and Ministry of Municipal
and Rural Affairs (MOMRA) in the Kingdom of Saudi Arabia jointly launched the “Future Saudi
Cities Programme (FSCP)”. The UN-HABITAT Office has been providing technical support to
the MOMRA and targets 17 main cities in the Kingdom of Saudi Arabia. The cities include Riyadh,
Makkah, Jeddah, Taif, Medina, Tabouk, Dammam, Qatif, Al Ahsa, Abha, Najran, Jazan, Hail,
Araar, AlBaha, Buraydah, and Sakaka, to respond to national and local urban challenges.
UN-Habitat provides a new approach for measuring urban prosperity: which is holistic, integrated
and essential for the promotion and monitoring of socio-economic development, inclusion and
progressive realization of the urban-related human rights for all. This new approach redirects cities
to function towards an urban future that is economically, politically, socially and environmentally
prosperous. The new approach or monitoring framework, The Cities Prosperity Index (CPI), is a
multidimensional framework that integrates six carefully selected dimensions made up of several
indicators that relate to factors and conditions necessary for a city to thrive and prosper. The six
dimensions include productivity, infrastructure development, equity and social inclusion, quality
of life, environmental sustainability, and urban governance and legislation. The CPI uses the
concept of ‘The Wheel of Urban Prosperity’ and the ‘Global Scale of Urban Prosperity’ to enable
stakeholders to assess achievements in their respective cities. The City Prosperity Index (CPI) not
only provides indices and measurements relevant to cities, but it is also an assessment tool that
enables city authorities, local and national stakeholders, and policy-makers to identify
opportunities and potential areas of intervention for their cities to become more prosperous.
Under the FSCP, UN-HABITAT, MOMRA, and Al Bala Municipality together with its Local
Urban Observatory has been working on developing urban statistics and spatial information
(analyzed through Geographic Information System(GIS)) to provide relevant urban information
that strongly supports evidence-based decision-making process on urban development and urban
planning in the city.
This CPI Profile Report applies the CPI framework and provides a summary of the basic
information and urban statistics about the City and gives an overview of the city’s achievements,
opportunities and potential areas that contribute to its prosperity in areas such productivity,
infrastructure development, quality of life, equity and social inclusion, environmental
sustainability, and urban governance and legislation.
The CPI was developed by UN-Habitat to provide a new approach for measuring urban prosperity:
which is holistic, integrated and essential for the promotion and monitoring of socio-economic
development, inclusion and progressive realization of the urban-related human rights for all. This
new approach redirects cities to function towards an urban future that is economically, politically,
socially and environmentally prosperous. The CPI is a multidimensional framework that integrates
six dimensions made up of several indicators that relate to factors and conditions necessary for a
5
city to thrive and prosper. The six dimensions include productivity, infrastructure development,
equity and social inclusion, quality of life, environmental sustainability, and urban governance and
legislation. The CPI uses the concept of ‘The Wheel of Urban Prosperity’ and the ‘Global Scale
of Urban Prosperity’ to enable cities assess achievements in terms of service delivery to their
residents. The CPI not only provides indices and measurements relevant to cities, but it is also an
assessment tool that enables city authorities, local and national stakeholders, and policy-makers to
identify opportunities and potential areas of intervention for their cities to become more
prosperous.
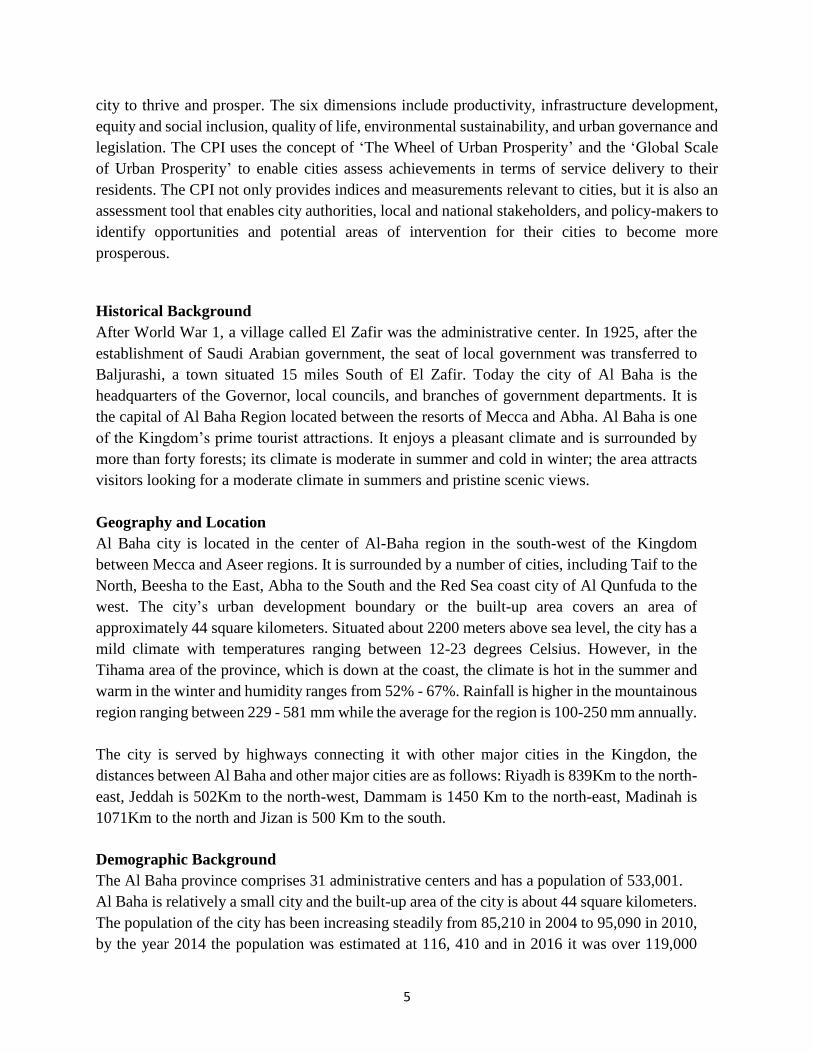
Historical Background
After World War 1, a village called El Zafir was the administrative center. In 1925, after the
establishment of Saudi Arabian government, the seat of local government was transferred to
Baljurashi, a town situated 15 miles South of El Zafir. Today the city of Al Baha is the
headquarters of the Governor, local councils, and branches of government departments. It is
the capital of Al Baha Region located between the resorts of Mecca and Abha. Al Baha is one
of the Kingdom’s prime tourist attractions. It enjoys a pleasant climate and is surrounded by
more than forty forests; its climate is moderate in summer and cold in winter; the area attracts
visitors looking for a moderate climate in summers and pristine scenic views.
Geography and Location
Al Baha city is located in the center of Al-Baha region in the south-west of the Kingdom
between Mecca and Aseer regions. It is surrounded by a number of cities, including Taif to the
North, Beesha to the East, Abha to the South and the Red Sea coast city of Al Qunfuda to the
west. The city’s urban development boundary or the built-up area covers an area of
approximately 44 square kilometers. Situated about 2200 meters above sea level, the city has a
mild climate with temperatures ranging between 12-23 degrees Celsius. However, in the
Tihama area of the province, which is down at the coast, the climate is hot in the summer and
warm in the winter and humidity ranges from 52% - 67%. Rainfall is higher in the mountainous
region ranging between 229 - 581 mm while the average for the region is 100-250 mm annually.
The city is served by highways connecting it with other major cities in the Kingdon, the
distances between Al Baha and other major cities are as follows: Riyadh is 839Km to the north-
east, Jeddah is 502Km to the north-west, Dammam is 1450 Km to the north-east, Madinah is
1071Km to the north and Jizan is 500 Km to the south.
Demographic Background
The Al Baha province comprises 31 administrative centers and has a population of 533,001.
Al Baha is relatively a small city and the built-up area of the city is about 44 square kilometers.
The population of the city has been increasing steadily from 85,210 in 2004 to 95,090 in 2010,
by the year 2014 the population was estimated at 116, 410 and in 2016 it was over 119,000
6
people. The pollution density of the city stands at 2466 people per square kilometers. Al Baha
city is in a region where the population of None Saudi stood at about 13% according to the
2010 census.
Socio-economic Background
Al Baha city is the headquarter of a province well known for its beauty, it has forests, wildlife
areas, valleys and mountains that attract visitors from all parts of the kingdom and the Persian
Gulf area. Al Baha city is one of the Kingdom’s prime tourist attractions which is surrounded
by more than forty forests, valleys, and mountains. The Sharif of Mecca called it the garden of
Hijaz area. The city is also very famous for the production of high quality of honey, in 2010
the city hosted the third International Honey Festival which was attended by farmers and people
from 10 Arab states producing honey. The city also hosts the Al-Baha Tourism Festival which
takes place every summer and holds a number of activities and sports events, as well as a
number of cultural, literary and religious programs. Equestrian and Olympic marathon
activities, as well as air shows, are also available during the festival. The region is rich in
ancient mining sites which were among the major gold mining areas in the kingdom.
City Prosperity Index (CPI) Assessment
Prosperity implies success, wellbeing, thriving conditions, safety and security, long life etc.
Prosperity in cities therefore is about successfully meeting today’s needs without compromising
tomorrow and working together for a smart, competitive economy, in a socially inclusive society
and a healthy, vibrant environment for individuals, families, and communities. Prosperity in cities
is a process and cities can be at different levels of prosperity. To measure the level and track how
cities progress on the path to becoming more prosperous, UN-Habitat introduced a monitoring
framework: The Cities Prosperity Index (CPI). The CPI is a composite index with six carefully
selected dimensions that captures all important elements of a prosperous city. This index along
with a conceptual matrix, The Wheel of Urban Prosperity and a Global Scale of City Prosperity,
are intended to help city authorities, decision-makers, partners and other stakeholders to use
existing evidence and formulate clear policies and interventions for their cities.
7
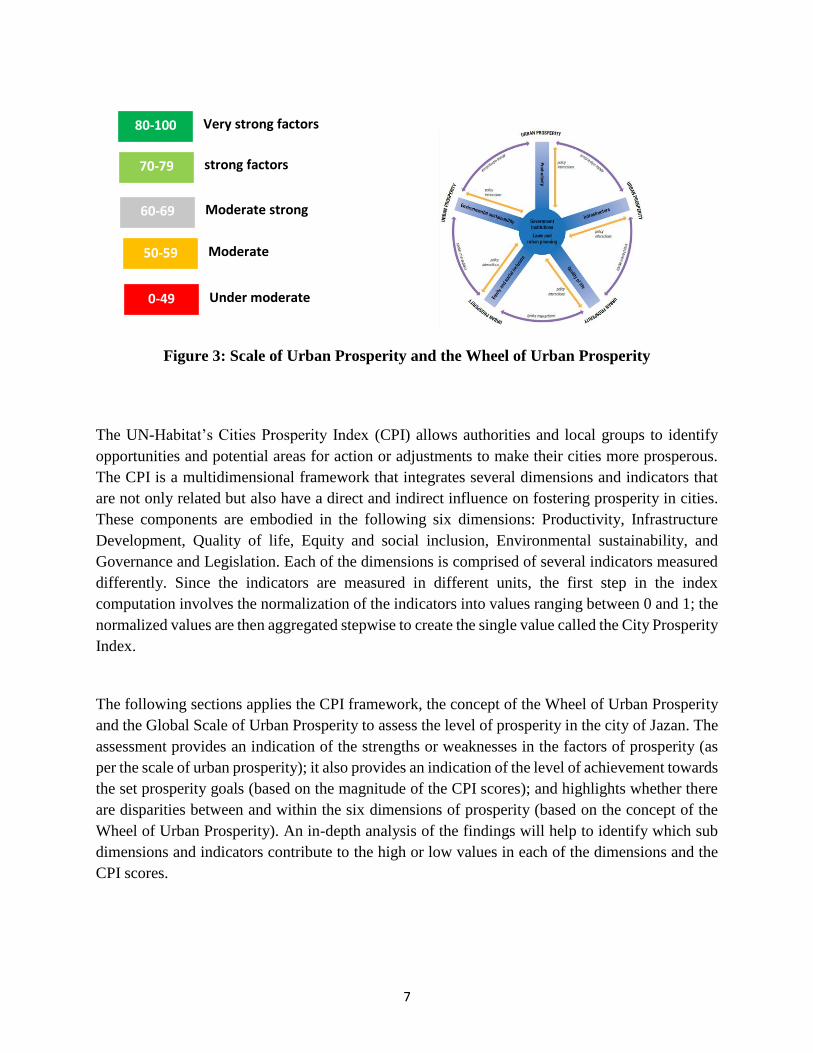
Figure 3: Scale of Urban Prosperity and the Wheel of Urban Prosperity
The UN-Habitat’s Cities Prosperity Index (CPI) allows authorities and local groups to identify
opportunities and potential areas for action or adjustments to make their cities more prosperous.
The CPI is a multidimensional framework that integrates several dimensions and indicators that
are not only related but also have a direct and indirect influence on fostering prosperity in cities.
These components are embodied in the following six dimensions: Productivity, Infrastructure
Development, Quality of life, Equity and social inclusion, Environmental sustainability, and
Governance and Legislation. Each of the dimensions is comprised of several indicators measured
differently. Since the indicators are measured in different units, the first step in the index
computation involves the normalization of the indicators into values ranging between 0 and 1; the
normalized values are then aggregated stepwise to create the single value called the City Prosperity
Index.
The following sections applies the CPI framework, the concept of the Wheel of Urban Prosperity
and the Global Scale of Urban Prosperity to assess the level of prosperity in the city of Jazan. The
assessment provides an indication of the strengths or weaknesses in the factors of prosperity (as
per the scale of urban prosperity); it also provides an indication of the level of achievement towards
the set prosperity goals (based on the magnitude of the CPI scores); and highlights whether there
are disparities between and within the six dimensions of prosperity (based on the concept of the
Wheel of Urban Prosperity). An in-depth analysis of the findings will help to identify which sub
dimensions and indicators contribute to the high or low values in each of the dimensions and the
CPI scores.
80-100 Very strong factors
70-79 strong factors
60-69 Moderate strong
50-59 Moderate
0-49 Under moderate
8
Data Challenges and Solutions.
One of the biggest challenges facing CPI implementation work is the unavailability of data at the
city level. The problem is compounded by the fact that most statistics officially produced in Saudi
Arabia are at regional level and are not segregated by rural and urban i.e. city boundaries are not
considered. The other problem is that CPI contains some unique indicators that have not been part
of the list of indicators generally produced in standard official reports. For example, city GDP, the
share of renewable energy and length of mass public transport system etc. Such indicators do not
have any official data sources. However, the indicators are very important, for example, mass
public transport system is very important for a large city but all cities in Saudi Arabia do not have
proper public transport system; the level of usage of the available public bus transport system is
also very low.
In situations like this, instead of giving all cities scores of zeros to make it a constant in the dataset,
we have decided to exclude them to avoid underestimation of the CPI and the computational
challenges that come with zeros where calculations involve roots of numbers.
For the same reason of data unavailability, the Governance and legislation dimension was not
included. The following indicators were not included as well: Economic specialization, Access to
improved water, Sufficient living area, Average broadband speed, Length of mass public transport
system, Mean years of schooling, Access to public spaces, Gini coefficient, Poverty rate, Slum
households, Youth unemployment rate, PM10, PM2.5, CO2 emission, Share of renewable energy
consumption, Public spaces for youth and solid waste collection.
Due to variations in the number of indicators included for different cities, it is not accurate to do a
blanket comparison of the level of prosperity between cities. It is, therefore, advisable to look at
each city individually and maybe compare dimensions or sub-dimensions where a same number
of indicators are used. The indicator list will continue to be refined and more data collected so that
the missing indicators can be included in future CPI analysis, and then comparisons between cities
will be more accurate at all levels.
In the interest of reliability and accurate estimations, it is better to include few reliable and accurate
indicator so that the result of the CPI can reliably be used in decision making, and policy
formulation to avoid ending up with any form of misguided interventions. In this case, therefore,
it is advisable that conclusions and recommendations can be made based on the dimensional or
sub-dimensional indices.
The Overall City Prosperity Index
As a measure of the level of prosperity in the city, the index value is an aggregate of many
indicators and therefore to achieve a better understanding of the index value it must be analyzed
stepwise back to the individual indicators. The findings show that the overall CPI index for the
9
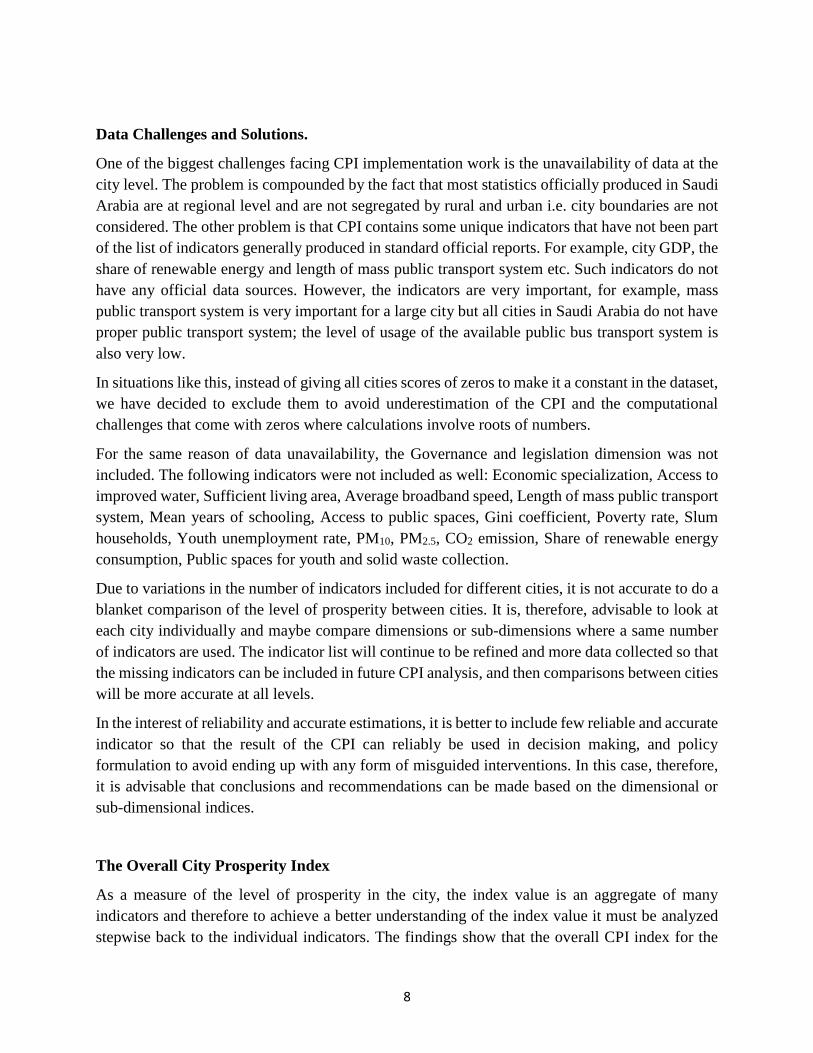
city is 60.2%. Due to the fewer number of dimensions, the overall CPI may appear higher or lower
than similar or cities at the same level of development. At 60.2% the overall index for the city is
moderately strong, suggesting that the urban policies need to be strengthened since they are
generally good. The five dimensions used are shown in the radar chart, the blue line represents the
dimensional indices and the orangeline represent the overall index or the mean. The chart in figure
2 shows that Quality of life dimension and Equity and social inclusion dimension have a score of
75.7% and 71.6%, respectively; on the prosperity scale this implies that the two dimensions have
strong factors of prosperity. Therefore, it is advisable that urban policies and interventions
regarding equity and social inclusion, and quality of life in the city of Al Baha should be
consolidated, it is also important to find out if there are any sub-dimensions or indicators within
the dimensions that may need strengthening to further improve the quality of life and equity in the
city. The Infrastructure development index is 61.9% and this is moderately strong, therefore it
needs to be strengthened.
The dimensions of Productivity and Environmental sustainability have 42.5% and 49.3%
respectively. According to the prosperity scale, the two dimensions are weak, therefore, urban
policies regarding productivity and environmental sustainability in the city should be prioritized
for strengthening to make them improve; urban policies and interventions regarding any sub-
dimensions or indicators within these two dimensions that may be found to be weaker should also
be prioritized.
Figure 2: City Prosperity Index Dimensions
The subsequent sections following this analysis of the overall index will further analyze and
deconstruct the four dimensions individually and identify any areas of strengths and weaknesses
so that appropriate recommendations and interventions can be formulated.
42.5%
61.9%
75.7%
71.6%
49.3%
Productivity
Infrastructure
Development
Quality of LifeEquity and Social
Inclusion
Environmental
Sustainability

10
The Productivity Dimension
The productivity dimension contains three sub-dimensions which are all included in the index, but
due to data issues, two indicators namely informal employment rate and economic specialization
were not included. They are important indicators to keep in the list for future computations of the
CPI should reliable data become available. The productivity dimension measures the city’s
efficiency in the creation of wealth for its people; it measures how cities contribute to economic
growth and development, generate income, employment and provide equal opportunities and good
living standards for its entire population. The figure below shows the scores for all the indicators
used.
Table 1: Productivity Index (42.5%)
Sub-Dimension Indicator Actual Units Standardized Comments
Economic Strength
(63.4%)
City Product per Capita 16,544.00 USD (PPP)
/ Inhabitants 62.5% M. Strong
Mean Household Income 30,518.40 USD(PPP) 62.9% M. Strong
Old Age Dependency Ratio 7.37 % 64.8% M. Strong
Employment
(59.4%)
Employment to Population
Ratio 50.42 % 44.8%
Under
moderate
Informal Employment 7.70 - 100.0% V. Strong
Unemployment Rate 12.12 % 33.4% Under
moderate
Economic
Agglomeration
(4.8%)
Economic Density 40,803,738 USD (PPP)
/Km2 4.8%
Under
moderate
Economic Specialization - -
The findings indicate that the productivity index is under moderate at 42.5%, going by the global
scale of prosperity, productivity is rated as under moderate, which means factors/policies relating
to the economic productivity of the city are not working well and should be prioritized for revision.
Consequently, it becomes apparent to find out which sub-dimensions and indicators contributes to
this weakness. The table shows that economic strength sub-dimension is moderately strong
(63.4%), withan almost perfect balance among its indicators. All the three indicators are
moderately strong and should be strengthened equally.
The findings in the table also indicate that the employment situation in the city is moderate with
an index of 59.4%, generally, this is fairly low therefore there is need to strengthen urban policies
and interventions relating to employment in the city. Particular attention should be focused on
strengthening urban policies targeting the high unemployment rate which currently stands at
12.12% and employment to population ratio (50.42%). These two indicators are important in
showing people’s access to employment and the ability of the city to create employment for its
people, respectively – the strength of the two indicators is key for the economic development of
the city.

11
Figure 3: Productivity Indicators
The other measure of the level of productivity and that which contributed to the lowering of the
low productivity index is economic agglomeration with a score of 4.8%. Economic density is a
measure of how economic productivity is distributed spatially, it is associated with the
concentration of economic activities per unit area which has cost-saving benefits to businesses
resulting from spatial proximity between suppliers, retailers, customers, service providers etc. Low
economic densities may mean long distances between suppliers or providers and consumers
leading to high unit costs in all production processes. It may also mean a high level of urban sprawl
in the city. Low economic agglomerations imply the lack of the benefits that come when firms and
people are located together near one another in cities and industrial clusters (high densities of
people and firms together).
The Infrastructure Development Dimension
Adequate and efficient infrastructure is one of the means to manage the adverse effects of rapid
urbanization which require faster means for moving goods, services, information and people
around the city, which is key for the functioning of the city and its economic development.
Prosperous cities continue to strive to achieve this by improving the quality of infrastructure
relating to housing, social, ICT, mobility, street network, health, education and so on. The
infrastructure dimensional index, therefore, helps to assess the level of achievements regarding
such goals. The findings show that the overall index for the infrastructural development is 61.9%,
which is just moderately strong according to the global scale of city prosperity thus it is not yet
good enough or very strong. It is imperative therefore to find out which specific sub-dimensions
and indicators are pulling down the means score; this will make it easier to pinpoint the areas of
weaknesses which may need prioritization.
The housing infrastructure sub-dimensional index is 78.9%, this means the urban policies
governing the housing sector are strong and therefore needs to be consolidated and strengthened.
The indicators within the sub-dimension that are still under moderate, for example, the population
density which is extremely low, should be prioritized for review and urban policies and
interventions relating to such indicators should be reviewed.
62.5% 62.9% 64.8%
44.8%
100.0%
33.4%
4.8%
City Product per
Capita
Mean Household
Income
Old Age Dependency Employment to
Population ratio
Informal Employment Unemployment Rate Economic Density
Economic Strenght Employment Economic
Agglomeration
12
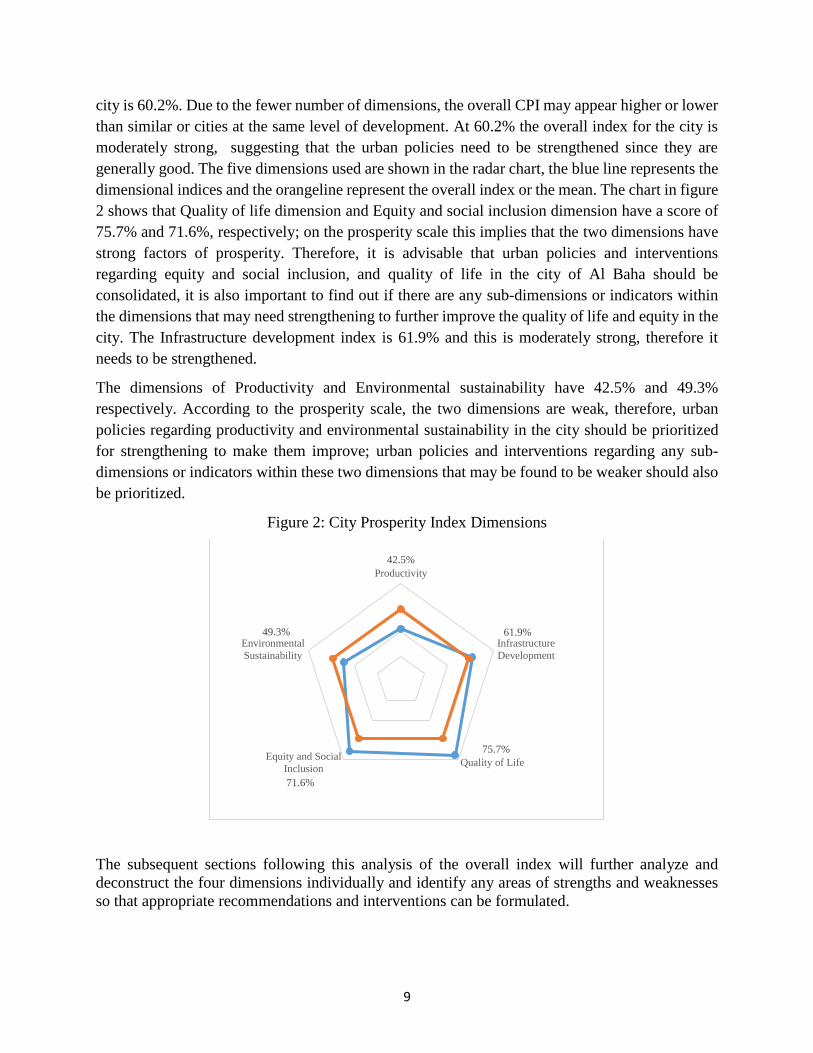
The social infrastructure dimensional index is also under moderate, 28.1%. It is therefore important
to prioritize urban policies relating to social infrastructural development in the city.
Table 2: Infrastructure Development Index (61.9%)
Sub-Dimension Indicator Actual Units Standardized Comments
Housing
Infrastructure
(78.9%)
Access to Electricity 100.00 % 100.0% V. Strong
Access to Improved
Sanitation - % - -
Access to Improved Water 99.30 % 99.3% V. Strong
Access to Improved Shelter 100.00 % 100.0% V. Strong
Population Density 2,466.38 Inhabitants
/Km2 16.4%
Under
moderate
Sufficient Living Area - % - -
Social
Infrastructure
(28.1%)
Number of Public Libraries 0.84 #/100,000
inhabitants. 0.0%
Under
moderate
Physician Density 2.59 #/1,000
inhabitants. 56.3% moderate
ICT (83.3%)
Average Broadband Speed - Mbps - -
Home Computer Access 73.33 % 73.3% M. Strong
Internet Access 93.33 % 93.3% V. Strong
Urban Mobility
(73.1%)
Average Daily Travel Time 16.70 minutes 100.0% V. Strong
Affordability of Transport 0.00 % 100.0% V. Strong
Length of Mass Transport
Network -
Km/1M
Inhabitants. - -
Road Safety (traffic
fatalities) 25.18
#/100,000
inhab. 19.4%
Under
moderate
Use of Public Transport - % - -
Street
Connectivity
(45.9%)
Intersection Density 59.35 #/km2 59.4% moderate
Land Allocated to Streets 13.98 % 26.6% Under
moderate
Street Density 10.34 Km/KM2 51.7% moderate
ICT plays a key role in driving the world economy today especially in relation to technological
innovations which depends highly on knowledge and access to information, access to home
computers and the internet are very important in this regard. The ICT sub-dimension measures the
level of achievement in making an efficient and accessible ICT infrastructure available to the
public. The ICT sub-dimensional index is 83.3%, meaning the available ICT infrastructure and
associated policies are generally good and need to be consolidated, there is always room for further
improvements.

13
Figure 4: Infrastructure Development Indicators
Figure 4: Infrastructure Development Indicators
Efficient urban mobility system with adequate street network allows timely and cost-effective
movement of people, goods, and services, which is a very critical factor in commerce and industrial
development as well as social interactions and exchanges within the city. Some Urban mobility
100.0% 99.3% 100.0%
16.4%
0.0%
56.3%
73.3%
93.3% 100.0% 100.0%
19.4%
59.4%
26.6%
51.7%
Access to
Electricity
Access to
Improved
Water
Improved
Shelter
Population
Density
Number of
Public
Libraries
Physicians
Density
Home
Computer
Access
Internet
Access
Average
Daily Travel
Time
Affordability
of Transport
Traffic
Fatalities
Intersection
Density
Land
Allocated to
Streets
Street
Density
Housing Infrastructure Social Infrastructure Urban Mobility Street Connectivity
100.0% 99.3% 100.0%
16.4%
56.3%
0.0%
93.3%
73.3%
100.0%
19.4%
100.0%
59.4%51.7%
26.6%
Imp
rove
d S
he
lter
Acc
ess
to Im
pro
ved
Wat
er
Acc
ess
to E
lect
rici
ty
Po
pu
lati
on
Den
sity
Ph
ysic
ian
Den
sity
Nu
mb
er
of
Pu
blic
Lib
rari
es
Inte
rne
t A
cces
s
Ho
me
Co
mp
ute
r A
cce
ss
Ave
rage
Dai
ly T
rave
l Tim
e
Traf
fic
Fata
litie
s
Aff
ord
abili
ty o
f Tr
ansp
ort
Stre
et In
ters
ecti
on
De
nsi
ty
Stre
et D
ensi
ty
Lan
d A
lloca
ted
to
Str
eet
s
Housing Infrastructure SocialInfrastructure
ICT Infrastructure Urban Mobility Street Connectivity
14
indicators for the city could not be included due to data availability issues, the indicators such as
Length of Mass Transport Network, the use of public transport and affordability of Public
Transport are still very important. Based on the available indicators, the sub-dimensional index for
urban mobility is 73.1% and the index for street connectivity is 45.9%, which means the city has
strong urban mobility factors, but the streets connectivity factors are still under moderate. Under
urban mobility, road safety factors are the main cause of problems while on the other hand, all
factors of street connectivity are moderate or under moderate. Therefore, all street connectivity
factors need to be priorities and road safety need to be improved as well.
The Quality of Life Dimension
Life in the city can sometimes be very miserable especially when people are not able to access
basic services, when people feel insecure and when faced with health risk situations. In situations
like this people don’t live long and are not productive. Cities striving for higher prosperity must
ensure that all factor that contributes to the wellbeing and good standard of living such as health
care, education, safety and security and public spaces are available and are easily accessible to the
city dwellers. The quality of life dimension index measures the level of availability vis-a-vis access
to these services. Although due to data unavailability problems, some indicators were not included
in the index and measures were taken to ensure that the available data give a representative picture.
Among the indicators excluded were Mean years of schooling and Accessibility to open public
space. They still remain very key indicators, so efforts should be made to make them available so
that they can be used in future CPI estimations.
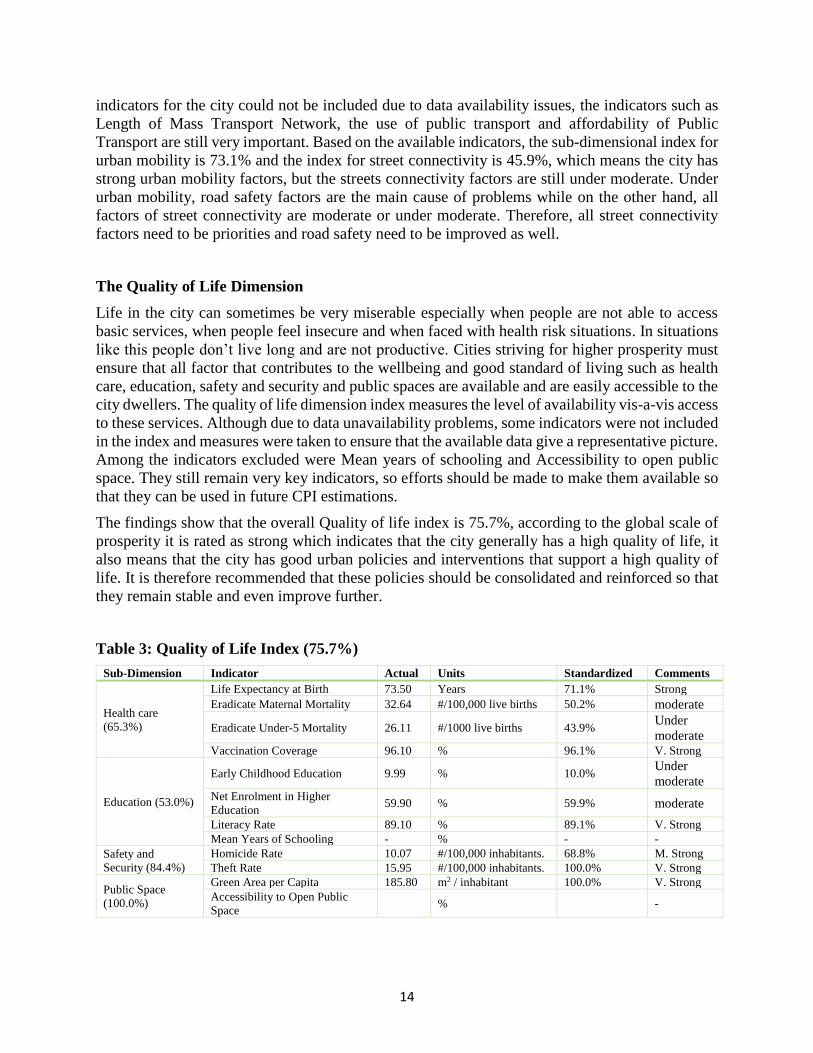
The findings show that the overall Quality of life index is 75.7%, according to the global scale of
prosperity it is rated as strong which indicates that the city generally has a high quality of life, it
also means that the city has good urban policies and interventions that support a high quality of
life. It is therefore recommended that these policies should be consolidated and reinforced so that
they remain stable and even improve further.
Table 3: Quality of Life Index (75.7%)
Sub-Dimension Indicator Actual Units Standardized Comments
Health care
(65.3%)
Life Expectancy at Birth 73.50 Years 71.1% Strong
Eradicate Maternal Mortality 32.64 #/100,000 live births 50.2% moderate
Eradicate Under-5 Mortality 26.11 #/1000 live births 43.9% Under
moderate Vaccination Coverage 96.10 % 96.1% V. Strong
Education (53.0%)
Early Childhood Education 9.99 % 10.0% Under
moderate Net Enrolment in Higher
Education 59.90 % 59.9% moderate
Literacy Rate 89.10 % 89.1% V. Strong
Mean Years of Schooling - % - -
Safety and
Security (84.4%)
Homicide Rate 10.07 #/100,000 inhabitants. 68.8% M. Strong
Theft Rate 15.95 #/100,000 inhabitants. 100.0% V. Strong
Public Space
(100.0%)
Green Area per Capita 185.80 m2 / inhabitant 100.0% V. Strong
Accessibility to Open Public
Space % -

15
The findings in table 3 also show that based on the available data the healthcare sub-dimensional
index is 65.3%, this is moderately strong and implies that the city has moderately good health care
policies that support availability and access to healthcare services. It is therefore recommended
that the policies should be strengthened. Health care indicators such as life expectancy and
vaccination coverage are very strong and the city can build from this as the foundation for a better
healthcare sector. However, under-five mortality rate and the maternal mortality rate is very low
and needs to be prioritized for improvements.
Figure 5: The Quality of Life Indicators
The findings also show that education sub-dimension has an index of 53% and according to the
global scale of prosperity this is moderate. Since the literacy rate in the city is very high with a
score of 89.1%, the observed weakness could be associated with low early childhood enrolment
rate which is low at 10%. It is therefore recommended that generally, all urban policies and
interventions relating to education should be reviewed and strengthened, however, a particular
focus should be directed to prioritizing early childhood education programmes in the city.
On the other hand, the finding shows that safety and security in the city are very good (84.4%),
therefore urban policies about safety and security in the city should be consolidated and reinforced
to remain strong or get better. The city has allocated a good proportion of land to public spaces in
the form of green area per capita, efforts should be made to make them easily accessible to the
public.
The Equity and Social Inclusion Dimension
One of the most important concepts within the concept of the prosperity of cities is the concept of
shared prosperity. It requires that as cities moves from one level to another up the ladder of
prosperity, it should “carry” along with it the entire population of the city. Put the other way
around, no segment of the city population should remain behind in poverty or deprivation as the
rest move up. Therefore, shared prosperity should cut across all sectors of the society to ensure
economic inclusion, social inclusion, gender inclusions and any other form of inclusion – and
eradicate any form of exclusion. The equity and social inclusion index reinforce this idea by
showing how far the city has come towards achieving this goal. Due to data unavailability issues
many indicators were not included in the index, nevertheless, the indicators remain very important
71.1%
50.2%43.9%
96.1%
10.0%
59.9%
89.1%
68.8%
100.0% 100.0%
Life
Expectancy at
Birth
Reduced
Maternal
Mortality
Reduced
Under-5
Mortality Rate
Vaccination
Coverage
Early
Childhood
Education
Programme
Net enrollment
rate in higher
education
Literacy Rate Reduced
Homicide rate
Reduced Theft
rate
Green area per
capita
Health Education Safety and Security Public Space
16
for the estimation of equity and social inclusion in the city. More efforts should be directed at
collecting data on the indicators.
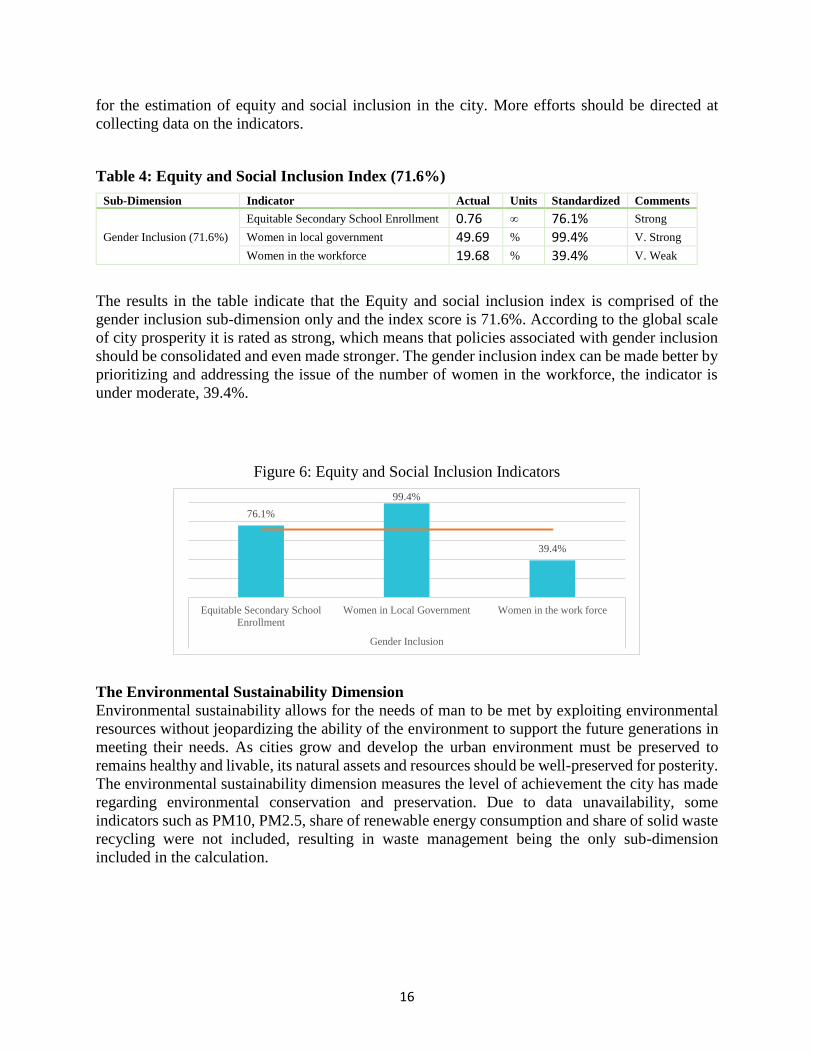
Table 4: Equity and Social Inclusion Index (71.6%)
Sub-Dimension Indicator Actual Units Standardized Comments
Gender Inclusion (71.6%)
Equitable Secondary School Enrollment 0.76 ∞ 76.1% Strong
Women in local government 49.69 % 99.4% V. Strong
Women in the workforce 19.68 % 39.4% V. Weak
The results in the table indicate that the Equity and social inclusion index is comprised of the
gender inclusion sub-dimension only and the index score is 71.6%. According to the global scale
of city prosperity it is rated as strong, which means that policies associated with gender inclusion
should be consolidated and even made stronger. The gender inclusion index can be made better by
prioritizing and addressing the issue of the number of women in the workforce, the indicator is
under moderate, 39.4%.
Figure 6: Equity and Social Inclusion Indicators
The Environmental Sustainability Dimension
Environmental sustainability allows for the needs of man to be met by exploiting environmental
resources without jeopardizing the ability of the environment to support the future generations in
meeting their needs. As cities grow and develop the urban environment must be preserved to
remains healthy and livable, its natural assets and resources should be well-preserved for posterity.
The environmental sustainability dimension measures the level of achievement the city has made
regarding environmental conservation and preservation. Due to data unavailability, some
indicators such as PM10, PM2.5, share of renewable energy consumption and share of solid waste
recycling were not included, resulting in waste management being the only sub-dimension
included in the calculation.
76.1%
99.4%
39.4%
Equitable Secondary School
Enrollment
Women in Local Government Women in the work force
Gender Inclusion

17
Table 5: Environmental Sustainability Index (49.3%)
Sub-Dimension Indicator Actual Units Standardized Comments
Waste
Management
(49.3%)
Solid Waste Collection 98.50 % 98.5% V. Strong
Solid waste recycling share - % - -
Waste water treatment 0.00 % 0.0% Under
moderate
The findings based on the available data show that the city of AL Baha has under moderate
environmental sustainability factors with an index score of 49.3%. Solid waste collection in the
city is very good but wastewater treatment is not good.
Figure 7: Environmental Sustainability Indicators
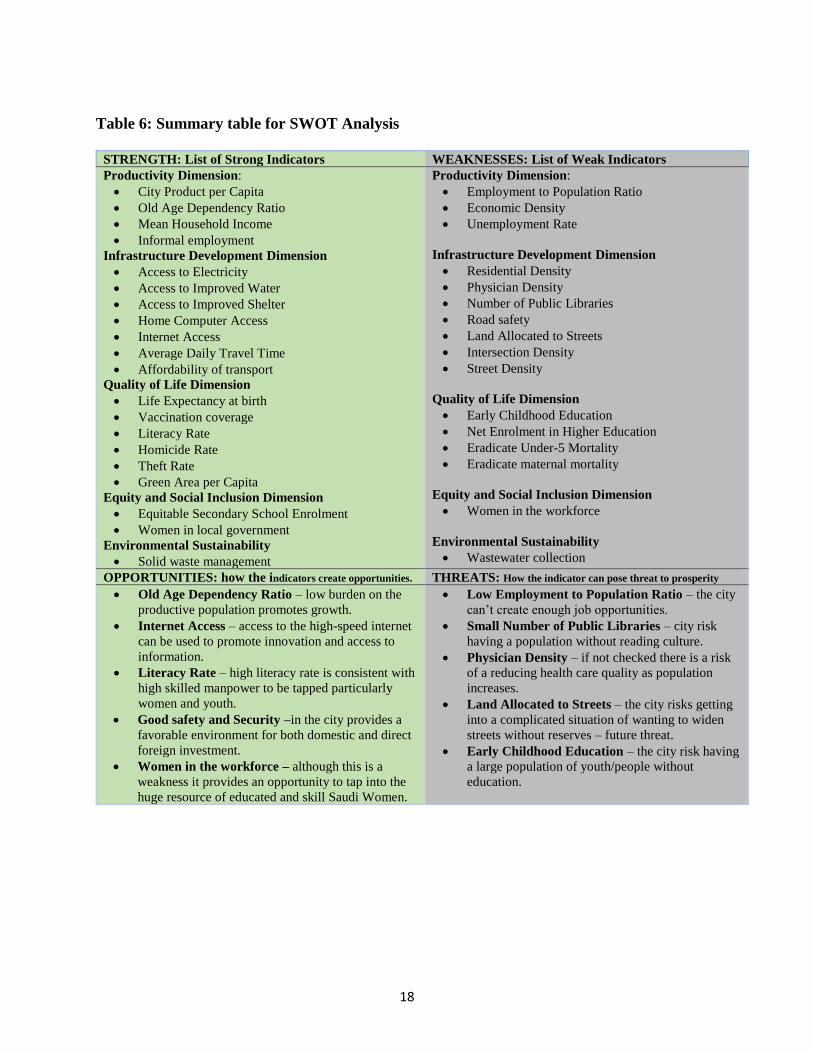
SWOT Analysis based on City Prosperity Index
This section attempts to use the findings of the CPI to identify areas of Strength, Weaknesses or
challenges, Opportunities for growth and possible Threats that the city may be facing so that
appropriate recommendations and action plans can be considered.
98.50%
0%
Solid Waste Collection Waste Water Treatment
18
Table 6: Summary table for SWOT Analysis
STRENGTH: List of Strong Indicators WEAKNESSES: List of Weak Indicators
Productivity Dimension:
• City Product per Capita
• Old Age Dependency Ratio
• Mean Household Income
• Informal employment
Infrastructure Development Dimension
• Access to Electricity
• Access to Improved Water
• Access to Improved Shelter
• Home Computer Access
• Internet Access
• Average Daily Travel Time
• Affordability of transport
Quality of Life Dimension
• Life Expectancy at birth
• Vaccination coverage
• Literacy Rate
• Homicide Rate
• Theft Rate
• Green Area per Capita
Equity and Social Inclusion Dimension
• Equitable Secondary School Enrolment
• Women in local government
Environmental Sustainability
• Solid waste management
Productivity Dimension:
• Employment to Population Ratio
• Economic Density
• Unemployment Rate
Infrastructure Development Dimension
• Residential Density
• Physician Density
• Number of Public Libraries
• Road safety
• Land Allocated to Streets
• Intersection Density
• Street Density
Quality of Life Dimension
• Early Childhood Education
• Net Enrolment in Higher Education
• Eradicate Under-5 Mortality
• Eradicate maternal mortality
Equity and Social Inclusion Dimension
• Women in the workforce
Environmental Sustainability
• Wastewater collection
OPPORTUNITIES: how the indicators create opportunities. THREATS: How the indicator can pose threat to prosperity
• Old Age Dependency Ratio – low burden on the
productive population promotes growth.
• Internet Access – access to the high-speed internet
can be used to promote innovation and access to
information.
• Literacy Rate – high literacy rate is consistent with
high skilled manpower to be tapped particularly
women and youth.
• Good safety and Security –in the city provides a
favorable environment for both domestic and direct
foreign investment.
• Women in the workforce – although this is a
weakness it provides an opportunity to tap into the
huge resource of educated and skill Saudi Women.
• Low Employment to Population Ratio – the city
can’t create enough job opportunities.
• Small Number of Public Libraries – city risk
having a population without reading culture.
• Physician Density – if not checked there is a risk
of a reducing health care quality as population
increases.
• Land Allocated to Streets – the city risks getting
into a complicated situation of wanting to widen
streets without reserves – future threat.
• Early Childhood Education – the city risk having
a large population of youth/people without
education.

19
20
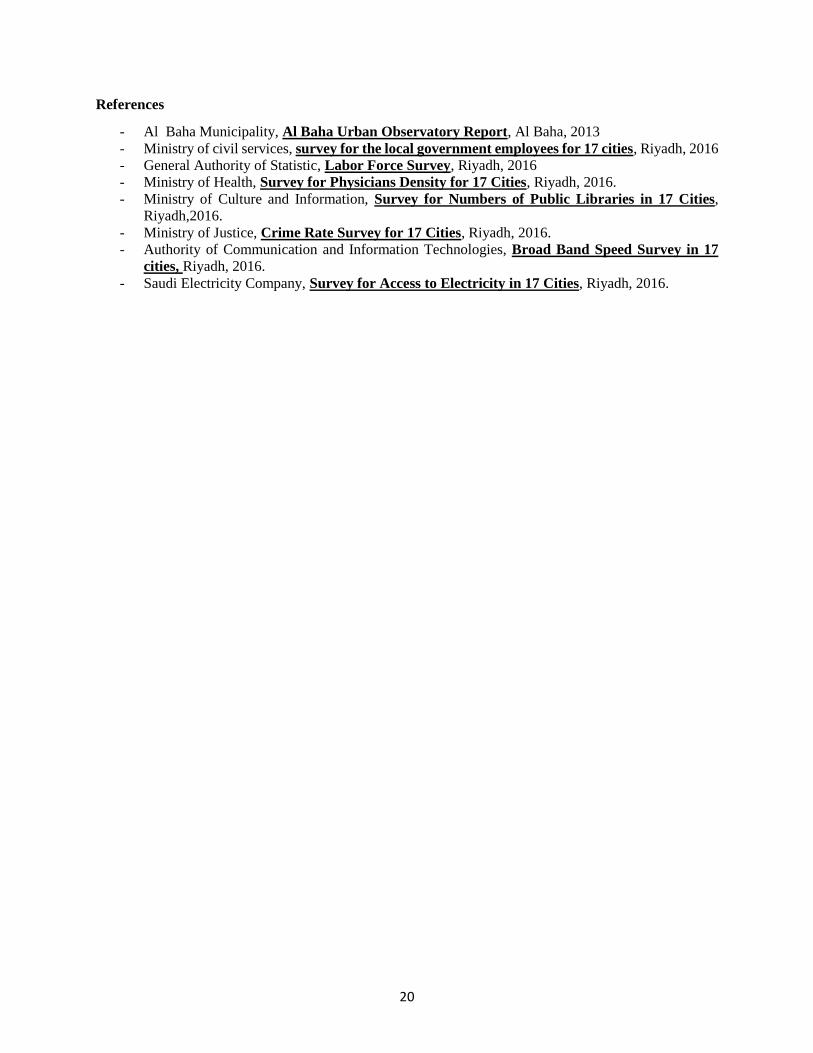
References
- Al Baha Municipality, Al Baha Urban Observatory Report, Al Baha, 2013
- Ministry of civil services, survey for the local government employees for 17 cities, Riyadh, 2016
- General Authority of Statistic, Labor Force Survey, Riyadh, 2016
- Ministry of Health, Survey for Physicians Density for 17 Cities, Riyadh, 2016.
- Ministry of Culture and Information, Survey for Numbers of Public Libraries in 17 Cities,
Riyadh,2016.
- Ministry of Justice, Crime Rate Survey for 17 Cities, Riyadh, 2016.
- Authority of Communication and Information Technologies, Broad Band Speed Survey in 17
cities, Riyadh, 2016.
- Saudi Electricity Company, Survey for Access to Electricity in 17 Cities, Riyadh, 2016.

21

22
ISBN: 978-603-8279-34-2