the future value of ecosystem services: global … · the future value of ecosystem services:...
TRANSCRIPT
Ecosystem Services 26 (2017) 289–301
Contents lists available at ScienceDirect
Ecosystem Services
journal homepage: www.elsevier .com/locate /ecoser
The future value of ecosystem services: Global scenarios and nationalimplications
http://dx.doi.org/10.1016/j.ecoser.2017.05.0042212-0416/� 2017 Elsevier B.V. All rights reserved.
⇑ Corresponding author.E-mail addresses: [email protected] (I. Kubiszewski), [email protected]
(R. Costanza), [email protected] (S. Anderson), [email protected] (P. Sutton).
Ida Kubiszewski a,⇑, Robert Costanza a, Sharolyn Anderson b, Paul Sutton c
aCrawford School of Public Policy, The Australian National University, Canberra, ACT 2601, AustraliabNational Parks Service, Fort Collins, Colorado, USAcUniversity of Denver, CO, USA
a r t i c l e i n f o
Article history:Received 7 February 2017Received in revised form 5 May 2017Accepted 6 May 2017Available online 2 June 2017
a b s t r a c t
We estimated the future value of ecosystem services in monetary units for 4 alternative global land useand management scenarios based on the Great Transition Initiative (GTI) scenarios to the year 2050. Weused previous estimates of the per biome values of ecosystem services in 2011 as the basis for compar-ison. We mapped projected land-use for 16 biomes at 1 km2 resolution globally for each scenario. This,combined with differences in land management for each scenario, created estimates of global ecosystemservices values that also allowed for examinations of individual countries. Results show that under dif-ferent scenarios the global value of ecosystem services can decline by $51 trillion/yr or increase byUSD $30 trillion/yr. In addition to the global values, we report totals for all countries and maps for afew example countries. Results show that adopting a set of policies similar to those required to achievethe UN Sustainable Development Goals, would greatly enhance ecosystem services, human wellbeing andsustainability.
� 2017 Elsevier B.V. All rights reserved.
1. Introduction
Ecosystem services are a major contributor to sustainablehuman wellbeing. Between 1997 and 2011, the global value ofthese services has decreased by an estimated USD 20 trillion/yr.due to land use change (Costanza et al., 2014). We synthesizedthree existing sets of scenarios (Raskin et al., 2002; Batemanet al., 2013; Costanza et al., 2015) to develop and evaluate thefuture value of global ecosystem services under four alternativeland-use and management scenarios (Table 1). The scenarios arebased around the four ‘Great Transition Initiative’ (GTI) archetypes(Hunt et al., 2012) created by Raskin et al. (2002). They provide arange of plausible futures that incorporate different policies andworld views and their effects on a range of issues, including cli-mate change, economics, overall wellbeing, and land and wateruse and management (Fig. 1). A large number of studies use abroad range of future scenarios. Van Vuuren et al. (2012) surveyedthese studies and concluded that: ‘‘Comparison of these studiesshows that there is actually a limited set of scenario families thatform the basis of many scenarios used in different environmental
assessments.” This is a conclusion shared by Hunt et al. (2012)and Costanza et al. (2015). Similar, broad range land-use andsocial-economic scenarios, within these archetypes, are also beingused by the IPCC (O’Neill et al., 2017; Popp et al., 2017; Riahi et al.,2017). The GTI scenarios, used in this paper, fit this set of familiesor ‘archetypes’ and include aggregate land use projections tied tothe scenarios. These scenarios are best thought of as ‘exploratory’(IPBES, 2016) in that they represent different plausible futuresbased on storylines, as opposed to ‘target-seeking’, ‘policy-screening’, or ‘retrospective’ scenarios.
We estimated the implications of these scenarios and their landuse and management assumptions for the value of ecosystem ser-vices to 2050 (Fig. 2).
The GTI scenarios are described in more detail later, but in sum-mary are:
1. Market Forces (MF): an economic and population growtharchetype based on neoliberal free market assumptions;
2. Fortress World (FW): an archetype in which nations and theworld become more fragmented, inequitable, and head towardstemporary or permanent social collapse;
3. Policy Reform (PR): a continuing economic growth archetype,but with discipline/restraint/regulation based on assumptionsabout the need for government intervention and effective pol-icy; and,
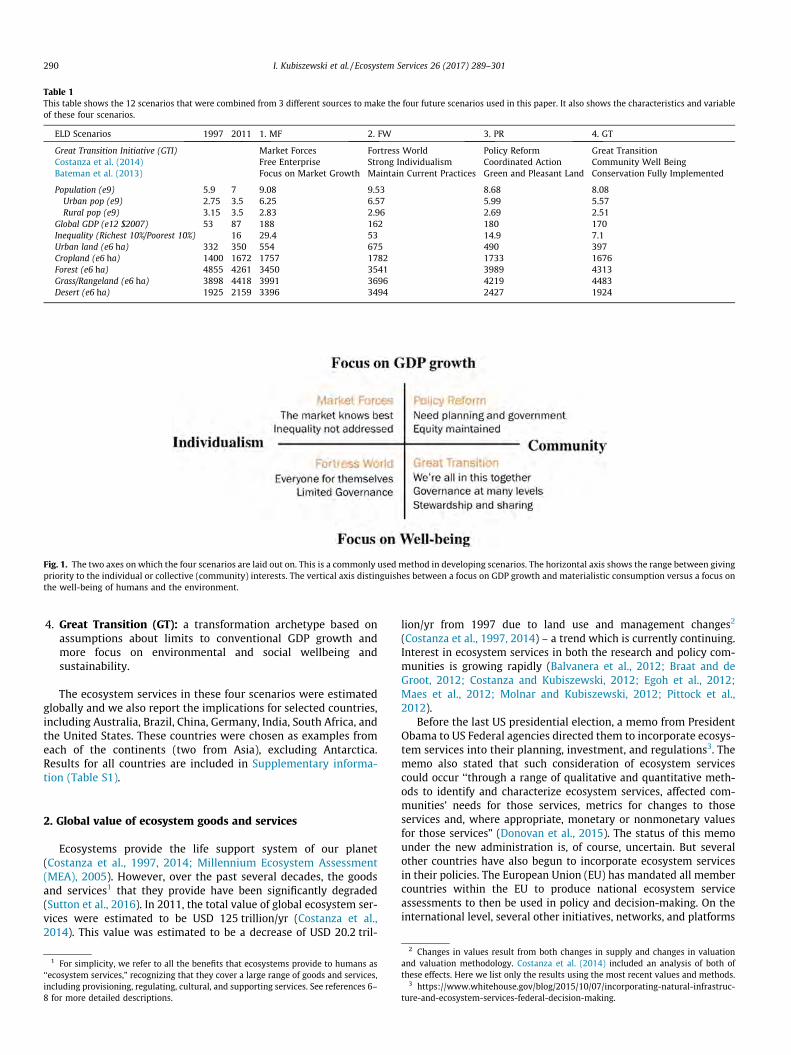
Table 1This table shows the 12 scenarios that were combined from 3 different sources to make the four future scenarios used in this paper. It also shows the characteristics and variableof these four scenarios.
ELD Scenarios 1997 2011 1. MF 2. FW 3. PR 4. GT
Great Transition Initiative (GTI) Market Forces Fortress World Policy Reform Great TransitionCostanza et al. (2014) Free Enterprise Strong Individualism Coordinated Action Community Well BeingBateman et al. (2013) Focus on Market Growth Maintain Current Practices Green and Pleasant Land Conservation Fully Implemented
Population (e9) 5.9 7 9.08 9.53 8.68 8.08Urban pop (e9) 2.75 3.5 6.25 6.57 5.99 5.57Rural pop (e9) 3.15 3.5 2.83 2.96 2.69 2.51
Global GDP (e12 $2007) 53 87 188 162 180 170Inequality (Richest 10%/Poorest 10%) 16 29.4 53 14.9 7.1Urban land (e6 ha) 332 350 554 675 490 397Cropland (e6 ha) 1400 1672 1757 1782 1733 1676Forest (e6 ha) 4855 4261 3450 3541 3989 4313Grass/Rangeland (e6 ha) 3898 4418 3991 3696 4219 4483Desert (e6 ha) 1925 2159 3396 3494 2427 1924
Fig. 1. The two axes on which the four scenarios are laid out on. This is a commonly used method in developing scenarios. The horizontal axis shows the range between givingpriority to the individual or collective (community) interests. The vertical axis distinguishes between a focus on GDP growth and materialistic consumption versus a focus onthe well-being of humans and the environment.
290 I. Kubiszewski et al. / Ecosystem Services 26 (2017) 289–301
4. Great Transition (GT): a transformation archetype based onassumptions about limits to conventional GDP growth andmore focus on environmental and social wellbeing andsustainability.
The ecosystem services in these four scenarios were estimatedglobally and we also report the implications for selected countries,including Australia, Brazil, China, Germany, India, South Africa, andthe United States. These countries were chosen as examples fromeach of the continents (two from Asia), excluding Antarctica.Results for all countries are included in Supplementary informa-tion (Table S1).
2. Global value of ecosystem goods and services
Ecosystems provide the life support system of our planet(Costanza et al., 1997, 2014; Millennium Ecosystem Assessment(MEA), 2005). However, over the past several decades, the goodsand services1 that they provide have been significantly degraded(Sutton et al., 2016). In 2011, the total value of global ecosystem ser-vices were estimated to be USD 125 trillion/yr (Costanza et al.,2014). This value was estimated to be a decrease of USD 20.2 tril-
1 For simplicity, we refer to all the benefits that ecosystems provide to humans as‘‘ecosystem services,” recognizing that they cover a large range of goods and services,including provisioning, regulating, cultural, and supporting services. See references 6–8 for more detailed descriptions.
lion/yr from 1997 due to land use and management changes2
(Costanza et al., 1997, 2014) – a trend which is currently continuing.Interest in ecosystem services in both the research and policy com-munities is growing rapidly (Balvanera et al., 2012; Braat and deGroot, 2012; Costanza and Kubiszewski, 2012; Egoh et al., 2012;Maes et al., 2012; Molnar and Kubiszewski, 2012; Pittock et al.,2012).
Before the last US presidential election, a memo from PresidentObama to US Federal agencies directed them to incorporate ecosys-tem services into their planning, investment, and regulations3. Thememo also stated that such consideration of ecosystem servicescould occur ‘‘through a range of qualitative and quantitative meth-ods to identify and characterize ecosystem services, affected com-munities’ needs for those services, metrics for changes to thoseservices and, where appropriate, monetary or nonmonetary valuesfor those services” (Donovan et al., 2015). The status of this memounder the new administration is, of course, uncertain. But severalother countries have also begun to incorporate ecosystem servicesin their policies. The European Union (EU) has mandated all membercountries within the EU to produce national ecosystem serviceassessments to then be used in policy and decision-making. On theinternational level, several other initiatives, networks, and platforms
2 Changes in values result from both changes in supply and changes in valuationand valuation methodology. Costanza et al. (2014) included an analysis of both ofthese effects. Here we list only the results using the most recent values and methods.
3 https://www.whitehouse.gov/blog/2015/10/07/incorporating-natural-infrastruc-ture-and-ecosystem-services-federal-decision-making.
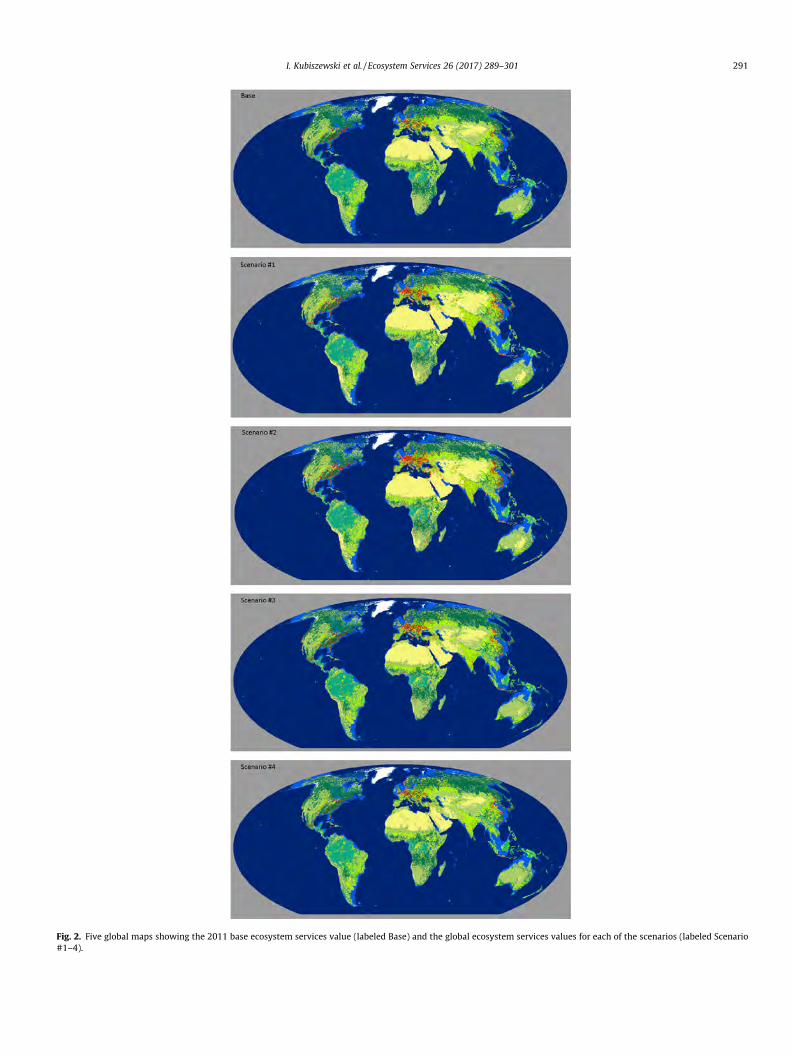
Fig. 2. Five global maps showing the 2011 base ecosystem services value (labeled Base) and the global ecosystem services values for each of the scenarios (labeled Scenario#1–4).
I. Kubiszewski et al. / Ecosystem Services 26 (2017) 289–301 291
292 I. Kubiszewski et al. / Ecosystem Services 26 (2017) 289–301
are underway. These include, but are not limited to, the Intergovern-mental Science-Policy Platform on Biodiversity and Ecosystem Ser-vices (IPBES), which has been established by the UN as an entityanalogous in structure and function to the IPCC, and the interna-tional Ecosystem Services Partnership (ESP), which has been estab-lished to coordinate and facilitate exchange of information aboutglobal efforts, projects, scholars, and practitioners.
2.1. Valuation of ecosystem services
Valuing ecosystems and the goods and services they providehas a long history (Westman, 1977; Costanza et al., 1997; Baveyeet al., 2013). One key use of valuation has been to allow ecosystemsto be explicitly considered in decisions that involve trade-offs(Farber et al., 2002). Trade-offs involving ecosystem services implyeither implicit or explicit valuation (Costanza et al., 1997). Explicitvaluation allows the units of all the elements to be expressed in thesame common denominator to allow direct comparison of thetrade-offs. Often, this is most easily and usefully done using mon-etary units, but other units such as time, energy, or land area arealso possible (Wackernagel and Rees, 1996; Rees, 2006) and a plu-ralistic, integrated, approach to valuation is obviously preferred(Costanza, 2000; Jacobs et al., 2016; Pascual et al., 2017).
However, expressing values in monetary units does not implyprivatization or market exchanges (Costanza, 2006; McCauley,2006; Costanza et al., 2014). Most ecosystem services are non-rival and/or non-excludable, and therefore fit poorly into markets(Kubiszewski et al., 2010). Additionally, ecosystem service valuesoften relate to non-market use or non-use values rather than mar-ket or psudo-market exchange values (Daly, 1998). We hasten toadd that valuation of ecosystem services in monetary units is notin conflict with other approaches to considering their importance,but represents an additional piece of information that can comple-ment other approaches.
This paper investigates alternative and plausible global land-use and management scenarios to the year 2050, which couldeither accelerate or reverse land degradation and the resultingimpacts of these scenarios on the estimated value of ecosystemservices.
4 www.greattransition.org/explore/scenarios
3. Scenario planning
Scenario analysis or scenario planning is defined as a ‘structuredprocess of exploring and evaluating alternative futures’ (Costanzaet al., 2015). Scenarios combine influential and uncertain drivers,that have low controllability, into storylines of the future(O’Brien, 2000). Ultimately, the goal of scenario planning is to illus-trate the consequences of these drivers and policy options, revealpotential tipping points (Lenton et al., 2008), and inform andimprove decisions. Unlike forecasting, projections, and predictions,exploratory scenarios explore plausible rather than probable futures(Peterson et al., 2003).
Scenario planning has become an important way to informdecision-making incorporating a whole-system perspective underuncertainty (Gallopín et al., 1997; Department of Trade andIndustry (DTI), 2003). Scenarios have been used at all scales, fromindividual corporations to communities to global (Costanza et al.,2015). This paper uses the GTI scenarios as a basis since they havebeen widely vetted and the scenarios have been found to be typicalof many other scenario studies (Hunt et al., 2012). The GTI scenar-ios were created by an international network of scholars, usingexpert opinion, models and regional analyses (McGrail, 2011). Theyalso developed global land use projections for each scenario, whichwe incorporated.
4. Methods
4.1. Global land use change scenarios and national implications
The scenarios can be arranged across two broad axes as shownin Fig. 1. One axis is a focus on individuals versus the community.The second axis is a focus on conventional GDP growth versuswellbeing more broadly. These two axes create 4 possiblescenarios.
Detailed Great Transition Initiative (GTI) scenarios exist for boththe global system and several regions.4 Brief narrative descriptionsof each scenario, extracted directly from the GTI website, are repro-duced here:
Market Forces: The Market Forces scenario is a story of amarket-driven world in the 21st century in which demographic,economic, environmental and technological trends unfold with-out major surprise relative to (sic) unfolding trends. Continuity,globalization and convergence are key characteristics of worlddevelopment – institutions gradually adjust without major rup-tures, international economic integration proceeds apace andthe socioeconomic patterns of poor regions converge slowlytoward the development model of the rich regions. Despite eco-nomic growth, extreme income disparity between rich and poorcountries, and between the rich and poor within countries,remains a critical social trend. Environmental transformationand degradation are a progressively more significant factor inglobal affairs.Fortress World: The Fortress World scenario is a variant of abroader class of Barbarization scenarios, in the hierarchy ofthe Global Scenario Group (Gallopín et al., 1997). Barbarizationscenarios envision the grim possibility that the social, economicand moral underpinnings of civilization deteriorate, as emerg-ing problems overwhelm the coping capacity of both marketsand policy reforms. The Fortress World variant of the Barbariza-tion story features an authoritarian response to the threat ofbreakdown. Ensconced in protected enclaves, elites safeguardtheir privilege by controlling an impoverished majority andmanaging critical natural resources, while outside the fortressthere is repression, environmental destruction and misery.Policy Reform: The Policy Reform scenario envisions the emer-gence of strong political will for taking harmonized and rapidaction to ensure a successful transition to a more equitableand environmentally resilient future. Rather than a projectioninto the future, Policy Reform scenario is a normative scenarioconstructed as a backcast from the future. It is designed toachieve a set of future sustainability goals. The analytical taskis to identify plausible development pathways for reaching thatend-point. Thus, the Policy Reform scenario explores therequirements for simultaneously achieving social and environ-mental sustainability goals under high economic growth condi-tions similar to those of Market Forces.Great Transition: The Great Transition scenario explores vision-ary solutions to the sustainability challenge, including newsocioeconomic arrangements and fundamental changes in val-ues. This scenario depicts a transition to a society that preservesnatural systems, provides high levels of welfare through mate-rial sufficiency and equitable distribution, and enjoys a strongsense of local solidarity.
Each of these scenarios have been produced and vetted by alarge network of scholars and have been used as archetypes for arange of other scenario planning studies (Raskin et al., 2002;
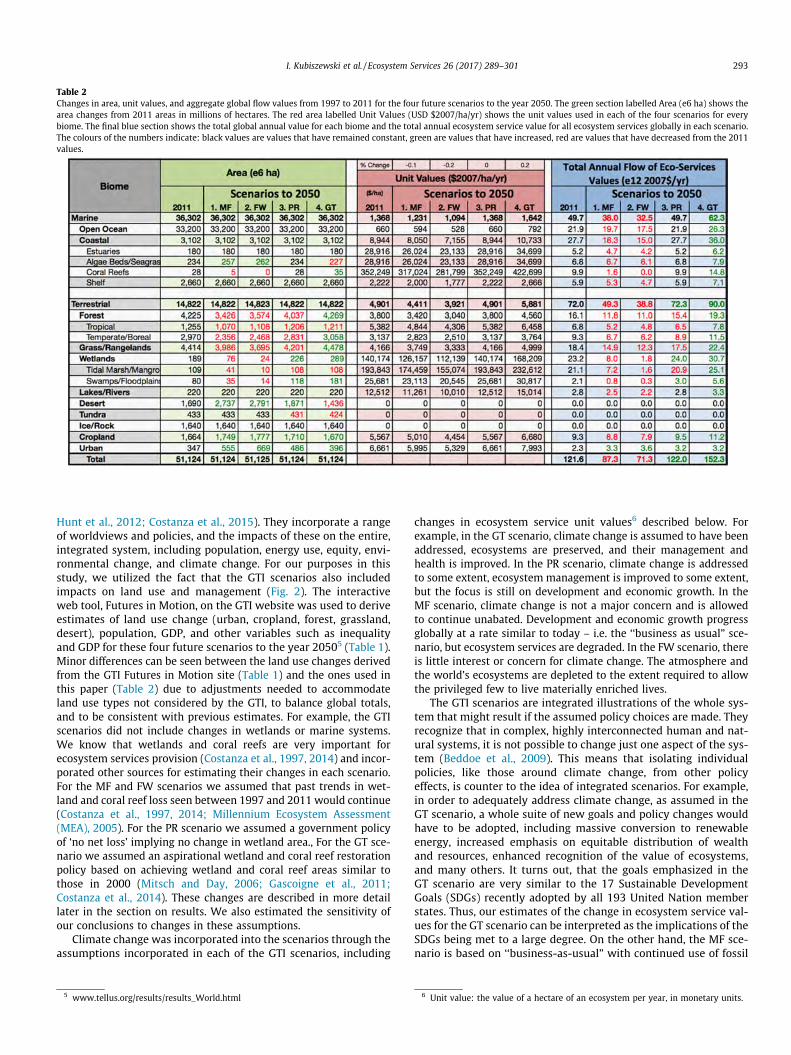
Table 2Changes in area, unit values, and aggregate global flow values from 1997 to 2011 for the four future scenarios to the year 2050. The green section labelled Area (e6 ha) shows thearea changes from 2011 areas in millions of hectares. The red area labelled Unit Values (USD $2007/ha/yr) shows the unit values used in each of the four scenarios for everybiome. The final blue section shows the total global annual value for each biome and the total annual ecosystem service value for all ecosystem services globally in each scenario.The colours of the numbers indicate: black values are values that have remained constant, green are values that have increased, red are values that have decreased from the 2011values.
I. Kubiszewski et al. / Ecosystem Services 26 (2017) 289–301 293
Hunt et al., 2012; Costanza et al., 2015). They incorporate a rangeof worldviews and policies, and the impacts of these on the entire,integrated system, including population, energy use, equity, envi-ronmental change, and climate change. For our purposes in thisstudy, we utilized the fact that the GTI scenarios also includedimpacts on land use and management (Fig. 2). The interactiveweb tool, Futures in Motion, on the GTI website was used to deriveestimates of land use change (urban, cropland, forest, grassland,desert), population, GDP, and other variables such as inequalityand GDP for these four future scenarios to the year 20505 (Table 1).Minor differences can be seen between the land use changes derivedfrom the GTI Futures in Motion site (Table 1) and the ones used inthis paper (Table 2) due to adjustments needed to accommodateland use types not considered by the GTI, to balance global totals,and to be consistent with previous estimates. For example, the GTIscenarios did not include changes in wetlands or marine systems.We know that wetlands and coral reefs are very important forecosystem services provision (Costanza et al., 1997, 2014) and incor-porated other sources for estimating their changes in each scenario.For the MF and FW scenarios we assumed that past trends in wet-land and coral reef loss seen between 1997 and 2011 would continue(Costanza et al., 1997, 2014; Millennium Ecosystem Assessment(MEA), 2005). For the PR scenario we assumed a government policyof ‘no net loss’ implying no change in wetland area., For the GT sce-nario we assumed an aspirational wetland and coral reef restorationpolicy based on achieving wetland and coral reef areas similar tothose in 2000 (Mitsch and Day, 2006; Gascoigne et al., 2011;Costanza et al., 2014). These changes are described in more detaillater in the section on results. We also estimated the sensitivity ofour conclusions to changes in these assumptions.
Climate change was incorporated into the scenarios through theassumptions incorporated in each of the GTI scenarios, including
5 www.tellus.org/results/results_World.html
changes in ecosystem service unit values6 described below. Forexample, in the GT scenario, climate change is assumed to have beenaddressed, ecosystems are preserved, and their management andhealth is improved. In the PR scenario, climate change is addressedto some extent, ecosystem management is improved to some extent,but the focus is still on development and economic growth. In theMF scenario, climate change is not a major concern and is allowedto continue unabated. Development and economic growth progressglobally at a rate similar to today – i.e. the ‘‘business as usual” sce-nario, but ecosystem services are degraded. In the FW scenario, thereis little interest or concern for climate change. The atmosphere andthe world’s ecosystems are depleted to the extent required to allowthe privileged few to live materially enriched lives.
The GTI scenarios are integrated illustrations of the whole sys-tem that might result if the assumed policy choices are made. Theyrecognize that in complex, highly interconnected human and nat-ural systems, it is not possible to change just one aspect of the sys-tem (Beddoe et al., 2009). This means that isolating individualpolicies, like those around climate change, from other policyeffects, is counter to the idea of integrated scenarios. For example,in order to adequately address climate change, as assumed in theGT scenario, a whole suite of new goals and policy changes wouldhave to be adopted, including massive conversion to renewableenergy, increased emphasis on equitable distribution of wealthand resources, enhanced recognition of the value of ecosystems,and many others. It turns out, that the goals emphasized in theGT scenario are very similar to the 17 Sustainable DevelopmentGoals (SDGs) recently adopted by all 193 United Nation memberstates. Thus, our estimates of the change in ecosystem service val-ues for the GT scenario can be interpreted as the implications of theSDGs being met to a large degree. On the other hand, the MF sce-nario is based on ‘‘business-as-usual” with continued use of fossil
6 Unit value: the value of a hectare of an ecosystem per year, in monetary units.
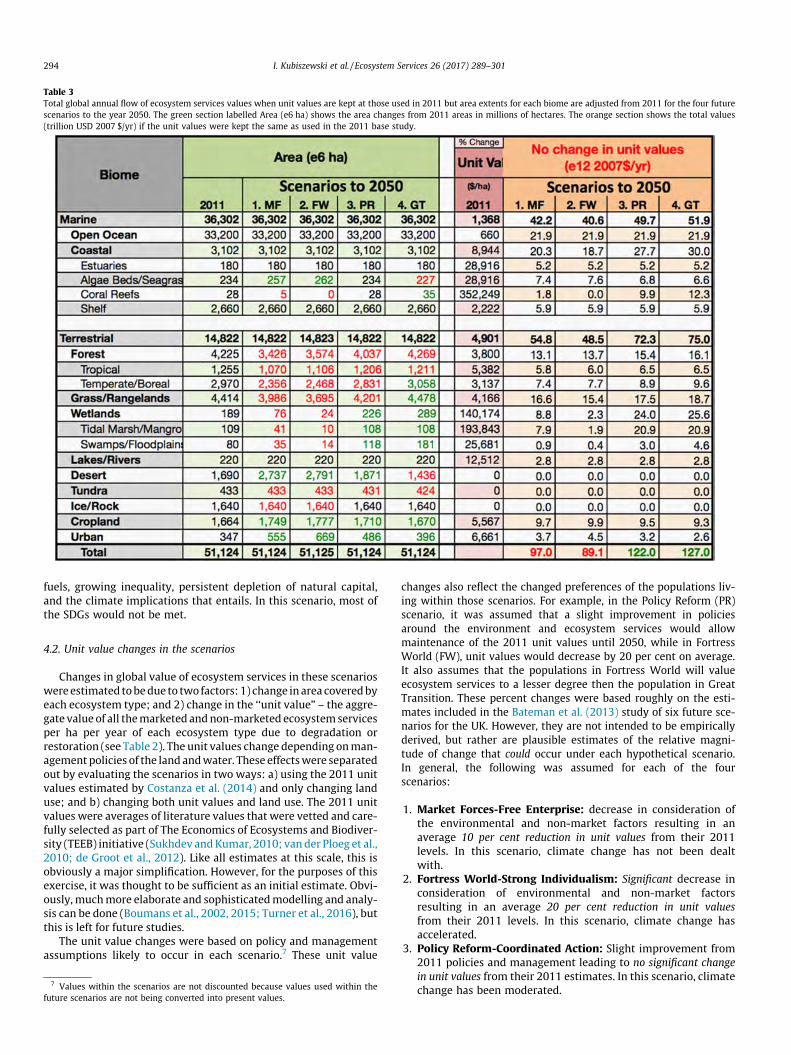
Table 3Total global annual flow of ecosystem services values when unit values are kept at those used in 2011 but area extents for each biome are adjusted from 2011 for the four futurescenarios to the year 2050. The green section labelled Area (e6 ha) shows the area changes from 2011 areas in millions of hectares. The orange section shows the total values(trillion USD 2007 $/yr) if the unit values were kept the same as used in the 2011 base study.
294 I. Kubiszewski et al. / Ecosystem Services 26 (2017) 289–301
fuels, growing inequality, persistent depletion of natural capital,and the climate implications that entails. In this scenario, most ofthe SDGs would not be met.
4.2. Unit value changes in the scenarios
Changes in global value of ecosystem services in these scenarioswereestimated tobedue to two factors: 1) change inarea coveredbyeach ecosystem type; and 2) change in the ‘‘unit value” – the aggre-gate value of all themarketed andnon-marketed ecosystemservicesper ha per year of each ecosystem type due to degradation orrestoration (see Table 2). The unit values change depending onman-agementpolicies of the land andwater. These effectswere separatedout by evaluating the scenarios in two ways: a) using the 2011 unitvalues estimated by Costanza et al. (2014) and only changing landuse; and b) changing both unit values and land use. The 2011 unitvalues were averages of literature values that were vetted and care-fully selected as part of The Economics of Ecosystems and Biodiver-sity (TEEB) initiative (Sukhdev andKumar, 2010; van der Ploeg et al.,2010; de Groot et al., 2012). Like all estimates at this scale, this isobviously a major simplification. However, for the purposes of thisexercise, it was thought to be sufficient as an initial estimate. Obvi-ously, muchmore elaborate and sophisticatedmodelling and analy-sis can be done (Boumans et al., 2002, 2015; Turner et al., 2016), butthis is left for future studies.
The unit value changes were based on policy and managementassumptions likely to occur in each scenario.7 These unit value
7 Values within the scenarios are not discounted because values used within thefuture scenarios are not being converted into present values.
changes also reflect the changed preferences of the populations liv-ing within those scenarios. For example, in the Policy Reform (PR)scenario, it was assumed that a slight improvement in policiesaround the environment and ecosystem services would allowmaintenance of the 2011 unit values until 2050, while in FortressWorld (FW), unit values would decrease by 20 per cent on average.It also assumes that the populations in Fortress World will valueecosystem services to a lesser degree then the population in GreatTransition. These percent changes were based roughly on the esti-mates included in the Bateman et al. (2013) study of six future sce-narios for the UK. However, they are not intended to be empiricallyderived, but rather are plausible estimates of the relative magni-tude of change that could occur under each hypothetical scenario.In general, the following was assumed for each of the fourscenarios:
1. Market Forces-Free Enterprise: decrease in consideration ofthe environmental and non-market factors resulting in anaverage 10 per cent reduction in unit values from their 2011levels. In this scenario, climate change has not been dealtwith.
2. Fortress World-Strong Individualism: Significant decrease inconsideration of environmental and non-market factorsresulting in an average 20 per cent reduction in unit valuesfrom their 2011 levels. In this scenario, climate change hasaccelerated.
3. Policy Reform-Coordinated Action: Slight improvement from2011 policies and management leading to no significant changein unit values from their 2011 estimates. In this scenario, climatechange has been moderated.
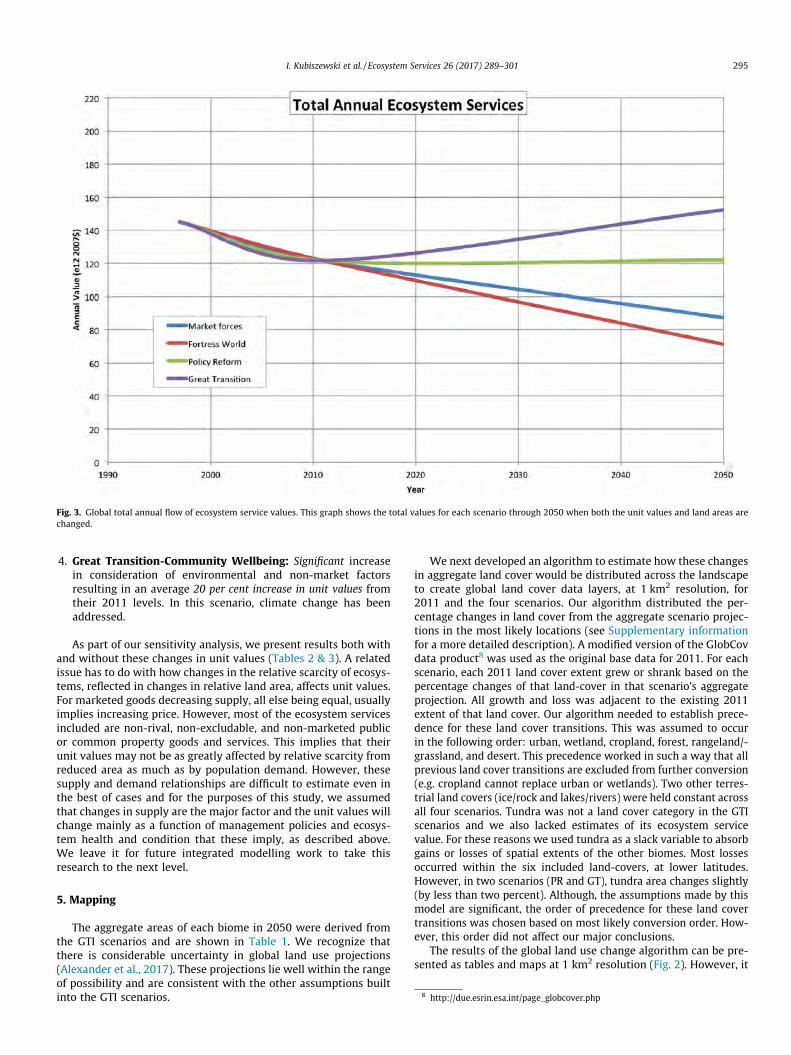
Fig. 3. Global total annual flow of ecosystem service values. This graph shows the total values for each scenario through 2050 when both the unit values and land areas arechanged.
8 http://due.esrin.esa.int/page_globcover.php
I. Kubiszewski et al. / Ecosystem Services 26 (2017) 289–301 295
4. Great Transition-Community Wellbeing: Significant increasein consideration of environmental and non-market factorsresulting in an average 20 per cent increase in unit values fromtheir 2011 levels. In this scenario, climate change has beenaddressed.
As part of our sensitivity analysis, we present results both withand without these changes in unit values (Tables 2 & 3). A relatedissue has to do with how changes in the relative scarcity of ecosys-tems, reflected in changes in relative land area, affects unit values.For marketed goods decreasing supply, all else being equal, usuallyimplies increasing price. However, most of the ecosystem servicesincluded are non-rival, non-excludable, and non-marketed publicor common property goods and services. This implies that theirunit values may not be as greatly affected by relative scarcity fromreduced area as much as by population demand. However, thesesupply and demand relationships are difficult to estimate even inthe best of cases and for the purposes of this study, we assumedthat changes in supply are the major factor and the unit values willchange mainly as a function of management policies and ecosys-tem health and condition that these imply, as described above.We leave it for future integrated modelling work to take thisresearch to the next level.
5. Mapping
The aggregate areas of each biome in 2050 were derived fromthe GTI scenarios and are shown in Table 1. We recognize thatthere is considerable uncertainty in global land use projections(Alexander et al., 2017). These projections lie well within the rangeof possibility and are consistent with the other assumptions builtinto the GTI scenarios.
We next developed an algorithm to estimate how these changesin aggregate land cover would be distributed across the landscapeto create global land cover data layers, at 1 km2 resolution, for2011 and the four scenarios. Our algorithm distributed the per-centage changes in land cover from the aggregate scenario projec-tions in the most likely locations (see Supplementary informationfor a more detailed description). A modified version of the GlobCovdata product8 was used as the original base data for 2011. For eachscenario, each 2011 land cover extent grew or shrank based on thepercentage changes of that land-cover in that scenario’s aggregateprojection. All growth and loss was adjacent to the existing 2011extent of that land cover. Our algorithm needed to establish prece-dence for these land cover transitions. This was assumed to occurin the following order: urban, wetland, cropland, forest, rangeland/-grassland, and desert. This precedence worked in such a way that allprevious land cover transitions are excluded from further conversion(e.g. cropland cannot replace urban or wetlands). Two other terres-trial land covers (ice/rock and lakes/rivers) were held constant acrossall four scenarios. Tundra was not a land cover category in the GTIscenarios and we also lacked estimates of its ecosystem servicevalue. For these reasons we used tundra as a slack variable to absorbgains or losses of spatial extents of the other biomes. Most lossesoccurred within the six included land-covers, at lower latitudes.However, in two scenarios (PR and GT), tundra area changes slightly(by less than two percent). Although, the assumptions made by thismodel are significant, the order of precedence for these land covertransitions was chosen based on most likely conversion order. How-ever, this order did not affect our major conclusions.
The results of the global land use change algorithm can be pre-sented as tables and maps at 1 km2 resolution (Fig. 2). However, it
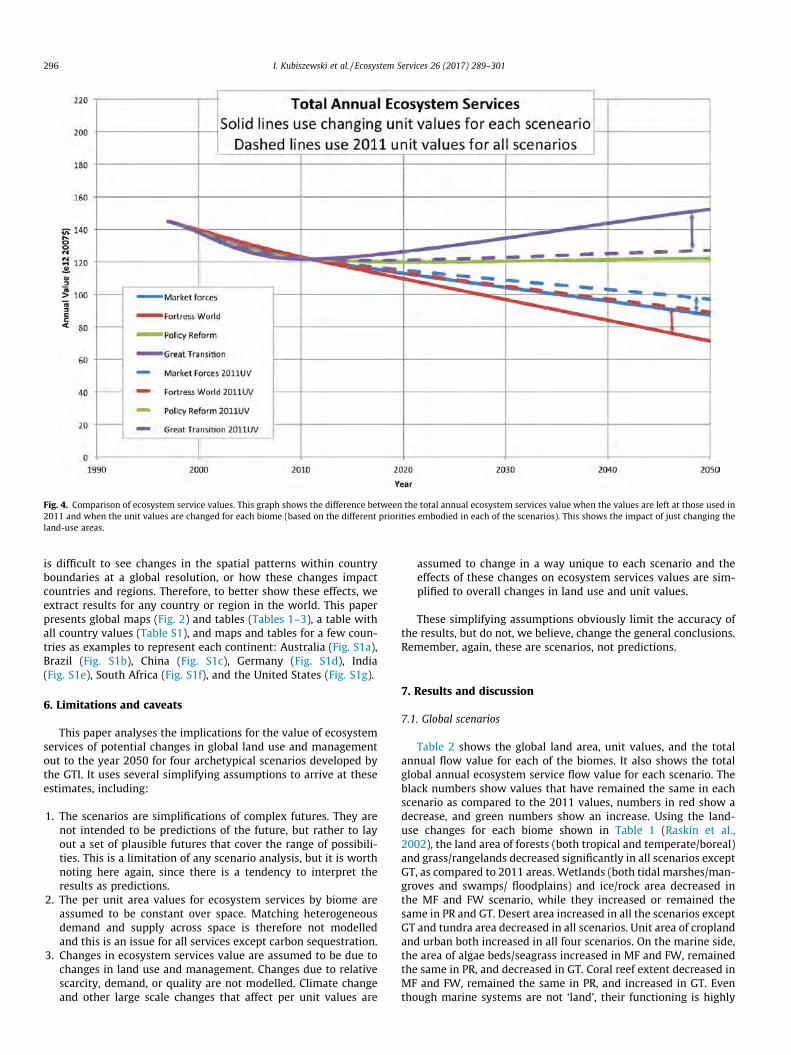
Fig. 4. Comparison of ecosystem service values. This graph shows the difference between the total annual ecosystem services value when the values are left at those used in2011 and when the unit values are changed for each biome (based on the different priorities embodied in each of the scenarios). This shows the impact of just changing theland-use areas.
296 I. Kubiszewski et al. / Ecosystem Services 26 (2017) 289–301
is difficult to see changes in the spatial patterns within countryboundaries at a global resolution, or how these changes impactcountries and regions. Therefore, to better show these effects, weextract results for any country or region in the world. This paperpresents global maps (Fig. 2) and tables (Tables 1–3), a table withall country values (Table S1), and maps and tables for a few coun-tries as examples to represent each continent: Australia (Fig. S1a),Brazil (Fig. S1b), China (Fig. S1c), Germany (Fig. S1d), India(Fig. S1e), South Africa (Fig. S1f), and the United States (Fig. S1g).
6. Limitations and caveats
This paper analyses the implications for the value of ecosystemservices of potential changes in global land use and managementout to the year 2050 for four archetypical scenarios developed bythe GTI. It uses several simplifying assumptions to arrive at theseestimates, including:
1. The scenarios are simplifications of complex futures. They arenot intended to be predictions of the future, but rather to layout a set of plausible futures that cover the range of possibili-ties. This is a limitation of any scenario analysis, but it is worthnoting here again, since there is a tendency to interpret theresults as predictions.
2. The per unit area values for ecosystem services by biome areassumed to be constant over space. Matching heterogeneousdemand and supply across space is therefore not modelledand this is an issue for all services except carbon sequestration.
3. Changes in ecosystem services value are assumed to be due tochanges in land use and management. Changes due to relativescarcity, demand, or quality are not modelled. Climate changeand other large scale changes that affect per unit values are
assumed to change in a way unique to each scenario and theeffects of these changes on ecosystem services values are sim-plified to overall changes in land use and unit values.
These simplifying assumptions obviously limit the accuracy ofthe results, but do not, we believe, change the general conclusions.Remember, again, these are scenarios, not predictions.
7. Results and discussion
7.1. Global scenarios
Table 2 shows the global land area, unit values, and the totalannual flow value for each of the biomes. It also shows the totalglobal annual ecosystem service flow value for each scenario. Theblack numbers show values that have remained the same in eachscenario as compared to the 2011 values, numbers in red show adecrease, and green numbers show an increase. Using the land-use changes for each biome shown in Table 1 (Raskin et al.,2002), the land area of forests (both tropical and temperate/boreal)and grass/rangelands decreased significantly in all scenarios exceptGT, as compared to 2011 areas. Wetlands (both tidal marshes/man-groves and swamps/ floodplains) and ice/rock area decreased inthe MF and FW scenario, while they increased or remained thesame in PR and GT. Desert area increased in all the scenarios exceptGT and tundra area decreased in all scenarios. Unit area of croplandand urban both increased in all four scenarios. On the marine side,the area of algae beds/seagrass increased in MF and FW, remainedthe same in PR, and decreased in GT. Coral reef extent decreased inMF and FW, remained the same in PR, and increased in GT. Eventhough marine systems are not ‘land’, their functioning is highly

Fig. 5. The four solid lines show the annual value of ecosystem services for each of the four scenarios going out to 2050. The dashed lines show GDP for each of the fourscenarios going out to 2050. The ecosystem services values and the GDP for the four scenarios were not added or combined in this figure.
I. Kubiszewski et al. / Ecosystem Services 26 (2017) 289–301 297
influenced by climate and land-based activity, especially coastalsystems like coral reefs.
The unit values per biome were adjusted from 2011 values asdescribed above. However, in order to show the sensitivity of theresults to the changes in the 2011 unit values, Fig. 4 and Table 2provide results without changes to the unit values. The generaltrends and conclusions are unchanged, only the magnitudes aredifferent.
Putting the land areas and unit values together for each biome,the global total annual flow of ecosystem services values was esti-mated (Fig. 3)9. The total global values in both MF and FW were alllower than in 2011, dropping to USD $87.3 and $71.3 trillion/yr,respectively, from a 2011 value of USD $121.6 trillion/yr. The valuesin PR increased a small amount to USD $122.0 trillion/yr, mostly dueto the fact that marine unit values did not change, forest and grass-land/rangelands unit values decreased, and wetlands, croplands, andurban unit values increased. In the GT scenario, on the other hand,total global value increased to USD $152.3 trillion/yr (Table 2).
We note here the sensitivity of the results to assumptions aboutwetland land use changes. This category of land use was notincluded in the GTI scenarios, but we know, based on their unit val-ues, that wetlands are among the most valuable ecosystems on aper ha basis. The changes in wetland area are thus responsiblefor a major fraction of the changes in ecosystem services valuebetween scenarios, even though they represent a small fractionof total global land use. It is clear that changing the assumptionsabout wetland land use changes would affect these results, butwe feel that the direction of change and general conclusions wouldnot change.
9 We explicitly only present annual values over time and avoid Net Present Valueestimates and the discounting of future values that would entail.
Fig. 4 shows the total global annual ecosystem services valueswhen the unit values are unchanged from those used in 2011and only area extents are changed for each biome. MF and FWdecreased to USD $97.0 (11% more than with unit value changes)and $89.1 (25% more than with unit value changes) trillion/yr from2011 total values, respectively, when only the area was changed,keeping the unit values constant. Total PR values remained thesame at USD $122 trillion/yr while GT total values increased toUSD $127.0 trillion/yr (17% less than with unit value changes)when unit values were kept at 2011 levels (Table 3). This compar-ison shows that using 2011 unit values creates a pattern similar tothat when the unit values are changed for each scenario. The onlydifference is that the change to the total values for each scenario isreduced. This occurs because the changes in unit values amplifythe existing changes in area cover of the biomes. Changes in biomeareas produce significant changes in global ecosystem service val-ues, regardless of unit values.
The gross domestic product (GDP) for each scenario (obtainedfrom the GTI scenarios) is shown in Fig. 5. MF has the highestGDP since economic growth is the end goal of the society in thatscenario. PR follows closely behind as it fosters economic growthwhile simultaneously passing policies to preserve ecosystemsand the services they provide. GT comes third because even with-out the focus on economic growth, the society and economy arehealthy and prospering. FW’s is lowest since global society is dete-riorating, with social, environmental, and economic problemsreaching a point of collapse.
7.2. National implications
Using the global 1 km2 land use projections created for the fourscenarios, the change in estimated Total Ecosystem Service Value
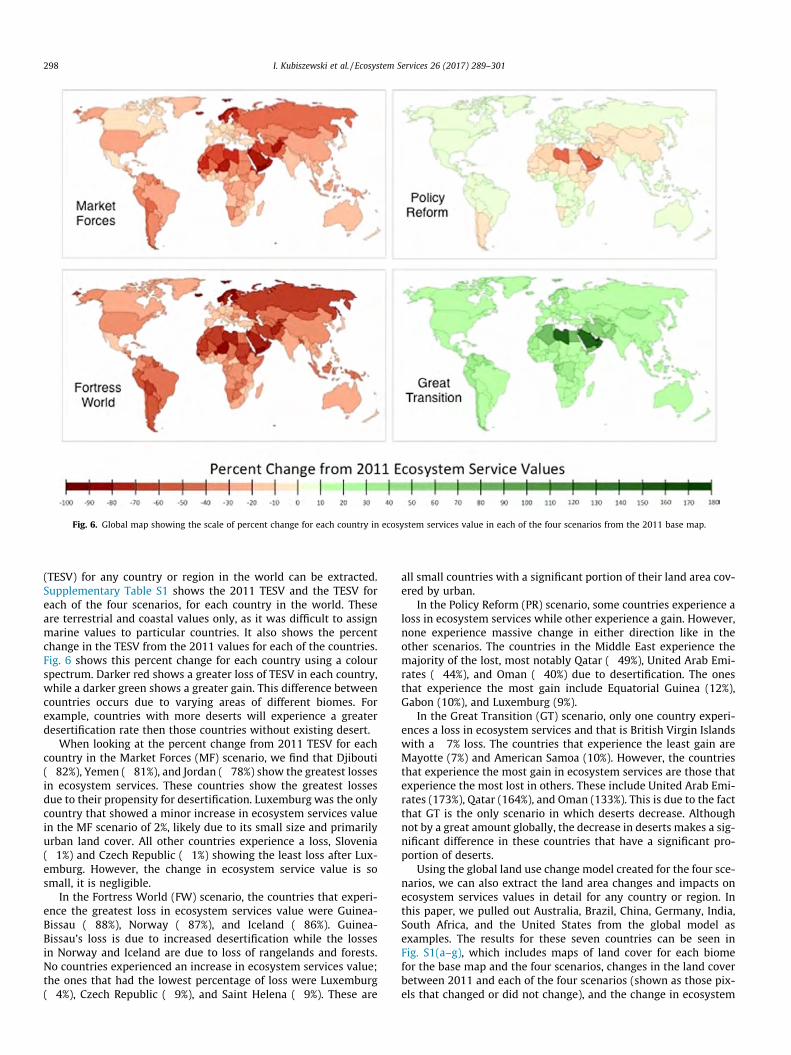
Fig. 6. Global map showing the scale of percent change for each country in ecosystem services value in each of the four scenarios from the 2011 base map.
298 I. Kubiszewski et al. / Ecosystem Services 26 (2017) 289–301
(TESV) for any country or region in the world can be extracted.Supplementary Table S1 shows the 2011 TESV and the TESV foreach of the four scenarios, for each country in the world. Theseare terrestrial and coastal values only, as it was difficult to assignmarine values to particular countries. It also shows the percentchange in the TESV from the 2011 values for each of the countries.Fig. 6 shows this percent change for each country using a colourspectrum. Darker red shows a greater loss of TESV in each country,while a darker green shows a greater gain. This difference betweencountries occurs due to varying areas of different biomes. Forexample, countries with more deserts will experience a greaterdesertification rate then those countries without existing desert.
When looking at the percent change from 2011 TESV for eachcountry in the Market Forces (MF) scenario, we find that Djibouti(�82%), Yemen (�81%), and Jordan (�78%) show the greatest lossesin ecosystem services. These countries show the greatest lossesdue to their propensity for desertification. Luxemburg was the onlycountry that showed a minor increase in ecosystem services valuein the MF scenario of 2%, likely due to its small size and primarilyurban land cover. All other countries experience a loss, Slovenia(�1%) and Czech Republic (�1%) showing the least loss after Lux-emburg. However, the change in ecosystem service value is sosmall, it is negligible.
In the Fortress World (FW) scenario, the countries that experi-ence the greatest loss in ecosystem services value were Guinea-Bissau (�88%), Norway (�87%), and Iceland (�86%). Guinea-Bissau’s loss is due to increased desertification while the lossesin Norway and Iceland are due to loss of rangelands and forests.No countries experienced an increase in ecosystem services value;the ones that had the lowest percentage of loss were Luxemburg(�4%), Czech Republic (�9%), and Saint Helena (�9%). These are
all small countries with a significant portion of their land area cov-ered by urban.
In the Policy Reform (PR) scenario, some countries experience aloss in ecosystem services while other experience a gain. However,none experience massive change in either direction like in theother scenarios. The countries in the Middle East experience themajority of the lost, most notably Qatar (�49%), United Arab Emi-rates (�44%), and Oman (�40%) due to desertification. The onesthat experience the most gain include Equatorial Guinea (12%),Gabon (10%), and Luxemburg (9%).
In the Great Transition (GT) scenario, only one country experi-ences a loss in ecosystem services and that is British Virgin Islandswith a �7% loss. The countries that experience the least gain areMayotte (7%) and American Samoa (10%). However, the countriesthat experience the most gain in ecosystem services are those thatexperience the most lost in others. These include United Arab Emi-rates (173%), Qatar (164%), and Oman (133%). This is due to the factthat GT is the only scenario in which deserts decrease. Althoughnot by a great amount globally, the decrease in deserts makes a sig-nificant difference in these countries that have a significant pro-portion of deserts.
Using the global land use change model created for the four sce-narios, we can also extract the land area changes and impacts onecosystem services values in detail for any country or region. Inthis paper, we pulled out Australia, Brazil, China, Germany, India,South Africa, and the United States from the global model asexamples. The results for these seven countries can be seen inFig. S1(a–g), which includes maps of land cover for each biomefor the base map and the four scenarios, changes in the land coverbetween 2011 and each of the four scenarios (shown as those pix-els that changed or did not change), and the change in ecosystem

Table 4The terrestrial values for ecosystem service in 7 countries and globally for the 2011 base and each of the four future scenarios.
Country Area(thousand km2)
ESV_2011(Billion $/yr)
S1_MF(Billion $/yr)
MF% changefrom 2011
S2_FW(Billion $/yr)
FW% changefrom 2011
S3_PR(Billion $/yr)
PR% changefrom 2011
S4_GT(Billion $/yr)
GT% changefrom 2011
Australia 7,719 $ 3,372 $ 2,730 �19% $ 2,391 �29% $ 3,360 0% $ 4,089 21%Brazil 8,524 $ 6,768 $ 4,727 �30% $ 3,717 �45% $ 6,868 1% $ 8,461 25%China 9,425 $ 3,587 $ 2,596 �28% $ 2,314 �35% $ 3,495 �3% $ 4,525 26%Germany 357 $ 197 $ 181 �8% $ 163 �17% $ 207 5% $ 242 23%India 3,167 $ 1,825 $ 1,563 �14% $ 1,358 �26% $ 1,834 0% $ 2,204 21%South Africa 1,171 $ 476 $ 399 �16% $ 351 �26% $ 478 0% $ 572 20%USA 9,470 $ 5,331 $ 4,123 �23% $ 3,279 �38% $ 5,395 1% $ 6,469 21%Global terrestrial 1,48,22,000 $ 71,971 $ 49,309 �31% $ 38,790 �46% $ 72,348 1% $ 90,044 25%
I. Kubiszewski et al. / Ecosystem Services 26 (2017) 289–301 299
services value from the 2011 values to each of the four scenarioswithin that country or region.
Table 4 shows the total ecosystem services values per year forthe 2011 base map and each of the seven countries, for each sce-nario. In MF and FW scenarios, all the countries experience a lossin ecosystem services. Brazil experiences most loss (�45%) in theFW scenario due to loss of tropical forests. This is still lower thanthe global average of �46%. In the PR scenario, none of the sevencountries experience major losses or gains in ecosystem services.The only one that experienced a loss was China (�3%) while Aus-tralia, India, and South African saw no net change. Brazil and theUS experience a positive change of 1% and Germany is the onlyone above the global average with an increase of 5%. In the GT sce-nario, the increase in ecosystem services in all the countries is inthe 20% range, a bit lower than the global average, which wasaround 35%. However the country maps and totals do not includemarine systems, which are picked up at the global scale.
As a check on the effects of unit value specificity and spatial res-olution and on the results, a comparison was done between theecosystem service values for individual nations determined by thisglobal model and more localized national studies. A 2013 nationalstudy found that the total ecosystem service value for the Kingdomof Bhutan was USD $15.5 billion/yr (Kubiszewski et al., 2013). Thecurrent global study determined that the total ecosystem servicesvalue of the same area was USD $14.9 billion/yr (SupplementaryTable S1), only a 4% difference. A similar comparison was donefor the country of South Africa. The current global study found thatthe total ecosystem service value in 2011 for South Africa was USD$476 billion/yr (Table 4). While a more detailed study found a totalecosystem service value for the same area of USD $515 billion/yr, adifference of just under 8% (Anderson et al., 2017). The relativelysmall differences found between the national studies and this glo-bal study suggests that the coarser spatial land use resolution ofthe global analysis and the use of global average unit values doesnot introduce significant differences in the total values, comparedwith higher spatial resolution national studies using more sitespecific unit values.
8. Conclusions
The large differences in the estimated total annual ecosystemservices values between each of the four scenarios shows the kindof impact that land-use and management decisions can have goingforward. A difference of USD 81 trillion/yr globally in the value ofecosystem services between the FW and GT scenarios can mean lifeor death for many people, especially those in developing countries(Adams et al., 2004). The GT scenario is an ecosystem servicesrestoration scenario. It can reverse the current trends in landdegradation and allow for a sustainable and desirable future, in aworld that also addresses climate change while enhancing othercritical services, especially those that are important to the poor.
We emphasize again that these results are estimates and scenar-ios, not measurements and predictions. We cannot predict thefuture, but we can create it based on the choices we make in thepresent. Our estimates are intended to help inform those choicesby making the connection clearer between future human wellbe-ing and the wellbeing of the rest of nature in quantitative termsthat highlight the decisions and trade-offs we have to make now.
The GT scenario (and to a lesser extent the PR scenario) can alsobe seen as embodying many of the goals recently agreed to by allcountries in the UN Sustainable Development Goals (SDG) process(United Nations, 2015). The GT scenario (and to a lesser extent thePR scenario) assumes reduced inequality, reduced hunger, bettermanagement of land and sea ecosystems, arresting climate change,sustainable production and consumption, and many other featuresalso listed among the 17 SDGs. Achieving the SDG’s will thus pro-vide a significant enhancement of ecosystem services and thispaper has provided one early estimate of the magnitude of thatpotential enhancement.
Our scenarios can help decision makers deal with uncertaintyand design policies to improve the chances of better futures actu-ally occurring. They can also be used to engage the larger public inthinking about the kind of future they really want. Scenarios can beused as the basis for public opinion surveys to gauge preferencesfor different futures at the global and national scales (Costanzaet al., 2015). Our results provide estimates of the changes inecosystem services that can be incorporated in these surveys.
Our approach in this study is admittedly simple and straightfor-ward. We do not imply that the unit values or the scenarios we useare precise estimates of the present or predictions of the future. Wemerely attempt to provide a spectrum of possibilities, which is allthat a scenario analysis can realistically hope to do. However, thesimplifying assumptions we make (extrapolation from a limitednumber of site-specific estimates, constant unit values per hectareper biome, not considering dynamic interdependencies, etc.) mostlikely lead to underestimates of the true value of ecosystem ser-vices (Boumans et al., 2002; Costanza et al., 2014), so we considerour estimates to be conservative.
Future work can improve and extend these initial estimates. Forexample, recent approaches to the uncertainty and transferabilityof monetary valuations can be used to better describe uncertaintyand improve benefit transfer based mapping (Schmidt et al., 2016).Using global and landscape scale computer simulation models canhelp create and evaluate integrated scenarios for ecosystemrestoration for comparison with business as usual (Boumanset al., 2002; Turner et al., 2016). These approaches hold significantpromise for reversing land degradation by using comprehensiveecological-economic frameworks, assessments, models and argu-ments as an aid for better decision-making.
To get there, these approaches need better integration intonational income and wealth accounts, assessments of environmen-tal costs and benefits in project appraisal, full cost accounting ofbusiness activities, and a range of other uses. There is significant

300 I. Kubiszewski et al. / Ecosystem Services 26 (2017) 289–301
progress in this direction with the advent of the IPBES, the Ecosys-tem Services Partnership, TruCost LLC, and many other global andregional initiatives. The SDGs recognize that the world we all wantis similar to the GT scenario. The missing facet of the SDGs is anoverarching goal with clear metrics of progress toward that goal.Another critical missing aspect is a dynamic model showing howthe 17 SDGs interact and trade-off with each other (Costanzaet al., 2016). Assessing the value of ecosystem services is centralto this task and allows us to build comprehensive, integrated mea-sures of sustainable wellbeing that can drive progress toward thatgoal.
Acknowledgements
This research was undertaken in collaboration with the Eco-nomics of Land Degradation Initiative (ELD), a project hosted byDeutsche Gesellschaft für Internationale Zusammenarbeit (GIZ)GmbH (German Federal Enterprise for International Cooperation).We would also like to thank Martino Pesaresi and other membersof the steering committee of the ‘Human Planet’ initiative, a part ofthe GEO Strategic Plan. Their Global Human Settlement Layer wasused to improve the urban extent of our ESV_Base product.
Appendix A. Supplementary data
Supplementary data associated with this article can be found, inthe online version, at http://dx.doi.org/10.1016/j.ecoser.2017.05.004.
References
Adams, W.M., Aveling, R., Brockington, D., Dickson, B., Elliott, J., Hutton, J., Roe, D.,Vira, B., Wolmer, W., 2004. Biodiversity conservation and the eradication ofpoverty. Science 306 (5699), 1146–1149.
Alexander, P., Prestele, R., Verburg, P.H., Arneth, A., Baranzelli, C., Batista e Silva, F.,Brown, C., Butler, A., Calvin, K., Dendoncker, N., Doelman, J.C., Dunford, R.,Engström, K., Eitelberg, D., Fujimori, S., Harrison, P.A., Hasegawa, T., Havlik, P.,Holzhauer, S., Humpenöder, F., Jacobs-Crisioni, C., Jain, A.K., Krisztin, T., Kyle, P.,Lavalle, C., Lenton, T., Liu, J., Meiyappan, P., Popp, A., Powell, T., Sands, R.D.,Schaldach, R., Stehfest, E., Steinbuks, J., Tabeau, A., van Meijl, H., Wise, M.A.,Rounsevell, M.D.A., 2017. Assessing uncertainties in land cover projections.Global Change Biol. 23 (2), 767–781.
Anderson, S., Giordano, A., Costanza, R., Kubiszewski, I., Sutton, P., Maes, J., Neale, A.,2017. National ecosystem service mapping approaches. In: Burkhard, B., Maes, J.(Eds.), Ecosystem Services Mapping. Pensoft Publishers, Bulgaria.
Balvanera, P., Uriarte, M., Almeida-Leñero, L., Altesor, A., DeClerck, F., Gardner, T.,Hall, J., Lara, A., Laterra, P., Peña-Claros, M., Silva Matos, D.M., Vogl, A.L.,Romero-Duque, L.P., Arreola, L.F., Caro-Borrero, Á.P., Gallego, F., Jain, M., Little,C., de Oliveira Xavier, R., Paruelo, J.M., Peinado, J.E., Poorter, L., Ascarrunz, N.,Correa, F., Cunha-Santino, M.B., Hernández-Sánchez, A.P., Vallejos, M., 2012.Ecosystem services research in Latin America: the state of the art. Ecosyst. Serv.2, 56–70.
Bateman, I.J., Harwood, A.R., Mace, G.M., Watson, R.T., Abson, D.J., Andrews, B.,Binner, A., Crowe, A., Day, B.H., Dugdale, S., Fezzi, C., Foden, J., Hadley, D.,Haines-Young, R., Hulme, M., Kontoleon, A., Lovett, A.A., Munday, P., Pascual, U.,Paterson, J., Perino, G., Sen, A., Siriwardena, G., van Soest, D., Termansen, M.,2013. Bringing ecosystem services into economic decision-making: land use inthe United Kingdom. Science 341 (6141), 45–50.
Baveye, P.C., Baveye, J., Gowdy, J., 2013. Monetary valuation of ecosystem services:it matters to get the timeline right. Ecol. Econ. 95, 231–235.
Beddoe, R., Costanza, R., Farley, J., Garza, E., Kent, J., Kubiszewski, I., Martinez, L.,McCowen, T., Murphy, K., Myers, N., Ogden, Z., Stapleton, K., Woodward, J.,2009. Overcoming systemic roadblocks to sustainability: the evolutionaryredesign of worldviews, institutions, and technologies. Proc. Natl. Acad. Sci. 106(8), 2483–2489.
Boumans, R., Costanza, R., Farley, J., Wilson, M.A., Portela, R., Rotmans, J., Villa, F.,Grasso, M., 2002. Modeling the dynamics of the integrated earth system and thevalue of global ecosystem services using the GUMBO model. Ecol. Econ. 41 (3),529–560.
Boumans, R., Roman, J., Altman, I., Kaufman, L., 2015. The Multiscale IntegratedModel of Ecosystem Services (MIMES): simulating the interactions of coupledhuman and natural systems. Ecosyst. Serv. 12, 30–41.
Braat, L., de Groot, R., 2012. The ecosystem services agenda: bridging the worlds ofnatural science and economics, conservation and development, and public andprivate policy. Ecosyst. Serv. 1, 4–15.
Costanza, R., 2000. Social goals and the valuation of ecosystem services. Ecosystems3 (1), 4–10.
Costanza, R., 2006. Nature: ecosystems without commodifying them. Nature 443,749.
Costanza, R., Kubiszewski, I., 2012. The authorship structure of ‘‘ecosystem services”as a transdisciplinary field of scholarship. Ecosyst. Serv. 1 (1), 16–25.
Costanza, R., dArge, R., de Groot, R., Farber, S., Grasso, M., Hannon, B., Limburg, K.,Naeem, S., Oneill, R.V., Paruelo, J., Raskin, R.G., Sutton, P., van den Belt, M., 1997.The value of the world’s ecosystem services and natural capital. Nature 387(6630), 253–260.
Costanza, R., de Groot, R., Sutton, P.C., van der Ploeg, S., Anderson, S., Kubiszewski, I.,Farber, S., Turner, R.K., 2014. Changes in the global value of ecosystem services.Global Environ. Change 26, 152–158.
Costanza, R., Kubiszewski, I., Cork, S., Atkins, P.W.B., Bean, A., Diamond, A., Grigg, N.,Korb, E., Logg-Scarvell, J., Navis, R., Patrick, K., 2015. Scenarios for Australia in2050: a synthesis and proposed survey. J. Future Stud. 19 (3), 49–76.
Costanza, R., Daly, L., Fioramonti, L., Giovannini, E., Kubiszewski, I., Mortensen, L.F.,Pickett, K.E., Ragnarsdottir, K.V., De Vogli, R., Wilkinson, R., 2016. Modelling andmeasuring sustainable wellbeing in connection with the UN sustainabledevelopment goals. Ecol. Econ. 130, 350–355.
Daly, H.E., 1998. The return of Lauderdale’s paradox. Ecol. Econ. 25, 21–23.de Groot, R., Brander, L., van der Ploeg, S., Costanza, R., Bernard, F., Braat, L., Christie,
M., Crossman, N., Ghermandi, A., Hein, L., Hussain, S., Kumar, P., McVittie, A.,Portela, R., Rodriguez, L.C., ten Brink, P., van Beukering, P., 2012. Globalestimates of the value of ecosystems and their services in monetary units.Ecosyst. Serv. 1 (1), 50–61.
Department of Trade and Industry (DTI), 2003. Foresight Futures 2020: RevisedScenarios and Guidance. Department of Trade and Industry, London.
Donovan, S., Goldfuss, C., Holdren, J., 2015. Incorporating Ecosystem Services intoFederal Decision Making. M-16-01. Executive Office of the President of theUnited States. Washington, DC.
Egoh, B.N., O’Farrell, P.J., Charef, A., Josephine Gurney, L., Koellner, T., Nibam Abi, H.,Egoh, M., Willemen, L., 2012. An African account of ecosystem service provision:use, threats and policy options for sustainable livelihoods. Ecosyst. Serv. 2, 71–81.
Farber, S.C., Costanza, R., Wilson, M.A., 2002. Economic and ecological concepts forvaluing ecosystem services. Ecol. Econ. 41 (3), 375–392.
Gallopín, G., Hammond, A., Raskin, P., Swart, R., 1997. Branch points: Globalscenarios and human choice. Stockholm Environment Institute, Stockholm,Sweden.
Gascoigne, W.R., Hoag, D., Koontz, L., Tangen, B.A., Shaffer, T.L., Gleason, R.A., 2011.Valuing ecosystem and economic services across land-use scenarios in thePrairie Pothole Region of the Dakotas, USA. Ecol. Econ. 70 (10), 1715–1725.
Hunt, D.V.L., Lombardi, D.R., Atkinson, S., Barber, A.R.G., Barnes, M., Boyko, C.T.,Brown, J., Bryson, J., Butler, D., Caputo, S., Caserio, M., Coles, R., Cooper, R.F.D.,Farmani, R., Gaterell, M., Hale, J., Hales, C., Hewitt, C.N., Jankovic, L., Jefferson, I.,Leach, J., MacKenzie, A.R., Memon, F.A., Sadler, J.P., Weingaertner, C., Whyatt, J.D., Rogers, C.D.F., 2012. Scenario archetypes: converging rather than divergingthemes. Sustainability 4 (4), 740–772.
IPBES, 2016. The methodological assessment report on scenarios and models ofbiodiversity and ecosystem services. Bonn, Germany, Secretariat of theIntergovernmental Science-Policy Platform on Biodiversity and EcosystemServices, Bonn, Germany. 348 pages.
Jacobs, S., Dendoncker, N., Martín-López, B., Barton, D.N., Gomez-Baggethun, E.,Boeraeve, F., McGrath, F.L., Vierikko, K., Geneletti, D., Sevecke, Katharina J.,Pipart, N., Primmer, E., Mederly, P., Schmidt, S., Aragão, A., Baral, H., Bark,Rosalind H., Briceno, T., Brogna, D., Cabral, P., De Vreese, R., Liquete, C., Mueller,H., Peh, K.S.H., Phelan, A., Rincón, Alexander R., Rogers, S.H., Turkelboom, F., VanReeth, W., van Zanten, B.T., Wam, H.K., Washbourne, C.-L., 2016. A newvaluation school: integrating diverse values of nature in resource and land usedecisions. Ecosyst. Serv. 22, 213–220. Part B.
Kubiszewski, I., Farley, J., Costanza, R., 2010. The production and allocation ofinformation as a good that is enhanced with increased use. Ecol. Econ. 69, 1344–1354.
Kubiszewski, I., Costanza, R., Dorji, P., Thoennes, P., Tshering, K., 2013. An initialestimate of the value of ecosystem services in Bhutan. Ecosyst. Serv. 3, e11–e21.
Lenton, T.M., Held, H., Kriegler, E., Hall, J.W., Lucht, W., Rahmstorf, S., Schellnhuber,H.J., 2008. Tipping elements in the earth’s climate system. Proc. Natl. Acad. Sci.105 (6), 1786.
Maes, J., Egoh, B., Willemen, L., Liquete, C., Vihervaara, P., Schägner, J.P., Grizzetti, B.,Drakou, E.G., Notte, A.L., Zulian, G., Bouraoui, F., Luisa Paracchini, M., Braat, L.,Bidoglio, G., 2012. Mapping ecosystem services for policy support and decisionmaking in the European Union. Ecosyst. Serv. 1 (1), 31–39.
McCauley, D.J., 2006. Selling out on nature. Nature 443, 27–28.McGrail, S., 2011. Environmentalism in transition? emerging perspectives, issues
and futures practices in contemporary environmentalism. J. Futures Stud. 15(3), 117–144.
Millennium Ecosystem Assessment (MEA), 2005. Ecosystems and Human Well-Being: Synthesis. Island Press.
Mitsch, W.J., Day Jr., J.W., 2006. Restoration of wetlands in the Mississippi–Ohio–Missouri (MOM) river basin: experience and needed research. Ecol. Eng. 26 (1),55–69.
Molnar, J.L., Kubiszewski, I., 2012. Managing natural wealth: research andimplementation of ecosystem services in the United States and Canada.Ecosyst. Serv. 2, 45–55.

I. Kubiszewski et al. / Ecosystem Services 26 (2017) 289–301 301
O’Brien, P., 2000. Scenario Planning: A Strategic Tool. Bureau of Rural Sciences,Canberra.
O’Neill, B.C., Kriegler, E., Ebi, K.L., Kemp-Benedict, E., Riahi, K., Rothman, D.S., vanRuijven, B.J., van Vuuren, D.P., Birkmann, J., Kok, K., Levy, M., Solecki, W., 2017.The roads ahead: narratives for shared socioeconomic pathways describingworld futures in the 21st century. Global Environ. Change 42, 169–180.
Pascual, U., Balvanera, P., Díaz, S., Pataki, G., Roth, E., Stenseke, M., Watson, R.T.,Bas�ak Dessane, E., Islar, M., Kelemen, E., Maris, V., Quaas, M., Subramanian, S.M.,Wittmer, H., Adlan, A., Ahn, S., Al-Hafedh, Y.S., Amankwah, E., Asah, S.T., Berry,P., Bilgin, A., Breslow, S.J., Bullock, C., Cáceres, D., Daly-Hassen, H., Figueroa, E.,Golden, C.D., Gómez-Baggethun, E., González-Jiménez, D., Houdet, J., Keune, H.,Kumar, R., Ma, K., May, P.H., Mead, A., O’Farrell, P., Pandit, R., Pengue, W., Pichis-Madruga, R., Popa, F., Preston, S., Pacheco-Balanza, D., Saarikoski, H., Strassburg,B.B., van den Belt, M., Verma, M., Wickson, F., Yagi, N., 2017. Valuing nature’scontributions to people: the IPBES approach. Curr. Opin. Environ. Sustainability26–27, 7–16.
Peterson, G., Cumming, G., Carpenter, S., 2003. Scenario planning: a tool forconservation in an uncertain world. Conserv. Biol. 17 (2), 358–366.
Pittock, J., Cork, S., Maynard, S., 2012. The state of the application of ecosystemsservices in Australia. Ecosyst. Serv. 1 (1), 111–120.
Popp, A., Calvin, K., Fujimori, S., Havlik, P., Humpenöder, F., Stehfest, E., Bodirsky, B.L., Dietrich, J.P., Doelmann, J.C., Gusti, M., Hasegawa, T., Kyle, P., Obersteiner, M.,Tabeau, A., Takahashi, K., Valin, H., Waldhoff, S., Weindl, I., Wise, M., Kriegler, E.,Lotze-Campen, H., Fricko, O., Riahi, K., Vuuren, D.P.v., 2017. Land-use futures inthe shared socio-economic pathways. Global Environ. Change 42, 331–345.
Raskin, P., Banuri, T., Gallopin, G., Gutman, P., Hammond, A., Kates, R., Swart, R.,2002. Great transition: the promise of lure of the times ahead. StockholmEnvironment Institute, Boston.
Rees, W.E., 2006. Ecological footprints and biocapacity: essential elements insustainability assessment. In: Dewulf, J., Van Langenhove, H. (Eds.),Renewables-Based Technology. John Wiley & Sons, Ltd, Chichester, UK, pp.143–157.
Riahi, K., van Vuuren, D.P., Kriegler, E., Edmonds, J., O’Neill, B.C., Fujimori, S., Bauer,N., Calvin, K., Dellink, R., Fricko, O., Lutz, W., Popp, A., Cuaresma, J.C., Kc, S.,Leimbach, M., Jiang, L., Kram, T., Rao, S., Emmerling, J., Ebi, K., Hasegawa, T.,
Havlik, P., Humpenöder, F., Da Silva, L.A., Smith, S., Stehfest, E., Bosetti, V., Eom,J., Gernaat, D., Masui, T., Rogelj, J., Strefler, J., Drouet, L., Krey, V., Luderer, G.,Harmsen, M., Takahashi, K., Baumstark, L., Doelman, J.C., Kainuma, M., Klimont,Z., Marangoni, G., Lotze-Campen, H., Obersteiner, M., Tabeau, A., Tavoni, M.,2017. The shared socioeconomic pathways and their energy, land use, andgreenhouse gas emissions implications: an overview. Global Environ. Change42, 153–168.
Schmidt, S., Manceur, A.M., Seppelt, R., 2016. Uncertainty of monetary valuedecosystem services – value transfer functions for global mapping. PLoS One 11(3), 1–22.
Sukhdev, P., Kumar, P., 2010. The Economics of Ecosystems and Biodiversity (TEEB).European Communities Brussels. http://www.TEEBweb.org.
Sutton, P.C., Anderson, S.J., Costanza, R., Kubiszewski, I., 2016. The ecologicaleconomics of land degradation: impacts on ecosystem service values. Ecol.Econ. 129, 182–192.
Turner, K.G., Anderson, S., Gonzales-Chang, M., Costanza, R., Courville, S., Dalgaard,T., Dominati, E., Kubiszewski, I., Ogilvy, S., Porfirio, L., Ratna, N., Sandhu, H.,Sutton, P.C., Svenning, J.-C., Turner, G.M., Varennes, Y.-D., Voinov, A., Wratten, S.,2016. A review of methods, data, and models to assess changes in the value ofecosystem services from land degradation and restoration. Ecol. Model. 319,190–207.
United Nations, 2015. Transforming our World: The 2030 Agenda for SustainableDevelopment. Outcome document for the UN Summit to Adopt the Post-2015Development Agenda, New York.
van der Ploeg, S., De Groot, R.S., Wang, Y., 2010. The TEEB Valuation Database:overview of structure, data, and results. Foundation for SustainableDevelopment, Wageningen, Netherlands. http://www.fsd.nl/esp/77979/5/0/30.
van Vuuren, D.P., Kok, M.T.J., Girod, B., Lucas, P.L., de Vries, B., 2012. Scenarios inglobal environmental assessments: key characteristics and lessons for futureuse. Global Environ. Change 22 (4), 884–895.
Wackernagel, M., Rees, W.E., 1996. Our ecological footprint: reducing humanimpact on the earth. New Society Publishers, Gabriola Island.
Westman, W.E., 1977. How much are nature’s services worth? Science 197 (4307),960–964.