the gabelli utilities fund - gamco investors, inc. | … also consider changes in economic and...
TRANSCRIPT
To Our Shareholders,
For the year ended December 31, 2017, the net asset value (“NAV”) per Class AAA Share of The GabelliUtilities Fund increased 8.9% compared with an increase of 12.1% for the Standard & Poor’s (“S&P”) 500Utilities Index (SPU). Other classes of shares are available. See page 2 for performance information for allclasses of shares.
Enclosed are the financial statements, including the schedule of investments, as of December 31, 2017.
Performance Discussion (Unaudited)
The objective of the Fund is to provide a high level of total return through a combination of capital appreciationand current income.
The investment strategy of the Fund is to invest at least 80% of its net assets in securities of domestic orforeign companies that are involved to a substantial extent in providing products, services, or equipment forthe generation or distribution of electricity, gas, and water and the provision of infrastructure operations ortelecommunications services, such as telephone, telegraph, satellite, cable, microwave, radiotelephone, mobilecommunication and cellular, paging, electronic mail, videotext, voice communications, data communications,and internet and that derive at least 50% of their revenue or earnings from, or devote at least 50% of theirassets to, utilities that the Fund’s investment adviser, Gabelli Funds, LLC (the “Adviser”), believes have thepotential to provide either capital appreciation or current income. The Fund may invest up to 40% of its totalassets in securities of non-U.S. issuers.
In selecting investments, the Adviser will consider factors such as: (i) the market price of the issuer’s commonstock, earnings expectations, earnings and price histories, balance sheet characteristics, perceived managementskills, and the conditions affecting the industry in which the issuer practices; (ii) the level of interest rates, localand national government regulations, the price and availability of materials used in the particular utility, environmentalprotection or energy conservation regulations, the level of demand for services, and the risks associated withconstructing and operating certain kinds of facilities such as nuclear power facilities; (iii) the potential for capitalappreciation of the stock; (iv) the dividend income generated by the stock; (v) the prices of the stock relativeto other comparable stocks; and (vi) the diversification of the portfolio of the Fund as to issuers. The Adviserwill also consider changes in economic and political outlooks as well as individual corporate developments.
In 2017, most electric, gas, and water utility stocks returned high single digits with top performances comingfrom renewable developers. The utility sector also had seven announced mergers. Despite a more lenientEnvironmental Protection Agency, withdrawal from the Paris Agreement on climate change, an end to the CleanPower Plan, and federal and state efforts to subsidize older baseload coal and nuclear generation, the nation’spower sector is experiencing an accelerated “greening” including the rapid development of wind and solargeneration and the retirement of older coal and nuclear units. In December, the Federal Reserve raised rates0.25% for the fifth time in two years, ending the year in the 1.25%-1.50% range.
Among the better performing stocks for the fiscal year were Nextera Energy Inc. (4.4% net assets as of December31, 2017), the world’s largest utility company with a market capitalization of more than $62 billion. NextEra’selectric utility subsidiary, Florida Power & Light Company, assembled and pre-positioned the largest restorationworkforce in U.S. history in order to restore service to 4.4 million customers after Hurricane Irma. Other contributorsto the Fund include PNM Resources Inc. (2.9%), which serves electricity to over 761,000 homes and businesses
The Gabelli Utilities FundAnnual Report — December 31, 2017
in Texas and New Mexico, and outperformed the industry in the second half of 2017, and Sony Corp (1.2%),whose stock advanced in 2017 due to its diversified product range and gaming and networking services.
Some of our weaker performers were Scana Corp. (0.8%), a South Carolina energy based holding companywhich lost $210 million associated with an abandoned nuclear project, Dish Network Corp. (0.9%) an Americanbased direct-broadcast satellite service provider who cut 145,000 subscribers after Hurricane Maria took outpower in Puerto Rico and the U.S. Virgin Islands, and Windstream Holdings Inc. (0.05%) a provider of advancednetwork communications and technology solutions which cut its very attractive dividend payout to zero in earlyAugust.
Thank you for your investment in the Gabelli Utilities Fund.
We appreciate your confidence and trust.
Comparative Results
Average Annual Returns through December 31, 2017 (a) (Unaudited)
1 Year 5 Year 10 Year 15 Year
SinceInception(8/31/99)
Class AAA (GABUX) . . . . . . . . . . . . . . . . . . . . . . . . . . . . . . . . . . . . . . . 8.93% 8.87% 5.93% 9.41% 7.77%S&P 500 Utilities Index. . . . . . . . . . . . . . . . . . . . . . . . . . . . . . . . . . . . . . . 12.11 12.62 6.31 11.15 6.86S&P 500 Index . . . . . . . . . . . . . . . . . . . . . . . . . . . . . . . . . . . . . . . . . . . . 21.83 15.79 8.50 9.92 5.94Lipper Utility Fund Average . . . . . . . . . . . . . . . . . . . . . . . . . . . . . . . . . . . . 11.46 10.12 5.58 10.44 6.63Class A (GAUAX). . . . . . . . . . . . . . . . . . . . . . . . . . . . . . . . . . . . . . . . . . 8.79 8.85 5.93 9.43 7.78With sales charge (b). . . . . . . . . . . . . . . . . . . . . . . . . . . . . . . . . . . . . . . . 2.53 7.57 5.30 9.00 7.44Class C (GAUCX). . . . . . . . . . . . . . . . . . . . . . . . . . . . . . . . . . . . . . . . . . 8.04 8.07 5.14 8.61 7.12With contingent deferred sales charge (c) . . . . . . . . . . . . . . . . . . . . . . . . . . 7.04 8.07 5.14 8.61 7.12Class I (GAUIX) . . . . . . . . . . . . . . . . . . . . . . . . . . . . . . . . . . . . . . . . . . . 9.11 9.13 6.18 9.58 7.91Class T (GAUTX) . . . . . . . . . . . . . . . . . . . . . . . . . . . . . . . . . . . . . . . . . . 8.81 8.85 5.92 9.41 7.77With sales charge (d). . . . . . . . . . . . . . . . . . . . . . . . . . . . . . . . . . . . . . . . 6.09 8.30 5.65 9.22 7.76In the current prospectuses dated April 28, 2017, as amended, the expense ratios for Class AAA, A, C, I, and T Shares are 1.38%, 1.38%,2.13%, 1.13%, and 1.38%, respectively. See page 13 for the expense ratios for the year ended December 31, 2017. Class AAA and Class IShares do not have a sales charge. The maximum sales charge for Class A, Class C, and Class T Shares is 5.75%, 1.00%, and 2.50%,respectively.(a) Returns represent past performance and do not guarantee future results. Total returns and average annual returns reflect changes in share price,
reinvestment of distributions, and are net of expenses. Investment returns and the principal value of an investment will fluctuate. When shares areredeemed, they may be worth more or less than their original cost. Current performance may be lower or higher than the performance datapresented. Visit www.gabelli.com for performance information as of the most recent month end. Returns would have been lower had Gabelli Funds,LLC, the Adviser, not reimbursed certain expenses of the Fund for periods prior to December 31, 2002. The Fund imposes a 2% redemption fee onshares sold or exchanged within seven days of purchase. Investors should carefully consider the investment objectives, risks, charges, andexpenses of the Fund before investing. The prospectuses contain information about these and other matters and should be read carefully beforeinvesting. To obtain a prospectus, please visit our website at www.gabelli.com. The value of utility stocks generally changes as long term interestrates change. Funds investing in a single sector, such as utilities, may be subject to more volatility than funds that invest more broadly. The utilitiesindustry can be significantly affected by government regulation, financing difficulties, supply or demand of services or fuel, and natural resourcesconservation. The Class AAA Share NAVs are used to calculate performance for the periods prior to the issuance of Class A Shares and Class CShares on December 31, 2002, Class I Shares on January 11, 2008, and Class T Shares on July 5, 2017. The actual performance of the Class AShares, Class C Shares, and Class T Shares would have been lower due to the additional fees and expenses associated with these classes ofshares. The actual performance of the Class I Shares would have been higher due to lower expenses related to this class of shares. The S&P 500Utilities Index is an unmanaged market capitalization weighted index of large capitalization stocks that may include facilities generation andtransmission or distribution of electricity, gas, or water. The S&P 500 Index is a market capitalization weighted index of 500 large capitalizationstocks commonly used to represent the U.S. equity market. The Lipper Utility Fund Average reflects the average performance of mutual fundsclassified in this particular category. Dividends are considered reinvested. You cannot invest directly in an index.
(b) Performance results include the effect of the maximum 5.75% sales charge at the beginning of the period.(c) Assuming payment of the 1% maximum contingent deferred sales charge imposed on redemptions made within one year of purchase.(d) Performance results include the effect of the maximum 2.50% sales charge at the beginning of the period.
2
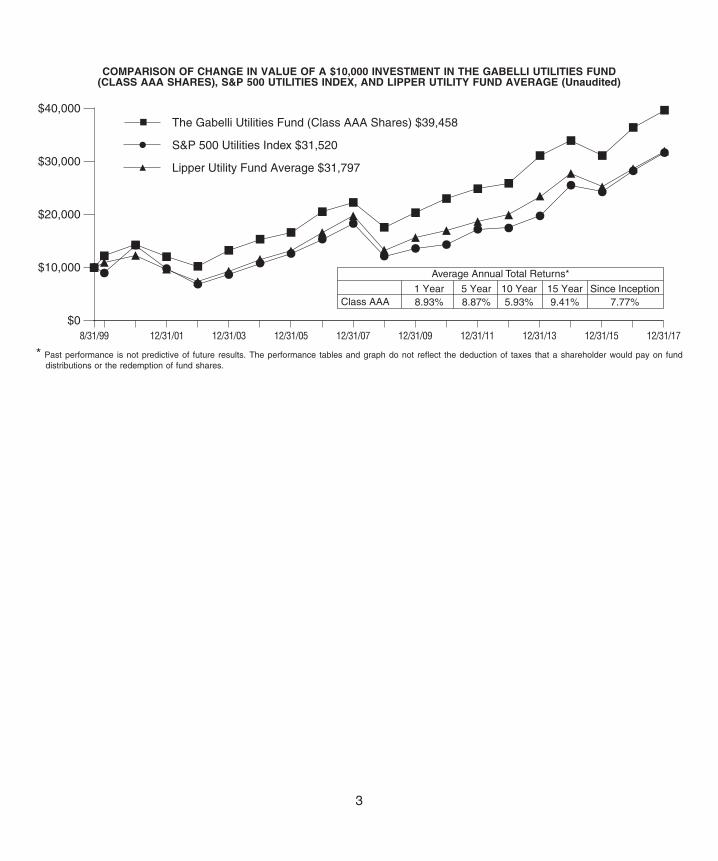
COMPARISON OF CHANGE IN VALUE OF A $10,000 INVESTMENT IN THE GABELLI UTILITIES FUND(CLASS AAA SHARES), S&P 500 UTILITIES INDEX, AND LIPPER UTILITY FUND AVERAGE (Unaudited)
$0
$10,000
$40,000
$20,000
$30,000 Lipper Utility Fund Average $31,797
S&P 500 Utilities Index $31,520
The Gabelli Utilities Fund (Class AAA Shares) $39,458
8/31/99 12/31/01 12/31/03 12/31/07 12/31/11 12/31/1712/31/13 12/31/1512/31/0912/31/05
Average Annual Total Returns*
Since InceptionClass AAA 8.87%8.93% 5.93% 9.41% 7.77%
10 Year 15 Year5 Year1 Year
* Past performance is not predictive of future results. The performance tables and graph do not reflect the deduction of taxes that a shareholder would pay on funddistributions or the redemption of fund shares.
3

We believe it is important for you to understand theimpact of fees and expenses regarding your investment.All mutual funds have operating expenses. As ashareholder of a fund, you incur ongoing costs, whichinclude costs for portfolio management, administrativeservices, and shareholder reports (like this one), amongothers. Operating expenses, which are deducted froma fund’s gross income, directly reduce the investmentreturn of a fund. When a fund’s expenses are expressedas a percentage of its average net assets, this figureis known as the expense ratio. The following examplesare intended to help you understand the ongoing costs(in dollars) of investing in your Fund and to comparethese costs with those of other mutual funds. The examplesare based on an investment of $1,000 made at thebeginning of the period shown and held for the entireperiod.
The Expense Table below illustrates your Fund’s costsin two ways:
Actual Fund Return: This section provides informationabout actual account values and actual expenses. Youmay use this section to help you to estimate the actualexpenses that you paid over the period after any feewaivers and expense reimbursements. The “EndingAccount Value” shown is derived from the Fund’sactual return during the past six months, and the“Expenses Paid During Period” shows the dollar amountthat would have been paid by an investor who startedwith $1,000 in the Fund. You may use this information,together with the amount you invested, to estimate theexpenses that you paid over the period.
To do so, simply divide your account value by $1,000(for example, an $8,600 account value divided by $1,000= 8.6), then multiply the result by the number givenfor your Fund under the heading “Expenses Paid DuringPeriod” to estimate the expenses you paid during thisperiod.
Hypothetical 5% Return: This section providesinformation about hypothetical account values andhypothetical expenses based on the Fund’s actual expenseratio. It assumes a hypothetical annualized return of5% before expenses during the period shown. In thiscase – because the hypothetical return used is not
the Fund’s actual return – the results do not apply toyour investment and you cannot use the hypotheticalaccount value and expense to estimate the actual endingaccount balance or expenses you paid for the period.This example is useful in making comparisons of theongoing costs of investing in the Fund and other funds.To do so, compare this 5% hypothetical example withthe 5% hypothetical examples that appear in shareholderreports of other funds.
Please note that the expenses shown in the table aremeant to highlight your ongoing costs only and do notreflect any transactional costs such as sales charges(loads), redemption fees, or exchange fees, if any, whichare described in the Prospectus. If these costs wereapplied to your account, your costs would be higher.Therefore, the 5% hypothetical return is useful in comparingongoing costs only, and will not help you determinethe relative total costs of owning different funds. The“Annualized Expense Ratio” represents the actualexpenses for the last six months and may be differentfrom the expense ratio in the Financial Highlights whichis for the year ended December 31, 2017.
BeginningAccount Value
07/01/17
EndingAccount Value
12/31/17
AnnualizedExpense
Ratio
ExpensesPaid During
Period*
The Gabelli Utilities FundActual Fund ReturnClass AAA $1,000.00 $1,034.20 1.36% $ 6.97Class A $1,000.00 $1,032.60 1.36% $ 6.97Class C $1,000.00 $1,029.20 2.11% $10.79Class I $1,000.00 $1,034.90 1.11% $ 5.69Class T** $1,000.00 $1,033.10 1.37% $ 6.87Hypothetical 5% ReturnClass AAA $1,000.00 $1,018.35 1.36% $ 6.92Class A $1,000.00 $1,018.35 1.36% $ 6.92Class C $1,000.00 $1,014.57 2.11% $10.71Class I $1,000.00 $1,019.61 1.11% $ 5.65Class T $1,000.00 $1,018.30 1.37% $ 6.97
* Expenses are equal to the Fund’s annualized expense ratio forthe last six months multiplied by the average account value overthe period, multiplied by the number of days in the most recentfiscal half year (184 days), then divided by 365.
** Class T Shares use a beginning account value date of 07/05/17,and Class T Share expenses are equal to the Funds’ annualizedexpense ratio for the period since inception multiplied by the numberof days since inception (180 days), then divided by 365.
The Gabelli Utilities FundDisclosure of Fund Expenses (Unaudited)For the Six Month Period from July 1, 2017 through December 31, 2017 Expense Table
4
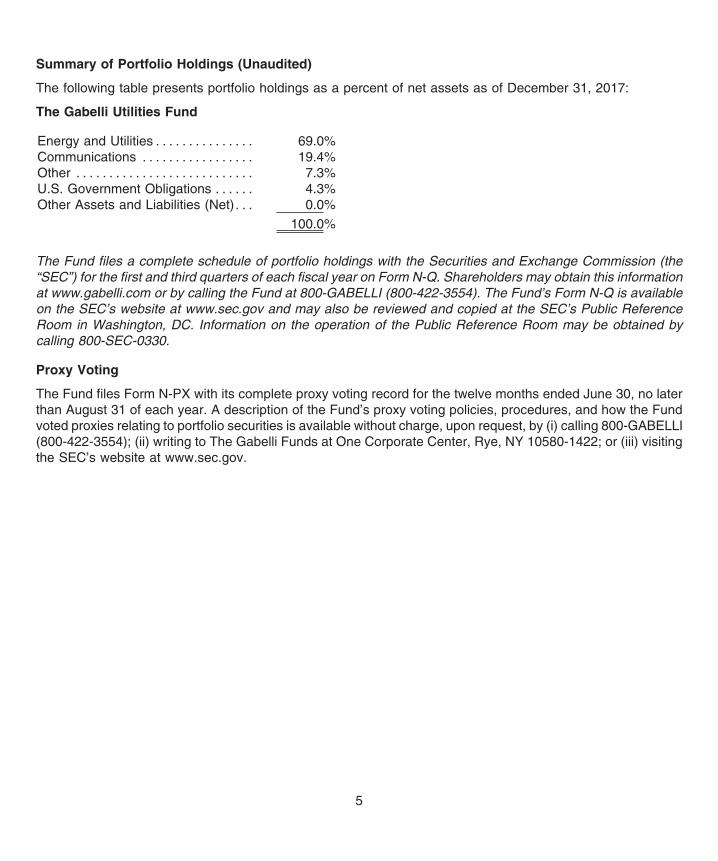
The following table presents portfolio holdings as a percent of net assets as of December 31, 2017:
The Gabelli Utilities Fund
Energy and Utilities . . . . . . . . . . . . . . . 69.0%Communications . . . . . . . . . . . . . . . . . 19.4%Other . . . . . . . . . . . . . . . . . . . . . . . . . . . 7.3%U.S. Government Obligations . . . . . . 4.3%Other Assets and Liabilities (Net). . . 0.0%
100.0%
The Fund files a complete schedule of portfolio holdings with the Securities and Exchange Commission (the“SEC”) for the first and third quarters of each fiscal year on Form N-Q. Shareholders may obtain this informationat www.gabelli.com or by calling the Fund at 800-GABELLI (800-422-3554). The Fund’s Form N-Q is availableon the SEC’s website at www.sec.gov and may also be reviewed and copied at the SEC’s Public ReferenceRoom in Washington, DC. Information on the operation of the Public Reference Room may be obtained bycalling 800-SEC-0330.
Proxy Voting
The Fund files Form N-PX with its complete proxy voting record for the twelve months ended June 30, no laterthan August 31 of each year. A description of the Fund’s proxy voting policies, procedures, and how the Fundvoted proxies relating to portfolio securities is available without charge, upon request, by (i) calling 800-GABELLI(800-422-3554); (ii) writing to The Gabelli Funds at One Corporate Center, Rye, NY 10580-1422; or (iii) visitingthe SEC’s website at www.sec.gov.
Summary of Portfolio Holdings (Unaudited)
5

Shares CostMarketValue
COMMON STOCKS — 95.5%ENERGY AND UTILITIES — 68.8%Alternative Energy — 0.5%
370,000 Algonquin Power & UtilitiesCorp. . . . . . . . . . . . . . . . . . . . . . . $ 2,068,158 $ 4,138,584
36,000 NextEra Energy Partners LP . . . 831,843 1,551,96063,261 Ormat Technologies Inc.,
New York . . . . . . . . . . . . . . . . . . 1,599,251 4,046,1746,739 Ormat Technologies Inc.,
Tel Aviv . . . . . . . . . . . . . . . . . . . . 196,537 431,8824,695,789 10,168,600
Electric Integrated — 42.5%304,000 ALLETE Inc. . . . . . . . . . . . . . . . . . . 10,925,762 22,605,440174,000 Alliant Energy Corp.. . . . . . . . . . . 3,065,132 7,414,140550,000 Ameren Corp.. . . . . . . . . . . . . . . . . 16,055,895 32,444,500700,000 American Electric Power Co.
Inc. . . . . . . . . . . . . . . . . . . . . . . . . 28,398,312 51,499,0006,000 Atlantic Power Corp.† . . . . . . . . . 36,882 14,272
180,000 Avangrid Inc. . . . . . . . . . . . . . . . . . 6,737,133 9,104,400290,000 Avista Corp. . . . . . . . . . . . . . . . . . . 7,089,367 14,932,100474,000 Black Hills Corp. . . . . . . . . . . . . . . 12,124,989 28,492,14050,000 Calpine Corp.† . . . . . . . . . . . . . . . . 769,990 756,50060,000 CMS Energy Corp. . . . . . . . . . . . . 402,675 2,838,000
165,000 Dominion Energy Inc. . . . . . . . . . 7,995,789 13,374,9004,000 DTE Energy Co. . . . . . . . . . . . . . . . 151,595 437,840
298,000 Duke Energy Corp. . . . . . . . . . . . . 16,331,147 25,064,780620,000 Edison International. . . . . . . . . . . 22,591,991 39,208,800814,000 El Paso Electric Co. . . . . . . . . . . . 18,108,780 45,054,900
1,400 Entergy Corp. . . . . . . . . . . . . . . . . . 96,612 113,946800,000 Eversource Energy . . . . . . . . . . . . 18,567,363 50,544,000355,000 Exelon Corp.. . . . . . . . . . . . . . . . . . 11,212,577 13,990,550380,000 FirstEnergy Corp. . . . . . . . . . . . . . 11,038,618 11,635,60078,960 Fortis Inc. . . . . . . . . . . . . . . . . . . . . 2,450,129 2,895,463
111,040 Fortis Inc., Toronto. . . . . . . . . . . . 3,472,604 4,073,233900,000 Great Plains Energy Inc.. . . . . . . 19,787,986 29,016,000915,000 Hawaiian Electric Industries
Inc. . . . . . . . . . . . . . . . . . . . . . . . . 21,821,324 33,077,25042,000 IDACORP Inc. . . . . . . . . . . . . . . . . 1,703,782 3,837,120
311,000 MGE Energy Inc. . . . . . . . . . . . . . . 9,537,543 19,624,100630,500 NextEra Energy Inc. . . . . . . . . . . . 40,112,079 98,477,795260,000 NiSource Inc. . . . . . . . . . . . . . . . . . 2,319,251 6,674,200434,000 NorthWestern Corp.. . . . . . . . . . . 11,726,586 25,909,800785,000 OGE Energy Corp.. . . . . . . . . . . . . 13,193,046 25,834,350740,000 Otter Tail Corp. . . . . . . . . . . . . . . . 17,917,539 32,893,000137,000 PG&E Corp. . . . . . . . . . . . . . . . . . . 5,207,891 6,141,710320,000 Pinnacle West Capital Corp. . . . 13,092,833 27,257,600
1,610,000 PNM Resources Inc. . . . . . . . . . . 20,018,302 65,124,500572,000 PPL Corp. . . . . . . . . . . . . . . . . . . . . 17,657,112 17,703,400190,000 Public Service Enterprise
Group Inc. . . . . . . . . . . . . . . . . . 5,490,935 9,785,000439,112 SCANA Corp. . . . . . . . . . . . . . . . . . 17,341,443 17,467,875430,000 The Southern Co. . . . . . . . . . . . . . 15,474,375 20,678,700
Shares CostMarketValue
51,125 Unitil Corp. . . . . . . . . . . . . . . . . . . . $ 1,483,755 $ 2,332,323440,000 Vectren Corp. . . . . . . . . . . . . . . . . . 12,163,963 28,608,800597,000 WEC Energy Group Inc. . . . . . . . 16,121,112 39,658,710920,000 Westar Energy Inc.. . . . . . . . . . . . 22,248,661 48,576,000310,000 Xcel Energy Inc. . . . . . . . . . . . . . . 6,350,159 14,914,100
488,393,019 950,086,837
Electric Transmission and Distribution — 0.6%67,000 Consolidated Edison Inc. . . . . . . 2,745,224 5,691,650
360,000 Red Electrica Corp. SA . . . . . . . . 4,191,840 8,081,6863,400 Uniper SE . . . . . . . . . . . . . . . . . . . . 38,231 106,066
6,975,295 13,879,402
Global Utilities — 2.0%11,352 AES Tiete Energia SA . . . . . . . . . 155,996 43,63440,000 Chubu Electric Power Co. Inc. . 671,887 497,18228,000 E.ON SE . . . . . . . . . . . . . . . . . . . . . . 524,216 304,41120,800 EDF SA . . . . . . . . . . . . . . . . . . . . . . . 308,177 260,0505,000 EDP - Energias de Portugal
SA, ADR . . . . . . . . . . . . . . . . . . . 134,159 173,300200,000 Electric Power Development
Co. Ltd. . . . . . . . . . . . . . . . . . . . . 4,991,198 5,387,17510,000 Eletropaulo Metropolitana
Eletricidade de Sao PauloSA . . . . . . . . . . . . . . . . . . . . . . . . . 32,332 49,290
185,000 Emera Inc.. . . . . . . . . . . . . . . . . . . . 4,545,769 6,914,32035,000 Enagas SA. . . . . . . . . . . . . . . . . . . . 916,226 1,002,412
100,000 Endesa SA. . . . . . . . . . . . . . . . . . . . 2,186,478 2,142,326265,000 Enel SpA . . . . . . . . . . . . . . . . . . . . . 1,382,306 1,631,131
4,000 EuroSite Power Inc.† . . . . . . . . . 1,670 660550,000 Hera SpA . . . . . . . . . . . . . . . . . . . . . 1,195,166 1,920,35466,000 Hokkaido Electric Power Co.
Inc. . . . . . . . . . . . . . . . . . . . . . . . . 1,054,241 434,63140,000 Hokuriku Electric Power Co.. . . 661,406 321,988
180,000 Huaneng Power InternationalInc., ADR . . . . . . . . . . . . . . . . . . 4,762,737 4,500,000
45,000 Iberdrola SA, ADR . . . . . . . . . . . . 1,344,640 1,392,075289,300 Iberdrola SA, Aquis . . . . . . . . . . . 2,262,874 2,242,367405,000 Korea Electric Power Corp.,,
ADR† . . . . . . . . . . . . . . . . . . . . . . 5,392,840 7,172,550110,000 Kyushu Electric Power Co.
Inc. . . . . . . . . . . . . . . . . . . . . . . . . 1,563,462 1,152,96232,000 Shikoku Electric Power Co.
Inc. . . . . . . . . . . . . . . . . . . . . . . . . 578,871 348,7552,000 Snam SpA . . . . . . . . . . . . . . . . . . . . 8,967 9,791
75,000 Statoil ASA . . . . . . . . . . . . . . . . . . . 1,693,070 1,600,37028,000 The Chugoku Electric Power
Co. Inc. . . . . . . . . . . . . . . . . . . . . 509,466 300,936305,000 The Kansai Electric Power Co.
Inc. . . . . . . . . . . . . . . . . . . . . . . . . 4,106,512 3,735,52355,000 The Tokyo Electric Power Co.
Holdings Inc.† . . . . . . . . . . . . . 208,402 217,706
The Gabelli Utilities FundSchedule of Investments — December 31, 2017
See accompanying notes to financial statements.
6
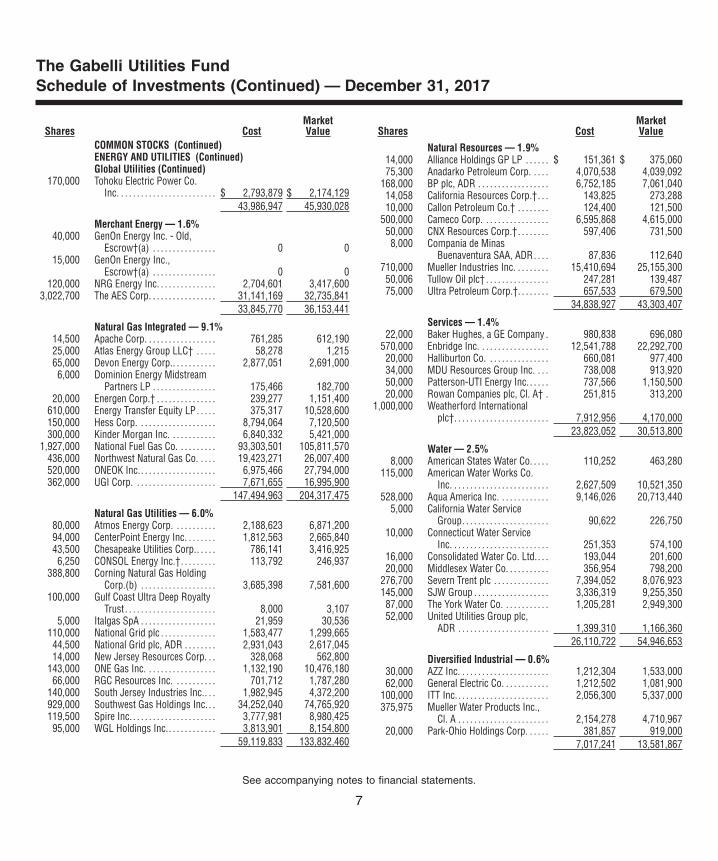
Shares CostMarketValue
COMMON STOCKS (Continued)ENERGY AND UTILITIES (Continued)Global Utilities (Continued)
170,000 Tohoku Electric Power Co.Inc. . . . . . . . . . . . . . . . . . . . . . . . . $ 2,793,879 $ 2,174,129
43,986,947 45,930,028
Merchant Energy — 1.6%40,000 GenOn Energy Inc. - Old,
Escrow†(a) . . . . . . . . . . . . . . . . 0 015,000 GenOn Energy Inc.,
Escrow†(a) . . . . . . . . . . . . . . . . 0 0120,000 NRG Energy Inc. . . . . . . . . . . . . . . 2,704,601 3,417,600
3,022,700 The AES Corp. . . . . . . . . . . . . . . . . 31,141,169 32,735,84133,845,770 36,153,441
Natural Gas Integrated — 9.1%14,500 Apache Corp. . . . . . . . . . . . . . . . . . 761,285 612,19025,000 Atlas Energy Group LLC† . . . . . 58,278 1,21565,000 Devon Energy Corp.. . . . . . . . . . . 2,877,051 2,691,0006,000 Dominion Energy Midstream
Partners LP . . . . . . . . . . . . . . . . 175,466 182,70020,000 Energen Corp.† . . . . . . . . . . . . . . . 239,277 1,151,400
610,000 Energy Transfer Equity LP. . . . . 375,317 10,528,600150,000 Hess Corp. . . . . . . . . . . . . . . . . . . . 8,794,064 7,120,500300,000 Kinder Morgan Inc. . . . . . . . . . . . 6,840,332 5,421,000
1,927,000 National Fuel Gas Co. . . . . . . . . . 93,303,501 105,811,570436,000 Northwest Natural Gas Co. . . . . 19,423,271 26,007,400520,000 ONEOK Inc.. . . . . . . . . . . . . . . . . . . 6,975,466 27,794,000362,000 UGI Corp. . . . . . . . . . . . . . . . . . . . . 7,671,655 16,995,900
147,494,963 204,317,475
Natural Gas Utilities — 6.0%80,000 Atmos Energy Corp. . . . . . . . . . . 2,188,623 6,871,20094,000 CenterPoint Energy Inc. . . . . . . . 1,812,563 2,665,84043,500 Chesapeake Utilities Corp.. . . . . 786,141 3,416,9256,250 CONSOL Energy Inc.†. . . . . . . . . 113,792 246,937
388,800 Corning Natural Gas HoldingCorp.(b) . . . . . . . . . . . . . . . . . . . 3,685,398 7,581,600
100,000 Gulf Coast Ultra Deep RoyaltyTrust . . . . . . . . . . . . . . . . . . . . . . . 8,000 3,107
5,000 Italgas SpA . . . . . . . . . . . . . . . . . . . 21,959 30,536110,000 National Grid plc . . . . . . . . . . . . . . 1,583,477 1,299,66544,500 National Grid plc, ADR . . . . . . . . 2,931,043 2,617,04514,000 New Jersey Resources Corp. . . 328,068 562,800
143,000 ONE Gas Inc. . . . . . . . . . . . . . . . . . 1,132,190 10,476,18066,000 RGC Resources Inc. . . . . . . . . . . 701,712 1,787,280
140,000 South Jersey Industries Inc.. . . 1,982,945 4,372,200929,000 Southwest Gas Holdings Inc. . . 34,252,040 74,765,920119,500 Spire Inc. . . . . . . . . . . . . . . . . . . . . . 3,777,981 8,980,42595,000 WGL Holdings Inc.. . . . . . . . . . . . 3,813,901 8,154,800
59,119,833 133,832,460
Shares CostMarketValue
Natural Resources — 1.9%14,000 Alliance Holdings GP LP . . . . . . $ 151,361 $ 375,06075,300 Anadarko Petroleum Corp. . . . . 4,070,538 4,039,092
168,000 BP plc, ADR . . . . . . . . . . . . . . . . . . 6,752,185 7,061,04014,058 California Resources Corp.†. . . 143,825 273,28810,000 Callon Petroleum Co.† . . . . . . . . 124,400 121,500
500,000 Cameco Corp. . . . . . . . . . . . . . . . . 6,595,868 4,615,00050,000 CNX Resources Corp.†. . . . . . . . 597,406 731,5008,000 Compania de Minas
Buenaventura SAA, ADR. . . . 87,836 112,640710,000 Mueller Industries Inc. . . . . . . . . 15,410,694 25,155,30050,006 Tullow Oil plc† . . . . . . . . . . . . . . . . 247,281 139,48775,000 Ultra Petroleum Corp.†. . . . . . . . 657,533 679,500
34,838,927 43,303,407
Services — 1.4%22,000 Baker Hughes, a GE Company . 980,838 696,080
570,000 Enbridge Inc. . . . . . . . . . . . . . . . . . 12,541,788 22,292,70020,000 Halliburton Co. . . . . . . . . . . . . . . . 660,081 977,40034,000 MDU Resources Group Inc. . . . 738,008 913,92050,000 Patterson-UTI Energy Inc. . . . . . 737,566 1,150,50020,000 Rowan Companies plc, Cl. A† . 251,815 313,200
1,000,000 Weatherford Internationalplc†. . . . . . . . . . . . . . . . . . . . . . . . 7,912,956 4,170,000
23,823,052 30,513,800
Water — 2.5%8,000 American States Water Co. . . . . 110,252 463,280
115,000 American Water Works Co.Inc. . . . . . . . . . . . . . . . . . . . . . . . . 2,627,509 10,521,350
528,000 Aqua America Inc. . . . . . . . . . . . . 9,146,026 20,713,4405,000 California Water Service
Group. . . . . . . . . . . . . . . . . . . . . . 90,622 226,75010,000 Connecticut Water Service
Inc. . . . . . . . . . . . . . . . . . . . . . . . . 251,353 574,10016,000 Consolidated Water Co. Ltd.. . . 193,044 201,60020,000 Middlesex Water Co. . . . . . . . . . . 356,954 798,200
276,700 Severn Trent plc . . . . . . . . . . . . . . 7,394,052 8,076,923145,000 SJW Group . . . . . . . . . . . . . . . . . . . 3,336,319 9,255,350
87,000 The York Water Co. . . . . . . . . . . . 1,205,281 2,949,30052,000 United Utilities Group plc,
ADR . . . . . . . . . . . . . . . . . . . . . . . 1,399,310 1,166,36026,110,722 54,946,653
Diversified Industrial — 0.6%30,000 AZZ Inc. . . . . . . . . . . . . . . . . . . . . . . 1,212,304 1,533,00062,000 General Electric Co. . . . . . . . . . . . 1,212,502 1,081,900
100,000 ITT Inc.. . . . . . . . . . . . . . . . . . . . . . . 2,056,300 5,337,000375,975 Mueller Water Products Inc.,
Cl. A . . . . . . . . . . . . . . . . . . . . . . . 2,154,278 4,710,96720,000 Park-Ohio Holdings Corp. . . . . . 381,857 919,000
7,017,241 13,581,867
The Gabelli Utilities FundSchedule of Investments (Continued) — December 31, 2017
See accompanying notes to financial statements.
7

Shares CostMarketValue
COMMON STOCKS (Continued)ENERGY AND UTILITIES (Continued)Environmental Services — 0.1%
26,000 Covanta Holding Corp. . . . . . . . . $ 414,429 $ 439,40080,000 Veolia Environnement SA . . . . . 1,097,512 2,042,139
1,511,941 2,481,539
TOTAL ENERGY ANDUTILITIES . . . . . . . . . . . . . . . . . . 877,813,499 1,539,195,509
COMMUNICATIONS — 19.4%Cable and Satellite — 5.7%
42,000 Charter Communications Inc.,Cl. A† . . . . . . . . . . . . . . . . . . . . . . 4,216,493 14,110,320
25,000 Cogeco Communications Inc. . 684,204 1,719,96870,000 Cogeco Inc.. . . . . . . . . . . . . . . . . . . 1,589,491 5,040,33440,000 Comcast Corp., Cl. A . . . . . . . . . . 402,189 1,602,000
430,000 DISH Network Corp., Cl. A† . . . 12,903,460 20,532,500308,000 EchoStar Corp., Cl. A† . . . . . . . . 10,215,374 18,449,200344,366 Liberty Global plc, Cl. A† . . . . . . 5,402,825 12,342,077600,000 Liberty Global plc, Cl. C† . . . . . . 10,353,788 20,304,00080,000 Liberty Global plc LiLAC,
Cl. A† . . . . . . . . . . . . . . . . . . . . . . 1,566,814 1,612,000150,000 Liberty Global plc LiLAC,
Cl. C† . . . . . . . . . . . . . . . . . . . . . . 3,323,789 2,983,50090,000 Rogers Communications Inc.,
Cl. B . . . . . . . . . . . . . . . . . . . . . . . 2,426,676 4,583,70012,000 Shaw Communications Inc.,
Cl. B . . . . . . . . . . . . . . . . . . . . . . . 148,195 273,9601,650,000 Sky plc† . . . . . . . . . . . . . . . . . . . . . . 18,135,231 22,544,757
50,000 Tokyo Broadcasting SystemHoldings Inc.. . . . . . . . . . . . . . . 683,652 1,248,724
72,052,181 127,347,040
Computer Services Software and Systems — 0.0%102,500 Internap Corp.† . . . . . . . . . . . . . . . 2,116,716 1,610,275
Telecommunications — 10.0%35,000 AT&T Inc. . . . . . . . . . . . . . . . . . . . . 1,197,700 1,360,800
560,000 BCE Inc. . . . . . . . . . . . . . . . . . . . . . . 15,759,354 26,885,600886,442 CenturyLink Inc. . . . . . . . . . . . . . . 18,600,909 14,785,853790,000 Cincinnati Bell Inc.†. . . . . . . . . . . 13,106,597 16,471,50035,000 Deutsche Telekom AG. . . . . . . . . 428,748 621,310
515,000 Deutsche Telekom AG, ADR . . . 6,311,945 9,095,4151,750,000 Global Telecom Holding SAE,
GDR† . . . . . . . . . . . . . . . . . . . . . . 1,357,829 730,31528,000 Harris Corp. . . . . . . . . . . . . . . . . . . 2,161,989 3,966,200
1,440,000 Koninklijke KPN NV . . . . . . . . . . . 4,192,069 5,024,38118,000 Koninklijke KPN NV, ADR. . . . . . 80,480 63,000
134,470 Loral Space & Communi-cations Inc.† . . . . . . . . . . . . . . . 5,551,093 5,923,403
35,200 NextGenTel Holding ASA . . . . . . 257,885 76,311290,000 Nippon Telegraph & Telephone
Corp. . . . . . . . . . . . . . . . . . . . . . . 7,159,565 13,643,577
Shares CostMarketValue
2,200 Orange Belgium SA . . . . . . . . . . . $ 33,392 $ 46,194330,000 Orascom Telecom Media and
Technology Holding SAE,GDR . . . . . . . . . . . . . . . . . . . . . . . 534,301 53,130
60,000 Pharol SGPS SA† . . . . . . . . . . . . . 28,418 17,998220,000 Pharol SGPS SA, ADR† . . . . . . . 182,432 54,45068,000 PLDT Inc., ADR. . . . . . . . . . . . . . . 3,226,928 2,045,440
150,000 Proximus SA . . . . . . . . . . . . . . . . . 4,775,028 4,922,3702,000 PT Indosat Tbk . . . . . . . . . . . . . . . 1,061 708
2,300,000 Singapore Telecommuni-cations Ltd. . . . . . . . . . . . . . . . . 5,695,042 6,139,295
800,000 Sprint Corp.† . . . . . . . . . . . . . . . . . 4,794,592 4,712,000121,000 Swisscom AG, ADR . . . . . . . . . . . 4,440,719 6,452,93010,000 Tele2 AB, Cl. B . . . . . . . . . . . . . . . . 158,627 122,880
170,000 Telecom Italia SpA, ADR† . . . . . 2,206,728 1,467,100235,000 Telefonica Brasil SA, ADR . . . . . 4,137,121 3,485,05053,000 Telefonica Deutschland
Holding AG. . . . . . . . . . . . . . . . . 280,618 266,196525,000 Telefonica SA, ADR . . . . . . . . . . . 8,961,856 5,082,000
1,000,000 Telekom Austria AG . . . . . . . . . . . 7,767,364 9,273,613340,000 Telenet Group Holding NV†. . . . 15,333,232 23,697,687546,000 Telephone & Data Systems
Inc. . . . . . . . . . . . . . . . . . . . . . . . . 14,762,101 15,178,80060,000 Telesites SAB de CV† . . . . . . . . . 45,551 45,528
700,000 VEON Ltd., ADR . . . . . . . . . . . . . . 3,208,119 2,688,000715,000 Verizon Communications Inc. . 22,935,173 37,844,950580,000 Windstream Holdings Inc.. . . . . 2,749,496 1,073,000
182,424,062 223,316,984
Wireless Communications — 3.7%65,000 America Movil SAB de CV,
Cl. L, ADR. . . . . . . . . . . . . . . . . . 1,049,728 1,114,75027,000 ATN International Inc. . . . . . . . . . 883,543 1,492,02069,000 China Mobile Ltd., ADR . . . . . . . 2,765,327 3,487,26053,000 China Unicom Hong Kong
Ltd., ADR† . . . . . . . . . . . . . . . . . 665,499 717,090200 Hutchison Telecommuni-
cations Hong KongHoldings Ltd.. . . . . . . . . . . . . . . 19 80
86,000 Millicom International CellularSA . . . . . . . . . . . . . . . . . . . . . . . . . 6,232,178 5,797,260
252,000 Millicom International CellularSA, SDR . . . . . . . . . . . . . . . . . . . 17,797,413 17,018,932
6,500 Mobile TeleSystems PJSC,ADR . . . . . . . . . . . . . . . . . . . . . . . 86,498 66,235
465,000 NTT DoCoMo Inc.. . . . . . . . . . . . . 7,286,947 10,981,717135,000 SK Telecom Co. Ltd., ADR. . . . . 2,383,798 3,767,850
400 SmarTone Telecommuni-cations Holdings Ltd. . . . . . . . 207 482
35,000 Tim Participacoes SA, ADR. . . . 684,957 675,850400,000 Turkcell Iletisim Hizmetleri
A/S, ADR. . . . . . . . . . . . . . . . . . . 5,592,425 4,080,000
The Gabelli Utilities FundSchedule of Investments (Continued) — December 31, 2017
See accompanying notes to financial statements.
8
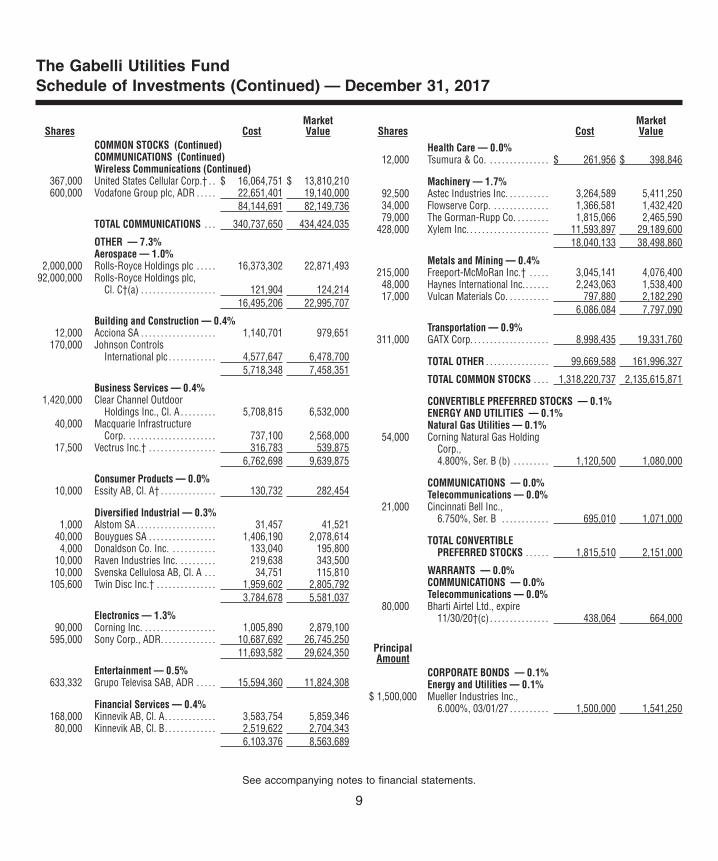
Shares CostMarketValue
COMMON STOCKS (Continued)COMMUNICATIONS (Continued)Wireless Communications (Continued)
367,000 United States Cellular Corp.† . . $ 16,064,751 $ 13,810,210600,000 Vodafone Group plc, ADR . . . . . 22,651,401 19,140,000
84,144,691 82,149,736
TOTAL COMMUNICATIONS . . . 340,737,650 434,424,035
OTHER — 7.3%Aerospace — 1.0%
2,000,000 Rolls-Royce Holdings plc . . . . . 16,373,302 22,871,49392,000,000 Rolls-Royce Holdings plc,
Cl. C†(a) . . . . . . . . . . . . . . . . . . . 121,904 124,21416,495,206 22,995,707
Building and Construction — 0.4%12,000 Acciona SA . . . . . . . . . . . . . . . . . . . 1,140,701 979,651
170,000 Johnson ControlsInternational plc . . . . . . . . . . . . 4,577,647 6,478,700
5,718,348 7,458,351
Business Services — 0.4%1,420,000 Clear Channel Outdoor
Holdings Inc., Cl. A . . . . . . . . . 5,708,815 6,532,00040,000 Macquarie Infrastructure
Corp. . . . . . . . . . . . . . . . . . . . . . . 737,100 2,568,00017,500 Vectrus Inc.† . . . . . . . . . . . . . . . . . 316,783 539,875
6,762,698 9,639,875
Consumer Products — 0.0%10,000 Essity AB, Cl. A† . . . . . . . . . . . . . . 130,732 282,454
Diversified Industrial — 0.3%1,000 Alstom SA . . . . . . . . . . . . . . . . . . . . 31,457 41,521
40,000 Bouygues SA . . . . . . . . . . . . . . . . . 1,406,190 2,078,6144,000 Donaldson Co. Inc. . . . . . . . . . . . 133,040 195,800
10,000 Raven Industries Inc. . . . . . . . . . 219,638 343,50010,000 Svenska Cellulosa AB, Cl. A . . . 34,751 115,810
105,600 Twin Disc Inc.† . . . . . . . . . . . . . . . 1,959,602 2,805,7923,784,678 5,581,037
Electronics — 1.3%90,000 Corning Inc. . . . . . . . . . . . . . . . . . . 1,005,890 2,879,100
595,000 Sony Corp., ADR. . . . . . . . . . . . . . 10,687,692 26,745,25011,693,582 29,624,350
Entertainment — 0.5%633,332 Grupo Televisa SAB, ADR . . . . . 15,594,360 11,824,308
Financial Services — 0.4%168,000 Kinnevik AB, Cl. A. . . . . . . . . . . . . 3,583,754 5,859,34680,000 Kinnevik AB, Cl. B. . . . . . . . . . . . . 2,519,622 2,704,343
6,103,376 8,563,689
Shares CostMarketValue
Health Care — 0.0%12,000 Tsumura & Co. . . . . . . . . . . . . . . . $ 261,956 $ 398,846
Machinery — 1.7%92,500 Astec Industries Inc. . . . . . . . . . . 3,264,589 5,411,25034,000 Flowserve Corp. . . . . . . . . . . . . . . 1,366,581 1,432,42079,000 The Gorman-Rupp Co. . . . . . . . . 1,815,066 2,465,590
428,000 Xylem Inc. . . . . . . . . . . . . . . . . . . . . 11,593,897 29,189,60018,040,133 38,498,860
Metals and Mining — 0.4%215,000 Freeport-McMoRan Inc.† . . . . . 3,045,141 4,076,40048,000 Haynes International Inc.. . . . . . 2,243,063 1,538,40017,000 Vulcan Materials Co. . . . . . . . . . . 797,880 2,182,290
6,086,084 7,797,090
Transportation — 0.9%311,000 GATX Corp. . . . . . . . . . . . . . . . . . . . 8,998,435 19,331,760
TOTAL OTHER . . . . . . . . . . . . . . . . 99,669,588 161,996,327
TOTAL COMMON STOCKS . . . . 1,318,220,737 2,135,615,871
CONVERTIBLE PREFERRED STOCKS — 0.1%ENERGY AND UTILITIES — 0.1%Natural Gas Utilities — 0.1%
54,000 Corning Natural Gas HoldingCorp.,4.800%, Ser. B (b) . . . . . . . . . 1,120,500 1,080,000
COMMUNICATIONS — 0.0%Telecommunications — 0.0%
21,000 Cincinnati Bell Inc.,6.750%, Ser. B . . . . . . . . . . . . 695,010 1,071,000
TOTAL CONVERTIBLEPREFERRED STOCKS . . . . . . 1,815,510 2,151,000
WARRANTS — 0.0%COMMUNICATIONS — 0.0%Telecommunications — 0.0%
80,000 Bharti Airtel Ltd., expire11/30/20†(c) . . . . . . . . . . . . . . . 438,064 664,000
PrincipalAmount
CORPORATE BONDS — 0.1%Energy and Utilities — 0.1%
$ 1,500,000 Mueller Industries Inc.,6.000%, 03/01/27 . . . . . . . . . . 1,500,000 1,541,250
The Gabelli Utilities FundSchedule of Investments (Continued) — December 31, 2017
See accompanying notes to financial statements.
9

PrincipalAmount Cost
MarketValue
U.S. GOVERNMENT OBLIGATIONS — 4.3%$97,520,000 U.S. Treasury Bills,
1.065% to 1.542%††,01/25/18 to 06/28/18. . . . . . . $ 97,235,208 $ 97,221,304
TOTALINVESTMENTS — 100.0% . . . $1,419,209,519 2,237,193,425
Other Assets and Liabilities (Net) — 0.0% . . (53,448)
NET ASSETS — 100.0% . . . . . . . . . . . . . . . . . . $2,237,139,977
(a) Security is valued using significant unobservable inputs and is classifiedas Level 3 in the fair value hierarchy.
(b) Security considered an affiliated holding because the Fund owns at least5% of its outstanding shares.
(c) Security exempt from registration under Rule 144A of the Securities Act of1933, as amended. This security may be resold in transactions exempt fromregistration, normally to qualified institutional buyers. At December 31, 2017,the market value of the Rule 144A security amounted to $664,000 or 0.03%of net assets.
† Non-income producing security.†† Represents annualized yield at date of purchase.
ADR American Depositary ReceiptGDR Global Depositary ReceiptSDR Swedish Depositary Receipt
The Gabelli Utilities FundSchedule of Investments (Continued) — December 31, 2017
See accompanying notes to financial statements.
10

Assets:Investments, at value (cost $1,414,403,621) . . . . . . . . $2,228,531,825Investments in affiliates, at value
(cost $4,805,898). . . . . . . . . . . . . . . . . . . . . . . . . . . 8,661,600Cash . . . . . . . . . . . . . . . . . . . . . . . . . . . . . . . . . . . . . . 2,319Receivable for Fund shares sold. . . . . . . . . . . . . . . . . 3,101,568Dividends receivable . . . . . . . . . . . . . . . . . . . . . . . . . . 4,193,501Prepaid expenses . . . . . . . . . . . . . . . . . . . . . . . . . . . . 80,243Total Assets. . . . . . . . . . . . . . . . . . . . . . . . . . . . . . . . 2,244,571,056
Liabilities:Payable for Fund shares redeemed . . . . . . . . . . . . . . 4,093,791Payable for investment advisory fees . . . . . . . . . . . . . 1,930,604Payable for distribution fees . . . . . . . . . . . . . . . . . . . . 928,108Payable for accounting fees . . . . . . . . . . . . . . . . . . . . 3,750Other accrued expenses . . . . . . . . . . . . . . . . . . . . . . . 474,826Total Liabilities . . . . . . . . . . . . . . . . . . . . . . . . . . . . . 7,431,079Net Assets
(applicable to 273,608,814 shares outstanding). . . . $2,237,139,977Net Assets Consist of:
Paid-in capital . . . . . . . . . . . . . . . . . . . . . . . . . . . . . . . $1,434,283,780Distribution in excess of net investment income . . . . . (1,019,191)Distributions in excess of net realized gains on
investments and foreign currency transactions . . . . (14,116,420)Net unrealized appreciation on investments . . . . . . . . 817,983,906Net unrealized appreciation on foreign currency
translations . . . . . . . . . . . . . . . . . . . . . . . . . . . . . . . 7,902Net Assets . . . . . . . . . . . . . . . . . . . . . . . . . . . . . . . . . $2,237,139,977
Shares of Beneficial Interest, each at $0.001 par value; unlimitednumber of shares authorized:
Class AAA:Net Asset Value, offering, and redemption
price per share ($350,708,716 ÷ 38,007,368shares outstanding) . . . . . . . . . . . . . . . . . . . . . . . $9.23
Class A:Net Asset Value and redemption price per
share ($837,684,252 ÷ 89,368,197 sharesoutstanding). . . . . . . . . . . . . . . . . . . . . . . . . . . . . . $9.37
Maximum offering price per share (NAV ÷0.9425, based on maximum sales charge of5.75% of the offering price) . . . . . . . . . . . . . . . . $9.94
Class C:Net Asset Value and offering price per share
($776,369,587 ÷ 118,008,211 sharesoutstanding). . . . . . . . . . . . . . . . . . . . . . . . . . . . . . $6.58(a)
Class I:Net Asset Value, offering, and redemption
price per share ($272,376,389 ÷ 28,224,926shares outstanding) . . . . . . . . . . . . . . . . . . . . . . . $9.65
Class T:Net Asset Value and redemption price per
share ($1,033 ÷ 112 shares outstanding) . . . . $9.22Maximum offering price per share (NAV ÷
0.975, based on maximum sales charge of2.50% of the offering price) . . . . . . . . . . . . . . . . $9.46
(a) Redemption price varies based on the length of time held.
Investment Income:Dividends - Unaffiliated (net of foreign withholding taxes
of $1,408,709) . . . . . . . . . . . . . . . . . . . . . . . . . . . . . . . . $ 64,226,189Dividends - Affiliated . . . . . . . . . . . . . . . . . . . . . . . . . . . . . 263,250Interest . . . . . . . . . . . . . . . . . . . . . . . . . . . . . . . . . . . . . . . 790,293Other income* . . . . . . . . . . . . . . . . . . . . . . . . . . . . . . . . . . 235Total Income . . . . . . . . . . . . . . . . . . . . . . . . . . . . . . . . . . 65,279,967
Expenses:Investment advisory fees . . . . . . . . . . . . . . . . . . . . . . . . . . 22,195,032Distribution fees - Class AAA . . . . . . . . . . . . . . . . . . . . . . 909,780Distribution fees - Class A . . . . . . . . . . . . . . . . . . . . . . . . . 2,054,701Distribution fees - Class C. . . . . . . . . . . . . . . . . . . . . . . . . 7,963,130Distribution fees - Class T . . . . . . . . . . . . . . . . . . . . . . . . . 1Shareholder services fees . . . . . . . . . . . . . . . . . . . . . . . . . 1,630,497Shareholder communications expenses. . . . . . . . . . . . . . . 304,911Custodian fees. . . . . . . . . . . . . . . . . . . . . . . . . . . . . . . . . . 225,255Trustees’ fees . . . . . . . . . . . . . . . . . . . . . . . . . . . . . . . . . . 137,000Registration expenses . . . . . . . . . . . . . . . . . . . . . . . . . . . . 126,820Accounting fees . . . . . . . . . . . . . . . . . . . . . . . . . . . . . . . . . 45,000Legal and audit fees . . . . . . . . . . . . . . . . . . . . . . . . . . . . . 28,778Interest expense . . . . . . . . . . . . . . . . . . . . . . . . . . . . . . . . 210Miscellaneous expenses . . . . . . . . . . . . . . . . . . . . . . . . . . 131,525Total Expenses . . . . . . . . . . . . . . . . . . . . . . . . . . . . . . . . 35,752,640Less:
Expenses paid indirectly by broker(See Note 6) . . . . . . . . . . . . . . . . . . . . . . . . . . . . . . . . (15,703)
Net Expenses . . . . . . . . . . . . . . . . . . . . . . . . . . . . . . . . . . 35,736,937Net Investment Income . . . . . . . . . . . . . . . . . . . . . . . . . . 29,543,030
Net Realized and Unrealized Gain/(Loss) onInvestments and Foreign Currency:Net realized gain on investments. . . . . . . . . . . . . . . . . . . . 18,926,765Net realized loss on foreign currency transactions . . . . . . (34,159)Net realized gain on investments and foreign currency
transactions . . . . . . . . . . . . . . . . . . . . . . . . . . . . . . . . . . 18,892,606Net change in unrealized appreciation:
on investments . . . . . . . . . . . . . . . . . . . . . . . . . . . . . . . . 131,864,424on foreign currency translations . . . . . . . . . . . . . . . . . . . 32,758
Net change in unrealized appreciationon investments and foreign currency translations . . . . . 131,897,182
Net Realized and Unrealized Gain/(Loss) onInvestments and Foreign Currency . . . . . . . . . . . . . . 150,789,788
Net Increase in Net Assets Resulting fromOperations . . . . . . . . . . . . . . . . . . . . . . . . . . . . . . . . . . $180,332,818
* The Fund received a reimbursement of custody expenses paidin prior years.
The Gabelli Utilities Fund
Statement of Assets and LiabilitiesDecember 31, 2017
Statement of OperationsFor the Year Ended December 31, 2017
See accompanying notes to financial statements.
11
Year EndedDecember 31, 2017
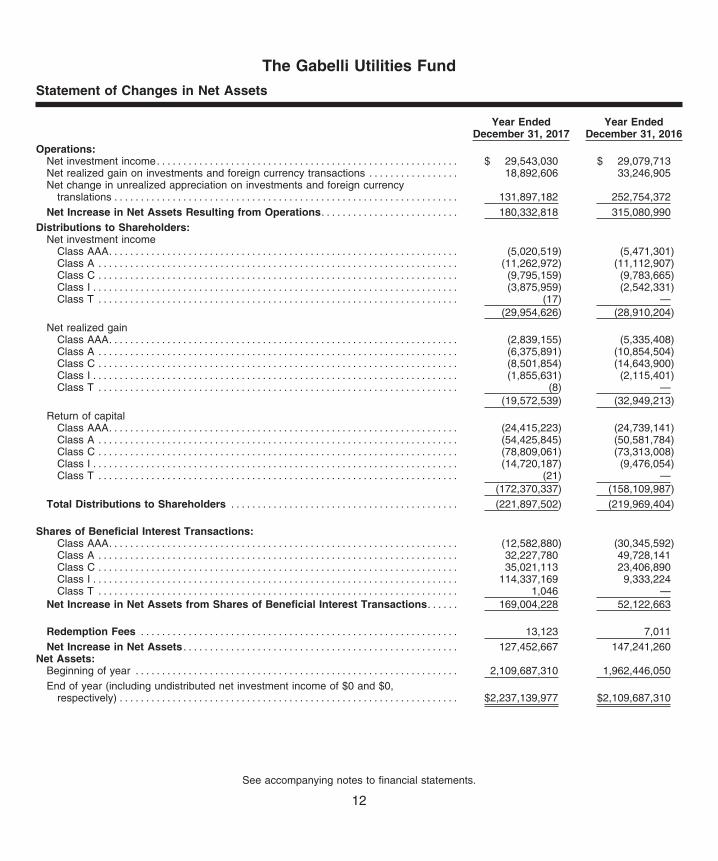
Year EndedDecember 31, 2016
Operations:Net investment income. . . . . . . . . . . . . . . . . . . . . . . . . . . . . . . . . . . . . . . . . . . . . . . . . . . . . . . . . $ 29,543,030 $ 29,079,713Net realized gain on investments and foreign currency transactions . . . . . . . . . . . . . . . . . 18,892,606 33,246,905Net change in unrealized appreciation on investments and foreign currency
translations . . . . . . . . . . . . . . . . . . . . . . . . . . . . . . . . . . . . . . . . . . . . . . . . . . . . . . . . . . . . . . . . . 131,897,182 252,754,372Net Increase in Net Assets Resulting from Operations. . . . . . . . . . . . . . . . . . . . . . . . . . 180,332,818 315,080,990
Distributions to Shareholders:Net investment income
Class AAA. . . . . . . . . . . . . . . . . . . . . . . . . . . . . . . . . . . . . . . . . . . . . . . . . . . . . . . . . . . . . . . . . . (5,020,519) (5,471,301)Class A . . . . . . . . . . . . . . . . . . . . . . . . . . . . . . . . . . . . . . . . . . . . . . . . . . . . . . . . . . . . . . . . . . . . (11,262,972) (11,112,907)Class C . . . . . . . . . . . . . . . . . . . . . . . . . . . . . . . . . . . . . . . . . . . . . . . . . . . . . . . . . . . . . . . . . . . . (9,795,159) (9,783,665)Class I . . . . . . . . . . . . . . . . . . . . . . . . . . . . . . . . . . . . . . . . . . . . . . . . . . . . . . . . . . . . . . . . . . . . . (3,875,959) (2,542,331)Class T . . . . . . . . . . . . . . . . . . . . . . . . . . . . . . . . . . . . . . . . . . . . . . . . . . . . . . . . . . . . . . . . . . . . (17) —
(29,954,626) (28,910,204)Net realized gain
Class AAA. . . . . . . . . . . . . . . . . . . . . . . . . . . . . . . . . . . . . . . . . . . . . . . . . . . . . . . . . . . . . . . . . . (2,839,155) (5,335,408)Class A . . . . . . . . . . . . . . . . . . . . . . . . . . . . . . . . . . . . . . . . . . . . . . . . . . . . . . . . . . . . . . . . . . . . (6,375,891) (10,854,504)Class C . . . . . . . . . . . . . . . . . . . . . . . . . . . . . . . . . . . . . . . . . . . . . . . . . . . . . . . . . . . . . . . . . . . . (8,501,854) (14,643,900)Class I . . . . . . . . . . . . . . . . . . . . . . . . . . . . . . . . . . . . . . . . . . . . . . . . . . . . . . . . . . . . . . . . . . . . . (1,855,631) (2,115,401)Class T . . . . . . . . . . . . . . . . . . . . . . . . . . . . . . . . . . . . . . . . . . . . . . . . . . . . . . . . . . . . . . . . . . . . (8) —
(19,572,539) (32,949,213)Return of capital
Class AAA. . . . . . . . . . . . . . . . . . . . . . . . . . . . . . . . . . . . . . . . . . . . . . . . . . . . . . . . . . . . . . . . . . (24,415,223) (24,739,141)Class A . . . . . . . . . . . . . . . . . . . . . . . . . . . . . . . . . . . . . . . . . . . . . . . . . . . . . . . . . . . . . . . . . . . . (54,425,845) (50,581,784)Class C . . . . . . . . . . . . . . . . . . . . . . . . . . . . . . . . . . . . . . . . . . . . . . . . . . . . . . . . . . . . . . . . . . . . (78,809,061) (73,313,008)Class I . . . . . . . . . . . . . . . . . . . . . . . . . . . . . . . . . . . . . . . . . . . . . . . . . . . . . . . . . . . . . . . . . . . . . (14,720,187) (9,476,054)Class T . . . . . . . . . . . . . . . . . . . . . . . . . . . . . . . . . . . . . . . . . . . . . . . . . . . . . . . . . . . . . . . . . . . . (21) —
(172,370,337) (158,109,987)Total Distributions to Shareholders . . . . . . . . . . . . . . . . . . . . . . . . . . . . . . . . . . . . . . . . . . . (221,897,502) (219,969,404)
Shares of Beneficial Interest Transactions:Class AAA. . . . . . . . . . . . . . . . . . . . . . . . . . . . . . . . . . . . . . . . . . . . . . . . . . . . . . . . . . . . . . . . . . (12,582,880) (30,345,592)Class A . . . . . . . . . . . . . . . . . . . . . . . . . . . . . . . . . . . . . . . . . . . . . . . . . . . . . . . . . . . . . . . . . . . . 32,227,780 49,728,141Class C . . . . . . . . . . . . . . . . . . . . . . . . . . . . . . . . . . . . . . . . . . . . . . . . . . . . . . . . . . . . . . . . . . . . 35,021,113 23,406,890Class I . . . . . . . . . . . . . . . . . . . . . . . . . . . . . . . . . . . . . . . . . . . . . . . . . . . . . . . . . . . . . . . . . . . . . 114,337,169 9,333,224Class T . . . . . . . . . . . . . . . . . . . . . . . . . . . . . . . . . . . . . . . . . . . . . . . . . . . . . . . . . . . . . . . . . . . . 1,046 —
Net Increase in Net Assets from Shares of Beneficial Interest Transactions. . . . . . 169,004,228 52,122,663
Redemption Fees . . . . . . . . . . . . . . . . . . . . . . . . . . . . . . . . . . . . . . . . . . . . . . . . . . . . . . . . . . . . 13,123 7,011Net Increase in Net Assets . . . . . . . . . . . . . . . . . . . . . . . . . . . . . . . . . . . . . . . . . . . . . . . . . . . . 127,452,667 147,241,260
Net Assets:Beginning of year . . . . . . . . . . . . . . . . . . . . . . . . . . . . . . . . . . . . . . . . . . . . . . . . . . . . . . . . . . . . . 2,109,687,310 1,962,446,050End of year (including undistributed net investment income of $0 and $0,
respectively) . . . . . . . . . . . . . . . . . . . . . . . . . . . . . . . . . . . . . . . . . . . . . . . . . . . . . . . . . . . . . . . . $2,237,139,977 $2,109,687,310
The Gabelli Utilities Fund
Statement of Changes in Net Assets
See accompanying notes to financial statements.
12

Sel
ecte
dda
tafo
ra
shar
eof
bene
ficia
lint
eres
tou
tsta
ndin
gth
roug
hout
each
perio
d:In
com
e(L
oss)
from
Inve
stm
entO
pera
tions
Dis
trib
utio
nsR
atio
sto
Ave
rage
Net
Ass
ets/
Supp
lem
enta
lDat
a
Year
Ende
dDe
cem
ber3
1
NetA
sset
Value
,Be
ginnin
gof
Perio
d
Net
Inve
stmen
tIn
com
e(a)
Net
Reali
zed
and
Unre
alize
dGa
in(L
oss)
onIn
vestm
ents
Total
from
Inve
stmen
tOp
erati
ons
Net
Inve
stmen
tIn
com
e
Net
Reali
zed
Gain
onIn
vestm
ents
Retu
rnof
Capit
alTo
talDi
stribu
tions
Rede
mpt
ionFe
es(a
)(b)
NetA
sset
Value
,En
dof
Perio
dTo
talRe
turn
†
NetA
ssets
End
ofPe
riod
(in00
0’s)
Net
Inve
stmen
tIn
com
eOp
erati
ngEx
pens
es
Portf
olio
Turn
over
Rate
Cla
ssA
AA
2017
$9.
26$0
.15
$0.
66$
0.81
$(0.
13)
$(0.
07)
$(0.
64)
$(0.
84)
$0.0
0$
9.23
8.9%
$35
0,70
91.
58%
1.37
%(c
)2%
2016
8.70
0.15
1.28
1.43
(0.1
4)(0
.13)
(0.6
0)(0
.87)
0.00
9.26
17.0
364,
411
1.65
1.38
(c)
420
15††
10.5
00.
11(1
.07)
(0.9
6)(0
.09)
(0.7
0)(0
.05)
(0.8
4)0.
008.
70(8
.3)
371,
419
1.42
1.39
(c)
820
14††
11.2
40.
180.
760.
94(0
.14)
(0.1
0)(1
.44)
(1.6
8)0.
0010
.50
8.9
820,
328
1.64
1.36
920
13††
10.8
60.
181.
882.
06(0
.14)
(0.2
0)(1
.34)
(1.6
8)0.
0011
.24
20.2
738,
742
1.60
1.37
11C
lass
A20
17$
9.40
$0.1
5$
0.66
$0.
81$(
0.13
)$(
0.07
)$(
0.64
)$(
0.84
)$0
.00
$9.
378.
8%$
837,
684
1.57
%1.
37%
(c)
2%20
168.
820.
151.
301.
45(0
.13)
(0.1
3)(0
.61)
(0.8
7)0.
009.
4017
.080
8,34
91.
641.
38(c
)4
2015
††10
.64
0.12
(1.1
0)(0
.98)
(0.0
9)(0
.70)
(0.0
5)(0
.84)
0.00
8.82
(8.3
)71
3,20
81.
451.
39(c
)8
2014
††11
.36
0.18
0.78
0.96
(0.1
4)(0
.10)
(1.4
4)(1
.68)
0.00
10.6
49.
01,
231,
349
1.64
1.36
920
13††
10.9
60.
181.
902.
08(0
.14)
(0.2
0)(1
.34)
(1.6
8)0.
0011
.36
20.2
1,10
9,53
21.
601.
3711
Cla
ssC
2017
$6.
88$0
.06
$0.
48$
0.54
$(0.
09)
$(0.
07)
$(0.
68)
$(0.
84)
$0.0
0$
6.58
8.0%
$77
6,37
00.
83%
2.12
%(c
)2%
2016
6.71
0.06
0.98
1.04
(0.0
9)(0
.13)
(0.6
5)(0
.87)
0.00
6.88
16.2
776,
780
0.89
2.13
(c)
420
15††
8.40
0.05
(0.9
0)(0
.85)
(0.0
9)(0
.70)
(0.0
5)(0
.84)
0.00
6.71
(9.1
)73
6,49
40.
732.
14(c
)8
2014
††9.
380.
080.
620.
70(0
.14)
(0.1
0)(1
.44)
(1.6
8)0.
008.
408.
11,
111,
695
0.89
2.11
920
13††
9.36
0.08
1.62
1.70
(0.1
4)(0
.20)
(1.3
4)(1
.68)
0.00
9.38
19.5
1,03
7,07
30.
852.
1211
Cla
ssI
2017
$9.
63$0
.18
$0.
68$
0.86
$(0.
15)
$(0.
07)
$(0.
62)
$(0.
84)
$0.0
0$
9.65
9.1%
$27
2,37
61.
81%
1.12
%(c
)2%
2016
8.99
0.18
1.33
1.51
(0.1
6)(0
.13)
(0.5
8)(0
.87)
0.00
9.63
17.4
160,
147
1.89
1.13
(c)
420
15††
10.8
00.
14(1
.11)
(0.9
7)(0
.09)
(0.7
0)(0
.05)
(0.8
4)0.
008.
99(8
.1)
141,
325
1.70
1.14
(c)
820
14††
11.4
80.
200.
801.
00(0
.14)
(0.1
0)(1
.44)
(1.6
8)0.
0010
.80
9.3
255,
651
1.86
1.11
920
13††
11.0
40.
221.
902.
12(0
.14)
(0.2
0)(1
.34)
(1.6
8)0.
0011
.48
20.4
179,
913
1.85
1.12
11C
lass
T(d)
2017
$9.
33$0
.05
$0.
26$
0.31
$(0.
16)
$(0.
07)
$(0.
19)
$(0.
42)
$0.0
0$
9.22
3.3%
$1
0.98
%(e
)1.
37%
(e)
2%
†T
otal
retu
rnre
pres
ents
aggr
egat
eto
talr
etur
nof
ahy
poth
etic
al$1
,000
inve
stm
enta
tthe
begi
nnin
gof
the
perio
dan
dso
ldat
the
end
ofth
epe
riod
incl
udin
gre
inve
stm
ento
fdis
trib
utio
nsan
ddo
esno
tre
flect
appl
icab
lesa
les
char
ges.
Tot
alre
turn
for
ape
riod
ofle
ssth
anon
eye
aris
not
annu
aliz
ed.
††A
llpe
rsh
are
amou
nts
and
net
asse
tva
lues
have
been
adju
sted
asa
resu
ltof
the
1fo
r2
reve
rse
stoc
ksp
liton
Mar
ch6,
2015
.(a
)P
ersh
are
amou
nts
have
been
calc
ulat
edus
ing
the
aver
age
shar
esou
tsta
ndin
gm
etho
d.(b
)A
mou
ntre
pres
ents
less
than
$0.0
05pe
rsh
are.
(c)
The
Fun
dre
ceiv
edcr
edits
from
ade
sign
ated
brok
erw
hoag
reed
topa
yce
rtai
nF
und
oper
atin
gex
pens
es.
For
the
year
sen
ded
Dec
embe
r31
,20
17,
2016
,an
d20
15,
ther
ew
asno
impa
cton
the
expe
nse
ratio
s.(d
)C
lass
TS
hare
sw
ere
initi
ally
offe
red
onJu
ly5,
2017
.(e
)A
nnua
lized
.
Th
eG
abel
liU
tilit
ies
Fu
nd
Fin
anci
alH
igh
ligh
ts
See
acco
mpa
nyin
gno
tes
tofin
anci
alst
atem
ents
.
13
1. Organization. The Gabelli Utilities Fund was organized on May 18, 1999 as a Delaware statutory trust. OnJuly 5, 2017, the Fund began to offer for sale Class T Shares. The Fund is a diversified open-end managementinvestment company registered under the Investment Company Act of 1940, as amended (the “1940 Act”).The Fund commenced operations on August 31, 1999. The Fund’s primary objective is to provide a high levelof total return through a combination of capital appreciation and current income.
The Fund invests a high percentage of its assets in the utilities sector. As a result, the Fund may be moresusceptible to economic, political, and regulatory developments, positive or negative, and may experience increasedvolatility to the Fund’s NAV and a magnified effect in its total return.
2. Significant Accounting Policies. As an investment company, the Fund follows the investment companyaccounting and reporting guidance, which is part of U.S. generally accepted accounting principles (“GAAP”)that may require the use of management estimates and assumptions in the preparation of its financial statements.Actual results could differ from those estimates. The following is a summary of significant accounting policiesfollowed by the Fund in the preparation of its financial statements.
Security Valuation. Portfolio securities listed or traded on a nationally recognized securities exchange or tradedin the U.S. over-the-counter market for which market quotations are readily available are valued at the lastquoted sale price or a market’s official closing price as of the close of business on the day the securities arebeing valued. If there were no sales that day, the security is valued at the average of the closing bid and askedprices or, if there were no asked prices quoted on that day, then the security is valued at the closing bid priceon that day. If no bid or asked prices are quoted on such day, the security is valued at the most recentlyavailable price or, if the Board of Trustees (the “Board”) so determines, by such other method as the Boardshall determine in good faith to reflect its fair market value. Portfolio securities traded on more than one nationalsecurities exchange or market are valued according to the broadest and most representative market, as determinedby Gabelli Funds, LLC (the “Adviser”).
Portfolio securities primarily traded on a foreign market are generally valued at the preceding closing valuesof such securities on the relevant market, but may be fair valued pursuant to procedures established by theBoard if market conditions change significantly after the close of the foreign market, but prior to the close ofbusiness on the day the securities are being valued. Debt obligations for which market quotations are readilyavailable are valued at the average of the latest bid and asked prices. If there were no asked prices quotedon such day, the security is valued using the closing bid price, unless the Board determines such amount doesnot reflect the securities’ fair vale, in which case these securities will be fair valued as determined by the Board.Certain securities are valued principally using dealer quotations. Futures contracts are valued at the closingsettlement price of the exchange or board of trade on which the applicable contract is traded. OTC futuresand options on futures for which market quotations are readily available will be valued by quotations receivedfrom a pricing service or, if no quotations are available from a pricing service, by quotations obtained from oneor more dealers in the instrument in question by the Adviser.
Securities and assets for which market quotations are not readily available are fair valued as determined bythe Board. Fair valuation methodologies and procedures may include, but are not limited to: analysis and reviewof available financial and non-financial information about the company; comparisons with the valuation andchanges in valuation of similar securities, including a comparison of foreign securities with the equivalent U.S.
The Gabelli Utilities FundNotes to Financial Statements
14
dollar value American Depositary Receipt securities at the close of the U.S. exchange; and evaluation of anyother information that could be indicative of the value of the security.
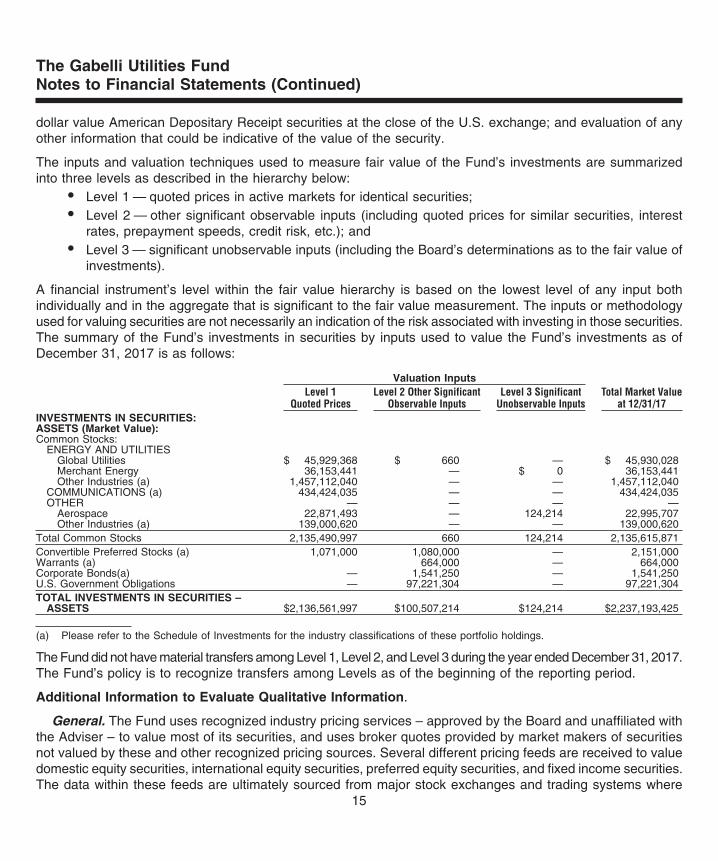
The inputs and valuation techniques used to measure fair value of the Fund’s investments are summarizedinto three levels as described in the hierarchy below:
• Level 1 — quoted prices in active markets for identical securities;• Level 2 — other significant observable inputs (including quoted prices for similar securities, interest
rates, prepayment speeds, credit risk, etc.); and• Level 3 — significant unobservable inputs (including the Board’s determinations as to the fair value of
investments).
A financial instrument’s level within the fair value hierarchy is based on the lowest level of any input bothindividually and in the aggregate that is significant to the fair value measurement. The inputs or methodologyused for valuing securities are not necessarily an indication of the risk associated with investing in those securities.The summary of the Fund’s investments in securities by inputs used to value the Fund’s investments as ofDecember 31, 2017 is as follows:
Valuation InputsLevel 1
Quoted PricesLevel 2 Other Significant
Observable InputsLevel 3 Significant
Unobservable InputsTotal Market Value
at 12/31/17INVESTMENTS IN SECURITIES:ASSETS (Market Value):Common Stocks:
ENERGY AND UTILITIESGlobal Utilities $ 45,929,368 $ 660 — $ 45,930,028Merchant Energy 36,153,441 — $ 0 36,153,441Other Industries (a) 1,457,112,040 — — 1,457,112,040
COMMUNICATIONS (a) 434,424,035 — — 434,424,035OTHER — — — —
Aerospace 22,871,493 — 124,214 22,995,707Other Industries (a) 139,000,620 — — 139,000,620
Total Common Stocks 2,135,490,997 660 124,214 2,135,615,871Convertible Preferred Stocks (a) 1,071,000 1,080,000 — 2,151,000Warrants (a) 664,000 — 664,000Corporate Bonds(a) — 1,541,250 — 1,541,250U.S. Government Obligations — 97,221,304 — 97,221,304TOTAL INVESTMENTS IN SECURITIES –
ASSETS $2,136,561,997 $100,507,214 $124,214 $2,237,193,425
(a) Please refer to the Schedule of Investments for the industry classifications of these portfolio holdings.
The Fund did not have material transfers among Level 1, Level 2, and Level 3 during the year ended December 31, 2017.The Fund’s policy is to recognize transfers among Levels as of the beginning of the reporting period.
Additional Information to Evaluate Qualitative Information.
General. The Fund uses recognized industry pricing services – approved by the Board and unaffiliated withthe Adviser – to value most of its securities, and uses broker quotes provided by market makers of securitiesnot valued by these and other recognized pricing sources. Several different pricing feeds are received to valuedomestic equity securities, international equity securities, preferred equity securities, and fixed income securities.The data within these feeds are ultimately sourced from major stock exchanges and trading systems where
The Gabelli Utilities FundNotes to Financial Statements (Continued)
15

these securities trade. The prices supplied by external sources are checked by obtaining quotations or actualtransaction prices from market participants. If a price obtained from the pricing source is deemed unreliable,prices will be sought from another pricing service or from a broker/dealer that trades that security or similarsecurities.
Fair Valuation. Fair valued securities may be common or preferred equities, warrants, options, rights, orfixed income obligations. Where appropriate, Level 3 securities are those for which market quotations are notavailable, such as securities not traded for several days, or for which current bids are not available, or whichare restricted as to transfer. Among the factors to be considered to fair value a security are recent prices ofcomparable securities that are publicly traded, reliable prices of securities not publicly traded, the use of valuationmodels, current analyst reports, valuing the income or cash flow of the issuer, or cost if the preceding factorsdo not apply. A significant change in the unobservable inputs could result in a lower or higher value in Level3 securities. The circumstances of Level 3 securities are frequently monitored to determine if fair valuationmeasures continue to apply.
The Adviser reports quarterly to the Board the results of the application of fair valuation policies and procedures.These include back testing the prices realized in subsequent trades of these fair valued securities to fair valuespreviously recognized.
Foreign Currency Translations. The books and records of the Fund are maintained in U.S. dollars. Foreigncurrencies, investments, and other assets and liabilities are translated into U.S. dollars at current exchangerates. Purchases and sales of investment securities, income, and expenses are translated at the exchangerate prevailing on the respective dates of such transactions. Unrealized gains and losses that result from changesin foreign exchange rates and/or changes in market prices of securities have been included in unrealizedappreciation/depreciation on investments and foreign currency translations. Net realized foreign currency gainsand losses resulting from changes in exchange rates include foreign currency gains and losses between tradedate and settlement date on investment securities transactions, foreign currency transactions, and the differencebetween the amounts of interest and dividends recorded on the books of the Fund and the amounts actuallyreceived. The portion of foreign currency gains and losses related to fluctuation in exchange rates betweenthe initial purchase trade date and subsequent sale trade date is included in realized gain/(loss) on investments.
Foreign Securities. The Fund may directly purchase securities of foreign issuers. Investing in securities offoreign issuers involves special risks not typically associated with investing in securities of U.S. issuers. Therisks include possible revaluation of currencies, the inability to repatriate funds, less complete financial informationabout companies, and possible future adverse political and economic developments. Moreover, securities ofmany foreign issuers and their markets may be less liquid and their prices more volatile than securities ofcomparable U.S. issuers.
Foreign Taxes. The Fund may be subject to foreign taxes on income, gains on investments, or currency repatriation,a portion of which may be recoverable. The Fund will accrue such taxes and recoveries as applicable, basedupon its current interpretation of tax rules and regulations that exist in the markets in which it invests.
The Gabelli Utilities FundNotes to Financial Statements (Continued)
16
Restricted Securities. The Fund may invest up to 15% of its net assets in securities for which the marketsare restricted. Restricted securities include securities whose disposition is subject to substantial legal or contractualrestrictions. The sale of restricted securities often requires more time and results in higher brokerage chargesor dealer discounts and other selling expenses than does the sale of securities eligible for trading on nationalsecurities exchanges or in the over-the-counter markets. Restricted securities may sell at a price lower thansimilar securities that are not subject to restrictions on resale. Securities freely saleable among qualified institutionalinvestors under special rules adopted by the SEC may be treated as liquid if they satisfy liquidity standardsestablished by the Board. The continued liquidity of such securities is not as well assured as that of publiclytraded securities, and accordingly the Board will monitor their liquidity. For the restricted securities the Fundheld at December 31, 2017, refer to the Schedule of Investments.
Securities Transactions and Investment Income. Securities transactions are accounted for on the trade datewith realized gain/(loss) on investments determined by using the identified cost method. Interest income (includingamortization of premium and accretion of discount) is recorded on an accrual basis. Premiums and discountson debt securities are amortized using the effective yield to maturity method. Dividend income is recorded onthe ex-dividend date, except for certain dividends from foreign securities that are recorded as soon after theex-dividend date as the Fund becomes aware of such dividends.
Determination of Net Asset Value and Calculation of Expenses. Certain administrative expenses are commonto, and allocated among, various affiliated funds. Such allocations are made on the basis of each fund’s averagenet assets or other criteria directly affecting the expenses as determined by the Adviser pursuant to proceduresestablished by the Board.
In calculating the NAV per share of each class, investment income, realized and unrealized gains and losses,redemption fees, and expenses other than class specific expenses are allocated daily to each class of sharesbased upon the proportion of net assets of each class at the beginning of each day. Distribution expenses areborne solely by the class incurring the expense.
Distributions to Shareholders. Distributions to shareholders are recorded on the ex-dividend date. Distributionsto shareholders are based on income and capital gains as determined in accordance with federal income taxregulations, which may differ from income and capital gains as determined under GAAP. These differencesare primarily due to differing treatments of income and gains on various investment securities and foreigncurrency transactions held by the Fund, timing differences, and differing characterizations of distributions madeby the Fund. Distributions made in excess of current earnings and profits on a tax basis are treated as anon-taxable return of capital. Distributions from net investment income for federal income tax purposes includenet realized gains on foreign currency transactions. These book/tax differences are either temporary or permanentin nature. To the extent these differences are permanent, adjustments are made to the appropriate capitalaccounts in the period when the differences arise. Permanent differences were primarily due to foreign currencygains and losses and prior period adjustments. These reclassifications have no impact on the NAV of the Fund.For the year ended December 31, 2017, reclassifications were made to decrease distributions in excess ofnet investment income by $379,617 and decrease distributions in excess of net realized gains on investmentsand foreign currency transactions by $66,469, with an offsetting adjustment to paid-in capital.
The Gabelli Utilities FundNotes to Financial Statements (Continued)
17

The tax character of distributions paid during the years ended December 31, 2017 and 2016 was as follows:
Year EndedDecember 31, 2017
Year EndedDecember 31, 2016
Distributions paid from:Ordinary income (inclusive of short term capital gains) . . . . . . . . . . . . . . . . . . . $ 30,251,265 $ 33,987,237Long term capital gains . . . . . . . . . . . . . . . . . . . . . . . . . . . . . . . . . . . . . . . . . . . . . . 19,275,900 27,872,180Return of capital . . . . . . . . . . . . . . . . . . . . . . . . . . . . . . . . . . . . . . . . . . . . . . . . . . . . 172,370,337 158,109,987Total distributions paid . . . . . . . . . . . . . . . . . . . . . . . . . . . . . . . . . . . . . . . . . . . . . . . $221,897,502 $219,969,404
Since January 2000, the Fund has had a fixed distribution policy. Under the policy, the Fund declares andpays monthly distributions from net investment income, capital gains, and paid-in capital. The actual sourceof the distribution is determined after the end of the year. Pursuant to this policy, distributions during the yearmay be made in excess of required distributions. To the extent such distributions are made from current earningsand profits, they are considered ordinary income or long term capital gains. The Fund’s current distributionpolicy may restrict the Fund’s ability to pass through to shareholders all of its net realized long term capitalgains as a Capital Gain Dividend, and may cause such gains to be treated as ordinary income. Distributionssourced from paid-in capital should not be considered as dividend yield or the total return from an investmentin the Fund. The Board continues to evaluate the distribution policy in light of ongoing economic and marketconditions and may change the amount of the monthly distributions in the future.
Provision for Income Taxes. The Fund intends to continue to qualify as a regulated investment companyunder Subchapter M of the Internal Revenue Code of 1986, as amended (the “Code”). It is the policy of theFund to comply with the requirements of the Code applicable to regulated investment companies and to distributesubstantially all of its net investment company taxable income and net capital gains. Therefore, no provisionfor federal income taxes is required.
As of December 31, 2017, the components of accumulated earnings/losses on a tax basis were as follows:
Net unrealized appreciation on investments and foreign currency translations . . . . . . $802,856,197
At December 31, 2017, the temporary differences between book basis and tax basis net unrealized appreciationon investments were primarily due to deferral of losses from wash sales for tax purposes, tax basis adjustmentson investments in partnerships, and mark-to-market adjustments on investments in passive foreign investmentcompanies.
The Fund is permitted to carry capital losses forward for an unlimited period. Capital losses that are carriedforward will retain their character as either short term or long term capital losses.
The following summarizes the tax cost of investments and the related net unrealized appreciation atDecember 31, 2017:
Cost
GrossUnrealized
Appreciation
GrossUnrealized
DepreciationNet UnrealizedAppreciation
Investments . . . . . . $1,434,345,128 $883,622,626 $(80,774,329) $802,848,297
The Fund is required to evaluate tax positions taken or expected to be taken in the course of preparing theFund’s tax returns to determine whether the tax positions are “more-likely-than-not” of being sustained by theapplicable tax authority. Income tax and related interest and penalties would be recognized by the Fund as
The Gabelli Utilities FundNotes to Financial Statements (Continued)
18

tax expense in the Statement of Operations if the tax positions were deemed not to meet the more-likely-than-notthreshold. For the year ended December 31, 2017, the Fund did not incur any income tax, interest, or penalties.As of December 31, 2017, the Adviser has reviewed all open tax years and concluded that there was no impactto the Fund’s net assets or results of operations. The Fund’s federal and state tax returns for the prior threefiscal years remain open, subject to examination. On an ongoing basis, the Adviser will monitor the Fund’s taxpositions to determine if adjustments to this conclusion are necessary.
3. Investment Advisory Agreement and Other Transactions. The Fund has entered into an investmentadvisory agreement (the “Advisory Agreement”) with the Adviser which provides that the Fund will pay theAdviser a fee, computed daily and paid monthly, at the annual rate of 1.00% of the value of its average dailynet assets. In accordance with the Advisory Agreement, the Adviser provides a continuous investment programfor the Fund’s portfolio, oversees the administration of all aspects of the Fund’s business and affairs, and paysthe compensation of all Officers and Trustees of the Fund who are affiliated persons of the Adviser.
The Fund pays each Trustee who is not considered an affiliated person an annual retainer of $18,000 plus$2,000 for each Board meeting attended and they are reimbursed for any out of pocket expenses incurred inattending meetings. All Board committee members receive $500 per meeting attended and the Chairman ofthe Audit Committee and the Lead Trustee each receives an annual fee of $2,000. A Trustee may receive asingle meeting fee, allocated among the participating funds, for participation in certain meetings held on behalfof multiple funds. Trustees who are directors or employees of the Adviser or an affiliated company receive nocompensation or expense reimbursement from the Fund.
4. Distribution Plan. The Fund’s Board has adopted a distribution plan (the “Plan”) for each class of shares,except for Class I Shares, pursuant to Rule 12b-1 under the 1940 Act. Under the Class AAA, Class A, Class C,and Class T Share Plans, payments are authorized to G.distributors, LLC (the “Distributor”), an affiliate of theAdviser, at annual rates of 0.25%, 0.25%, 1.00%, and 0.25%, respectively, of the average daily net assets ofthose classes, the annual limitations under each Plan. Such payments are accrued daily and paid monthly.
5. Portfolio Securities. Purchases and sales of securities during the year ended December 31, 2017, otherthan short term securities and U.S. Government obligations, aggregated $43,366,598 and $113,042,742,respectively.
6. Transactions with Affiliates and Other Arrangements. During the year ended December 31, 2017, theFund paid $85,154 in brokerage commissions on security trades to G.research, LLC, an affiliate of the Adviser.Additionally the Distributor retained a total of $1,336,561 from investors representing commissions (sales chargesand underwriting fees) on sales and redemptions of Fund shares.
During the year ended December 31, 2017, the Fund received credits from a designated broker who agreedto pay certain Fund operating expenses. The amount of such expenses paid through this directed brokeragearrangement during this period was $15,703.
The cost of calculating the Fund’s NAV per share is a Fund expense pursuant to the Advisory Agreement.During the year ended December 31, 2017, the Fund paid or accrued $45,000 to the Adviser in connectionwith the cost of computing the Fund’s NAV.
The Gabelli Utilities FundNotes to Financial Statements (Continued)
19
7. Line of Credit. The Fund participates in an unsecured line of credit, which expires March 8, 2018 and maybe renewed annually, of up to $75,000,000 under which it may borrow up to 10% of its net assets from thecustodian for temporary borrowing purposes. Borrowings under this arrangement bear interest at a floatingrate equal to the higher of the overnight Federal Funds rate plus 125 basis points or the 30-day LIBOR plus125 basis points in effect on that day. This amount, if any, would be included in “Interest expense” in theStatement of Operations. During the year ended December 31, 2017, there were no borrowings outstandingunder the line of credit.
8. Shares of Beneficial Interest. The Fund offers five classes of shares – Class AAA Shares, Class A Shares,Class C Shares, Class I Shares and Class T Shares. Class AAA Shares and Class I Shares are offered withouta sales charge. Class A Shares and Class T Shares are subject to a maximum front-end sales charge of 5.75%and 2.50%, respectively. Class C Shares are subject to a 1.00% contingent deferred sales charge for one yearafter purchase.
The Fund imposes a redemption fee of 2.00% on all classes of shares that are redeemed or exchanged onor before the seventh day after the date of a purchase. The redemption fee is deducted from the proceedsotherwise payable to the redeeming shareholders and is retained by the Fund as an increase in paid-in capital.The redemption fees retained by the Fund during the years ended December 31, 2017 and 2016, if any, canbe found in the Statement of Changes in Net Assets under Redemption Fees.
The Gabelli Utilities FundNotes to Financial Statements (Continued)
20
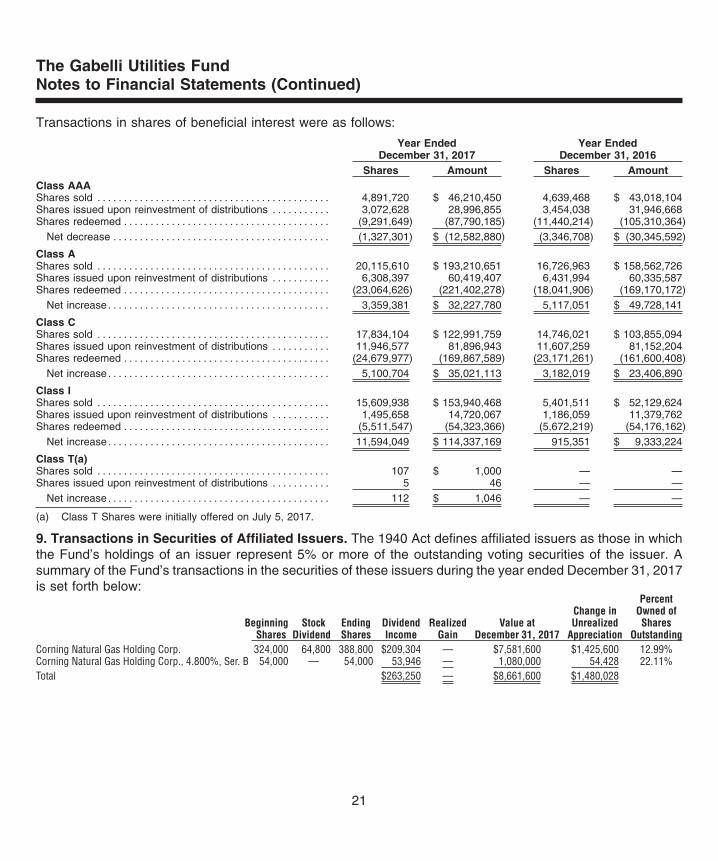
Transactions in shares of beneficial interest were as follows:
Year EndedDecember 31, 2017
Year EndedDecember 31, 2016
Shares Amount Shares AmountClass AAAShares sold . . . . . . . . . . . . . . . . . . . . . . . . . . . . . . . . . . . . . . . . . . . . 4,891,720 $ 46,210,450 4,639,468 $ 43,018,104Shares issued upon reinvestment of distributions . . . . . . . . . . . 3,072,628 28,996,855 3,454,038 31,946,668Shares redeemed . . . . . . . . . . . . . . . . . . . . . . . . . . . . . . . . . . . . . . . (9,291,649) (87,790,185) (11,440,214) (105,310,364)
Net decrease . . . . . . . . . . . . . . . . . . . . . . . . . . . . . . . . . . . . . . . . . (1,327,301) $ (12,582,880) (3,346,708) $ (30,345,592)
Class AShares sold . . . . . . . . . . . . . . . . . . . . . . . . . . . . . . . . . . . . . . . . . . . . 20,115,610 $ 193,210,651 16,726,963 $ 158,562,726Shares issued upon reinvestment of distributions . . . . . . . . . . . 6,308,397 60,419,407 6,431,994 60,335,587Shares redeemed . . . . . . . . . . . . . . . . . . . . . . . . . . . . . . . . . . . . . . . (23,064,626) (221,402,278) (18,041,906) (169,170,172)
Net increase. . . . . . . . . . . . . . . . . . . . . . . . . . . . . . . . . . . . . . . . . . 3,359,381 $ 32,227,780 5,117,051 $ 49,728,141
Class CShares sold . . . . . . . . . . . . . . . . . . . . . . . . . . . . . . . . . . . . . . . . . . . . 17,834,104 $ 122,991,759 14,746,021 $ 103,855,094Shares issued upon reinvestment of distributions . . . . . . . . . . . 11,946,577 81,896,943 11,607,259 81,152,204Shares redeemed . . . . . . . . . . . . . . . . . . . . . . . . . . . . . . . . . . . . . . . (24,679,977) (169,867,589) (23,171,261) (161,600,408)
Net increase. . . . . . . . . . . . . . . . . . . . . . . . . . . . . . . . . . . . . . . . . . 5,100,704 $ 35,021,113 3,182,019 $ 23,406,890
Class IShares sold . . . . . . . . . . . . . . . . . . . . . . . . . . . . . . . . . . . . . . . . . . . . 15,609,938 $ 153,940,468 5,401,511 $ 52,129,624Shares issued upon reinvestment of distributions . . . . . . . . . . . 1,495,658 14,720,067 1,186,059 11,379,762Shares redeemed . . . . . . . . . . . . . . . . . . . . . . . . . . . . . . . . . . . . . . . (5,511,547) (54,323,366) (5,672,219) (54,176,162)
Net increase. . . . . . . . . . . . . . . . . . . . . . . . . . . . . . . . . . . . . . . . . . 11,594,049 $ 114,337,169 915,351 $ 9,333,224
Class T(a)Shares sold . . . . . . . . . . . . . . . . . . . . . . . . . . . . . . . . . . . . . . . . . . . . 107 $ 1,000 — —Shares issued upon reinvestment of distributions . . . . . . . . . . . 5 46 — —
Net increase. . . . . . . . . . . . . . . . . . . . . . . . . . . . . . . . . . . . . . . . . . 112 $ 1,046 — —
(a) Class T Shares were initially offered on July 5, 2017.
9. Transactions in Securities of Affiliated Issuers. The 1940 Act defines affiliated issuers as those in whichthe Fund’s holdings of an issuer represent 5% or more of the outstanding voting securities of the issuer. Asummary of the Fund’s transactions in the securities of these issuers during the year ended December 31, 2017is set forth below:
BeginningShares
StockDividend
EndingShares
DividendIncome
RealizedGain
Value atDecember 31, 2017
Change inUnrealized
Appreciation
PercentOwned ofShares
OutstandingCorning Natural Gas Holding Corp. 324,000 64,800 388,800 $209,304 — $7,581,600 $1,425,600 12.99%Corning Natural Gas Holding Corp., 4.800%, Ser. B 54,000 — 54,000 53,946 — 1,080,000 54,428 22.11%Total $263,250 — $8,661,600 $1,480,028
The Gabelli Utilities FundNotes to Financial Statements (Continued)
21
10. Indemnifications. The Fund enters into contracts that contain a variety of indemnifications. The Fund’smaximum exposure under these arrangements is unknown. However, the Fund has not had prior claims orlosses pursuant to these contracts. Management has reviewed the Fund’s existing contracts and expects therisk of loss to be remote.
11. Subsequent Events. Management has evaluated the impact on the Fund of all other subsequent eventsoccurring through the date the financial statements were issued and has determined that there were no subsequentevents requiring recognition or disclosure in the financial statements.
The Gabelli Utilities FundNotes to Financial Statements (Continued)
22

To the Shareholders and Board of Trustees ofThe Gabelli Utilities Fund
Opinion on the Financial Statements
We have audited the accompanying statement of assets and liabilities of The Gabelli Utilities Fund (the “Fund”), includingthe schedule of investments, as of December 31, 2017, and the related statement of operations for the year then ended,the statements of changes in net assets for each of the two years in the period then ended, the financial highlights foreach of the five years in the period then ended and the related notes (collectively referred to as the “financial statements”).In our opinion, the financial statements present fairly, in all material respects, the financial position of the Fund at December31, 2017, the results of its operations for the year then ended, the changes in its net assets for each of the two years inthe period then ended and its financial highlights for each of the five years in the period then ended, in conformity withU.S. generally accepted accounting principles.
Basis for Opinion
These financial statements are the responsibility of the Fund’s management. Our responsibility is to express an opinionon the Fund’s financial statements based on our audits. We are a public accounting firm registered with the Public CompanyAccounting Oversight Board (United States) (“PCAOB”) and are required to be independent with respect to the Fund inaccordance with the U.S. federal securities laws and the applicable rules and regulations of the Securities and ExchangeCommission and the PCAOB.
We conducted our audits in accordance with the standards of the PCAOB. Those standards require that we plan andperform the audit to obtain reasonable assurance about whether the financial statements and financial highlights are freeof material misstatement, whether due to error or fraud. The Fund is not required to have, nor were we engaged to perform,an audit of the Fund’s internal control over financial reporting. As part of our audits, we are required to obtain an understandingof internal control over financial reporting, but not for the purpose of expressing an opinion on the effectiveness of theFund’s internal control over financial reporting. Accordingly, we express no such opinion.
Our audits included performing procedures to assess the risks of material misstatement of the financial statements, whetherdue to error or fraud, and performing procedures that respond to those risks. Such procedures included examining, on atest basis, evidence regarding the amounts and disclosures in the financial statements. Our procedures included confirmationof securities owned as of December 31, 2017, by correspondence with the custodian. Our audits also included evaluatingthe accounting principles used and significant estimates made by management, as well as evaluating the overall presentationof the financial statements. We believe that our audits provide a reasonable basis for our opinion.
We have served as the auditor of one or more Gabelli/GAMCO Funds investment companies since 1992.
Philadelphia, PennsylvaniaFebruary 28, 2018
The Gabelli Utilities FundReport of Independent Registered Public Accounting Firm
23
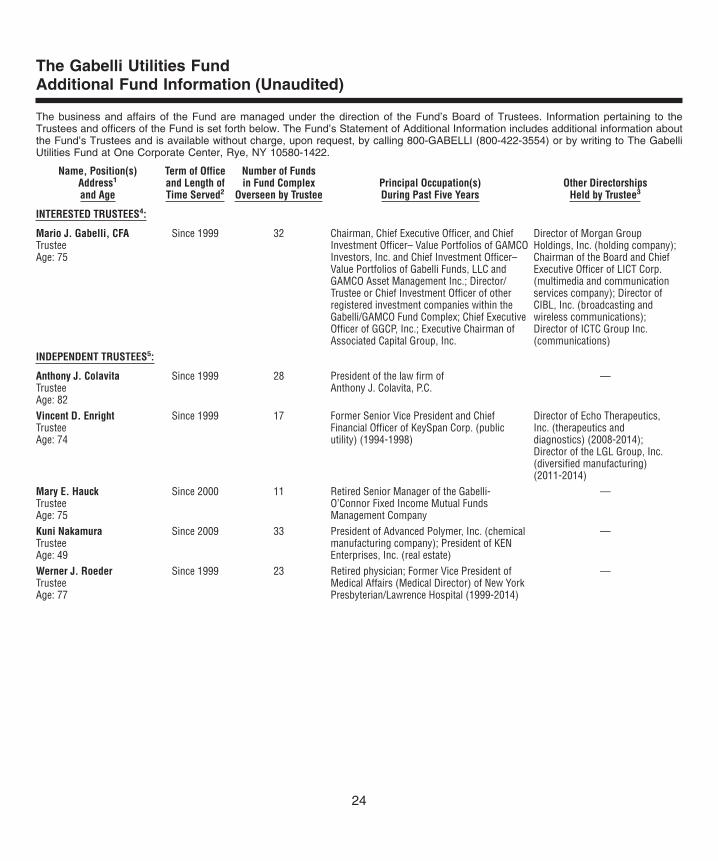
The business and affairs of the Fund are managed under the direction of the Fund’s Board of Trustees. Information pertaining to theTrustees and officers of the Fund is set forth below. The Fund’s Statement of Additional Information includes additional information aboutthe Fund’s Trustees and is available without charge, upon request, by calling 800-GABELLI (800-422-3554) or by writing to The GabelliUtilities Fund at One Corporate Center, Rye, NY 10580-1422.
Name, Position(s)Address1
and Age
Term of Officeand Length ofTime Served2
Number of Fundsin Fund Complex
Overseen by TrusteePrincipal Occupation(s)During Past Five Years
Other DirectorshipsHeld by Trustee3
INTERESTED TRUSTEES4:
Mario J. Gabelli, CFATrusteeAge: 75
Since 1999 32 Chairman, Chief Executive Officer, and ChiefInvestment Officer– Value Portfolios of GAMCOInvestors, Inc. and Chief Investment Officer–Value Portfolios of Gabelli Funds, LLC andGAMCO Asset Management Inc.; Director/Trustee or Chief Investment Officer of otherregistered investment companies within theGabelli/GAMCO Fund Complex; Chief ExecutiveOfficer of GGCP, Inc.; Executive Chairman ofAssociated Capital Group, Inc.
Director of Morgan GroupHoldings, Inc. (holding company);Chairman of the Board and ChiefExecutive Officer of LICT Corp.(multimedia and communicationservices company); Director ofCIBL, Inc. (broadcasting andwireless communications);Director of ICTC Group Inc.(communications)
INDEPENDENT TRUSTEES5:
Anthony J. ColavitaTrusteeAge: 82
Since 1999 28 President of the law firm ofAnthony J. Colavita, P.C.
—
Vincent D. EnrightTrusteeAge: 74
Since 1999 17 Former Senior Vice President and ChiefFinancial Officer of KeySpan Corp. (publicutility) (1994-1998)
Director of Echo Therapeutics,Inc. (therapeutics anddiagnostics) (2008-2014);Director of the LGL Group, Inc.(diversified manufacturing)(2011-2014)
Mary E. HauckTrusteeAge: 75
Since 2000 11 Retired Senior Manager of the Gabelli-O’Connor Fixed Income Mutual FundsManagement Company
—
Kuni NakamuraTrusteeAge: 49
Since 2009 33 President of Advanced Polymer, Inc. (chemicalmanufacturing company); President of KENEnterprises, Inc. (real estate)
—
Werner J. RoederTrusteeAge: 77
Since 1999 23 Retired physician; Former Vice President ofMedical Affairs (Medical Director) of New YorkPresbyterian/Lawrence Hospital (1999-2014)
—
The Gabelli Utilities FundAdditional Fund Information (Unaudited)
24
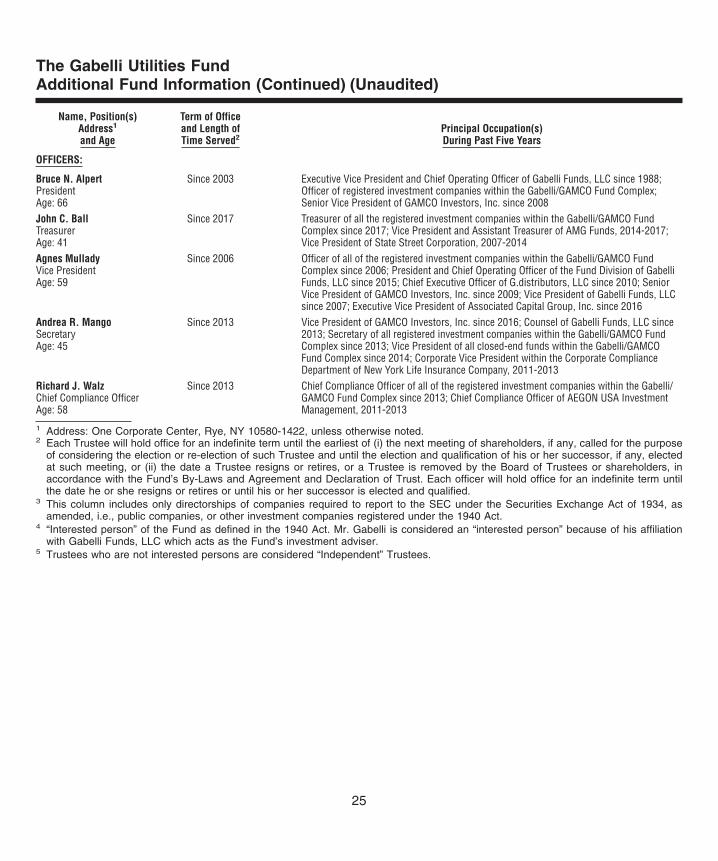
Name, Position(s)Address1
and Age
Term of Officeand Length ofTime Served2
Principal Occupation(s)During Past Five Years
OFFICERS:
Bruce N. AlpertPresidentAge: 66
Since 2003 Executive Vice President and Chief Operating Officer of Gabelli Funds, LLC since 1988;Officer of registered investment companies within the Gabelli/GAMCO Fund Complex;Senior Vice President of GAMCO Investors, Inc. since 2008
John C. BallTreasurerAge: 41
Since 2017 Treasurer of all the registered investment companies within the Gabelli/GAMCO FundComplex since 2017; Vice President and Assistant Treasurer of AMG Funds, 2014-2017;Vice President of State Street Corporation, 2007-2014
Agnes MulladyVice PresidentAge: 59
Since 2006 Officer of all of the registered investment companies within the Gabelli/GAMCO FundComplex since 2006; President and Chief Operating Officer of the Fund Division of GabelliFunds, LLC since 2015; Chief Executive Officer of G.distributors, LLC since 2010; SeniorVice President of GAMCO Investors, Inc. since 2009; Vice President of Gabelli Funds, LLCsince 2007; Executive Vice President of Associated Capital Group, Inc. since 2016
Andrea R. MangoSecretaryAge: 45
Since 2013 Vice President of GAMCO Investors, Inc. since 2016; Counsel of Gabelli Funds, LLC since2013; Secretary of all registered investment companies within the Gabelli/GAMCO FundComplex since 2013; Vice President of all closed-end funds within the Gabelli/GAMCOFund Complex since 2014; Corporate Vice President within the Corporate ComplianceDepartment of New York Life Insurance Company, 2011-2013
Richard J. WalzChief Compliance OfficerAge: 58
Since 2013 Chief Compliance Officer of all of the registered investment companies within the Gabelli/GAMCO Fund Complex since 2013; Chief Compliance Officer of AEGON USA InvestmentManagement, 2011-2013
1 Address: One Corporate Center, Rye, NY 10580-1422, unless otherwise noted.2 Each Trustee will hold office for an indefinite term until the earliest of (i) the next meeting of shareholders, if any, called for the purpose
of considering the election or re-election of such Trustee and until the election and qualification of his or her successor, if any, electedat such meeting, or (ii) the date a Trustee resigns or retires, or a Trustee is removed by the Board of Trustees or shareholders, inaccordance with the Fund’s By-Laws and Agreement and Declaration of Trust. Each officer will hold office for an indefinite term untilthe date he or she resigns or retires or until his or her successor is elected and qualified.
3 This column includes only directorships of companies required to report to the SEC under the Securities Exchange Act of 1934, asamended, i.e., public companies, or other investment companies registered under the 1940 Act.
4 “Interested person” of the Fund as defined in the 1940 Act. Mr. Gabelli is considered an “interested person” because of his affiliationwith Gabelli Funds, LLC which acts as the Fund’s investment adviser.
5 Trustees who are not interested persons are considered “Independent” Trustees.
The Gabelli Utilities FundAdditional Fund Information (Continued) (Unaudited)
25
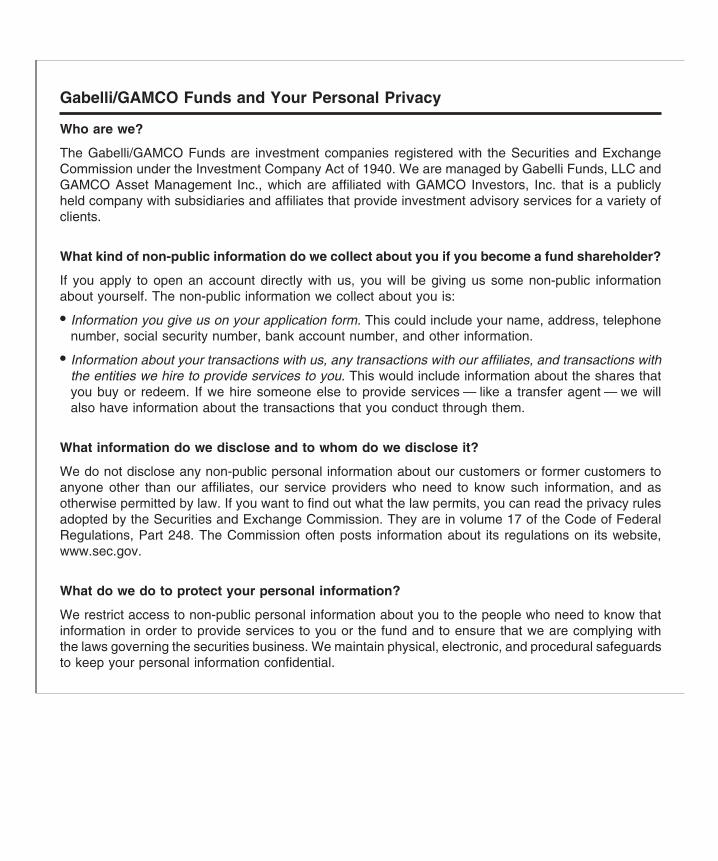
Gabelli/GAMCO Funds and Your Personal Privacy
Who are we?
The Gabelli/GAMCO Funds are investment companies registered with the Securities and ExchangeCommission under the Investment Company Act of 1940. We are managed by Gabelli Funds, LLC andGAMCO Asset Management Inc., which are affiliated with GAMCO Investors, Inc. that is a publiclyheld company with subsidiaries and affiliates that provide investment advisory services for a variety ofclients.
What kind of non-public information do we collect about you if you become a fund shareholder?
If you apply to open an account directly with us, you will be giving us some non-public informationabout yourself. The non-public information we collect about you is:
• Information you give us on your application form. This could include your name, address, telephonenumber, social security number, bank account number, and other information.
• Information about your transactions with us, any transactions with our affiliates, and transactions withthe entities we hire to provide services to you. This would include information about the shares thatyou buy or redeem. If we hire someone else to provide services — like a transfer agent — we willalso have information about the transactions that you conduct through them.
What information do we disclose and to whom do we disclose it?
We do not disclose any non-public personal information about our customers or former customers toanyone other than our affiliates, our service providers who need to know such information, and asotherwise permitted by law. If you want to find out what the law permits, you can read the privacy rulesadopted by the Securities and Exchange Commission. They are in volume 17 of the Code of FederalRegulations, Part 248. The Commission often posts information about its regulations on its website,www.sec.gov.
What do we do to protect your personal information?
We restrict access to non-public personal information about you to the people who need to know thatinformation in order to provide services to you or the fund and to ensure that we are complying withthe laws governing the securities business. We maintain physical, electronic, and procedural safeguardsto keep your personal information confidential.

THE GABELLI UTILITIES FUNDOne Corporate CenterRye, NY 10580-1422
Portfolio Manager Biography
Mario J. Gabelli, CFA, is Chairman, Chief Executive Officer, and Chief Investment Officer - Value Portfolios ofGAMCO Investors, Inc. that he founded in 1977, and Chief Investment Officer - Value Portfolios of Gabelli Funds, LLCand GAMCO Asset Management Inc. He is also Executive Chairman of Associated Capital Group, Inc. Mr. Gabelli isa summa cum laude graduate of Fordham University and holds an MBA degree from Columbia Business Schooland Honorary Doctorates from Fordham University and Roger Williams University.
2017 TAX NOTICE TO SHAREHOLDERS (Unaudited)For the year ended December 31, 2017, the Fund paid to shareholders ordinary income distributions (comprised of netinvestment income and short term capital gains) totaling $0.120, $0.119, $0.104, $0.141, and $0.222 per share for Class AAA,Class A, Class C, Class I, and Class T Shares, respectively, and long term capital gains totaling $19,275,900 or themaximum allowable. The distributions of long term capital gains have been designated as a capital gain dividend by theFund’s Board of Trustees. For the year ended December 31, 2017, 100% of the ordinary income distribution qualifiesfor the dividends received deduction available to corporations. The Fund designates 100% of the ordinary income distributionas qualified dividend income pursuant to the Jobs and Growth Tax Relief Reconciliation Act of 2003. The Fund designates1.21% of the ordinary income distribution as qualified interest income pursuant to the Tax Relief, Unemployment Recharacterization,and Job Creation Act of 2010. The Fund designates 100% of the ordinary income distribution as qualified short termgain pursuant to the American Jobs Creation Act of 2004.U.S. Government IncomeThe percentage of the ordinary income distribution paid by the Fund during 2017 which was derived from U.S. Treasurysecurities was 1.04%. Such income is exempt from state and local tax in all states. However, many states, includingNew York and California, allow a tax exemption for a portion of the income earned only if a mutual fund has investedat least 50% of its assets at the end of each quarter of the Fund’s fiscal year in U.S. Government securities. The Funddid not meet this strict requirement in 2017. Due to the diversity in state and local tax law, it is recommended that youconsult your personal tax adviser as to the applicability of the information provided to your specific situation.
All designations are based on financial information available as of the date of this annual report and, accordingly, aresubject to change. For each item, it is the intention of the Fund to designate the maximum amount permitted under theInternal Revenue Code and the regulations thereunder.
We have separated the portfolio manager’s commentary from the financial statements and investment portfolio due tocorporate governance regulations stipulated by the Sarbanes-Oxley Act of 2002. We have done this to ensure that thecontent of the portfolio manager’s commentary is unrestricted. Both the commentary and the financial statements, includingthe portfolio of investments, will be available on our website at www.gabelli.com.
THE GABELLI UTILITIES FUNDOne Corporate CenterRye, New York 10580-1422
t 800-GABELLI (800-422-3554)f 914-921-5118e [email protected]
GABELLI.COM
Net Asset Value per share available dailyby calling 800-GABELLI after 7:00 P.M.
BOARD OF TRUSTEESMario J. Gabelli, CFAChairman and ChiefExecutive Officer,GAMCO Investors, Inc.Executive Chairman,Associated Capital Group, Inc.
Anthony J. ColavitaPresident,Anthony J. Colavita, P.C.
Vincent D. EnrightFormer Senior Vice President andChief Financial Officer,KeySpan Corp.
Mary E. HauckFormer SeniorPortfolio Manager,Gabelli-O'Connor FixedIncome Mutual FundManagement Co.
Kuni NakamuraPresident,Advanced Polymer, Inc.
Werner J. RoederFormer Medical Director,Lawrence Hospital
OFFICERSBruce N. AlpertPresident
John C. BallTreasurer
Agnes MulladyVice President
Andrea R. MangoSecretary
Richard J. WalzChief Compliance Officer
DISTRIBUTOR
G.distributors, LLC
CUSTODIAN
State Street Bank and TrustCompany
TRANSFER AGENT ANDDIVIDEND DISBURSING AGENT
DST Asset ManagerSolutions Inc.
LEGAL COUNSEL
Skadden, Arps, Slate, Meagher &Flom LLP
This report is submitted for the general information of the shareholdersof The Gabelli Utilities Fund. It is not authorized for distribution to prospectiveinvestors unless preceded or accompanied by an effective prospectus.
THEGABELLIUTILITIESFUND
Annual ReportDecember 31, 2017
GAB470Q417AR